Article

Seasonal Variations in Groundwater Quality and Hydrogeochemistry in the Endemic Areas of Chronic Kidney Disease of Unknown Etiology (CKDu) in Sri Lanka

Department of Urban Engineering, The University of Tokyo, 7-3-1 Hongo, Bunkyo-ku, Tokyo 113-8656, Japan
*
Author to whom correspondence should be addressed.
Current affiliation: Department of Technology and Ecology, Graduate School of Global Environmental Studies, Kyoto University, Yoshida-Honmachi, Sakyo-ku, Kyoto 606-8501, Japan.
Water 2021, 13(23), 3356; https://doi.org/10.3390/w13233356
Submission received: 30 October 2021 / Revised: 22 November 2021 / Accepted: 22 November 2021 / Published: 26 November 2021
(This article belongs to the Special Issue Water Pollution and Sanitation)

Abstract

:
Groundwater quality and geochemical processes were investigated in the endemic areas of chronic kidney disease of unknown etiology (CKDu) in Sri Lanka. Representative groundwater samples (n = 60) were collected from 30 dug wells located in the Anuradhapura district, over the dry and wet seasons. The samples were analyzed for pH, electrical conductivity (EC), total dissolved solids (TDS), alkalinity, major cations and major anions. Calcium-magnesium-bicarbonate ion combinations are predominant in this groundwater, and the simultaneous occurrence of high hardness (382–394 mg/L as CaCO3), alkalinity (364–379 mg/L as CaCO3) and ionicity is a salient characteristic. Alkalinity, TDS, hardness, and magnesium exceeded the safe limits for drinking in over half of the samples, regardless of the season. The major ion chemistry (Ca2+, Mg2+, Na+ and HCO3) is primarily governed by the weathering of carbonate and silicate minerals, ion exchange, and evaporation which is accelerated by the semi-arid climate. Fluoride and chloride inputs are regulated by dissolution of fluoride-bearing minerals and anthropogenic causes, respectively. Saturation indices suggested supersaturation of carbonates and silicates, and undersaturation of evaporites and fluorite. Persistent high ionicity, and hardness of groundwater that is seldom impacted by seasonal variations might be playing a vital role in the genesis of CKDu.

1. Introduction

Groundwater has been an invaluable and indispensable natural resource for the sustenance of human life across the world, over the years. It is considered to be the most-extracted raw material worldwide, supplying drinking water for nearly half of the world’s population [1]. The ever-increasing demand for groundwater, compelled by the rapid growth of population and industries, and the subsequent over-exploitation puts unprecedented stress on limited groundwater resources. This has given rise to numerous environmental, social and health issues, including the degradation of water quality and spread of waterborne diseases [2,3].
The geochemistry of groundwater, in particular, is vital for drinking, as it may directly interfere with the health of consumers. Lithology of source-aquifer, rock-water interactions, evaporation and precipitation, residence time of groundwater and characteristics of the flow path are several of the factors that govern the geochemistry of groundwater [4]. There are ample examples to showcase that groundwater geochemistry is strongly linked with the health of the local population in a particular terrain. Such cases are commonly reported from less-developed, tropical-arid and semi-arid regions of the world, where groundwater is the primary source of drinking water [2,5]. For instance, high fluoride in groundwater critically affects the dental and skeletal health of over 60 million people in India, and arsenicosis attributed to high arsenic in groundwater is a serious health concern for 35–77 million people in Bangladesh [6,7].
Emerging ailments of unidentified origin that are often associated with the geochemistry of groundwater are increasingly reported from developing countries in the tropical-arid regions. Chronic kidney disease of unknown etiology or causality (CKDu) in Sri Lanka, India, Central America, and Balkan countries sets the best examples for such complex health issues that are omnipresent in rural areas experiencing hot-climate conditions [8,9]. CKDu is asymptomatic of the traditional risk factors of chronic kidney diseases, namely diabetes, hypertension and chronic glomerulonephritis, and is remarkably observable amongst rural farming communities [10]. While the characteristics of these diseases suggest numerous risk factors unique to each terrain, the episode in Sri Lanka is strongly suggestive of a geochemistry-induced onset, owing to the endemic occurrence of the disease in areas which rely on poor-quality groundwater for drinking [11,12].
The prevalence of CKDu in Sri Lanka is pronounced in the north-central region of the dry zone (Figure 1a), an area that is demarcated by year-round high temperature (25–30 °C) and limited rainfall (<1750 mm). Due to the short supply of piped water and scarcity of surface water resources, the domestic water needs in these areas, including for drinking and cooking, are primarily fulfilled with groundwater in dug wells and tube wells. The geochemical composition of groundwater in disease-endemic areas is rather unique and is characterized by the co-occurrence of elevated fluoride, hardness, and ionicity. A nephrotoxicity caused by the individual or synergistic effect of these constituents, along with heavy metals, metalloids, agrochemical residues, and organic matter are thus postulated as possible risk factors of CKDu. A recent review publication presented an elaborate discussion on the potential influence of these constituents in groundwater at the onset of CKDu [13].
Despite a great deal of past research, scientific evidence is still lacking to establish any relationship between groundwater and the occurrence of CKDu. Nevertheless, groundwater in the wet zone of the country (Figure 1a) that is absent of CKDu is found to be geochemically different from the groundwater in the dry zone where CKDu is pervasive [14]. Hence, distinguishing the geochemical character of groundwater in the CKDu-endemic areas is imperative in order to identify the possible sources and routes of undesirable chemical constituents in groundwater and thereby elucidate the cause of the disease. The present study intends to investigate water quality and the dominant geochemical processes of groundwater in the CKDu-endemic areas of Sri Lanka, and comprehend whether the groundwater is subjected to any geochemical variations due to the seasonal impacts of rainfall through comparing groundwater quality between the dry and wet seasons.
The findings of this study will provide insight into the hydrogeochemical evolution of groundwater in CKDu-endemic areas, the suitability of groundwater for drinking, and preventive measures for geochemical contamination of groundwater resources. Moreover, it may provide guidance for the sustainable management and effective utilization of the limited groundwater resources in these areas that are rapidly depleting due to mass-scale exploitation for the production of drinking water at the community-based reverse osmosis (RO) water treatment plants [15].

2. Materials and Methods
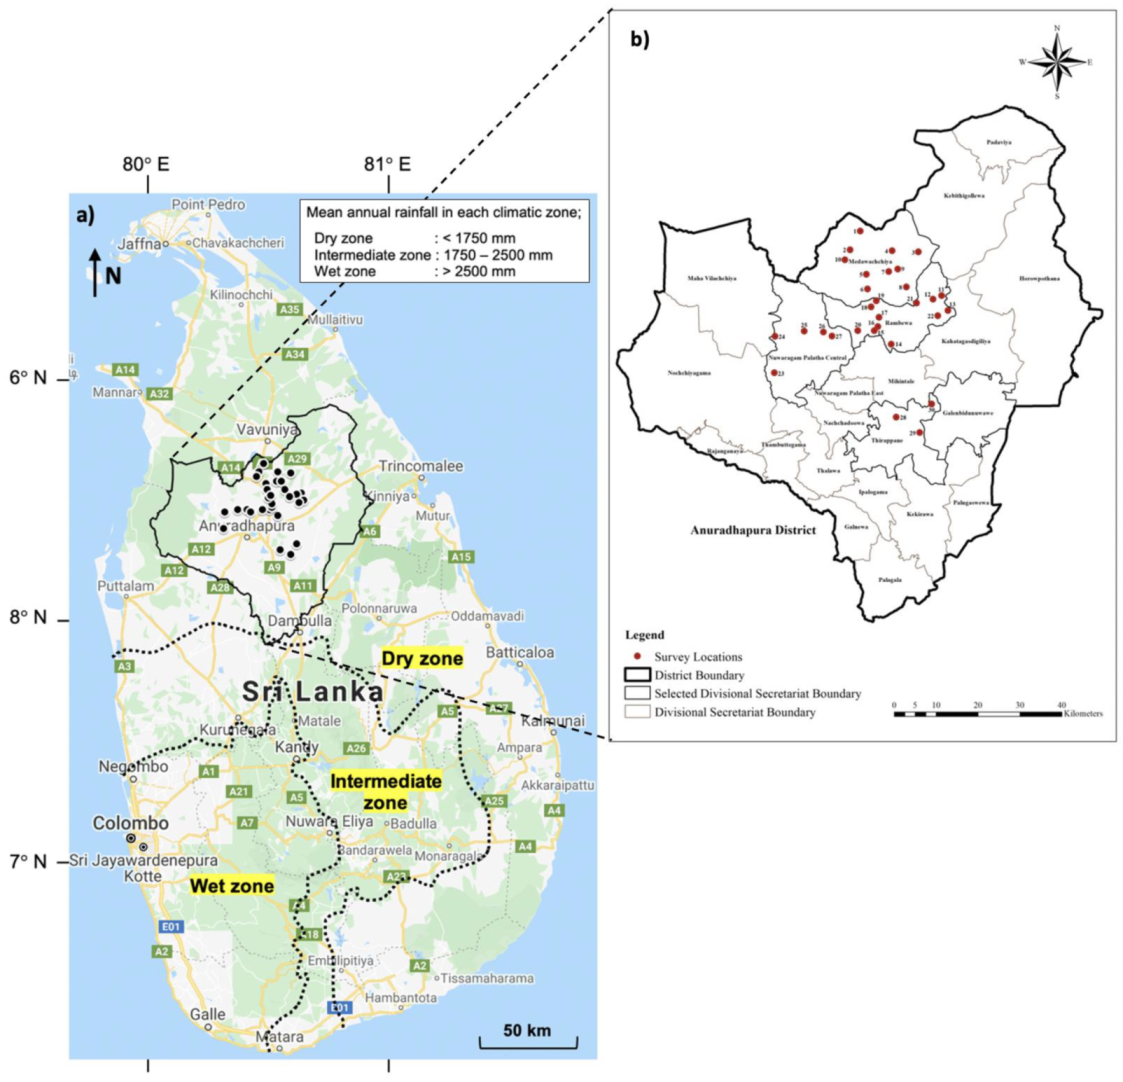
2.1. Study Area

This study was conducted in Anuradhapura District of the North Central Province (NCP), which is considered to be the hotspot of CKDu in Sri Lanka. It is the largest district in Sri Lanka, covering a land area of 7179 km2 with a total population of over 0.9 million people living in 22 Divisional Secretariat Divisions (DSDs) [16]. This study investigated groundwater sources in four DSDs in Anuradhapura, namely Nuwaragam Palatha Central, Medawachchiya, Rambewa, and Thirappane that are affected with CKDu at 1–4% point prevalence [17].
The study area belongs to the dry zone of Sri Lanka (mean annual temperature: 27.3–28.3 °C, mean annual rainfall: 1247–1419 mm), where much of the precipitation (74%) is received during the inter-monsoon rain, between October to November, and the northeast monsoon rain, between December to February [18,19]. The rest of the year suffers a long dry spell, while late August to early September marks the peak of the drought [20]. The average wind speed is approximately 2.02 m/s (measured at 91 m from the mean sea level, over 48 years) and the direction of wind may vary from 71° through 227° with reference to the north, depending on the monsoon flows [21,22]. The highest evapo-transpiration (>6 mm/day) is usually reported between the dry period, from May to September [23]. The low-land undulating topography of these areas varies between 50 to 400 m above the mean sea level [23]. The regional geology (Figure S1) is dominated with high-grade metamorphic rock formations, like quartzites, schists, granites, and gneisses of Precambrian Age [24]. Reddish-brown earth and low-humic-gley type soils are commonly occurring in this region [25].
The economy of this region heavily relies on paddy and chena cultivations which are irrigated with rain-fed tank-cascade systems (TCS) of NCP and agro-wells. The dominant land cover is forests, followed by paddy lands and water tanks. Surface water resources occupy only 7% of the total land area of Anuradhapura, with 14 large tanks, 79 medium-sized tanks and 2600 small tanks, and 4 rivers (Kala oya, Mee oya, Yan oya and Malwathu oya) [26]. These surface water sources are typically seasonal and are widely used for supplying water for irrigation; therefore, domestic water needs are primarily fulfilled with groundwater occurring in shallow regolith aquifers (<10 m deep) and deeper fracture zone aquifers (~30 to 40 m deep) in the hard metamorphic rock region [27]. The regolith aquifers comprise a highly weathered and permeable ‘saprolite’ layer underlain by rather impermeable and less-weathered ‘saprock’ layer. Groundwater in these aquifers usually occurs within pocket-formations in the saprolite stratum, thus a continuous water table cannot be anticipated. The depth of the groundwater table in regolith aquifers may vary between 2 to 8 m during the dry season and rise to ground level during the rainy season [20]. In the deeper fracture zone, groundwater is held in joints and fissures of the crystalline basement rocks [28].

2.2. Sampling and Water Quality Analysis

During the current study, groundwater samples (n = 60 in total) were collected from 30 dug wells located in the study areas in the dry season (23 August to 30 August 2019, temperature: 24–33 °C, average monthly rainfall: 44 mm) and wet or rainy season (23 December to 30 December 2019, temperature: 21–28 °C, average monthly rainfall: 230 mm). These were either household wells or public wells which had catered to the domestic water needs of local people for decades. However, they are no longer used for direct potable uses (other than abstraction of source water for RO water treatment plants in the locality), in order to avoid the risk of spreading CKDu. The sampling locations are indicated in Figure 1b.
The groundwater samples were analyzed on-site for pH, electrical conductivity (EC) and total dissolved solids (TDS), total alkalinity, and dissolved silica (SiO2). The pH, EC and TDS were analyzed using a portable water quality meter (LAQUAtwin, Horiba Corp., Kyoto, Japan). Total alkalinity was measured using a digital titrator (Digital Titrator-model 16,900, HACH, Ralph, CO, USA), where a simple titration with 1.6 N sulfuric acid was employed to determine a pH end point of 4.3–4.9 (using Bromcresol green-methyl red indicator). Dissolved silica (SiO2) was measured with a portable colorimeter (DR/900, HACH, USA) utilizing the Heteropoly Blue Method for low range SiO2 (0.01–1.60 mg/L) and Silicomolybdate Method for high range SiO2 (1–75 mg/L). All measuring equipment were calibrated every day prior to sampling.
A water sample was collected from each well and preserved for the laboratory analysis of cations and anions during both surveys. These samples were carefully transferred into sterilized polypropylene bottles (50 mL) by filtering through 0.45 μm polyethersulfone (PES) membrane syringe filters. The bottles were thoroughly rinsed with water to be sampled, prior to the collection of each sample. It was difficult to adhere to certain standard protocols of sample preservation, such as acidification, owing to the technical challenges encountered during sampling in the rural areas under investigation; hence, the best available method for the preservation of samples was adopted by storing the samples at below 4 °C until analysis, as suggested by [29].
Sample processing and analysis was carried out in the laboratory at the University of Tokyo, Japan, following the standard methods for the examination of water [30,31]. Cations (Na+, K+, Ca2+, and Mg2+) and anions (Cl, F, SO42−, and NO3) were analyzed with ion chromatography, using Advanced Compact IC-861 (TSKgel SuperIC-Cation HS column, Tokyo, Japan) and Chromatogram IC-2010 (TSKgel SuperIC-Anion HS column, Tokyo, Japan), respectively. The accuracy of the anion-cation analysis was assured through the analysis of MilliQ water as laboratory blanks. Field blanks or repeat analyses were not adopted, again due to the technical challenges encountered during the surveys. These should be noted as limitations to interpreting data in the present study.
Bicarbonate (HCO3) was calculated based on alkalinity, using Equation (1) and total hardness was calculated with Ca2+ and Mg2+ concentrations, using Equation (2). The derivation of Equations (1) and (2) are described in [32] (pp. 12–13) and [33] (pp. 93–94), respectively.
HCO3 (in mg/L) = 1.22 × Total alkalinity (in mg/L as CaCO3)
Total hardness (in mg/L as CaCO3) = 2.5 × (Ca2+, mg/L) + 4.1 × (Mg2+, mg/L)
Analytical precision of the measurements of major ions was determined by calculating the ionic balance error percentage. All samples from dry and wet seasons were within ±7% ionic balance, thus the chemical analysis was satisfactory.

2.3. Data Analysis

“R” statistical software was used for all statistical analyses [34]. Welch Two Sample t-test was conducted for statistical comparison of groundwater quality data, with significant differences determined based on the p values. Additionally, Pearson’s correlation coefficient (r) was calculated to identify the correlations between major ion types in groundwater.
“GW_Chart” geochemical modeling software by United States Geological Survey (USGS) was used to generate the Piper trilinear diagram. It is a useful tool that classifies groundwater into different facies based on the dominant ion types [35]. Gibbs diagram was created to identify the key processes through which dissolved ions are introduced to groundwater, namely precipitation, evaporation, and rock–water interactions [36]. It is a simple scatter diagram representing the ratios of Na+/(Na+ + Ca2+) and Cl/(Cl + HCO3) as a function of TDS, where three distinct fields classify the dominancy of the above-mentioned processes. The correlations between major ion types in water were explained with the use of various hydrogeochemical plots. Finally, the saturation indices (SI) of potential minerals in the groundwater were estimated with “PHREEQC3” geochemical modeling software by USGS [37]. SI value gives an indication of the state of chemical equilibrium of groundwater with respect to a particular mineral phase [38]. SI of a given mineral is governed by its ion activity product (IAP) and solubility product (Ksp), and is calculated with Equation (3).
SI = log ( IAP / K sp )
If SI is negative (SI < 0), the groundwater is considered undersaturated with respect to the given mineral, meaning that it will continue to dissolve to achieve equilibrium. If SI is positive (SI > 0), it implies supersaturation, which leads to further precipitation of the mineral to reach equilibrium. A neutral SI, i.e., SI = 0 indicates that the mineral will remain in equilibrium with the water phase [39].

3. Results and Discussion

3.1. Groundwater Quality and Compliance with Drinking Water Standards

The descriptive statistics of water quality data from the dry and wet seasons, and the p values from the statistical comparison (with Welch two sample t-test) of groundwater quality between the two seasons are indicated in Table 1. The compliance of groundwater quality for drinking was assessed with the maximum allowable levels (MALs) specified under Sri Lanka Standards for potable water i.e., SLS 614: 2013 (Table 1), and where applicable, with World Health Organization (WHO) drinking water guidelines [40,41].
The mean temperature of the groundwater did not fluctuate noticeably among the sources and the two seasons (dry 30 °C; wet 29 °C), yet a significant seasonal difference was noted in the statistical analysis (p < 0.05). The pH was rather low in the dry season (mean 6.6) but increased to a mean value of 7.3 in the wet season, leading to a significant seasonal variation at p < 0.01. Consequently, one third of the samples in the dry season, and 3% in the wet season did not meet the lower threshold for drinking (6.5). However, the mean pH levels complied with the recommended range. The weak acidity of groundwater in the dry season might be ascribed to numerous reasons, such as variations in carbonic equilibrium, buffering of H+ ions by clay minerals, increased oxidation of certain H+-releasing minerals, and long-term weathering of aquifer materials [42].
Despite low to neutral pH, the groundwater was highly alkaline and the mean alkalinity levels were comparable between the two seasons (dry 379 mg/L as CaCO3; wet 364 mg/L as CaCO3). Over 90% of both dry and wet season samples far exceeded the taste-threshold for total alkalinity (200 mg/L as CaCO3). High mean EC (dry 1157 µS/cm; wet 958 µS/cm) and TDS (dry 578 ppm; wet 510 ppm) levels were observed in both seasons. The levels were relatively higher in the dry season than in the wet season, but the differences were not statistically significant. TDS in 67% wells in the dry season and 40% wells in the wet season, including the mean TDS levels, surpassed the MAL (500 ppm), suggesting the unpalatability of groundwater. These high EC/TDS levels could be ascribed to rock-water interactions in the groundwater aquifers that are accelerated due to the semi-arid climate conditions prevailing in the CKDu-endemic region [11]. Seawater intrusion would be an unlikely source of high EC/TDS, as the study area is located far away from the coastal belt (>50 km). Total hardness depicted similar trends as EC and TDS and the mean concentrations exceeded 180 mg/L as CaCO3 in both seasons (dry 394 mg/L as CaCO3; wet 382 mg/L as CaCO3), indicating extreme hardness of groundwater [41]. The abundant presence of calcium and magnesium-bearing minerals in the aquifers might have caused high hardness in the groundwater. Nevertheless, nearly 50% of the wells had total hardness exceeding total alkalinity, inferring the occurrence of non-carbonate or permanent hardness in groundwater [43].
The mean concentrations of sodium (dry 86 mg/L; wet 87 mg/L) remained invariable over the seasons and complied with the non-health-based MAL (200 mg/L), but 3–7% individual samples surpassed the limit. Potassium levels as high as 19 mg/L and 45 mg/L were reported in the dry and wet season respectively, yet the mean concentrations for both seasons are appreciably low and comparable (dry 1.77 mg/L; wet 2.66 mg/L). Rather conservative calcium concentrations (dry 87 mg/L; wet 87 mg/L) were noted over the seasons. Nearly a quarter of the wells exceeded the MAL for calcium (100 mg/L), yet the mean concentrations always satisfied the limit. The magnesium concentrations ranged up to nearly 90 mg/L in both seasons, and the mean concentrations (dry 43 mg/L; wet 40 mg/L) exceeded the MAL (30 mg/L) in nearly 70% samples, regardless of the season. Owing to excessive calcium and magnesium, over 90% wells failed to meet the SLS taste-threshold for hardness (250 mg/L as CaCO3), irrespective of the seasons. Geochemical studies hypothesized undesirable health effects due to excessive hardness, calcium and magnesium in drinking water in the CKDu-endemic areas. Certain wells in this region have been abandoned for years due to the increased unpalatability of water caused by high hardness [44]. Moreover, the potential contribution of hardness and hardness cations in the onset of CKDu is widely suspected considering their ability to create nephrotoxic effects in the presence of a multitude of chemical constituents including fluoride, heavy metals, pesticide residues and certain organic matter [13,44,45,46,47].
In general, the concentrations of bicarbonate (dry 462 mg/L as CaCO3; wet 444 mg/L as CaCO3), chloride (dry 106 mg/L; wet 100 mg/L), and sulfate (dry 29 mg/L; wet 34 mg/L) remained unchanged over the seasons. The low concentrations of nitrate that were detected in groundwater could be ascribed to the leakage of sewage from pit latrines (Figure S2) and intensive agricultural practices in the study areas [48,49]. The levels were significantly reduced in the wet season (dry 1.96; wet 0.35 mg/L) compared to the dry season (p < 0.05), possibly due to the increased dilution or curtailed use of fertilizers in the rainy season [11]. The mean chloride concentrations always met the MAL (250 mg/L), while only 7–10% of the wells did not. Additionally, all of the samples complied with the MALs for sulfate and nitrate.
The endemic areas of CKDu are characterized with high fluoride levels in groundwater (>1.0 mg/L) compared to non-endemic areas (<1.0 mg/L), and previous studies reported levels as high as 13 mg/L in the well water in these areas [50]; therefore, fluoride is considered to be a probable risk factor of CKDu as well [51]. Leaching of fluoride from minerals such as micas, hornblende, pyroxene, and apatite in the underlying metamorphic rocks is thought to be accelerated under the tropical climatic conditions prevailing in the CKDu region, particularly due to increased evaporation and low dilution [51]. Nevertheless, fairly low and steady fluoride concentrations were observed in the current study irrespective of the seasons (dry 0.72 mg/L; wet 0.69 mg/L). SLS specifies a lower MAL for fluoride (1.0 mg/L), compared to the WHO guideline value (1.5 mg/L), contemplating the higher water intake by people living in the tropical regions. The mean fluoride concentrations satisfied both MAL and WHO guidelines, but nearly 20% of the samples had levels ranging between 1.0–1.5 mg/L, whereas 7–10% exceeded 1.5 mg/L. Nevertheless, the wide prevalence of dental fluorosis in the study region implied that the uptake of fluoride is severe, even at these low concentrations measured in groundwater [52].
The results in general are indicative of rather steady concentrations of major ions in groundwater notwithstanding the seasonal impacts of rainfall. Although the water levels in the wells were not measured during the field survey, personal communications with local people confirmed that the water table had been depleted and had risen by the time of sampling in the dry and wet seasons, respectively. Under such circumstances, high ion concentrations are typically anticipated in the dry season compared to dilution-induced low ion concentrations in the wet season [53]. However, the accumulation of salts within the soil profile during the dry seasons, and their subsequent leaching into groundwater during the rainy periods is a common phenomenon associated with the shallow regolith aquifers in the southern-dry zone of Sri Lanka [28]. This might logically explain why significant seasonal variations in ion concentrations or chemical parameters were not observed in the present study despite visible fluctuations in the groundwater table.

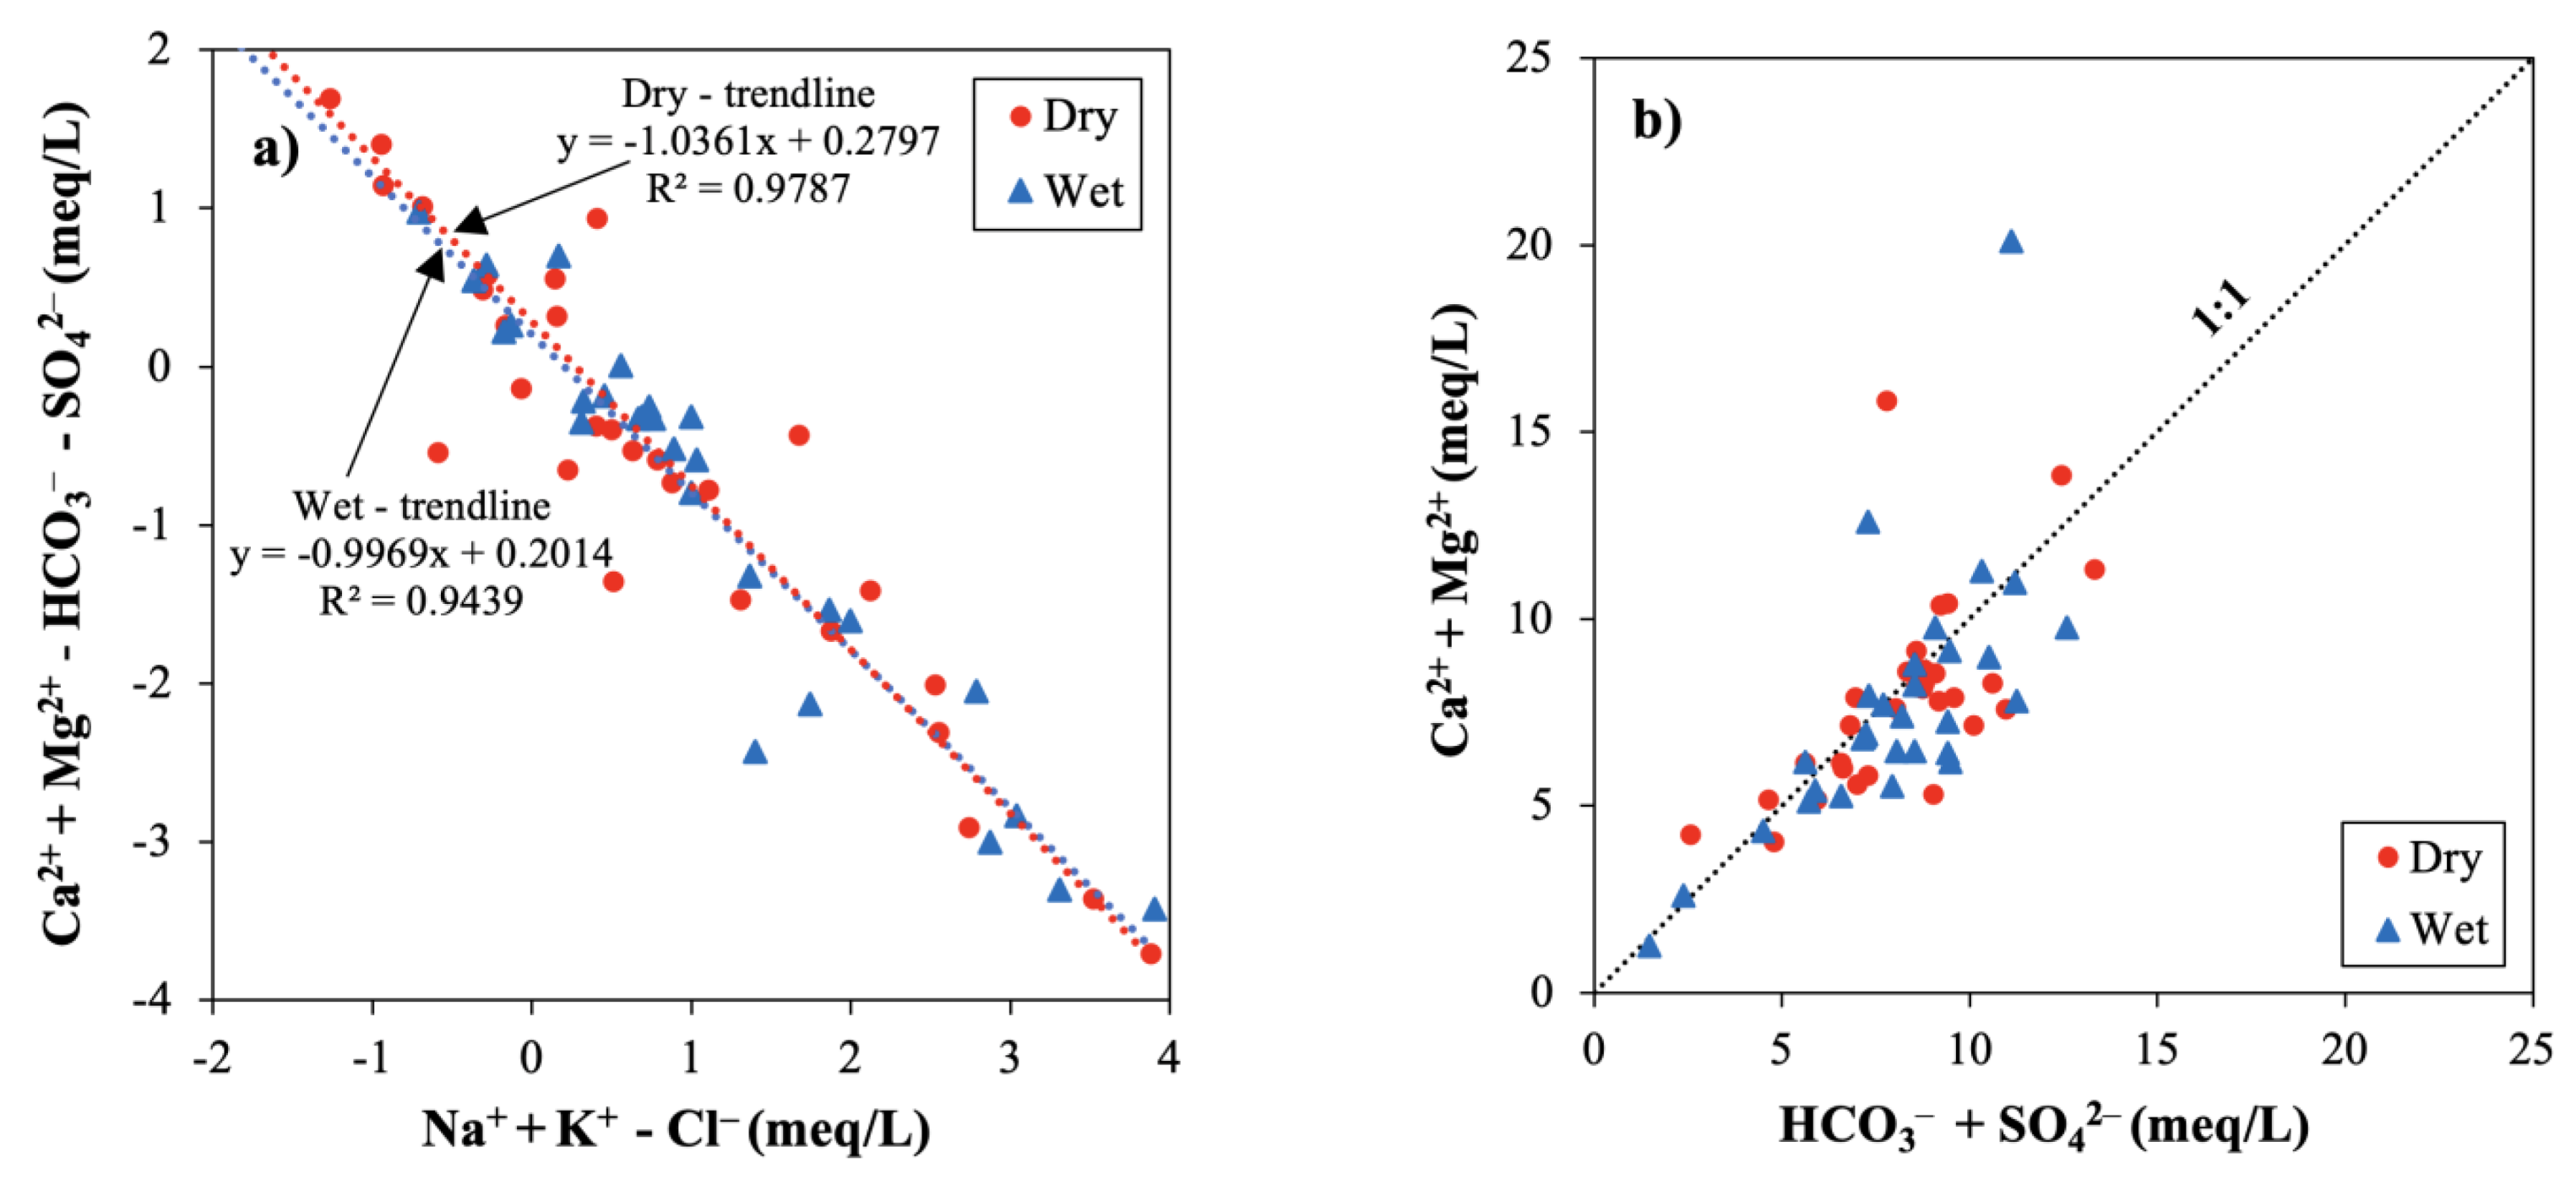
3.2. Major Ion Chemistry and Chemical Processes

The ionic composition of groundwater determined in terms of the milliequivalent concentrations of cations and anions varied in the order; Ca2+ (37%) > Na+ (32%) > Mg2+ (30%) >> K+ (1%) and HCO3 (65%) > Cl (29%) >> SO42− (5.6%) > F (0.4%), respectively. The total cations showed quite similar proportions of Ca2+, Na+ and Mg2+, but a very low share of K+. Bicarbonate (HCO3) was the dominant anion type, followed by Cl. The concentrations of SO42− and F were proportionately low, whereas NO3 was negligible compared to the major anions.

3.2.1. Correlation Coefficient Matrix

The correlations between major ionic parameters are indicated in the correlation coefficient (r) matrix in Table 2. Much stronger correlations (r > 0.7) were noted in the wet season samples compared to the dry season samples. TDS was more strongly correlated with Cl (r for dry = 0.803; wet = 0.877) compared to other major ions; Ca2+, SO42−, Na+, HCO3, and Mg2+ (r = 0.556–0.797). Further strong correlations were noted between Na+ and Cl (r = 0.755), Ca2+ and SO42− (r = 0.782), Mg2+ and HCO3 (r = 0.715), Ca2+ and Cl (r = 0.780), and SO42− and Cl (r = 0.752), which are probably attributed to rock-water interactions, and ion exchange processes in these groundwater systems [54,55].
The discussion below exemplifies numerous methods of analyzing geochemical water quality data and the graphical representations of the relationships between those water quality parameters. Such interpretations would be beneficial to identify the primary sources of ions in groundwater and the processes controlling the geochemistry of groundwater in a particular terrain.

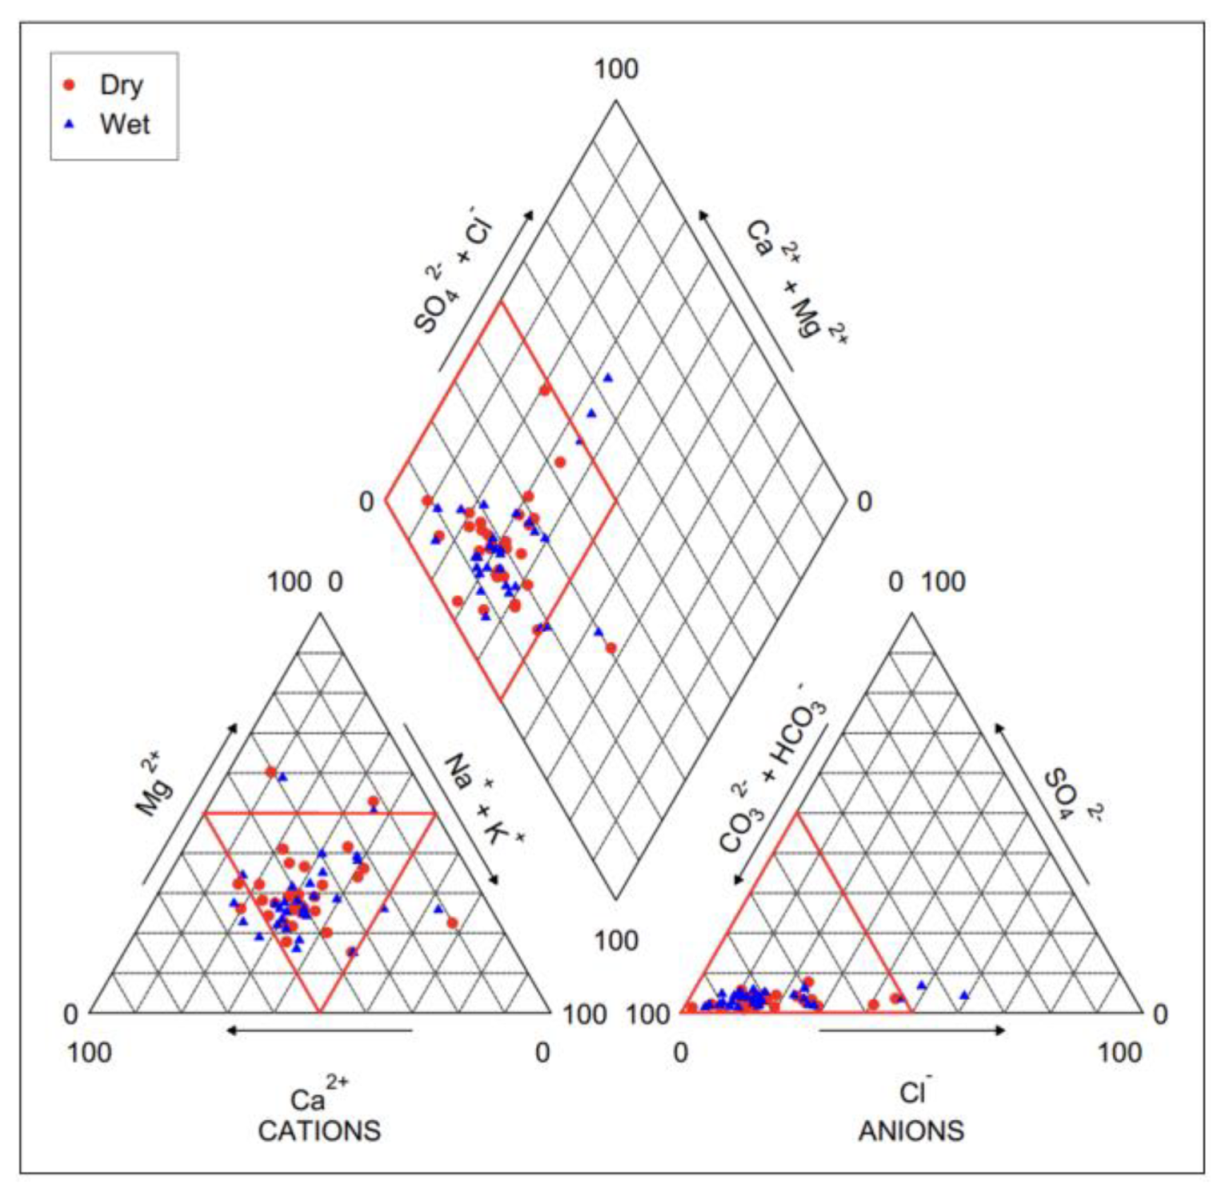
3.2.2. Piper Diagram

As per the Piper diagram based on the present results (Figure 2), this groundwater can be commonly characterized as calcium-magnesium-bicarbonate (Ca-Mg-HCO3) type [35]. Near-surface weathering of carbonate and silicate minerals would typically give rise to these ion species, causing high alkalinity of groundwater [4].

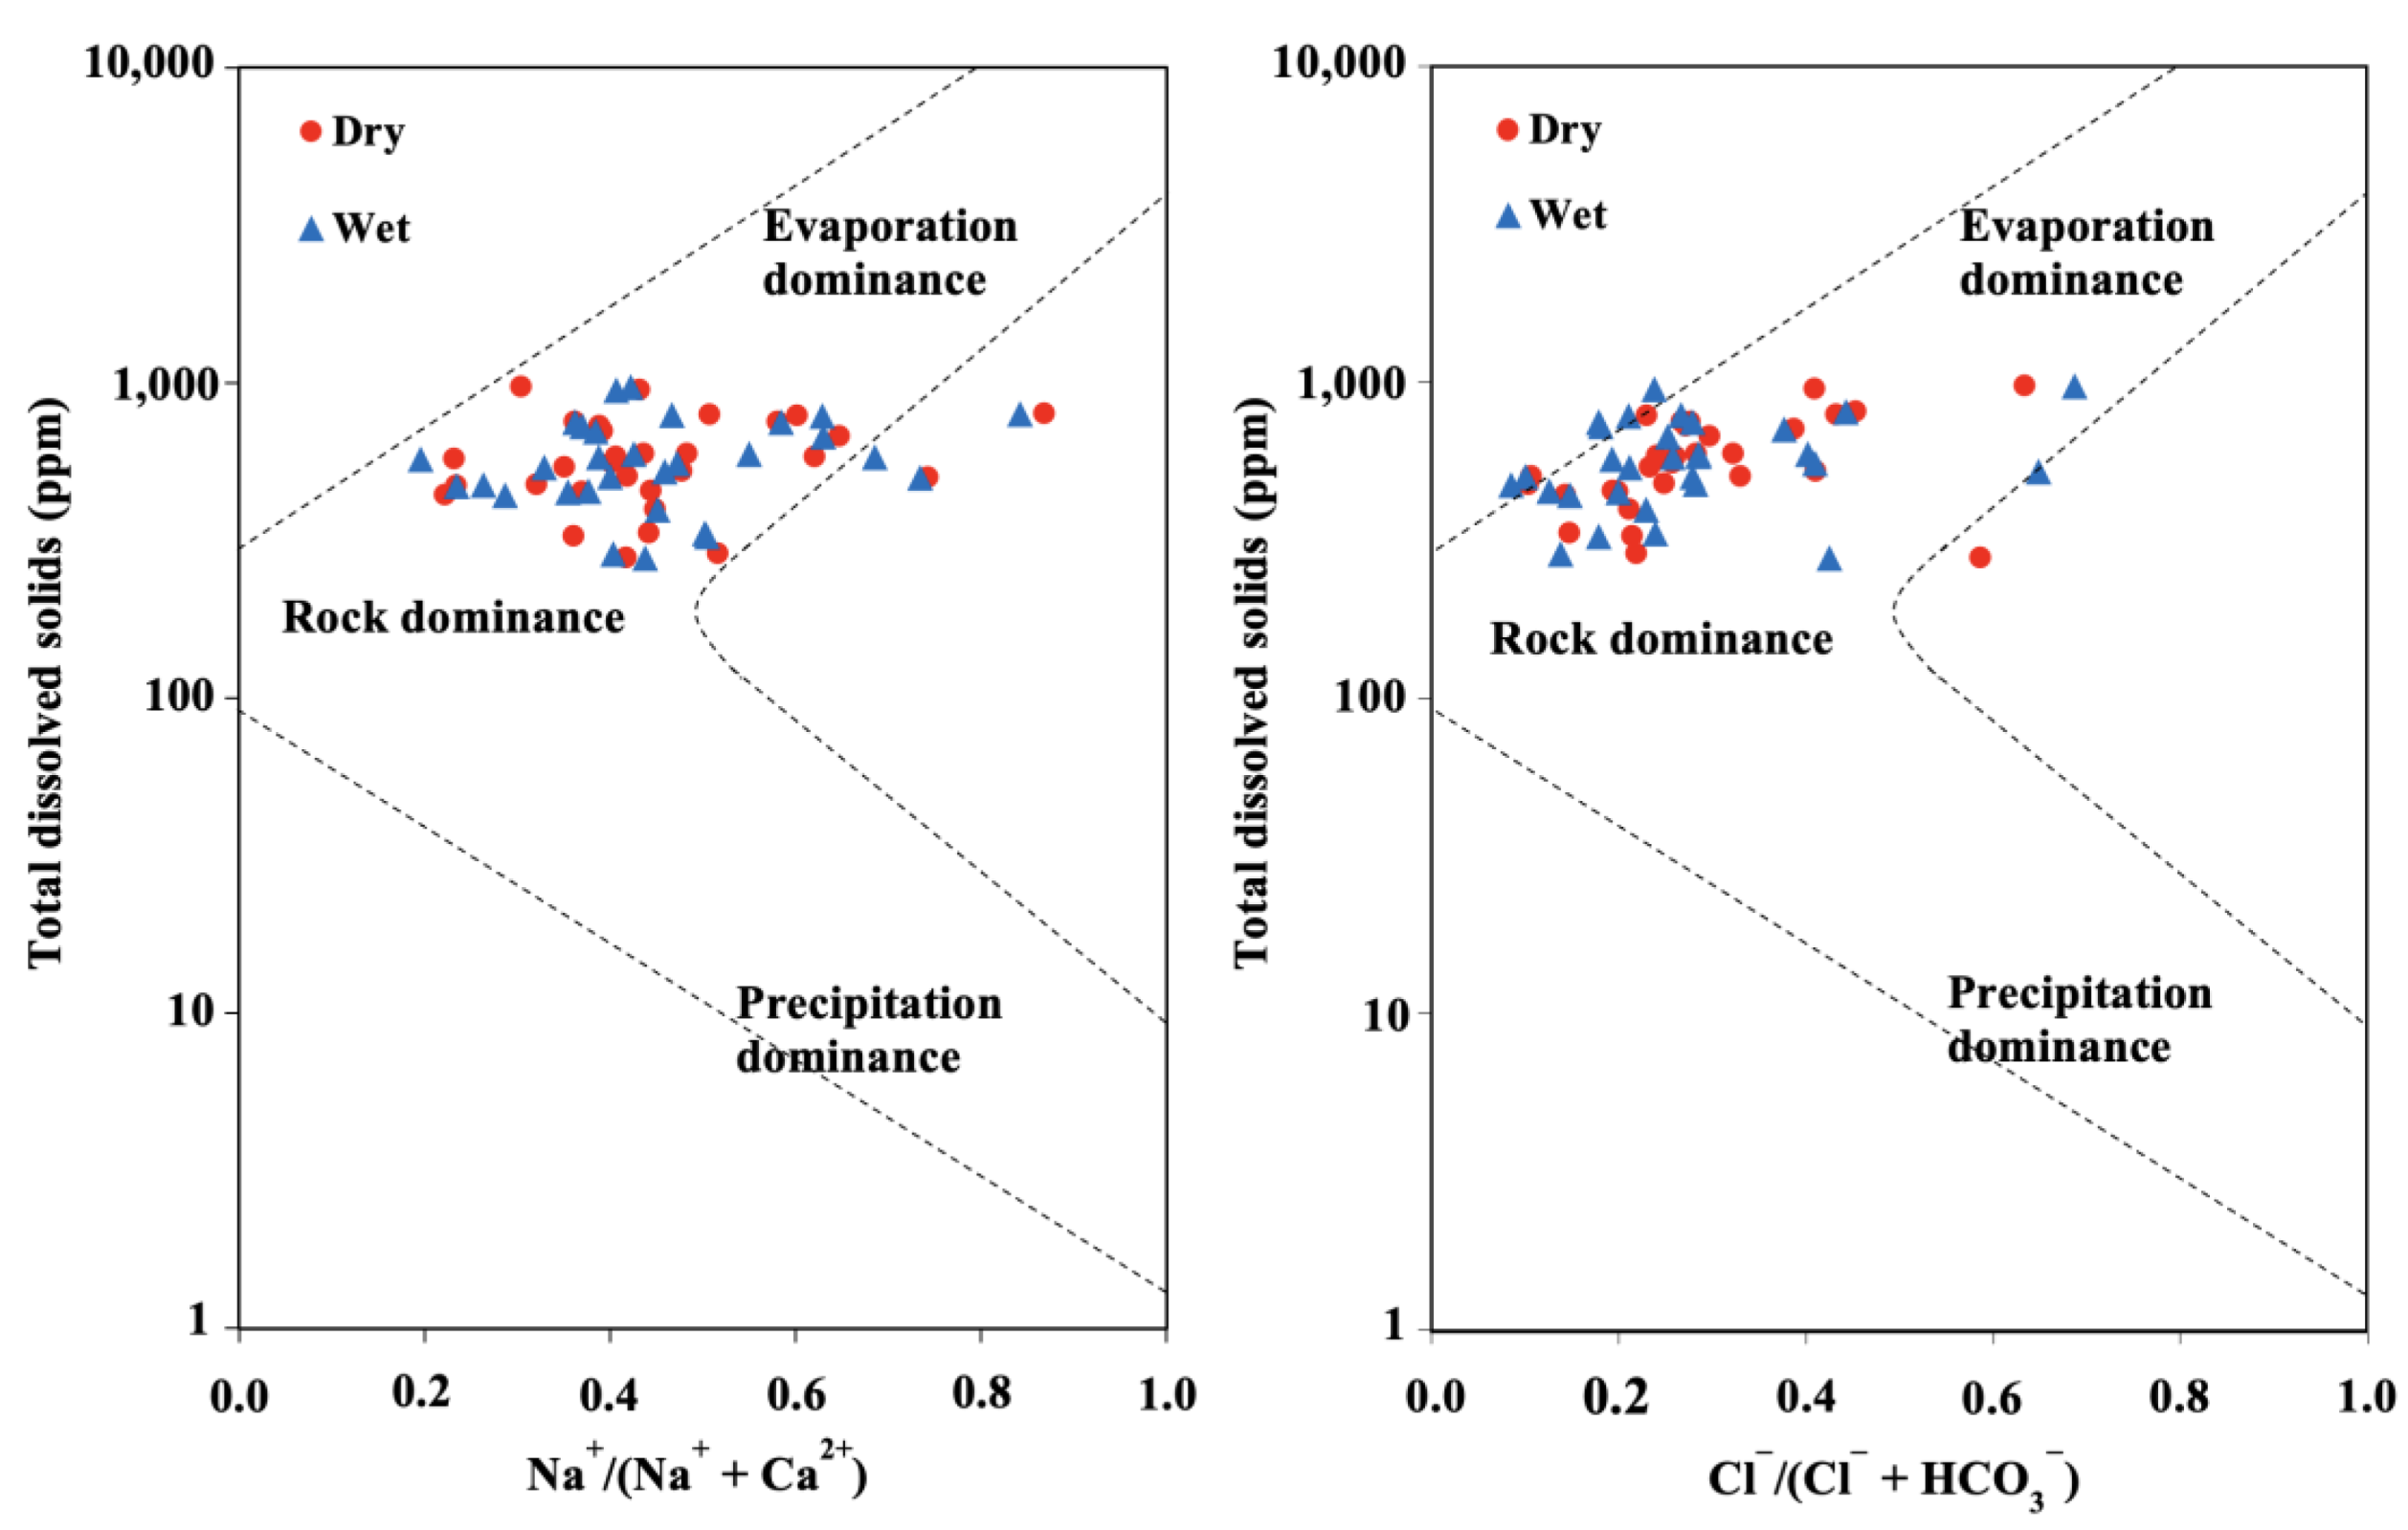
3.2.3. Gibbs Diagram

In the Gibbs diagram based on present results (Figure 3), the data points from both seasons were scattered in-between the rock–water interaction and evaporation dominant regions of the Gibbs diagram; thus, both the chemical weathering of rocks and evaporation are influencing the geochemistry of groundwater in these areas [36]. The ions formed by chemical weathering are further concentrated due to increased evaporation driven by the semi-arid climate in the study areas, leading to high salinity or TDS levels. In addition, increased leaching during rainy periods may also give rise to high salinity levels [56].

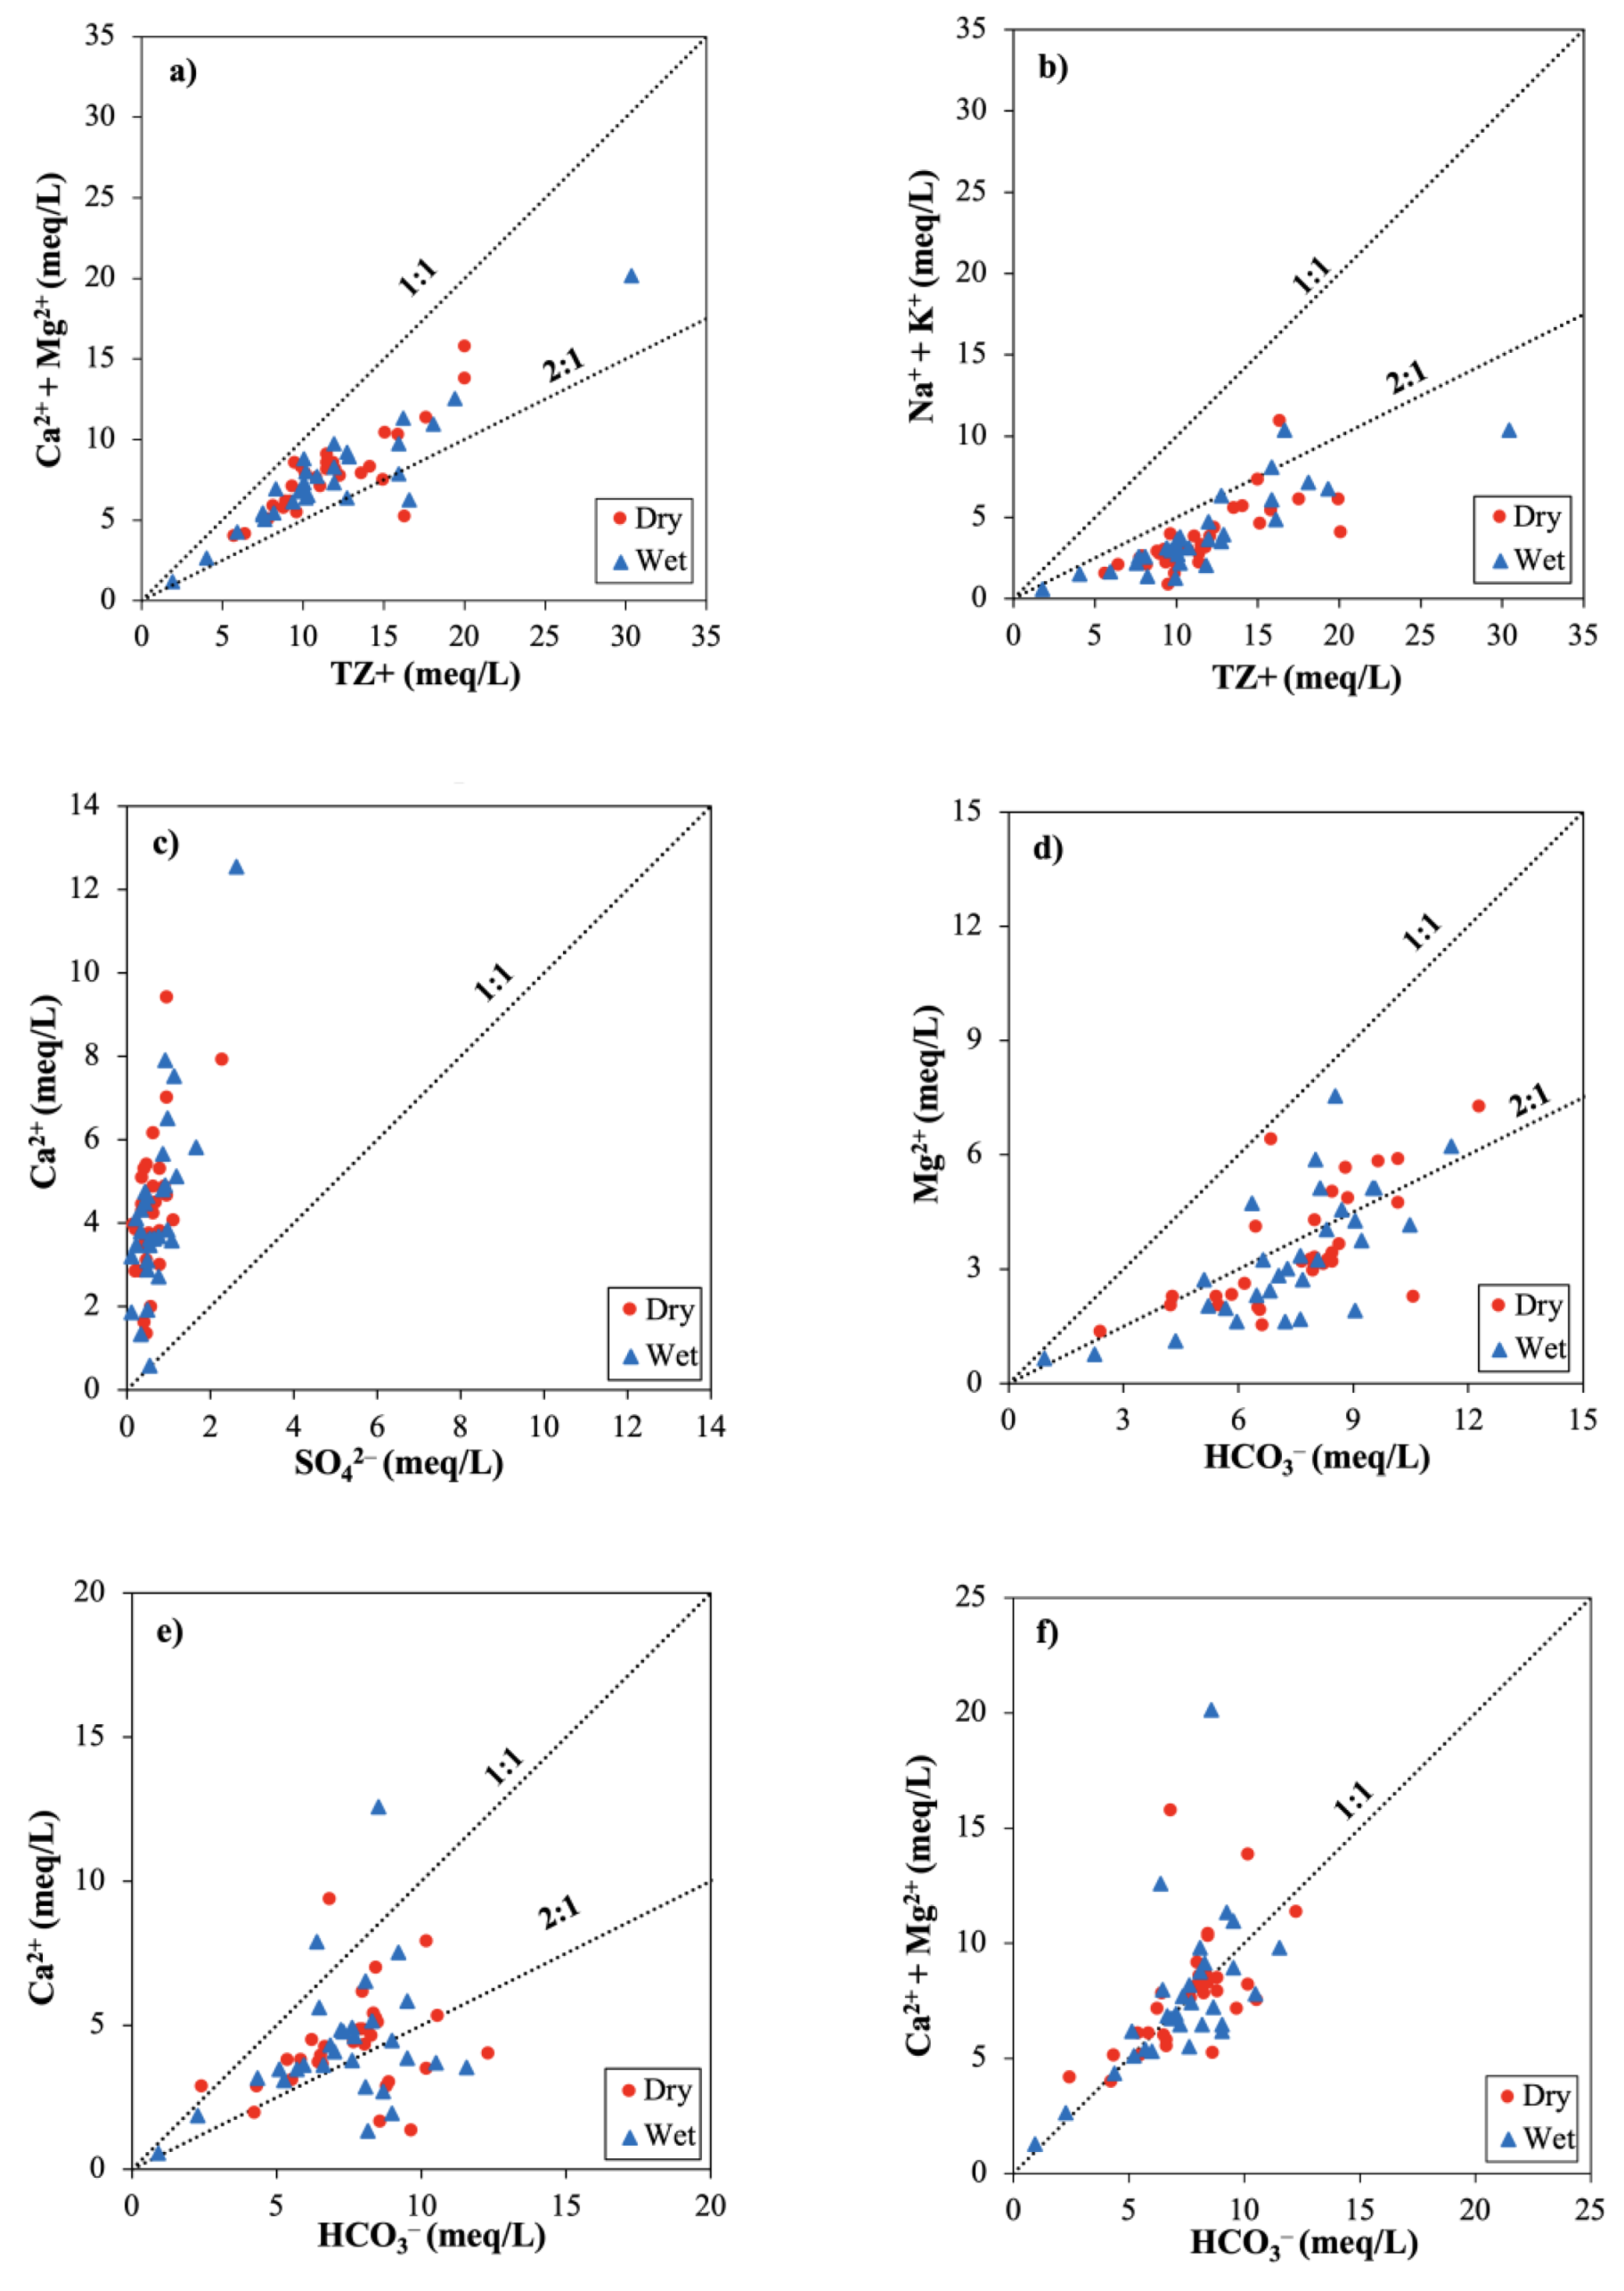
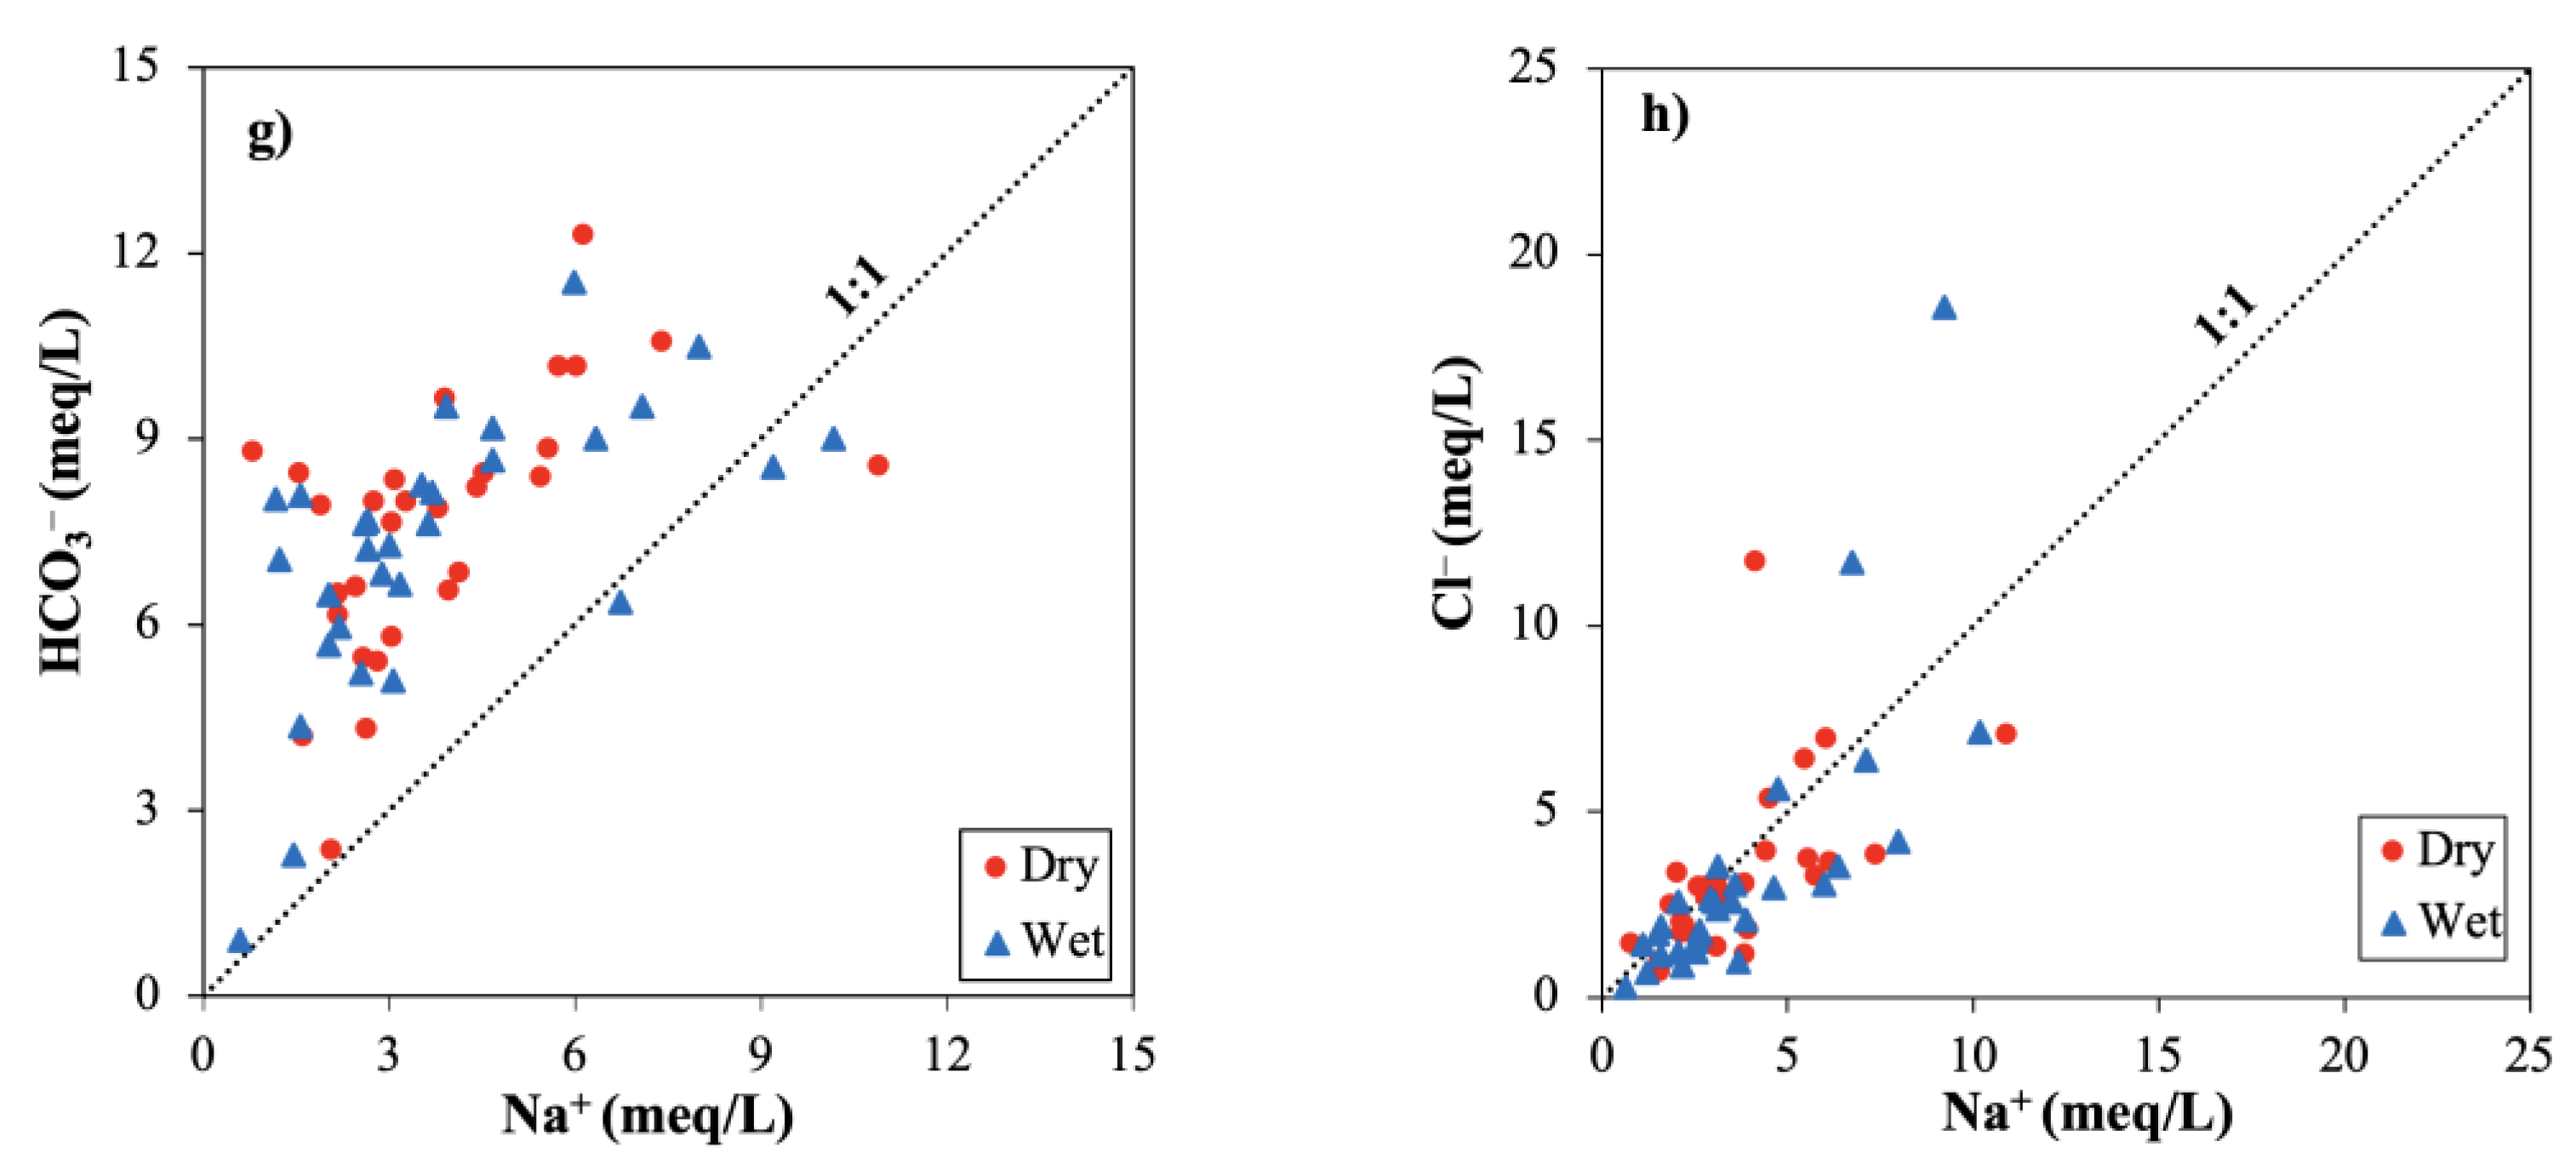
3.2.4. Hydrogeochemical Plots

Hydrogeochemical plots provide a clear illustration of the correlations between major ion types. In Figure 4a,b, the equiline marked total cations (TZ+) comprising only of the cation types indicated in the Y-axis, whereas 2:1 line marked only 50% contribution to the total cations by the cations in the Y-axis. In the plot of Ca2+ + Mg2+ vs. total cations (TZ+) (Figure 4a), almost all the points fell in-between the equiline (1:1) and 2:1 line, regardless of the seasons. This inferred that the groundwater is enriched with alkaline earth cations, contributing to around 70% of the total cations. The low content of alkali cations (~30%) was further illustrated by the Na + + K+ vs. TZ+ diagram (Figure 4b). The possible reason for reduced alkali cations in solution might be the replacement of Na+ by Ca2+ and Mg2+ during the reverse ion exchange process, as explained in the forthcoming discussion.
The weathering of carbonate minerals is a primary hydrogeochemical process that produces high amounts of Ca2+, Mg2+, and HCO3 in groundwater. It is an intensive process driven by weak carbonic acid (Equation (4)) which causes rapid dissolution of carbonate minerals, such as calcite (Equation (5)) and dolomite (Equation (6)). Additionally, gypsum dissolution (Equation (7)) may also produce a high amount of Ca2+ [4,57]. The hard metamorphic terrain of the study areas is underlain by crystalline limestone and calc rocks which are considered to be prospective sources of Ca2+, Mg2+ and HCO3 in the groundwater [58,59]. Furthermore, a geochemical mass balance modelling study by [60] suggested that groundwater in the study areas is highly influenced by carbonate dissolution. However, geological evidence hardly suggested the presence of gypsum in these areas.
Formation   of   carbonic   acid :   CO 2   +   H 2 O     H 2 CO 3
Calcite   dissolution :     CaCO 3   +   H +     Ca 2 +   +   HCO 3
Dolomite   dissolution :   CaMg ( CO 3 ) 2   +   2 H +     Ca 2 +   +   Mg 2 +   +   2 HCO 3
Gypsum   dissolution :   CaSO 4 · 2 H 2 O     Ca 2 +   +   SO 4 2   +   2 H 2 O
On the other hand, the weathering of silicate minerals, like albite, gives rise to high Na+ and HCO3 concentrations (Equation (8)). A substantial amount of Ca2+ and Mg2+ is also brought into solution by silicate weathering, but to a lesser extent with respect to HCO3 [57]. Pyroxenes and amphiboles are some of the commonly found silicate minerals in the CKDu-endemic areas which contain Ca2+ and Mg2+ [11]. The dissociation equations for these minerals are shown in Equations (9) and (10) respectively [61].
Albite dissolution:
2 NaAlSi 3 O 8   +   9 H 2 O   +   2 H 2 CO 3     Al 2 Si 2 O 5 ( OH ) 4   +   2 Na +   +   2 HCO 3   +   4 H 4 SiO 4
Pyroxene dissolution:
CaMg ( Si 2 O 6 )   +   4 CO 2   +   6 H 2 O     Ca 2 +   +   Mg 2 +   +   4 HCO 3     +   2 H 4 SiO 4
Amphibole dissolution:
Ca 2 Mg 5 Si 8 O 22 ( OH ) 2   +   14 CO 2     +   22 H 2 O     2 Ca 2 +   +   5 Mg 2 +   +   14 HCO 3   +   8 H 4 SiO 4
In addition to the chemical weathering of minerals, the geochemistry of major cations in groundwater can be highly affected by the occurrence of ion exchange. This process can take place in two forms, namely direct ion exchange (Equation (11)) and reverse ion exchange (Equation (12)). The direct process brings high alkali cation (Na+) concentrations to groundwater while reducing the alkaline earth cations (Ca2+). The opposite happens in the reverse ion exchange process.
Direct   ion   exchange :   Ca 2 +   +   2 Na - X     2 Na +   +   Ca - X 2
Reverse   ion   exchange :   2 Na +   +   Ca - X 2     Ca 2 +   +   2 Na - X
The hydrogeochemical plots from Figure 4c–h are generally described based on the dispersion of data points with respect to the equiline. The points scattered along the line indicated the same source(s) of origin for both ion types shown in X and Y axes. The points above the line indicated additional sources for the ion type(s) in the Y-axis, whereas those below the line suggested such additional sources for the ion type in the X-axis. The same interpretation applies for Figure 4d,e with 2:1 line, instead of 1:1.
If the dissolution of gypsum is the primary source of Ca2+ and SO42−, the ratio between Ca2+ and SO42− should be equal to 1 in Figure 4c. Nevertheless, the data points were concentrated towards the Ca2+ side of the graph, far above the equiline, suggesting that dissolution of gypsum is not a likely source of Ca2+ in both seasons [62]. In Mg2+ vs. HCO3 plot (Figure 4d), some data points fell along 2:1 line, indicating carbonate dissolution. The points below 2:1 line suggested the origin of Mg2+ and HCO3 by silicate weathering, whereas the points above the line hinted at additional sources of Mg2+, such as reverse ion exchange [63].
The data points in between 1:1 and 2:1 lines in Ca2+ vs. HCO3 plot (Figure 4e), and the points scattered along 1:1 line in Ca2+ + Mg2+ vs. HCO3 plot (Figure 4f) suggested dissolution of carbonates as the key source of Ca2+, Mg2+ and HCO3, regardless of the seasons [62]. Considerable points below the 2:1 line in Figure 4e, and equiline in Figure 4f illustrated abundance of HCO3 over Ca2+ and Mg2+ ascribed to the weathering of silicate minerals, such as pyroxenes and amphiboles. At the same time, a substantial number of samples scattered above the equiline in Figure 4f suggested that carbonate weathering in aquifers might be accompanied by reverse ion exchange to produce higher Ca2+ and Mg2+ with respect to HCO3 [64,65].
The plot of HCO3 vs. Na+ (Figure 4g) is useful to clarify whether silicate weathering could be a primary source of Na+ and HCO3 in groundwater. A very few points on the equiline suggested the weathering of silicate minerals as a source of both HCO3 and Na+. However, a large portion of samples from both seasons fell above the line, indicating higher HCO3 compared to Na+ due to the occurrence of carbonate weathering, in addition to silicate weathering. Reverse cation exchange could be another possible reason for reduced Na+ concentrations, as explained in the forthcoming discussion [66]. In the plot between Na+ and Cl (Figure 4h), the points scattered along and around the equiline at low concentrations of Na+ and Cl suggested halite dissolution as a likely source of both ion types [4]. Nevertheless, halite is not reported to be naturally occurring in the groundwater resources in the study region. A considerable number of points scattered below the line regardless of the seasons, denoting higher abundance of Na+ due to silicate weathering and/or ion exchange process [67]. Few points above the line portrayed Cl enriched groundwater. Removal of Na+ by reverse cation exchange while Cl being readily moved through soil could be a potential reason for this [64]. Additionally, anthropogenic activities, such as the mixing of fertilizer from agricultural fields, and mixing of sewage, may produce high-chloride groundwaters [68] High sewage contamination of wells was noted in this study and the level of contamination is shown in Figure S2.
The relationships between major ions can be interpreted in several ways to explicate whether cation exchange is predominant in groundwater. The slope of Ca2+ + Mg2+ − HCO3 − SO42− vs. Na+ + K+ − Cl scatter plot being equal to −1 (in other words, coefficient of determination, i.e., R2 = 1) denotes the overall presence of cation exchange in groundwater [62]. The trendlines for dry and wet seasons (in Figure 5a) had slopes equal to −1.014 (R2 = 0.96) and −1.005 (R2 = 0.97) respectively; therefore, the occurrence of cation exchange in these groundwater sources is perfectly illustrated.
The plot of Ca2+ + Mg2+ vs. HCO3 + SO42− (Figure 5b) can be employed to further elaborate on the type of cation exchange. A significant number of samples, irrespective of the seasons, are scattered below the equiline and within the HCO3 + SO42− region, implying the dominance of cation exchange. Nevertheless, a fair share of points fell above the line too (in Ca2+ + Mg2+ region), implying the occurrence of reverse cation exchange in certain groundwater sources [69]. This is further confirmed by Chloro-alkaline indices CAI-1 and CAI-2 calculated with Equations (13) and (14), respectively [70].
CAI-1 = Cl − (Na+ + K+)/Cl
CAI-2 = Cl − (Na+ + K+)/(HCO3 + CO32− + SO42− + NO3)
Negative values for CAI-1 and CAI-2 imply ion exchange whereas positive values imply reverse ion exchange. The indices were negative for 65% of the samples from the dry season and 74% from the wet season. This further verifies the dominance of direct ion exchange in these groundwaters. Additionally, the negative CAI indices are suggestive of the origin of bicarbonate ions by carbonate weathering [71].

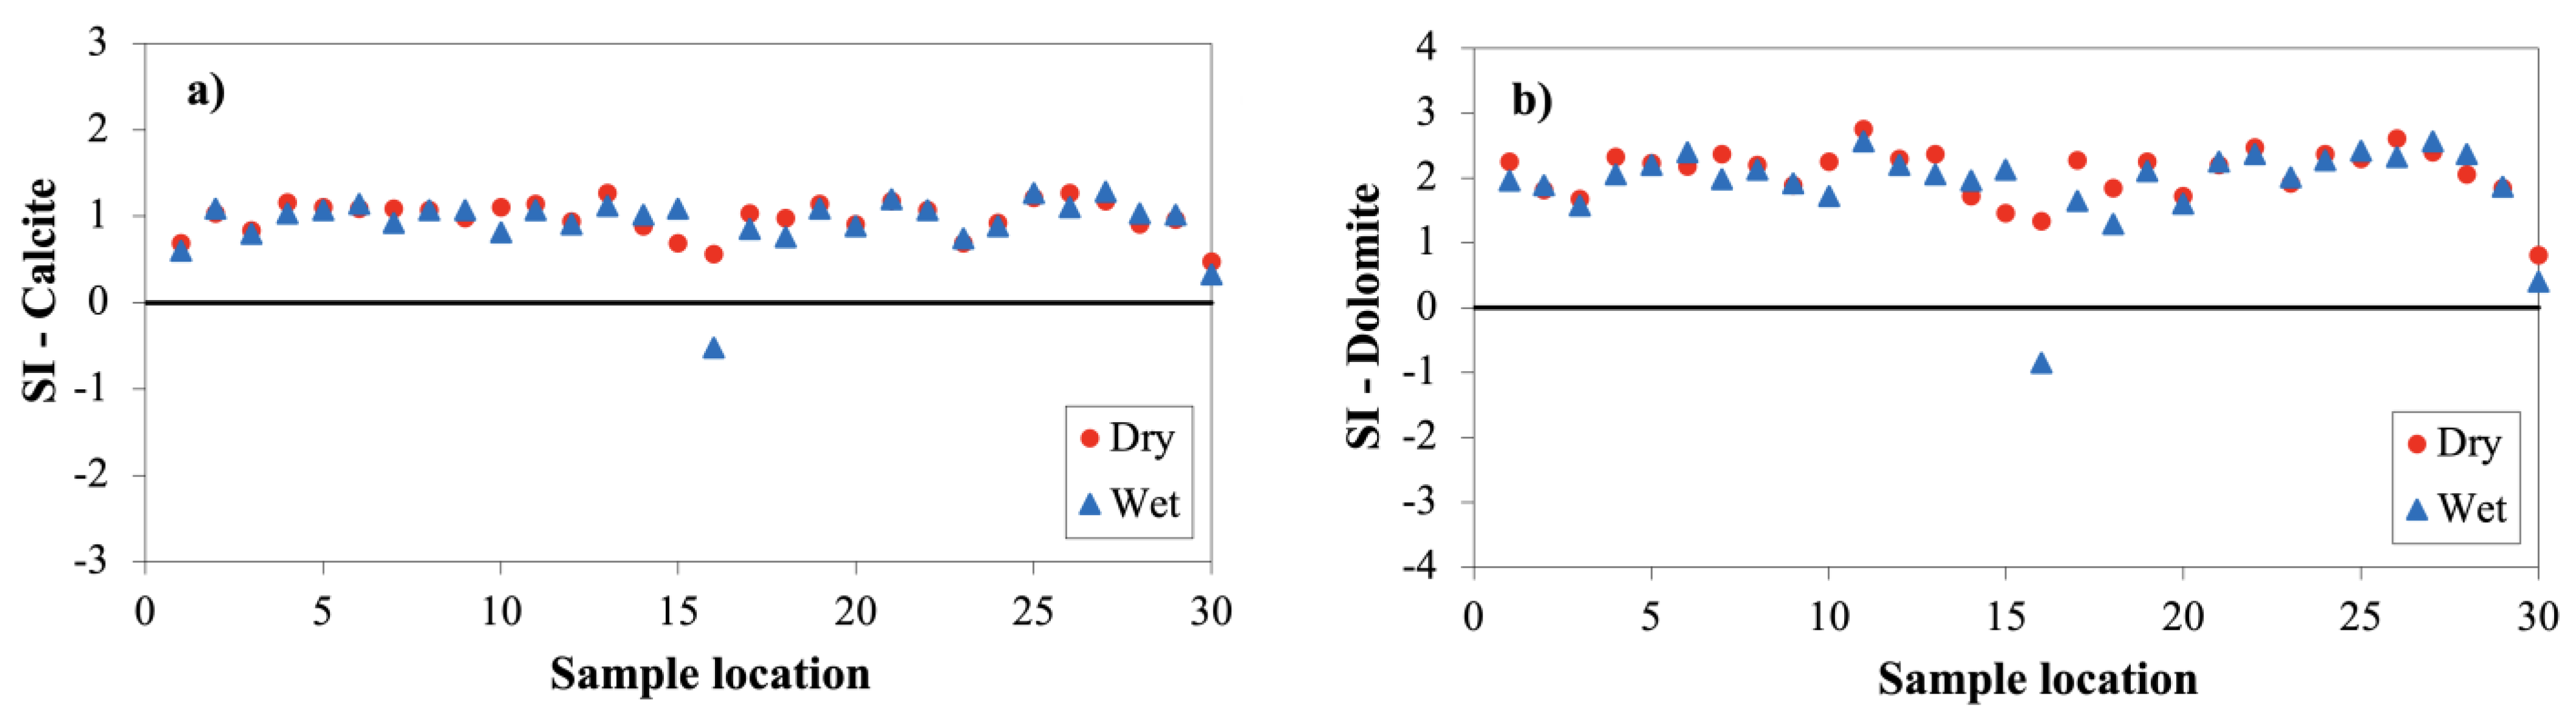
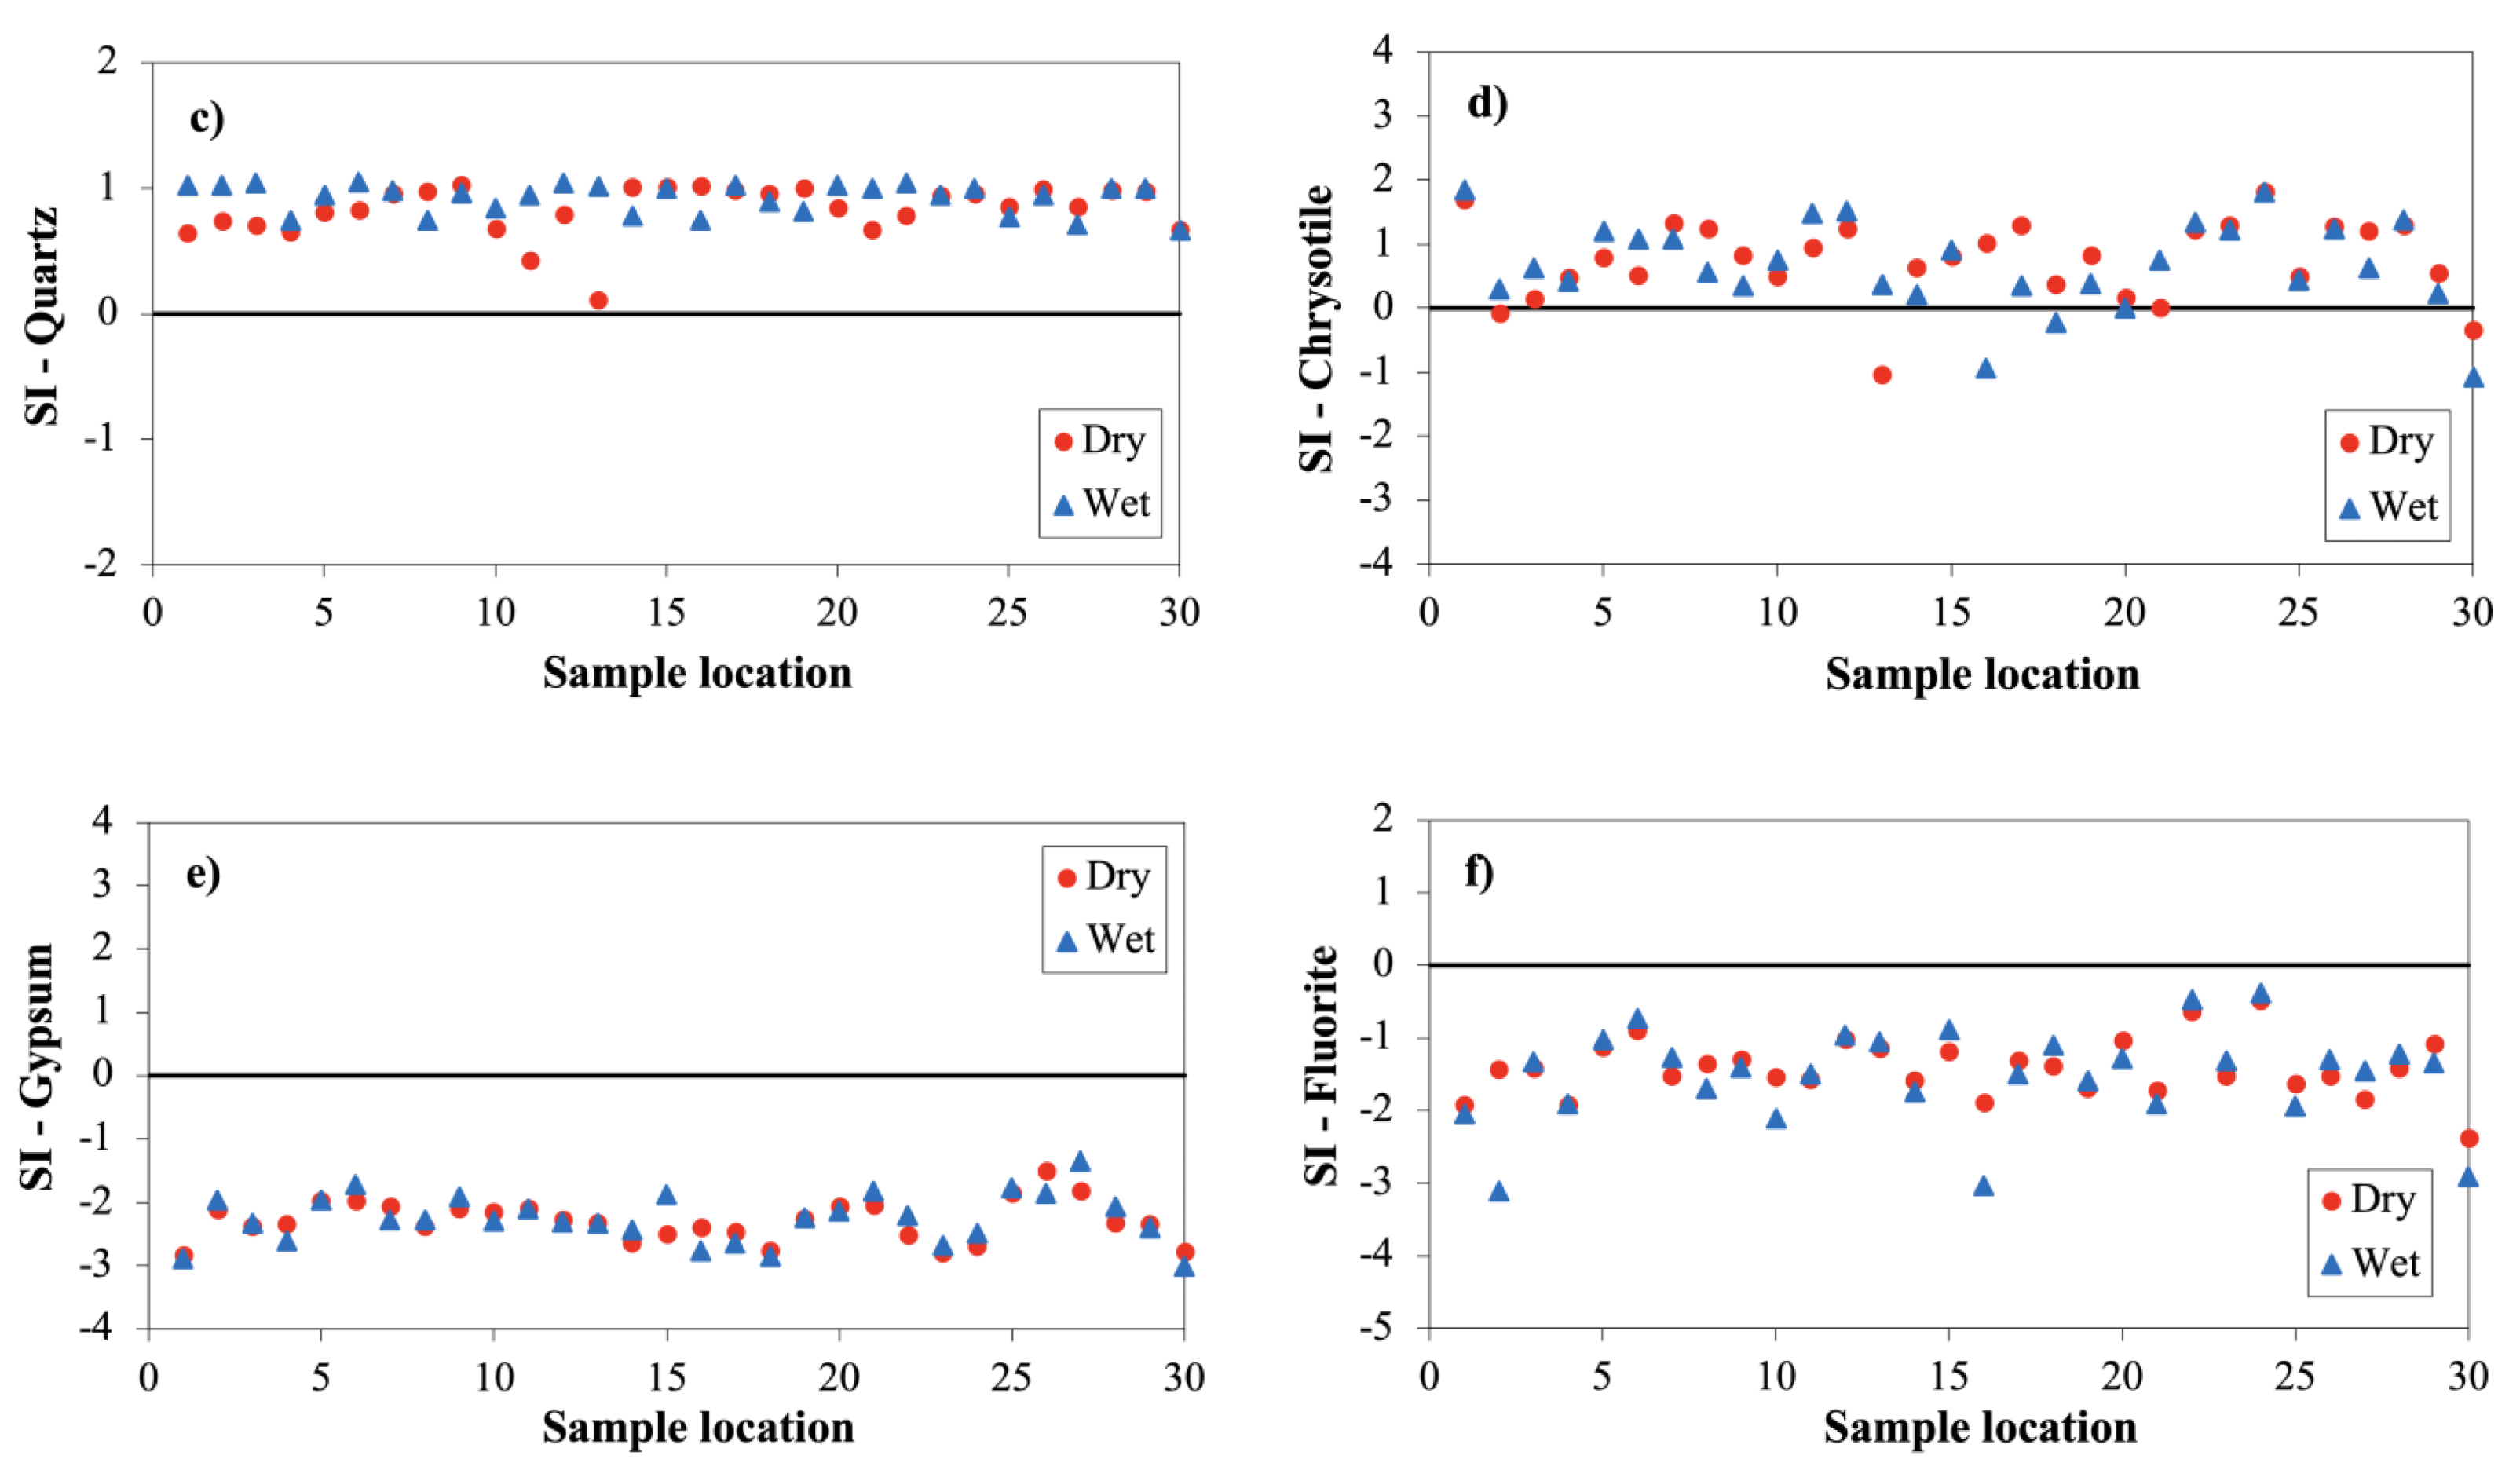
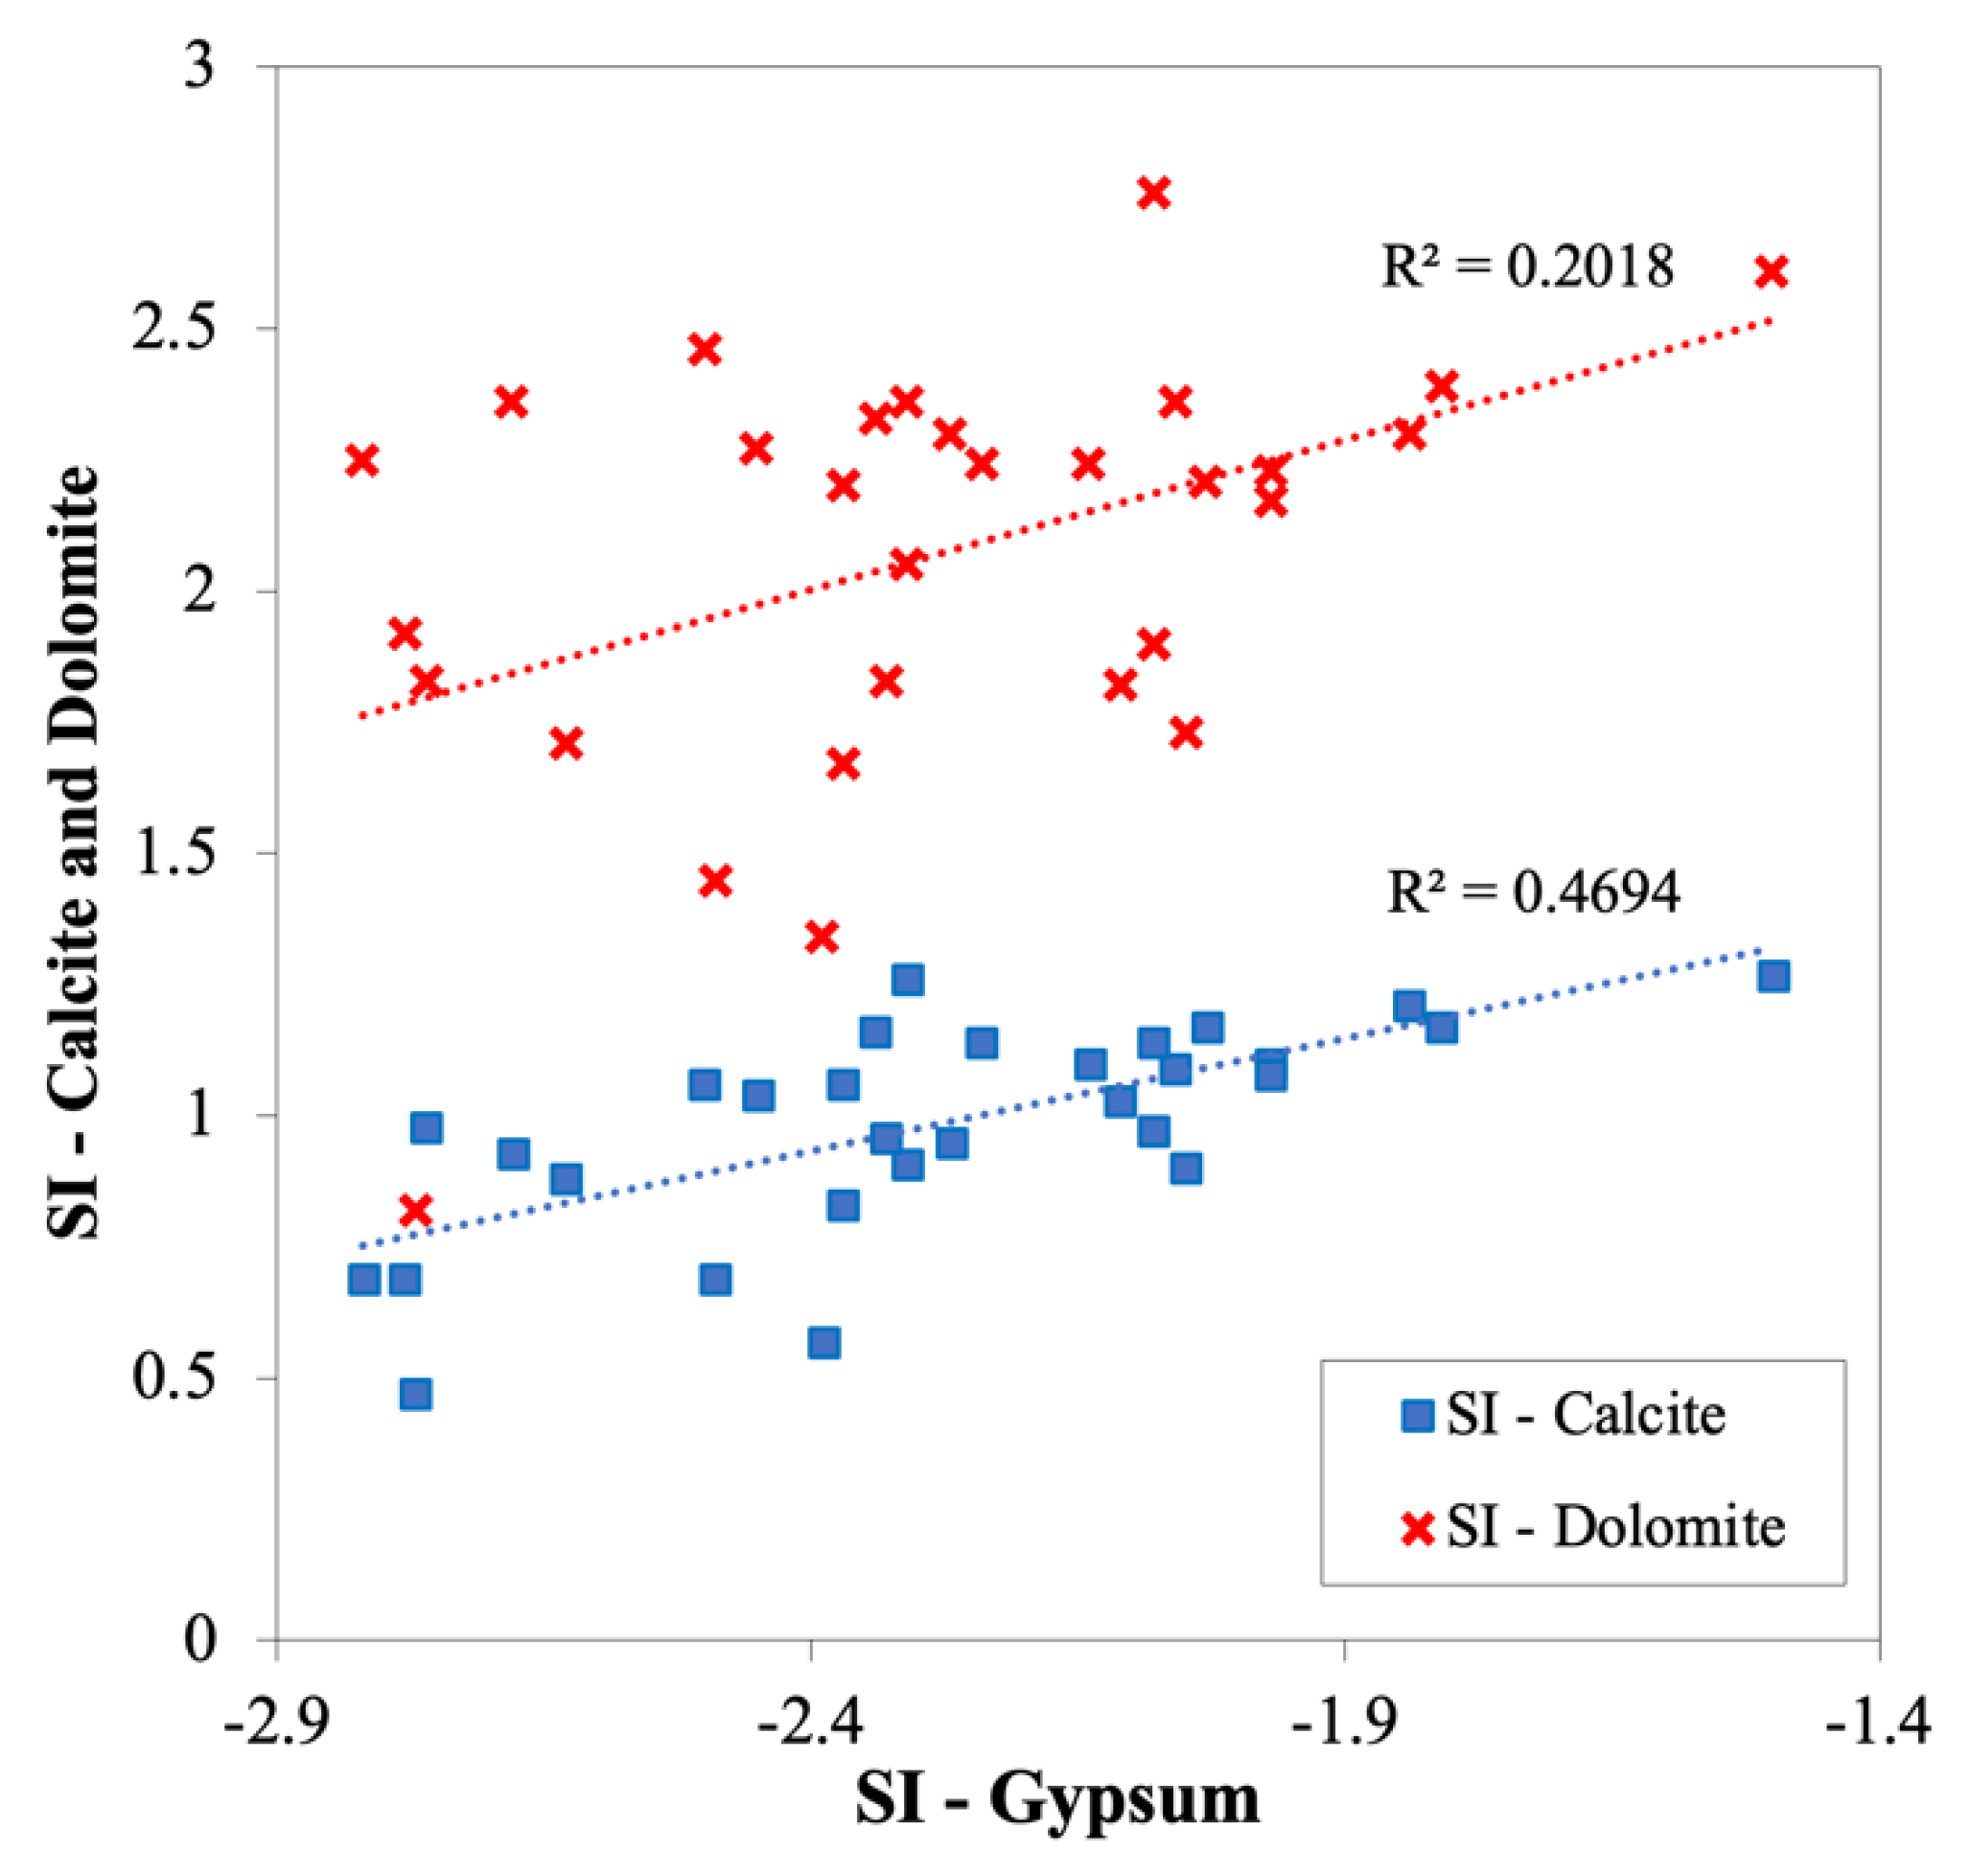
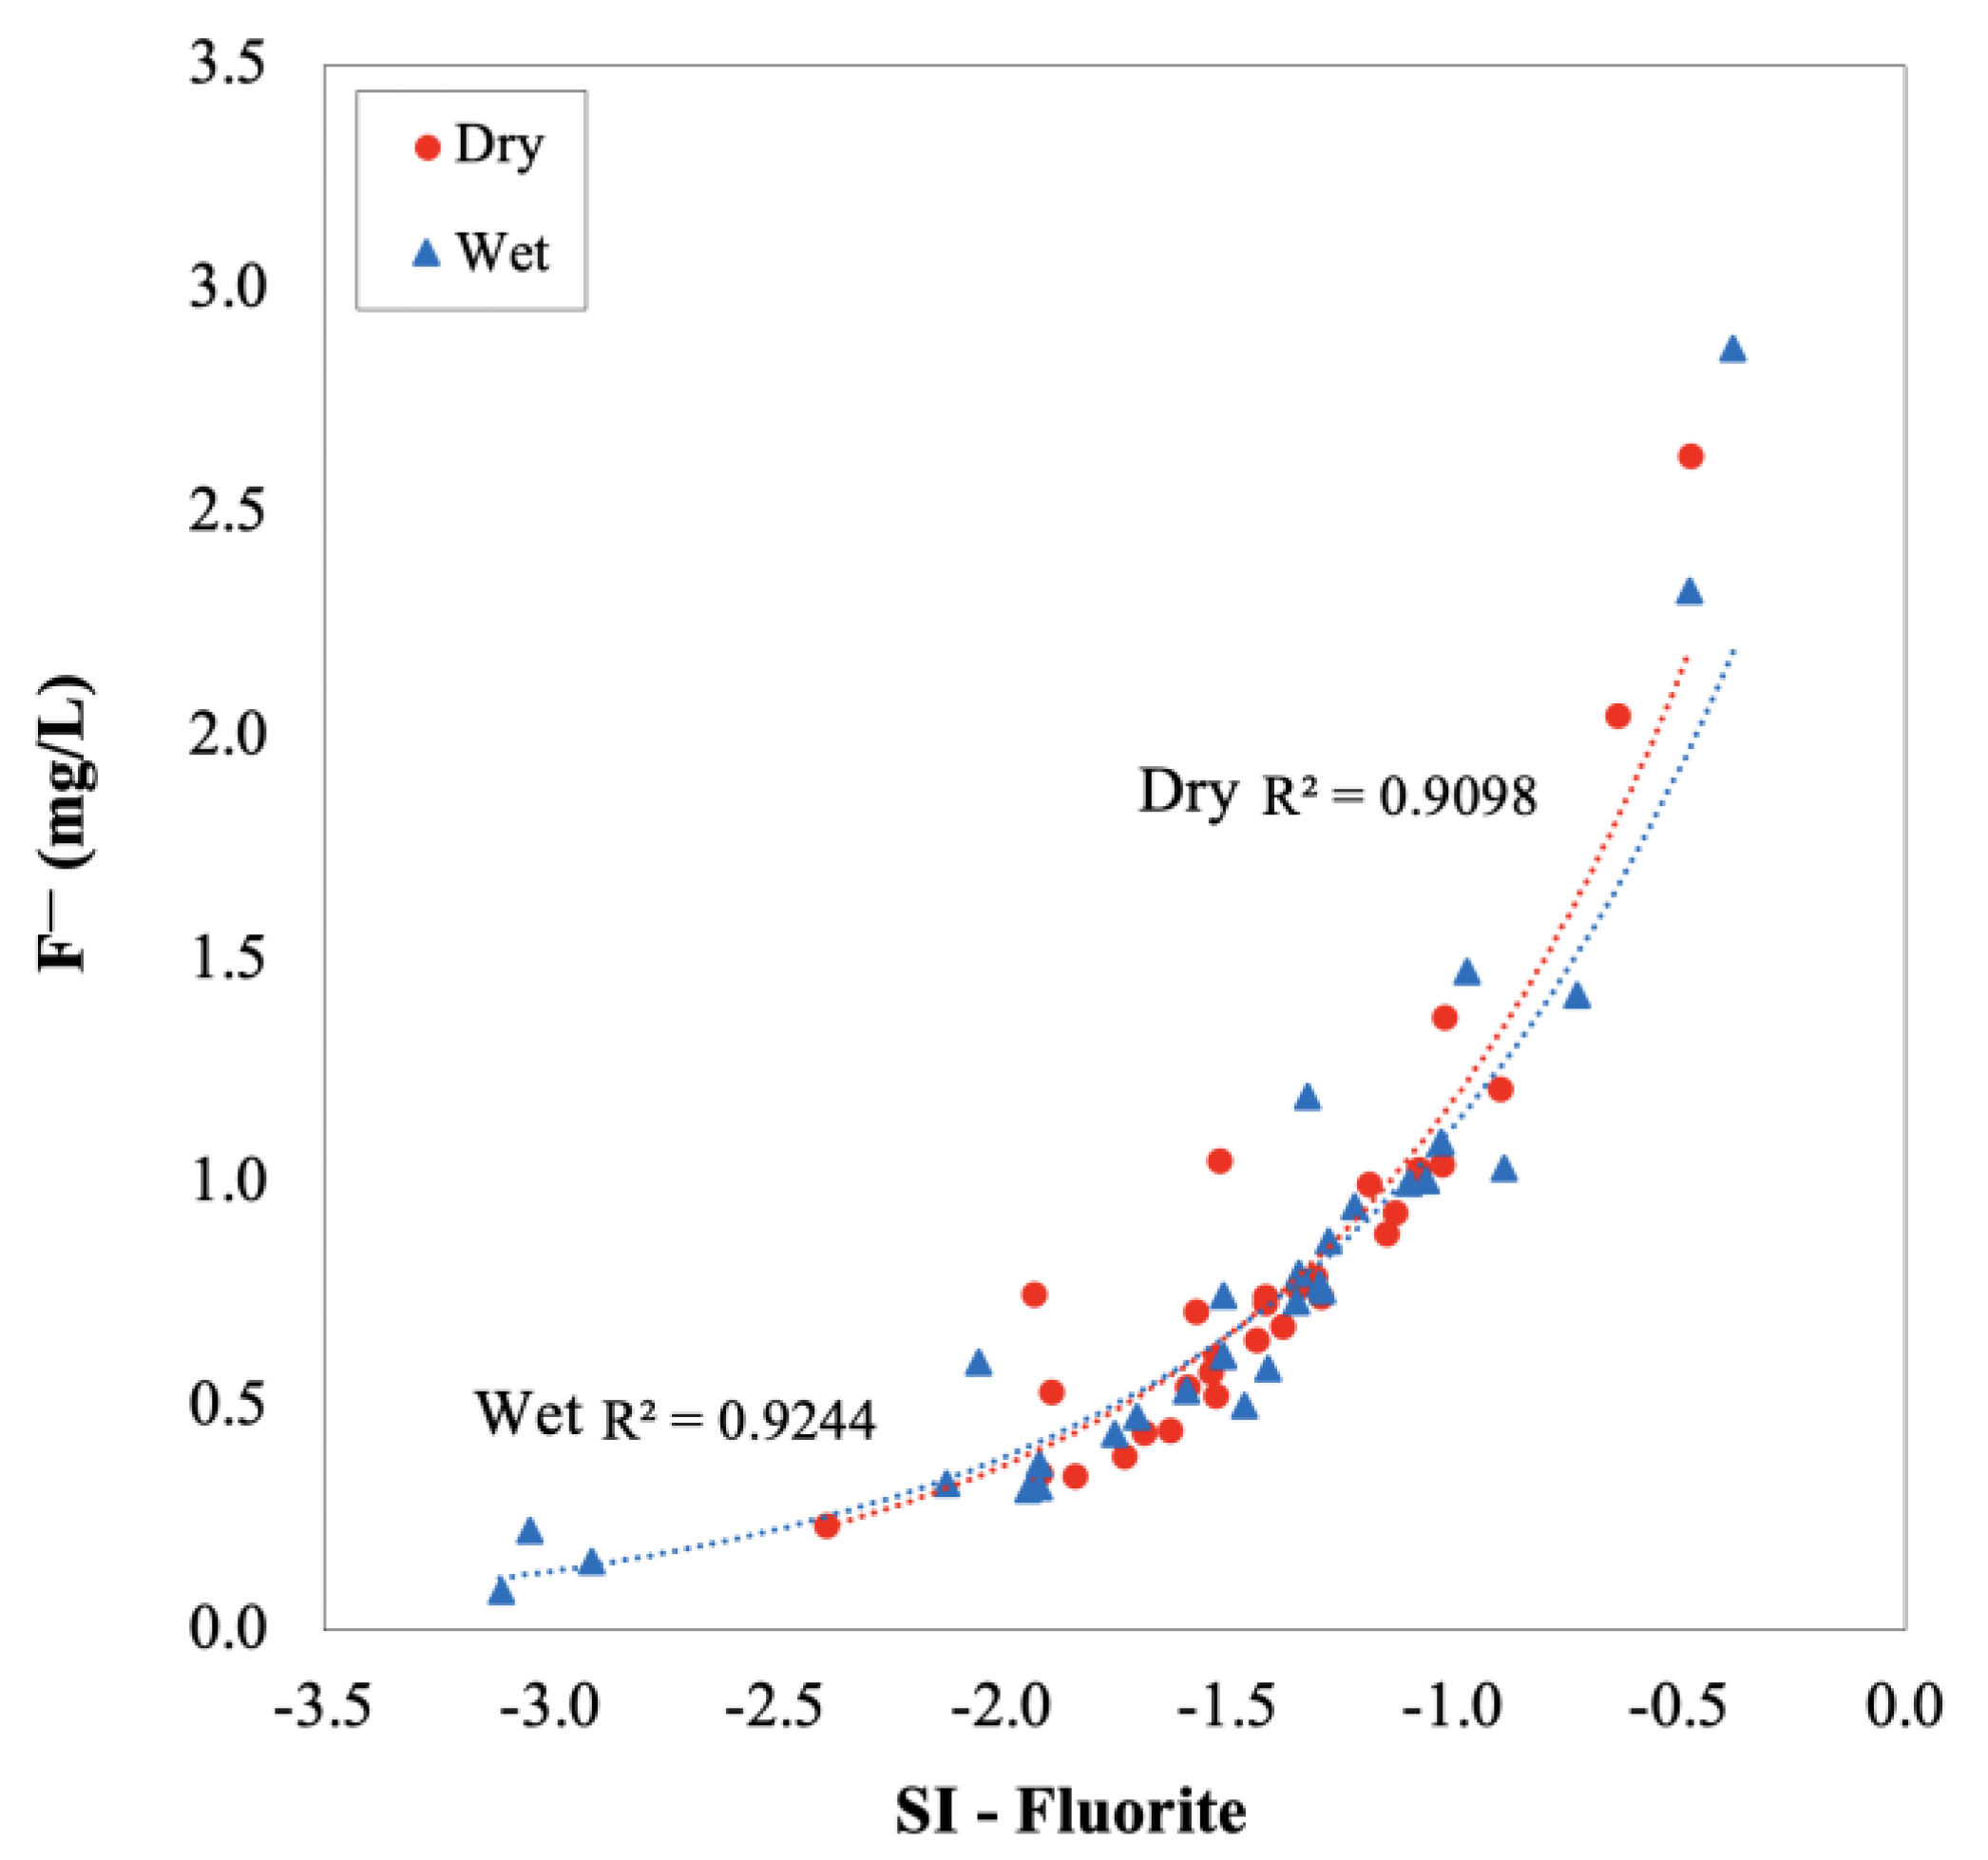
3.2.5. Saturation Index (SI)

The SI values of the potential minerals in the groundwater samples were calculated with PHREEQC3.2.0-9820 speciation code [37]. The input data for the model were the concentrations of all chemical parameters, including dissolved silica (SiO2) from Table S1. The list of potential mineral phases enumerated by the model and the respective saturation indices are shown in Table 3. These minerals included a multitude of carbonates (calcite, aragonite and dolomite), silicates (quartz, chalcedony, chrysotile and sepiolite), evaporites (gypsum, anhydrite and halite) and fluorite. Evaporites referred to water-soluble mineral sediments formed by evaporation.
All groundwater samples, except one from the wet season (from site no. 16), were supersaturated with respect to carbonate minerals (0.79 < SIAragonite ≈ SICalcite < SIDolomite < 2.07) as illustrated in Figure 6a,b. The negative SI values at site no. 16 in the wet season can be ascribed to the relatively low Ca2+ and Mg2+ levels (12 mg/L and 8 mg/L respectively) reported in the groundwater. The SI values for the carbonate minerals generally remained conservative irrespective of the seasons. Intensive evaporation caused by tropical climates would be the key reason for rapid dissolution and precipitation of these minerals [69]. Silicate minerals, on the other hand, are typically maintained in near-equilibrium to over-saturation (0.41 < SIChalcedony < SIChrysotile < SISepiolite, SIQuartz < 0.93) during both seasons (Figure 6c,d). Moreover, the SI values for magnesium-silicates, such as chrysotile and sepiolite appear to fluctuate more among different groundwater sources, compared to quartz minerals (Figure 6c,d). The saturation indices of carbonate and silicate minerals suggested that they possess longer transit times in groundwater, and hence tend to dissolve more minerals to achieve equilibrium [72].
Evaporites, contrary to carbonates and silicates, are under-saturated (−2.25 > SIGypsum ≈ SIAnhydrite > SIHalite > −6.84) regardless of the seasons (Figure 6e). Moreover, their state of equilibrium is resistant to seasonal variations (Table 3). Although the negative SI values implied further dissociation of evaporites, minerals with extremely low SI, such as halite (dry SIHalite −6.75; wet SIHalite −6.84) may not be readily available in the recharge zone of the aquifer, or may not have sufficient time to interact with groundwater to influence its chemical composition [72]. The literature reported that the addition of Ca2+ from gypsum dissolution may lead to further precipitation and subsequent supersaturation of calcite and dolomite [57,63]. Figure 4c implied that gypsum would be a negligible source of Ca2+ in groundwater sources in the study area. This is further evident with the weak correlations observed between the saturation indices of gypsum and calcite, and gypsum and dolomite in Figure 7.
The chemical equilibrium of fluorite indicated similar patterns as evaporites. All groundwater samples were undersaturated with respect to fluorite (Figure 6f) yet were closer to equilibrium compared to evaporites (Dry SIFluorite −1.42; Wet SIFluorite −1.52). The lithology of the study areas may not readily comprise fluorite deposits, but local granitic gneiss, biotite gneiss, hornblende-biotite gneiss, and carbonatites are known to introduce dissolute fluorite into these groundwater systems [73]. The precipitation of calcite and dolomite, and alkaline pH levels are known to favor the dissolution of fluorite [67,74]. In the present case, the groundwater indicated more alkaline pH levels in the wet season (mean pH = 7.3) compared to the dry season (mean pH = 6.6); as a result, slightly stronger correlations were observed between fluorite dissolution and F ion concentrations in the wet season (R2 = 0.9244) than in the dry season (R2 = 0.9098) (Figure 8).

3.3. Possible Implications for CKDu

The concentrations of major chemical parameters (EC, total alkalinity, total hardness, and major ions) in groundwater reported in the present study are comparable with or even higher than those reported from the CKDu-endemic areas in past research (see Table S2). Moreover, the concentrations are notably higher than the levels reported from the wet zone, where CKDu is non-prevalent. This inferred that the wells associated with CKDu have elevated ion concentrations (i.e., high ionicity) and hardness compared to those in the non-prevalent areas, possibly due to the increased interactions between groundwater and aquifer minerals, as explained in Section 3.1. Furthermore, groundwater in the wet zone is characterized by Na-K-bicarbonate dominant ion combinations, mostly attributed to anthropogenic causes [14]; whereas it is Ca-Mg-bicarbonate type owing to geochemical processes in the CKDu-endemic areas of the dry zone.
These comparisons portrayed the distinctive geochemical character of groundwater in the CKDu-affected areas that gives rise to ion concentrations and hardness levels that are undesirable for drinking. Plenty of past research suspected that dietary exposure to such groundwater over decades might have triggered the nephrotoxicity in CKDu. Wells which are recharged only by direct rain and hold water in stagnation, leading to high ion concentrations (Dehiaththakandiya: 520.2 μS/cm, Padaviya: 722.6 μS/cm, Medirigiriya: 817.6 μS/cm, Nikawewa: 1161.8 μS/cm), are noted to be associated with CKDu, whereas those recharged with surface water inputs and contained ions in a more diluted state (Dehiaththakandiya: 111.6 μS/cm, Padaviya: 448.5 μS/cm, Medirigiriya: 429.8 μS/cm, Nikawewa: 527.4 μS/cm) are not [20]. Similarly, groundwater in the wet zone where CKDu is absent is found to be rapidly recharged by frequent rainfall, and thus always contains low ion concentrations. Conversely, it takes a longer time in the dry zone due to the scarce occurrence of rainfall [75], which may be resulting in year-round high ionicity, and hardness levels, as showcased in the present study. Therefore, it is evident that rainfall imposes a significant impact on the unique geochemistry of groundwater in the CKDu-endemic areas of Sri Lanka. It would be interesting to analyze the trends of groundwater quality along with the occurrence of CKDu over the seasons to elucidate if groundwater plays any role in CKDu.
On a special note, the presence of asbestos-containing minerals like chrysotile [Mg3Si2O5(OH)4] in groundwater in the CKDu-endemic areas should be deeply investigated due to their hazardous nature. Chrysotile-asbestos is a toxic geogenic contaminant of human health concern [76]. Although the inhalation of chrysotile-asbestos is known to causes detrimental health effects, the implications of dietary exposure remain largely unknown due to the lack of conclusive scientific evidence [77]. The presence of asbestos minerals in drinking water has never been a concern with regards to CKDu in Sri Lanka, and hence it would be an engrossing topic for consideration in future research.

4. Conclusions

A comprehensive geochemical analysis of groundwater in the CKDu-endemic areas of Sri Lanka was performed with the use of numerous geochemical tools. This groundwater can be commonly categorized as Ca-Mg-HCO3 type, with high ionicity and hardness. Overall, it is inappropriate for direct potable uses due to the unsafe levels of alkalinity, TDS, hardness, and magnesium.
The geochemistry of this groundwater is primarily governed by the chemical weathering of rocks, cation exchange and evaporation under the intensive semi-arid climate exists in the CKDu region. Additionally, the geochemistry was more impacted by dissolution/precipitation of carbonates and silicates compared to evaporites. Abundance of Ca2+, Mg2+ and HCO3 can be attributed, primarily to the weathering of carbonate and silicate minerals. The origin of Na+ is mainly due to silicate weathering, followed by direct cation exchange. Reverse cation exchange may cause a reduction of Na+ and subsequent increment of Ca2+ and Mg2+ in certain groundwaters (25–36%). The origin of Cl can be ascribed to anthropogenic sources, like sewage, whereas the main source of F would be dissolution of fluoride-bearing minerals.
As far as the present findings are concerned, the geochemical characteristics of groundwater in CKDu-endemic areas are seldom impacted by the seasonal variations in rainfall. This leads to persistent high-ionicity and hardness, making the groundwater undesirable for drinking. The seasonal trends between this unique geochemical behavior of regolith aquifers and the incidence of CKDu and the occurrence of potentially hazardous chrysotile in groundwater should be deeply investigated as part of the efforts to elucidate the cause of CKDu in Sri Lanka.

Supplementary Materials

The following are available online at https://www.mdpi.com/article/10.3390/w13233356/s1, Figure S1: Geological map of the study area (Anuradhapura District) [78]; Figure S2: Percentage of wells with (a) E. coli and (b) Total coliform; Table S1: Groundwater quality data from the dry and wet seasons of the CKDu-endemic areas; Table S2: Comparison of the groundwater quality data from the present study with those from previous research [11,14,47,51,79,80].

Author Contributions

S.I.: methodology, software, writing—original draft preparation, formal analysis, investigation, validation, data curation, visualization. K.O.: conceptualization, resources, supervision, investigation, writing—review & editing, project administration, funding acquisition. S.T.: conceptualization, supervision, writing—review & editing. All authors have read and agreed to the published version of the manuscript.

Funding

This research was funded by Japan Society for the Promotion of Science (Grants-in-Aid for Scientific Research 17H03329) and the University of Tokyo GAP Fund 2018.

Institutional Review Board Statement

Not applicable.

Informed Consent Statement

Not applicable.

Data Availability Statement

Not applicable.

Acknowledgments

We would like to extend our sincere gratitude to Jagath Manatunge from University of Moratuwa, Sri Lanka, and the Assistant General Manager and the staff of Rural Water Supply Division, NWSDB, Anuradhapura, Sri Lanka, for the enormous support extended on our field work.

Conflicts of Interest

The authors declare no conflict of interest.

References

  1. Margat, J.; van der Gun, J. Groundwater around the World; CRC Press: Boca Raton, FL, USA, 2013. [Google Scholar] [CrossRef]
  2. Schmoll, O.; Howard, G.; Chilton, G.; Chorus, I. (Eds.) Protecting Groundwater for Health: Managing the Quality of Drinking-Water Sources; World Health Organization: Geneva, Switzerland, 2013; Volumn 12. [Google Scholar] [CrossRef]
  3. Wada, Y.; van Beek, L.P.H.; van Kempen, C.M.; Reckman, J.W.T.; Vasak, S.; Bierkens, M.F.P. Global depletion of groundwater resources. Geophys. Res. Lett. 2021, 37. [Google Scholar] [CrossRef] [Green Version]
  4. Elango, L.; Kannan, R. Rock-water interaction and its control on chemical composition of groundwater. Dev. Environ. Sci. 2007, 5, 229–243. [Google Scholar] [CrossRef]
  5. Maghrebi, M.; Noori, R.; Partani, S.; Araghi, A.; Barati, R.; Farnoush, H.; Haghighi, A.T. Iran’s groundwater hydrochemistry. Earth Space Sci. 2021, 8, e2021EA001793. [Google Scholar] [CrossRef]
  6. Meenakshi, G.V.K.; Kavita, R.; Malik, A. Groundwater quality in some villages of Haryana, India: Focus on fluoride and fluorosis. J. Hazard. Mater. 2004, 106, 85–97. [Google Scholar] [CrossRef]
  7. Smith, A.H.; Lingas, E.O.; Rahman, M. Contamination of drinking-water by arsenic in Bangladesh: A public health emergency. Bull. World Health Organ. 2000, 78, 1093–1103. [Google Scholar] [CrossRef] [PubMed]
  8. Gifford, F.J.; Gifford, R.M.; Eddleston, M.; Dhaun, N. Endemic nephropathy around the world. Kidney Int. Rep. 2017, 2, 282–292. [Google Scholar] [CrossRef] [Green Version]
  9. Weaver, V.M.; Fadrowski, J.J.; Jaar, B.G. Global dimensions of chronic kidney disease of unknown etiology (CKDu): A modern era environmental and/or occupational nephropathy? BMC Nephrol. 2015, 16, 145. [Google Scholar] [CrossRef] [Green Version]
  10. Noble, A.; Amerasinghe, P.; Manthrithilake, H.; Arasalingam, S. Review of literature on chronic kidney disease of unknown etiology (CKDu) in Sri Lanka. In IWMI Working Paper—158; International Water Management Institute (IWMI): Colombo, Sri Lanka, 2014; 41p. [Google Scholar] [CrossRef]
  11. Wickramarathna, S.; Balasooriya, S.; Diyabalanage, S.; Chandrajith, R. Tracing environmental aetiological factors of chronic kidney diseases in the dry zone of Sri Lanka—A hydrogeochemical and isotope approach. J. Trace Elements Med. Biol. 2017, 44, 298–306. [Google Scholar] [CrossRef]
  12. Chandrajith, R.; Nanayakkara, S.; Itai, K.; Aturaliya, T.N.C.; Dissanayake, C.B.; Abeysekera, T.; Harada, K.; Watanabe, T.; Koizumi, A. Chronic kidney diseases of uncertain etiology (CKDue) in Sri Lanka: Geographic distribution and environmental implications. Environ. Geochem. Health 2010, 33, 267–278. [Google Scholar] [CrossRef]
  13. Imbulana, S.; Oguma, K. Groundwater as a potential cause of Chronic Kidney Disease of unknown etiology (CKDu) in Sri Lanka: A review. J. Water Health 2021, 19, 393–410. [Google Scholar] [CrossRef]
  14. Rubasinghe, R.; Gunatilake, S.K.; Chandrajith, R. Geochemical characteristics of groundwater in different climatic zones of Sri Lanka. Environ. Earth Sci. 2015, 74, 3067–3076. [Google Scholar] [CrossRef]
  15. Imbulana, S.; Oguma, K.; Takizawa, S. Evaluation of groundwater quality and reverse osmosis water treatment plants in the endemic areas of Chronic Kidney Disease of Unknown Etiology (CKDu) in Sri Lanka. Sci. Total Environ. 2020, 745, 140716. [Google Scholar] [CrossRef] [PubMed]
  16. Department of Census and Statistics Sri Lanka. Mid-year Population Estimates by District & Sex 2014–2019. 2019. Available online: http://www.statistics.gov.lk/pophousat/vitalstatistics/midyearpopulation/mid-year%20population%20by%20district.pdf (accessed on 20 October 2021).
  17. Ranasinghe, A.V.; Kumara, G.W.G.P.; Karunarathna, R.H.; De Silva, A.P.; Sachintani, K.G.D.; Gunawardena, J.M.C.N.; Kumari, S.K.C.R.; Sarjana, M.S.F.; Chandraguptha, J.S.; De Silva, M.V.C. The incidence, prevalence and trends of chronic kidney disease and chronic kidney disease of uncertain aetiology (CKDu) in the North Central Province of Sri Lanka: An analysis of 30,566 patients. BMC Nephrol. 2019, 20, 338. [Google Scholar] [CrossRef] [PubMed]
  18. de Costa, W.A.J.M. Climate change in Sri Lanka: Myth or reality? Evidence from long-term meteorological data. J. Natl. Sci. Found. Sri Lanka 2008, 36, 63. [Google Scholar] [CrossRef] [Green Version]
  19. Athula, S.; Kanchana, W. Commons vs. Commons: Managing Scarce Water Resources in Dry Zone Village Tank Systems in Sri Lanka; EEPSEA: Los Baños, Philippines, 2011. [Google Scholar] [CrossRef]
  20. Edirisinghe, E.A.N.V.; Manthrithilake, H.; Pitawala, H.M.T.G.A.; Dharmagunawardhane, H.A.; Wijayawardane, R.L. Geochemical and isotopic evidences from groundwater and surface water for understanding of natural contamination in chronic kidney disease of unknown etiology (CKDu) endemic zones in Sri Lanka. Isot. Environ. Health Stud. 2017, 54, 244–261. [Google Scholar] [CrossRef]
  21. Maduranga, W.L.S.; Lewangamage, C.S. Development of wind loading maps for Sri Lanka for use with different wind loading codes. Eng. J. Inst. Eng. Sri Lanka 2018, 51, 47. [Google Scholar] [CrossRef] [Green Version]
  22. Elliott, D.; Schwartz, M.; Scott, G.; Haymes, S.; Heimiller, D.; George, R. Wind Energy Resource Atlas of Sri Lanka and the Maldives; National Renewable Energy Lab.(NREL): Golden, CO, USA, 2003. [CrossRef] [Green Version]
  23. Gilliland, K.; Simpson, I.; Adderley, W.; Burbidge, C.; Cresswell, A.; Sanderson, D.; Coningham, R.; Manuel, M.; Strickland, K.; Gunawardhana, P.; et al. The dry tank: Development and disuse of water management infrastructure in the Anuradhapura hinterland, Sri Lanka. J. Archaeol. Sci. 2013, 40, 1012–1028. [Google Scholar] [CrossRef] [Green Version]
  24. Cooray, P.G. The precambrian of Sri Lanka: A historical review. Precambrian Res. 1994, 66, 3–18. [Google Scholar] [CrossRef]
  25. Irrigation Department Sri Lanka. Soil Map of Sri-Lanka—ESDAC—European Commission. 1988. Available online: https://esdac.jrc.ec.europa.eu/content/soil-map-sri-lanka (accessed on 20 October 2021).
  26. Kodituwakku, K.A.D.; Weerasinghe, H.A.S.; Wijayawardhana, L.M.J.R. Report on the Availability of Lands for Sugarcane Cultivation in Sri Lanka Sugarcane Research Institute. 2010. Available online: http://sugarres.lk/wp-content/uploads/2020/05/Report-on-Land-Availability-for-Sugarcane-Cultivation.pdf (accessed on 21 November 2021).
  27. Pathmarajah, S. Use of Groundwater for Agriculture in Sri Lanka. 2002. Available online: https://www.researchgate.net/publication/237022438_Use_of_groundwater_for_agriculture_in_Sri_Lanka (accessed on 20 October 2021).
  28. Panabokke, C.R.; Ariyaratne, B.R.; Seneviratne, A.; Wijekoon, D.; Molle, F. Characterization and monitoring of the regolith aquifer within four selected cascades (sub-watersheds) of the Malala Oya Basin [Sri Lanka]. In IWMI Working Papers—122; International Water Management Institute (IWMI): Colombo, Sri Lanka, 2007; Available online: http://www.iwmi.cgiar.org/Publications/Working_Papers/working/WOR122.pdf (accessed on 20 October 2021).
  29. Jackson, P.E. Ion chromatography in environmental analysis. Encycl. Anal. Chem. 2000, 2779–2801. [Google Scholar] [CrossRef]
  30. Eaton, A.D.; Clesceri, L.S.; Rice, E.W.; Greenberg, A.E.; Franson, M.A.H.; American Public Health Association (Eds.) Standard Methods for the Examination of Water & Wastewater, 21st ed.; American Public Health Association: Washington, DC, USA, 2005. [Google Scholar]
  31. Michalski, R. Applications of ion chromatography for the determination of inorganic cations. Crit. Rev. Anal. Chem. 2009, 39, 230–250. [Google Scholar] [CrossRef]
  32. Deutsch, W.J. Groundwater Geochemistry: Fundamentals and Applications to Contamination, 1st ed.; CRC Press: Boca Raton, FL, USA, 2020. [Google Scholar] [CrossRef]
  33. Weiner, E.R. Applications of Environmental Aquatic Chemistry—Google Books; Taylor & Francis: Oxfordshire, UK, 2013; Available online: https://www.google.co.jp/books/edition/Applications_of_Environmental_Aquatic_Ch/4ZlqSed6IQwC?hl=en&gbpv=1&dq=calculating+hardness+of+groundwater&pg=PA93&printsec=frontcover (accessed on 19 November 2021).
  34. R Core Development Team. R: A Language and Environment for Statistical Computing, 3.2.1. 2015. Available online: http://www.r-project.org/ (accessed on 20 October 2021).
  35. Piper, A.M. A graphic procedure in the geochemical interpretation of water-analyses. Eos Trans. Am. Geophys. Union 1944, 25, 914–928. [Google Scholar] [CrossRef]
  36. Gibbs, R.J. Mechanisms Controlling World Water Chemistry. Science 1970, 170, 1088–1090. [Google Scholar] [CrossRef] [PubMed]
  37. Parkhurst, D.; Appelo, C. Description of Input and Examples for PHREEQC Version 3-A Computer Program for Speciation, Batch-Reaction, One-Dimensional Transport, and Inverse Geochemical Calculations. Available online: http://www.hydrochemistry.eu (accessed on 8 May 2021).
  38. Garrels, R.M.; Mackenzie, F.T. Origin of the Chemical Compositions of Some Springs and Lakes; ACS Publications: Washington, DC, USA, 1967; pp. 222–242. [Google Scholar] [CrossRef]
  39. Lloyd, J.W.; Heathcote, J.A. Natural Inorganic Hydrochemistry in Relation to Ground Water; Oxford University Press: New York, NY, USA, 1985. [Google Scholar]
  40. Sri Lanka Standards Institute. Drinking Water Standards: Sri Lanka Standards for Potable Water—SLS 614, 1983; Sri Lanka Standards Institute: Colombo, Sri Lanka, 1947; Available online: https://investsrilanka.com/wp-content/uploads/2020/11/environmental_norms.pdf (accessed on 20 October 2021).
  41. World Health Organization. Guidelines for Drinking-Water Quality, 4th ed.; World Health Organization: Geneva, Switzerland, 2011; p. 340. [Google Scholar] [CrossRef]
  42. Zhou, X.; Shen, Y.; Zhang, H.; Song, C.; Li, J.; Liu, Y. Hydrochemistry of the natural low pH groundwater in the coastal aquifers near Beihai, China. J. Ocean Univ. China 2015, 14, 475–483. [Google Scholar] [CrossRef]
  43. Hem, J.D. Study and interpretation of the chemical characteristics of natural water. In US Geological Survey Water-Supply Paper; Department of the Interior, US Geological Survey: Reston, VA, USA, 1985; Volume 2254. [Google Scholar]
  44. Jayasumana, C.; Gunatilake, S.; Senanayake, P. Glyphosate, hard water and nephrotoxic metals: Are they the culprits behind the epidemic of chronic kidney disease of unknown etiology in Sri Lanka? Int. J. Environ. Res. Public Health 2014, 11, 2125–2147. [Google Scholar] [CrossRef] [Green Version]
  45. Dharma-Wardana, M.W.C. Chronic kidney disease of unknown etiology and the effect of multiple-ion interactions. Environ. Geochem. Health 2017, 40, 705–719. [Google Scholar] [CrossRef] [Green Version]
  46. Wasana, H.M.S.; Perera, G.D.R.K.; Gunawardena, P.D.S.; Fernando, P.S.; Bandara, J. WHO water quality standards Vs Synergic effect(s) of fluoride, heavy metals and hardness in drinking water on kidney tissues. Sci. Rep. 2017, 7, srep42516. [Google Scholar] [CrossRef]
  47. Balasooriya, S.; Munasinghe, H.; Herath, A.T.; Diyabalanage, S.; Ileperuma, O.A.; Manthrithilake, H.; Daniel, C.; Amann, K.; Zwiener, C.; Barth, J.A.C.; et al. Possible links between groundwater geochemistry and chronic kidney disease of unknown etiology (CKDu): An investigation from the Ginnoruwa region in Sri Lanka. Exp. Health 2019, 12, 823–834. [Google Scholar] [CrossRef]
  48. Moore, K.B.; Ekwurzel, B.; Esser, B.K.; Hudson, G.B.; Moran, J.E. Sources of groundwater nitrate revealed using residence time and isotope methods. Appl. Geochem. 2006, 21, 1016–1029. [Google Scholar] [CrossRef] [Green Version]
  49. Ghahremanzadeh, H.; Noori, R.; Baghvand, A.; Nasrabadi, T. Evaluating the main sources of groundwater pollution in the southern Tehran aquifer using principal component factor analysis. Environ. Geochem. Health 2017, 40, 1317–1328. [Google Scholar] [CrossRef] [PubMed]
  50. Chandrajith, R.; Padmasiri, J.; Dissanayake, C.; Prematilaka, K. Spatial distribution of fluoride in groundwater of Sri Lanka. J. Natl. Sci. Found. Sri Lanka 2012, 40, 303–309. [Google Scholar] [CrossRef] [Green Version]
  51. Chandrajith, R.; Dissanayake, C.; Ariyarathna, T.; Herath, H.; Padmasiri, J. Dose-dependent Na and Ca in fluoride-rich drinking water—Another major cause of chronic renal failure in tropical arid regions. Sci. Total Environ. 2011, 409, 671–675. [Google Scholar] [CrossRef] [PubMed]
  52. Dissanayake, C.B. Water quality and dental health in the Dry Zone of Sri Lanka. Geol. Soc. London Spéc. Publ. 1996, 113, 131–140. [Google Scholar] [CrossRef]
  53. Jha, M.K.; Shekhar, A.; Jenifer, M.A. Assessing groundwater quality for drinking water supply using hybrid fuzzy-GIS-based water quality index. Water Res. 2020, 179, 115867. [Google Scholar] [CrossRef]
  54. Naseh, M.R.V.; Noori, R.; Berndtsson, R.; Adamowski, J.; Sadatipour, E. Groundwater pollution sources apportionment in the Ghaen Plain, Iran. Int. J. Environ. Res. Public Health 2018, 15, 172. [Google Scholar] [CrossRef] [Green Version]
  55. Noori, R.; Maghrebi, M.; Mirchi, A.; Tang, Q.; Bhattarai, R.; Sadegh, M.; Noury, M.; Haghighi, A.T.; Kløve, B.; Madani, K. Anthropogenic depletion of Iran’s aquifers. Proc. Natl. Acad. Sci. USA 2021, 118, e2024221118. [Google Scholar] [CrossRef] [PubMed]
  56. Rao, N.S. Seasonal variation of groundwater quality in a part of Guntur District, Andhra Pradesh, India. Environ. Earth Sci. 2005, 49, 413–429. [Google Scholar] [CrossRef]
  57. Zhang, B.; Zhao, D.; Zhou, P.; Qu, S.; Liao, F.; Wang, G. Hydrochemical characteristics of groundwater and dominant water—Rock interactions in the Delingha. Water 2020, 12, 836. [Google Scholar] [CrossRef] [Green Version]
  58. Dissanayake, C.B.; Senaratne, A.; Weerasooriya, S.V.R. Geochemistry of well water and cardiovascular diseases in Sri Lanka. Int. J. Environ. Stud. 1982, 19, 195–203. [Google Scholar] [CrossRef]
  59. Dissanayake, C.B.; Chandrajith, R. The hydrogeological and geochemical characteristics of groundwater of Sri Lanka. In Groundwater of South Asia; Springer: Singapore, 2018; pp. 405–428. [Google Scholar] [CrossRef]
  60. McDonough, L.K.; Meredith, K.T.; Nikagolla, C.; Banati, R.B. The influence of water–rock interactions on household well water in an area of high prevalence chronic kidney disease of unknown aetiology (CKDu). NPJ Clean Water 2021, 4, 2. [Google Scholar] [CrossRef]
  61. Walraevens, K.; Bakundukize, C.; Mtoni, Y.E.; Van Camp, M. Understanding the hydrogeochemical evolution of groundwater in Precambrian basement aquifers: A case study of Bugesera region in Burundi. J. Geochem. Explor. 2018, 188, 24–42. [Google Scholar] [CrossRef]
  62. Gao, Z.; Liu, J.; Feng, J.; Wang, M.; Wu, G. Hydrogeochemical characteristics and the suitability of groundwater in the alluvial-diluvial plain of Southwest Shandong Province, China. Water 2019, 11, 1577. [Google Scholar] [CrossRef] [Green Version]
  63. Luo, W.; Gao, X.; Zhang, X. Geochemical processes controlling the groundwater chemistry and fluoride contamination in the Yuncheng Basin, China—An area with complex hydrogeochemical conditions. PLoS ONE 2018, 13, e0199082. [Google Scholar] [CrossRef] [PubMed]
  64. Chenini, I.; Farhat, B.; Ben Mammou, A. Identification of major sources controlling groundwater chemistry from a multilayered aquifer system. Chem. Speciat. Bioavailab. 2010, 22, 183–189. [Google Scholar] [CrossRef]
  65. Zaidi, F.K.; Nazzal, Y.; Jafri, M.K.; Naeem, M.; Ahmed, I. Reverse ion exchange as a major process controlling the groundwater chemistry in an arid environment: A case study from northwestern Saudi Arabia. Environ. Monit. Assess. 2015, 187, 1–18. [Google Scholar] [CrossRef]
  66. Kumar, S.K.; Rammohan, V.; Sahayam, J.D.; Jeevanandam, M. Assessment of groundwater quality and hydrogeochemistry of Manimuktha River basin, Tamil Nadu, India. Environ. Monit. Assess. 2008, 159, 341–351. [Google Scholar] [CrossRef] [PubMed]
  67. Wu, C.; Wu, X.; Qian, C.; Zhu, G. Hydrogeochemistry and groundwater quality assessment of high fluoride levels in the Yanchi endorheic region, northwest China. Appl. Geochem. 2018, 98, 404–417. [Google Scholar] [CrossRef]
  68. Srinivasamoorthy, K.; Chidambaram, S.; Prasanna, M.V.; Vasanthavihar, M.; Peter, J.; Anandhan, P. Identification of major sources controlling groundwater chemistry from a hard rock terrain—A case study from Mettur taluk, Salem district, Tamil Nadu, India. J. Earth Syst. Sci. 2008, 117, 49–58. [Google Scholar] [CrossRef] [Green Version]
  69. Rajmohan, N.; Elango, L. Identification and evolution of hydrogeochemical processes in the groundwater environment in an area of the Palar and Cheyyar River Basins, Southern India. Environ. Geol. 2004, 46, 47–61. [Google Scholar] [CrossRef]
  70. Schoeller, H. Qualitative evaluation of groundwater resources. In Methods and Techniques of Ground-water Investigation and Development: Water Resources Series No. 33; United Nations: New York, NY, USA, 1967; pp. 44–48. Available online: https://books.google.co.jp/books?id=xbI8mgEACAAJ&printsec=frontcover&source=gbs_ge_summary_r&cad=0#v=onepage&q&f=false (accessed on 20 October 2021).
  71. Chidambaram, S.; Anandhan, P.; Prasanna, M.V.; Srinivasamoorthy, K.; Vasanthavigar, M. Major ion chemistry and identification of hydrogeochemical processes controlling groundwater in and around Neyveli Lignite Mines, Tamil Nadu, South India. Arab. J. Geosci. 2012, 6, 3451–3467. [Google Scholar] [CrossRef]
  72. Ansari, A.; Deodhar, A.; Kumar, U.S. Modeling of geochemical processes and multivariate statistical analysis for hydrochemical assessment of spring water of the Outer Himalaya, India. Environ. Earth Sci. 2019, 78, 665. [Google Scholar] [CrossRef]
  73. Young, S.M.; Pitawala, A.; Ishiga, H. Factors controlling fluoride contents of groundwater in north-central and northwestern Sri Lanka. Environ. Earth Sci. 2010, 63, 1333–1342. [Google Scholar] [CrossRef]
  74. Saxena, V.; Ahmed, S. Inferring the chemical parameters for the dissolution of fluoride in groundwater. Environ. Geol. 2003, 43, 731–736. [Google Scholar] [CrossRef]
  75. Song, X.; Kayane, I.; Tanaka, T.; Shimada, J. A study of the groundwater cycle in Sri Lanka using stable isotopes. Hydrol. Process. 1999, 13, 1479–1496. [Google Scholar] [CrossRef]
  76. Gwenzi, W. Occurrence, behaviour, and human exposure pathways and health risks of toxic geogenic contaminants in serpentinitic ultramafic geological environments (SUGEs): A medical geology perspective. Sci. Total Environ. 2019, 700, 134622. [Google Scholar] [CrossRef] [PubMed]
  77. World Health Organization. Asbestos in Drinking-Water: Draft Background Document for Development of WHO Guidelines for Drinking-Water Quality (Version for Public Review). 2020. Available online: https://www.who.int/docs/default-source/wash-documents/wash-chemicals/gdwq-asbestos-background-document-for-public-review.pdf?ua=1 (accessed on 22 May 2021).
  78. European Commission’s Joint Research Centre—European Soil Data Centre (ESDAC). Geological Map of Sri-Lanka—ESDAC—European Commission. Geological Map of Sri Lanka. 1982. Available online: https://esdac.jrc.ec.europa.eu/content/geological-map-sri-lanka (accessed on 22 October 2021).
  79. Udeshani, W.; Dissanayake, H.; Gunatilake, S.; Chandrajith, R. Assessment of groundwater quality using water quality index (WQI): A case study of a hard rock terrain in Sri Lanka. Groundw. Sustain. Dev. 2020, 11, 100421. [Google Scholar] [CrossRef]
  80. Nikagolla, C.; Meredith, K.T.; Dawes, L.A.; Banati, R.B.; Millar, G.J. Using water quality and isotope studies to inform research in chronic kidney disease of unknown aetiology endemic areas in Sri Lanka. Sci. Total Environ. 2020, 745, 140896. [Google Scholar] [CrossRef]
Figure 1. (a) Climatic zones of Sri Lanka. (b) Sampling locations in the study areas.
Water 13 03356 g001
Figure 2. Piper trilinear diagram for dry and wet seasons.
Water 13 03356 g002
Figure 3. Gibbs diagram for dry and wet seasons.
Water 13 03356 g003
Figure 4. Hydrogeochemical scatter plots between major ions. (a) Ca2+ + Mg2+ vs. Total cations (TZ+); (b) Na+ + K+ vs. TZ+; (c) Ca2+ vs. SO42−; (d) Mg2+ vs. HCO3; (e) Ca2+ vs. HCO3; (f) Ca2+ + Mg2+ vs. HCO3; (g) HCO3 vs. Na+; (h) Cl vs. Na+.
Water 13 03356 g004aWater 13 03356 g004b
Figure 5. Hydrogeochemical plots indicating the presence of ion exchange process in groundwater. (a) Ca2+ + Mg2+ − HCO3 − SO42− vs. Na+ + K+ − Cl; (b) Ca2+ + Mg2+ vs. HCO3 + SO42.
Water 13 03356 g005
Figure 6. Saturation indices (SI) of some minerals in groundwater. (a) SI of Calcite; (b) SI of Dolomite; (c) SI of Quartz; (d) SI of Chrysotile; (e) SI of Gypsum; (f) SI of Fluorite.
Water 13 03356 g006aWater 13 03356 g006b
Figure 7. Relationship between gypsum dissolution and calcite/dolomite precipitation.
Water 13 03356 g007
Figure 8. Relationship between fluorite dissolution and F ion concentrations in groundwater in dry and wet seasons.
Water 13 03356 g008
Table 1. Water quality data from dry and wet seasons and compliance with drinking water standards.
Water Quality ParameterDry SeasonWet Seasonp Values from t-Test bMAL c% Samples Didn’t Meet MAL c
MinMaxMeanSD aMinMaxMeanSD aDryWet
Temperature273330126342920.001 *
pH6.17.26.60.36.17.87.30.32.761 × 10−12 **6.5–8.5333
Total Alkalinity (mg/L as CaCO3)119614379104465783641120.6022009093
Electrical Conductivity (µS/cm)5551941115736419528209583890.238
Total Dissolved Solids (ppm)2789715781829714105102560.2385006740
Total Hardness (mg/L as CaCO3)2027913941306210053821680.7662509793
Sodium/Na+ (mg/L)1925086481423487570.90120037
Calcium/Ca2+ (mg/L)2718987351225287450.9801002723
Magnesium/Mg2+ (mg/L)1789431989240210.586307067
Potassium/K+ (mg/L)0.4418.711.771.180.3444.602.662.360.146
Bicarbonate/HCO3 (mg/L)145749462127567054441360.602
Chloride/Cl (mg/L)264181066010660100840.943250710
Sulfate/SO42− (mg/L)71102919612534240.39225000
Fluoride/F (mg/L)0.242.630.720.280.092.870.690.360.94111.5 d2730
Nitrate/NO3 (mg/L)0.0019.231.962.140.001.500.350.210.003 *5000
a Standard Deviation; b p values from Welch Two Sample t-test for the statistical comparison between groundwater quality in dry and wet seasons; (* Significant difference at p < 0.05; ** Significant difference at p < 0.01); c Maximum allowable level (MAL) recommended for drinking under Sri Lanka Standards for potable water (SLS 614: 2013) [40]; d World Health Organization (WHO) guideline value for drinking water quality [41]; “–“ refers to “not applicable”
Table 2. Correlation coefficient (r) matrix of major ions in groundwater in (a) dry season and (b) wet season (The correlations are considered as significant and marked in bolded figures when the absolute value of “r” is greater than 0.500).
(a)
ParameterTDSNa+K+Ca2+Mg2+HCO3ClSO42−F
TDS1.000
Na+0.6361.000
K+−0.023−0.0761.000
Ca2+0.6080.0410.1431.000
Mg2+0.6080.337−0.1740.2491.000
HCO30.6230.5590.0110.2390.6901.000
Cl0.8030.579−0.0410.6230.4730.2301.000
SO42−0.5560.3270.0670.5740.4720.3910.4841.000
F−0.1150.104−0.129−0.3820.2440.282−0.180−0.1521.000
(b)
ParameterTDSNa+K+Ca2+Mg2+HCO3ClSO42−F
TDS1.000
Na+0.6701.000
K+0.4880.2191.000
Ca2+0.7970.3990.5671.000
Mg2+0.5950.6210.2050.4401.000
HCO30.3940.6170.1220.3310.7151.000
Cl0.8770.7550.4820.7800.6030.2771.000
SO42−0.7340.5540.5570.7820.6610.4370.7531.000
F0.0710.303−0.267−0.1320.4350.4090.0590.0311.000
Table 3. Saturation indices (SI) of potential minerals in groundwater.
MineralSI-Dry SeasonSI-Wet Season
MinMaxMeanSD aMinMaxMeanSD a
Calcite(CaCO3)0.471.270.980.20−0.531.290.930.34
Aragonite(CaCO3)0.331.130.840.20−0.671.150.790.34
Dolomite(CaMg(CO3)2)0.822.762.070.41−0.842.561.920.67
Quartz(SiO2)0.111.030.830.200.661.050.920.12
Chalcedony(SiO2)−0.300.620.410.200.240.630.510.12
Chrysotile(Mg3Si2O5(OH)4)−1.041.810.750.63−1.091.840.670.70
Sepiolite(Mg2Si3O7·5OH:3H2O)−1.621.680.790.67−0.661.880.930.61
Gypsum(CaSO4·2H2O)−2.82−1.50−2.280.32−3.00−1.35−2.250.39
Anhydrite(CaSO4)−3.01−1.69−2.480.32−3.21−1.54−2.450.39
Halite(NaCl)−7.62−5.82−6.750.45−8.41−5.52−6.840.61
Fluorite(CaF2)−2.39−0.48−1.420.40−3.11−0.38−1.520.66
a Standard Deviation.
Publisher’s Note: MDPI stays neutral with regard to jurisdictional claims in published maps and institutional affiliations.

