
Operating Effects of the Three Gorges Reservoir on the Riverbed Stability in the Wuhan Reach of the Yangtze River

 ,
,
Abstract
:1. Introduction
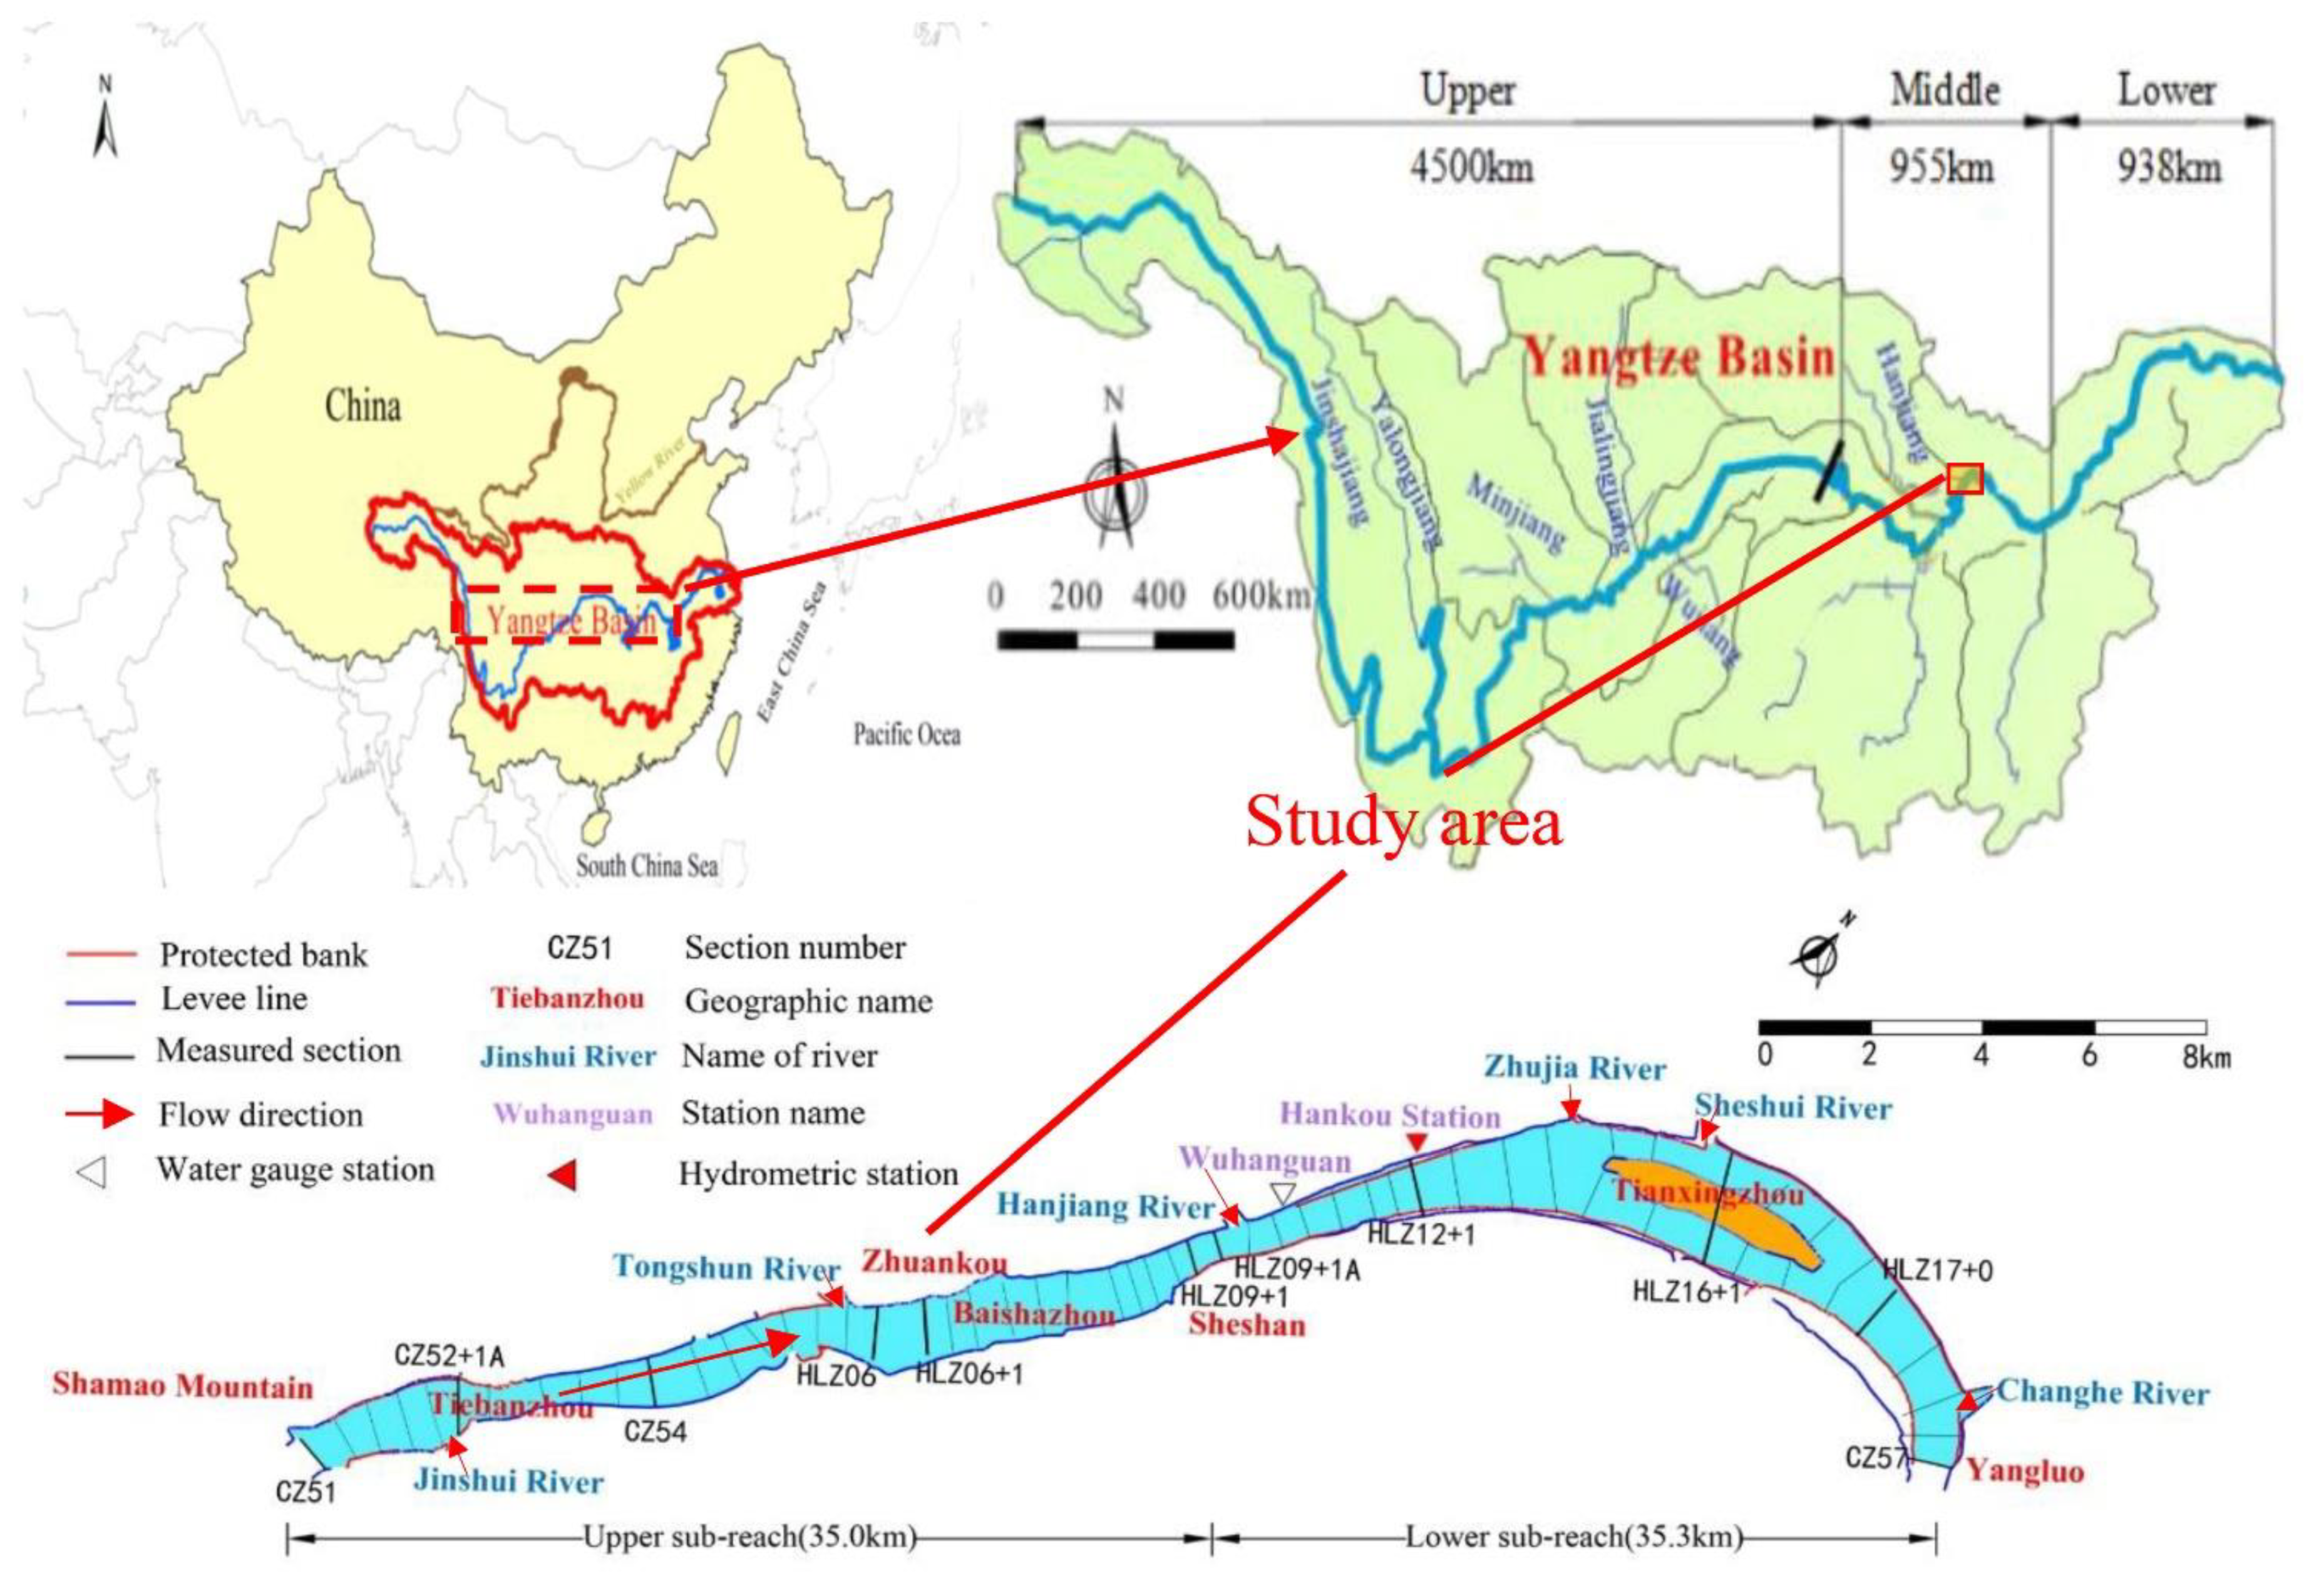
2. Study Area
3. Methods
3.1. Methods for Evaluating Channel Stability
3.2. Methods for Calculation of the Changes in Morphological Parameters
4. Results
4.1. Changes in Flow and Sediment Regimes
4.2. Morphological Adjustment
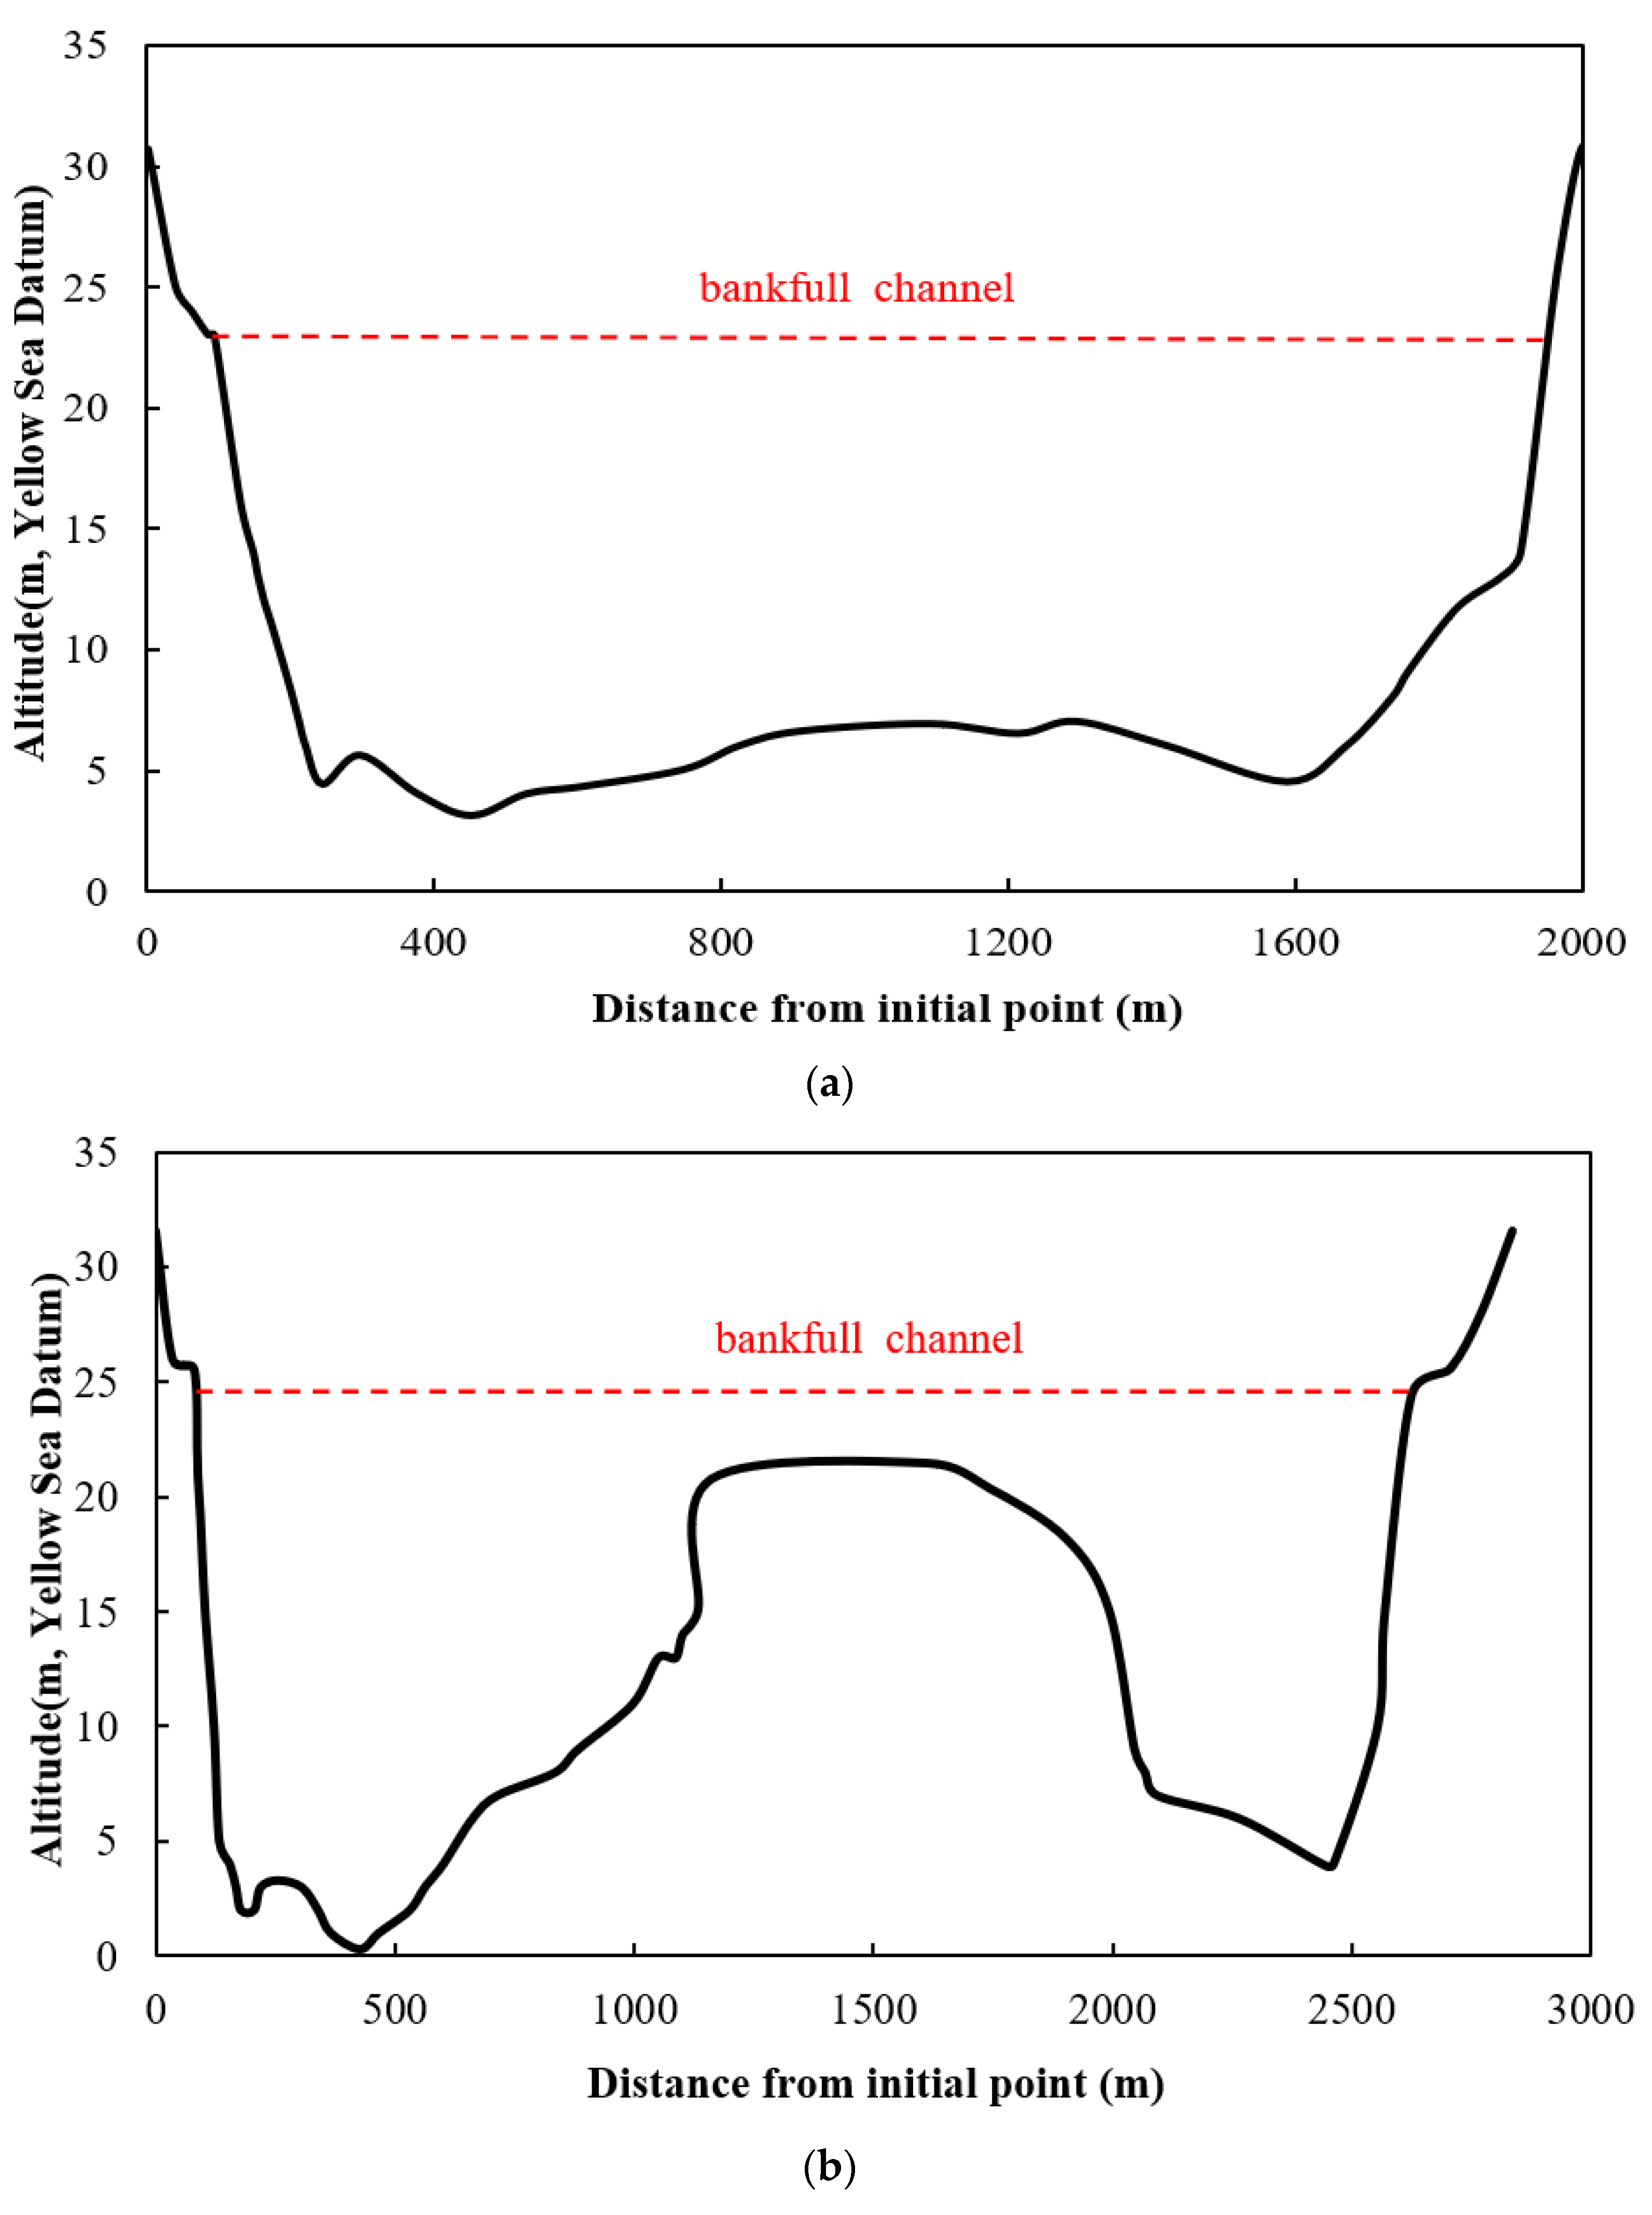
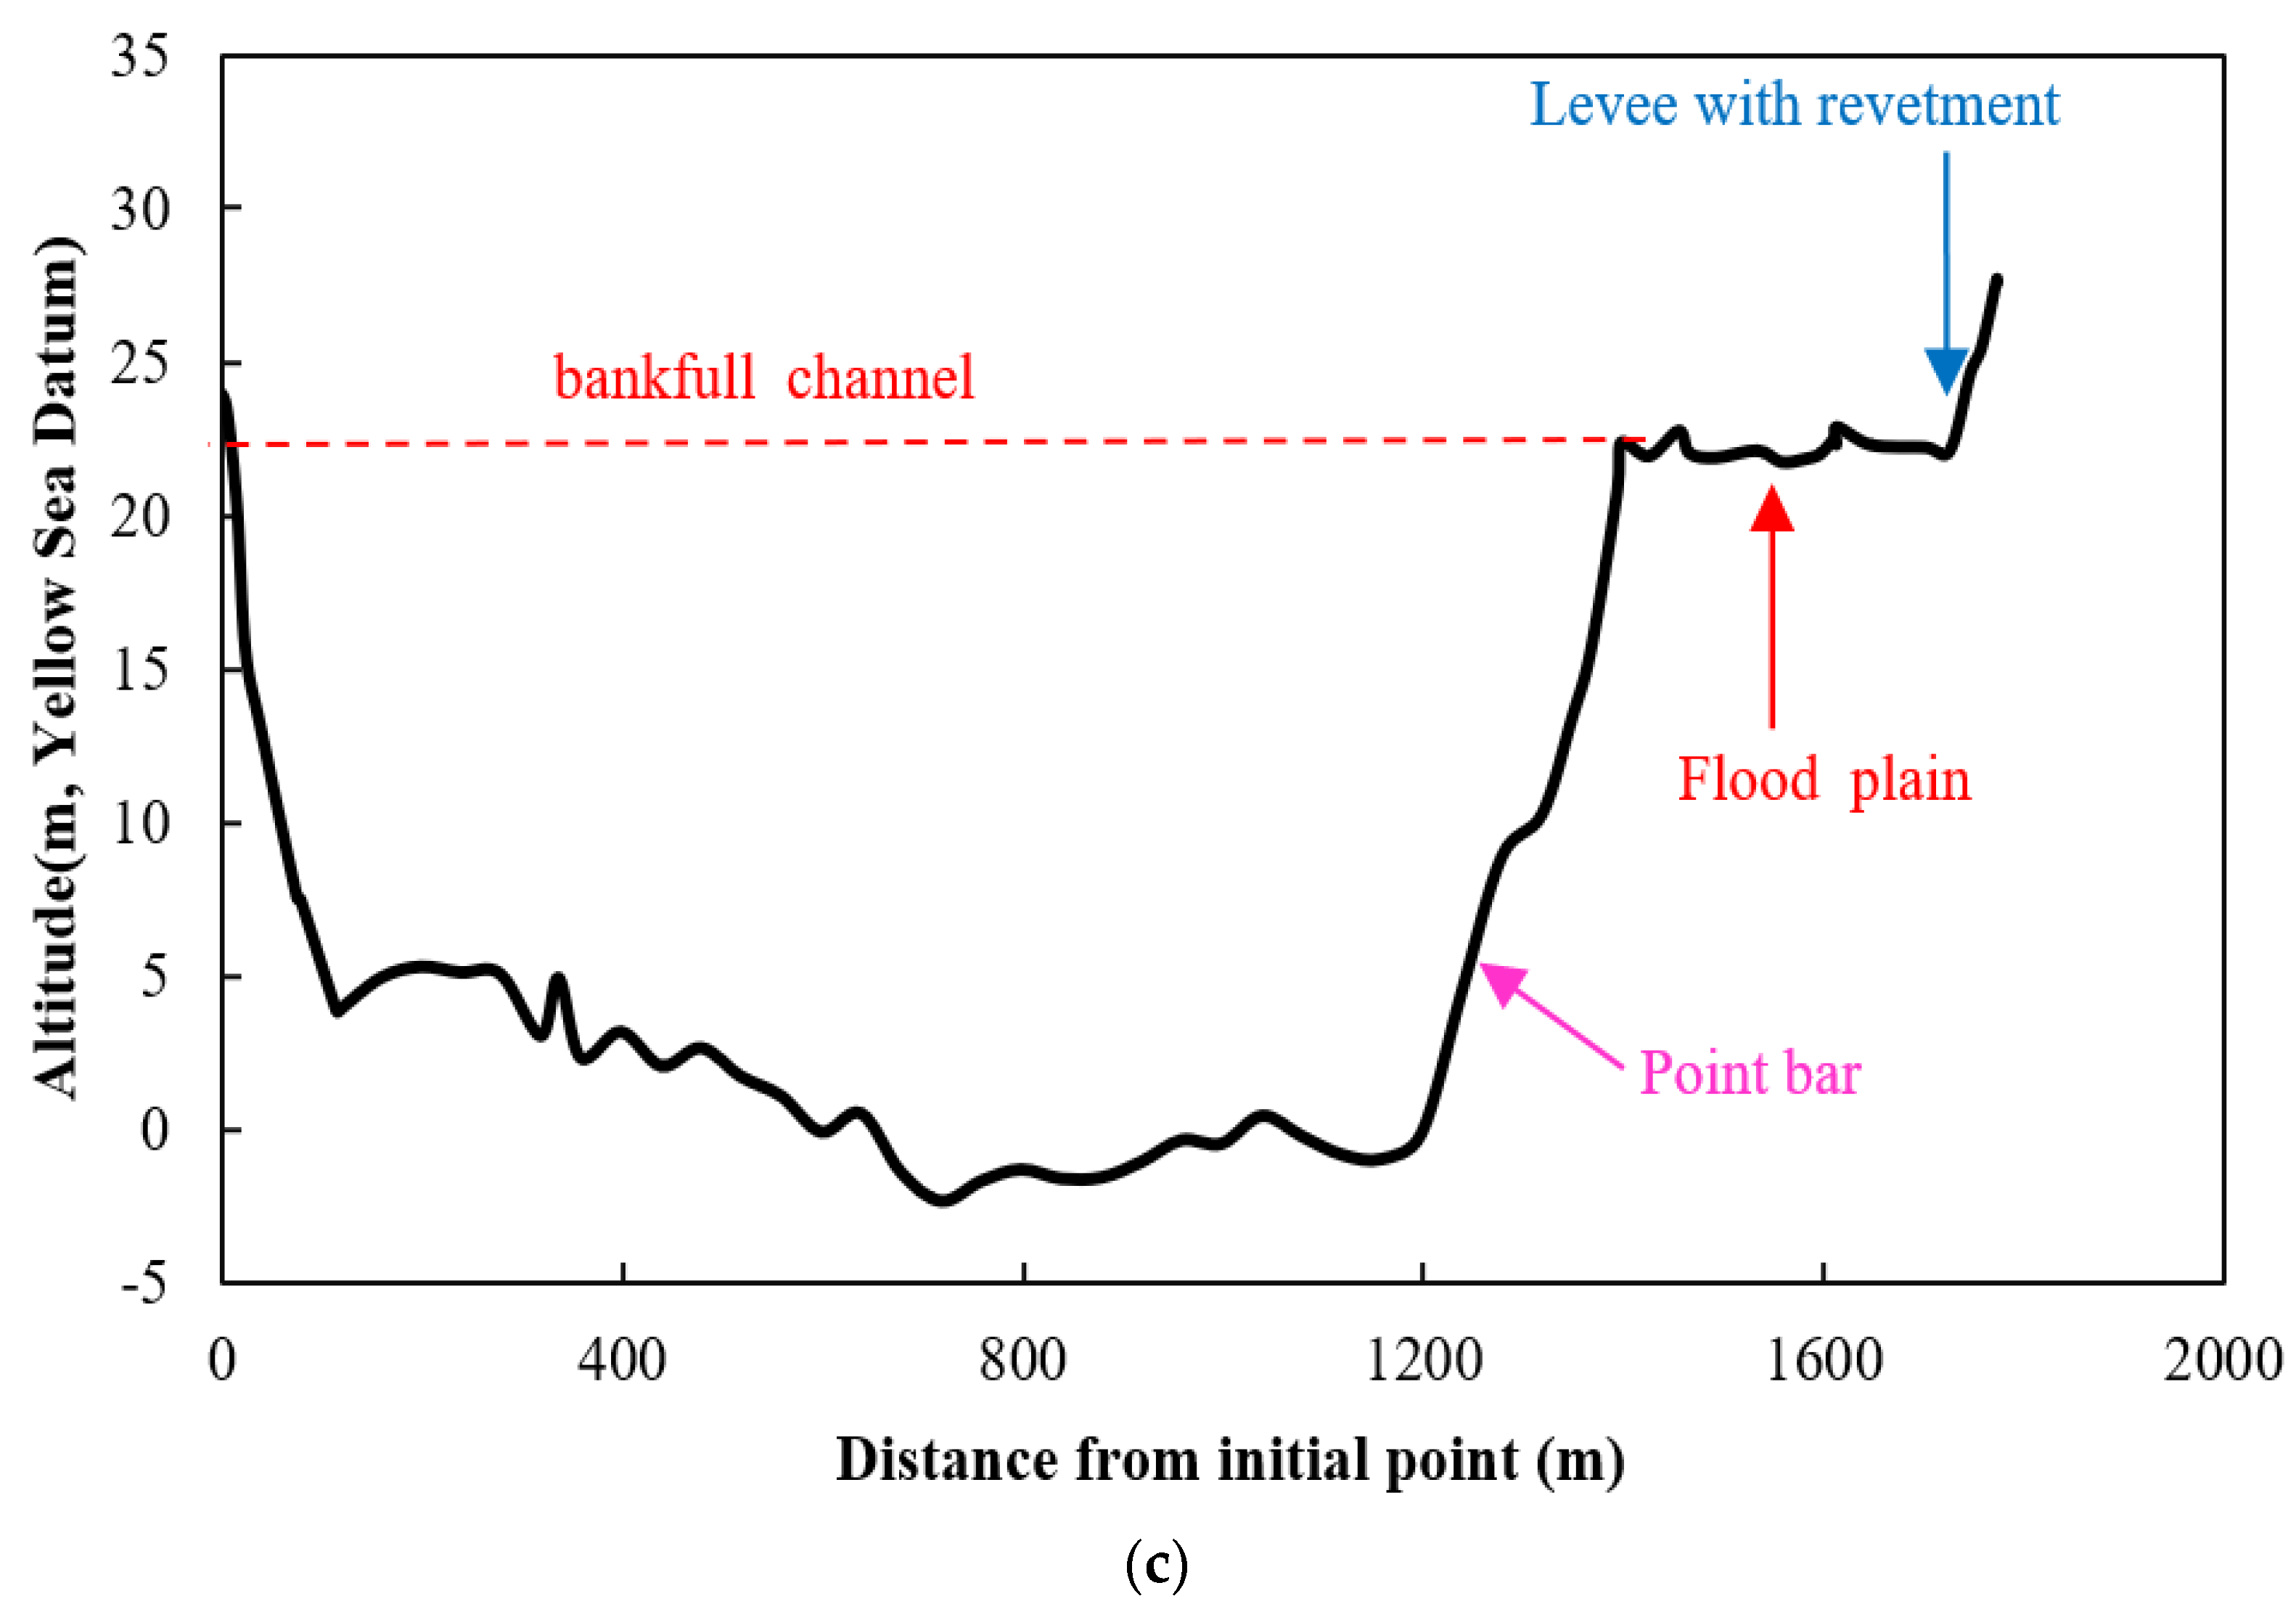
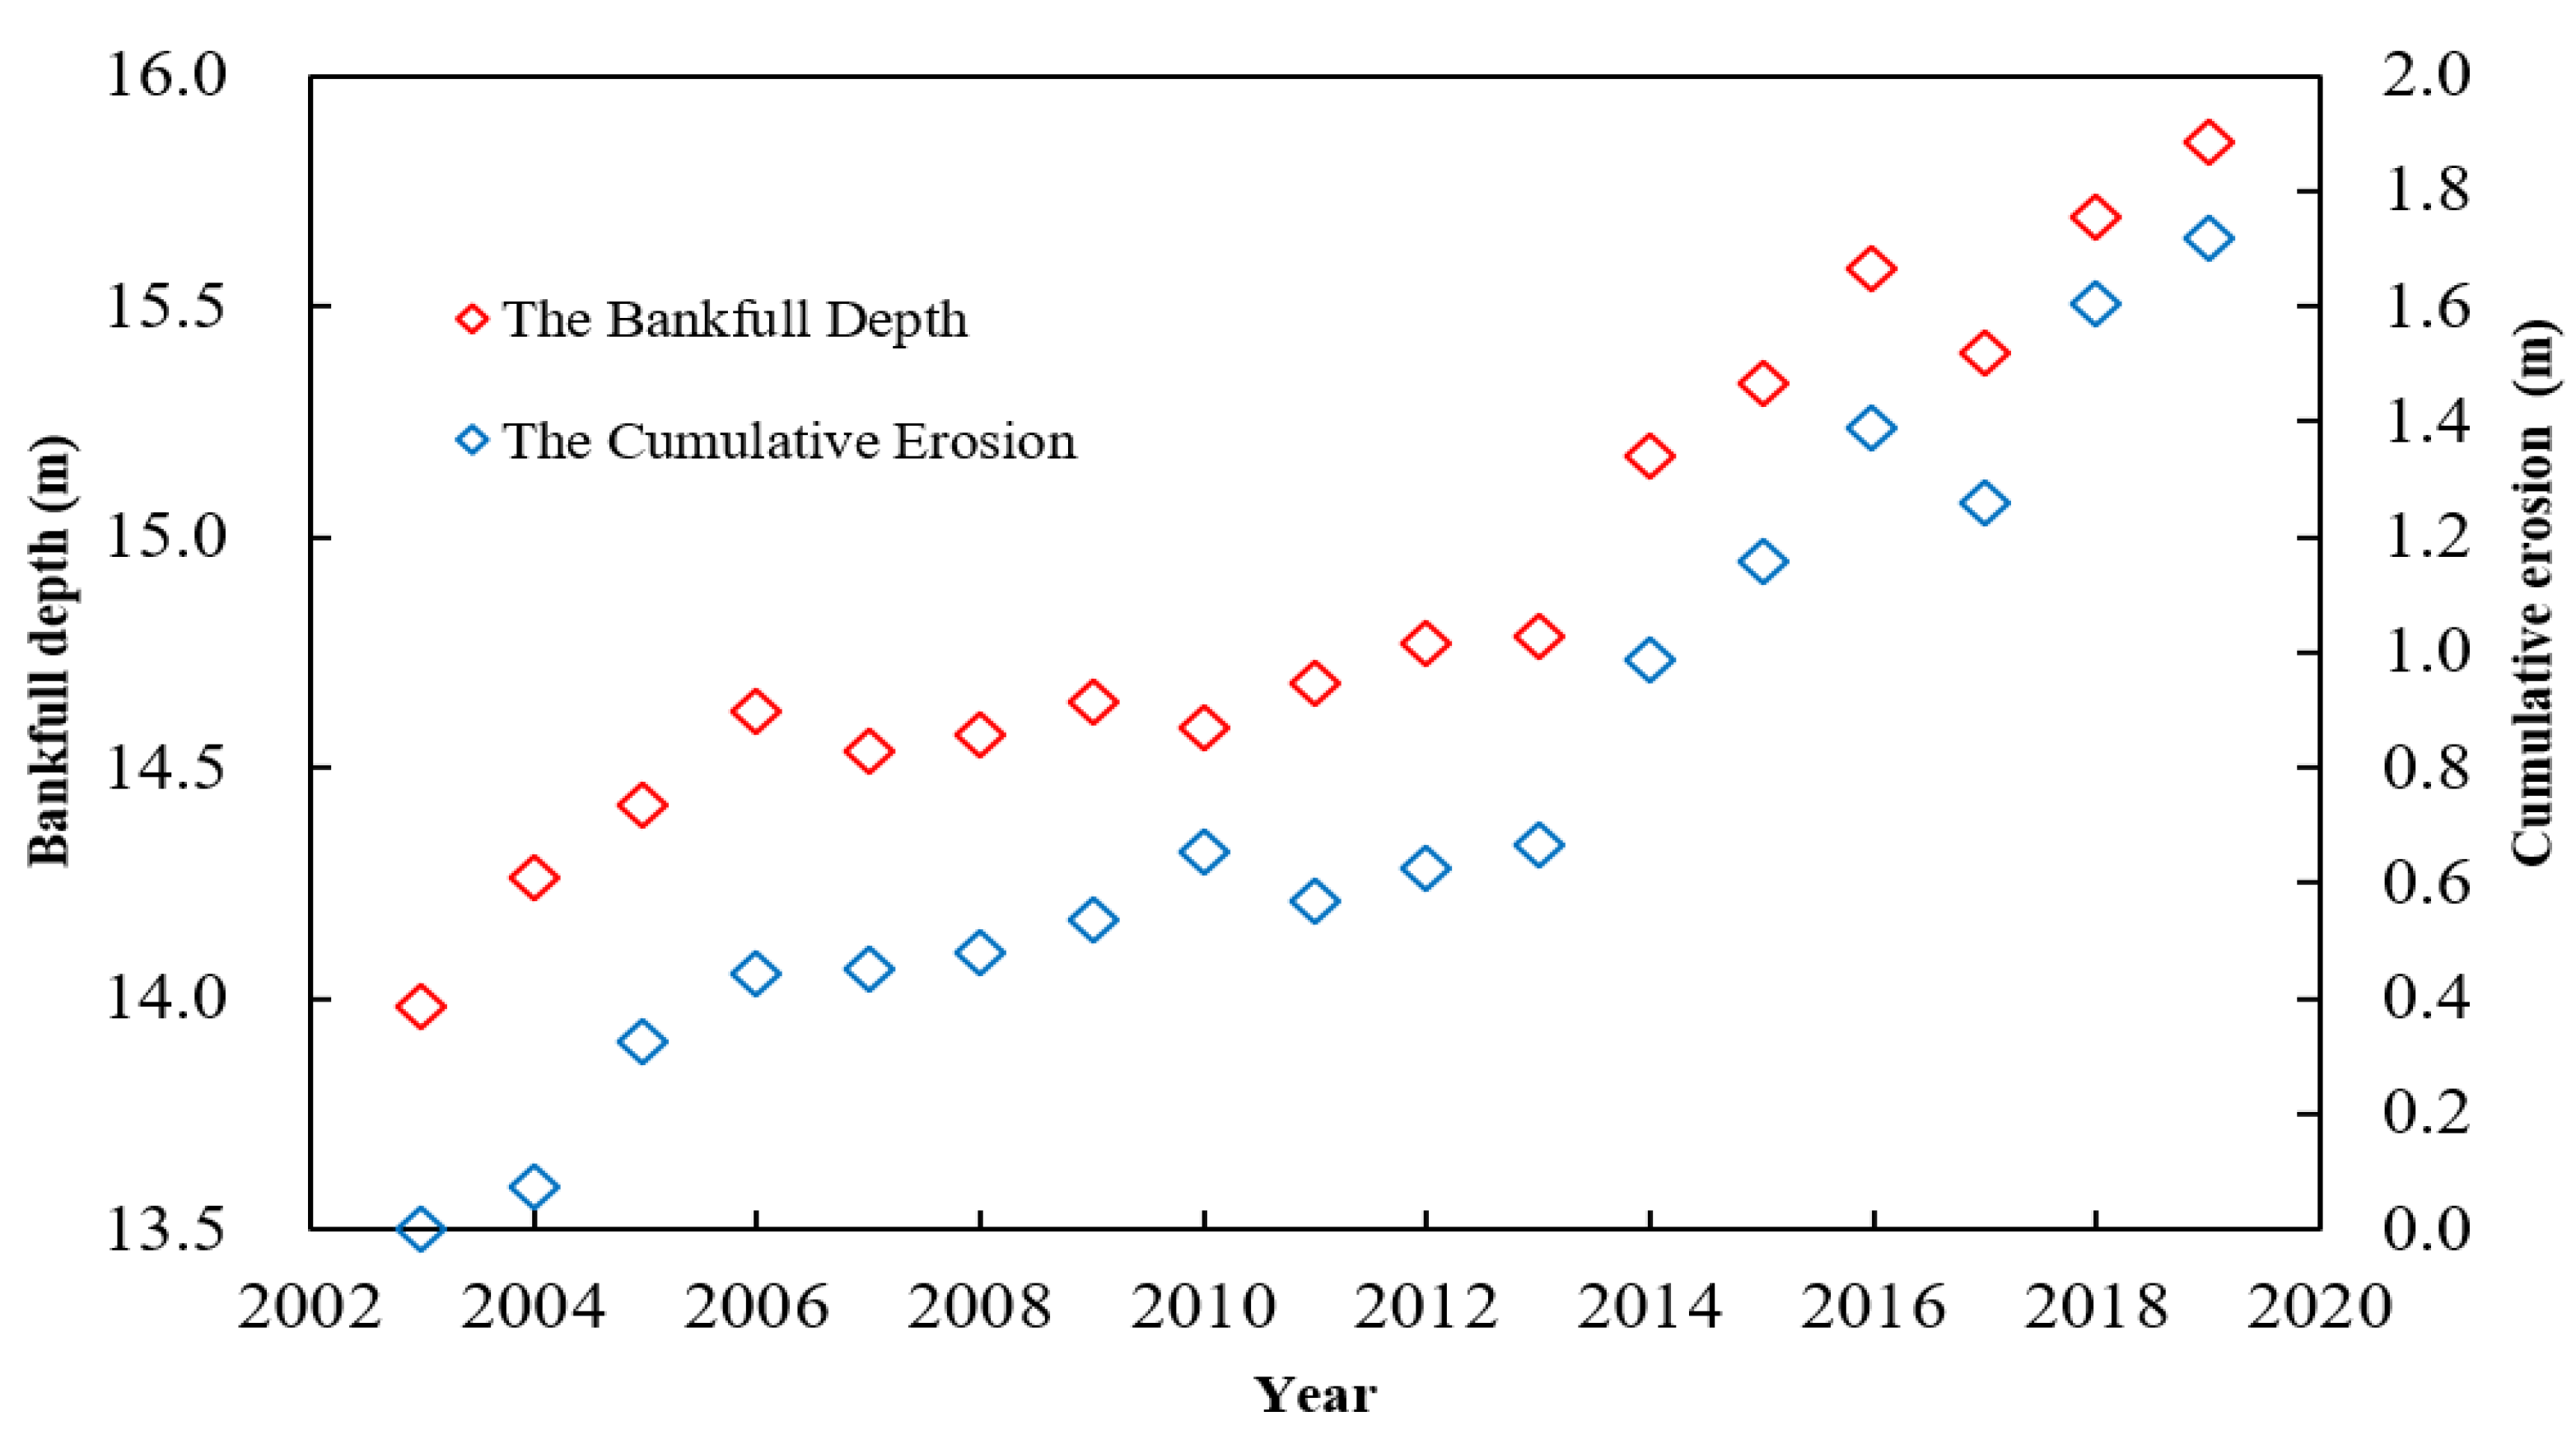
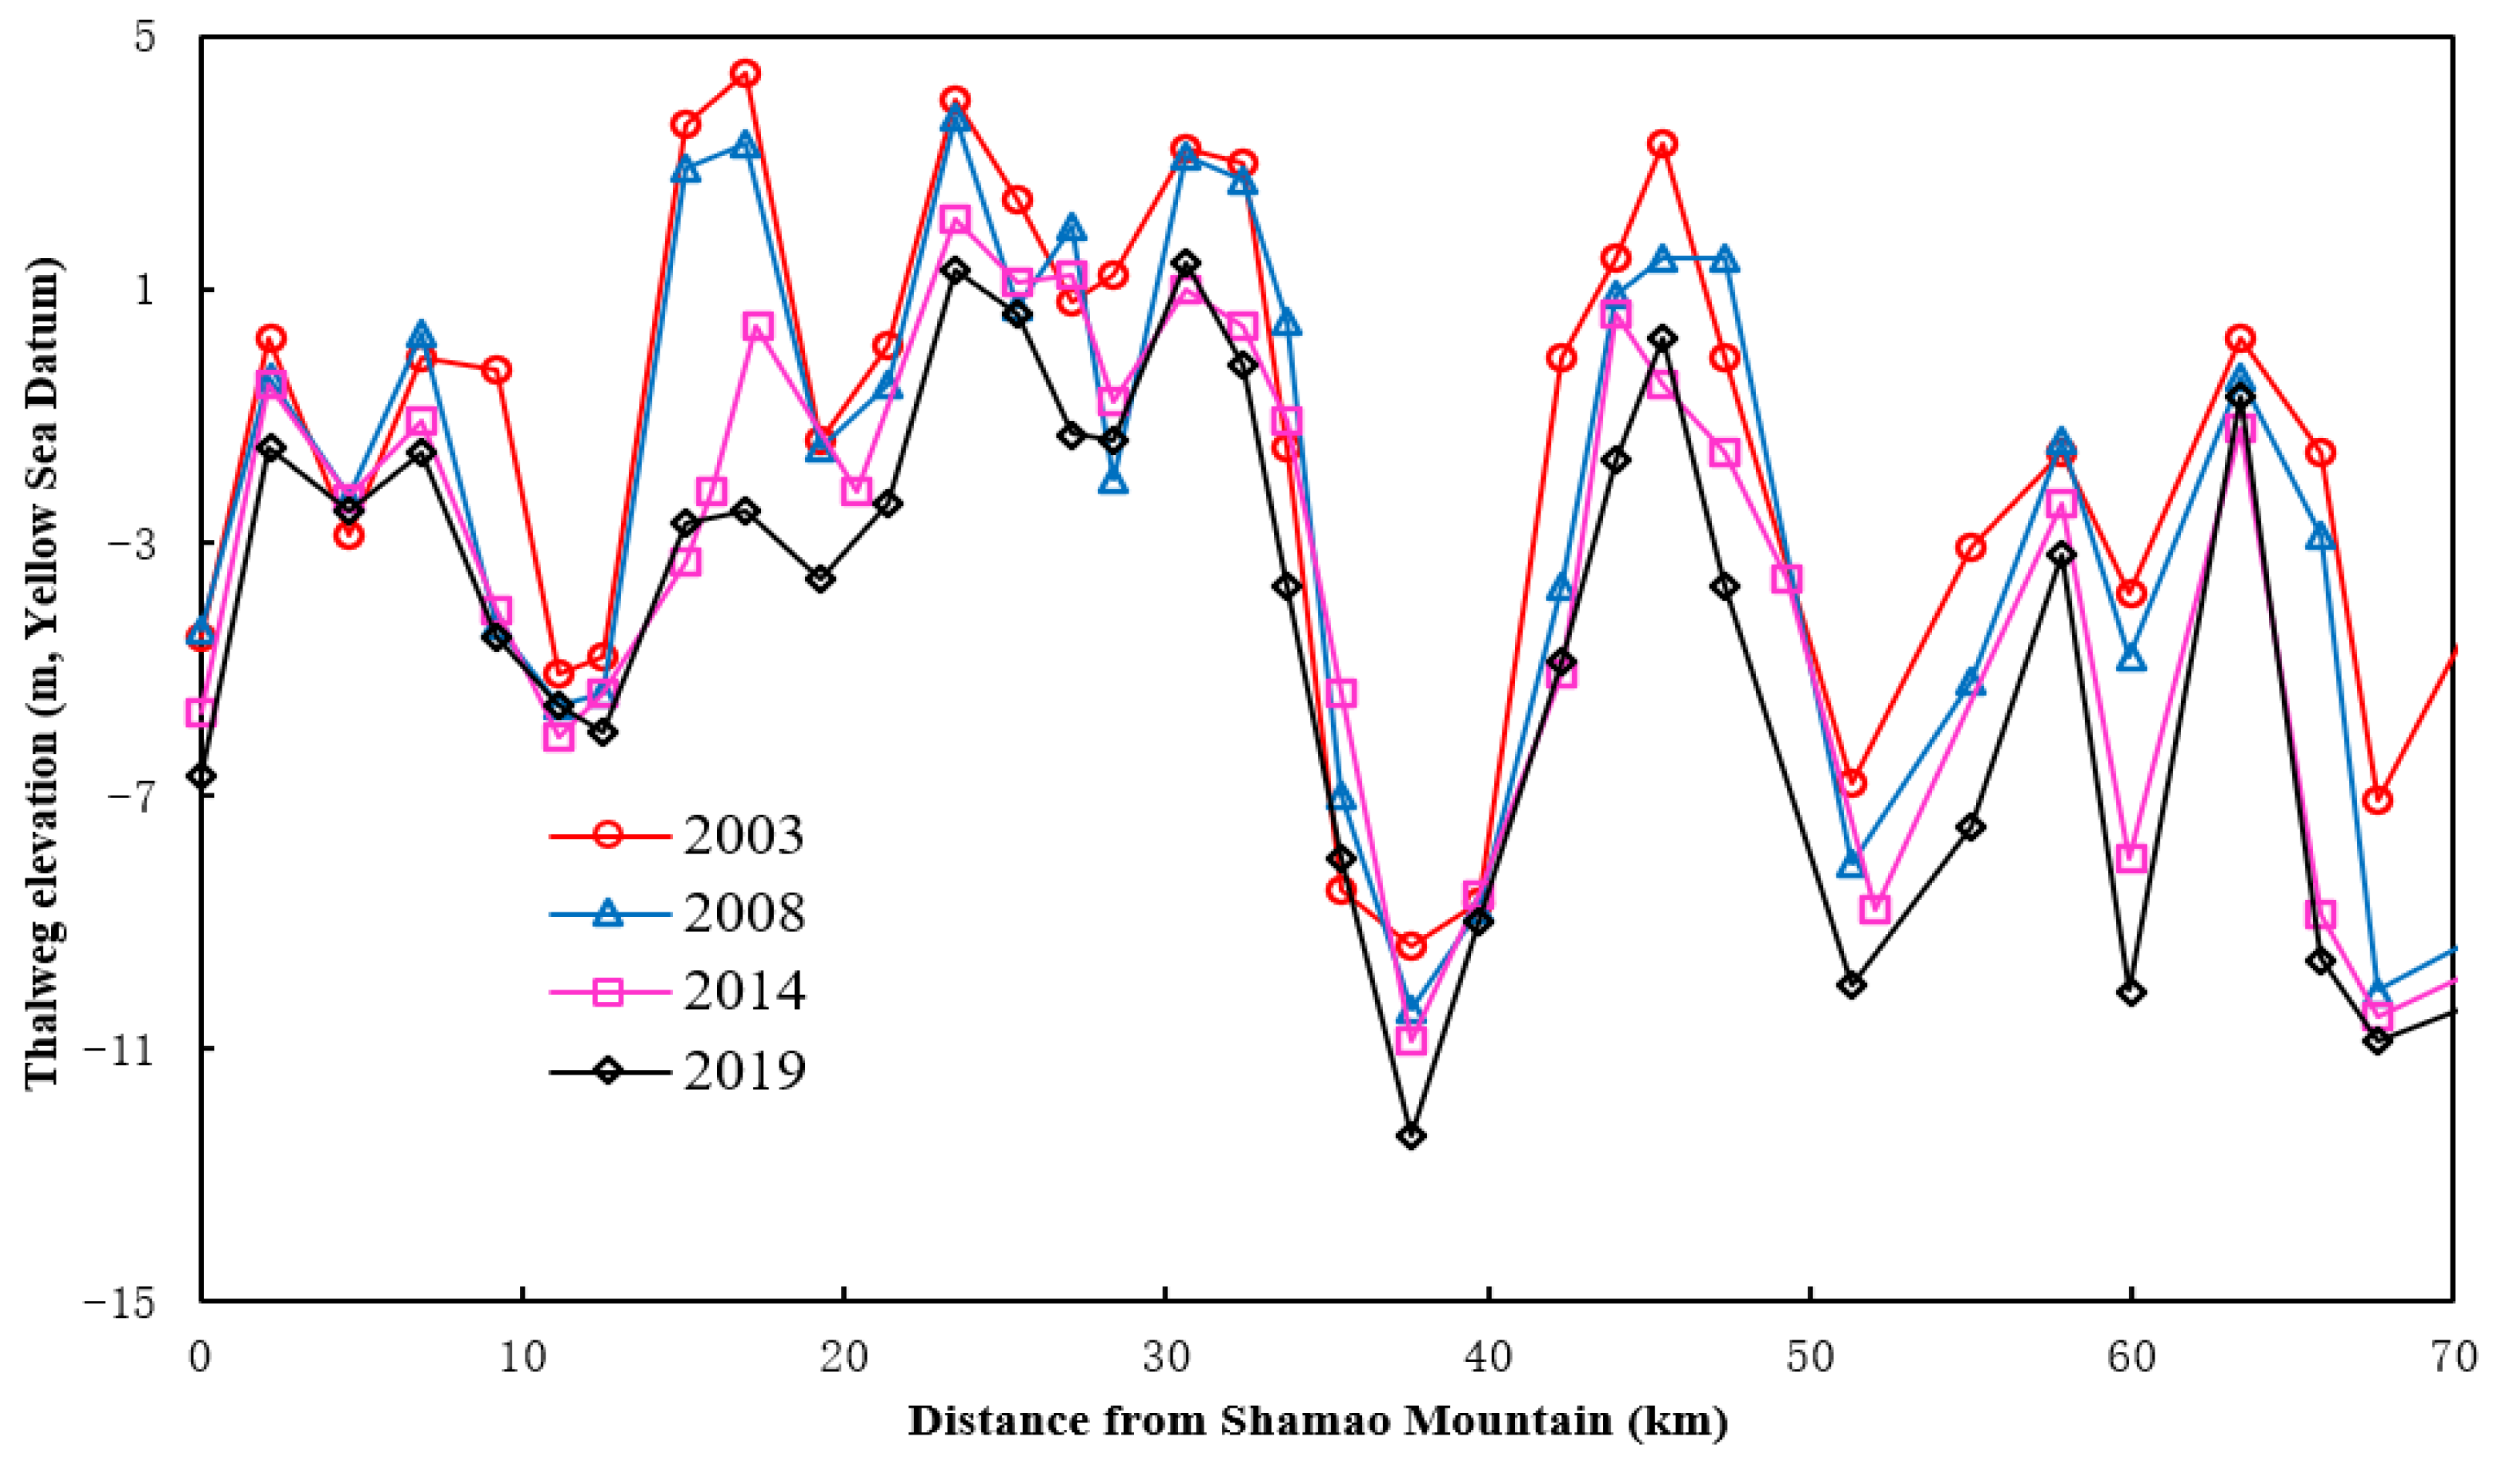
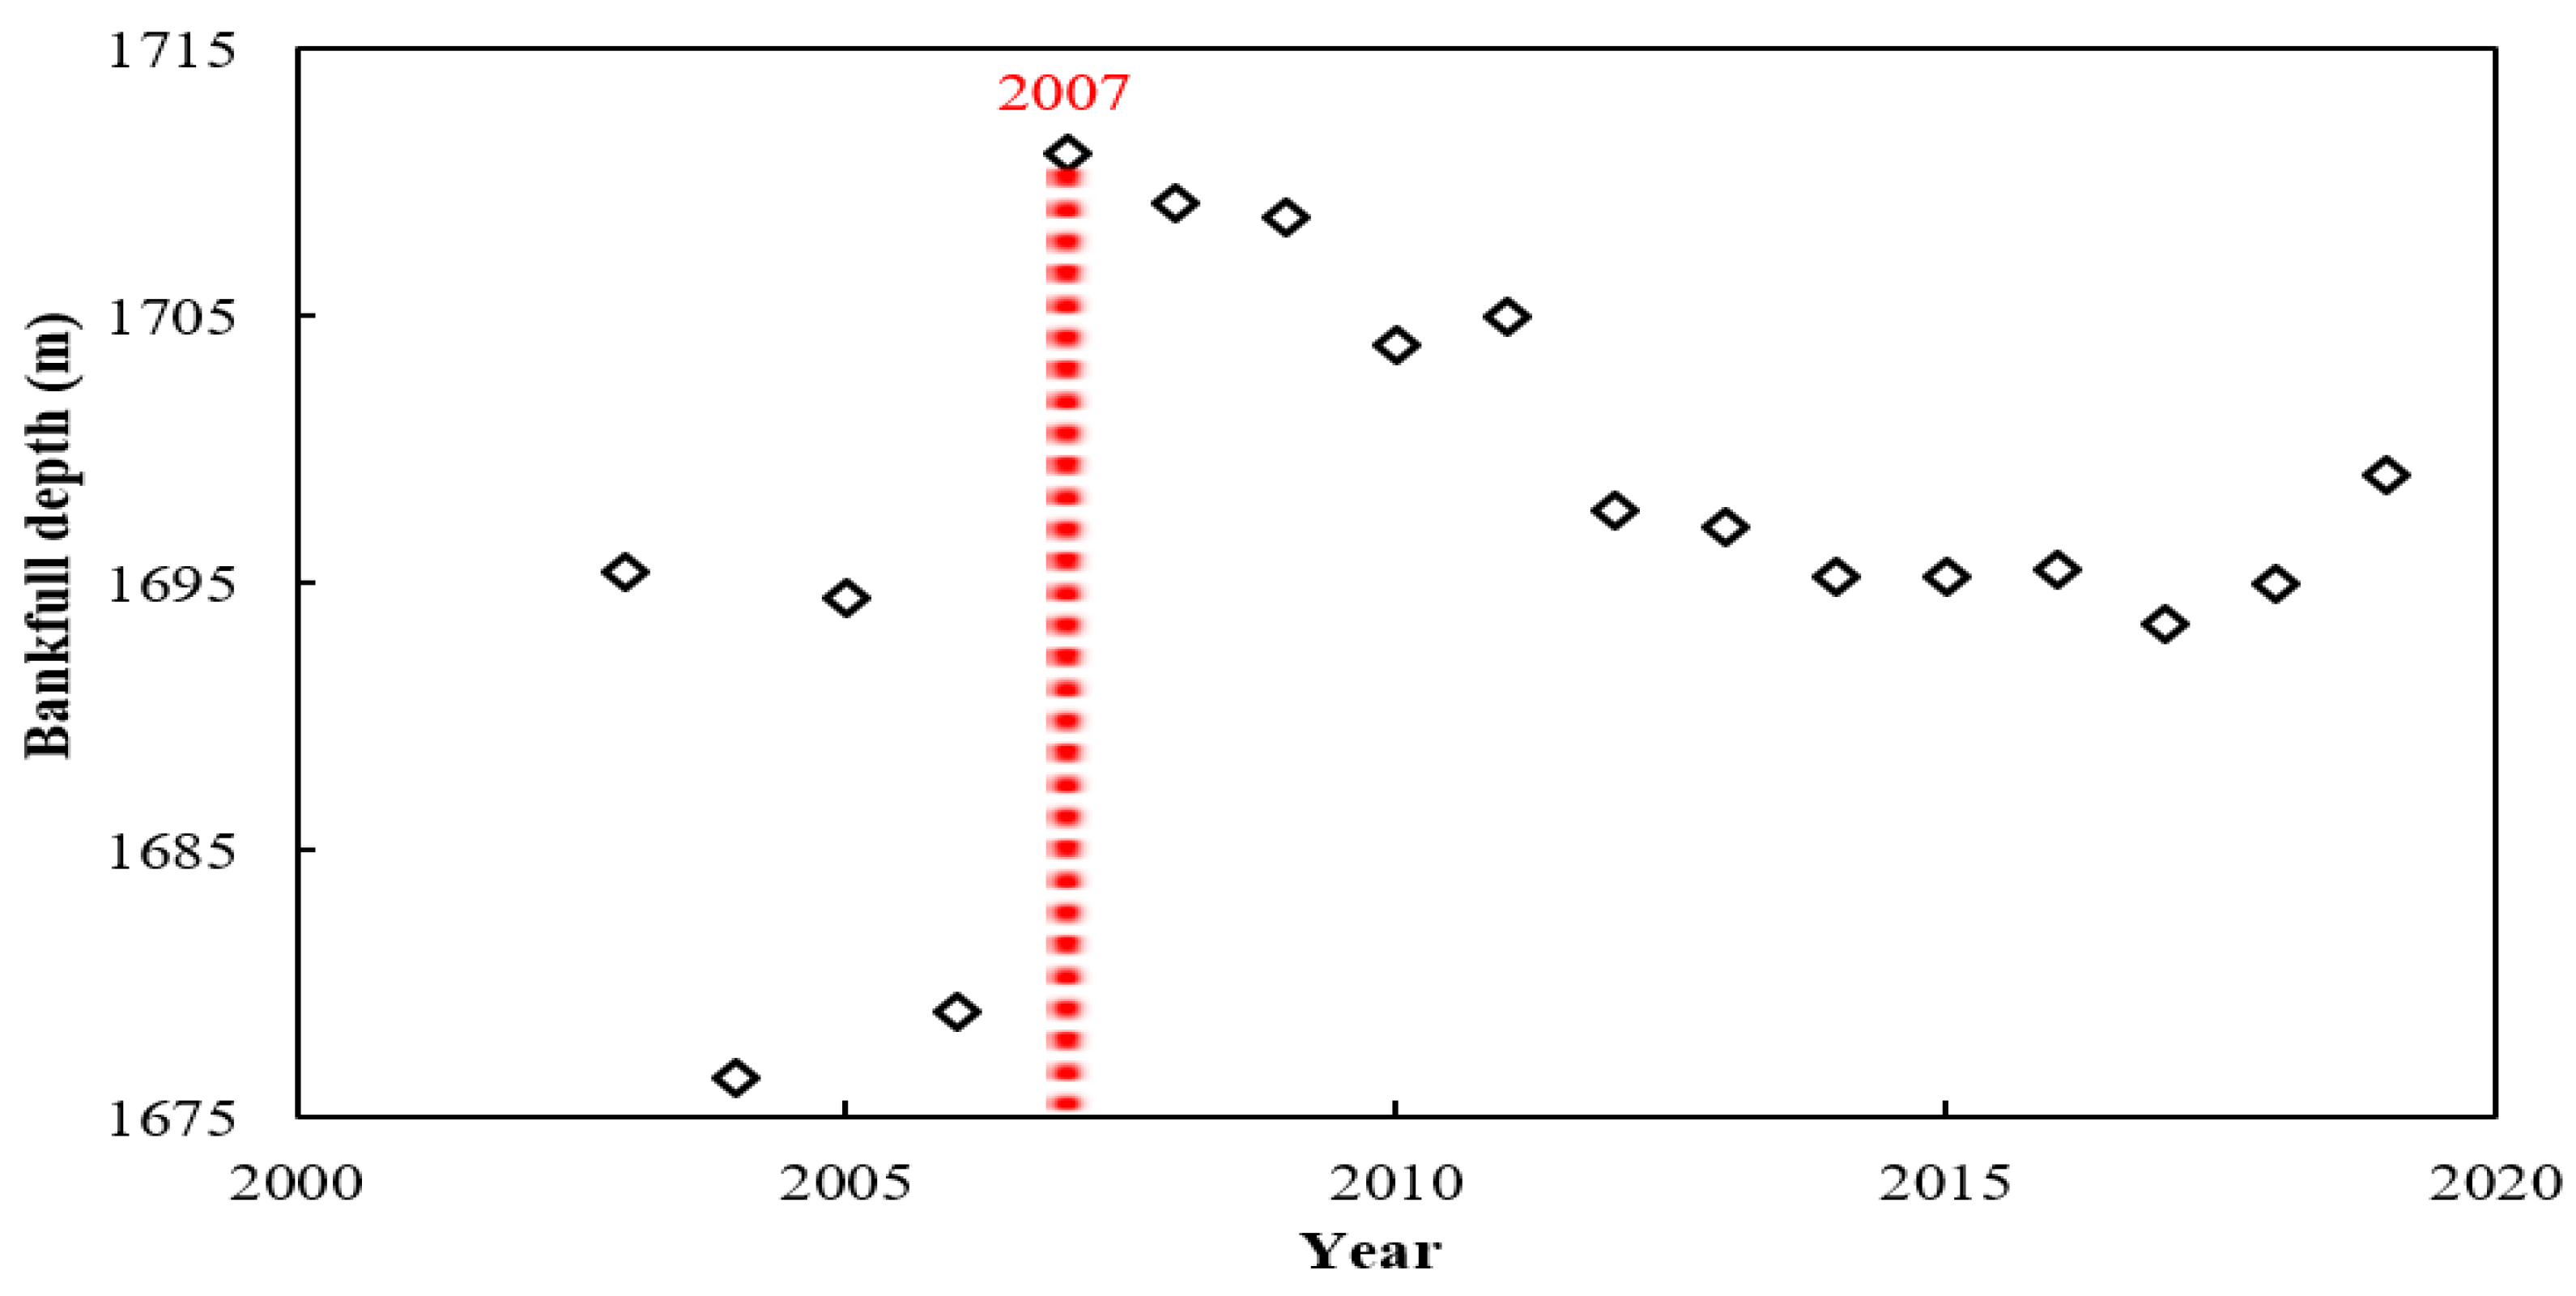
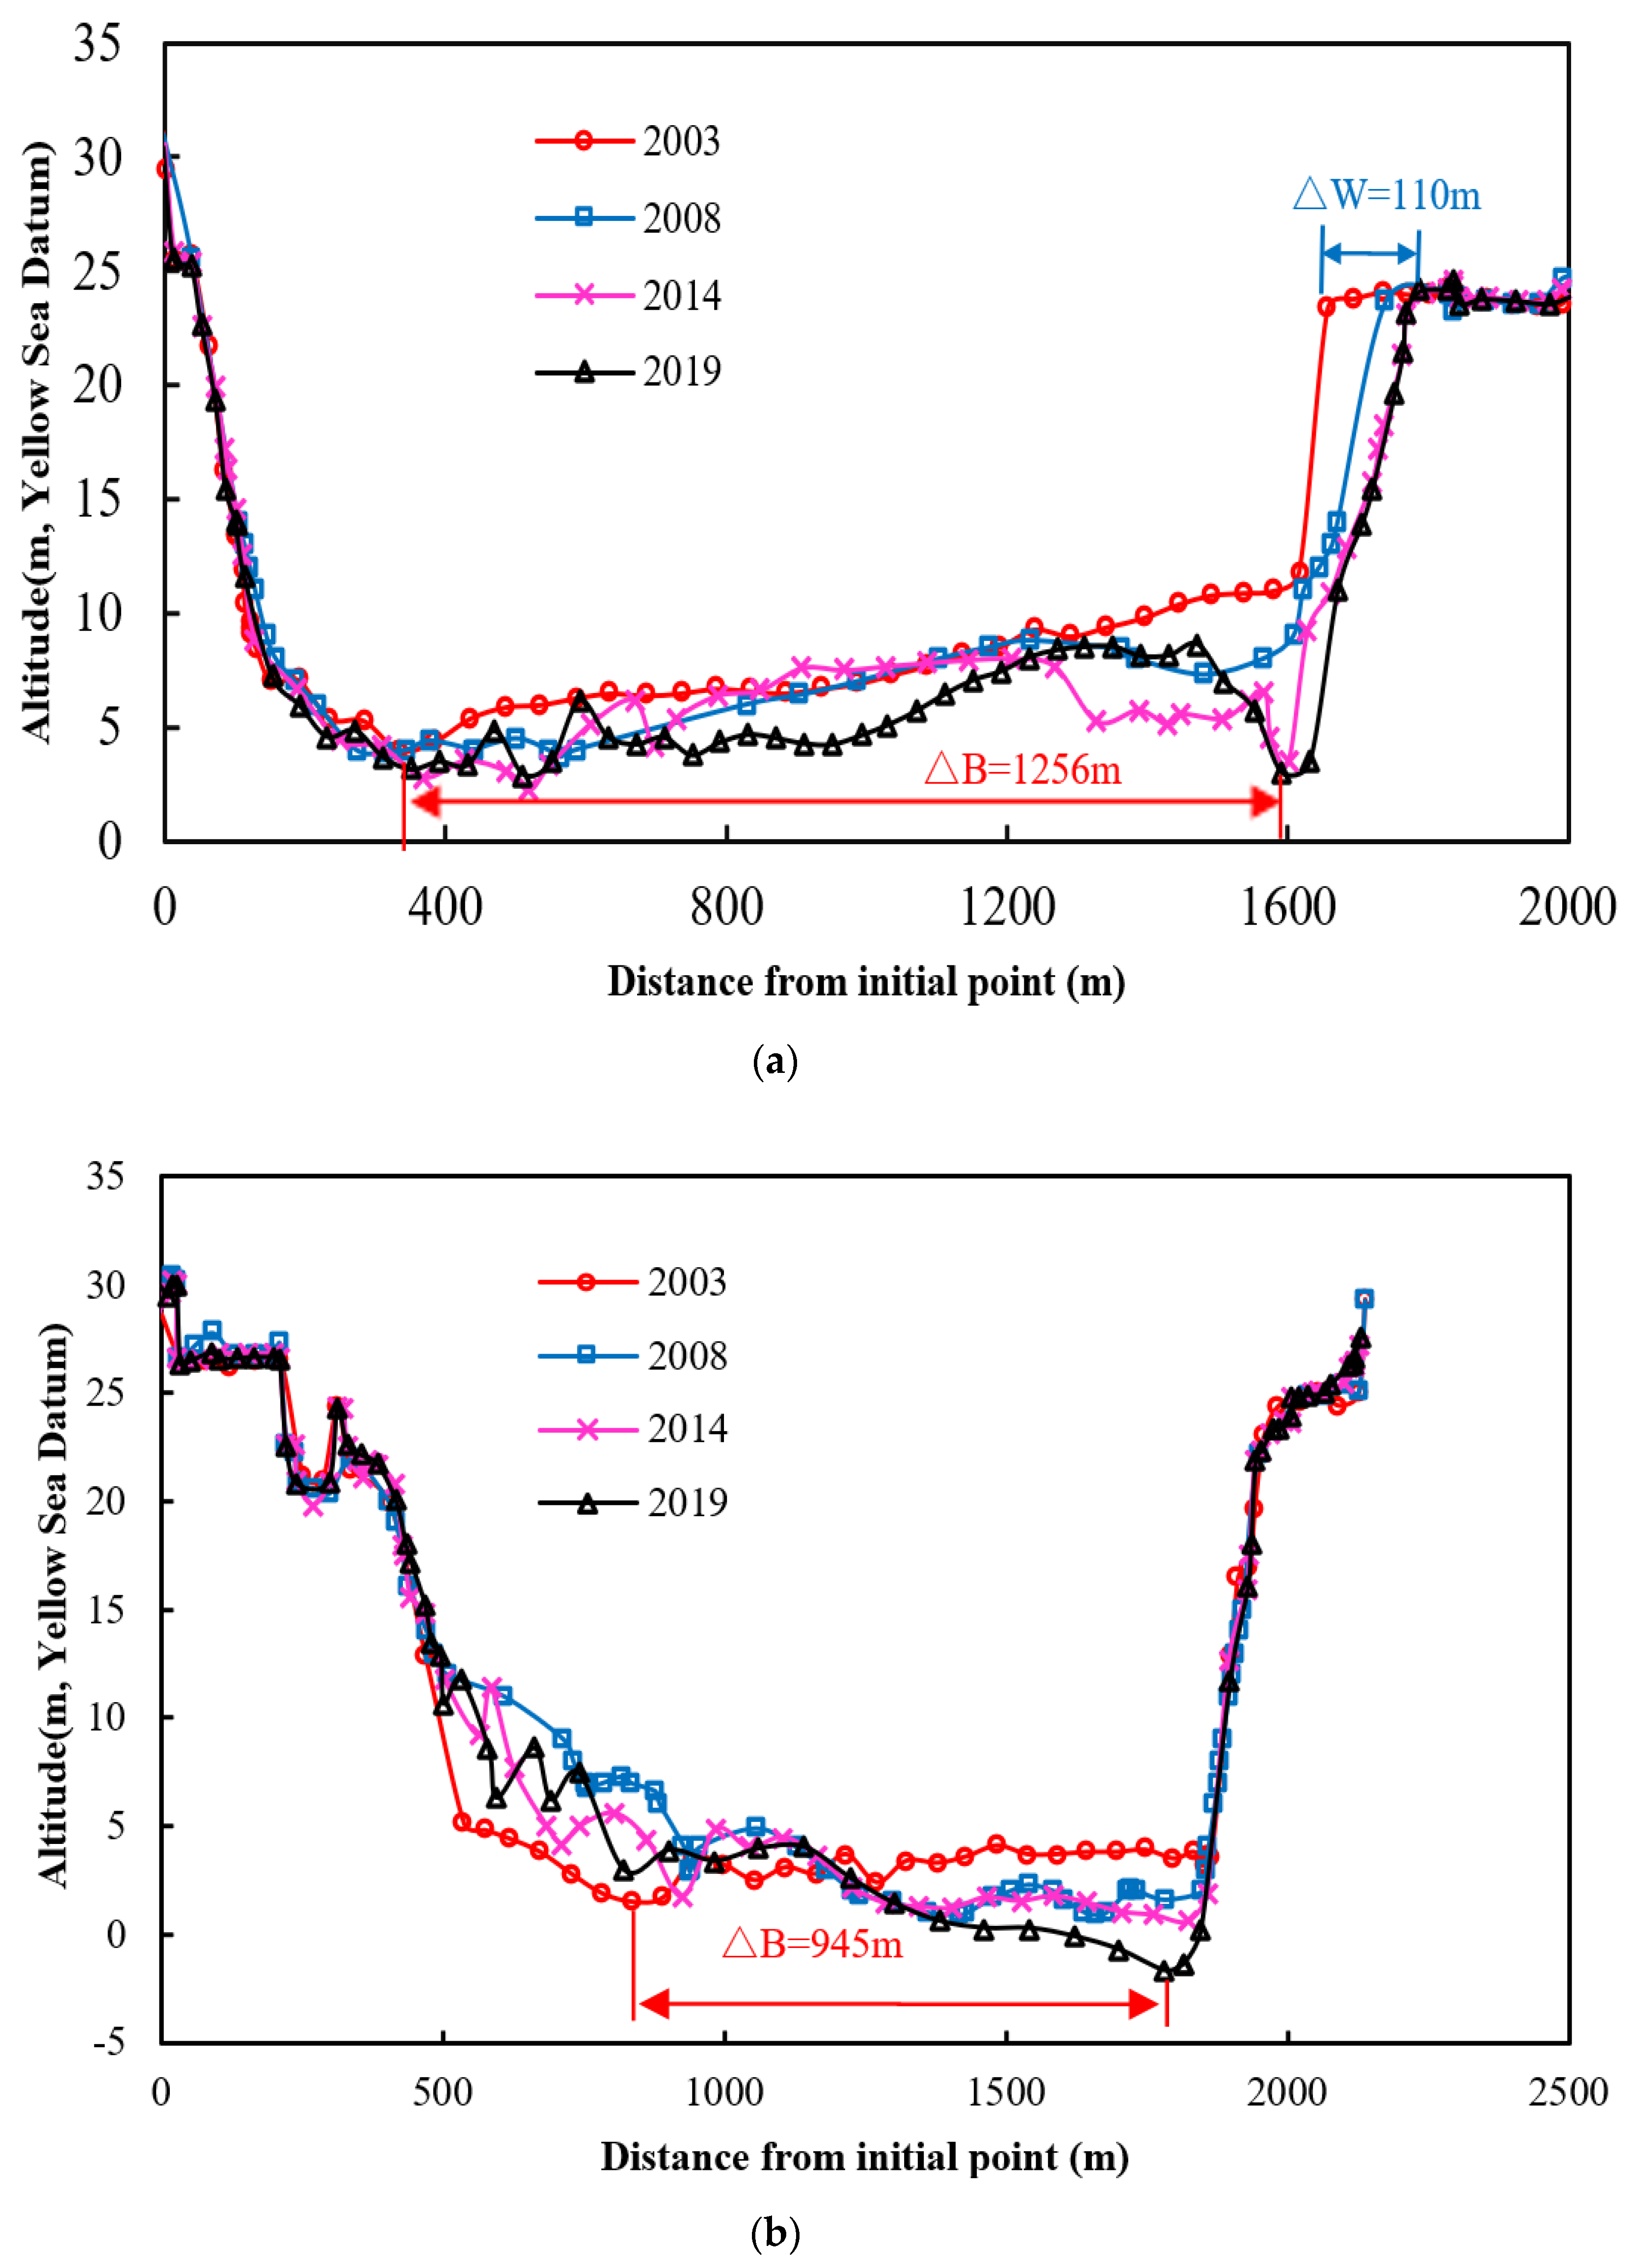
4.2.1. Variation in Vertical Channel Stability
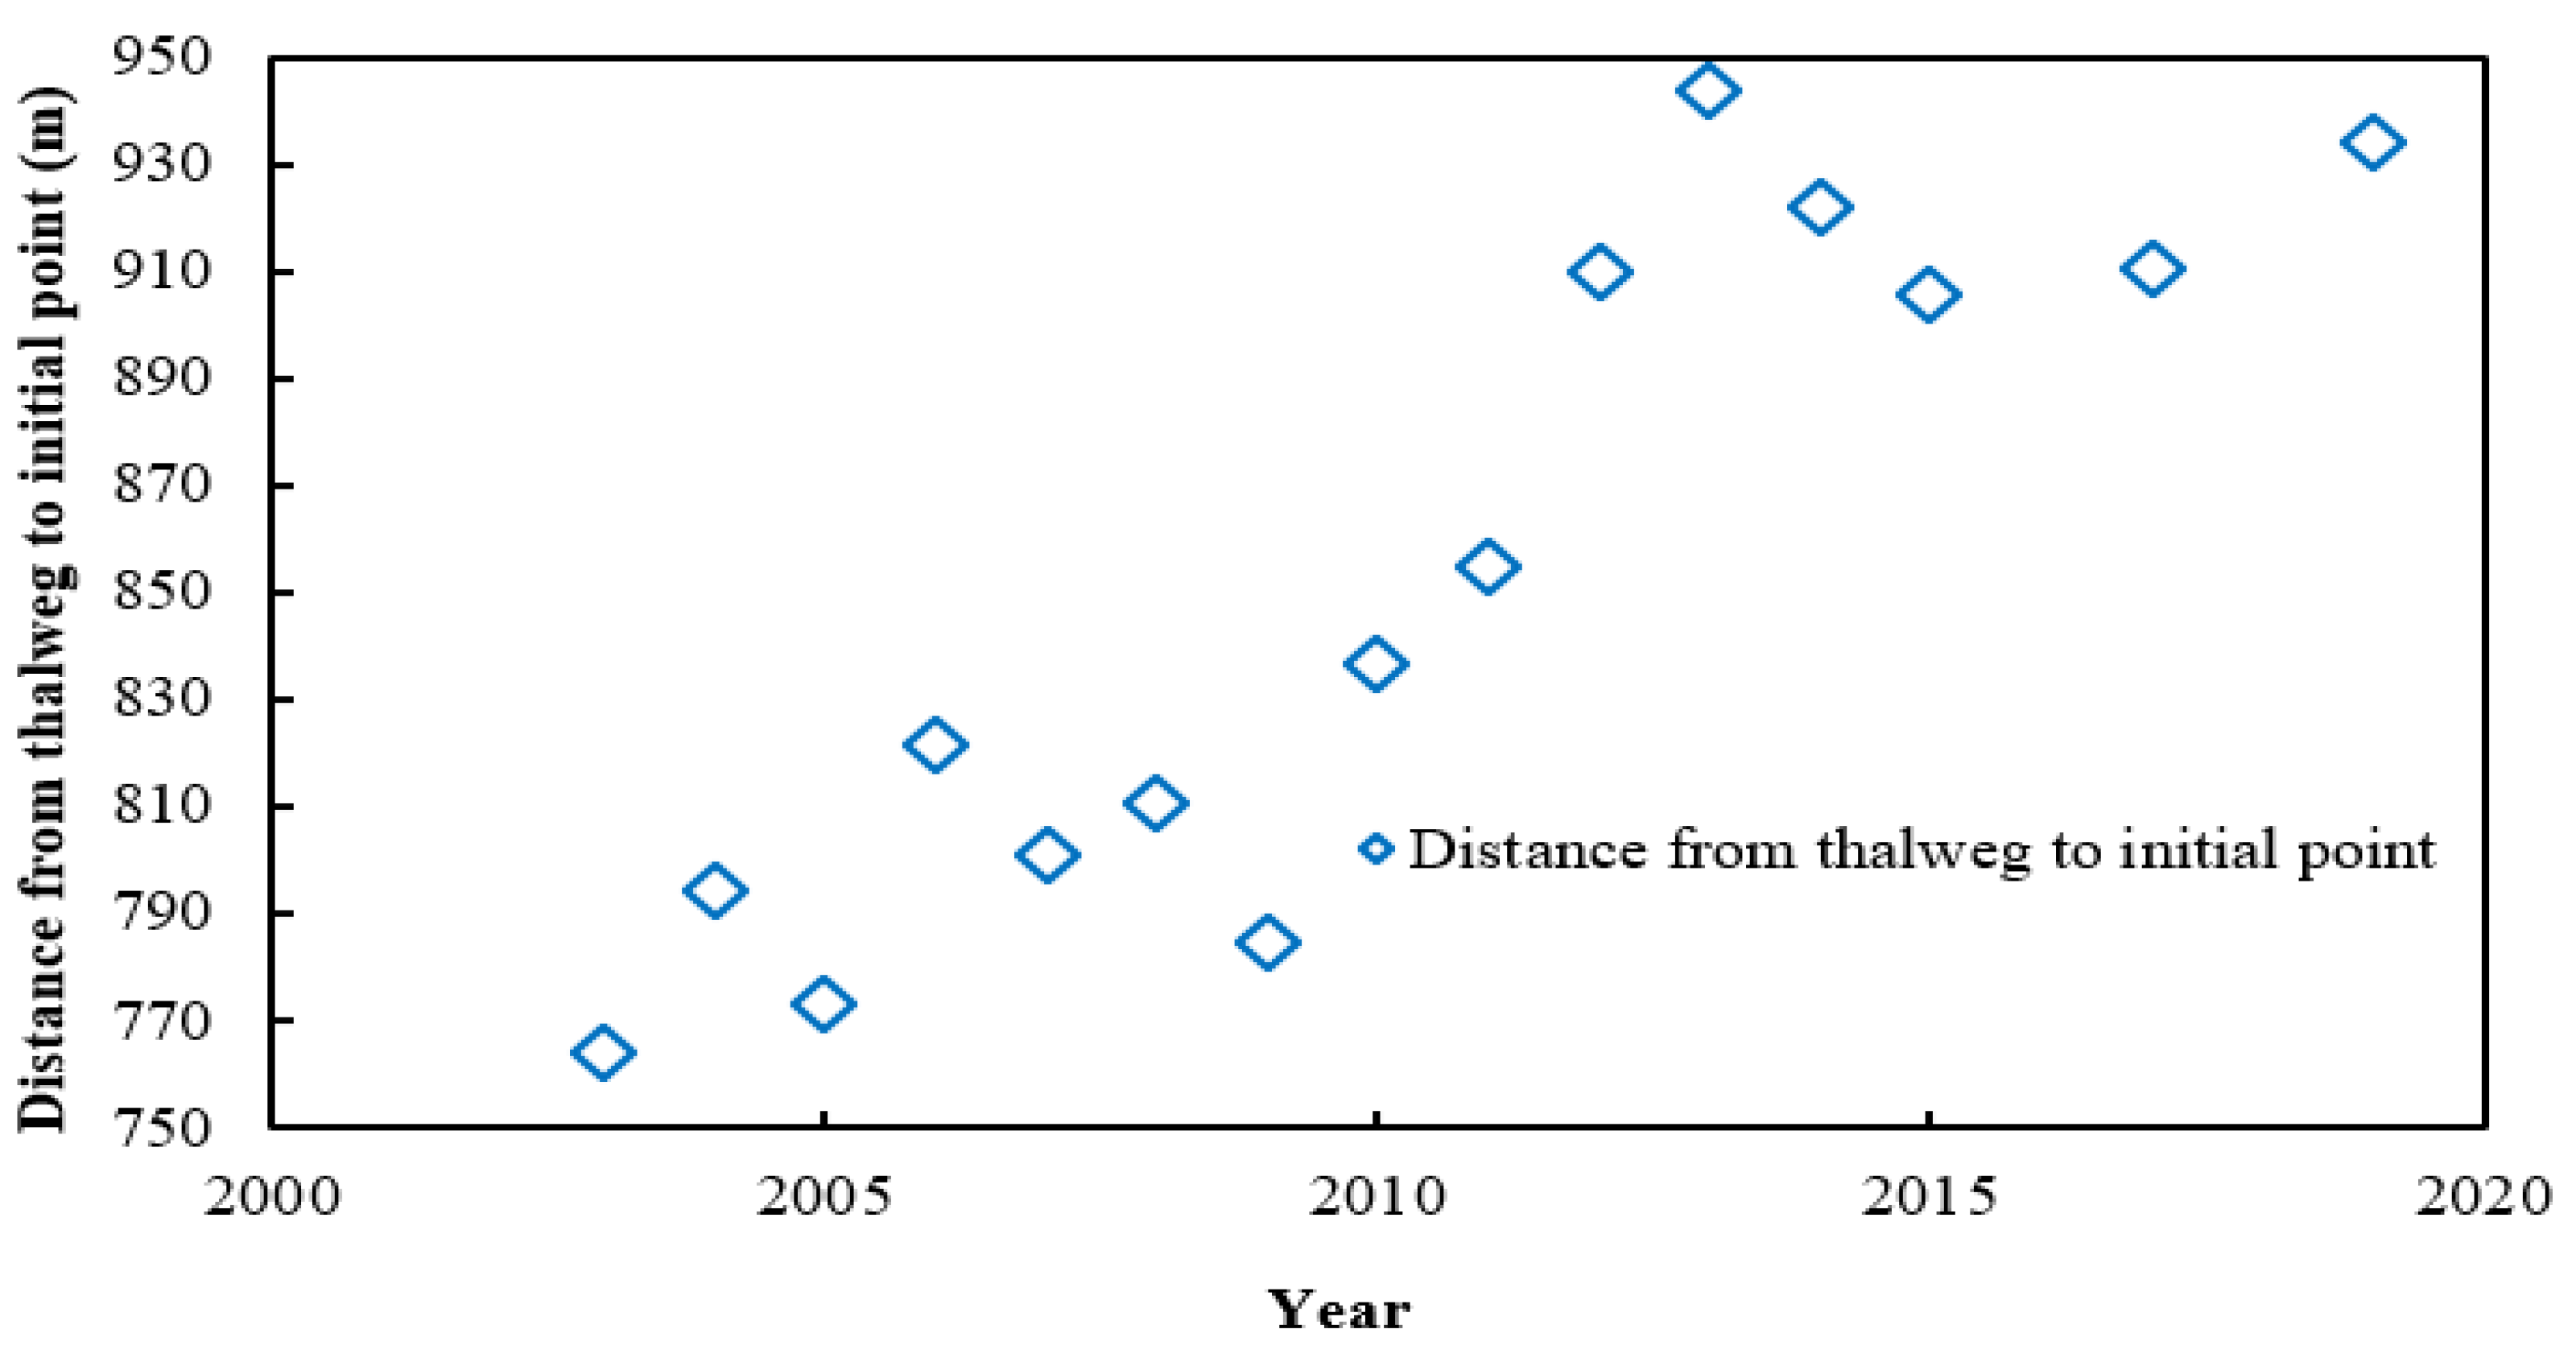
4.2.2. Variation in Lateral Channel Stability
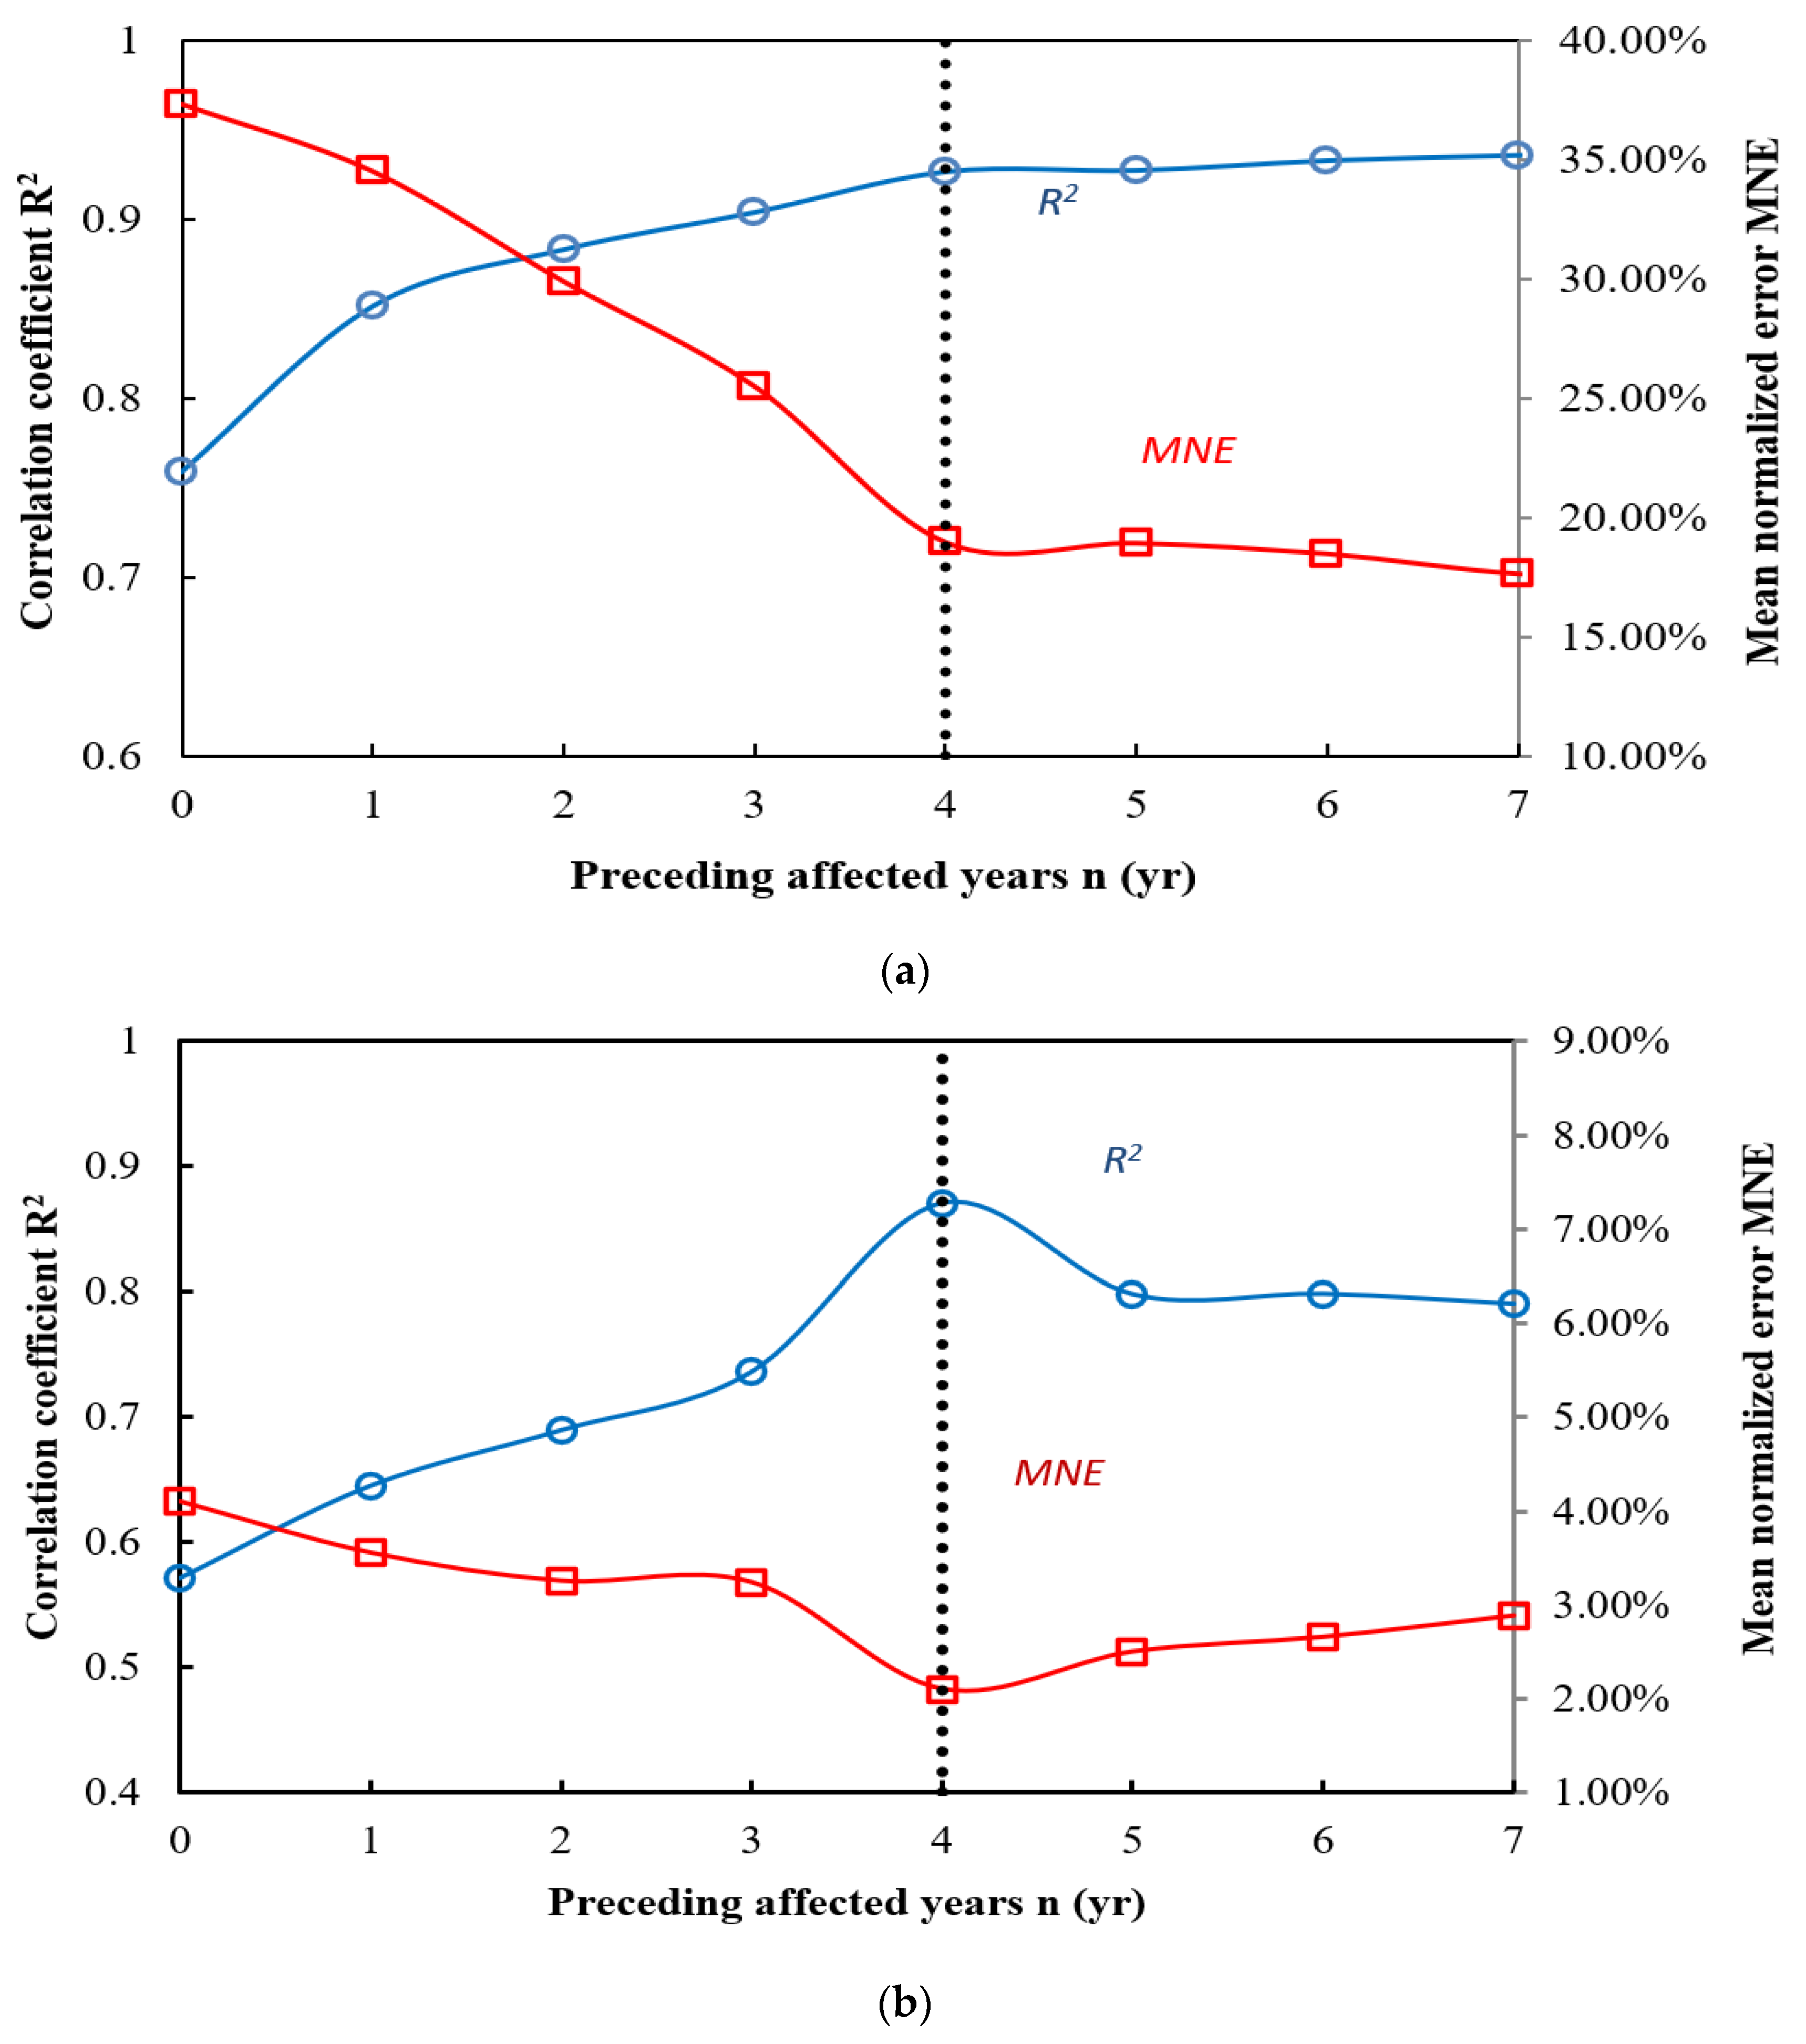
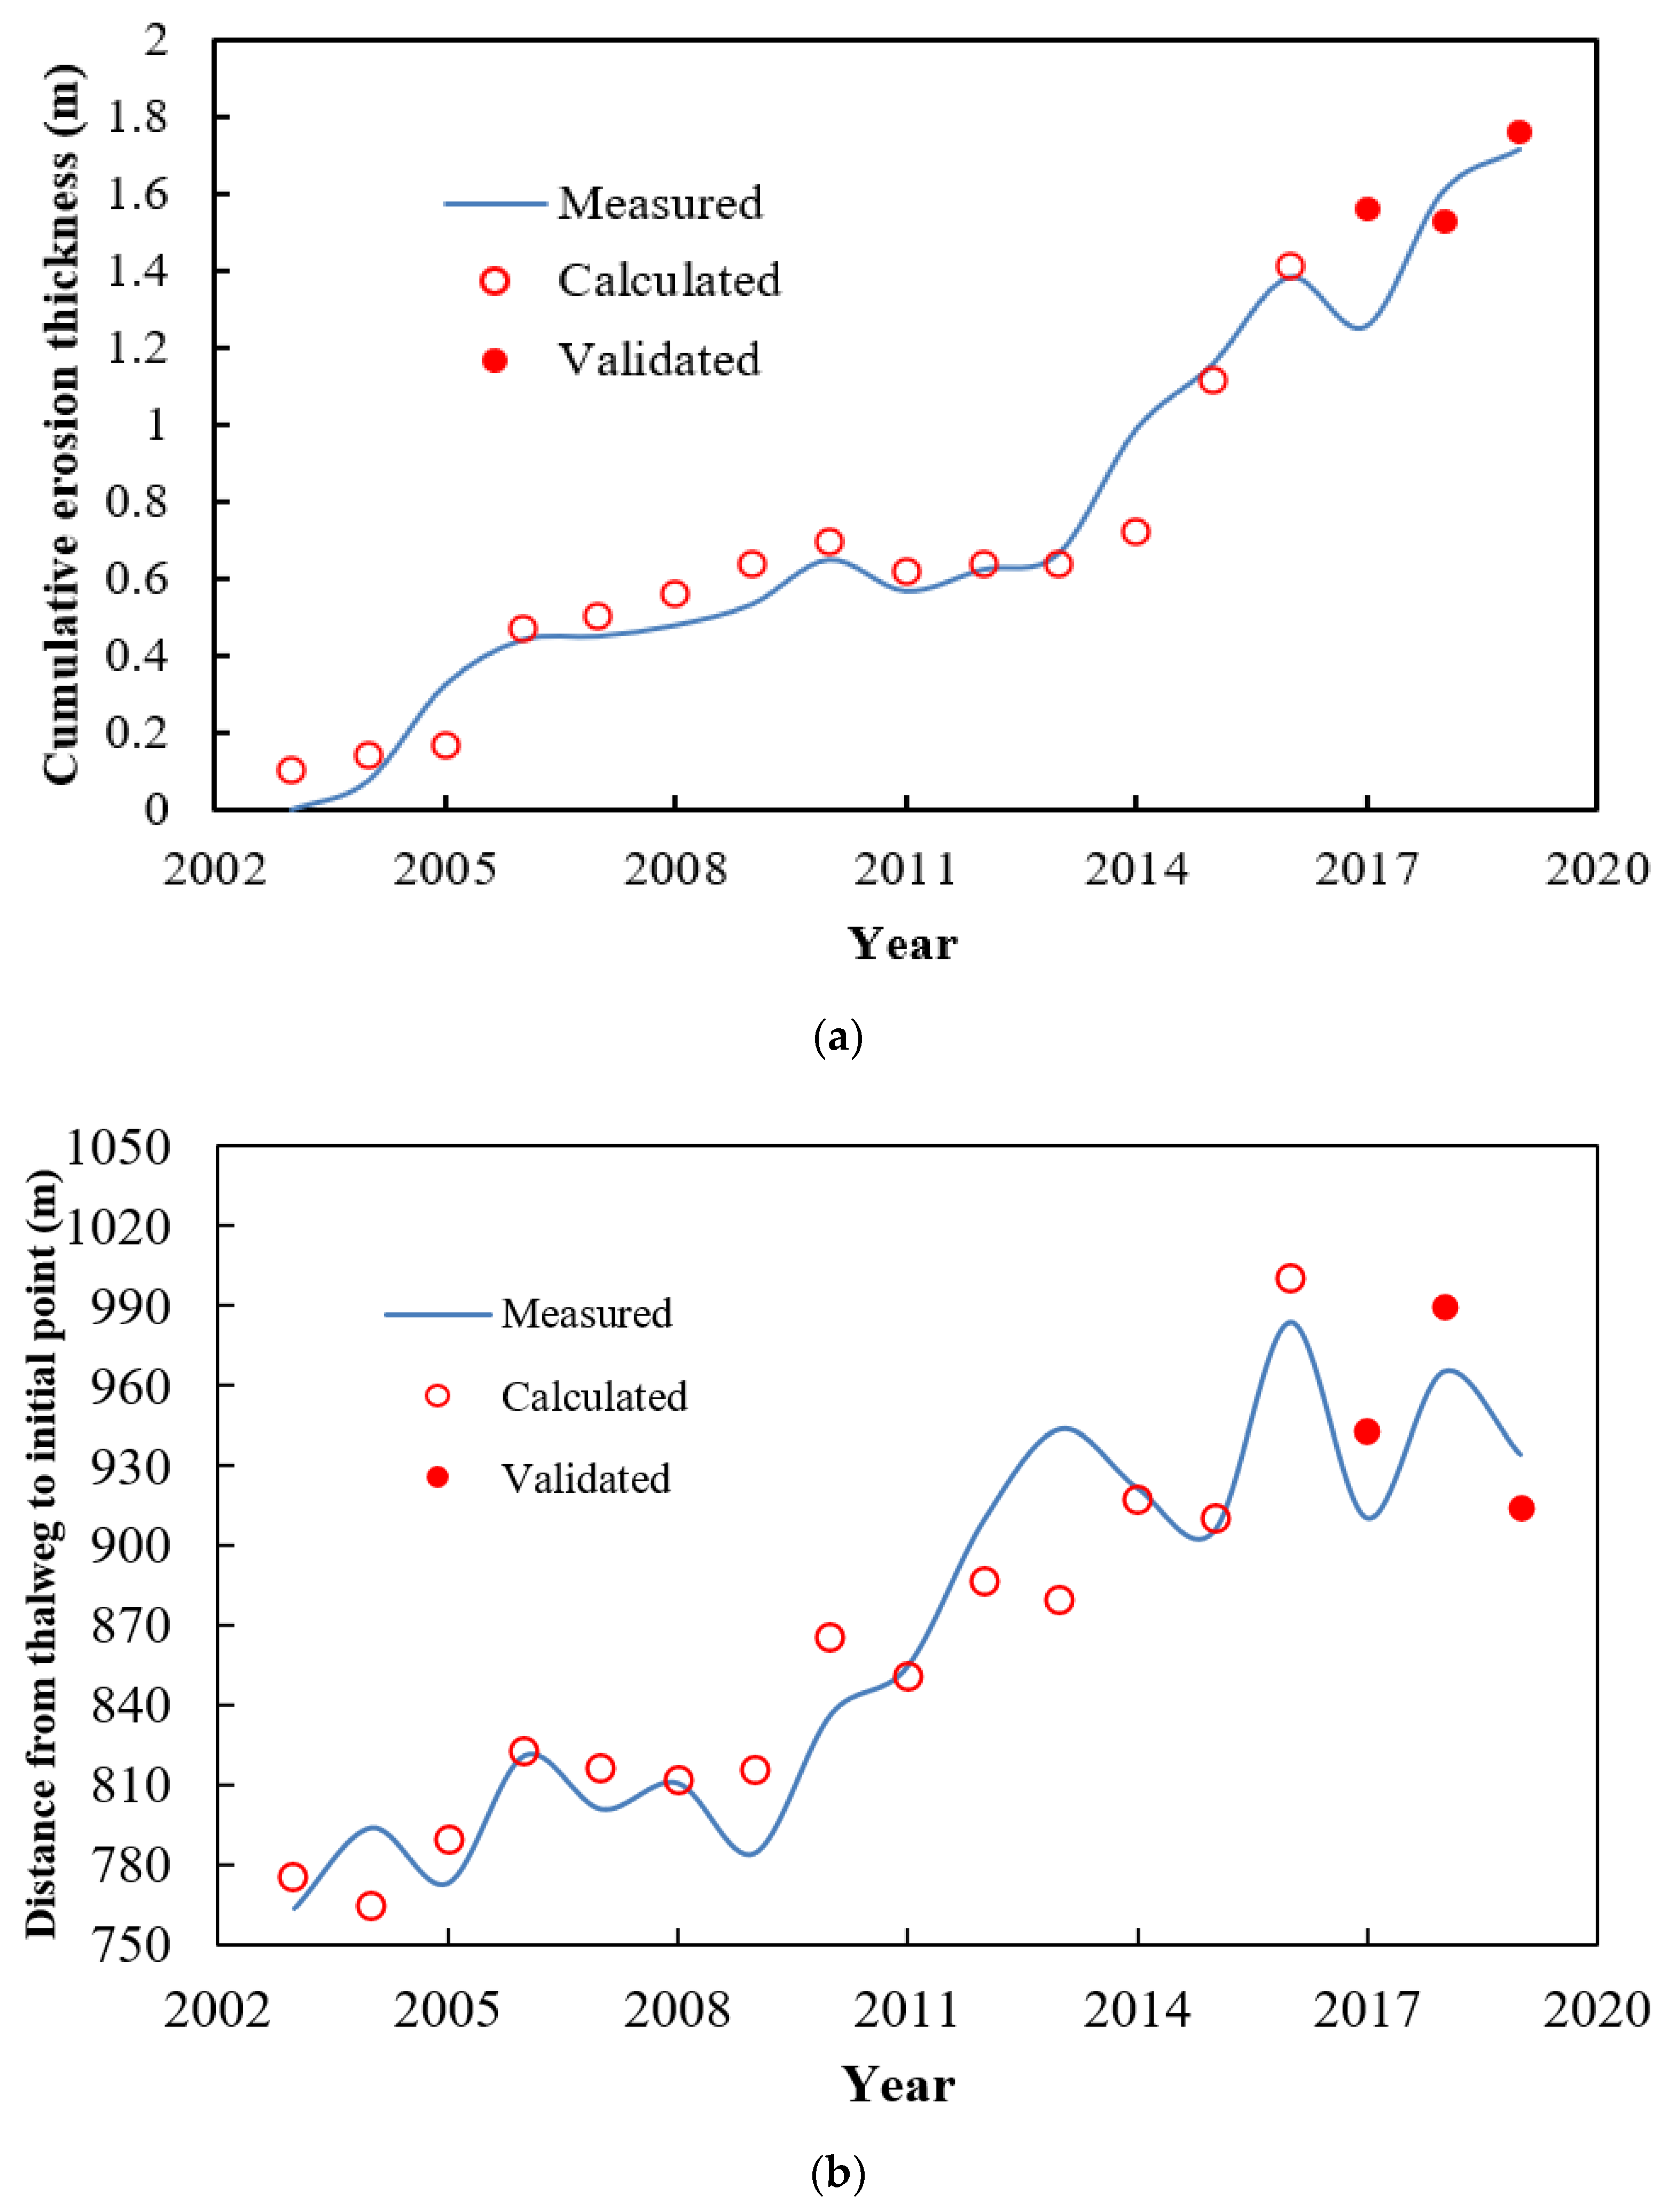
4.3. Simulations of Channel Stability Indexes Based on the Improved DRM
5. Discussion
6. Conclusions
Author Contributions
Funding
Data Availability Statement
Acknowledgments
Conflicts of Interest
References
- Best, J. Anthropogenic stresses on the world’s big rivers. Nat. Geosci. 2019, 12, 7–21. [Google Scholar] [CrossRef]
- Lai, X.; Yin, D.; Finlayson, B.L.; Wei, T.; Li, M.; Yuan, W.; Yang, S.; Dai, Z.; Gao, S.; Chen, Z. Will river erosion below the three gorges dam stop in the middle Yangtze? J. Hydrol. 2017, 554, 24–31. [Google Scholar] [CrossRef]
- Li, N.; Lu, X.X.; Chen, L.; Wasson, R. Downstream geomorphic impact of the Three Gorges Dam: With special reference to the channel bars in the Middle Yangtze River. Earth Surf. Process. Landforms 2019, 44, 2660–2670. [Google Scholar] [CrossRef]
- Begin, Z. The relationship between flow-shear stress and stream pattern. J. Hydrol. 1981, 52, 307–319. [Google Scholar] [CrossRef]
- Chen, N. Changes in river regime after the construction of upstream reservoirs. Earth Surf. Process. Landf. 1985, 10, 143–159. [Google Scholar] [CrossRef]
- Lyu, Y.; Zheng, S.; Tan, G.; Shu, C. Effects of Three Gorges Dam operation on spatial distribution and evolution of channel thalweg in the Yichang-Chenglingji Reach of the Middle Yangtze River, China. J. Hydrol. 2018, 565, 429–442. [Google Scholar] [CrossRef]
- Gierszewski, P.J.; Habel, M.; Szmańda, J.B.; Luc, M. Evaluating effects of dam operation on flow regimes and riverbed adaptation to those changes. Sci. Total Environ. 2019, 710, 136202. [Google Scholar] [CrossRef]
- Gilvear, D.J. Patterns of channel adjustment to impoundment of the upper River Spey, Scotland (1942-2000). River Res. Appl. 2004, 20, 151–165. [Google Scholar] [CrossRef]
- Wu, B.; Zheng, S.; Thorne, C. A general framework for using the rate law to simulate morphological response to disturbance in the fluvial system. Prog. Phys. Geogr. Earth Environ. 2012, 36, 575–597. [Google Scholar] [CrossRef]
- Liang, Z.Y.; Yang, L.F.; Feng, P.L. Relations of channel geometry to water and sediment rate for the lower Yellow River. J. Hydroelectr. Eng. 2005, 24, 68–71. (In Chinese) [Google Scholar]
- Xia, J.; Li, X.; Zhang, X.; Li, T. Recent variation in reach-scale bankfull discharge in the Lower Yellow River. Earth Surf. Process. Landforms 2014, 39, 723–734. [Google Scholar] [CrossRef]
- Graf, W.L. The rate law in fluvial geomorphology. Am. J. Sci. 1977, 277, 178–191. [Google Scholar] [CrossRef]
- Wu, B.; Li, L. Delayed response model for bankfull discharge predictions in the Yellow River. Int. J. Sediment Res. 2011, 26, 445–459. [Google Scholar] [CrossRef]
- Zheng, S.; Wu, B.; Thorne, C.; Simon, A. Morphological evolution of the North Fork Toutle River following the eruption of Mount St. Helens, Washington. Geomorphology 2013, 208, 102–116. [Google Scholar] [CrossRef]
- Zheng, S.; Wu, B.; Wang, K.; Tan, G.; Han, S.; Thorne, C.R. Evolution of the Yellow River delta, China: Impacts of channel avulsion and progradation. Int. J. Sediment Res. 2017, 32, 34–44. [Google Scholar] [CrossRef]
- Zheng, S.; Han, S.; Tan, G.; Xia, J.; Wu, B.; Wang, K.; Edmonds, D.A. Morphological adjustment of the Qingshuigou channel on the Yellow River Delta and factors controlling its avulsion. Catena 2018, 166, 44–55. [Google Scholar] [CrossRef]
- Zhang, Y.C.; Li, L.Y.; Fan, B.L.; Zheng, S. Delayed Response of Cross Section Area to Variable Incoming Flow and Sediment at Shashi Segment of Yangtze River. J. Yangtze River Sci. Res. Inst. 2016, 33, 1–5. (In Chinese) [Google Scholar]
- Lyu, Y.; Zheng, S.; Tan, G.; Shu, C.; Han, Q. Morphodynamic adjustments in the Yichang–Chenglingji Reach of the Middle Yangtze River since the operation of the Three Gorges Project. Catena 2019, 172, 274–284. [Google Scholar] [CrossRef]
- Tang, X.Y.; Tong, S.C.; Xu, G.X.; Huang, G.X.; Wang, T. Delayed response of sedimentation in the flood seasons to the pool level of the Three Gorges Reservoir. J. Adv. Water Sci. 2019, 30, 528–536. (In Chinese) [Google Scholar]
- Lyu, Y.; Fagherazzi, S.; Tan, G.; Zheng, S.; Feng, Z.; Han, S.; Shu, C. Hydrodynamic and geomorphic adjustments of channel bars in the Yichang-Chenglingji Reach of the Middle Yangtze River in response to the Three Gorges Dam operation. Catena 2020, 193, 104628. [Google Scholar] [CrossRef]
- Park, C.C. World-wide variations in hydraulic geometry exponents of stream channels: An analysis and some observations—Reply. J. Hydrol. 1978, 39, 199–202. [Google Scholar] [CrossRef]
- James, L.A. Incision and morphologic evolution of an alluvial channel recovering from hydraulic mining sediment. Geol. Soc. Am. Bull. 1991, 103, 723–736. [Google Scholar] [CrossRef]
- Lawler, D.M.; Grove, J.R.; Couperthwaite, J.S.; Leeks, G.J.L. Downstream change in river bank erosion rates in the Swale-Ouse system, northern England. Hydrol. Process. 1999, 13, 977–992. [Google Scholar] [CrossRef]
- Lee, J.-S.; Julien, P.Y. Downstream Hydraulic Geometry of Alluvial Channels. J. Hydraul. Eng. 2006, 132, 1347–1352. [Google Scholar] [CrossRef] [Green Version]
- He, L.; Wilkerson, G.V. Improved Bankfull Channel Geometry Prediction Using Two-Year Return-Period Discharge1. JAWRA J. Am. Water Resour. Assoc. 2011, 47, 1298–1316. [Google Scholar] [CrossRef]
- Huang, H.Q.; Deng, C.; Nanson, G.C.; Fan, B.; Liu, X.; Liu, T.; Ma, Y. A test of equilibrium theory and a demonstration of its practical application for predicting the morphodynamics of the Yangtze River. Earth Surf. Process. Landforms 2013, 39, 669–675. [Google Scholar] [CrossRef]
- Liu, X.; Huang, H.Q.; Nanson, G.C. The morphometric variation of islands in the middle and lower Yangtze River: A variational analytical explanation. Geomorphology 2016, 261, 273–281. [Google Scholar] [CrossRef]
- Hadadin, N. Variation in hydraulic geometry for stable versus incised streams in the Yazoo River basin–USA. Int. J. Sediment Res. 2017, 32, 121–126. [Google Scholar] [CrossRef]
- Franzoia, M.; Nones, M. Morphological reactions of schematic alluvial rivers: Long simulations with a 0-D model. Int. J. Sediment Res. 2017, 32, 295–304. [Google Scholar] [CrossRef]
- Harrison, L.R.; Legleiter, C.J.; Wydzga, M.A.; Dunne, T. Channel dynamics and habitat development in a meandering, gravel bed river. Water Resour. Res. 2011, 47. [Google Scholar] [CrossRef] [Green Version]
- Tian, S.; Wang, W.; Xie, B.; Zhang, M. Fluvial processes of the downstream reaches of the reservoirs in the Lower Yellow River. J. Geogr. Sci. 2016, 26, 1321–1336. [Google Scholar] [CrossRef]
- Wyżga, B.; Oglęcki, P.; Hajdukiewicz, H.; Zawiejska, J.; Radecki-Pawlik, A.; Skalski, T.; Mikus, P. Interpretation of the invertebrate-based BMWP-PL index in a gravel-bed river: Insight from the Polish Carpathians. Hydrobiologia 2013, 712, 71–88. [Google Scholar] [CrossRef]
- Xia, J.; Zhou, M.; Lin, F.; Deng, S.; Lu, J. Variation in reach-scale bankfull discharge of the Jingjiang Reach undergoing upstream and downstream boundary controls. J. Hydrol. 2017, 547, 534–543. [Google Scholar] [CrossRef]
- Zheng, S.; Wu, B.S.; Hou, S.Z.; Lyu, Y.W. Spatial and temporal erosion and deposition processes and the delayed response of the Sanmenxia reservoir. J. Hydraul. Eng. 2019, 50, 1433–1445. (In Chinese) [Google Scholar]
- Li, G.Y. Effect of Corliolis force on morphology evolution of Yellow River. J. Hydraul. Eng. 2007, 38, 1409–1413. (In Chinese) [Google Scholar]
- Li, J.; Xia, J.; Zhou, M.; Deng, S.; Zhang, X. Variation in reach-scale thalweg migration intensity in a braided reach of the lower Yellow River in 1986–2015. Earth Surf. Process. Landf. 2017, 42, 1952–1962. [Google Scholar] [CrossRef]
- Xia, J.Q.; Deng, S.S.; Lu, J.Y.; Xu, Q.X.; Zong, Q.L. Dynamic channel adjustments in the Jingjiang Reach of the Middle Yangtze River. Sci. Rep. 2016, 6, 22802. [Google Scholar] [CrossRef]


| Channel Reach | Start and End Points | Channel Type | Channel Length (km) | Maximal/Minimal Spacing between Two Sections (km) |
|---|---|---|---|---|
| Upper sub-reach | Shamao Mountain–Sheshan | Straight braided channel | 35.0 | 2.32/0.62 |
| Lower sub-reach | Sheshan–Yangluo | Slightly curved braided channel | 35.3 | 2.82/0.83 |
| Data Type | Station (Location) | Period of Record | Sources |
|---|---|---|---|
| Monthly discharge | Hankou Hydrological Station | 1954–2019 | CWRC |
| Monthly water level | Hankou Hydrological Station | 1954–2019 | CWRC |
| Monthly sediment concentration | Hankou Hydrological Station | 1954–2019 | CWRC |
| Monthly suspended sediment gradation | Hankou Hydrological Station | 1954–2019 | CWRC |
| Surveyed profiles | 57 fixed cross-sections within the Wuhan reach | 2003–2019 | CWRC |
| Period | Runoff (108 m3) | Sediment Discharge (108 kg) | ||||
|---|---|---|---|---|---|---|
| Total Annual Average | Annual Average in Flood Season | Proportion of Flood Season (%) | Total Annual Average | Annual Average in Flood Season | Proportion of Flood Season (%) | |
| 1954~2002 | 7147 | 5247 | 73.4 | 39,670 | 34,820 | 87.8 |
| 2003~2006 | 6734 | 4763 | 70.7 | 13,320 | 11,580 | 86.9 |
| 2007~2008 | 6589 | 4618 | 70.1 | 10,750 | 9077 | 84.4 |
| 2009~2019 | 6892 | 4692 | 68.1 | 9578 | 7664 | 80.0 |
| Indexes | K | a | b | β | R2 | MNE | p |
|---|---|---|---|---|---|---|---|
| Cumulative erosion | 0.003 | 0.08 | 2.17 | 0.14 | 0.93 | 19% | |
| Distance from thalweg to initial point | 0.09 | 1.10 | 0.43 | 0.01 | 0.87 | 2.1% |
 |
Publisher’s Note: MDPI stays neutral with regard to jurisdictional claims in published maps and institutional affiliations. |
© 2021 by the authors. Licensee MDPI, Basel, Switzerland. This article is an open access article distributed under the terms and conditions of the Creative Commons Attribution (CC BY) license (https://creativecommons.org/licenses/by/4.0/).
Share and Cite
Yin, Z.; Zhang, H.; Tan, G.; Lyu, Y.; Feng, Z.; Shu, C.; Wang, J.; Zhang, G. Operating Effects of the Three Gorges Reservoir on the Riverbed Stability in the Wuhan Reach of the Yangtze River. Water 2021, 13, 3353. https://doi.org/10.3390/w13233353
Yin Z, Zhang H, Tan G, Lyu Y, Feng Z, Shu C, Wang J, Zhang G. Operating Effects of the Three Gorges Reservoir on the Riverbed Stability in the Wuhan Reach of the Yangtze River. Water. 2021; 13(23):3353. https://doi.org/10.3390/w13233353
Chicago/Turabian StyleYin, Zhi, Hongbin Zhang, Guangming Tan, Yiwei Lyu, Zhiyong Feng, Caiwen Shu, Jingwen Wang, and Guangyue Zhang. 2021. "Operating Effects of the Three Gorges Reservoir on the Riverbed Stability in the Wuhan Reach of the Yangtze River" Water 13, no. 23: 3353. https://doi.org/10.3390/w13233353