Article

Enhanced Sediment Denitrification for Nitrogen Removal by Manipulating Water Level in the Lakeshore Zone

1
Jiangsu Collaborative Innovation Center of Atmospheric Environment and Equipment Technologies, Jiangsu Key Laboratory of Atmospheric Environmental Monitoring & Pollution Control, School of Environmental Science and Engineering, Nanjing University of Information Science and Technology, Nanjing 210044, China
2
Power China Huadong Engineering Corporation Limited, Hangzhou 311122, China
3
Key Laboratory of Coastal Environmental and Resources Research of Zhejiang Province, School of Engineering, Westlake University, Hangzhou 320024, China
4
State Key Laboratory of Environmental Aquatic Chemistry, Research Center for Eco-Environmental Sciences, Chinese Academy of Sciences, Beijing 100085, China
*
Author to whom correspondence should be addressed.
Water 2021, 13(23), 3323; https://doi.org/10.3390/w13233323
Submission received: 21 October 2021 / Accepted: 20 November 2021 / Published: 23 November 2021

Abstract

:
Denitrification of sediments is an important way to remove reactive nitrogen in lakeshore zones. In this work, we analyzed sediment denitrification patterns across the shore zone of Lake Taihu and explored their underlying mechanisms using flooding simulation experiments. The results showed that denitrification mainly occurred in the upper sediment layer (0–10 cm) and the denitrification rate was highest at the land–water interface (6.2 mg N/m2h), where there was a frequent rise and fall in the water level. Denitrification was weaker in the lakebed sediments (4.6 mg N/m2h), which were inundated long-term, and in the sediments of the near-shore zone (2.3 mg N/m2h), which were dried out for extended periods. Flooding simulation experiments further indicated a strong positive relationship between sediment denitrification rate and flooding frequency. When the flooding occurred once every 3, 6, 9, 12, or 15 days, the denitrification rate reached 7.6, 5.7, 2.8, 0.9, and 0.6 mg N/m2h, respectively. Frequent flooding caused alternating anoxic and aerobic conditions in sediments, accelerating nitrogen substrate supply and promoting the growth and activity of denitrifying bacteria. Based on these findings, we propose a possible strategy for enhancing sediment denitrification by manipulating the water level, which can help guide nitrogen removal in lakeshore zones.

1. Introduction

Nitrogen is vital to the functioning of aquatic ecosystems, yet can be extremely detrimental in excess because it can lead to algal blooms, drinking water contamination, reduced biodiversity, and lake hypoxia or anoxia [1,2]. Nitrogen control is therefore an essential issue for the mitigation of lake eutrophication [3]. The lakeshore zone is an ecological transition zone between lacustrine and terrestrial ecosystems [4,5,6]. It is a protective barrier for lakes, functioning as a buffer to intercept runoff pollutants, and hosting various physical, chemical, and biological reactions that remove pollutants for pollution load reduction and lake water quality improvement [7,8,9,10]. Denitrification, a process of permanent nitrogen removal by converting nitrate to nitrogen gas under anaerobic conditions, is one of the main nitrogen removal mechanisms in lakeshore sediments [11,12,13,14].
Redox is the key factor influencing denitrification, as most denitrifying bacteria are facultative heterotrophic anaerobes [15,16]. Under oxygen-deficient conditions, denitrifying bacteria can grow and multiply rapidly and have high activity [17,18]. Naqvi et al. found that active denitrification mainly occurs in anoxic hypolimnia in freshwater reservoirs [19]. However, prolonged anaerobic conditions eventually inhibit denitrification. Zhu et al. [12] found that a prolonged anaerobic environment caused by the decomposition of accumulated cyanobacteria disturbed the coupled nitrification–denitrification and thereby inhibited sediment denitrification; the sediment denitrification rate decreased by 32% and 79% when the algal biomass was increased by 5- and 10-fold, respectively. Previous studies reported that alternating anoxic and aerobic environments can enhance denitrification by coupling with nitrification [20]. Kessler et al. [21] found that bed form celerity influenced denitrification rates by increasing the coupling of nitrification and denitrification in hyporheic zones of permeable sediments. In lake ecosystems, water level fluctuation can cause frequent flooding in shore zones [20], which can potentially cause alternating aerobic and anoxic environments and thereby affect sediment denitrification. However, the spatial characteristics of sediment denitrification in the lakeshore zone under water level fluctuation and its relationship with water level fluctuation remain unclear.
In this study, we analyzed sediment denitrification patterns in the shore zone of Lake Taihu. We used simulation experiments to reveal the key mechanisms of the changes in sediment denitrification under water level fluctuations. This paper proposes a potential strategy for enhancing nitrogen removal in the lakeshore zone.

2. Materials and Methods
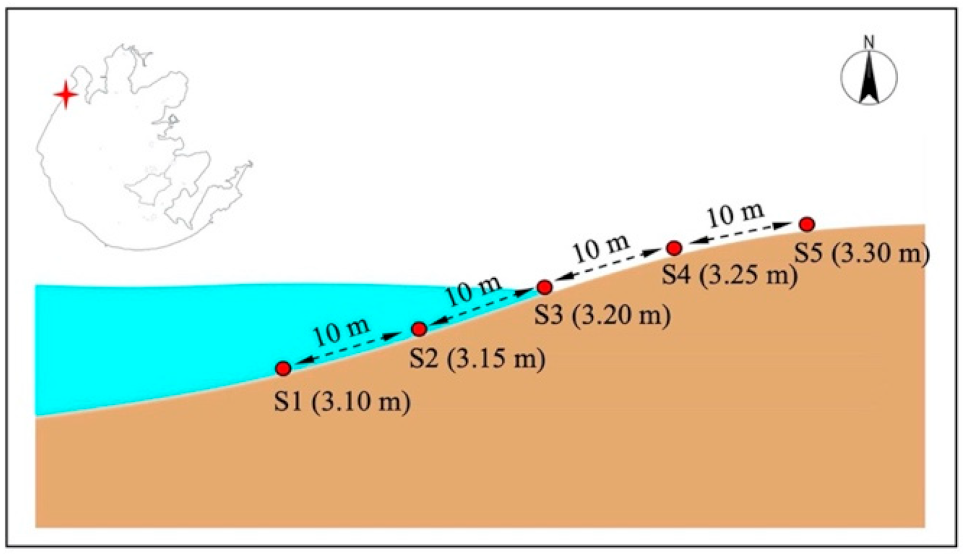
2.1. Field Sampling

The study area was the lakeshore zone in the northwest area of Lake Taihu (119°59′57″ E, 31°23′3″ N). The site is less disturbed, which is beneficial to clarifying the precise impacts of water level manipulation on sediment denitrification. Lake Taihu is the third largest freshwater lake in China, with a water area of 2338 km2. It is a typical shallow lake with an average water depth of 1.9 m and an average annual water level of 3.28 m [22,23,24,25]. The lakeshore zone of Lake Taihu is a 50–100 m circular area within the dike, with a total length of about 405 km, of which 76.2 km is located at the Meiliang Bay section, 37.7 km at the Zhushan Bay section, and 43.2 km at the Gonghu Bay section [26,27]. Past human activities, including the construction of farmland and wharfs around the lake and the excessive development of tourism, caused the shoreline zone of Lake Taihu to shrink, negatively affecting its ecological functions. In recent years, with the implementation of initiatives such as returning farmland to the lake, the lakeshore zone of Lake Taihu has been gradually restored, which has improved the self-purification capacity for improving water quality of Lake Taihu [28,29,30].
In this study, five sampling sites were set up along Zhushan Bay, including two sampling sites (S1 and S2) in the lake body area, one sampling site (S3) in the water–land intersection area, and two sampling sites (S4 and S5) in the offshore area. The sampling sites were spaced 10 m apart and were all located within the highest and lowest water levels, as shown in Figure 1. Sediment collection was carried out using a column mud collector at the submerged sampling sites and a hand shovel at the exposed terrestrial sampling sites in the lake body area, with surface sediment from 0–10 cm and bottom sediment from 45–55 cm. Sediment samples that were collected weighed approximately 30 g, of which approximately 25 g was stored at 4 °C for denitrification rate determination, and approximately 5 g was stored in freeze tubes at −80 °C for denitrifying bacterial analysis. All samples were taken in triplicate.

2.2. Incubation Experiments

To reveal the effect of the flooding cycle on sediment denitrification patterns, flooding simulation experiments were conducted. The simulation system consisted of a flooding vessel and a water storage vessel (Figure 2). The flooding vessel was a rectangular Plexiglas container with a length, width, and height of 50, 40, and 30 cm, respectively, and the water storage container was a cylindrical Plexiglas barrel (bottom diameter: 30 cm, height: 35 cm, volume: 25 L); the flooding and storage containers were connected by a peristaltic pump, and the flooding and dewatering simulations were realized by switching the water flow direction of the pump. Sediment and water in the simulated system were taken from the site S3 (Figure 1), using the surface sediment (1–10 cm) from the sampling site. Five treatment groups were set up in the simulation system, and the inundation frequency was set at once every 3, 6, 9, 12, or 15 days. For each flooding, water was first slowly pumped from the storage vessel into the flooding vessel, and water was then slowly released into the storage vessel after 12 h of flooding. Surface sediments from each group were collected after 45 days of operation to determine the denitrification rates and the abundance of denitrifying bacteria. During each experiment, water samples from the storage vessel were collected the day after each flooding to determine ammonium and nitrate. Before each analysis, the water was filtered through a GF/F membrane, and the analytical methods for ammonium and nitrate referred to the National Environmental Protection Standard of the People’s Republic of China [31].

2.3. Denitrification Rate Determination

Sediment denitrification rates were determined using the acetylene inhibition method [32,33]: 5 g of the mixed sample was accurately weighed in a 100 mL glass flask, which was filled with in situ lake water. The flask was blasted with high-purity acetylene gas for 20 m and sealed with a rubber stopper to avoid the formation of air bubbles inside the flask. After 4 h of incubation at a constant temperature of 20 °C, sheltered from light, and shaken at a rate of 70 rpm, the N2O yield was determined by the headspace equilibrium method: after accurately withdrawing 20 mL of solution from the glass flask with a 50 mL syringe, and 20 mL of high-purity nitrogen gas was aspirated to form a headspace. Following 3 m of vigorous manual shaking, the headspace gas was injected into a 12 mL vacuum flask (Labco Exetainers 839 W, Labco Limited, Lampeter, UK), returned to the laboratory at room temperature, protected from light, and measured on a gas chromatograph (7890B, Agilent, Santa Clara, CA, USA) within 24 h. The slope of the trend line for N2O was used as the sediment denitrification rate. Measurements were repeated three times for each sampling site. The acetylene inhibition method may cause an underestimation of the denitrification rate due to the incomplete blockage of N2O reduction, and the inhibition of nitrification that eliminates a possible substrate for denitrification. We think it can represent a lower bound for what could be expected in the lakeshore zone [34,35]. Moreover, denitrifiers in the raw sediments and nitrogen species in the raw water were also synchronously measured to analyze denitrification.

2.4. Denitrifying Bacterial Abundance Analysis

The sediment (0.3–0.5 g) was accurately weighed using an analytical balance, the specific weight was recorded, and DNA was extracted from the sediment using a FastDNA Power-Max Soil DNA Isolation Kit (MP Biomedical, Santa Ana, CA, USA) according to the kit operating instructions. Quantitative analysis of the functional denitrification genes nirS, nirK, and nosZ was performed by quantitative (q)-PCR using the following primers: nirS-cd3aF/nirS-R3cd, nirK-F/nirK-R, and nosZ-1F/nosZ-1R, respectively [36,37,38,39]. All q-PCR reactions were conducted in a 20 µL reaction mixture containing 0.5 μmol/L primers, 10 µL SYBR® Premix Ex Taq (QPK-201, TOYOBO, Osaka, Japan), 0.8 µL 3 mg/mL bovine serum albumin (Sigma, St Louis, MI, USA), ultrapure water, and 1 µL DNA template. The q-PCR procedure for the nirS was pre-denaturation at 95 °C for 1 min, followed by 40 cycles of denaturation at 95 °C for 25 s, annealing at 57 °C for 1 min, and extension at 72 °C for 1 min. The q-PCR procedure for nirK was pre-denaturation at 95 °C for 1 min, followed by 40 cycles of denaturation at 95 °C for 25 s, annealing at 65 °C for 30 s, and extension at 72 °C for 1 min. The q-PCR procedure for nosZ was pre-denaturation at 95 °C for 1 min, followed by 40 cycles of denaturation at 95 °C for 30 s, annealing at 60 °C for 45 s, and extension at 72 °C for 1 min. PCR amplification of all samples was performed in triplicate on a 96-well plate (HSP9665, Bio-Rad Laboratories Inc., Hercules, CA, USA) sealed with a light-transmissive sealing tape (MSB1001, Bio-Rad Laboratories Inc., Hercules, CA, USA). Three controls (no DNA) were set up on a 96-well plate for each primer pair.

2.5. Statistical Analysis

One-way analysis of variance (ANOVA) was used to test for statistical differences between bottom sediment denitrification rates and denitrification genes at different sampling sites, with the significance level set at p < 0.05. All statistical analyses were performed using SPSS software (SPSS v22.0, SPSS Inc., Chicago, IL, USA).

3. Results and Discussion

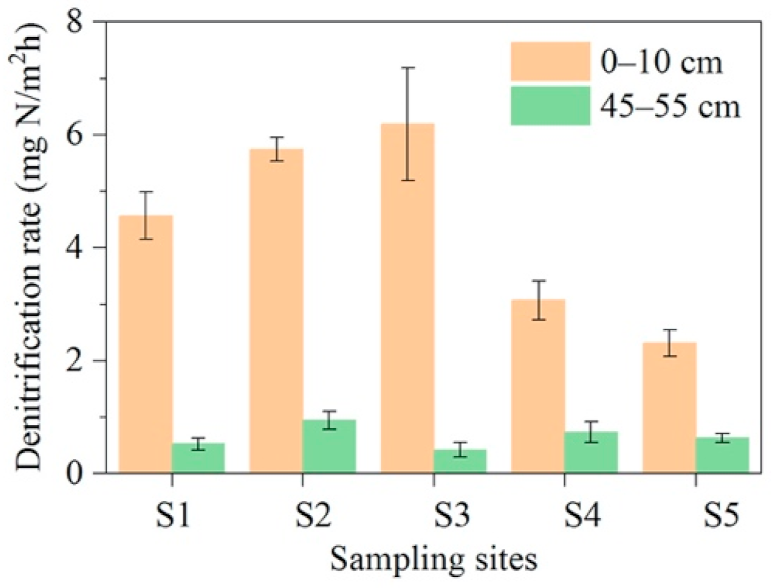
3.1. Spatial Patterns of Sediment Denitrification in the Lakeshore Zone

The denitrification in the lakeshore zone showed significant variability among water depths and water levels (Figure 3). Denitrification occurred mainly in the surface sediment (0–5 cm), where the denitrification rate was 650% higher than in the bottom sediment (50–55 cm). The denitrification rate of the bottom sediment did not differ significantly (p > 0.05) from the lake body area to the offshore area, remaining at 0.4–1.0 mg N/m2h, while the denitrification rate of the surface sediment first showed an increasing and then a decreasing trend, with the denitrification rate increasing from 4.6 mg N/m2h at the S1 in the lake body area to 6.2 mg N/m2h at the S3 in the land–water interface, and then decreasing to 2.3 mg N/m2h at the S5 in the offshore zone (Figure 3). Denitrification analysis showed that it was microbially mediated and that the abundance of denitrifying bacteria exhibited similar distribution characteristics as the denitrification rate in the lakeshore zone [40,41,42], i.e., denitrifying bacteria were abundant in the surface sediments and showed an increasing and then decreasing trend from the lacustrine zone to the offshore zone (Figure 4). The functional denitrification genes nirS, nirK, and nosZ, which encode nitric oxide reductase, nitrite reductase, and nitrous oxide reductase, respectively [32,33,34,35], maintained their abundance in the bottom sediments at 0.03 × 10⁷–0.12 × 10⁷, 0.69 × 10⁶–1.12 × 10⁶, and 0.34 × 10⁹–1.0 × 10⁹ copies/g sediment, respectively. The abundance of nirS, nirK, and nosZ in the surface sediment increased from 1.3 × 10⁷, 2.5 × 10⁶, and 1.7 × 10⁹ copies/g at the S1 in the lake body zone sediment to 4.2 × 10⁷, 3.5 × 10⁶, and 4.1 × 10⁹ copies/g sediment at the S3 in the land–water interface zone, and then decreased again to 1.8 × 10⁷, 3.2 × 10⁶, and 1.8 × 10⁹ copies/g sediment at the S5 in the offshore zone, respectively (Figure 4). Differences in the water-level direction of denitrification rates in the shore zone may be due to inundation frequency. Under the influence of water level fluctuations, local areas in the shoreline zone tended to be periodically inundated and dried out, especially in the land–water interface, while wind induced waves also caused the area to be periodically inundated. On the other hand, lake-bottom sediments (S1 and S2) were inundated for extended periods, while offshore sediments (S4 and S5) were dry for extended periods.

3.2. Sediment Denitrification under Different Simulated Flooding Frequencies

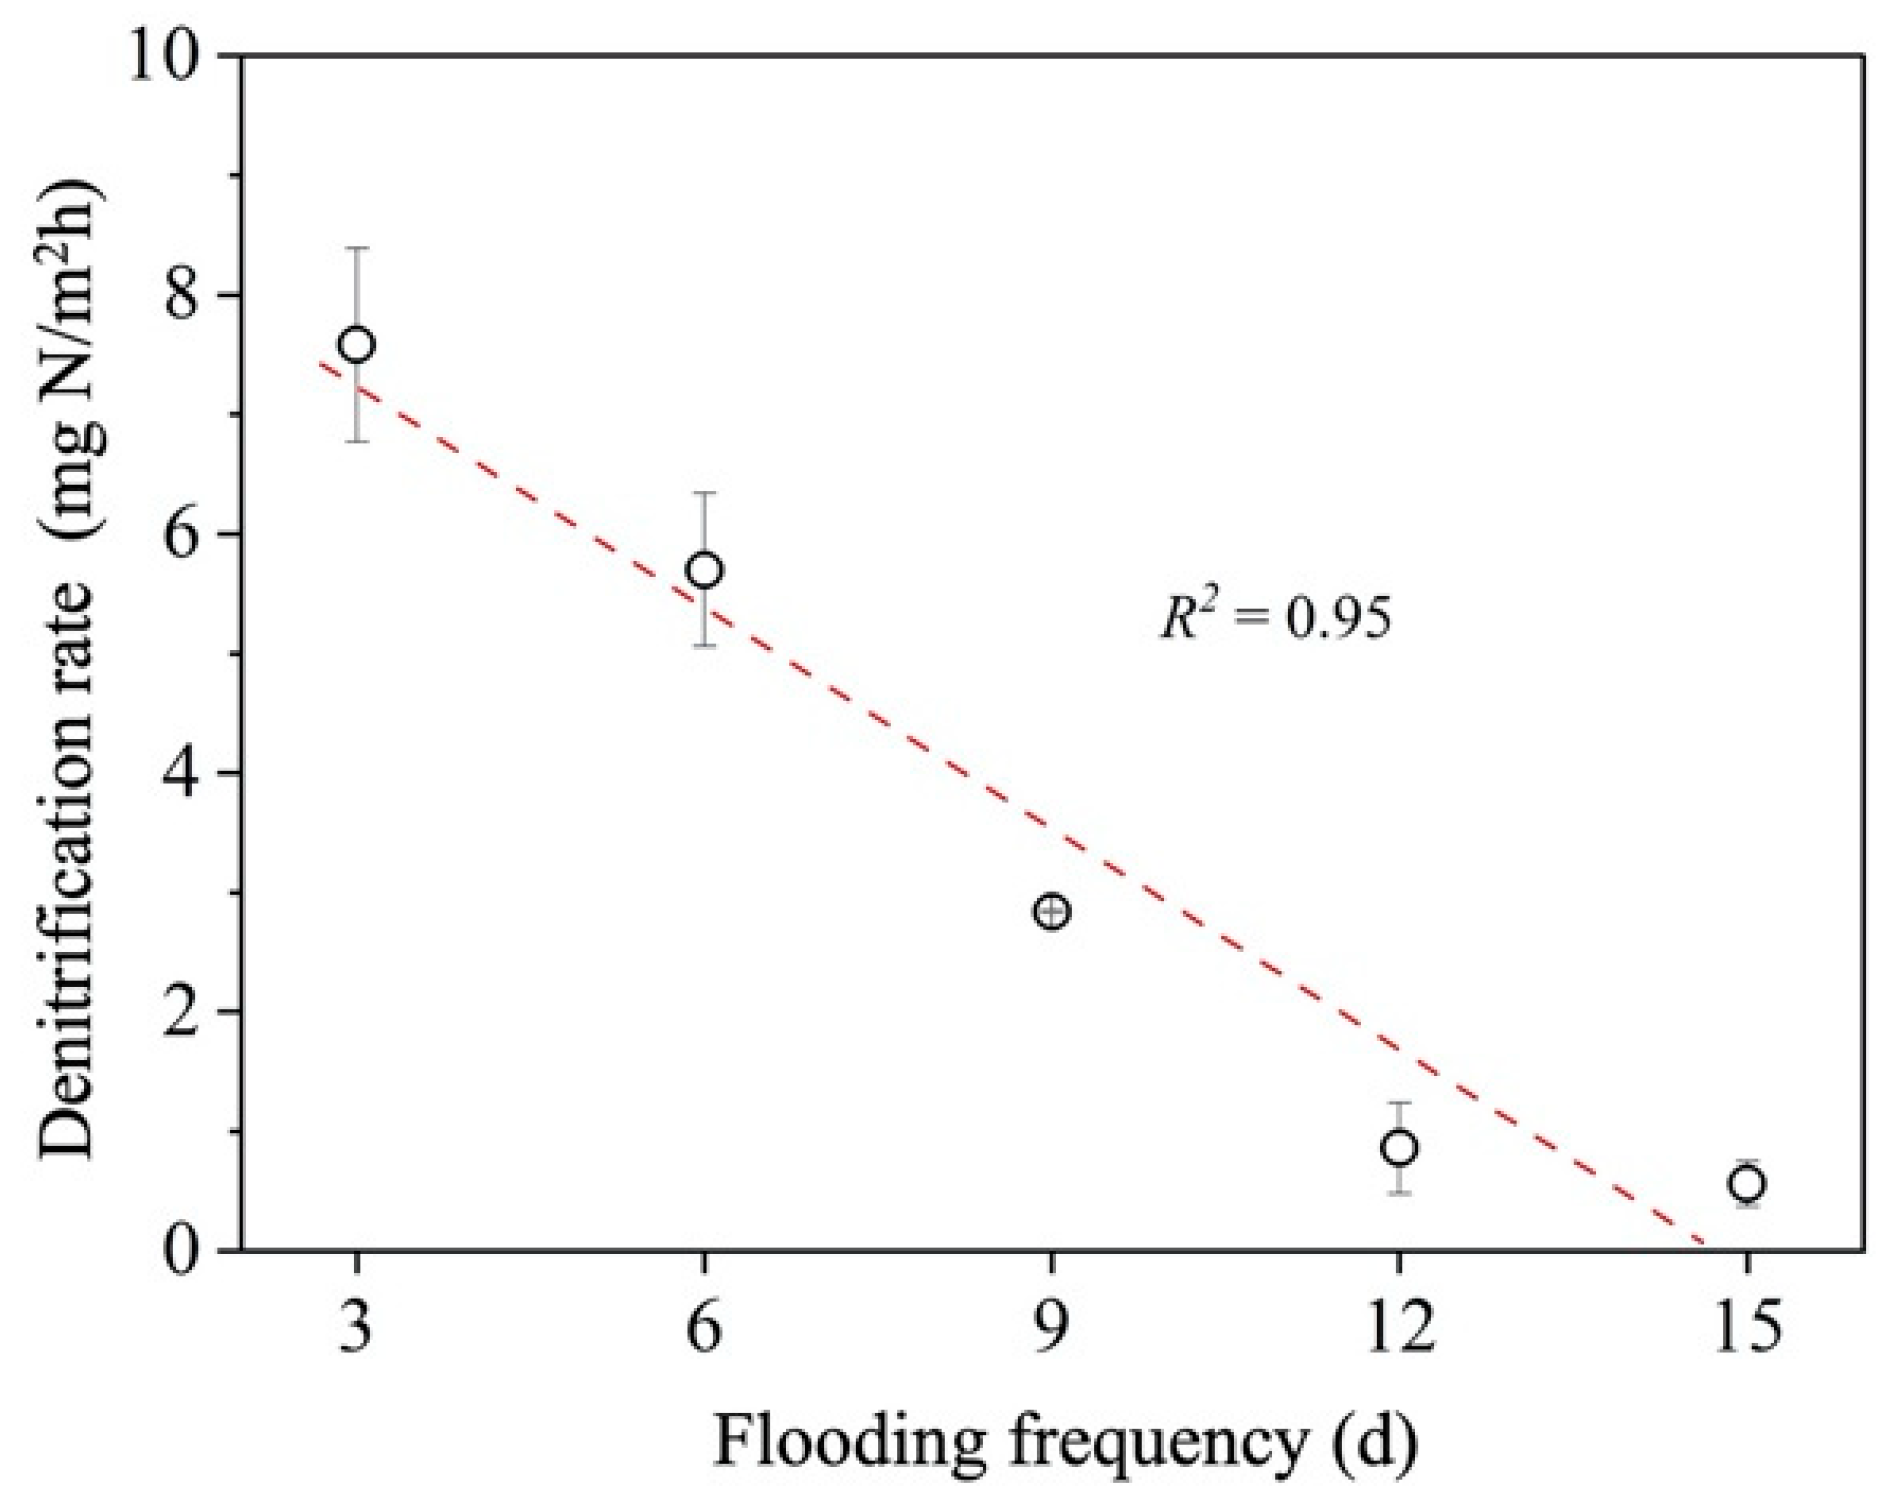
3.2.1. Sediment Denitrification Rate

The relationship between flooding frequency and denitrification rate is shown in Figure 5. There was a significant positive relationship between flooding frequency and denitrification rate (p < 0.05). This pattern supports the variation in the denitrification rate according to the water level in the lakeshore zone of Lake Taihu. Under the influence of water level fluctuations, denitrification rates were highest in the sediments of the water–land interface with the highest inundation-decay frequency, and relatively low in the lakebed sediments and offshore sediments with lower inundation-decay frequencies (Figure 5). A similar pattern was found in hydropower reservoirs. The frequent water level fluctuations enhanced the denitrification of sediments in the fallout zone due to diurnal differences in power generation and incoming and outgoing water volumes [20].

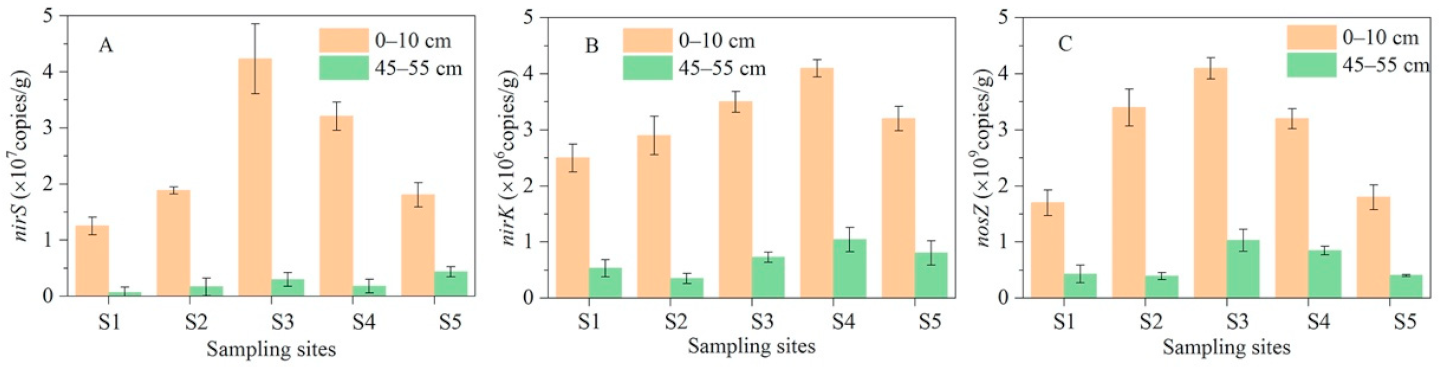
3.2.2. Abundance of Sediment-Denitrifying Bacteria

The abundances of denitrification gene nirS, nirK, and nosZ in sediment under different flooding conditions are shown in Figure 6. The abundances of these genes showed synchronous changes with the denitrification rate (Figure 4). At flooding frequencies of once every 3, 6, 9, 12, or 15 days, the nirS gene abundance was 5.4 × 10⁷, 4.7 × 10⁷, 1.2 × 10⁷, 0.8 × 10⁷, and 0.9 × 10⁷ copies/g sediment, respectively; the nirK gene abundance was 7.3 × 10⁶, 3.7 × 10⁶, 1.5 × 10⁶, 1.1 × 10⁶, and 0.8 × 10⁶ copies/g sediment, respectively; and the nosZ gene abundance was 4.3 × 10⁹, 2.7 × 10⁹, 1.5 × 10⁹, 1.0 × 10⁹ and 0.7 × 10⁹ copies/g sediment, respectively. During flooding, the sediment is often in anoxic conditions, while after drying, it shifts to aerobic conditions. Zhu et al. [43] found that the water–land intersection of lakes formed a unique anoxic-aerobic environment due to alternating flooding and drying, which was conducive to the proliferation of anaerobic ammonia-oxidizing microorganisms, promoting anaerobic ammonia-oxidative denitrification in the area. The alternating anoxic and aerobic environments promote coupled nitrification and denitrification, where nitrification provides a sufficient substrate for the denitrifying bacteria [12,20]; at the same time, frequent inundation and desiccation also facilitate the supply of nutrients for denitrifying bacteria [44,45].

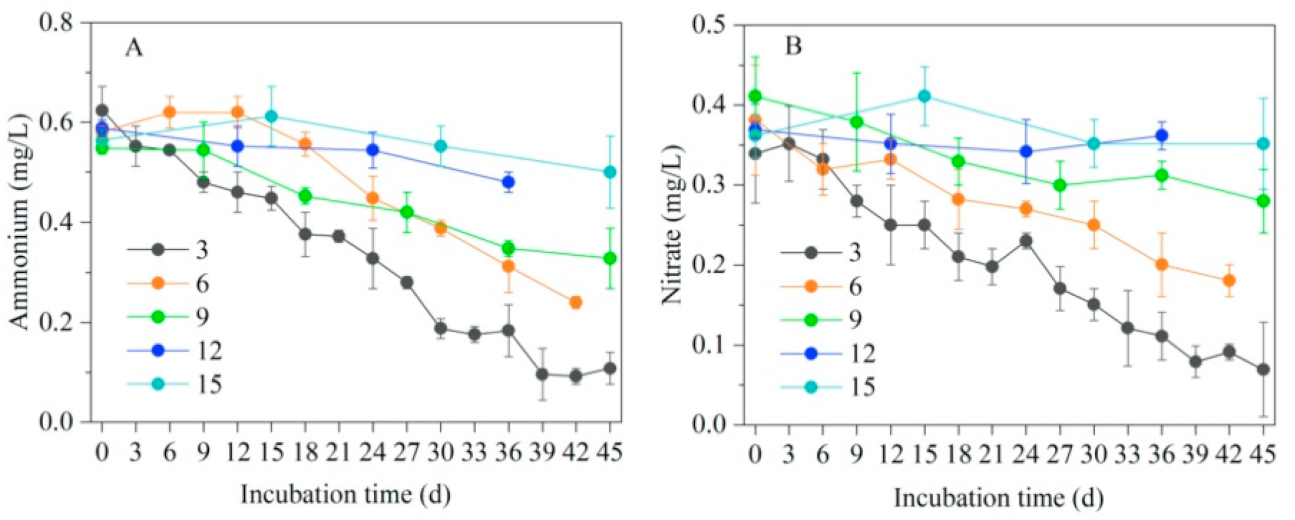
3.2.3. Nitrogen Substrates

The changing patterns of ammonium and nitrate substrates in the water column under different flooding frequencies are shown in Figure 7. Ammonium and nitrate, as substrates for denitrification, showed different patterns of change under different flooding conditions; a higher flooding frequency was associated with a stronger denitrification and a faster decline in both ammonium and nitrate. At the end of the flooding simulation experiment, the ammonium concentration in the simulated system at flooding frequencies of once every 3, 6, 9, 12, or 15 days decreased from 0.58 to 0.11, 0.24, 0.33, 0.48, and 0.50 mg/L, respectively, while the nitrate concentration decreased from 0.37 L to 0.07, 0.18, 0.28, 0.36, and 0.35 mg/L, respectively. The alternating aerobic and anoxic conditions favored denitrification, where organic nitrogen was converted to nitrate by ammonification and nitrification reactions to provide the substrate for denitrification under anoxic conditions; therefore, ammonium and nitrate showed a pattern of synchronous changes. In line with our results, Tanner et al. [46] improved the physical and chemical environment of horizontally submerged artificial wetlands by enhancing denitrification via regulated water level changes, achieving efficient removal of nitrogen from polluted water bodies.

3.3. Implications for Nitrogen Removal in the Lakeshore Zone

In lake ecosystems, the lakeshore zone plays an important role in pollution load reduction and improving water quality [28,29,47,48]. According to hydrological conditions, lakeshore zones can be classified into long-term, intermittent, and no outcrop types [49], having different nitrogen removal efficiencies based on the results of this study. In recent years, many lakeshore zones have been continuously encroached upon and destroyed, and ecological functions have been lost due to the interference of human factors such as the rapid development of large-scale lake farming and purse seine fishing. When restoring or reconstructing the lakeshore zone of eutrophic lakes, it is recommended that the water level of the lakeshore zone be artificially regulated through engineering measures to form a nitrification and denitrification hot zone, enhancing the water purification capacity by: (1) periodically pumping lake water into the lakeshore zone to create alternating flooding and drying conditions to enhance denitrification and nitrification (Figure 8); (2) modifying the slope of the lakeshore zone to create a functional denitrification and nitrification zone with the same magnitude of water level fluctuations at the lakeshore. The area of the functional zone of denitrification and nitrification in the lakeshore zone must be increased according to the water level fluctuations. However, the cementing of lakeshores may block the natural processes of nitrogen removal from sediments, which needs to be evaluated prior to practical applications.
Although increased flooding frequency can enhance sediment denitrification, it is practically impossible to achieve extremely high flooding frequency, and there might be a tipping point after which the sediment denitrification rate may be inhibited or even decreased as flooding frequency further increases. This is because sediment will be submerged for an extended period. Moreover, the alternating anoxic and aerobic environments created by manipulating the water level may change eutrophogenic factors (especially phosphorus) [50]. All these issues require additional research in the future.

4. Conclusions

In this work, we analyzed the characteristics of sediment denitrification in the lakeshore zone of Lake Taihu and revealed the relationship between denitrification rate and flooding frequency through flooding simulation experiments. Our main findings are as follows:
(1)
Denitrification of sediments in the lakeshore zone occurred mainly in the surface layer at 0–10 cm, up to 650% times more than in the sediments at 50–55 cm depth; denitrification rates in the surface sediments of the frequently flooded land–water interface were higher than those in the lake bed sediments and in the near-shore zone sediments that were left dry for extended periods, reaching 6.2, 4.6, and 2.3 mg N/m2h, respectively.
(2)
Sediment denitrification rates were significantly and positively correlated with flooding frequency (R2 = 0.95), with higher flooding frequencies resulting in stronger sediment denitrification; denitrification rates reached 7.6, 5.7, 2.8, 0.9, and 0.6 mg N/m2h at flooding frequencies of once every 3, 6, 9, 12, and 15 days, respectively.
(3)
Through water level regulation, an alternating flooding and drying process occurs in the surface sediment, creating alternating anoxic and aerobic environments conducive to the reproduction and activity of denitrifying bacteria, enhancing denitrification of sediments in the lakefront zone, and improving water quality by improving the purification capacity and reducing pollution in the lakeshore zone.

Author Contributions

Conceptualization, L.Z.; methodology, L.K. and W.S.; investigation, Y.G.; data curation, Y.G. and M.W.; writing—original draft preparation, Y.G.; writing—review and editing, H.X., J.W., W.S. and L.Z.; supervision, L.Z.; funding acquisition, W.S. and L.Z. All authors have read and agreed to the published version of the manuscript.

Funding

This research was funded by the National Natural Science Foundation of China (No. 51979171), Starting Research Fund of Nanjing University of Information Science and Technology (No. 2021r097).

Conflicts of Interest

The authors declare no conflict of interest. The funders had no role in the design of the study; in the collection, analyses, or interpretation of data; in the writing of the manuscript; or in the decision to publish the results.

References

  1. Houser, J.N.; Richardson, W.B. Nitrogen and phosphorus in the Upper Mississippi River: Transport, processing, and effects on the river ecosystem. Hydrobiologia 2010, 640, 71–88. [Google Scholar]
  2. Porter, E.M.; Bowman, W.D.; Clark, C.M.; Compton, J.E.; Pardo, L.H.; Soong, J.L. Interactive effects of anthropogenic nitrogen enrichment and climate change on terrestrial and aquatic biodiversity. Biogeochemistry 2013, 114, 93–120. [Google Scholar]
  3. Lewis, W.M., Jr.; Wurtsbaugh, W.A.; Paerl, H.W. Rationale for control of anthropogenic nitrogen and phosphorus to reduce eutrophication of inland waters. Environ. Sci. Technol. 2011, 45, 10300–10305. [Google Scholar]
  4. You, H.; Fan, H.; Xu, L.; Wu, Y.; Liu, L.; Yao, Z. Poyang lake wetland ecosystem health assessment of using the wetland landscape classification characteristics. Water 2019, 11, 825. [Google Scholar]
  5. Kröpelin, S.; Verschuren, D.; Lézine, A.-M.; Eggermont, H.; Cocquyt, C.; Francus, P.; Cazet, J.-P.; Fagot, M.; Rumes, B.; Russell, J.M. Climate-driven ecosystem succession in the Sahara: The past 6000 years. Science 2008, 320, 765–768. [Google Scholar]
  6. Roth, B.M.; Kaplan, I.C.; Sass, G.G.; Johnson, P.T.; Marburg, A.E.; Yannarell, A.C.; Havlicek, T.D.; Willis, T.V.; Turner, M.G.; Carpenter, S.R. Linking terrestrial and aquatic ecosystems: The role of woody habitat in lake food webs. Ecol. Model. 2007, 203, 439–452. [Google Scholar]
  7. Wu, H.; Li, F.; Hao, B.; Zhou, W.; Xing, W.; Liu, W.; Liu, G. Does hydrological reconnection enhance nitrogen cycling rates in the lakeshore wetlands of a eutrophic lake? Ecol. Indic. 2019, 96, 241–249. [Google Scholar]
  8. Huibin, X.B.Y.; Wenchao, M.; Xujing, W.D.G.; Liansheng, H. Study of denitrification in buffer zones of lakeshore. Chin. J. Environ. Eng. 2009, 10, 1729–1734. [Google Scholar]
  9. Yan, R.; Gao, Y.; Li, L.; Gao, J. Estimation of water environmental capacity and pollution load reduction for urban lakeside of Lake Taihu, eastern China. Ecol. Eng. 2019, 139, 105587. [Google Scholar]
  10. Chen, B.; Huang, W.; Ma, S.; Feng, M.; Liu, C.; Gu, X.; Chen, K. Characterization of chromophoric dissolved organic matter in the littoral zones of eutrophic lakes Taihu and Hongze during the algal bloom season. Water 2018, 10, 861. [Google Scholar]
  11. Pang, Y.; Wang, J.; Li, S.; Ji, G. Long-term sulfide input enhances chemoautotrophic denitrification rather than DNRA in freshwater lake sediments. Environ. Pollut. 2021, 270, 116201. [Google Scholar]
  12. Zhu, L.; Shi, W.; Van Dam, B.; Kong, L.; Yu, J.; Qin, B. Algal accumulation decreases sediment nitrogen removal by uncoupling nitrification-denitrification in shallow eutrophic lakes. Environ. Sci. Technol. 2020, 54, 6194–6201. [Google Scholar]
  13. Peura, S.; Eiler, A.; Bertilsson, S.; Nykänen, H.; Tiirola, M.; Jones, R.I. Distinct and diverse anaerobic bacterial communities in boreal lakes dominated by candidate division OD1. ISME J. 2012, 6, 1640–1652. [Google Scholar]
  14. Francis, C.A.; Beman, J.M.; Kuypers, M.M. New processes and players in the nitrogen cycle: The microbial ecology of anaerobic and archaeal ammonia oxidation. ISME J. 2007, 1, 19–27. [Google Scholar]
  15. Zhang, J.; Chai, C.-W.; ThomasArrigo, L.K.; Zhao, S.-C.; Kretzschmar, R.; Zhao, F.-J. Nitrite accumulation is required for microbial anaerobic iron oxidation, but not for arsenite oxidation, in two heterotrophic denitrifiers. Environ. Sci. Technol. 2020, 54, 4036–4045. [Google Scholar]
  16. Zhao, H.W.; Mavinic, D.S.; Oldham, W.K.; Koch, F.A. Controlling factors for simultaneous nitrification and denitrification in a two-stage intermittent aeration process treating domestic sewage. Water Res. 1999, 33, 961–970. [Google Scholar]
  17. Small, G.E.; Cotner, J.B.; Finlay, J.C.; Stark, R.A.; Sterner, R.W. Nitrogen transformations at the sediment–water interface across redox gradients in the Laurentian Great Lakes. Hydrobiologia 2014, 731, 95–108. [Google Scholar]
  18. Deutzmann, J.S.; Schink, B. Anaerobic oxidation of methane in sediments of Lake Constance, an oligotrophic freshwater lake. Appl. Environ. Microbiol. 2011, 77, 4429–4436. [Google Scholar]
  19. Naqvi, S.W.A.; Lam, P.; Narvenkar, G.; Sarkar, A.; Naik, H.; Pratihary, A.; Shenoy, D.M.; Gauns, M.; Kurian, S.; Damare, S.; et al. Methane stimulates massive nitrogen loss from freshwater reservoirs in India. Nat. Commun. 2018, 9, 1–10. [Google Scholar]
  20. Shi, W.; Chen, Q.; Zhang, J.; Zheng, F.; Liu, D.; Yi, Q.; Chen, Y. Enhanced riparian denitrification in reservoirs following hydropower production. J. Hydrol. 2020, 583, 124305. [Google Scholar]
  21. Kessler, A.J.; Cardenas, M.B.; Cook, P.L. The negligible effect of bed form migration on denitrification in hyporheic zones of permeable sediments. Journal of Geophysical Research. Biogeosciences 2015, 120, 538–548. [Google Scholar]
  22. Qin, B.; Xu, P.; Wu, Q.; Luo, L.; Zhang, Y. Environmental issues of lake Taihu, China. Hydrobiologia 2007, 581, 3–14. [Google Scholar]
  23. Wu, T.-F.; Qin, B.-Q.; Zhu, G.-W.; Zhu, M.-Y.; Wei, L.; Luan, C.-M. Modeling of turbidity dynamics caused by wind-induced waves and current in the Taihu Lake. Int. J. Sediment Res. 2013, 28, 139–148. [Google Scholar]
  24. Wenchuan, Q.; Dickman, M.; Sumin, W. Multivariate analysis of heavy metal and nutrient concentrations in sediments of Taihu Lake, China. Hydrobiologia 2001, 450, 83–89. [Google Scholar]
  25. Xiao, Q.; Zhang, M.; Hu, Z.; Gao, Y.; Hu, C.; Liu, C.; Liu, S.; Zhang, Z.; Zhao, J.; Xiao, W. Spatial variations of methane emission in a large shallow eutrophic lake in subtropical climate. J. Geophys. Res. Biogeosci. 2017, 122, 1597–1614. [Google Scholar]
  26. Zhang, Y.; Lin, S.; Qian, X.; Wang, Q.g.; Qian, Y.; Liu, J.; Ge, Y. Temporal and spatial variability of chlorophyll a concentration in Lake Taihu using MODIS time-series data. Hydrobiologia 2011, 661, 235–250. [Google Scholar]
  27. Ji, L.; Bai, Z.; Deng, L. Sorption of tetracyclines and macrolieds on different sites sediments of Taihu Lake. In Environmental Conservation, Clean Water, Air & Soil (CleanWAS); IWA Publishing: London, UK, 2017; p. 98. [Google Scholar]
  28. Hu, L.; Hu, W.; Zhai, S.; Wu, H. Effects on water quality following water transfer in Lake Taihu, China. Ecol. Eng. 2010, 36, 471–481. [Google Scholar]
  29. Wang, J.; Fu, Z.; Qiao, H.; Liu, F. Assessment of eutrophication and water quality in the estuarine area of Lake Wuli, Lake Taihu, China. Sci. Total Environ. 2019, 650, 1392–1402. [Google Scholar]
  30. Lu, J.; Wang, H.; Wang, W.; Yin, C. Vegetation and soil properties in restored wetlands near Lake Taihu, China. In Eutrophication of Shallow Lakes with Special Reference to Lake Taihu, China; Springer: Dordrecht, The Netherlands, 2007; Volume 581, pp. 151–159. [Google Scholar]
  31. Jian, S.A.; Nan, L.A.; Ping, Y.A.; Yz, A.; Yong, Y.A.; Xl, A.; Hz, B. Simultaneous antibiotic degradation, nitrogen removal and power generation in a microalgae-bacteria powered biofuel cell designed for aquaculture wastewater treatment and energy recovery. Int. J. Hydrog. Energy 2020, 45, 10871–10881. [Google Scholar]
  32. Hinshaw, S.E.; Tatariw, C.; Flournoy, N.; Kleinhuizen, A.; Taylor, C.; Sobecky, P.A.; Mortazavi, B. Vegetation Loss Decreases Salt Marsh Denitrification Capacity: Implications for Marsh Erosion. Environ. Sci. Technol. 2017, 51, 8245–8253. [Google Scholar]
  33. Morales, S.E.; Cosart, T.; Holben, W.E. Bacterial gene abundances as indicators of greenhouse gas emission in soils. ISME J. 2010, 4, 799–808. [Google Scholar]
  34. Groffman, P.M.; Altabet, M.A.; Böhlke, J.K.; Butterbach-Bahl, K.; David, M.B.; Firestone, M.K.; Firestone, M.K.; Giblin, A.E.; Kana, T.M.; Nielsen, L.P.; et al. Methods for measuring denitrification: Diverse approaches to a difficult problem. Ecol. Appl. 2006, 16, 2091–2122. [Google Scholar]
  35. Fulweiler, R.W.; Heiss, E.M.; Rogener, M.K.; Newell, S.E.; LeCleir, G.R.; Kortebein, S.M.; Wilhelm, S.W. Examining the impact of acetylene on N-fixation and the active sediment microbial community. Front. Microbiol. 2015, 6, 418. [Google Scholar]
  36. Hou, L.; Yin, G.; Min, L.; Zhou, J.; Zheng, Y.; Gao, J.; Zong, H.; Yi, Y.; Gao, L.; Tong, C. Effects of Sulfamethazine on Denitrification and the Associated N2O Release in Estuarine and Coastal Sediments. Environ. Sci. Technol. 2015, 49, 326–333. [Google Scholar]
  37. Li, J.; Wang, J.T.; Hu, H.W.; Cai, Z.J.; Lei, Y.R.; Li, W.; Zhang, M.Y.; Li, Z.M.; Zhu, Y.N.; Cui, L.J. Changes of the denitrifying communities in a multi-stage free water surface constructed wetland. Sci. Total Environ. 2019, 650 Pt 1, 1419–1425. [Google Scholar]
  38. Rotthauwe, J.-H.; Witzel, K.-P.; Liesack, W. The ammonia monooxygenase structural gene amoA as a functional marker: Molecular fine-scale analysis of natural ammonia-oxidizing populations. Appl. Environ. Microbiol. 1997, 63, 4704–4712. [Google Scholar]
  39. Henry, S.; Bru, D.; Stres, B.; Hallet, S.; Philippot, L. Quantitative detection of the nosZ gene, encoding nitrous oxide reductase, and comparison of the abundances of 16S rRNA, narG, nirK, and nosZ genes in soils. Appl. Environ. Microbiol. 2006, 72, 5181–5189. [Google Scholar]
  40. Cuhel, J.; Šimek, M.; Laughlin, R.J.; Bru, D.; Chèneby, D.; Watson, C.J.; Philippot, L. Insights into the effect of soil pH on N2O and N2 emissions and denitrifier community size and activity. Appl. Environ. Microbiol. 2010, 76, 1870–1878. [Google Scholar]
  41. Gruber, N.; Sarmiento, J.L. Global patterns of marine nitrogen fixation and denitrification. Glob. Biogeochem. Cycles 1997, 11, 235–266. [Google Scholar]
  42. Hayatsu, M.; Tago, K.; Saito, M. Various players in the nitrogen cycle: Diversity and functions of the microorganisms involved in nitrification and denitrification. Soil Sci. Plant Nutr. 2008, 54, 33–45. [Google Scholar]
  43. Zhu, G.; Wang, S.; Wang, W.; Wang, Y.; Zhou, L.; Jiang, B.; Den Camp, H.J.O.; Risgaard-Petersen, N.; Schwark, L.; Peng, Y. Hotspots of anaerobic ammonium oxidation at land–freshwater interfaces. Nat. Geosci. 2013, 6, 103–107. [Google Scholar]
  44. Austin, B.J.; Strauss, E.A. Nitrification and denitrification response to varying periods of desiccation and inundation in a western Kansas stream. Hydrobiologia 2011, 658, 183–195. [Google Scholar]
  45. Fromin, N.; Pinay, G.; Montuelle, B.; Landais, D.; Ourcival, J.M.; Joffre, R.; Lensi, R. Impact of seasonal sediment desiccation and rewetting on microbial processes involved in greenhouse gas emissions. Ecohydrology 2010, 3, 339–348. [Google Scholar]
  46. Tanner, C.C.; D’Eugenio, J.; McBride, G.B.; Sukias, J.P.S.; Thompson, K. Effect of water level fluctuation on nitrogen removal from constructed wetland mesocosms. Ecol. Eng. 1999, 12, 67–92. [Google Scholar]
  47. Huang, W.; Mao, J.; Zhu, D.; Lin, C. Impacts of land use and land cover on water quality at multiple buffer-zone scales in a Lakeside City. Water 2020, 12, 47. [Google Scholar]
  48. Liu, B.; Cai, S.; Wang, H.; Cui, C.; Cao, X. Hydrodynamics and water quality of the Hongze Lake in response to human activities. Environ. Sci. Pollut. Res. 2021, 28, 46215–46232. [Google Scholar]
  49. Shea, N.; Ouimet, W.B.; Dethier, D.P.; Bierman, P.R.; Rood, D.H. Spatial patterns of mobile regolith thickness and meteoric 10Be in the Boulder Creek Critical Zone Observatory, Front Range, Colorado. AGU Fall Meet. Abstr. 2012, 2012, EP41D-0835. [Google Scholar]
  50. Yuan, H.Z.; Wang, H.X.; Zhou, Y.W.; Jia, B.C.; Yu, J.H.; Cai, Y.W.; Yang, Z.; Liu, E.F.; Li, Q.; Yin, H. Water-level fluctuations regulate the availability and diffusion kinetics process of phosphorus at lake water–sediment interface. Water Res. 2021, 200, 117258. [Google Scholar]
Figure 1. The location of study area and the layout of sampling sites in the lakeshore zone in this study. The value between two sites is the distance, and the value in the parentheses next to each site number is the altitude above sea level. m, meters.
Water 13 03323 g001
Figure 2. Design of flooding simulation system.
Water 13 03323 g002
Figure 3. Denitrification rate in 0–10 and 45–55 cm sediment layers in the shore zone of Lake Taihu.
Water 13 03323 g003
Figure 4. Denitrifier abundance in 0–10 and 45–55 cm sediment layers in the shore zone of Lake Taihu: (A) nirS gene, (B) nirK gene, (C) nosZ gene.
Water 13 03323 g004
Figure 5. Relationship between sediment denitrification rate and flooding frequency.
Water 13 03323 g005
Figure 6. Denitrifier abundance in surface sediments under different flooding frequencies: (A) nirS gene, (B) nirK gene, and (C) nosZ gene.
Water 13 03323 g006
Figure 7. Changes in nitrogen substrates in the water under different flooding frequencies: (A) ammonium (B) nitrate. The number in the figure legend represents flooding frequency.
Water 13 03323 g007
Figure 8. Enhanced sediment denitrification in the lakeshore zone by manipulating water level.
Water 13 03323 g008
Publisher’s Note: MDPI stays neutral with regard to jurisdictional claims in published maps and institutional affiliations.

