Article

Iron, Phosphorus and Trace Elements in Mussels’ Shells, Water, and Bottom Sediments from the Severnaya Dvina and the Onega River Basins (Northwestern Russia)

by
Artem A. Lyubas
1,*,
Alena A. Tomilova
1,
Artem V. Chupakov
1,
Ilya V. Vikhrev
1,
Oksana V. Travina
1,
Alexander S. Orlov
1,
Natalia A. Zubrii
1,
Alexander V. Kondakov
1,
Ivan N. Bolotov
1 and
Oleg S. Pokrovsky
1,2,3
1
N. Laverov Federal Center for Integrated Arctic Research of the Ural Branch of the Russian Academy of Sciences, Northern Dvina Emb. 23, 163000 Arkhangelsk, Russia
2
Geosciences and Environment Toulouse, UMR 5563 CNRS, 31400 Toulouse, France
3
BIO-GEO-CLIM Laboratory, Tomsk State University, 634050 Tomsk, Russia
*
Author to whom correspondence should be addressed.
Water 2021, 13(22), 3227; https://doi.org/10.3390/w13223227
Submission received: 28 September 2021 / Revised: 9 November 2021 / Accepted: 9 November 2021 / Published: 14 November 2021

Abstract

:
Trace elements in freshwater bivalve shells are widely used for reconstructing long-term changes in the riverine environments. However, Northern Eurasian regions, notably the European Russian North, susceptible to strong environmental impact via both local pollution and climate warming, are poorly studied. This work reports new data on trace elements accumulation by widespread species of freshwater mussels Unio spp. and Anodonta anatina in the Severnaya Dvina and the Onega River Basin, the two largest subarctic river basins in the Northeastern Europe. We revealed that iron and phosphorous accumulation in Unio spp. and Anodonta anatina shells have a strong relationship with a distance from the mouth of the studied river (the Severnaya Dvina). Based on multiparametric statistics comprising chemical composition of shells, water, and sediments, we demonstrated that the accumulation of elements in the shell depends on the environment of the biotope. Differences in the elemental composition of shells between different taxa are associated with ecological preferences of certain species to the substrate. The results set new constraints for the use of freshwater mussels’ shells for monitoring riverine environments and performing paleo-reconstructions.

1. Introduction

Trace elements (TE) in carbonate shells of bivalve mollusks have been widely used for environmental studies [1,2,3,4,5,6,7,8,9]. Measuring TE concentration in shells of mollusks helps to track changes of different parameters in watercourses during long-time periods and to reveal local and global environmental impacts on riverine habitats [6]. For example, Zhao et al. [10] found that patterns of the Mn/Ca index in the shells of Hyriopsis cumingii (Lea, 1852) are associated with the occurrence of reduction conditions at the bottom sediments water interface. Therefore, the use of the Mn/Ca ratio can potentially serve as a high-resolution marker of Mn mobility in the anoxic layer. Studying this indicator in the shells of bivalve mollusks can help to retrospectively track environmental changes in aquatic ecosystems caused by eutrophication. Bolotov et al. [6] determined that the accumulation of trace elements in the shells of freshwater pearl mussels depends on the environmental conditions of the biotope and has no taxonomic control. The ratio of manganese and iron concentrations in relation to the environmental conditions of a freshwater body was analyzed by Naeher et al. [11]. These authors demonstrated applicability of this indicator for the reconstruction of redox conditions using values from the shells of modern bivalve mollusks and showed that sedimentation factors can reduce the applicability of the Mn/Fe ratio for reconstructing O2 concentrations in the bottom water of lakes. Ravera et al. [12] evaluated the possibility of assessing the state of abiotic and biotic components of a freshwater ecosystem using concentrations of chemical elements in the shells and tissues of the bivalve mollusks Anodonta anatina (Linnaeus, 1758) and Unio sp., as well as in water, bottom sediments, and aquatic plants. These authors demonstrated that these indicators can be a useful tool for long-term studies of environmental pollution.
Over recent years, the use of new methods allowed analyzing changes in the chemical composition of shells with high spatial resolution. A number of indicatory elements were used to assess seasonal trends and hydrological conditions of aquatic ecosystems. For example, van Plantinga and Grossman [8] used shells of two species (Amblema plicata (Say, 1817) and Cyrtonaias tampicoensis (Lea, 1838)) of naiad as natural archives. These authors established a relationship between the Mn/Ca ratio and the river discharge. Watanabe et al. [13] compared the values of geochemical indicators of hydrological conditions with the values of annual increments in the freshwater pearl mussel Margaritifera laevis (Haas, 1910). A correlation was found between the Ba/Ca ratio and the shell growth rate, which depended on the volume of winter snow and spring meltwater.
The present work is aimed to characterize the accumulation of elements in the shells of widespread species of freshwater bivalve mollusks, together with the components of their habitats (bottom sediments and water) using a case study of two large river basins in Northwestern Russia. Subarctic rivers of European Russian North are subjected to strong impact of both local (pollution sources, forestry, industry) and global (climate change, vegetation shifts) factors but they remain poorly studied using complex biogeochemical ecosystem-based approaches that can include river water, sediments, and aquatic organisms. Here, we intended to test the impact of environmental conditions on TE distribution coefficients and characterize the difference between taxa in order to better define the scope of the use of bivalve shells as archives of riverine aquatic environments.

2. Materials and Methods

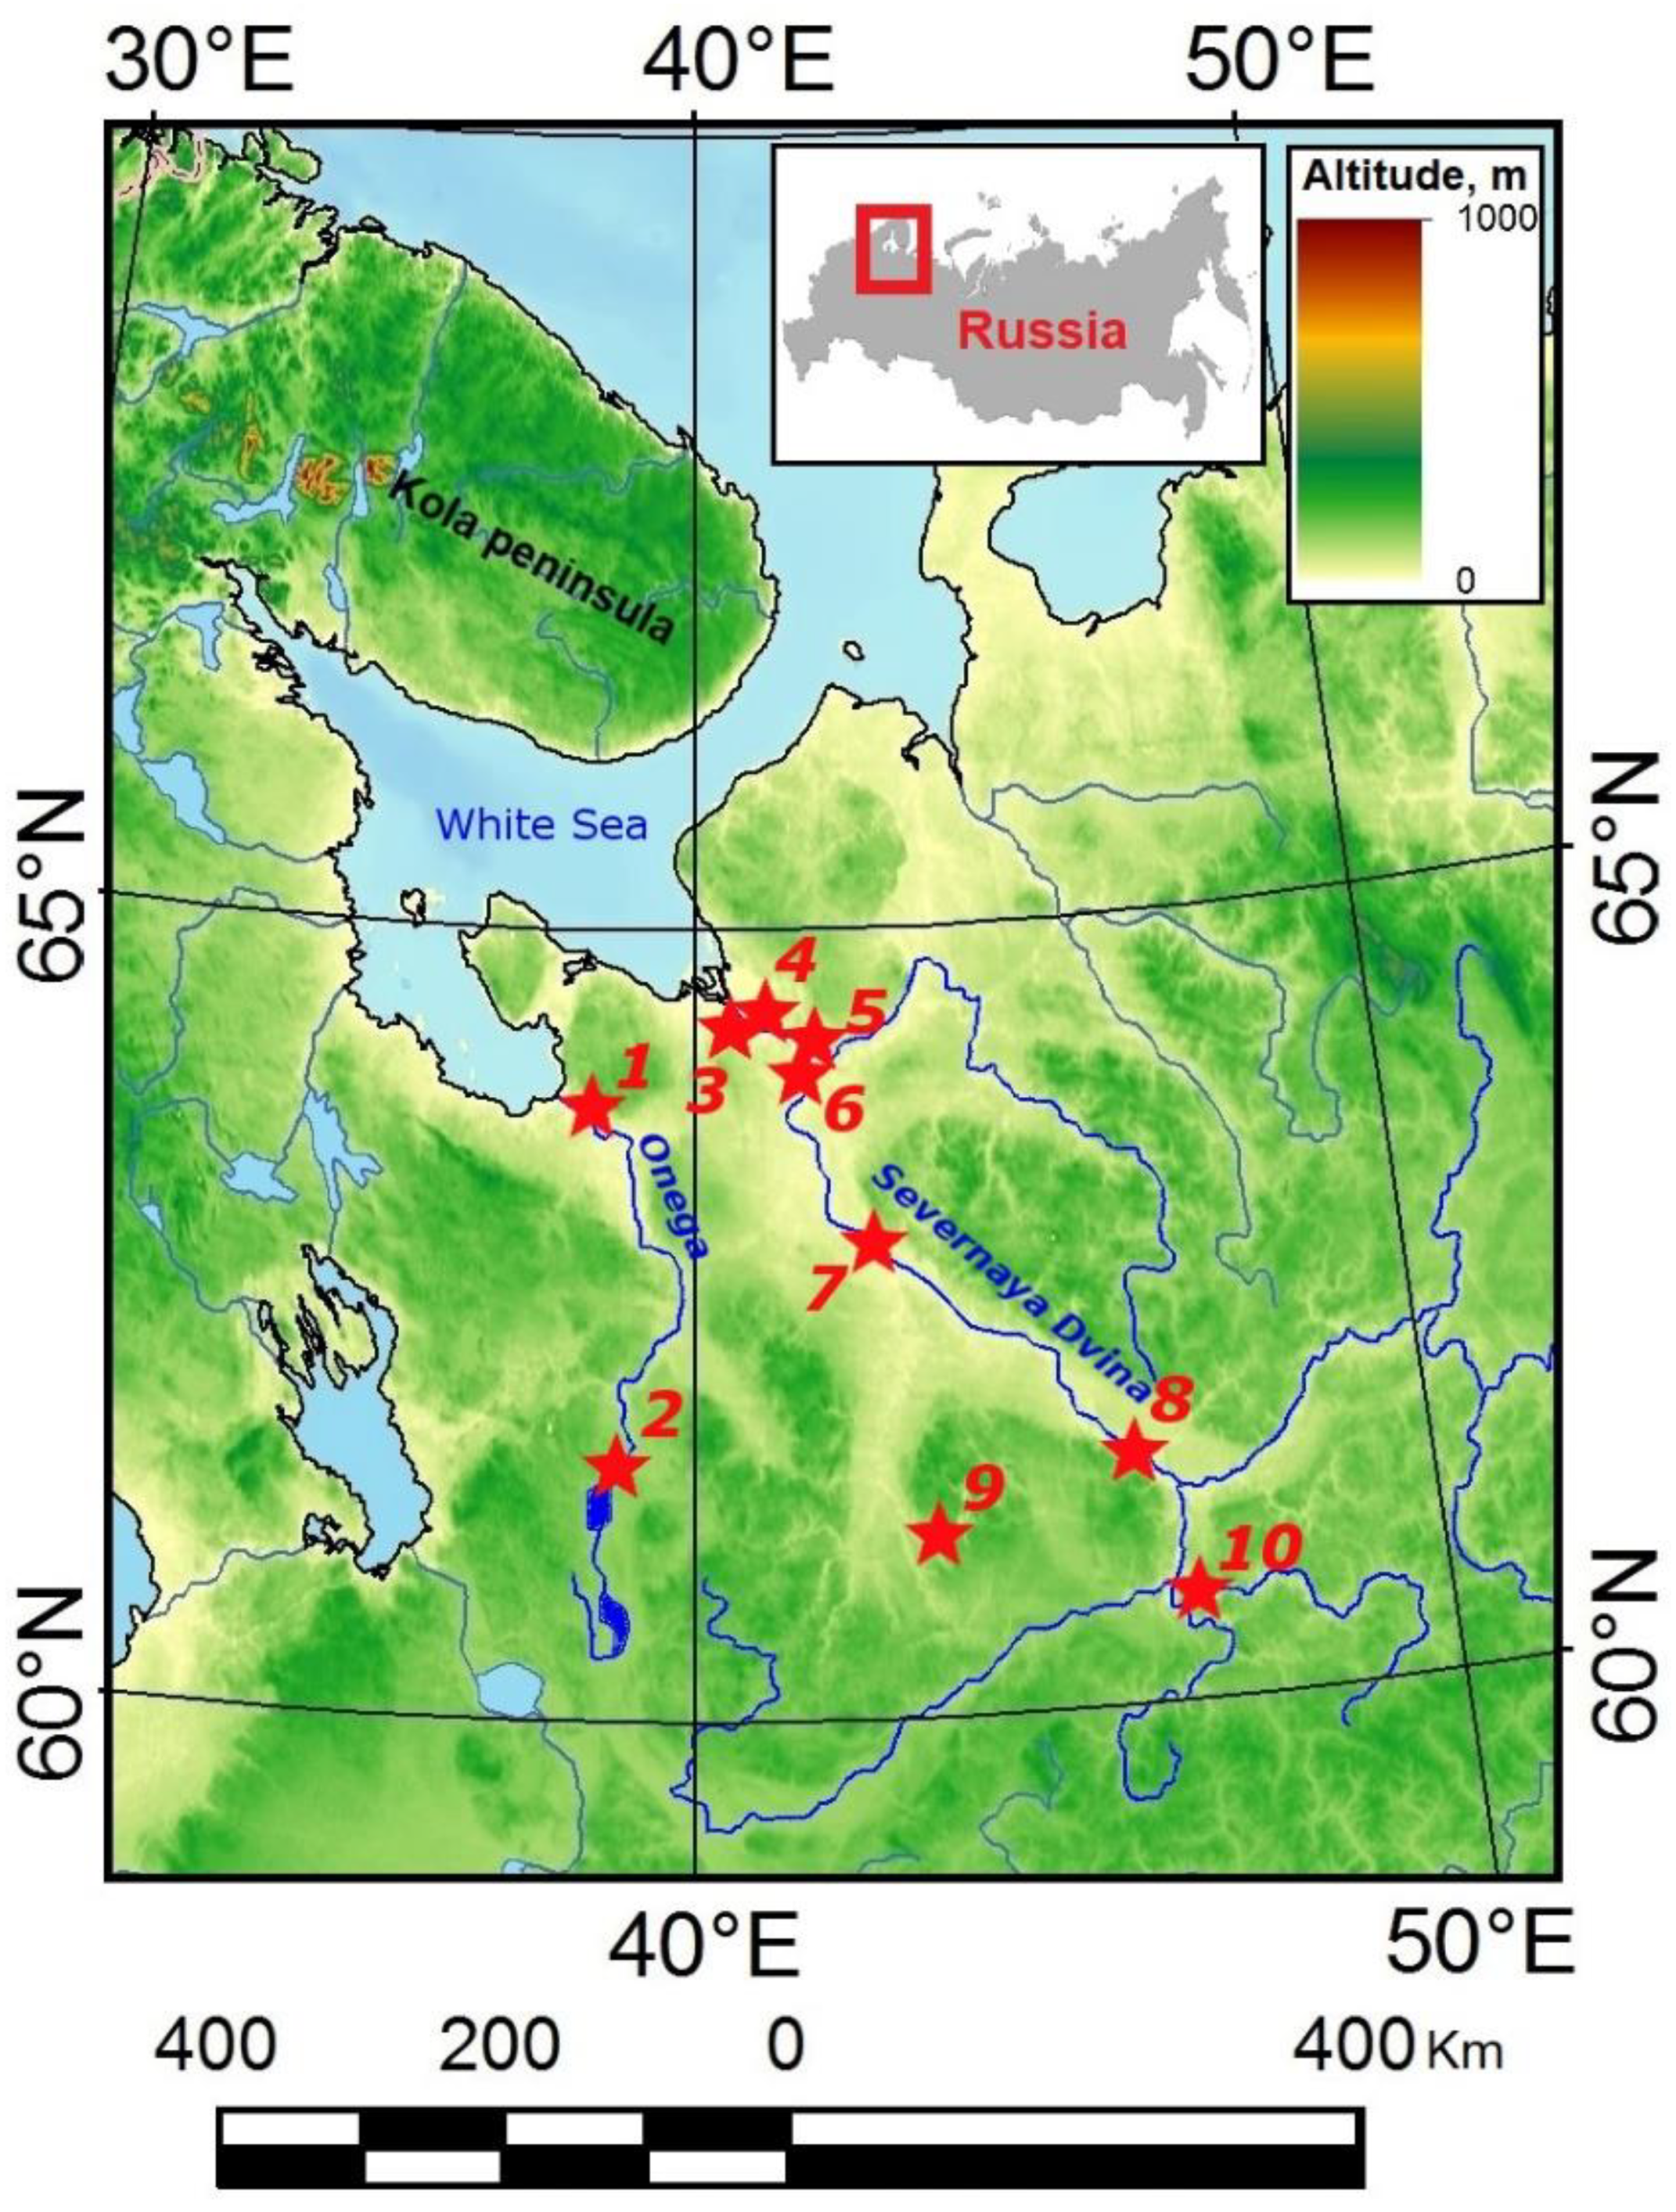
2.1. Sampling Locations

Sampling sites are located in the basins of the Severnaya Dvina and the Onega rivers (Figure 1, Table 1). The names of sampling localities are given relative to nearby settlements. Mollusks’ samples were taken manually from a depth of 0.5 to 1.5 m.
River water samples were collected at sites of shells’ sampling from 0.5 m depth in pre-cleaned polypropylene bottles. The water was immediately filtered through a single-use sterile acetate cellulose filter (Sartorius, 0.45 µm), into pre-cleaned polypropylene Nalgene bottles. Samples for TE analyses were acidified with ultrapure double-distilled HNO3 and stored in the refrigerator pending analyses.
The sediment samples were taken from the water-sediment interface to a depth of 3–4 cm (which corresponds to the depth of burying of Anodonta anatina and Unio spp. mollusks in the ground), placed in a double zip polyethylene bag, preserved in cold dark environment, and transported within several days to the laboratory where they were dried at 90 °C in the oven.
Shells from 10 sampling sites located in different parts of the Severnaya Dvina and the Onega River basins were used to analyze trace elements’ composition (Figure 2). Bottom sediment and water samples were taken at 9 localities (Table 1).

2.2. Determination of the Taxonomic Position of Mollusks’ Individuals and Preparation Samples for Trace Elements’ Analysis

The primary species identification of the collected samples of bivalve mollusks was carried out based on standard and special keys [14,15,16]. The comparative analysis of the shell morphology was carried out taking into account the structure of the pseudocardinal and lateral teeth, muscle attachment scars, shell shape, and umbo position [17,18]. Details of the shell structure were studied using an Axio Lab.A1 light microscope (Carl Zeiss, Jena, Germany) and a Leica M165C stereomicroscope (Leica Microsystems, Wetzlar, Germany). Shells were sawn from the umbo to the ventral margin perpendicularly to the winter lines and along the axis of minimum growth with a diamond saw, and the obtained fragment to 10 mm width was taken for trace element analysis.

2.3. Analysis of the Trace Element Composition of Shells

For the analysis of major and trace elements, parts of the shell were washed using MilliQ water, dried and ground in an agate mortar. Acidic dissolution of crushed shells was carried out by processing them in ultrapure water Merck H2O2, bidistilled ultrapure water Aldrich HNO3, HNO3 + HCl and, finally, in HNO3 at 80 °C in Savillex Teflon containers housed in separate evaporation chambers (class A 100) located inside the cleanroom (class ISO A 10,000). This made it possible to dissolve only the carbonate and organic parts of the shells without leaching silicate mineral impurities. Together with samples, we also processed two certified carbonate reference materials (Coral JCp-1, Giant Clam JCt-1). The leachate products were evaporated to dryness, re-dissolved in 10% HNO3 and diluted 5000 times for the analysis of major and trace elements using an Agilent 7500ce (Agilent Technologies, Inc., Santa Clara, United States)inductively coupled plasma mass-spectrometer [6,19].

2.4. Analysis of the Elemental Composition of Water Samples

The elemental composition of the river water was measured by mass spectrometric and atomic emission analyzes with inductively coupled plasma (ICP-MS and ICP-AES). The detection limits of the method were 0.1–10 ng L−1 for Y, rare earth elements (REE), U, Th, Zr, Li, Mo, Be, Rb, Cd, W, Nb, Hf, Sb, Cs, Tl, and 10–100 ng L−1 for (Co, V, Sr, Ba, Mn, Pb, As) and 100–10,000 ng L−1 for other elements (S, Si, P, Br, K, Ca, Fe, Na, Mg, Al, B, Ti, Cr, Zn, Cu, Se, Ni) [20].

2.5. Analysis of the Elemental Composition of Bottom Sediments Samples

The mineralization of sediment samples was carried out by acid digestion. Along with the analyzed samples, the digestion of international certified sediment materials (LKSD) and one in-house standard sample was carried out. One hundred mg of sample were placed in Teflon beakers (volume 50 mL), with 0.1 mL of a solution containing 8 μg dm−3 of 145Nd, 161Dy, and 174Yb which is used as a control of the chemical yield during the sample decomposition procedure), and moistened with several drops of deionized water. After that, 0.5 mL of HClO4 (Perchloric acid fuming 70% Supratur, Merck, Darmstadt, Germany), 3 mL (HF Hydrofluoric acid 40% GR, ISO, Merck, Darmstadt, Germany), 0.5 mL of HNO3 (Nitric acid 65%, GR, ISO, Merck, Darmstadt, Germany) were added and evaporated until intense white fumes appeared. The vials were cooled, their walls were washed with water, and the solution was again evaporated to wet salts. Then, 2 mL of HCl (hydrochloric acid fuming 37% GR, ISO, Merck, Darmstadt, Germany) and 0.2 mL of 0.1 M H3BO3 solution (analytical grade) were added and evaporated to a volume of 0.5–0.7 mL. The resulting solutions were transferred into polyethylene bottles, amended with 0.1 mL of a solution containing 10 mg L−1 In (internal standard), diluted with deionized water to 20 mL, and analyzed by ICP-MS. As blank controls in Teflon beakers, the procedures described above were carried out without samples, and the resulting solutions were used as control [19].

2.6. Statistical Treatment of the Data

Element concentrations in samples were compared using the nonparametric Mann–Whitney U and Kruskal–Wallace H tests because the data were not distributed normally (Shapiro–Wilk test). To assess the relationship between the concentrations of elements, the Spearman’s correlation coefficient was used, and linear, logarithmic, and exponential regression models were employed.
A principal component analysis (PCA) was used to determine the factors controlling the pattern of element accumulation in shells, water, and sediments. The selection of factors was carried out according to the screen test and on the basis of eigenvalues (Kaiser criterion). The suitability of the data for factorization was assessed based on the Kaiser–Meier–Olkin measure of sample adequacy (minimum fitness value was higher than 0.6) and using the Bartlett’s test of sphericity. Metal pollution index was calculated according with Usero et al. [21] and Sedeño-Díaz et al. [22].

3. Results

3.1. Elemental Composition of Shells

The collected shells of bivalve mollusks belonged to two genera (Anodonta and Unio). All analyzed individuals of Anodonta belonged to the species A. anatina. The individuals belonging to the genus Unio, according to the teeth structure and the outline of the shell contours, were identified as U. pictorum (Linnaeus, 1758) and U. tumidus Retzius, 1788 [23]. The average ontogenetic ages of individuals were 4.17 ± 0.20 years for specimens of Anodonta and 4.67 ± 0.20 years for specimens of Unio.
The average chemical composition of mollusk shells is presented in Table 2. After Ca, the most abundant elements were Na, Fe, Mn, Sr. Average concentrations of Na, Fe, Mn, Sr in Anodonta anatina (n = 18) and Unio spp. (n = 21) shells were 2340 ± 31 mg/kg and 2300 ± 27 mg/kg, 1580 ± 653 mg/kg and 1030 mg/kg, 680 ± 79 mg/kg and 424 ± 38 mg/kg, 635 ± 48 mg/kg, and 713 ± 68 mg/kg, respectively.
It was found that the concentrations of only 5 elements (Mg, Al, Mn, Ba, and U) differ between samples of mollusks belonging to different genera. Considering both genera together, the concentrations of Li, Na, P Al, Sr, Y, Ba, REEs differed between the samples from the two river basins. Further, the concentrations of all elements, except for Cr, Cu, As, and Pb, differ statistically significantly among the studied localities when considering two genera together.

3.2. Elemental Composition of Water and Sediments

The concentrations of chemical elements in water and bottom sediments are presented in Table 3 and Table 4.
Correlations between element concentrations in the shells revealed two groups of elements. The largest number of strong correlations was found for aluminum (Mg, K, Rb, U, Th, etc.) and iron (P, K, Rb, Cs). Generally, for Anodonta anatina, the correlations between elements were stronger than those for Unio species (Figure 3 and Figures S1–S4, Supplementary Materials).
Correlations of REE with other elements were analyzed for Anodonta mussels’ shells. Strong positive correlations were established for La, Ce, Pr, Nd, Sm, Eu, Gd, Dy, Er, Yb with iron (RSpearman ranged from 0.80 to 0.96, p < 0.01) and for Eu, Gd, Er, Yb with aluminium (RSpearman ranged from 0.70 to 0.80, p < 0.01). Medium positive correlations were observed between aluminium and Ce, Pr, Nd, Sm, Dy (RSpearman ranged from 0.51 to 0.68, p < 0.05).
Correlations of REE with other elements were also examined for Unio mussels’ shells. Strong positive correlations were identified for Nd, Sm, Ce, Pr, Eu, Gd, Dy, Er, Yb with iron (RSpearman ranged from 0.78 to 0.88, p < 0.01) and for Nd, Sm, Gd, Dy, Er with aluminium (RSpearman ranged from 0.71 to 0.75, p < 0.01). Medium positive correlations were observed between Al and Ce, Pr, Eu, Yb (RSpearman ranged from 0.64 to 0.69, p < 0.01). Medium positive correlations were observed between Fe and La (RSpearman = 0.69, p < 0.01).
Iron and phosphorus exhibited strong correlations with Mg, Y, Cs (RSpearman> 0.7, p < 0.01), K, Rb (RSpearman > 0.7, p < 0.05), and REE (RSpearman > 0.8, p < 0.05). There were no significant correlations for Na, Al, S, Mn, Sr, and U with the concentrations of iron and phosphorus in the shells of bivalve mollusks (p > 0.05).

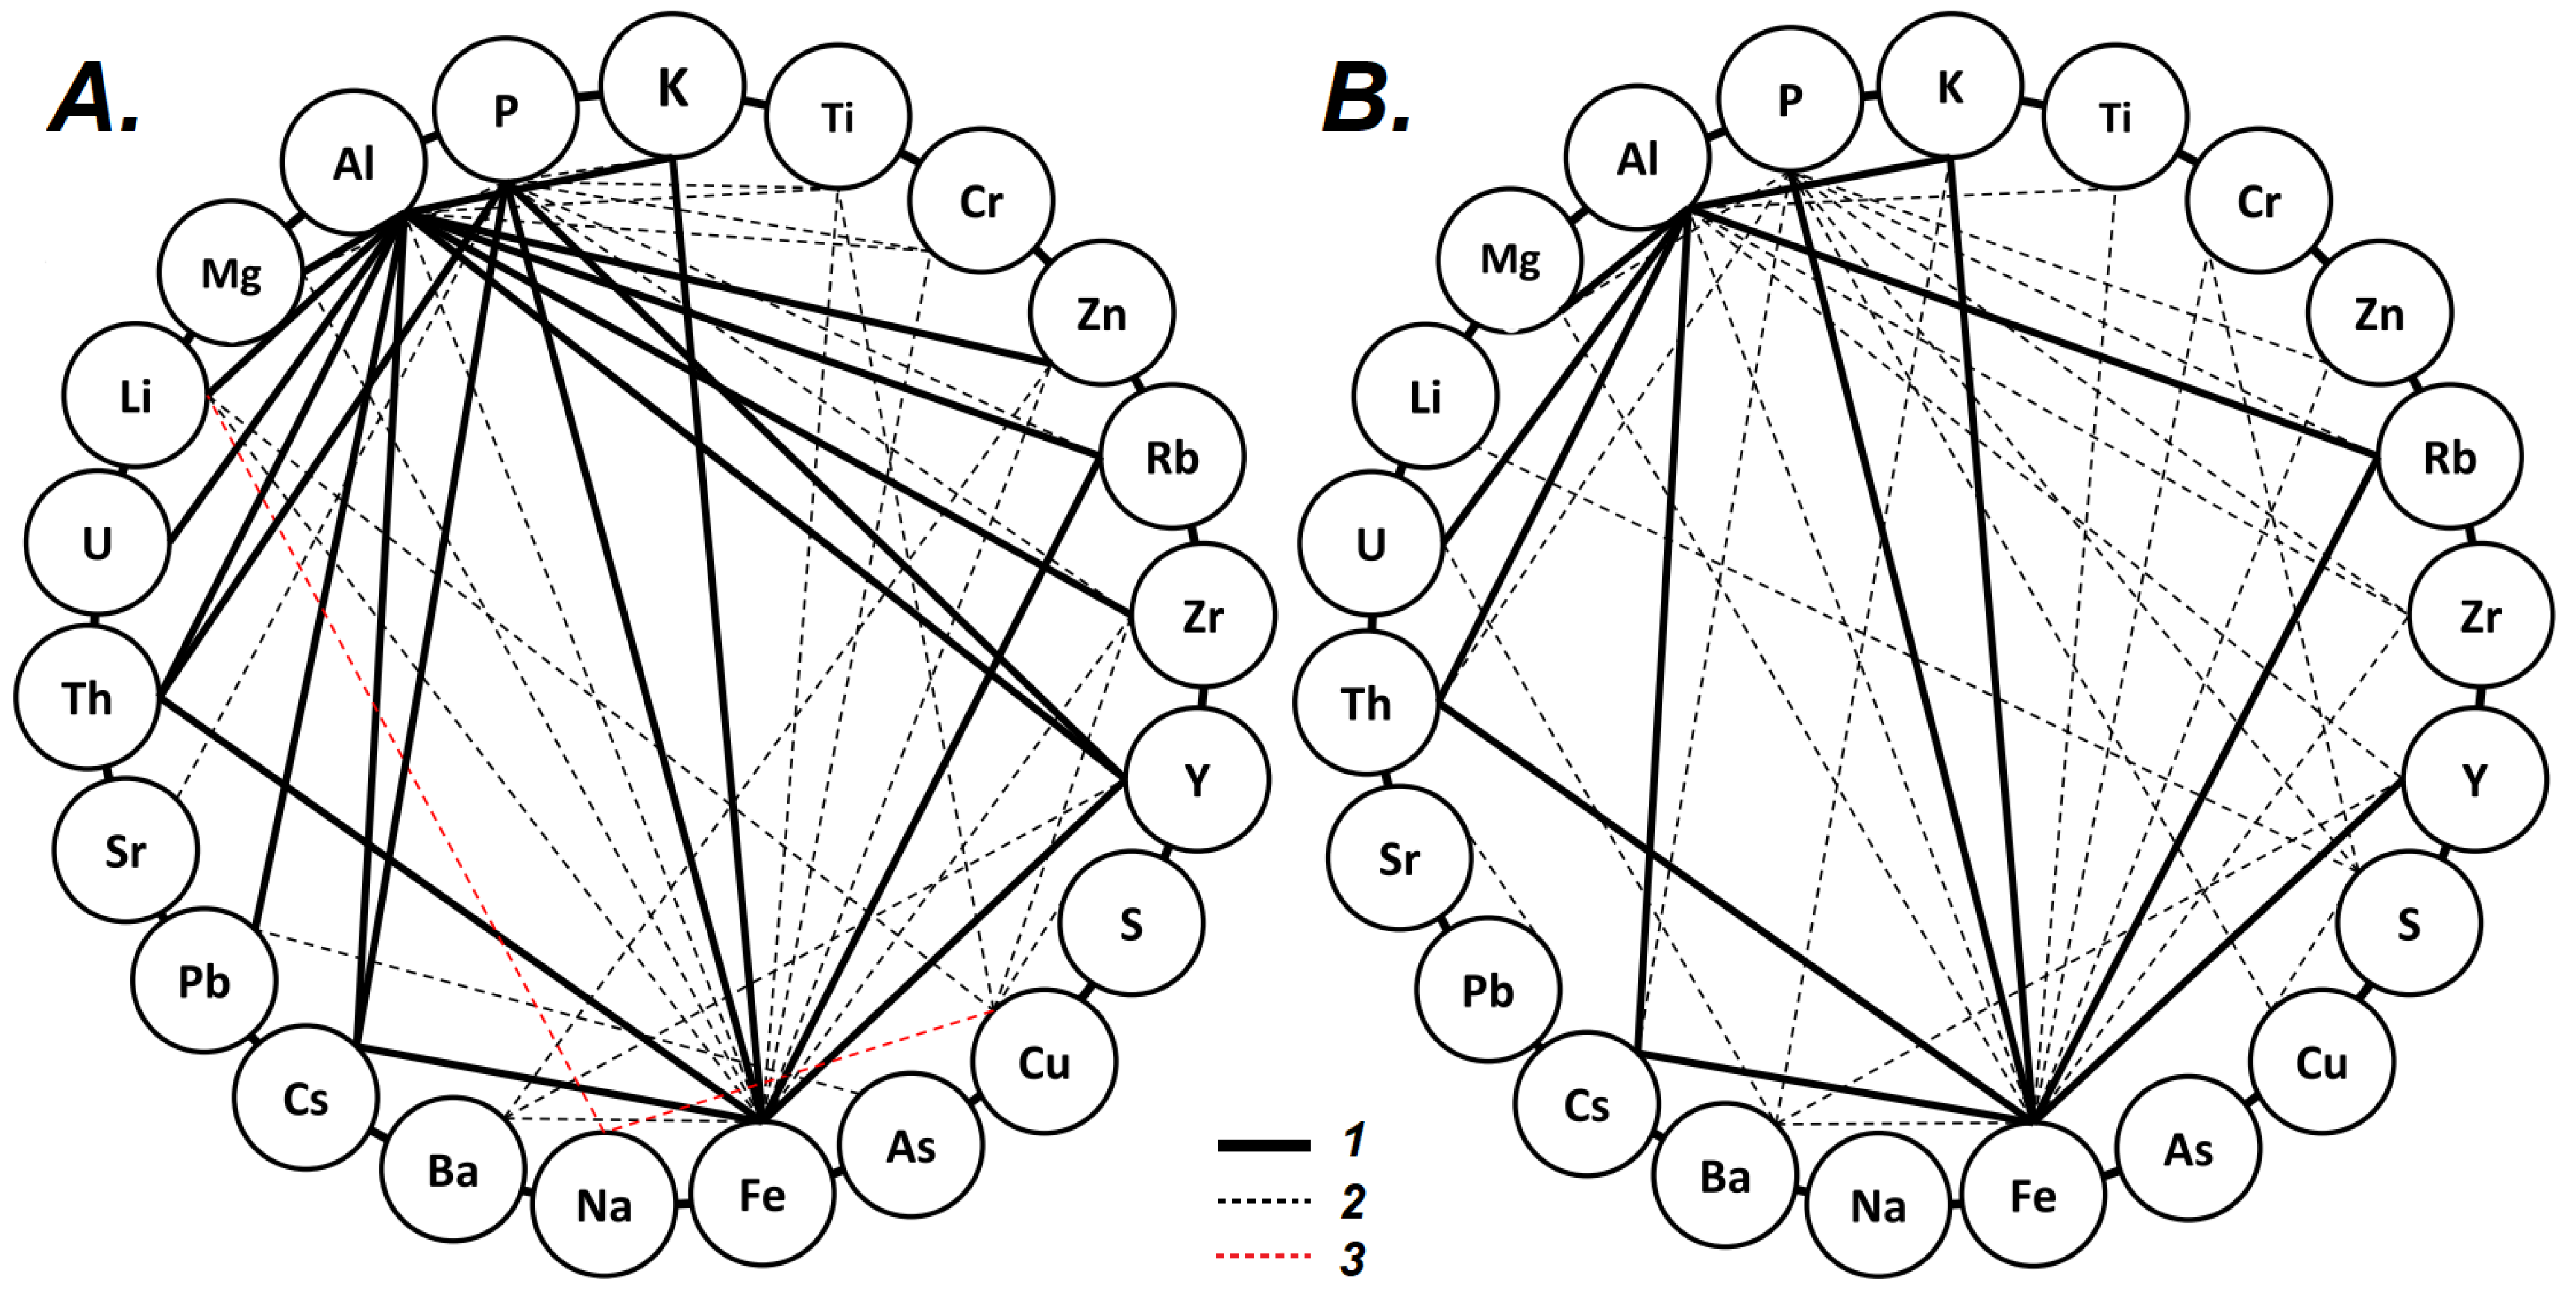
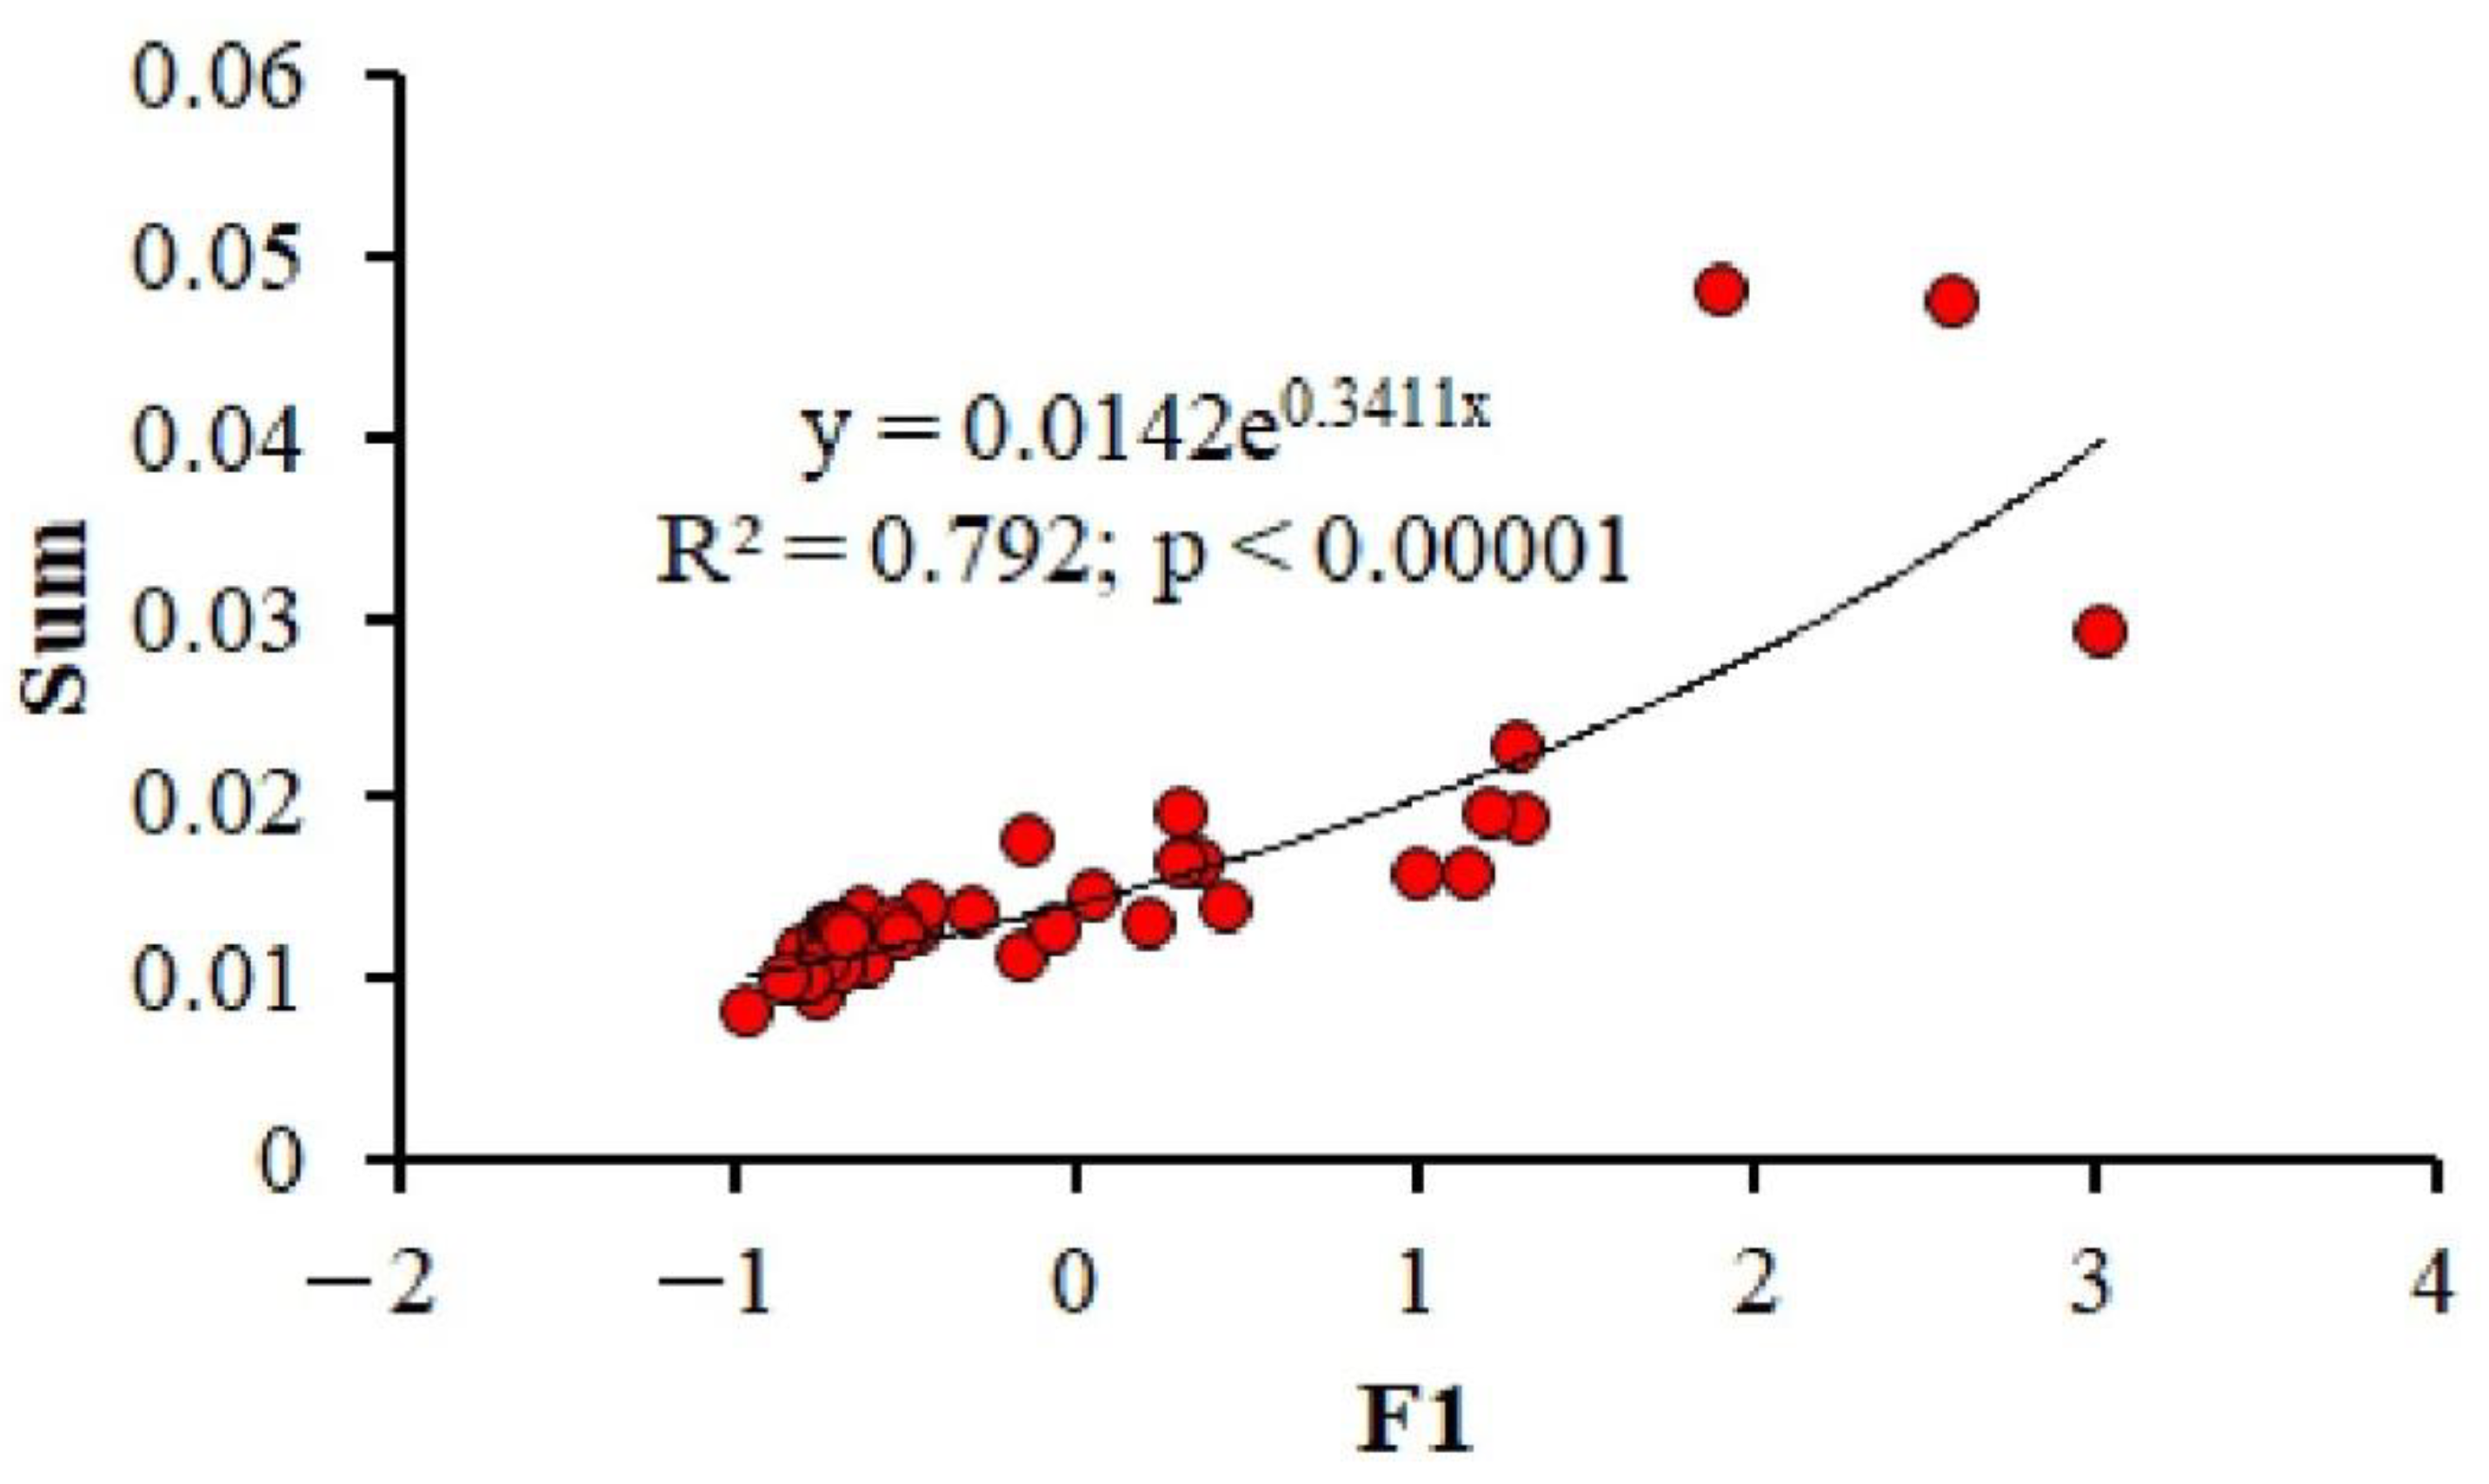
3.3. Multiparametric Statistics

Preliminary assessment of the suitability of concentrations data on Li, Na, Mg, Al, P, S, K, Ti, Cr, Mn, Fe, Cu, Zn, As, Rb, Sr, Y, Zr, Nb, Sb, Cs, Ba, REEs, Pb, Th, U for factorization revealed an acceptable value of the Kaiser–Mayer–Olkin sample adequacy measure (0.719) and a statistically significant indicator of Bartlett’s sphericity criterion (χ2 = 2592; p < 0.001). As a result, three factors were identified; in terms of the values of factor loadings, they were interpreted as follows. None of the factors was different between individuals of different genera. Factor 1 had a regression relationship with the sum of the concentrations of elements per sample, normalized to calcium (Figure 4). Factor 2 was associated with the accumulation of iron, barium, and phosphorus during shell growth. Factor 3 described the conditions of a particular biotope associated with the composition of the bottom sediments in which the mollusks lived, including the accumulation of heavy metals in the shell (Sb, Pb, Sr), and differed among localities (p > 0.001).

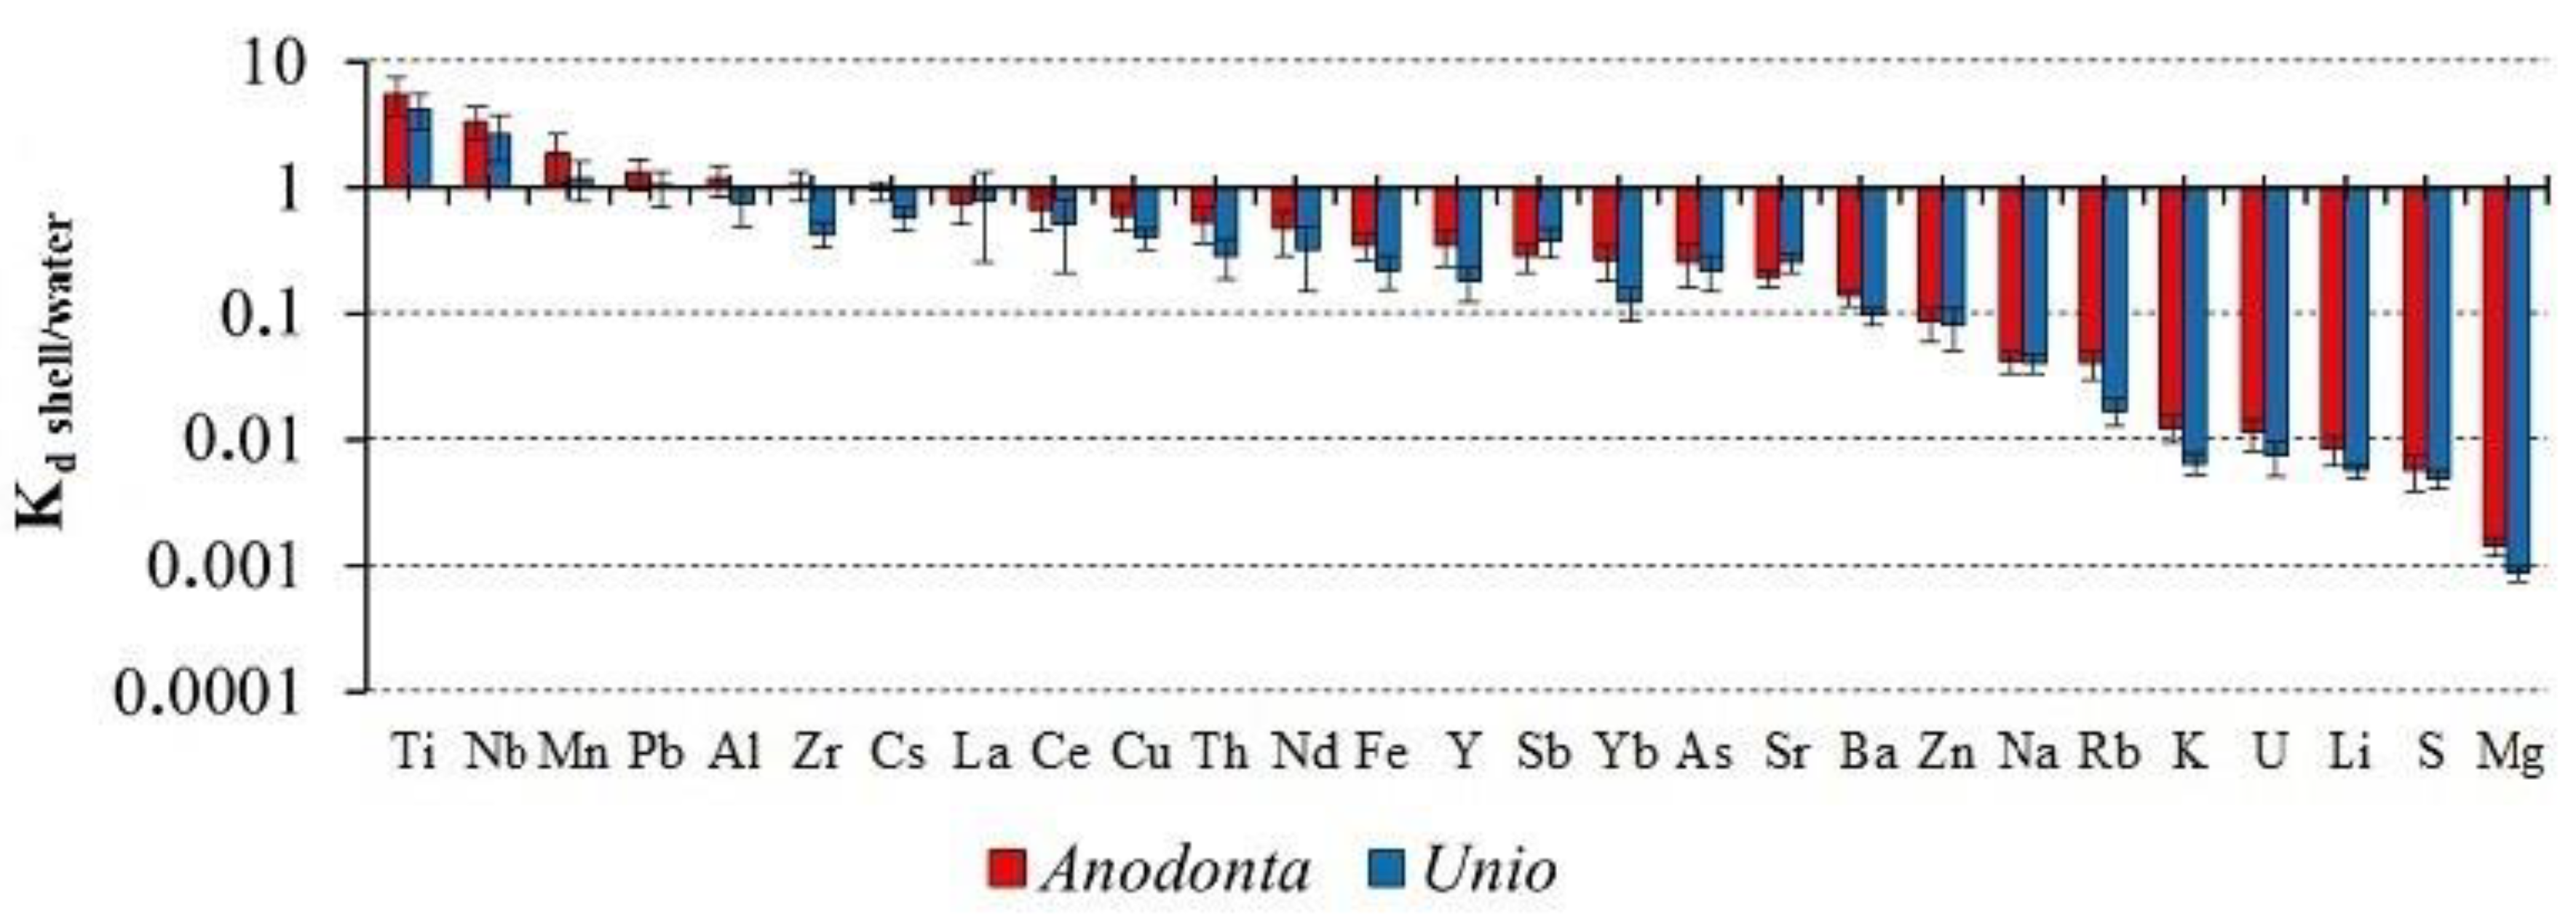
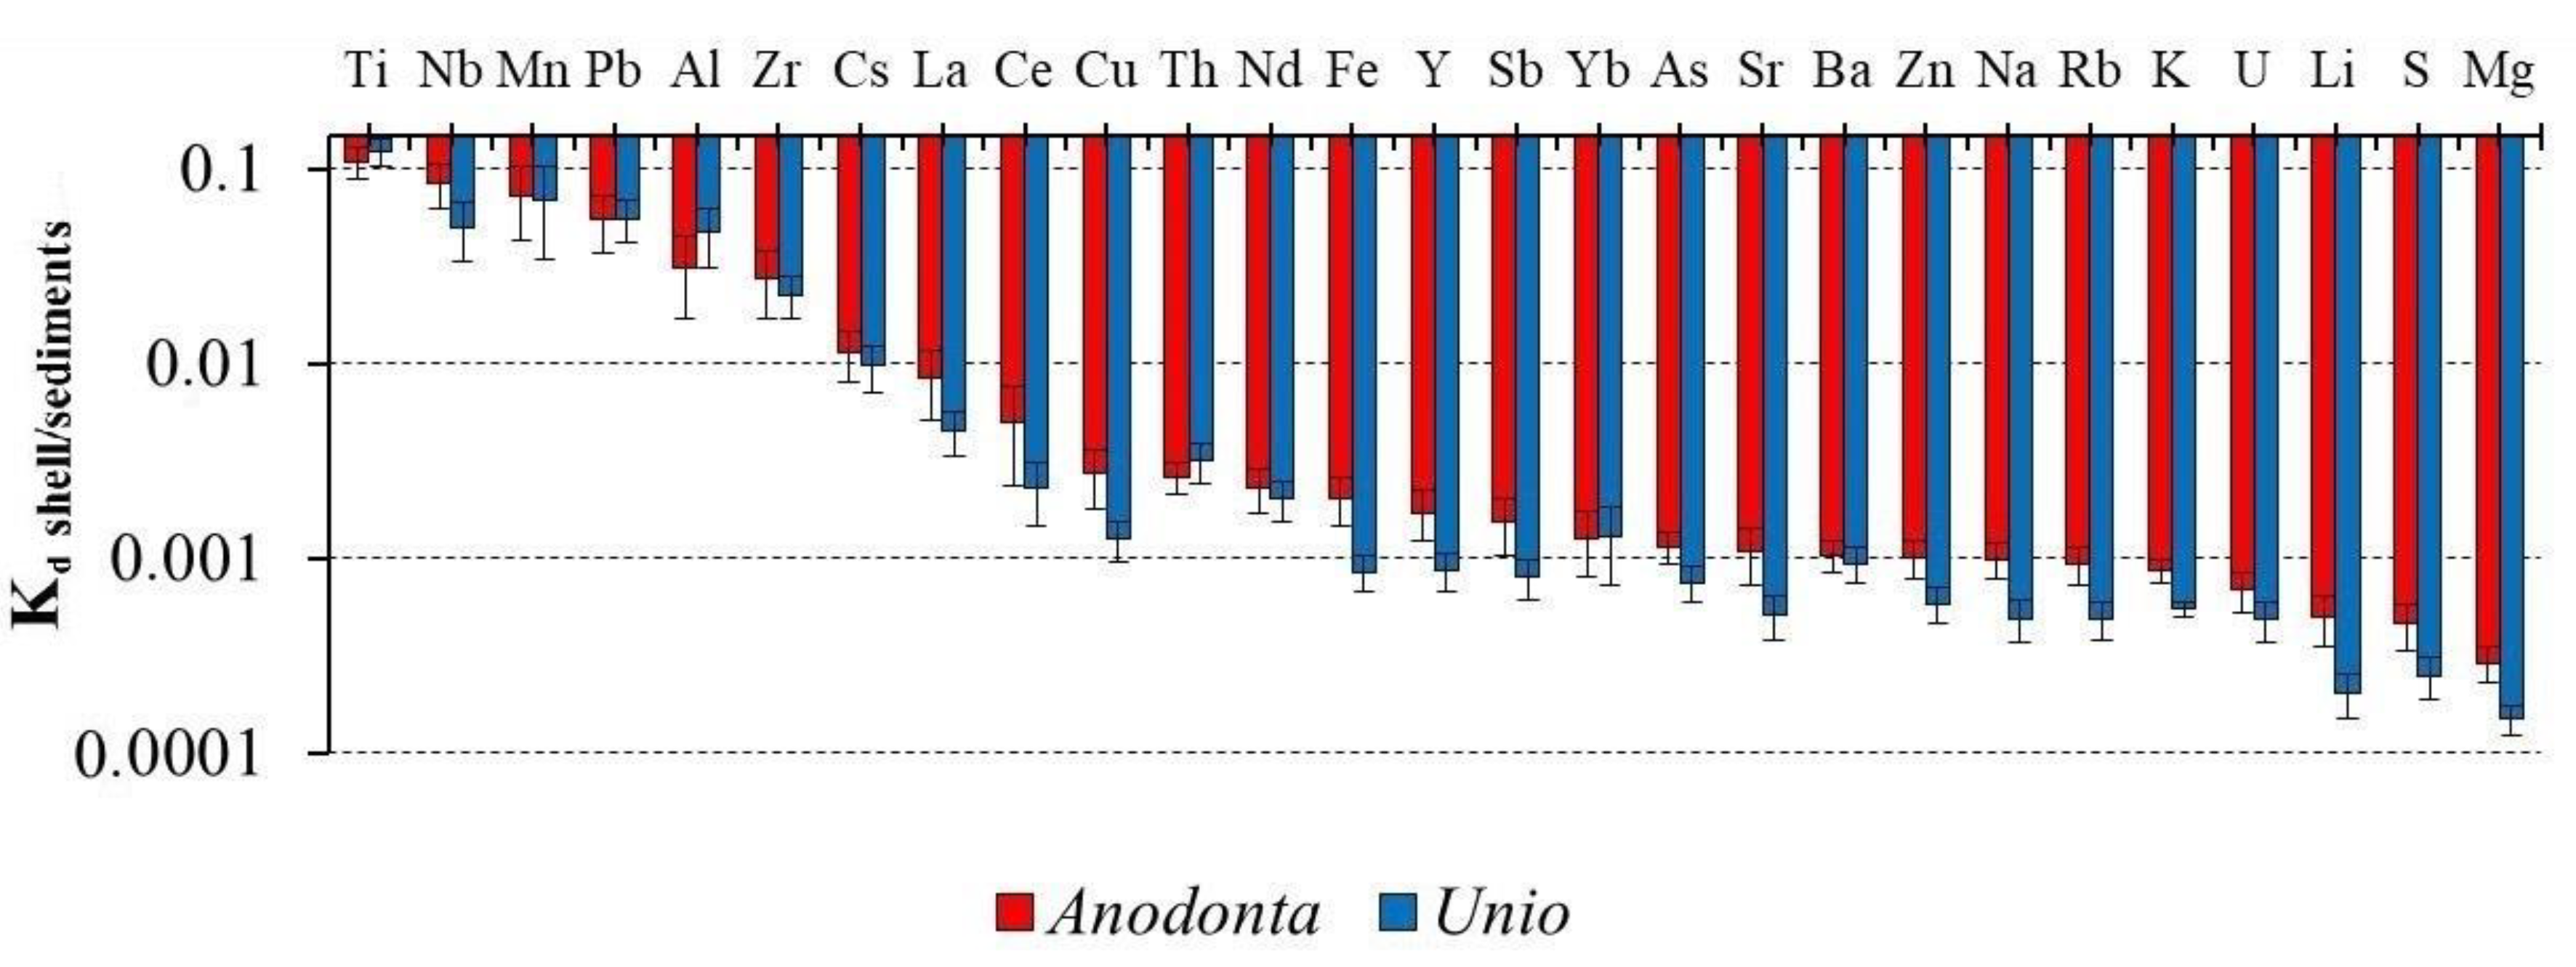
3.4. Element Distribution Coefficients between the Shell and the Environment

Apparent distribution coefficients of major and trace elements between the river water and the aragonite shells of Unio spp. and A. anatina were calculated based on several replicates from the same site. Calcium-normalized distribution coefficients Kd (solid/liquid) = ([TE]/[Ca])shell/([TE]/[Ca]) solution varied from 10 to 0.001 (Figure 5). In addition, distribution coefficients of trace elements between shells and bottom sediment samples were determined to range from 6.71 × 10⁻⁶ to 0.52 (Figure 6).
The metal pollution index was calculated according to Usero et al. (1996) and Sedeño-Díaz et al. (2020) for U. pictorum, U. tumidus and A. anatina shells from the Severnaya Dvina River Basin. It varied from 0.59 to 4.75 for A. anatina and from 0.67 to 4.22 for Unio spp. For the shells from the Onega River Basin this index varied from 0.74 to 2.80 for A. anatina and from 0.45 to 0.81 for Unio spp.

4. Discussion

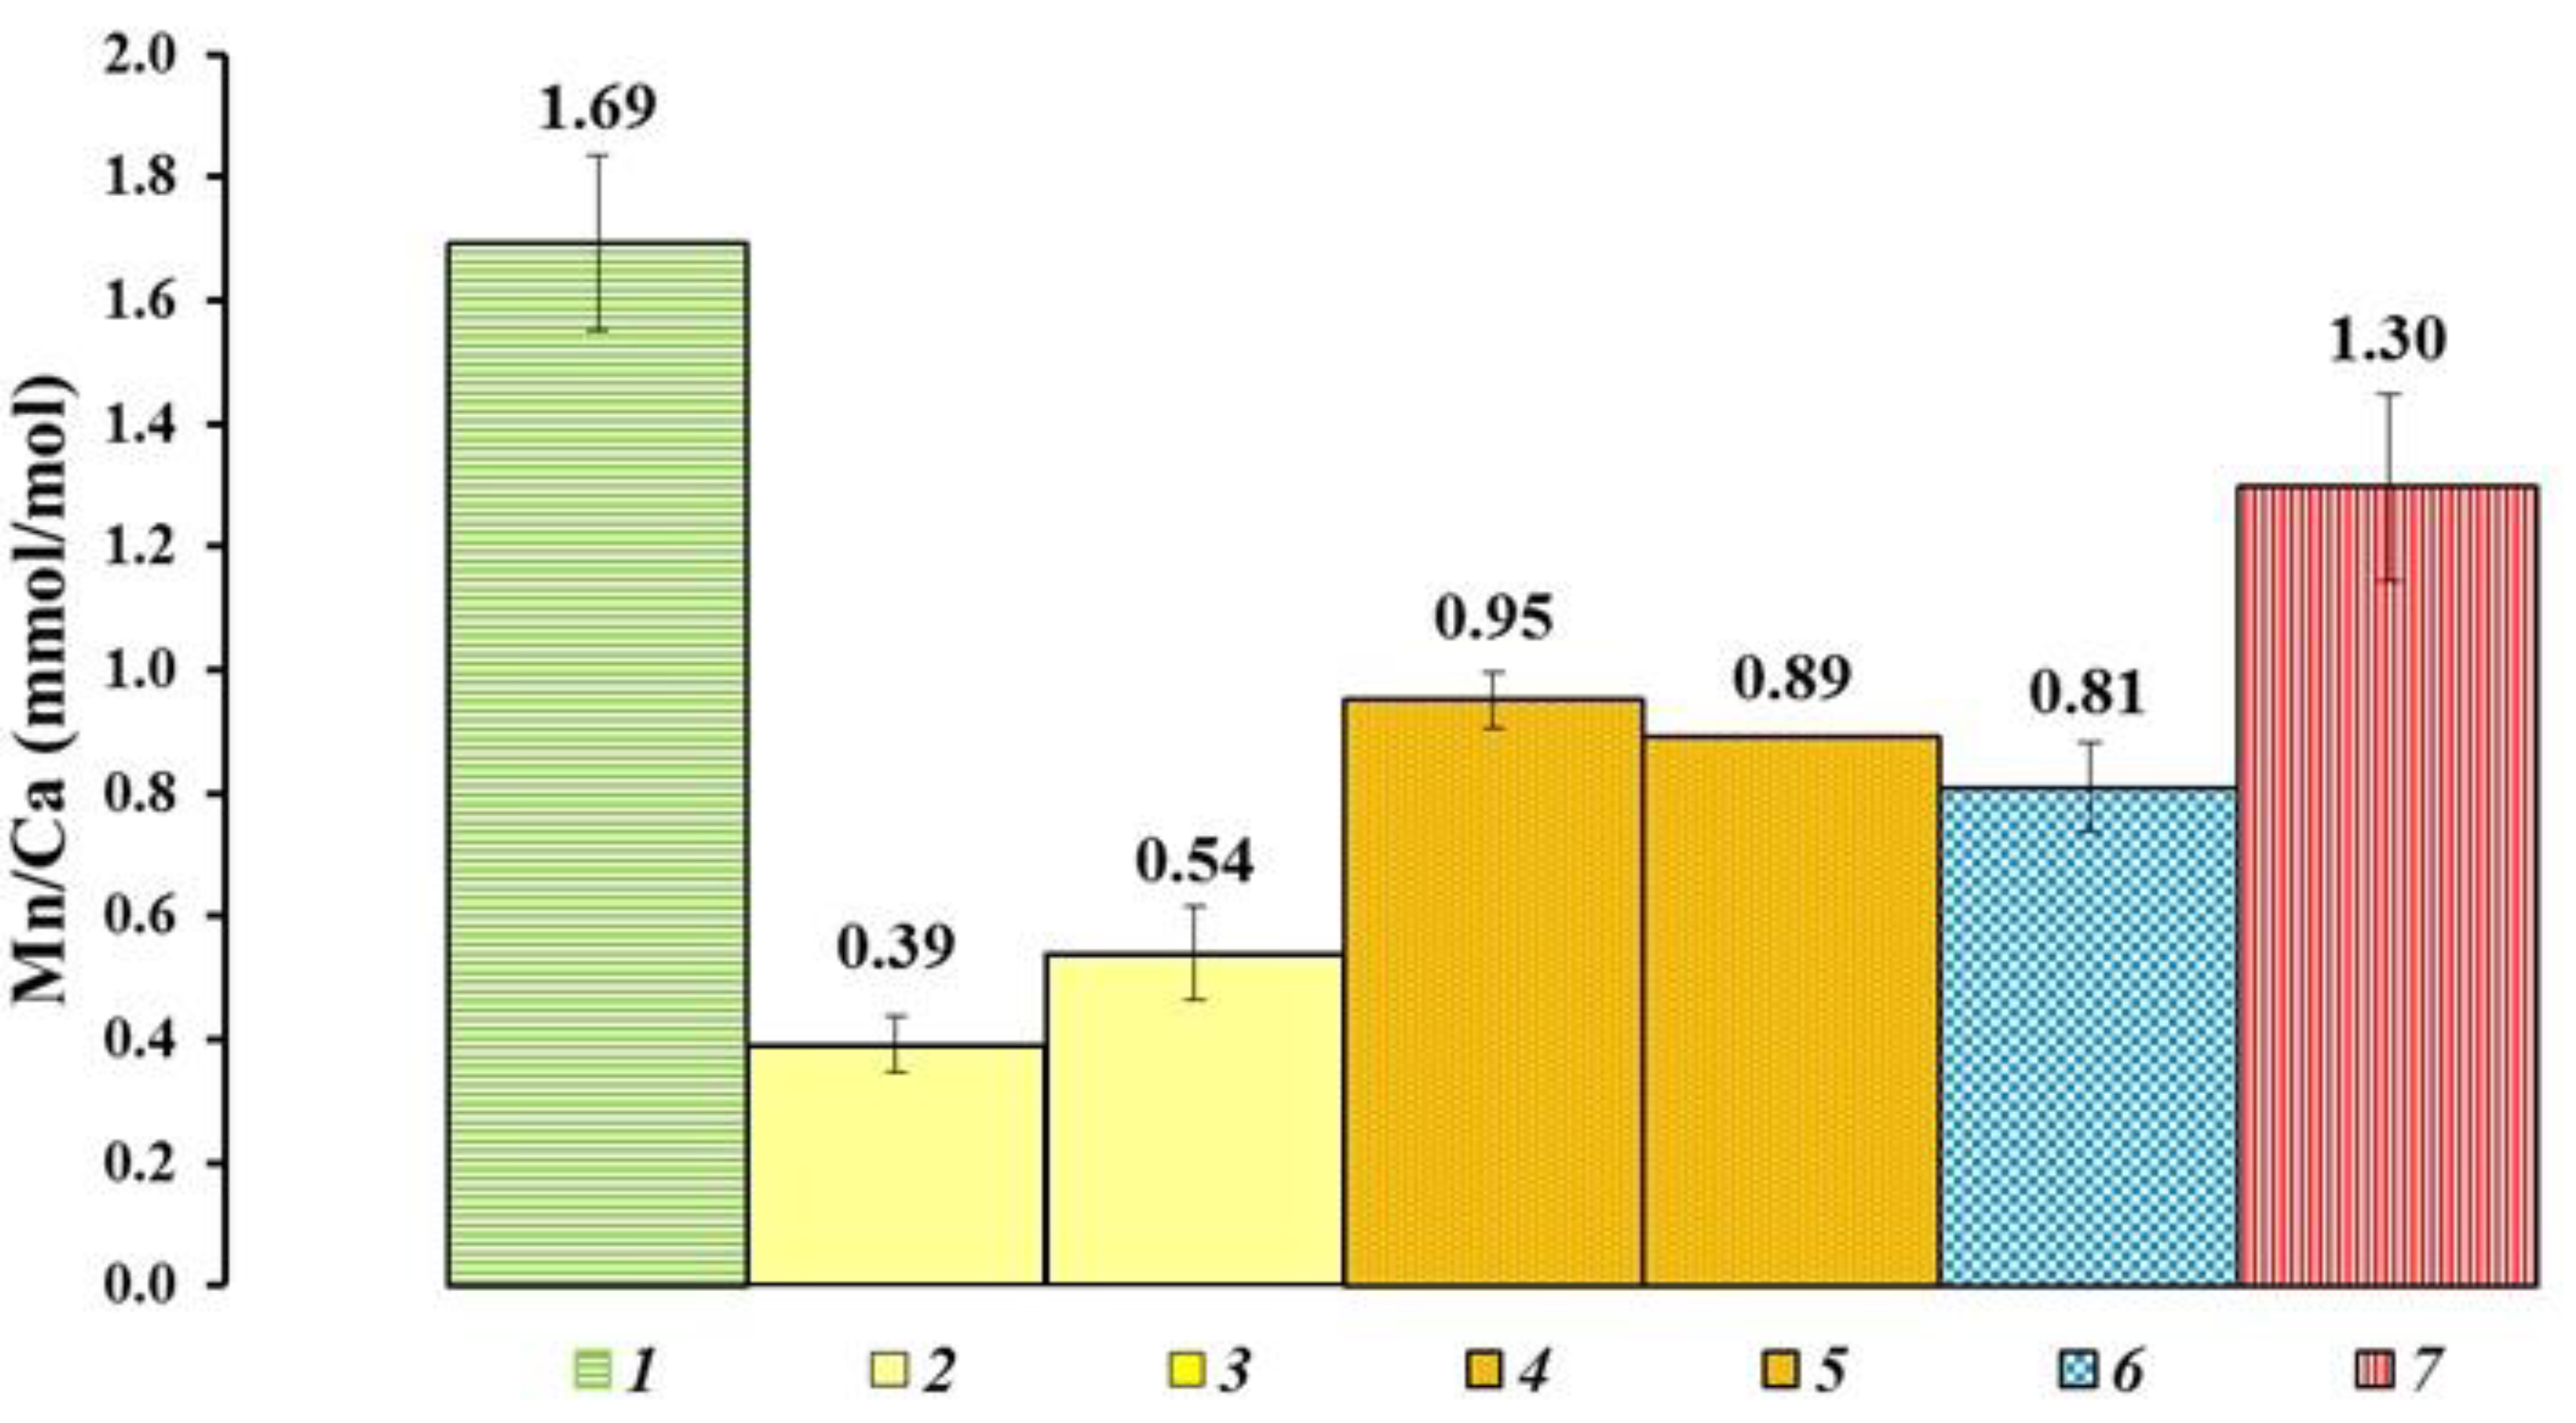
4.1. Element Inter-Correlations and Element Ratios as Indicators of Possible Mechanisms and Environmental Conditions

The correlations between element concentrations identified in this study may reflect several main mechanisms of TE accumulation in the shells such as: (i) metabolic reactions leading to carbonate mineral generation within the mollusk’s body and co-precipitation with aragonite in the “extrapallial” fluid; (ii) complexation with organic matter (periostracum, winter lines, nacreous) of the shell structure; (iii) co-deposition with iron (III) or manganese (IV) hydroxide on the surface of growing shells and (iv) nonspecific passive capture (occlusion) of river water or sediment porewater particles (silicates, sulfides, organic debris) during filtration of the surrounding water (Bolotov et al., 2015).
There was a sizable (a factor of 7 to 11) increase in the Fe concentration in the U. pictorum and U. tumidus shells and in water from biotopes in the direction from the headwaters of the basin to the mouth of the Severnaya Dvina River (R² = 0.928, p < 0.01). In addition, such a regression relationship was also revealed for phosphorus in the shells of mollusks of this genus (R2 = 0.934, p < 0.01), Figure 7. No such dependence was found for bottom sediments from the corresponding sampling points. In our opinion, this is due to variability of the bottom sediment composition at the sampling sites (from loam to medium-grained sand). In contrast, a strong positive correlation between Fe and P in shells of mollusks may indicate either P co-precipitation with Fe hydroxide or formation of Fe phosphate at the shell surface or impregnated between growing layers. Strong removal of P with Fe hydroxide from aqueous solutions is fairly well known [24,25,26]. The importance of this process for concomitant Fe and P accumulation in mollusks shells is consistent with the fact that the Kd Shell/Water for Fe and P did not exhibit statistically significant regression relationships with the distance from the mouth of the Severnaya Dvina River (p > 0.05), despite sizable variations of these element concentrations in the river water.
For the Severnaya Dvina River, Dzhamalov et al. [27] reported a downstream trend of an increase in Fe dissolved concentration and export fluxes. This trend can be linked to a progressive increase of the bog coverage and a shift in the watershed rock lithology, from carbonates and evaporates in the headwaters and small tributaries to silicate moraine and Archean metamorphic rocks in the low reaches of the basin [28,29]. The data on Fe concentration in shells and ecosystem compartments obtained in this study are consistent with these observations. A northward increasing trend in Fe concentration is evidenced from 6 sampling sites located in the section of the basin from the confluence of the Yug River to the mouth of the Severnaya Dvina River (Figure 7). Therefore, the shells of freshwater mussels with an average lifespan of about five years represent an archive that can be complementary to a long-term river water chemistry monitoring via hydrochemical analyses, i.e., [27,30].
Additional information about the environmental conditions of biotopes can be obtained via the concentration ratios of an element to Ca or Fe (i.e., Mn/Fe, Mn/Ca). A linear regression (p = 0.0016) was revealed between the Mn/Fe ratio in the U. pictorum and U. tumidus shells and in sediments from the corresponding biotopes in the Severnaya Dvina River Basin (Figure 8). Given that Mn/Fe ratio can serve as an indicator of the redox conditions at the sediment-water interface, i.e., [10], the accumulation of Mn relative to Ca in skeletons of mollusks reflects the corresponding redox conditions, which are operating under anoxic/suboxic conditions at the sediment-water interface.
On the one hand, among various mechanisms, Mn, and Fe immobilization in the form of MnS and FeS both in the sediments and shells can be involved. This is consistent with elevated sulfide concentration in upper layer of riverine sediments in the region [31]. On the other hand, preferential uptake of Mn vs. Fe by shells can be explained by higher affinity of Mn2+ to the carbonate mineral structure compared to Fe3+ in the environmental conditions, which are not sufficiently reduced to convert Fe3+ into Fe2+.
Zhao et al. [10] suggested the ranking of different species of freshwater mollusks with respect to the Mn/Ca ratio in watercourses of different trophic status. In terms of their average Mn/Ca (mmol/mol) values in shells, the U. tumidus, U. pictorum and A. anatina samples from the studied basins (the Severnaya Dvina and the Onega rivers) correspond to mesotrophic watercourses (Figure 9). The values of the Mn/Ca ratio in the shells of freshwater bivalve mollusks can reflect the occurrence of reducing conditions at the water-sediment interface; such conditions may occur due to eutrophication [10]. In the studied shells, the Mn/Ca ratios are higher in the A. anatina shells (p < 0.01), because this species lives under conditions of lower oxygen content, burrowing deeper into softer clay sediments in comparison with Unio specimens from the same biotope.

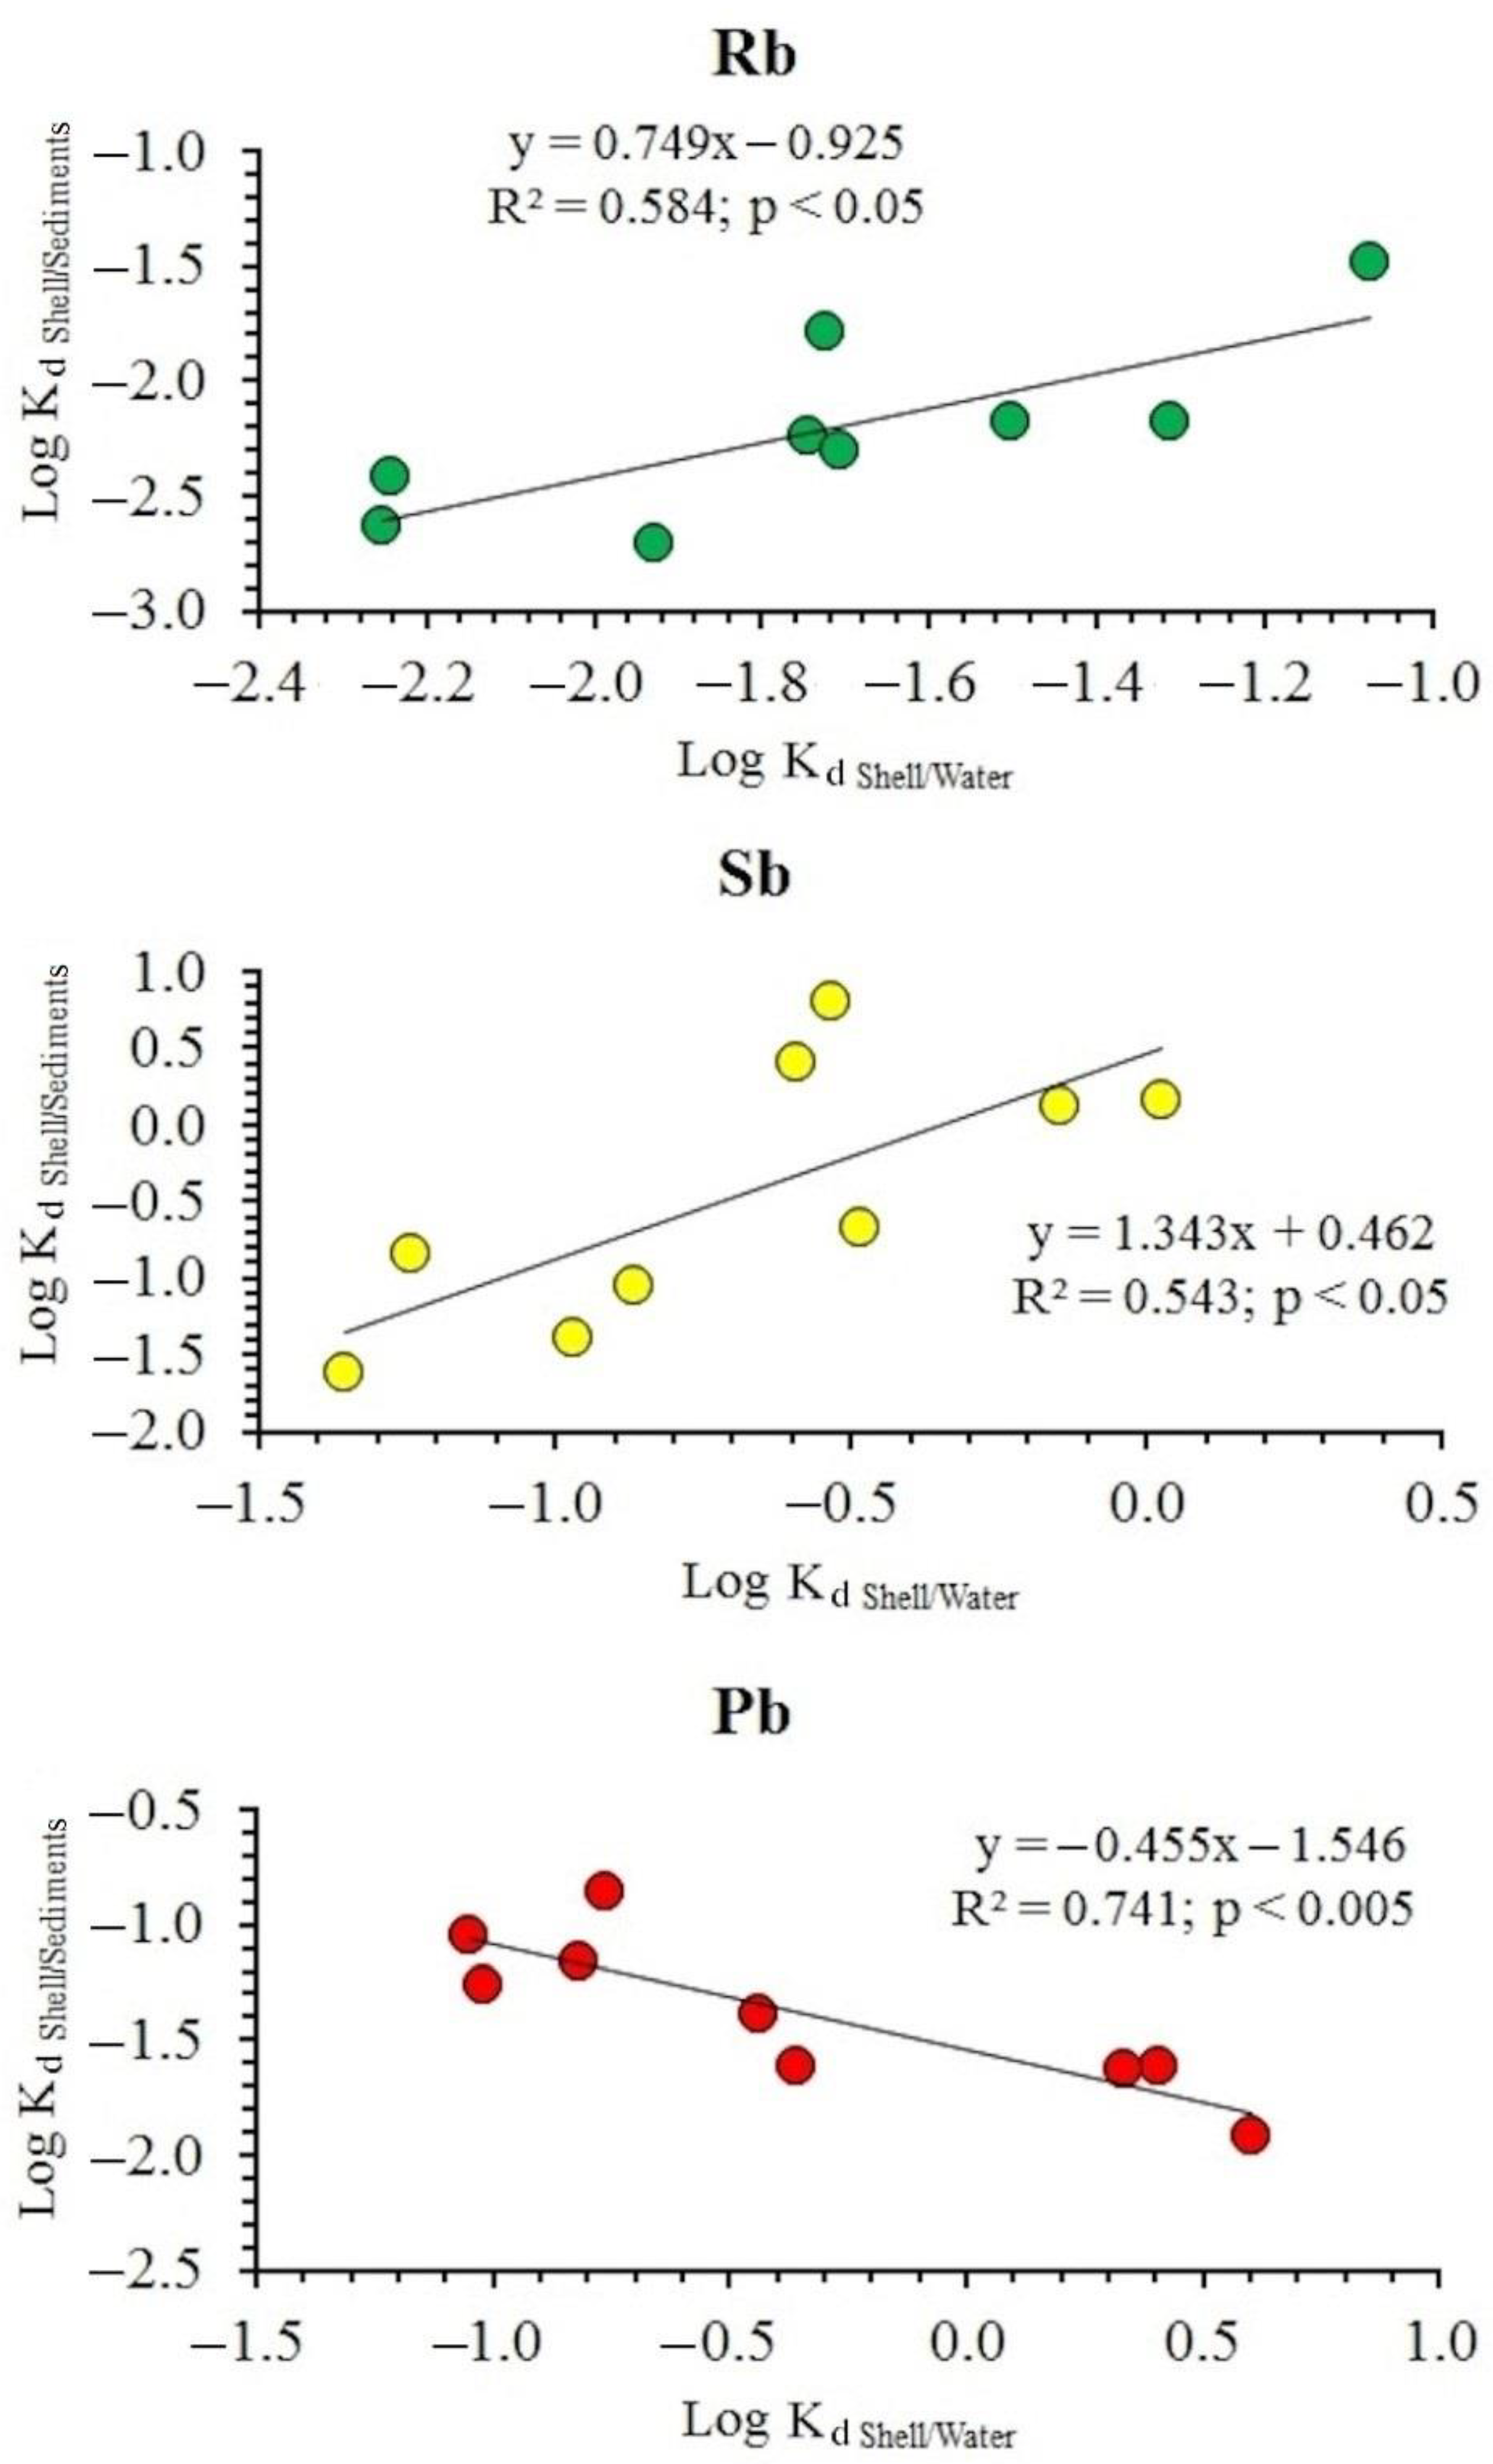
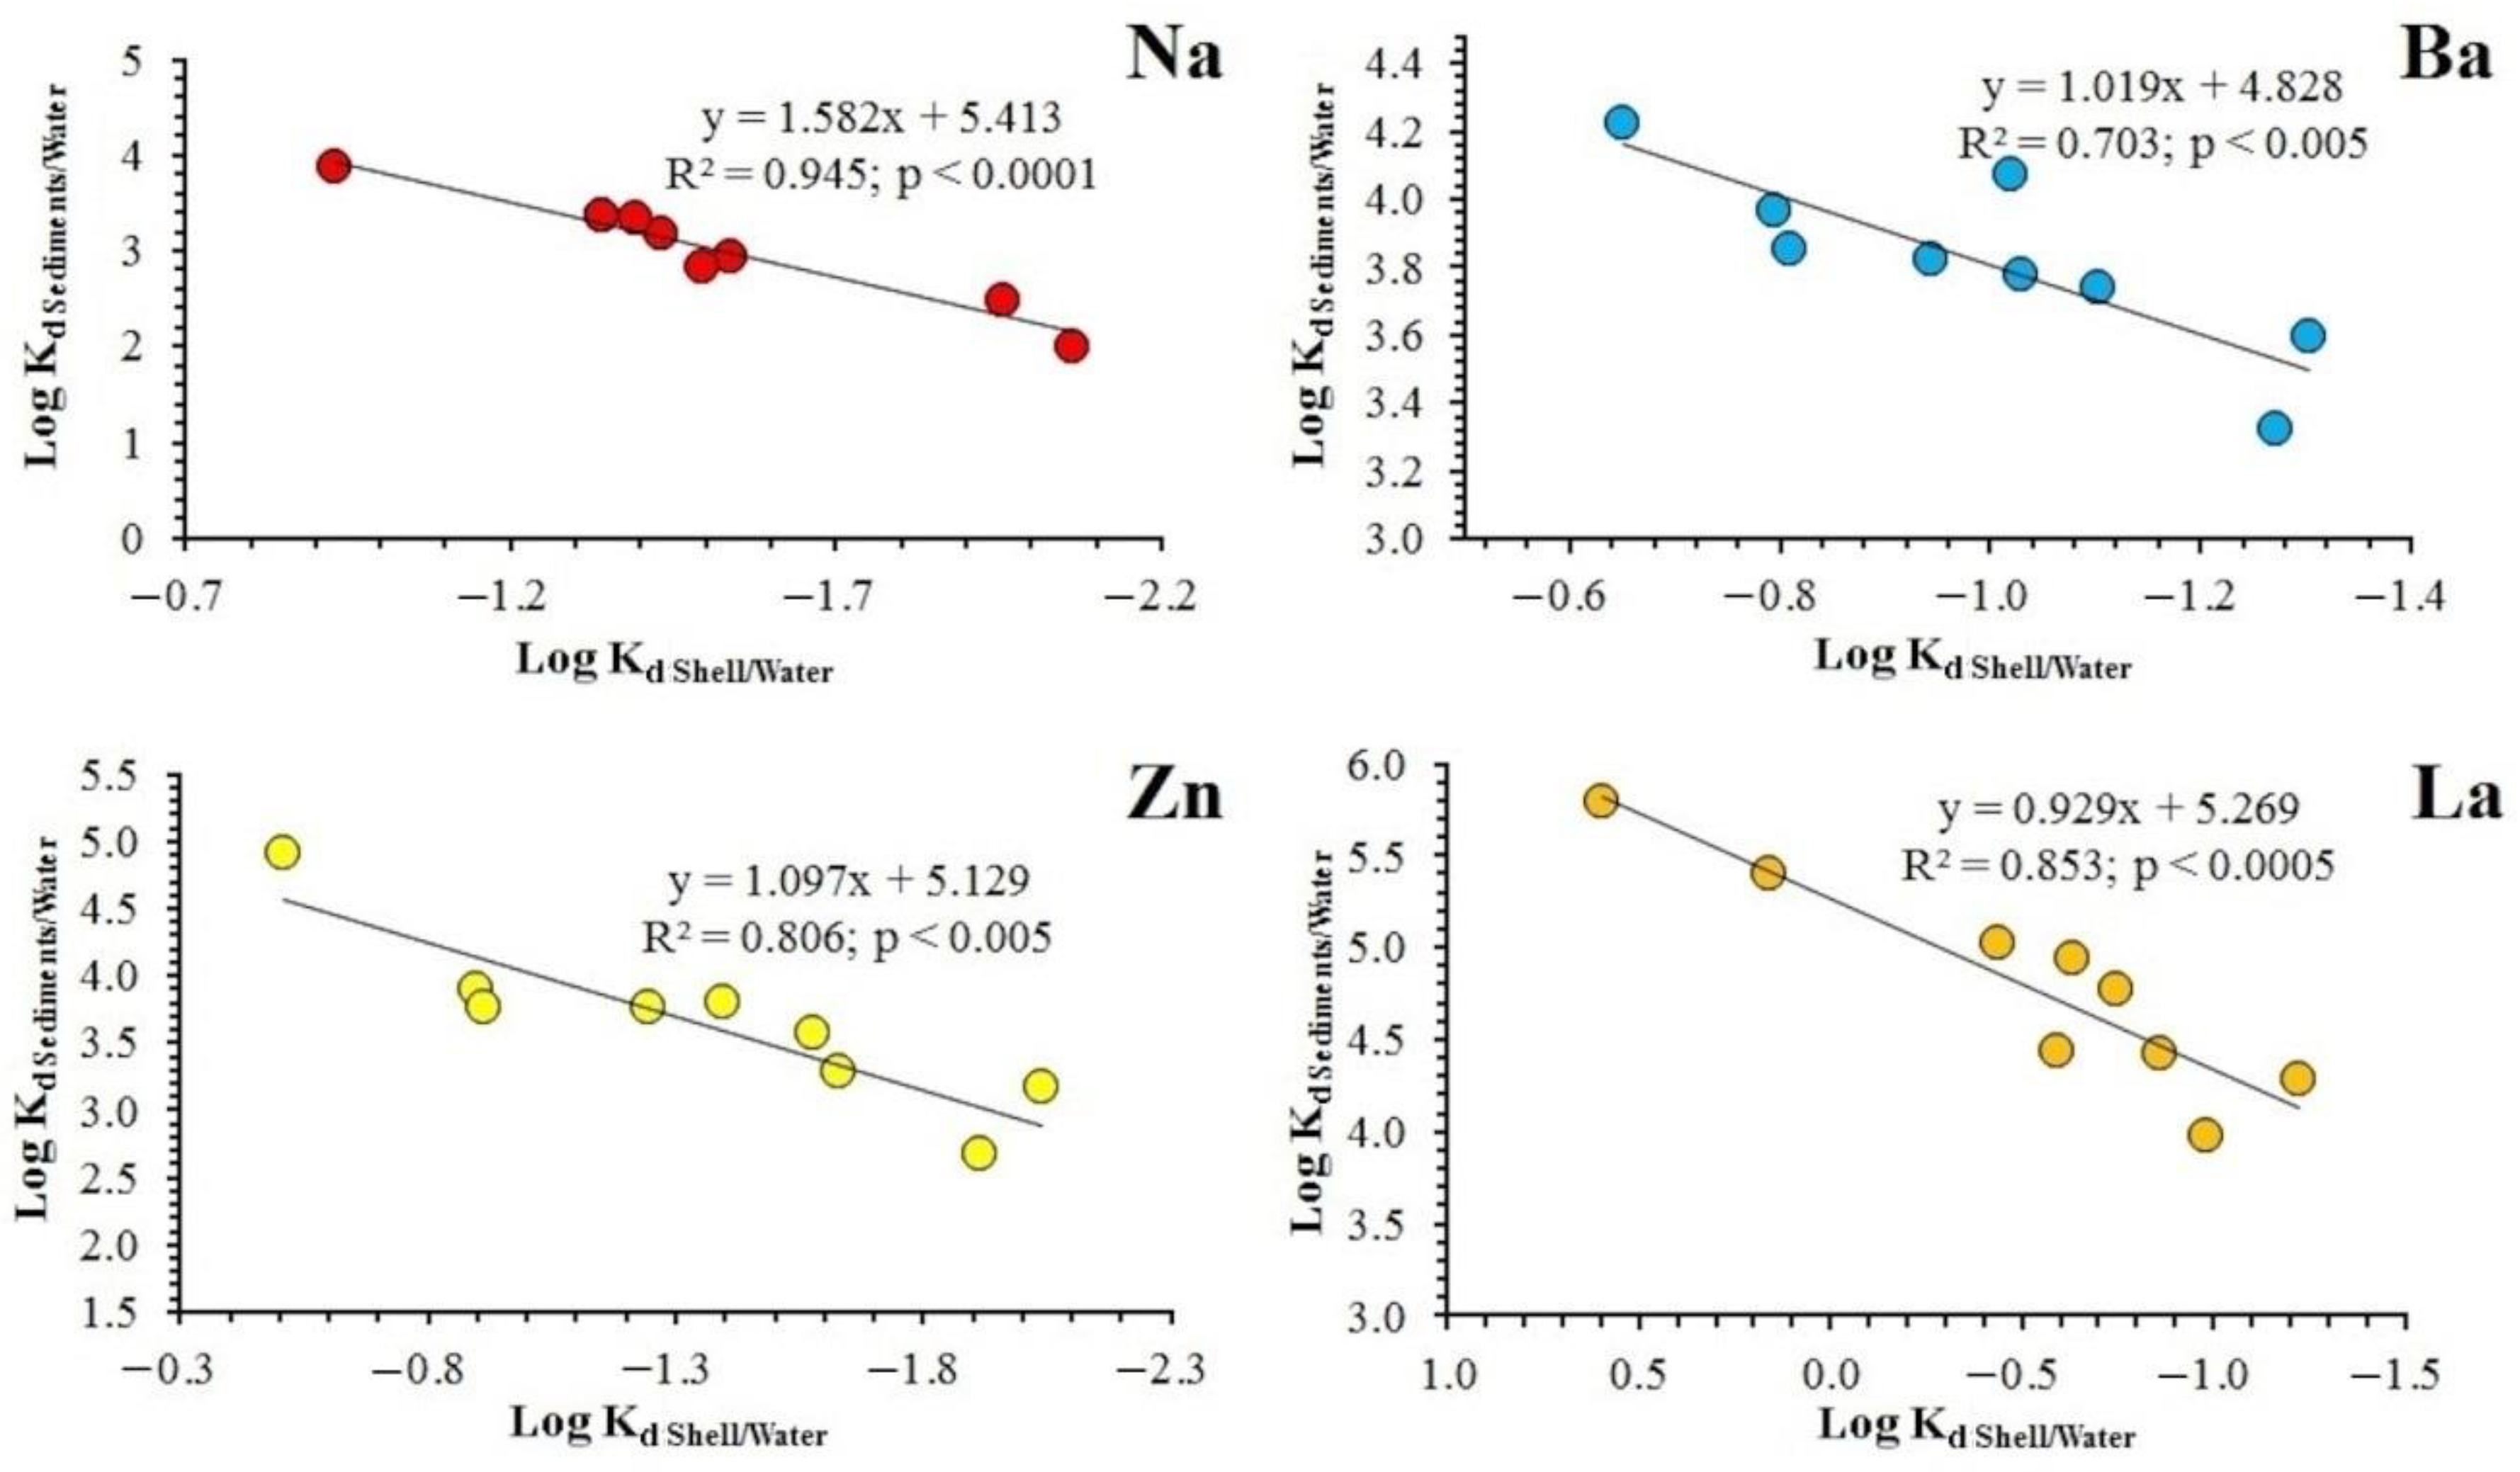
4.2. Relationship between the Content of Chemical Elements in Shells, Water and Sediments

The distribution coefficients (Kd) of chemical elements between different compartments of the ecosystem were calculated to assess the efficiency of element uptake by mollusks shells from the surrounding milieu. The lowest values of the distribution coefficients (Kd Shell/Water, Kd Shell/Sediments) of highly mobile elements such as Na, S, Sr, Sb, and U were established in the localities of the Severnaya Dvina Basin. These elements are most abundant in the bottom water layer. Lithophile elements (Al, Ti, Mn, Cu, Zr, Pb) exhibited the highest values of the distribution coefficient between the shell and the river water or the sediment.
According to the graphs presented in Figure 10, Rb, Sb, and Pb exhibited linear regression coefficients of Log Kd Shell/Water (X) and Log Kd Shell/Sediment (Y). A positive regression was found for Rb (R2 = 0.58; p < 0.05) and Sb (R2 = 0.54; p < 0.05), whereas a negative regression was observed for Pb (R2 = 0.74; p < 0.005).
Overall, an increase in Kd Shell/Water with Kd Sediments/Water may reflect (1) a concomitant immobilization of an element from the river water to the shells and the sediments; (2) efficient uptake of an element by mollusks from the surrounding sediments.
Another important observation is that sodium, zinc, barium, and lanthanum demonstrated significant (p < 0.005) linear dependence of Log Kd Shell/Water and Log Kd Sediment/Water values (Figure 11). These ratios reflect the dependence of the element contents in the shells and sediment concentration in water. Some elements can accumulate in greater amounts in the sediments, with the highest Kd values of Zn and La corresponding to localities with a clay substrate. Sodium has lower values of the distribution coefficients between sediments and water, as well as between shells and water, which is associated with its relatively high concentration and mobility in the liquid phase. The correlations observed between the distribution coefficients of elements between shells/water and sediments by water show that Na, Zn, Ba, and La (and generally all light REE) are more evenly distributed between liquid/solid phases and shells compared to other studied elements, which is consistent with recent results of Sedeño-Díaz et al. [22].
A dependence of the metal pollution index for Anodonta and Unio shells as a function of the distance to the river mouth was strongly pronounced for the Severnaya Dvina River Basin. This dependence can be approximated by a power function (R2 = 0.824, p < 0.05, Figure 12). The metal pollution index (MPI) includes the sum of the concentrations of all metal elements (without Ca) accumulated in shells following Usero et al. [21,32] and Stankovic et al. [33]. The MPI value increased in the direction from the headwaters to the mouth of the Severnaya Dvina River. Such a downstream accumulative pattern can be explained by the location of large agglomeration (Arkhangelsk city, population of 354,100 inhabitants) in the low reaches of the river. Statistically significant differences between locations were found for the metal pollution index (p = 0.003). The highest index values were found for biotopes located in the mouth of the Severnaya Dvina and the Onega rivers. This likely reflects an increasing local anthropogenic pressure (urban sewage waters, some industry) from the town of Onega and Arkhangelsk, located in the mouth zone of both rivers. At the same time, there was no statistically significant regression relationship for concentrations of Zn, Cd, Pb, As, Sb, Cu, Ni, Co, Cr in shells and for Kd Shell/Water with the distance from the mouth of the Severnaya Dvina River (p > 0.05). The contrast in Fe and metal/metalloid spatial pattern is noteworthy as it suggests that sole urban pollution cannot be responsible for elevated Fe concentration in the low reaches of the Severnaya Dvina River. Rather, enhanced proportion of bogs and wetlands in the mouth zone of Severnaya Dvina may provide high amount of Fe, essentially in the form of organo-ferric colloids i.e., [28,34] to the river main stem.

5. Conclusions

Analyses of the chemical composition of mollusks shells, water, and sediments of the two largest European Arctic Rivers—Severnaya Dvina and Onega—demonstrated a sizable accumulation of a small number of elements (Mg, Al, Mn, Ba, and U) in the shells. These elements exhibited statistically significant differences between studied genera and allowed to trace the ecological preferences of certain species in terms of the substrate. The differences in element concentrations in shells and ecosystem compartments (river water and sediments) between river basins partially stem from the lithological composition of the catchment area and the presence of bogs at the watershed.
The specificity of lithological and mineralogical composition of bottom sediments controls the conditions of chemical element distribution between the components of the riverine ecosystem in each locality. These results suggest that element accumulation in the shell depends on specific conditions of the biotope.
The concentrations of iron in the water and shells and phosphorus in the shells of bivalve mollusks (Unio spp.) increased in the direction from the upper parts of the basin to the low reaches of the Severnaya Dvina River. This suggested strong influx of iron from the bogs of the catchment to the river and Fe accumulation by the freshwater mussels.
The principal component analysis revealed three main factors; the first was interpreted as the concentration pattern (1), the second one was responsible for accumulation of iron and phosphorus during shell growth (2), and the third is reflecting the conditions of biotopes associated with the composition of the bottom sediments (3).
The metal pollution indices demonstrated progressive enrichment in the confluence of the Severnaya Dvina River and the Pinega River and also in the vicinity of the river mouth, reflecting possible point source contamination originated from industrial and pollution activity.

Supplementary Materials

The following are available online at https://www.mdpi.com/article/10.3390/w13223227/s1, Figure S1: the power relationships between Fe and P concentrations in A. anatina (1) and Unio spp. (2) shells; Figure S2: the power relationships between Al and Mg concentrations in A. anatina (1) and Unio spp. (2) shells; Figure S3: the power relationships between Al and K concentrations in A. anatina (1) and Unio spp. (2) shells; Figure S4: the power relationships between Fe and Y concentrations in A. anatina (1) and Unio spp. (2) shells.

Author Contributions

O.S.P., A.A.L. and I.N.B. developed the concept of this study. A.A.T., I.V.V., O.V.T., A.S.O. and I.N.B. collected samples. A.A.L. and A.A.T. carried out preparation of samples for chemical analyses. A.A.L. and N.A.Z. performed statistical processing of the geochemical data. I.V.V. and A.A.T. determined taxonomic position of individuals of studied mollusks’ samples. A.A.L. and O.S.P. wrote the paper, with input from A.V.C., A.A.T., A.V.K. and I.N.B. All authors have read and agreed to the published version of the manuscript.

Funding

This research was funded by the Russian Science Foundation, Grant Number 21-17-00126.

Institutional Review Board Statement

Not applicable.

Informed Consent Statement

Not applicable.

Data Availability Statement

The data that support the findings of this study are available from the corresponding author upon reasonable request.

Acknowledgments

We are grateful to those who assisted us in sample collection for chemical analyses: Svetlana E. Sokolova, Yulia V. Bespalaya, Galina D. Popova, Elena D. Lyubas, and Maxim V. Popov. We also wish to express our gratitude to Vasilii K. Karandashev (IMT RAS, Chernogolovka, Moscow Region) for assisting in chemical analyses.

Conflicts of Interest

The authors declare no conflict of interest.

References

  1. Schöne, B.R.; Dunca, E.; Mutvei, H.; Norlund, U. A 217-year record of summer air temperature reconstructed from freshwater pearl mussels (M. margaritifera, Sweden). Quat. Sci. Rev. 2004, 23, 1803–1816. [Google Scholar] [CrossRef]
  2. Schöne, B.R.; Page, N.A.; Rodland, D.L.; Fiebig, J.; Baier, S.; Helama, S.O.; Oschmann, W. ENSO-coupled precipitation records (1959–2004) based on shells of freshwater bivalve mollusks (Margaritifera falcata) from British Columbia. Int. J. Earth Sci. 2007, 96, 525–540. [Google Scholar] [CrossRef]
  3. Van der Putten, E.; Dehairs, F.; Keppens, E.; Baeyens, W. High resolution distribution of trace elements in the calcite shell layer of modern Mytilus edulis: Environmental and biological controls. Geochim. Cosmochim. Acta. 2000, 64, 997–1011. [Google Scholar] [CrossRef]
  4. Roditi, H.; Fisher, N.; Sañudo-Wilhelmy, S. Uptake of dissolved organic carbon and trace elements by zebra mussels. Nature 2000, 407, 78–80. [Google Scholar] [CrossRef]
  5. Dunca, E.; Mutvei, H.; Schöne, B.R. Freshwater bivalves tell of past climates: But how clearly do shells from polluted rivers speak? Palaeogeogr. Palaeoclimatol. Palaeoecol. 2005, 228, 43–57. [Google Scholar] [CrossRef]
  6. Bolotov, I.N.; Pokrovsky, O.S.; Auda, Y.; Bespalaya, J.V.; Vikhrev, I.V.; Gofarov, M.Y.; Lyubas, A.A.; Viers, J.; Zouiten, C. Trace element composition of freshwater pearl mussels Margaritifera spp. across Eurasia: Testing the effect of species and geographic location. Chem. Geol. 2015, 402, 125–139. [Google Scholar] [CrossRef]
  7. Lyubas, A.A.; Kabakov, M.B.; Kriauciunas, V.V.; Obada, T.F.; Nicoara, I.N.; Tomilova, A.A. Freshwater mollusks from Neogene-Quaternary Dniester and Prut riverine deposits as indicator paleoenvironments: Chemical composition of shells and its palaeoecological interpretation. Arct. Environ. Res. 2019, 19, 35–42. [Google Scholar] [CrossRef]
  8. Van Plantinga, A.A.; Grossman, E.L. Trace elements in mussel shells from the Brazos River, Texas: Environmental and biological control. Biogeosci. Discuss. 2019, 1–27. [Google Scholar] [CrossRef]
  9. Aljahdali, M.O.; Alhassan, A.B. Spatial variation of metallic contamination and its ecological risk in sediment and freshwater mollusk: Melanoides tuberculata (Müller, 1774) (Gastropoda: Thiaridae). Water 2020, 12, 206. [Google Scholar] [CrossRef] [Green Version]
  10. Zhao, L.; Walliser, E.O.; Mertz-Kraus, R.; Schöne, B.R. Unionid shells (Hyriopsis cumingii) record manganese cycling at the sediment–water interface in a shallow eutrophic lake in China (Lake Taihu). Palaeogeogr. Palaeoclimatol. Palaeoecol. 2017, 484, 97–108. [Google Scholar] [CrossRef]
  11. Naeher, S.; Gilli, A.; North, R.P.; Hamann, Y.; Schubert, C.J. Tracing bottom water oxygenation with sedimentary Mn/Fe ratios in Lake Zurich, Switzerland. Chem. Geol. 2013, 352, 125–133. [Google Scholar] [CrossRef]
  12. Ravera, O.; Cenci, R.; Beone, G.M.; Dantas, M.; Lodigiani, P. Trace element concentrations in freshwater mussels and macrophytes as related to those in their environment. J. Limnol. 2003, 62, 61–70. [Google Scholar] [CrossRef] [Green Version]
  13. Watanabe, T.; Suzuki, M.; Komoto, Y.; Shirai, K.; Yamazaki, A. Daily and annual shell growth in a long-lived freshwater bivalve as a proxy for winter snowpack. Palaeogeogr. Palaeoclimatol. Palaeoecol. 2021, 569, 110346. [Google Scholar] [CrossRef]
  14. Zhadin, V.I. Mollusks of fresh and brackish waters of the USSR. Keys Fauna USSR Publ. Zool. Inst. USSR Acad. Sci. 1952, 46, 1–376. (In Russian) [Google Scholar]
  15. Klishko, O.K.; Lopes-Lima, M.; Bogan, A.E.; Matafonov, D.V.; Froufe, E. Morphological and molecular analyses of Anodontinae species (Bivalvia, Unionidae) of Lake Baikal and Transbaikalia. PLoS ONE 2018, 13, e0194944. [Google Scholar] [CrossRef]
  16. Bolotov, I.N.; Kondakov, A.V.; Konopleva, E.S.; Vikhrev, I.V.; Aksenova, O.V.; Aksenov, A.S.; Bespalaya, Y.V.; Borovskoy, A.V.; Danilov, P.P.; Dvoryankin, G.A.; et al. Integrative taxonomy, biogeography and conservation of freshwater mussels (Unionidae) in Russia. Sci. Rep. 2020, 10, 1–20. [Google Scholar] [CrossRef] [Green Version]
  17. Konopleva, E.S.; Bolotov, I.N.; Vikhrev, I.V.; Gofarov, M.Y.; Kondakov, A.V. An integrative approach underscores the taxonomic status of Lamellidens exolescens, a freshwater mussel from the Oriental tropics (Bivalvia: Unionidae). System. Biodivers. 2017, 15, 204–217. [Google Scholar] [CrossRef]
  18. Konopleva, E.S.; Pfeiffer, J.M.; Vikhrev, I.V.; Kondakov, A.V.; Gofarov, M.Y.; Aksenova, O.V.; Lunn, Z.; Chan, N.; Bolotov, I.N. A new genus and two new species of freshwater mussels (Unionidae) from western Indochina. Sci. Rep. 2019, 9, 1–14. [Google Scholar] [CrossRef]
  19. Karandashev, V.K.; Turanov, A.N.; Orlova, T.A.; Lezhnev, A.E.; Nosenko, S.V.; Zolotareva, N.I.; Moskvina, I.R. Application of mass-spectrometry with inductively coupled plasma to elemental analysis of environmental objects. Ind. Lab. Diagn. Mater. 2007, 73, 12–22. [Google Scholar]
  20. Karandashev, V.K.; Leikin, A.Y.; Khvostikov, V.A.; Kutseva, N.K.; Pirogova, S.V. Water analysis by inductively coupled plasma mass spectrometry. Inorg. Mater. 2016, 52, 1391–1404. [Google Scholar] [CrossRef]
  21. Usero, J.; González, E.; Regalado, L.; Gracia, I. Trace metals in the bivalve mollusc Chamelea gallina from the Atlantic coast of Southern Spain. Baseline 1996, 32, 305–310. [Google Scholar] [CrossRef]
  22. Sedeño-Díaz, J.E.; López-López, E.; Mendoza-Martínez, E.; Rodríguez-Romero, A.J.; Morales-García, S.S. Distribution coefficient and metal pollution index in water and sediments: Proposal of a new index for ecological risk assessment of metals. Water 2020, 12, 29. [Google Scholar] [CrossRef] [Green Version]
  23. Gural’-Sverdlova, N.V.; Gural’, R.I. Mollusks of the Unionidae Family in the Funds of the State Museum of Natural History of the National Academy of Sciences of Ukraine, Their Conchological Variability and Diagnostic Features. 2015. Available online: http://www.pip-mollusca.org/page/epubl/unionidae.php (accessed on 25 March 2021).
  24. Takacs, I.; Murthy, S.; Smith, S.; McGrath, M. Chemical phosphorus removal to extremely low levels: Experience of two plants in the Washington, DC area. Water Sci. Technol. 2006, 53, 21–28. [Google Scholar] [CrossRef] [PubMed]
  25. Liu, Y.-T.; Hesterberg, D. Phosphate Bonding on Noncrystalline Al/Fe-Hydroxide Coprecipitates. Environ. Sci. Technol. 2011, 45, 6283–6289. [Google Scholar] [CrossRef] [PubMed]
  26. Chen, K.Y.; Hsu, L.C.; Chan, Y.T.; Cho, Y.L.; Tsao, F.Y.; Tzou, Y.M.; Hsieh, Y.C.; Liu, Y.T. Phosphate removal in relation to structural development of humic acid-iron coprecipitates. Sci. Rep. 2018, 8, 10363. [Google Scholar] [CrossRef]
  27. Dzhamalov, R.G.; Mironenko, A.A.; Myagkova, K.G.; Reshetnyak, O.S.; Safronova, T.I. Space–time analysis of hydrochemical composition and pollution of water in the Severnaya Dvina Basin. Water Resour. 2019, 46, 188–198. [Google Scholar] [CrossRef]
  28. Pokrovsky, O.S.; Viers, J.; Shirokova, L.S.; Shevchenko, V.P.; Fillipov, A.S.; Dupre, B. Dissolved, suspended, and colloidal fluxes of organic carbon, major and trace elements in Severnaya Dvina River and its tributary. Chem. Geol. 2010, 273, 136–149. [Google Scholar] [CrossRef]
  29. Malov, A.I. The use of the geological benchmarks to assess the residence time of groundwater in the aquifer using uranium isotopes on the example of the Northern Dvina basin. Lithol. Mineral Resour. 2013, 48, 254–265. [Google Scholar] [CrossRef]
  30. Chupakov, A.V.; Pokrovsky, O.S.; Moreva, O.Y.; Shirokova, L.S.; Neverova, N.V.; Chupakova, A.A.; Kotova, E.I.; Vorobyeva, T.Y. High resolution multi-annual riverine fluxes of organic carbon, nutrient and trace element from the largest European Arctic river, Severnaya Dvina. Chem. Geol. 2020, 538, 119491. [Google Scholar] [CrossRef]
  31. Kokryatskaya, N.M.; Volkov, I.I.; Demidova, T.P.; Murzina, T.S. Sulfur compounds in bottom sediments of fresh-water basins (mouth of the Severnaya Dvina River and Rybinsk Water Reservoir). Lithol. Miner. Resour. 2003, 38, 552–563. [Google Scholar] [CrossRef]
  32. Usero, J.; Gonzalez-Regalado, E.; Gracia, I. Trace metals in the bivalve molluscs Ruditapes decussatus and Ruditapes philippinarum from the Atlantic coast of southern Spain. Environ. Int. 1997, 23, 291–298. [Google Scholar] [CrossRef]
  33. Stankovic, S.; Jovic, M.; Mihajlovic, M.L.; Joksimović, D.; Tanaskovski, B. Metal pollution determined by pollution indices for sea grass P. oceanica and surface sediments. Arch. Biol. Sci. 2015, 67, 91–101. [Google Scholar] [CrossRef]
  34. Pokrovsky, O.S.; Shirokova, L.S.; Viers, J.; Gordeev, V.V.; Shevchenko, V.P.; Chupakov, A.V.; Vorobieva, T.Y.; Candaudap, F.; Causserand, C.; Lanzanova, A.; et al. Fate of colloids during estuarine mixing in the Arctic. Ocean Sci. 2014, 10, 107–125. [Google Scholar] [CrossRef] [Green Version]
Figure 1. Location map of the field study areas: 1—Porog (POR), 2—Kuftyrikha (Kar), 3—Isakogorka (Z), 4—Krasnoflotsky (Kras), 5—Kholmogory (Hol), 6—Marilovo (Mar), 7—Bereznik (Br), 8—Krasnoborsk (KBOR), 9—Shangaly (ShB), 10—Ust’-Alekseevo (UG).
Water 13 03227 g001
Figure 2. Shells of freshwater bivalve mollusks Anodonta anatina (Linnaeus, 1758), Unio pictorum (Linnaeus, 1758) and Unio tumidus Retzius, 1788: AA. anatina, the Severnaya Dvina River near Kholmogory village; BU. pictorum, the Severnaya Dvina near Kholmogory village; CA. anatina, the Onega River near Kargopol town (the Kuftyrikha boundary); DU. tumidus, the Onega River near Kargopol town (the Kuftyrikha boundary). Scale bar = 10 mm.
Water 13 03227 g002
Figure 3. Correlation between trace elements’ concentrations in shells of freshwater mussels Anodonta anatina (A) and Unio spp. (B), collected from the Onega and the Severnaya Dvina River basins: 1—strong positive correlation (RSpearman > 0.7, p < 0.05); 2—medium positive correlation (0.7 ≥ RSpearman ≥ 0.5, p < 0.05); 3—medium negative correlation (− 0.7 ≤ RSpearman ≤ −0.5, p < 0.05).
Water 13 03227 g003
Figure 4. The power relationships between the first principal component and the sum of Ca-normalized elements in each sample.
Water 13 03227 g004
Figure 5. Calcium-normalized distribution coefficients (Kd) of elements between mollusks’ shells (Unio spp. and Anodonta anatina) and river water.
Water 13 03227 g005
Figure 6. Calcium-normalized distribution coefficients (Kd) of elements between mollusks’ shells (Unio spp. and Anodonta anatina) and bottom sediments.
Water 13 03227 g006
Figure 7. Changes in the concentration of iron and phosphorus in U. pictorum and U. tumidus shells and iron in the water from biotopes in the Severnaya Dvina Basin. The power relationships between element concentration (shells) (y) and distance from mouth (Severnaya Dvina) (x) are significant at p < 0.01 for shells’ samples and at p < 0.05 for samples of water.
Water 13 03227 g007
Figure 8. Regression relationships between element Mn/Fe-ratio in U. pictorum and U. tumidus shells (x) and bottom sediments (y) from Severnaya Dvina basin.
Water 13 03227 g008
Figure 9. Comparison of Mn/Ca ratio (mmol/mol) in shells of freshwater bivalve mollusks: 1—Margaritifera margaritifera (oligotrophic rivers), 2—M. laevis (oligotrophic rivers), 3—M. dahurica (oligotrophic rivers), 4—M. laevis (mesotrophic rivers), 5—M. dahurica (mesotrophic rivers), 6—U. tumidus and U. pictorum (mesotrophic rivers), 7—Anodonta anatina (mesotrophic rivers) (References: 1–5—Bolotov et al., 2015, 6–7—this study).
Water 13 03227 g009
Figure 10. Regression relationships between Log Kd Shell/Water (X) and Log Kd Shell/Sediments (Y) for Rb, Sb, and Pb.
Water 13 03227 g010
Figure 11. Regression relationships between Log Kd Shell/Water and Log Kd Sediments/Water for Na, Zn, Ba and La.
Water 13 03227 g011
Figure 12. Regression relationships between values of metal pollution index (Y axis) and the distance from the mouth of the Severnaya Dvina River (X axis) are significant at p < 0.05.
Water 13 03227 g012
Table 1. List of studied localities.
LocalityRiver BasinCoordinatesBottom Sediments and Short Site DescriptionNumber of Samples
1Porog village,
right bank before the rifts
Onega River63°49′44.5″ N 38°28′32.3″ ESilted area of the bottom before the river bend,
bottom sediments—sandy loam
Shells—4
Water—1
Bottom
Sediment—1
2Kuftyrikha boundary near Kargopol townOnega River 61°32′46.9″ N 38°59′54.4″ ECoarse sand, depth 1–1.5 m, slight current, bottom sediments—sand with stones.Shells—4
Water—1
Bottom
Sediment—1
3Perkhachevsky settlement,
Isakogorka anabranch
Severnaya Dvina River64°27′55.2″ N 40°29′22.2″ ESilty bottom, smell of hydrogen sulfideShells—4
Water—1
Bottom
Sediment—1
4Krasnoflotsky island,
beach in the southwest of the island
Severnaya Dvina River64°30′07″ N
40°37′02″ E
Willow beach, bottom sediments—medium-grained sandShells—4
Water—1
Bottom
Sediment—1
5Kholmogory villageSevernaya Dvina River64°14′39.3″ N 41°36′29.9″ EThe bottom is silted in places. The depth increases rapidly near the coast, bottom sediments—sand and siltShells—4
Water—1
Bottom
Sediment—1
6Marilovo villageSevernaya Dvina River64°08′29.0″ N 41°45′47.0″ ESandy coast along the village, bottom sediments—rocky-sandy bottom with clayShells—4
Water—0
Bottom
Sediment—0
7Bereznik village, western side of the beachSevernaya Dvina River62°50′38.0″ N 42°48′01.1″ EBeach, bottom sediments—fine-grained sandShells—3
Water—1
Bottom
Sediment – 1
8Krasnoborsk village, west of Zeleny IslandSevernaya Dvina River61°34′58.0″ N 45°50′42.8″ EBeach northwest of the village, bottom sediments—medium-grained sandShells—4
Water—1
Bottom
Sediment—1
9Shangaly village
Ust’ya river, beach at the suspension bridge
Severnaya Dvina River61°07′52.3″ N 43°20′46.0″ EDepth 1.2–1.5 m, straight section of the river, beach, bottom sediments—medium-grained sand pebbles stones.Shells—4
Water—1
Bottom
Sediment—1
10Yug river, beach in the village Ust-Alekseevo,Severnaya Dvina River60°27′54.1″ N 46°30′21.9″ EThe flow rate is low, bottom sediments—bottom sediments—medium-grained sand. Shells—4
Water—1
Bottom
Sediment—1
Table 2. Elemental composition of Anodonta anatina and Unio spp. shells from the Severnaya Dvina and the Onega river basins: the cross into a cell of the table shows the absence of statistically significant differences (p > 0.05), the check mark in a cell of the table shows the presence of statistically significant differences (p < 0.05).
ElementAnodonta, ppm
Mean ± SE (n = 18)
Unio, ppm
Mean ± SE (n = 21)
Statistically Significant Differences
by Generaby Basinsby Localities
Li0.28 ± 0.040.23 ± 0.02×
Na2340 ± 302300 ± 27×
Mg138 ± 1887.6 ± 9.03×
Al304 ± 47174 ± 30×
P246 ± 89171 ± 62×
K129 ± 2276.8 ± 12.1××
Ti44 ± 6.931.1 ± 3.62××
Cr1.89 ± 0.31.15 ± 0.19×××
Mn680 ± 79423 ± 38×
Fe1580 ± 6531030 ± 493××
Cu3.32 ± 0.282.93 ± 0.23×××
Zn3.47 ± 0.603.26 ± 0.53××
As2.49 ± 0.812.92 ± 1.36×××
Rb0.46 ± 0.100.22 ± 0.05××
Sr635 ± 48713 ± 68×
Zr1.86 ± 0.410.99 ± 0.19××
Y0.35 ± 0.080.22 ± 0.06×
Nb0.095 ± 0.0190.063 ± 0.012××
S314 ± 36301 ± 25××
Sb0.12 ± 0.020.14 ± 0.02××
Cs0.022 ± 0.0050.012 ± 0.002××
Ba64.6 ± 10.143.4 ± 5.3
La0.65 ± 0.140.45 ± 0.11×
Ce1.2 ± 0.230.76 ± 0.18×
Pr0.14 ± 0.030.04 ± 0.02×
Nd0.48 ± 0.10.31 ± 0.07×
Sm0.094 ± 0.0190.058 ± 0.013×
Eu0.018 ± 0.0040.012 ± 0.003×
Gd0.077 ± 0.0180.047 ± 0.013×
Dy0.069 ± 0.0150.044 ± 0.009×
Er0.032 ± 0.0070.019 ± 0.005×
Yb0.03 ± 0.0070.016 ± 0.004×
Pb0.49 ± 0.030.46 ± 0.04×××
Th0.062 ± 0.0110.039 ± 0.011××
U0.030 ± 0.0050.019 ± 0.004×
Table 3. Trace element composition of water from the studied biotopes.
ElementC, ppm
Mean ± SE (n = 9)
ElementC, ppm
Mean ± SE (n = 9)
B42.0 ± 11.7Zr0.226 ± 0.036
Na12000 ± 4340Nb0.005 ± 0.001
Mg11300 ± 1590Mo0.53 ± 0.12
Al70.9 ± 19.1Cd0.018 ± 0.008
Si2180 ± 321Sb0.07 ± 0.02
S10200 ± 2590Cs0.005 ± 0.001
K1320 ± 277La0.208 ± 0.064
Ca42000 ± 5410Ce0.437 ± 0.15
Ti2.12 ± 0.54Pr0.057 ± 0.017
V0.904 ± 0.063Nd0.234 ± 0.068
Mn190 ± 84.9Sm0.047 ± 0.014
Fe449 ± 104Eu0.0089 ± 0.0025
Co0.15 ± 0.04Gd0.046 ± 0.012
Ni0.503 ± 0.118Tb0.0064 ± 0.0018
Cu0.933 ± 0.121Dy0.0346 ± 0.0090
Zn10.3 ± 3.4Ho0.0069 ± 0.0016
As1.3 ± 0.2Er0.0173 ± 0.0043
Br34 ± 11Tm0.0022 ± 0.0006
Sr448 ± 111Yb0.0142 ± 0.0033
Ba59 ± 11Lu0.0021 ± 0.0005
Pb0.192 ± 0.053Hf0.0055 ± 0.0010
Li4.8 ± 0.9W0.0068 ± 0.0018
Be0.009 ± 0.002Tl0.0029 ± 0.0003
Rb1.21 ± 0.15Th0.0215 ± 0.0043
Y0.176 ± 0.047U0.426 ± 0.122
Table 4. Trace element composition of bottom sediments from the studied biotopes.
ElementC, ppm
Mean ± SE (n = 9)
ElementC, ppm
Mean ± SE (n = 9)
Na9130 ± 1520Sn0.349 ± 0.104
Al30200 ± 4260Cs0.702 ± 0.214
P231 ± 51Ba337 ± 34
S1620 ± 1450La9.79 ± 1.88
K8720 ± 910Ce21.3 ± 3.98
Ca16200 ± 665Pr2.31 ± 0.43
Ti1120 ± 257Nd8.84 ± 1.63
Mn362 ± 87Sm1.64 ± 0.32
Fe12100 ± 2980Eu0.392 ± 0.064
Li13.1 ± 6.03Gd1.45 ± 0.28
Be0.786 ± 0.182Tb0.198 ± 0.041
Sc4.00 ± 0.94Dy1.25 ± 0.25
V25.1 ± 6.3Ho0.234 ± 0.047
Cr28.9 ± 5.3Er0.733 ± 0.160
Co4.98 ± 1.12Tm0.105 ± 0.022
Ni16.0 ± 4.3Yb0.759 ± 0.148
Cu9.42 ± 5.22Lu0.106 ± 0.021
Zn34.4 ± 9.1Hf1.23 ± 0.22
Ga5.84 ± 0.83Ta0.334 ± 0.094
As2.71 ± 0.63W0.298 ± 0.13
Rb27.8 ± 2.89Tl0.135 ± 0.012
Sr388 ± 267Pb8.03 ± 1.59
Y6.76 ± 1.52Bi0.03 ± 0.01
Zr49.8 ± 8.8Th1.99 ± 0.53
Nb4.6 ± 1.2U0.79 ± 0.28
Publisher’s Note: MDPI stays neutral with regard to jurisdictional claims in published maps and institutional affiliations.

