Article

Biochemical Composition of Seston Reflecting the Physiological Status and Community Composition of Phytoplankton in a Temperate Coastal Embayment of Korea

1
School of Earth Sciences and Environmental Engineering, Gwangju Institute of Science and Technology, Gwangju 61005, Korea
2
Department of Fisheries, University of Dhaka, Dhaka 1000, Bangladesh
*
Author to whom correspondence should be addressed.
Water 2021, 13(22), 3221; https://doi.org/10.3390/w13223221
Submission received: 23 September 2021 / Revised: 11 November 2021 / Accepted: 12 November 2021 / Published: 13 November 2021
(This article belongs to the Special Issue Eutrophication Management in Coastal Zones for Better Water Quality)

Abstract

:
The biochemical composition of seston along a salinity gradient were examined in the low-turbidity, temperate, estuarine embayment, Gwangyang Bay in Korea. Seasonal variations in sestonic protein (PRT), carbohydrate (CHO), and lipid (LIP) concentrations were analyzed to assess the effects of physiological status and taxonomic composition of phytoplankton. The concentrations of biochemical compounds displayed a close relationship with chlorophyll a (Chla). PRT:CHO ratios were high (>1.0) in the estuarine channel in warmer months and in whole bay in February, indicating a N-replete condition for phytoplankton growth. High CHO:LIP ratios (>2.5) in the saline deep-bay area during the warmer months (>2.0) emphasized the importance of temperature and photoperiod over nutritional conditions. The low POC:Chla (<200), molar C:N (~7) ratios, and biopolymeric carbon concentrations coupled with high primary productivity indicated a low detrital contribution to the particulate organic matter pool. Diatom dominance throughout the year contributed to consistently high carbohydrate concentrations. Furthermore, generalized additive models highlighted that phytoplankton community (i.e., size) structure may serve as an important descriptor of sestonic biochemical composition. Collectively, our results suggest that physiological and taxonomic features of phytoplankton play prominent roles in determining the biochemical composition of seston, supporting the fact that the ecosystem processes in Gwangyang Bay are largely based on phytoplankton dynamics.

1. Introduction

Estuaries form transition zones between riverine and marine biomes [1]. Because of the mixing of freshwater and seawater, estuaries are characterized by pronounced gradients of physical, biogeochemical, and biological processes [2]. Spatiotemporal variabilities in these processes strongly influence the biological community characteristics of the estuarine–marine continuum [3,4,5]. Seston is composed of suspended living and dead material, and plays a vital role in the biogeochemical cycling of materials in estuarine and marine ecosystems [6]. Although plants and particulate organic matter (POM) from various sources are carried by the sea and rivers, living phytoplankton are a major part of seston and are the main primary synthesizers of biochemical compounds (i.e., proteins, carbohydrates, and lipids), through photosynthesis, and support food webs in estuarine and marine systems [7,8]. Therefore, despite the large variety of processes (e.g., tidal resuspension, riverine loads, and turbidity maximum zone) that control the quantity and composition of seston in estuarine and coastal systems [9,10], variations in the biochemical composition of seston can yield valuable information about the biogeochemical factors that control the spatiotemporal distribution, sources, transport, and degradation of POM, as well as phytoplankton growth, total biomass, production, and community composition characteristics [11,12].
In estuarine, coastal, and oceanic ecosystems of high algal standing crops, the biochemical composition of seston might reflect the physiological state of phytoplankton, which responds to changes in environmental conditions such as light availability (i.e., water-column turbidity, [13,14]), temperature [15], and nutrient status (i.e., N:P limitation; [7,16]). For example, in phytoplankton, protein synthesis is high during the high growth phase or productive season, whereas carbohydrate and lipid synthesis is high under high-light-intensity and low-nitrogen conditions [17,18]. Moreover, different phytoplankton size classes (picophytoplankton, <2 μm; nanophytoplankton, 2–20 μm; and microphytoplankton, >20–200 μm) have different nutrient requirements and uptake, metabolic rate (growth, photosynthesis, and respiration), light absorption, and zooplankton grazing rates [19,20,21]. In nutrient-poor conditions, small-sized phytoplankton have a competitive advantage over larger-sized phytoplankton because of their higher surface-area/volume ratio. In contrast, nutrient-rich conditions promote the growth of larger-sized phytoplankton, such as diatoms, because of their ability to take up nutrients rapidly and store them in vacuoles [22]. Accordingly, species composition and/or cell-size diversity are important functional traits for the determination of biochemical composition, as they vary among the major phytoplankton taxa [17,23,24]. In addition, microbial decomposition processes may also serve as an important role in determining sestonic composition, especially in an estuarine embayment [9,10,17]. Such variations in the biochemical composition of seston lead to a concomitant variation in energy content [25]. Therefore, the characterization of the biochemical composition of seston may provide clues to identify the effects of changes in environmental conditions across the land–sea interface, and further evaluate its quality and bioavailability for higher trophic organisms.
Gwangyang Bay, located on the southern coast of South Korea, displays the unique feature of a low particle concentration relative to the huge freshwater discharge from the Seomjin River; therefore, it is characterized as a low-turbidity, temperate embayment system [26]. The short residence time (a few days) of both freshwater and bay water [27,28], as well as the low quantity of suspended particulate matter (SPM), restrict the accumulation of riverine terrestrial particles within the estuary and deep-bay system, generating a low-turbidity condition. The seasonal variability in phytoplankton community composition and primary production is tightly coupled to high input of nutrients delivered by freshwater [24,29,30]. Furthermore, recent evidence demonstrates that in situ primary production, principally by phytoplankton, serves as the prevalent contributor of SPM and POM in this embayment system, thus providing a major trophic base to the benthic and pelagic food web [5,26,31]. For this reason, Gwangyang Bay provides an excellent test-bed system to examine the spatiotemporal variations in the biochemical composition of seston, which may provide insight into the major biogeochemical processes linked to the high biological activity (i.e., phytoplankton biomass and primary production) observed in the phytoplankton-based coastal ecosystem.
In this study, we estimated the biochemical composition (i.e., proteins, carbohydrates, and lipids) of seston; dissolved inorganic nutrients, seston (i.e., total SPM); particulate organic carbon (POC) and particulate nitrogen (PN), δ13C and δ15N values of POM and chlorophyll a (Chla), in association with the primary productivity (PP) and community composition of phytoplankton in Gwangyang Bay. The objectives of the present study were to determine the seasonal and spatial variations in the biochemical composition of seston along the estuarine–coastal continuum and identify the major factors that control its spatial distribution. If in situ production of phytoplankton is a prevalent source of seston, its biochemical composition would reflect the physiological state and taxonomic (i.e., size) composition of phytoplankton according to changes in environmental conditions across the estuarine gradient. The present study tested this hypothesis by correlating the biochemical composition of seston with the nutritional conditions of the water column and dominant phytoplankton species along the longitudinal axis of the bay. Potential isotopic, elemental, and biochemical proxies for the origin of seston were also examined to support the prevalent contribution of autochthonous phytoplankton to the POM pool [9,26,32]. Finally, the ratios of biochemical components were used as useful proxies of the phytoplankton physiological status in response to nutritional conditions [7,16].

2. Materials and Methods

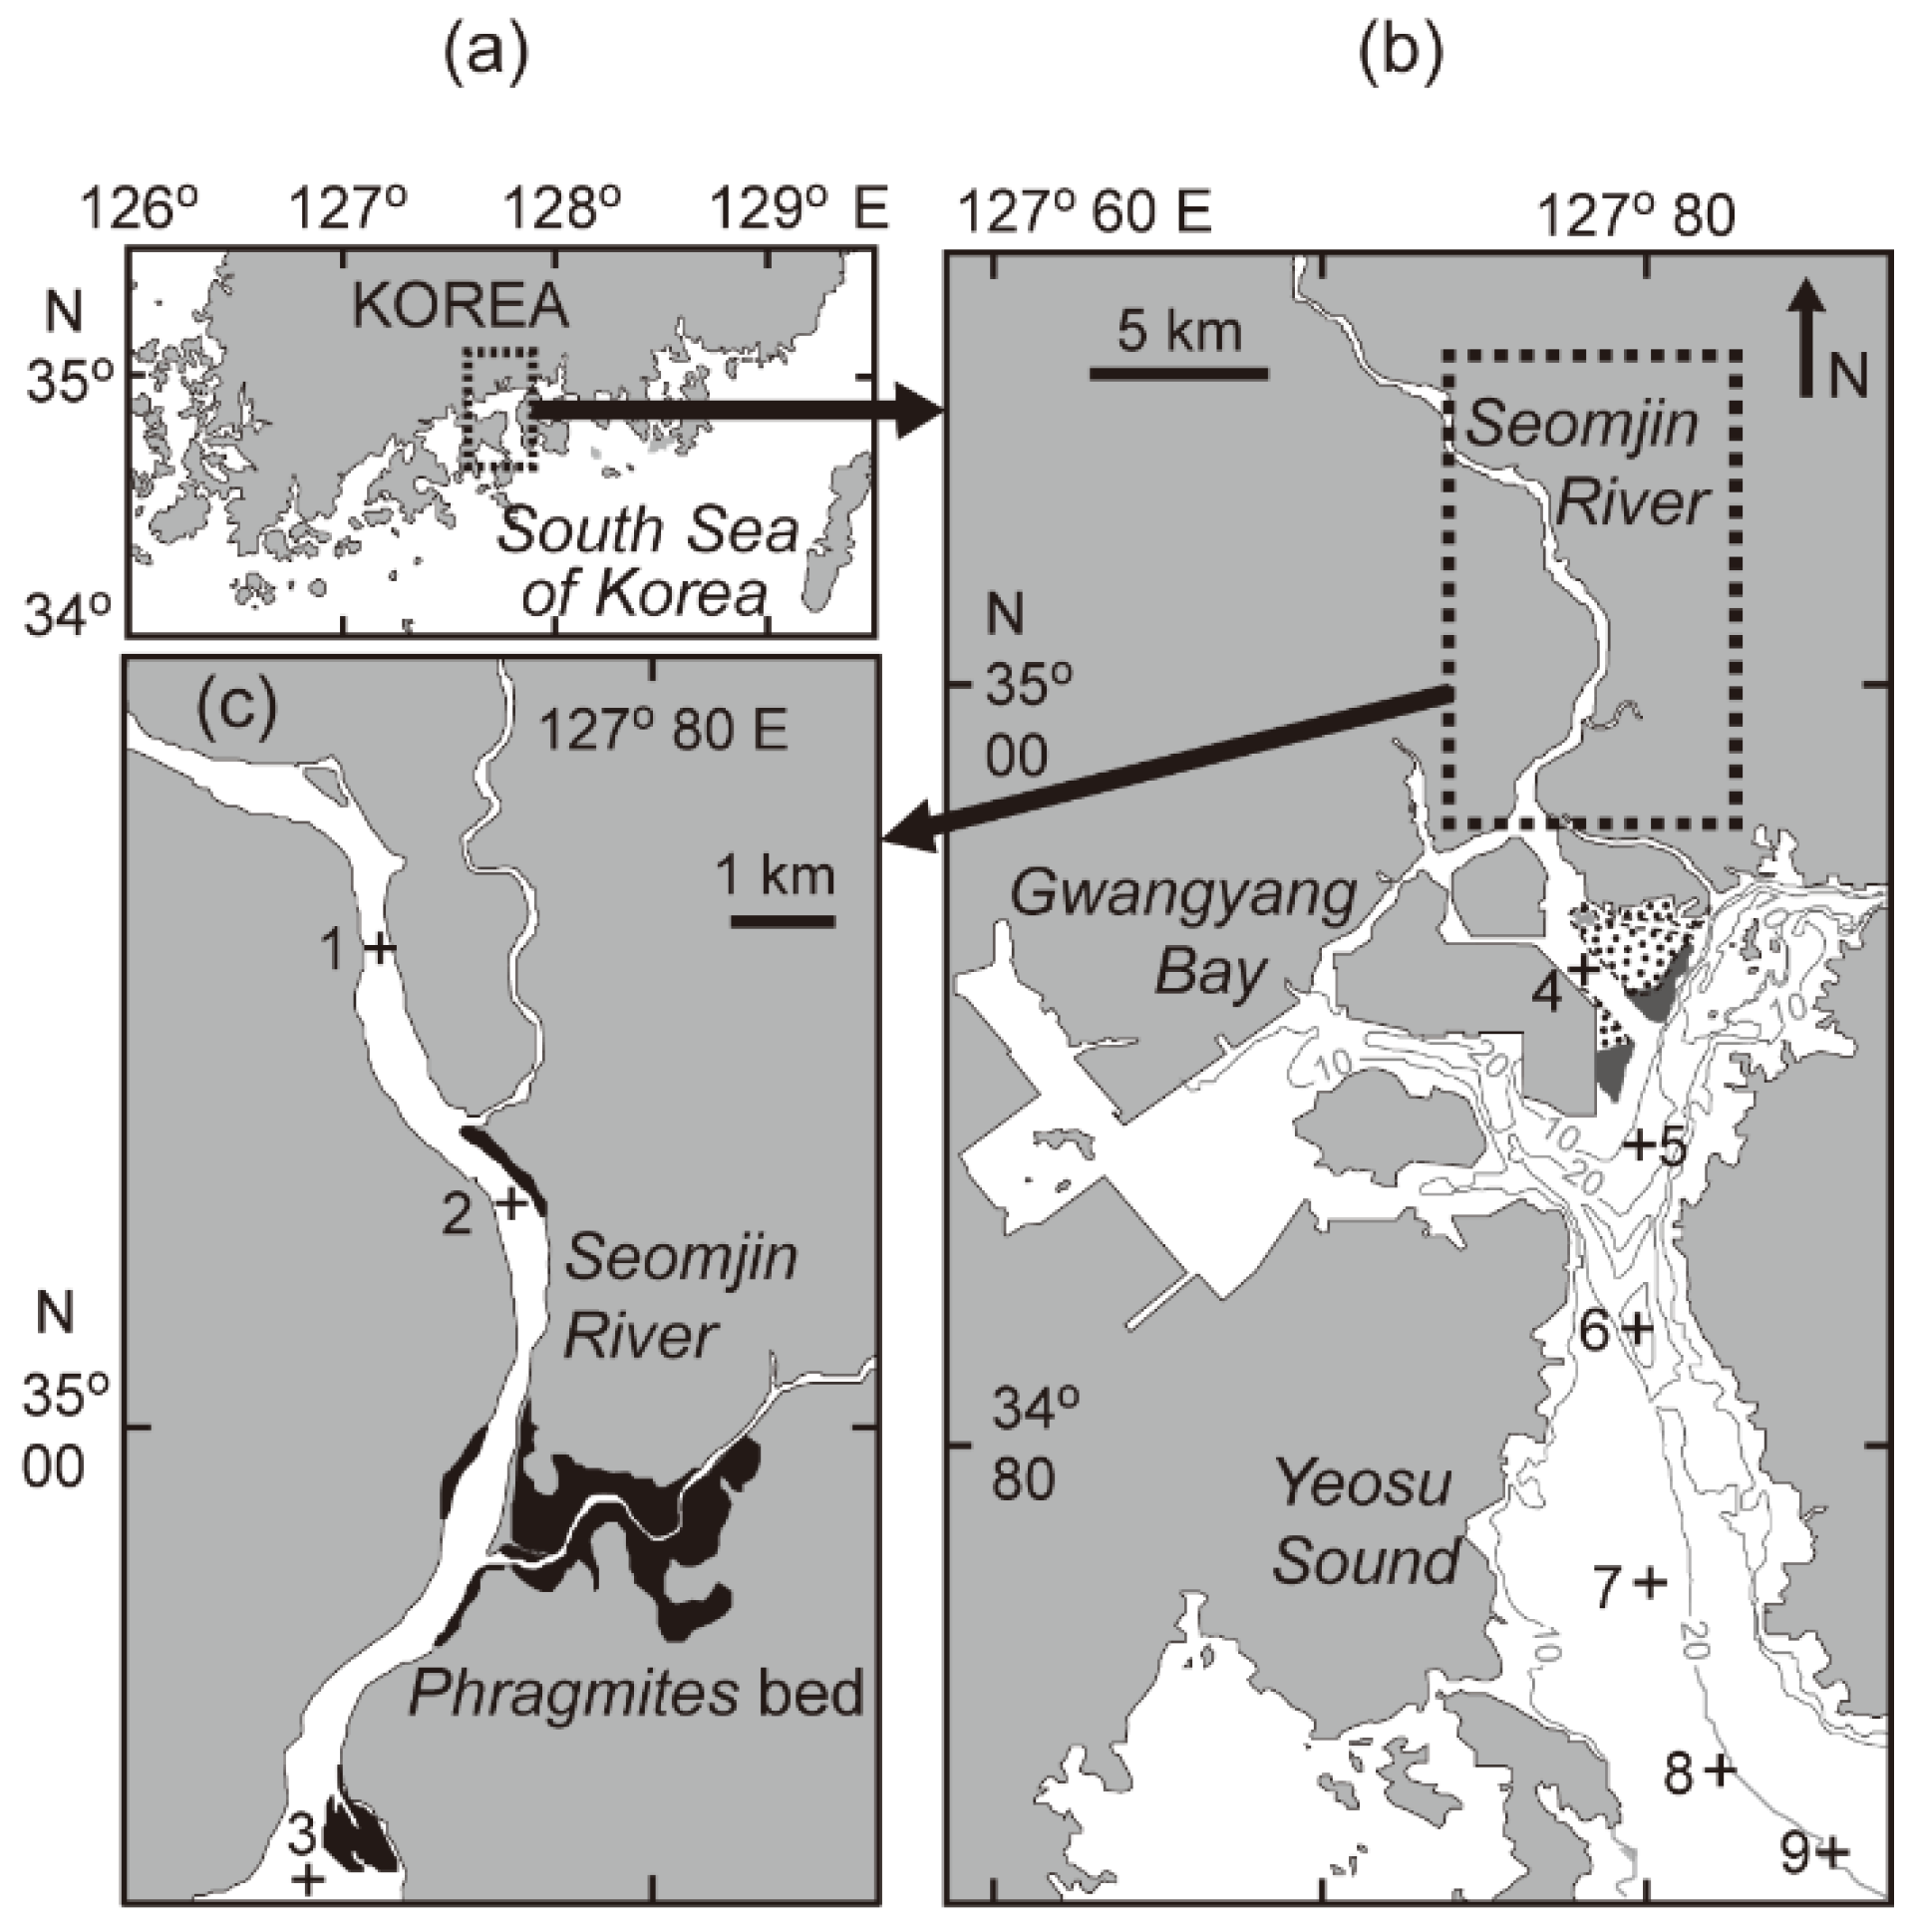
2.1. Study Site and Sample Collection

Gwangyang Bay is located on the southern coast of the Korean peninsula, covering an approximate area of 145 km2. The bay has a semidiurnal tidal cycle, with a maximum tidal range of 3.40 m and 1.10 m during the spring and neap tides, respectively [9]. The Seomjin River discharge varies from 30–95 m3 s−1 during the dry winter period to 300–400 m3 s−1 during the summer monsoon, representing a marked seasonal pattern [33]. The residence time of water is 7 days in the estuarine channel [27] and 1.6–3.4 days in the deep-bay area [28]. The bay is characterized by a mesotide and low turbidity (SPM), and is a highly productive system [26,28,34]. This temperate and semi-enclosed bay system consists of the upper shallow (approximately 2.4–8.0 m deep) estuarine channel from the lower reaches of the Seomjin River in the north, and the main navigation channel, or deep-bay channel (10–30 m deep), in the south [27].
Based on the hydrographic features of the bay, we chose nine distinct stations along the longitudinal transect of the bay for the collection of water samples. Three stations (S1–S3) were located in the oligohaline shallow estuarine channel (salinity 0–8), two stations (S4 and S5) were in the mesohaline, or mixing zone (salinity 15–30), and the four remaining stations (S6–S9) were located in the polyhaline deep-bay channel (salinity >30) (Figure 1). Samplings were conducted seasonally in May (spring), August (summer), and November (fall) of 2017 and February (winter) of 2018. On each sampling occasion, water samples were collected for the determination of dissolved inorganic nutrients, SPM, POC, PN, C and N stable isotopes (termed δ13C and δ15N) of POM, phytoplankton biomass (Chla), and community composition and biochemical composition of seston. Water samples were collected from 1 m below the water surface at each site using a 20-L van Dorn water sampler. The water was prefiltered onboard through a 180-μm Nitex screen, to remove zooplankton and any large particles. Water temperature and salinity were measured using a Conductivity-Temperature-Depth meter (Sea-Bird Electronics, Inc., Bellevue, WA, USA) on each sampling occasion.

2.2. Sample Processing

Immediately after transporting the water samples to the wet laboratory (within 20 min), all prefiltered water samples were filtered again in the laboratory under a gentle vacuum (150–200 mmHg). To measure SPM and phytoplankton (Chla and photosynthetic pigment composition), 1 L of water for each component was filtered through precombusted (450 °C, 2 h) Whatman GF/F filters (ϕ 47 mm; pore size, 0.7 μm). For POC and PN determinations, 0.5 L of water was filtered using Whatman GF/F filters (ϕ 25 mm; pore size, 0.7 μm). The filtered seawater was immediately transferred into acid-washed polypropylene bottles and frozen at −20 °C for nutrients analysis. The filters were also immediately folded, wrapped in aluminum foil, and deep-frozen at −20 °C (−70 °C for pigment samples) until further analyses. For seston biochemical determinations, 1 L of water for individual biochemical components (i.e., proteins, carbohydrates, and lipids) was filtered onto precombusted (450 °C, 2 h) Whatman GF/F filters (ϕ 47 mm; pore size, 0.7 μm). For the determination of the δ13C and δ15N of POM, 1 L of water was filtered onto Whatman GF/F filters (ϕ 25 mm; pore size, 0.7 μm). The filters containing seston samples for POC and PN quantification and isotope measurements were acidified by fuming in a desiccator saturated with hydrogen chloride (HCl) overnight, to remove inorganic carbonates [35]. Duplicate measurements were performed for all analyses and average values were used.

2.3. Laboratory Analysis

2.3.1. Dissolved Inorganic Nutrients and SPM

Before the analysis of inorganic nutrients, water samples were thawed overnight at low temperature (2 °C) and brought to room temperature (25 °C). The concentrations of dissolved inorganic nutrients were colorimetrically determined using a QuAAtro nutrient analyzer (SEAL Analytical GmbH, Norderstedt, Germany) according to the procedures developed for phosphate (PO43−; [36]); ammonium (NH4; [37]); and nitrite (NO2), nitrate (NO3), and silicate (SiO2; [38]).
The preweighed filters containing seston were oven-dried at 60 °C for 72 h and reweighed after cooling to room temperature in a vacuumed desiccator. The concentration of SPM was determined by the difference in the mass of the filters between before and after filtration. POM was determined after combusting the filters at 450 °C for 4 h. POM concentration was estimated by the difference in mass before and after combustion.

2.3.2. Photosynthetic Pigments and Chemotaxonomic Composition of Phytoplankton

Photosynthetic pigments (including Chla) were extracted in 95% methanol (5 mL) for 12 h in the dark at −20 °C and sonicated for 5 min. The filters were then ground with a homogenizer and the solution extracted was centrifuged at 3000 rpm for 10 min, to remove any particulate material. The extracts were filtered through 0.45 mm polytetrafluoroethylene (PTFE) syringe filters, mixed with 300 μL of water (HPLC grade), and transferred to an automated sampler through analytical vials. The individual pigment concentrations were assessed using a reverse-phase high-performance liquid chromatography instrument (LC-20AD, Shimadzu Co., Kyoto, Japan) equipped with a Waters Symmetry C8 (4.6 × 150 mm; particle size, 3.5 mm; pore size, 100 Å) column (Waters, Milford, MA, USA), as described by [39]. The procedures used for pigment analysis are described in greater detail elsewhere [40].
All detected diagnostic pigments (Chla, Chlb, peridinin, 19-butanoyloxyfucoxanthin, fucoxanthin, prasinoxanthin, violaxanthin, neoxanthin, 19-hexanoyloxyfucoxanthin, diadinoxanthin, alloxanthin, zeaxanthin, lutein, and β-apo-carotenal) were determined by a spectrophotometer with known specific extinction coefficients [41]. Sample peaks were identified based on the comparison of their retention times with those of pure standards. Canthaxanthin was used as the internal standard for peak identification. Based on the initial estimate of the pigment ratios, the contribution of phytoplankton groups to total Chla was estimated using the CHEMTAX software [42]. Class-specific input pigment ratios reported previously for various phytoplankton species from Korean waters [43] were used in this calculation procedure. Based on size structure of phytoplankton community composition for generalized additive models [GAMs], diatoms and dinoflagellates were grouped as microphytoplankton; cryptophytes, pelagophytes, and prymnesiophytes as nanophytoplankton; and chlorophytes, cyanobacteria and prasinophytes as picophytoplankton.

2.3.3. Primary Productivity of Phytoplankton

Water samples for primary production were prefiltered through a 180-μm Nytex net and placed in two sets of 0.5 L transparent polycarbonate Nalgene bottles. Light intensity was measured using a photosynthetically available radiation sensor (Li-1400, Li-cor Inc., Lincoln, NE, USA) for daily and experimental irradiance measurement. The carbon uptake rate was measured by incorporating a NaH13CO3 (98%, Sigma-Aldrich, St. Louis, MO, USA) solution into each sample used for incubation, to a final concentration of 0.2 mM, corresponding to about 10% of the ambient water concentration. The sample bottles were covered with layers of screens calibrated to mimic irradiance levels equivalent to those observed at five or six optical depths and incubated on deck under natural light for 3–4 h in two acrylic incubators. After incubation, the water samples were filtered through precombusted (at 450 °C for 2 h), 25 mm Whatman GF/F filters under gentle vacuum, and the filters were stored at −20 °C until isotopic analysis. In the laboratory, the samples for POC and 13C isotope measurements were processed by fuming with HCl overnight, to remove carbonates, and dried at 60 °C for 72 h in a drying oven. POC concentration and its isotopic ratio (13C to 12C) were analyzed using a continuous-flow isotope ratio mass spectrometer (CF-IRMS; IsoPrime 100, IsoPrime Ltd., Cheadle, UK) connected to an elemental analyzer (vario Micro cube, Elementar, Hanau, Germany). The carbon uptake rate was calculated according to [44]. Daily PP (mg C m−3 day−1) was calculated by multiplying the measured hourly carbon uptake rate by photoperiod conversion factors [45,46]. The integrated PP (mg C m−2 day−1) was calculated using the trapezoidal rule for the entire euphotic zone [47].

2.3.4. Biochemical Composition of Seston

PRTs were analyzed according to [48]. For protein extraction, we added 1 mL of water to centrifuge tubes containing a filter. The filter was ground with 5 mL of an alkaline copper solution. After 10 min, 0.5 mL of Folin–Ciocalteu phenol reagent was added to the solution. Subsequently, the solution was centrifuged at 3000 rpm for 10 min. The protein content of SPM was determined based on the absorbance at a wavelength of 750 nm using a UV spectrophotometer (Labomed Inc., Los Angeles, CA, USA) and expressed as bovine serum albumin equivalents (Sigma-Aldrich).
CHOs were analyzed according to [49]. Filters for CHO analysis were transferred into 15 mL polypropylene tubes containing 1 mL of water and were ground using a glass rod. Subsequently, 1 mL of 5% phenol was added for CHO extraction, and the solutions were kept at room temperature for 40 min. Next, 5 mL of sulfuric acid was added to the tubes and mixed using a vortex mixer. The solutions were centrifuged at 3500 rpm for 10 min. The carbohydrate content of SPM was determined based on the absorbance at a wavelength of 490 nm and expressed as glucose equivalents (Sigma-Aldrich).
For LIP extraction, filters were transferred to 16 mL glass tubes containing 3 mL of chloroform–methanol (1:2, v/v), followed by grinding and mixing using a vortex mixer. The tubes were stored in the refrigerator (4 °C) for 1 h, to prevent evaporation loss. After centrifugation at 2000 rpm for 10 min, the supernatants were collected and stored in new tubes. This extraction procedure was repeated immediately. After complete extraction, 4 mL of water was added to the tubes containing the sample solutions, which were then homogenized and centrifuged at 2000 rpm, to separate the solvents into two phases (the chloroform phase for lipids and the methanol + water phase). The methanol + water phase was removed from the solvent using a Pasteur pipette and the chloroform phase was exposed to N2 gas, to remove chloroform. After adding 2 mL of H2SO4, heating at 200 °C, and cooling to room temperature, the lipid content of the samples was determined based on the absorbance at a wavelength of 375 nm and expressed as tripalmitin equivalents [50,51].

2.3.5. Biopolymeric Carbon

To assess the carbon composition of POM, the carbon equivalents of proteins, carbohydrates, and lipids were estimated using conversion factors of 0.45, 0.50, and 0.70 gC g−1, respectively, according to the composition of the standards used [11]. The sum of particulate protein, carbohydrate, and lipid carbon was reported as the biopolymeric carbon (BPC) of POM [52] and considered as a labile or easily assimilated organic fraction of POM that is readily available to benthic consumers [53].

2.3.6. POC, PN, δ13CPOM, and δ15NPOM
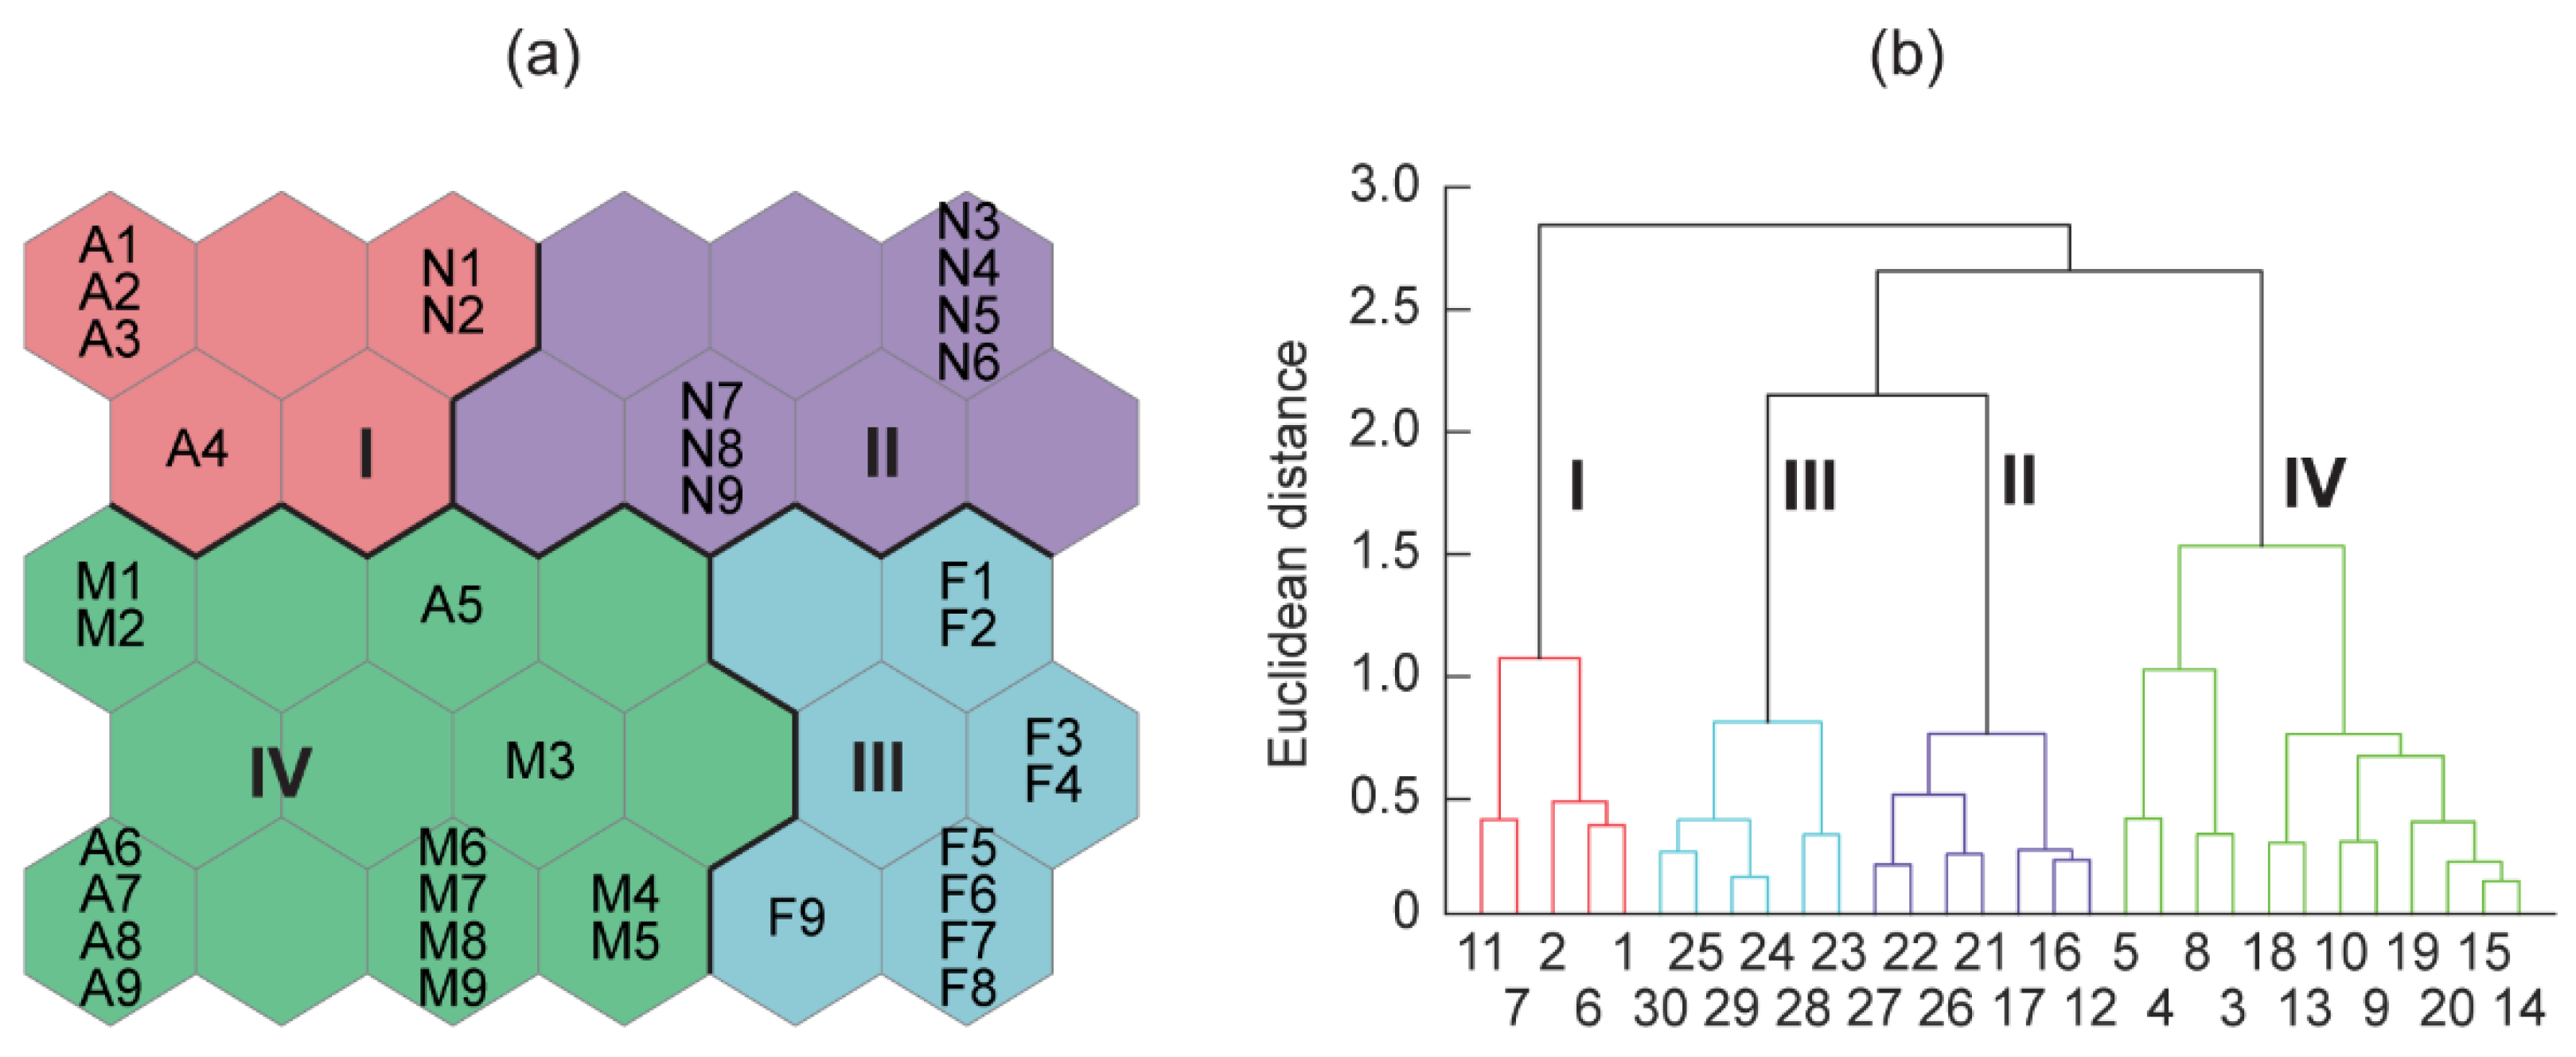
After drying at 60 °C for 72 h in an oven, the filters containing particle samples were wrapped in tin plates. POC and PN concentrations were determined using an elemental analyzer (vario Micro cube, Elementar, Hanau, Germany). The δ13C and δ15N values of POM were determined using a continuous-flow isotope ratio mass spectrometer (CF-IRMS; IsoPrime 100, Isoprime Ltd, Cheadle, United Kingdom.) connected to an elemental analyzer (vario Micro cube, Elementar). Filters containing SPM were wrapped in tin capsules and placed in the elemental analyzer. The samples were oxidized by combustion at high temperature (1030 °C). CO2 and N2 gases were then introduced into the CF-IRMS using helium as a carrier gas. Isotope values were expressed in delta (δ) notation as parts per thousand (‰) differences from the conventional standards (Vienna Pee Dee Belemnite and air N2 for carbon and nitrogen, respectively) according to the following equation:
δ X = ( R s a m p l e   /   R s t a n d a r d 1 ) × 10 3
where X is 13C or 15N and R is the 13C/12C or 15N/14N ratio. Instrument calibration was performed after the analysis of every 5–10 samples via routine measurements of international standards of sucrose (ANU C12H22O11; NIST, Gaithersburg, MD, USA) for carbon and of ammonium sulfate ([NH4]2SO4; NIST) for nitrogen. The analytical precision based on 20 replicates of internal peptone and urea standards was approximately ≤0.1‰ and ≤0.15‰ for δ13C and δ15N, respectively.

2.4. Data Analysis

Patterns in the distribution of biogeochemical parameters were detected using a self-organizing map (SOM), which is an unsupervised artificial neural network algorithm [54], to illustrate the physical and nutritional conditions that determine the abundance of different classes of phytoplankton, and further interpret the relationship between the biochemical composition of seston and the dominant taxonomic groups of phytoplankton. The SOM is used for abstraction, visualization, and clustering of data (22 variables × 36 samples in this study) [55]. The SOM algorithm network consists of two layers. The input data, i.e., the biogeochemical parameters in this study, were normalized on a scale of 0–1 to reduce the variation and ensure that all variables have equal importance. During the training process, the data were assigned to neurons (processing units) in the input layer, and the output layer, which comprises output neurons, was created after the rough-training and fine-tuning phases. Finally, a real sample was assigned to the most similar neuron in the output layer and samples of similar characteristics were located in adjacent neurons, which are usually arranged into a two-dimensional grid, for better visualization. The grid size (the number of output neurons) was chosen according to Vesanto’s heuristic rule of 5 N , where N is the size of the dataset [56]; subsequently, the final size of the SOM was decided at the minimum levels of the quantization error (QE) and topographic error (TE) by running the entire procedure several times [55]. Here, 5 × 6 output neurons, which yielded QE and TE values of 0.581 and 0.000, respectively, were used. After training the SOM, we applied Ward’s linkage method with the Euclidean distance measure to define the cluster boundaries between different SOM units [57]. We then assumed that individual cluster groups of samples were established by the SOM procedure, and subsequent cluster analysis constituted environmental conditions. The trend of environmental conditions in the clusters is indicated by shades of color on the SOM, which classified them into particular clusters. Training of the SOM and the clustering procedures was performed using the MATLAB software (Version 6.1, MathWorks, Natick, MA, USA). Furthermore, a nonparametric Kruskal–Wallis test followed by a Mann–Whitney pairwise comparison test was applied to compare the biogeochemical characteristic between clusters using IBM SPSS Statistics (version 21.0, IBM Corp., Armonk, NY, USA).
To characterize the relationship between the biochemical composition of seston and phytoplankton groups, in particular to determine whether the taxonomic (i.e., size) composition of phytoplankton plays a role in the observed trends in biochemical composition, we examined the changes in sestonic carbohydrate, protein, and lipid concentrations and their ratios according to phytoplankton size composition using generalized additive models (GAMs; [58]). Micro-, nano-, and pico-phytoplankton concentrations were included in the model as predictor variables, as follows:
T i = a + s 1 ( m i c r o p h y t o p l a n k t o n ) + s 2 ( n a n o p h y t o p l a n k t o n ) + s 3 ( p i c o p h y t o p l a n k t o n ) + ε i
where T is the sestonic biochemical component (carbohydrate, protein, and lipid concentrations, and their ratio values), a is the intercept, s i is the spline function smoother, i indicates individual samples, and ε is the random noise term assumed to be normally distributed with mean zero and constant variance. The best model was selected using the Akaïke information criterion (AIC). Subsequently, ANOVAs were performed to detect significant effects of covariates. We then presented the partial effect of the size composition of phytoplankton on each biochemical component. The R package ‘mgcv’ was used for fitting GAMs [59].

3. Results

Based on 36 datasets (9 stations over 4 seasons) of 22 physical and biogeochemical variables (Tables S1–S3), we trained the SOM and condensed it onto a 5 × 6 rectangular-grid map (Figure 2a and Supplementary Figure S1). The dendrogram grouped samples into four clusters (I, II, III, and IV) with similar biogeochemical characteristics (Figure 2b). The partition of samples to cluster assemblages was highly related to seasonality and salinity gradient; the samples collected in warmer months (May and August) were grouped on the left side of the SOM, whereas the samples collected in colder months (November and February) were clustered on the right side of the map. Cluster I comprised samples from river-mouth and estuarine stations (A1–A4) collected in August and November (N1 and N2), as expected based on the influence of the high riverine discharge that occurs during summer and fall. Samples collected in estuarine-to-deep-bay channel stations during fall (N3–N9) were assigned to cluster II. Cluster III grouped all the stations at which samples were collected in winter (F1–F9). Cluster IV contained all of the spring-collection stations (M1–M9) and summer-collection polyhaline-zone stations (A5–A9).
A Kruskal–Wallis test followed by a Mann–Whitney pairwise comparison test of all biogeochemical parameters belonging to the four clusters yielded nonsignificant differences (df = 3, p > 0.05) in lipid concentration, PRT:CHO ratio, CHO:LIP ratio, and C:N ratio. All other variables exhibited significant differences (df = 3, p < 0.05) among clusters, which indicated strong relationships between the variables. Based on the cluster configuration, the distributions of SPM composition and biogeochemical variables were characterized by their median values for each cluster (Figure 3); the details of individual variables are described below.

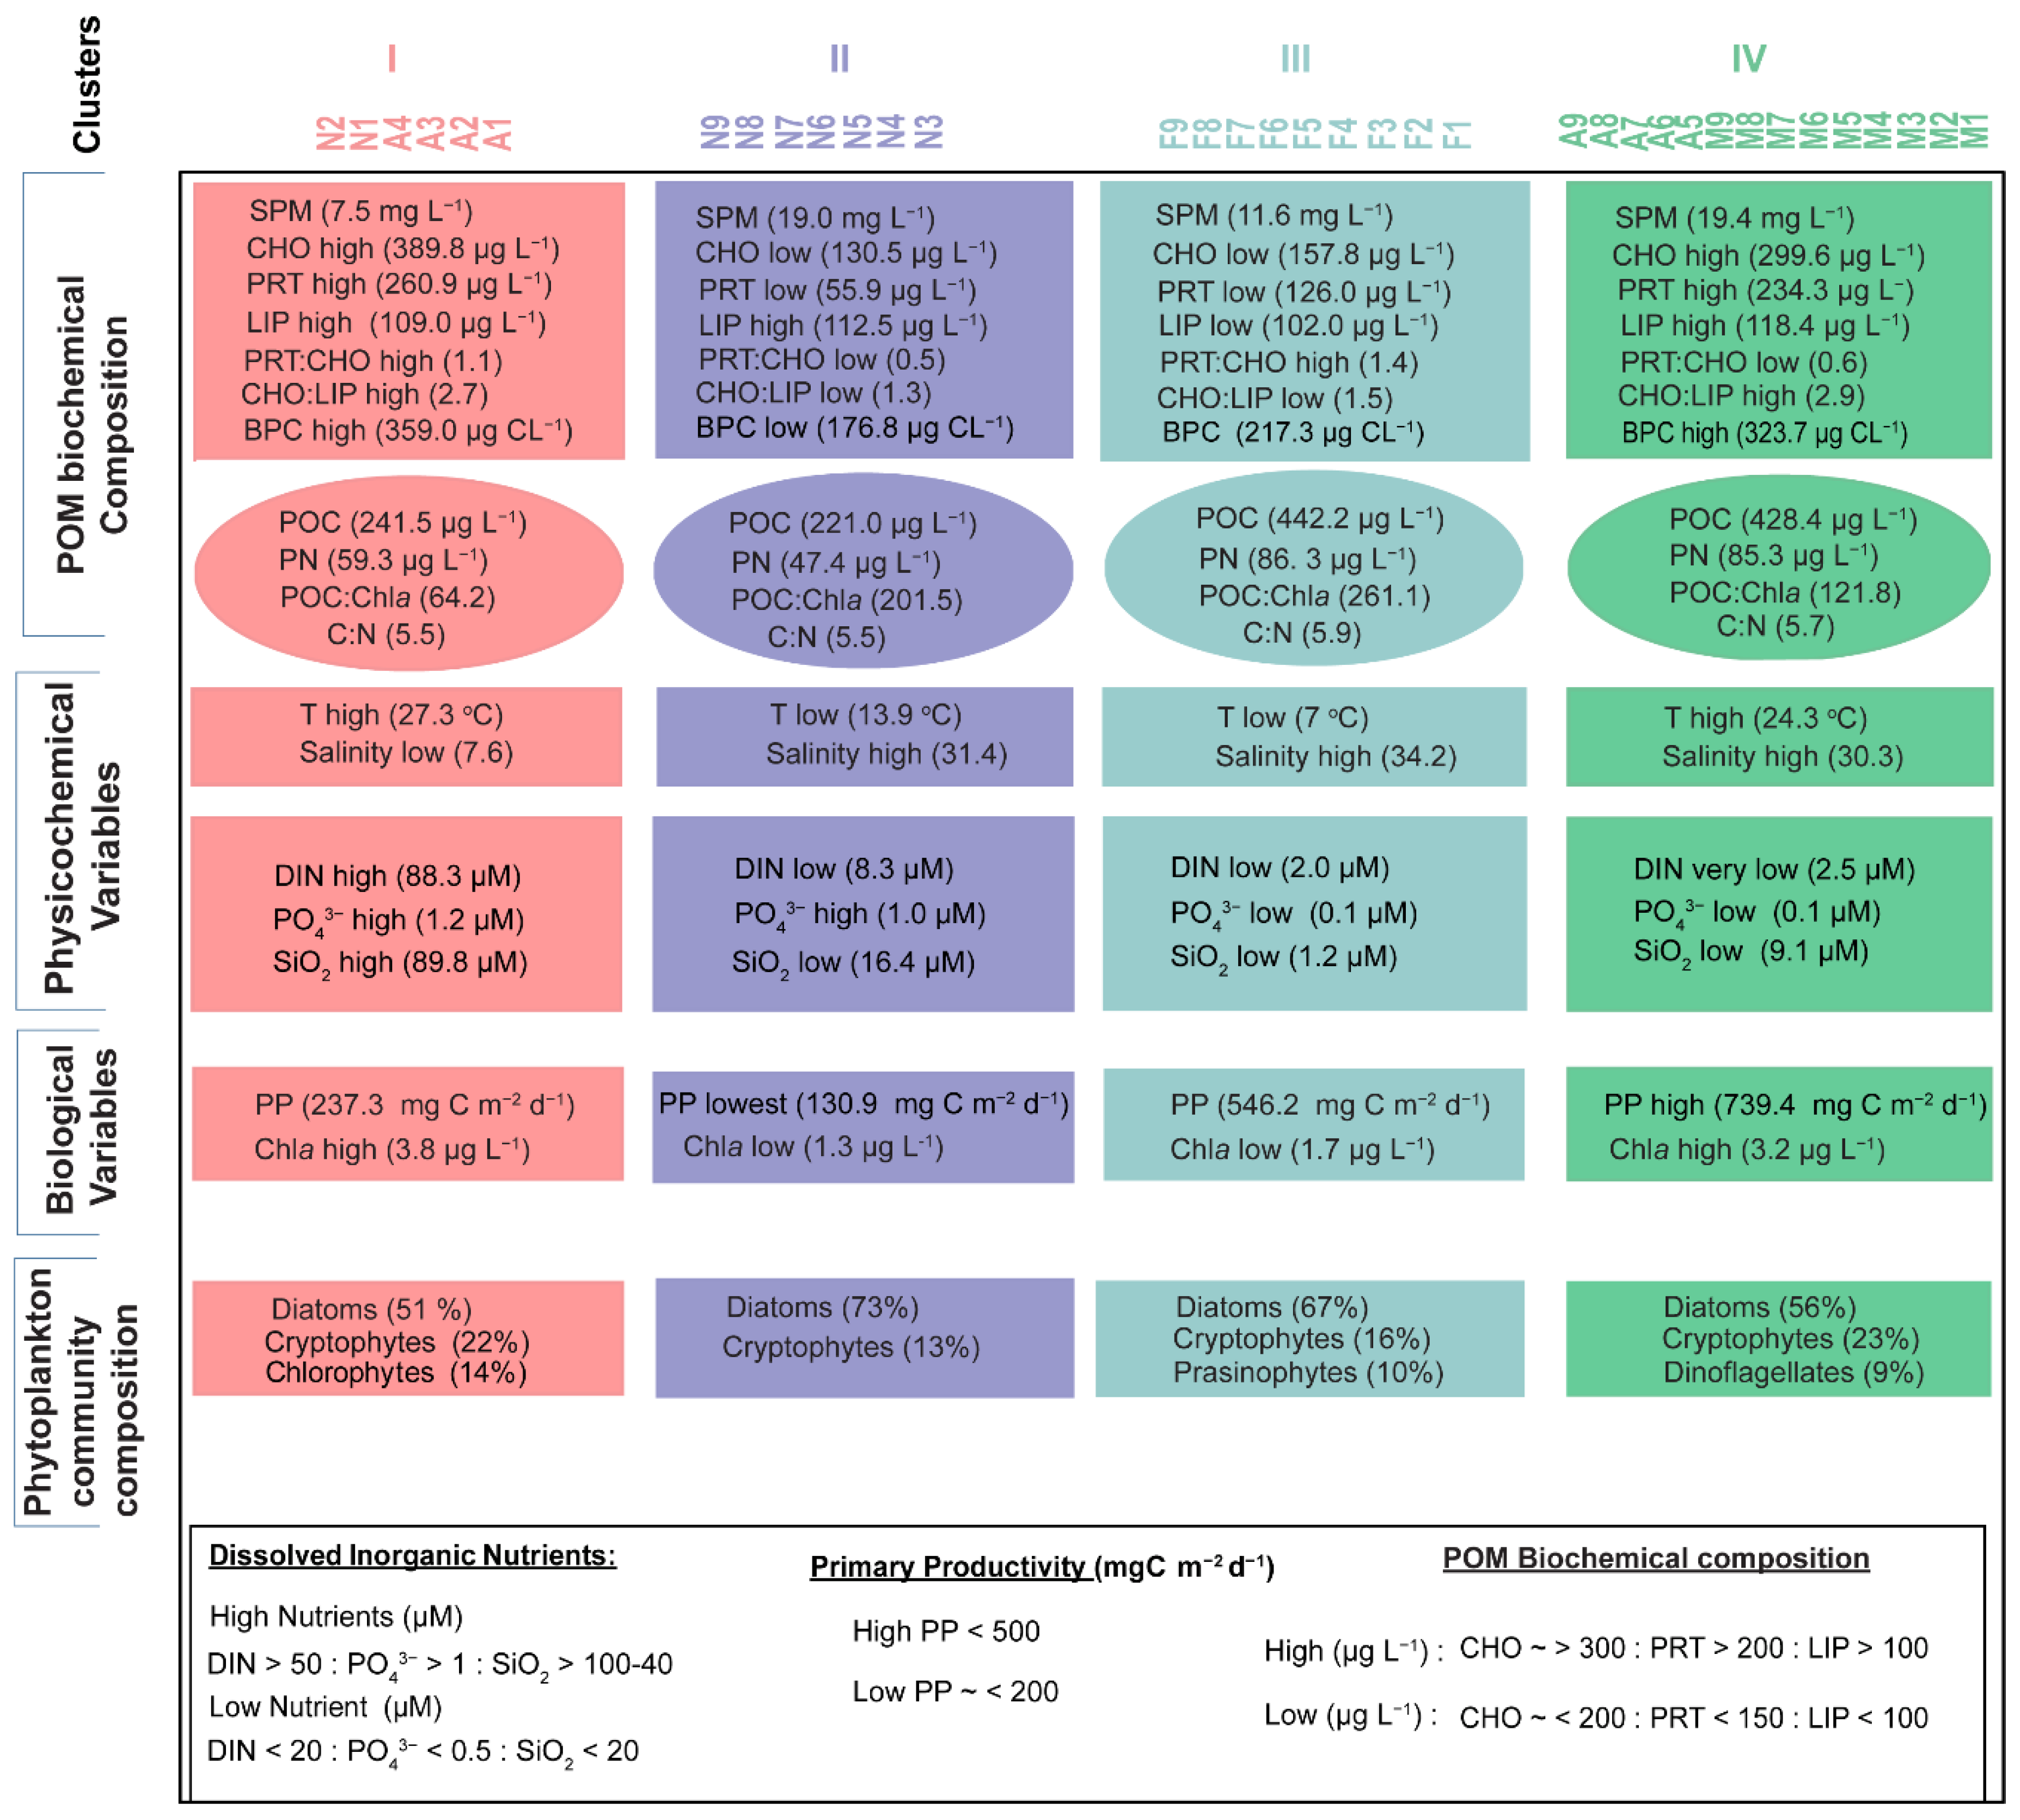
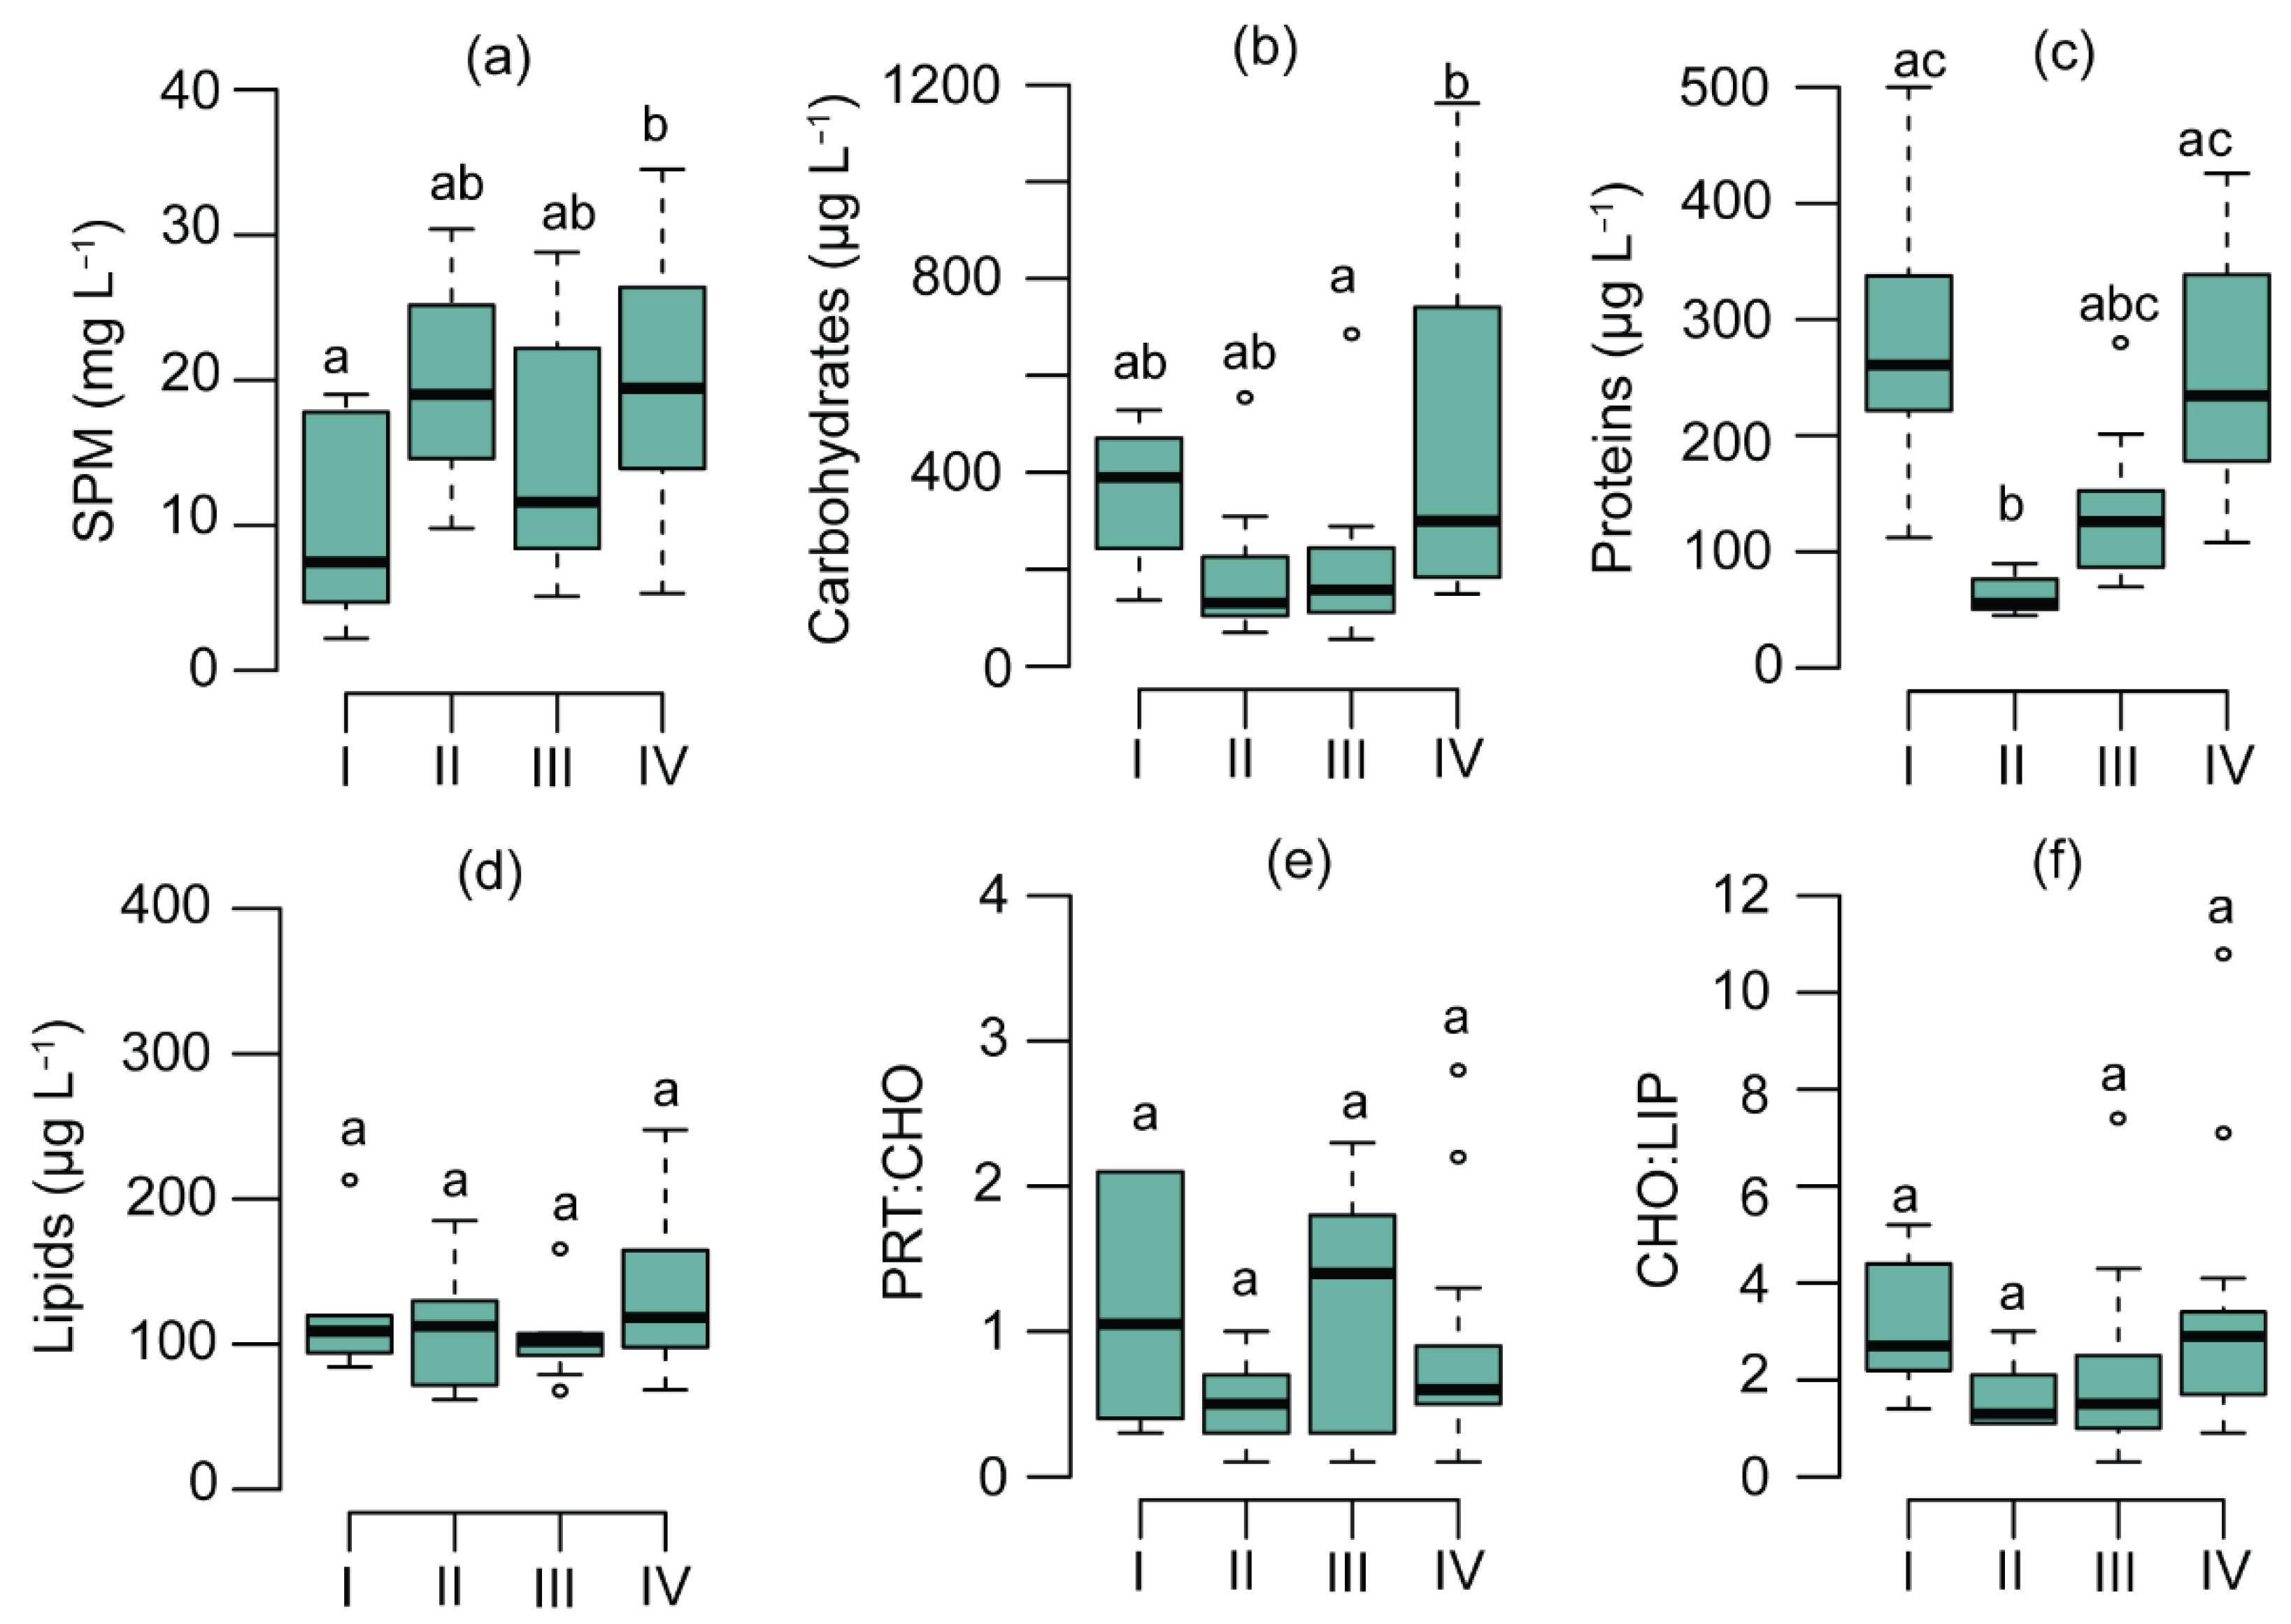
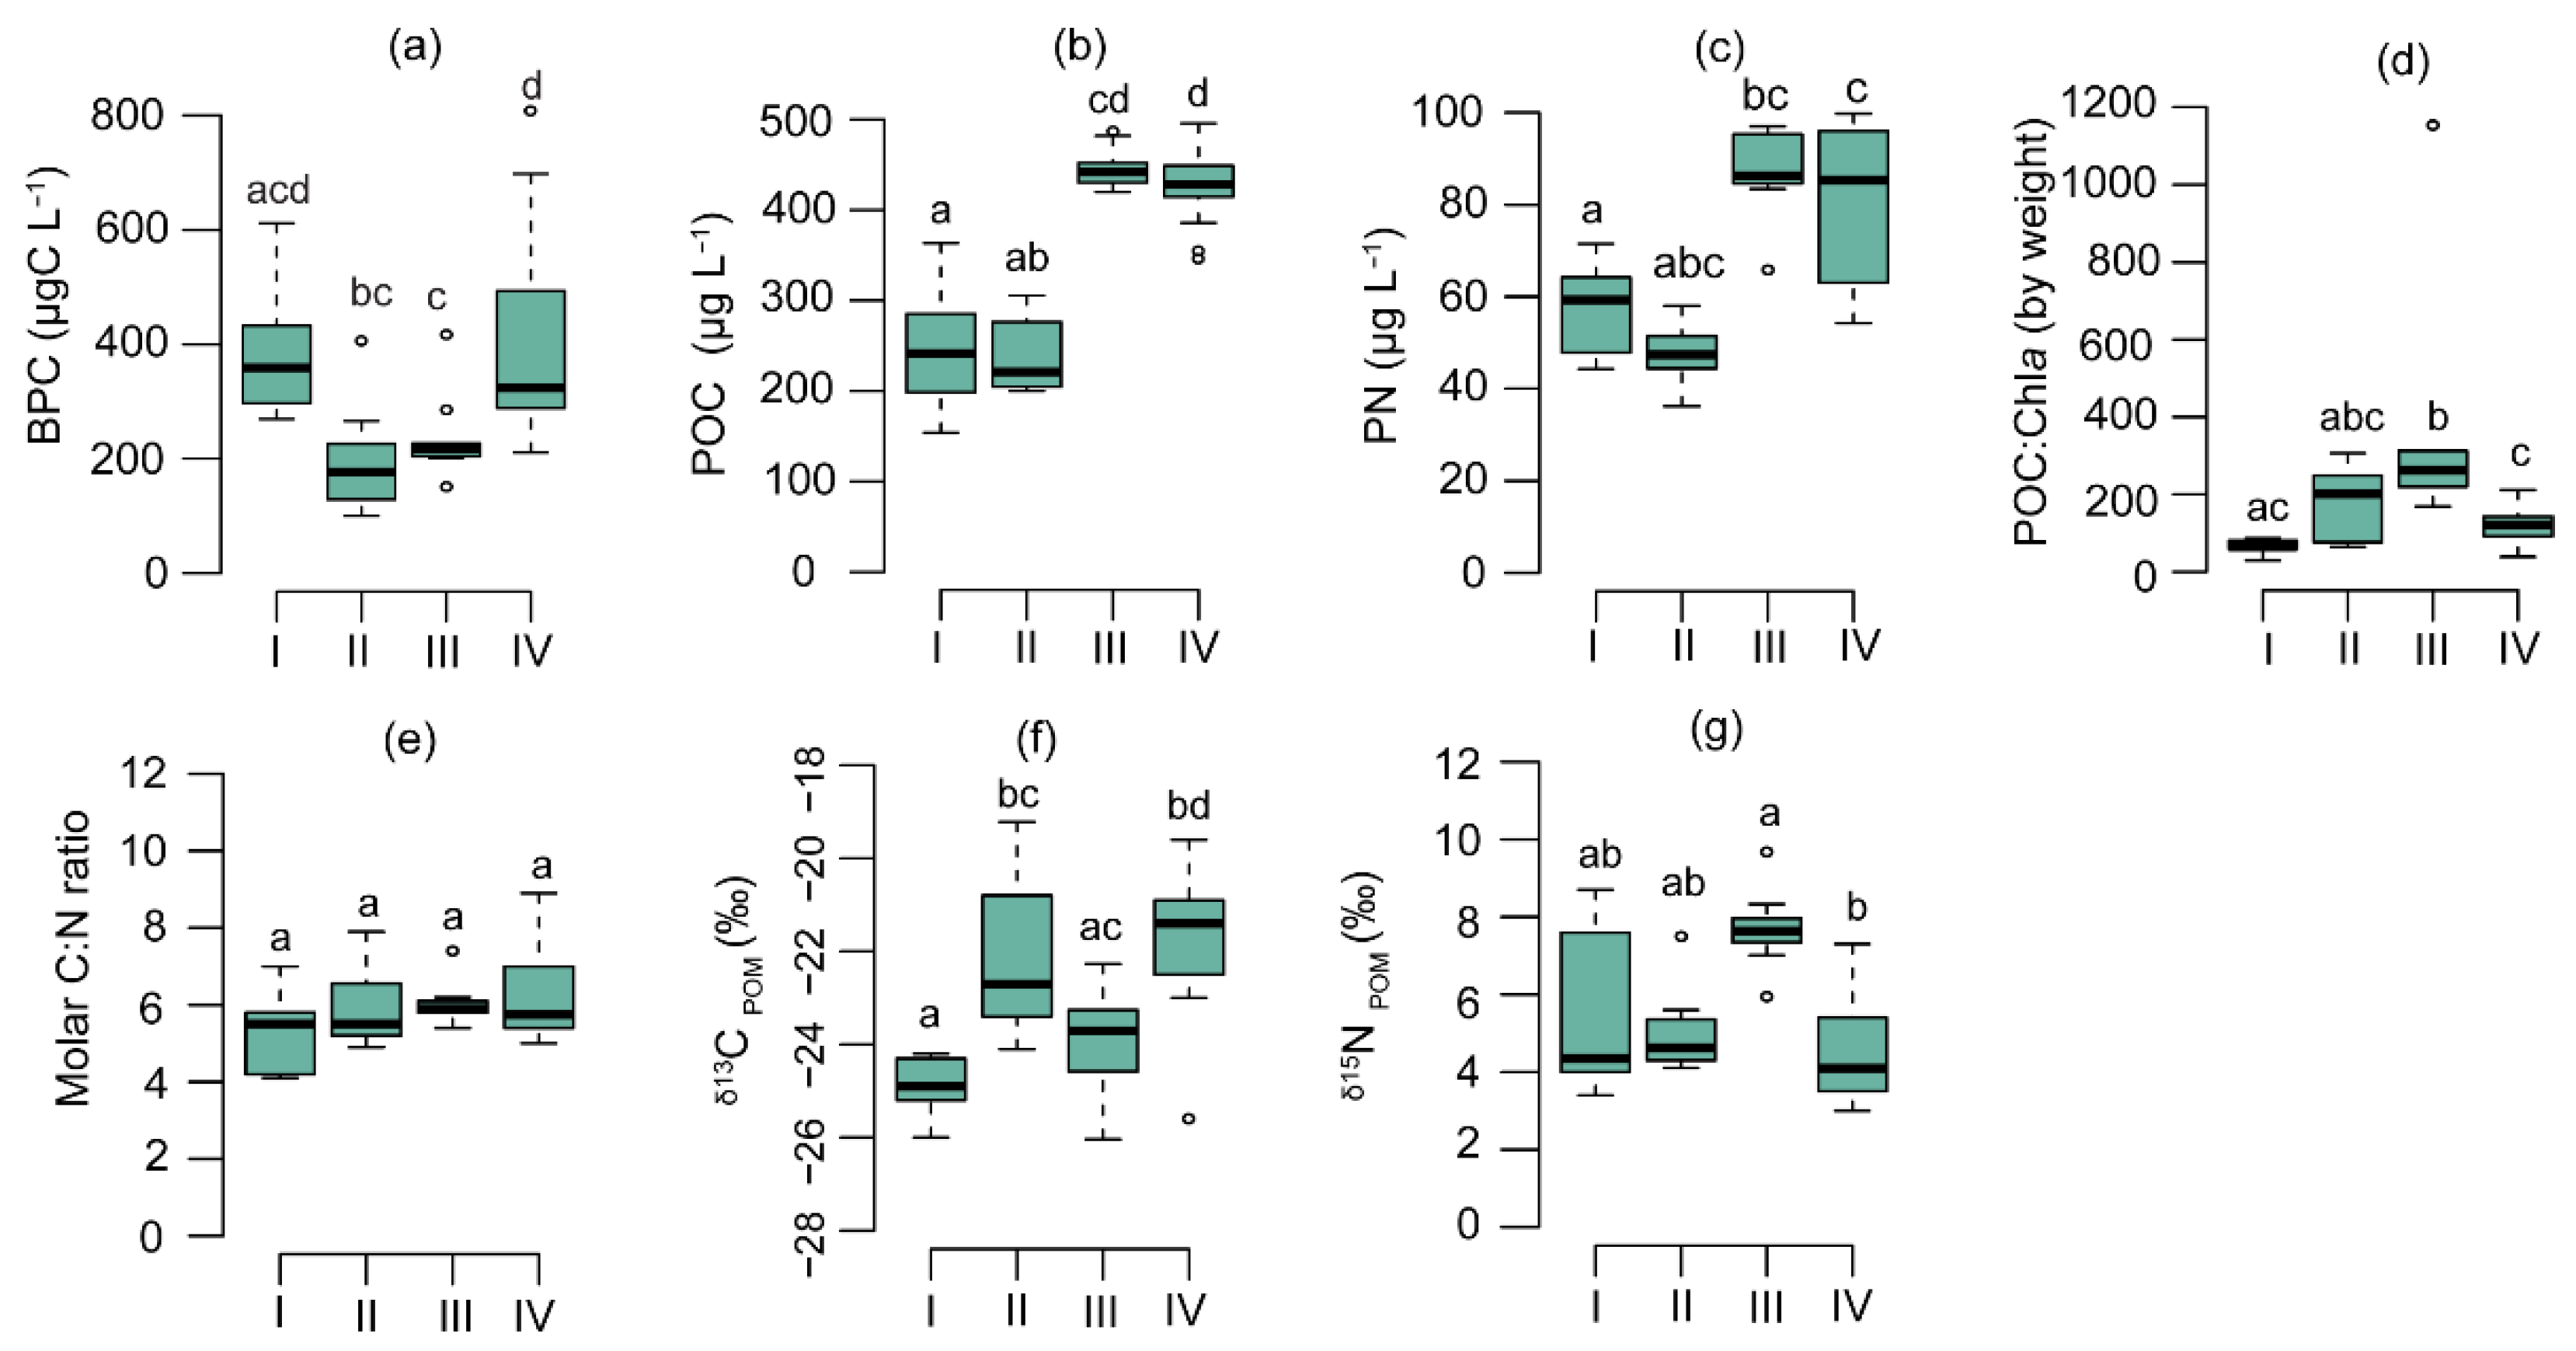
3.1. SPM Concentration and Composition

A Mann–Whitney pairwise comparison test (at the level of p  <  0.05) revealed that SPM concentrations were highest in cluster IV and lowest in cluster I; carbohydrate (CHO) and protein (PRT) concentrations were high in clusters I and IV compared with clusters II and III (Figure 4a–c). Lipid (LIP) concentrations and the PRT:CHO and CHO:LIP ratios were statistically homogeneous in all clusters (Figure 4d–f).
Clusters I and IV were characterized by high BPC (Figure 5a). POC and PN were higher in clusters III and IV compared with clusters I and II (Figure 5b,c). The POC:Chla ratio was lowest in cluster I (~65) and highest in cluster III (>250) (Figure 5d), whereas the C:N ratio was relatively homogeneous in all clusters (<9) (Figure 5e). Moreover, δ13CPOM displayed seasonal variability, with lower values detected in clusters I and III (−24‰) compared with clusters II and IV (Figure 5f). In contrast, δ15NPOM was relatively higher in cluster III (7.7‰) compared with the other clusters (Figure 5g).

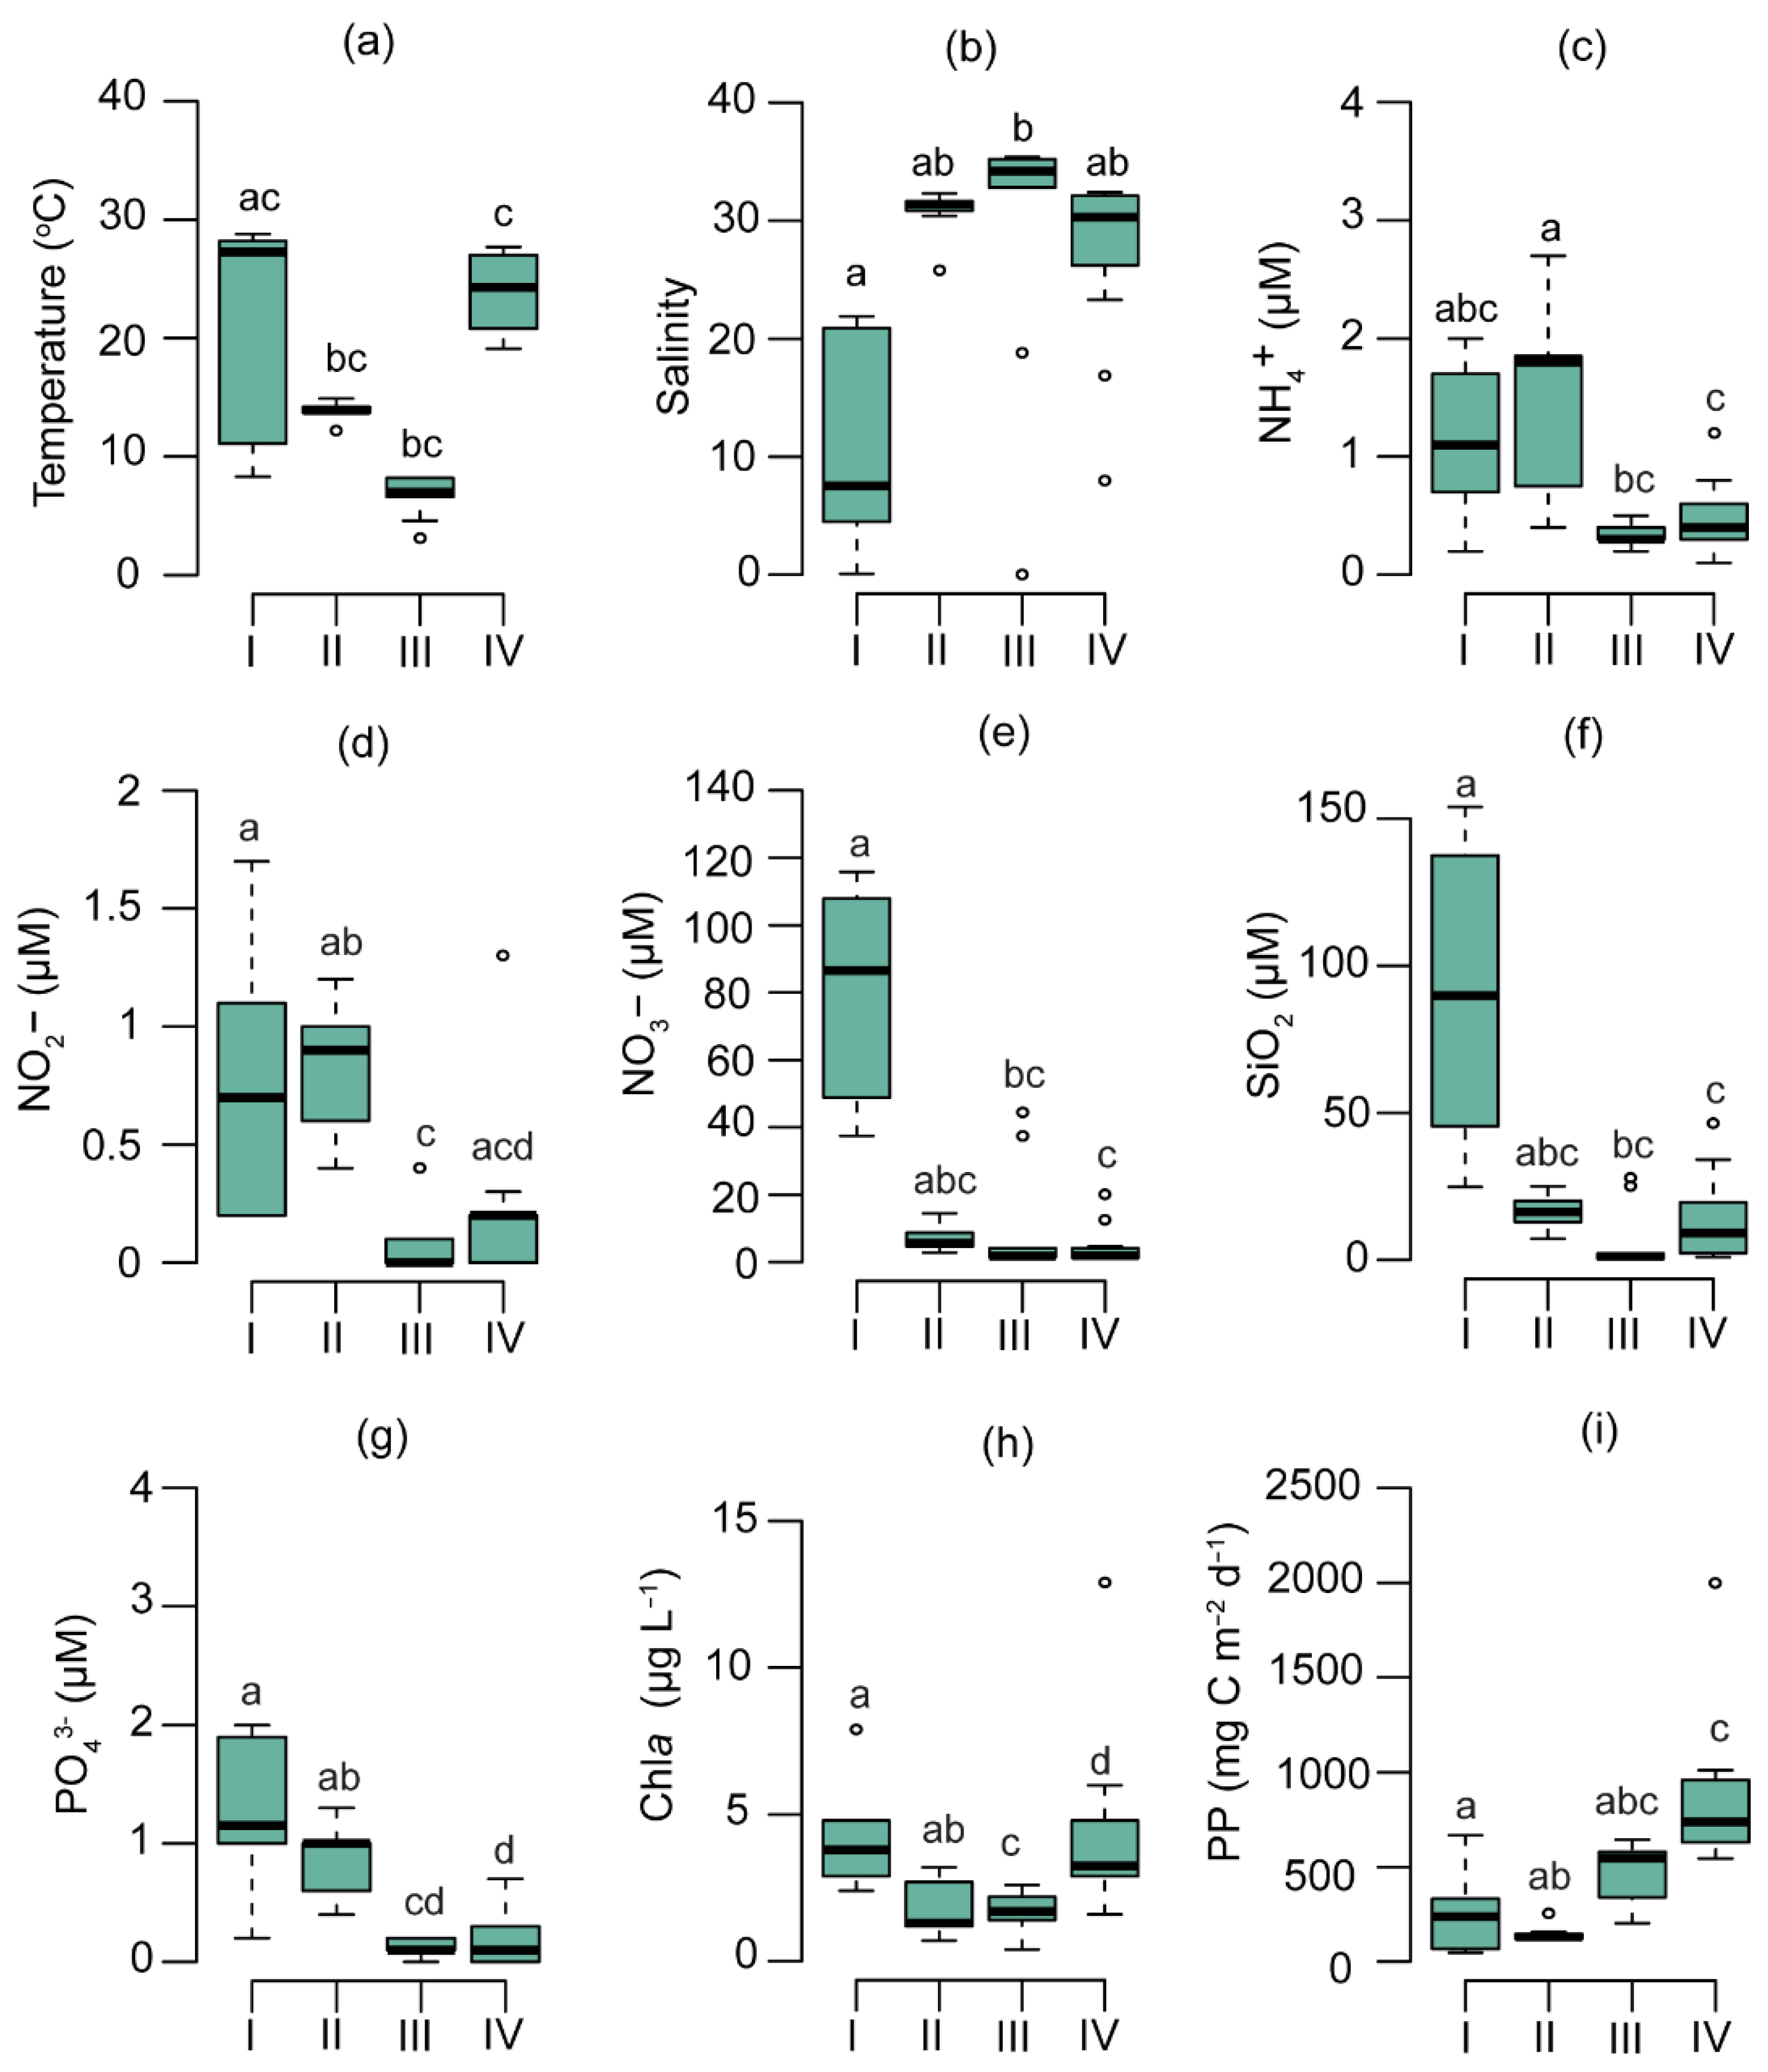
3.2. Physicochemical and Biological Parameters

The water temperature and salinity distributions agreed with the spatiotemporal configuration of SOM unit clusters (Figure 6a,b). The water temperature was significantly higher in the spring and summer clusters compared with the fall and winter clusters; salinity was lowest in cluster I. NH4+ and NO2 concentrations were higher in clusters I and II compared with clusters II and IV (Figure 6c,d). NO3 and SiO2 concentrations were much higher in cluster I than they were in the other clusters (Figure 6e,f). The PO43− concentration exhibited spatiotemporal patterns that were similar to those of NH4+ and NO2, that is, higher in clusters I and II compared with clusters III and IV (Figure 6g).
Clusters I and IV (spring and summer) were associated with high Chla concentrations compared with clusters II and III (Figure 6h). The phytoplankton PP was lowest in cluster II (130.9 mg C m−2 day−1) and highest in cluster IV (739.4 mg C m−2 day−1) (Figure 6i).

3.3. Phytoplankton Community Composition

The phytoplankton community composition exhibited a well-marked spatiotemporal variability in Gwangyang Bay during the study period. Diatoms and cryptophytes were dominant contributors to total Chla in all clusters. Diatoms made up 51% of the phytoplankton community in cluster I, followed by cryptophytes (22%) and chlorophytes (14%); 73% of the phytoplankton community in cluster II, followed by cryptophytes (13%); 67% of the phytoplankton community in cluster III, followed by cryptophytes (16%) and prasinophytes (10%); and 56% of the phytoplankton community in cluster IV, followed by cryptophytes (23%) and dinoflagellates (9%) (Figure 3; Table S4).

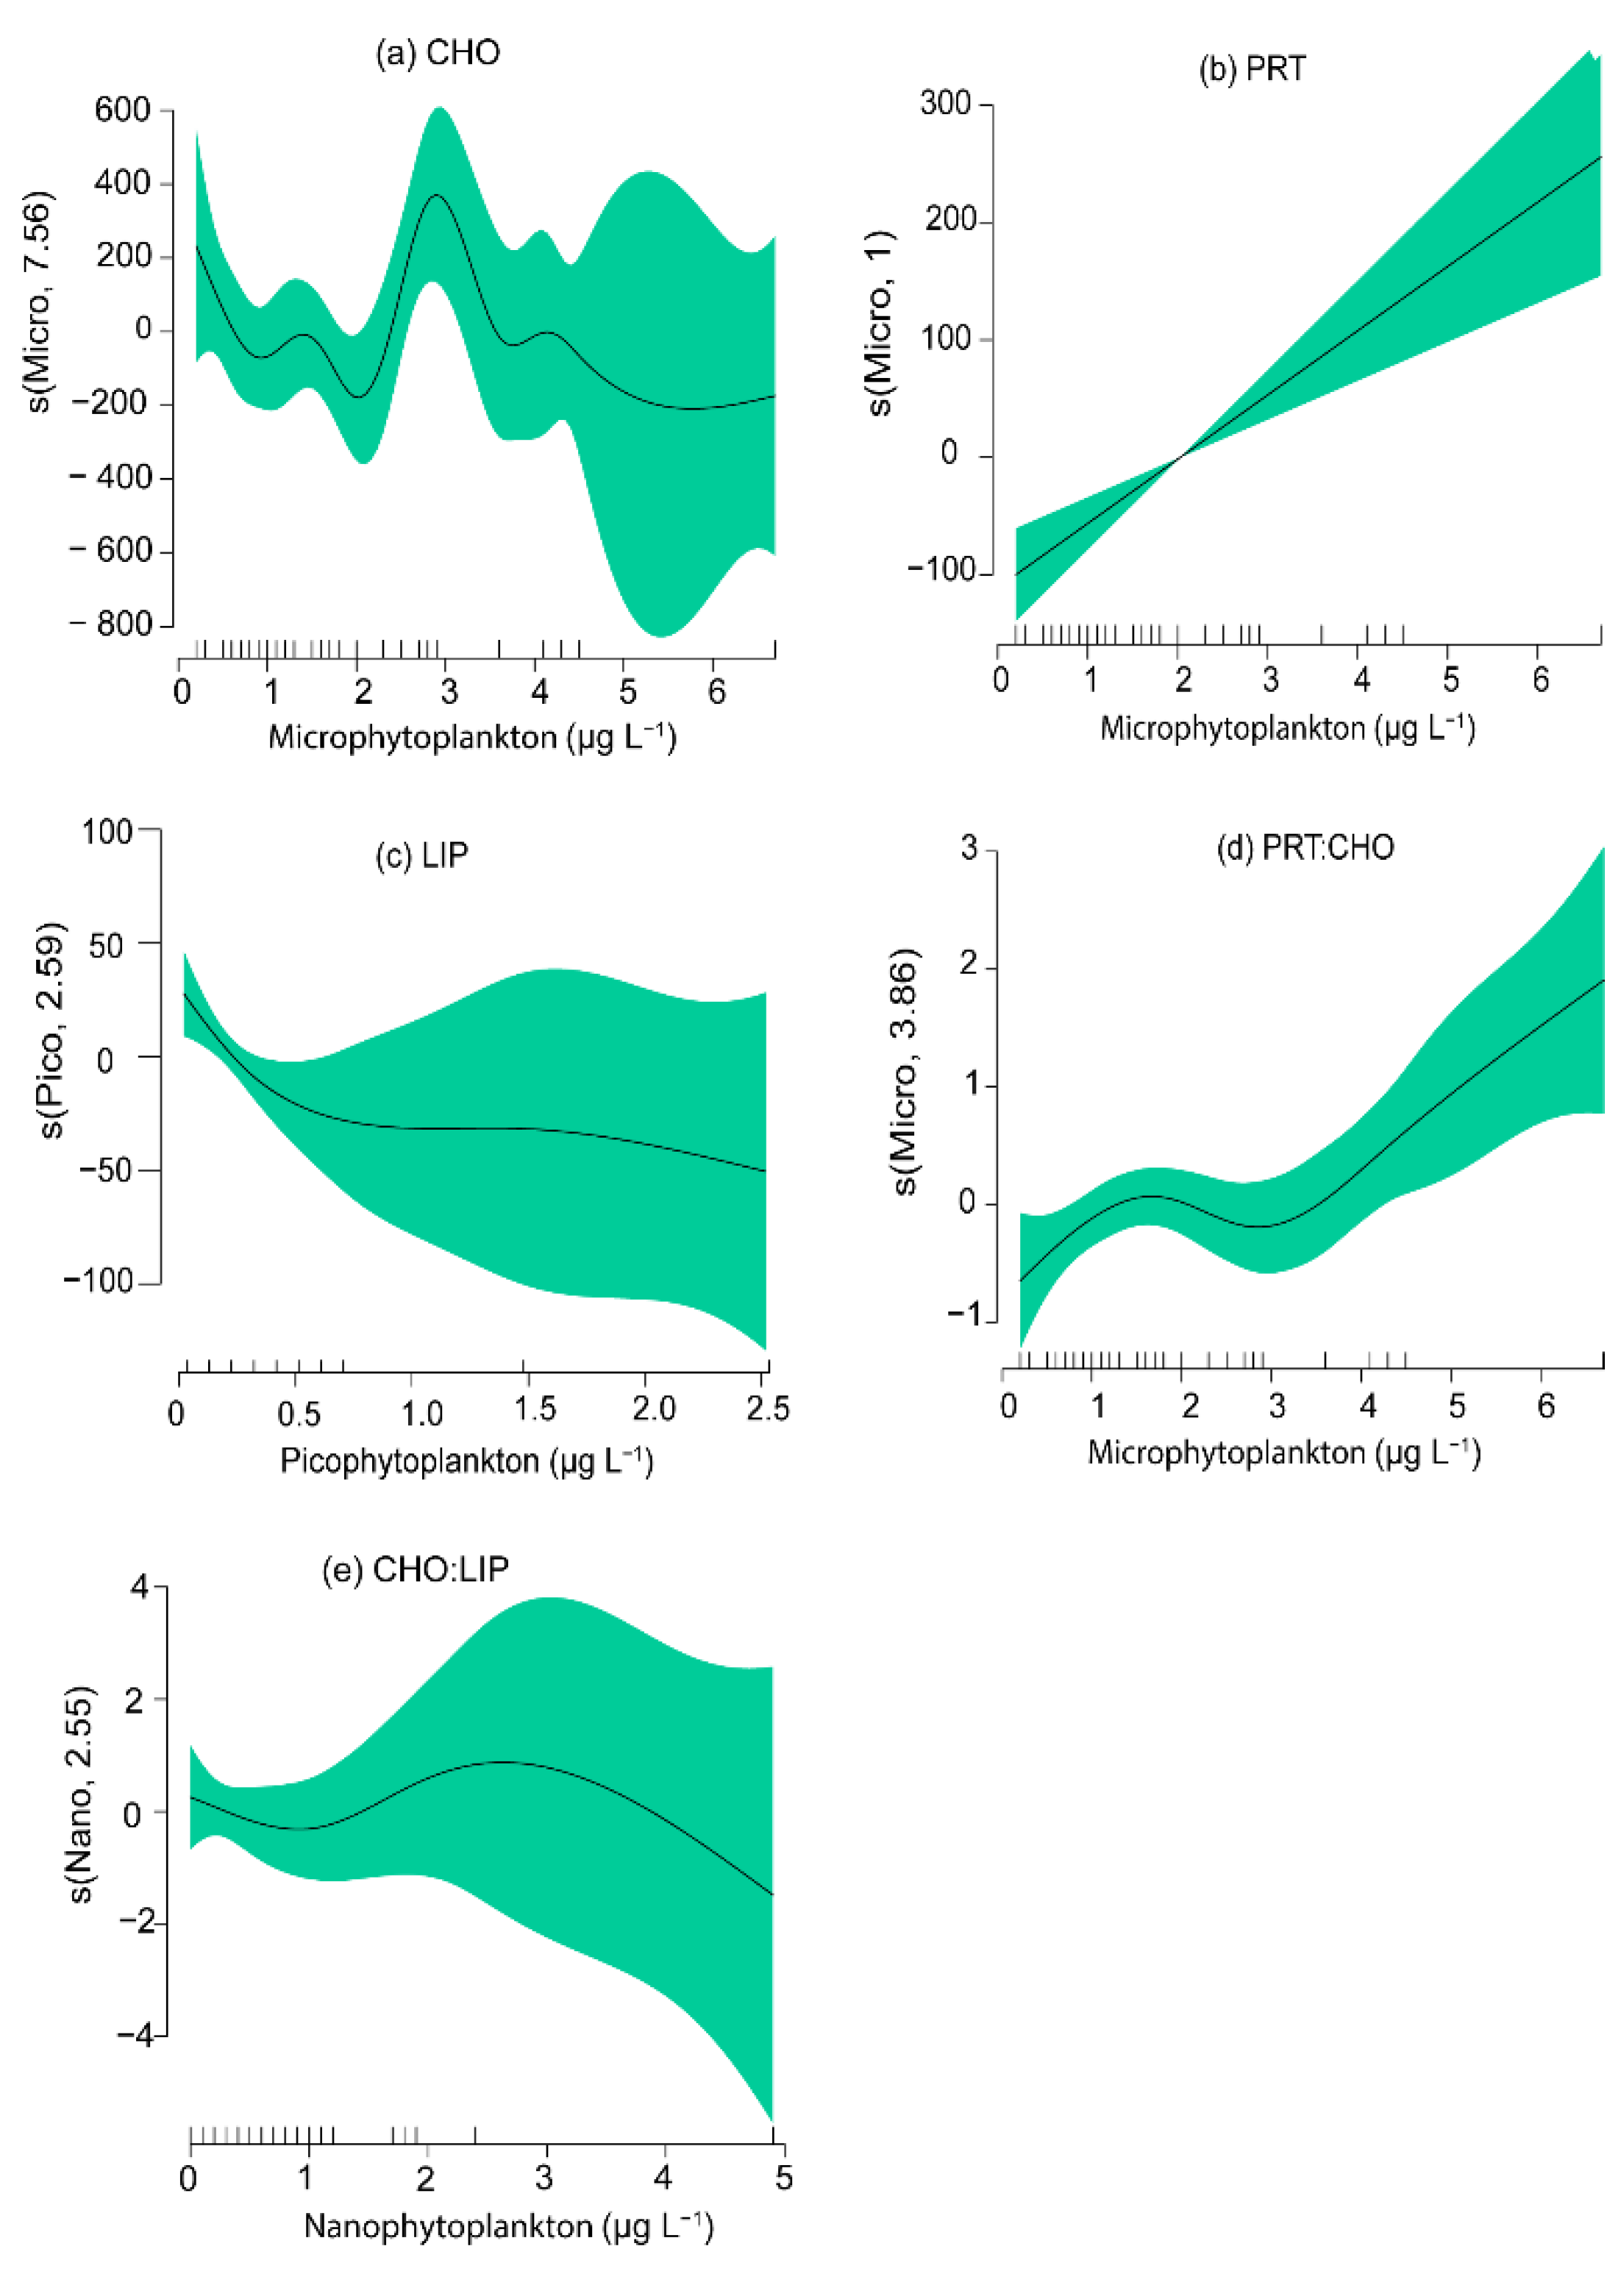
3.4. Relationships between Phytoplankton Groups and the Biochemical Composition of Seston

Our GAM models revealed the best descriptors of different-size fractions of phytoplankton regarding the variabilities in the concentrations and ratios of the biochemical compounds of seston (CHO, PRT, LIP, CHO:PRT ratio, and CHO:LIP ratio) observed in Gwangyang Bay (Figure 7a,e; Table S5). Carbohydrate concentrations did not show any significant relationship with phytoplankton size fractions (p > 0.05). The variability in protein concentrations exhibited a clear positive relationship with microphytoplankton (p < 0.05, Figure 7a,b), and lipid concentrations were significantly affected by picophytoplankton abundance (p < 0.05, Figure 7c). Intriguingly, we observed a positive relationship between microphytoplankton abundance and the PRT:CHO ratio (p < 0.05, Figure 7d), but no significant effect of nanophytoplankton abundance on the CHO:LIP ratio (p > 0.05, Figure 7e).

4. Discussion

In the present study, a SOM analysis clearly distinguished all the sampling units into four cluster groups that characterized different environmental conditions. The observed spatial and seasonal distributions of the biochemical (i.e., macromolecular) compounds of seston were consistent with those of phytoplankton biomass (Chla). The physiological responses of phytoplankton communities to light, nutrient availability, and growth phase are reflected in their biochemical composition [60]. The biochemical profiles of phytoplankton may reflect its taxonomic composition [61], as well as abiotic environmental conditions [24,62]. In this context, our results support the contention that spatial and seasonal variabilities in biochemical components (i.e., the concentration and composition of carbohydrates, proteins, and lipids) of seston are closely related to (1) the physiological status of phytoplankton in combination with nutritional status in individual clusters and (2) the taxonomic (i.e., size) structure of the phytoplankton community. To our knowledge, this was the first investigation of such variabilities in the biochemical components of seston in association with the physiological status and taxonomic composition of phytoplankton in the Gwangyang Bay system.

4.1. Physiological Effects of Phytoplankton on POM Composition

At ecological time scales, a multiplicity of environmental drivers, such as nutrients, turbidity, temperature, and salinity, modulate multimodal phytoplankton community compositions [22,63,64] and alter the growth rates, primary production, and physiological functions of phytoplankton [65]. During the annual peak discharge in spring and summer, the Seomjin River evacuates seasonally the highest DIN and SiO2 to the Gwangyang Bay system. Such a high riverine discharge results in high N:P and Si:P ratios, because PO43− concentrations remain relatively low or stable. The resultant high nutrient addition stimulates phytoplankton growth during those seasons [26,30,33,66]. Diatoms were the most abundant phytoplankton group detected throughout the study period. However, heterogeneity in the physicochemical drivers (nutrient and SPM concentrations) and species-specific responses to those environmental variables shaped phytoplankton assemblages in individual clusters (Figure 3).
Large spatial variability in environmental conditions and growth phases, as determined by phytoplankton biomass (Chla), altered the physiological status, thus affecting the biochemical composition of phytoplankton in each cluster [61,67]. Cluster I, which was representative of the estuarine channel, was characterized by a high river discharge, low salinity, low SPM, and high inorganic nutrient concentrations and was clearly associated with the exponential growth phase of phytoplankton (i.e., highest Chla), which resulted in the highest concentrations of sestonic biochemical compounds [18,68]. The higher incorporation of carbon into proteins observed in cluster I reflected the presence of physiologically healthy phytoplankton with high relative growth rates, supporting the contention that phytoplankton synthesize proteins at high levels as a physiological response to high nutrient conditions, and our data are in agreement with results reported by [18,24]. Because phytoplankton cell metabolism is highly plastic to abiotic environmental factors, the high PRT:CHO ratios (>1) observed in cluster I reflected a high metabolic activity under nitrogen-replete conditions. Sufficient nutrient conditions coupled with a suitable physiological status of the phytoplankton supported the exponential growth phase, which was further characterized by a high CHO:LIP ratio (>2) in cluster I. Our study results are in contrast with the highly productive proteins-dominated Ross Sea system, where very high PRT:CHO contents (>4.5) were observed [69,70,71]. In addition, the lowest POC:Chla ratio (64.2), as a consequence of high Chla, observed in cluster I suggests an active growth phase of phytoplankton and a relatively high contribution of living phytoplankton to POC under nutrient-replete and low-turbidity conditions [72,73,74]. A high BPC fraction indicates eutrophic conditions (i.e., high primary-productivity systems) [75]. In this study, BPC received the highest contribution from proteins and the dominance of freshly produced carbon by phytoplankton (low POC:Chla and C:N ratio < 6) in cluster I. This result suggests that a large portion of the organic matter in Gwangyang Bay is of high quality and constitutes a rapidly digestible material that is available for heterotrophic nutrition. Previous studies have also demonstrated that BPC concentrations are highly dependent on phytoplankton primary production ([76] and references therein).
As characterized by the elevated salinity, lower temperature, and nutrient input detected in clusters II and III, the decline in seasonal river discharge that occurs in November and February generated a major transition in environmental conditions. The physiological adaptations of phytoplankton under low nutrients, high SPM, and cold-water temperatures resulted in a transition into a stationary growth phase (the lowest Chla and PP) and a low metabolic rate in phytoplankton. This was evidenced by the lower concentrations of all of the sestonic biochemical compounds, particularly the lowest protein concentrations (55 μg L−1) and low POC and PN concentrations detected in cluster II compared with the other clusters [61,77]. Nutrient limitations (a low N:P ratio of ~8) and the consequential stress on phytoplankton physiology were also reflected in the lowest PRT:CHO (0.5) and CHO:LIP (1.3) ratios detected in cluster II [70,71]. In contrast, in cluster III, although the temperature and dissolved inorganic nutrient concentrations were lowest, phytoplankton were able to cope with physiological stresses and uptake nutrients, which resulted in a relatively high PP in winter [26]. This physiological plasticity of phytoplankton under low nutrient conditions could be explained by the high N:P ratio (~20) of dissolved inorganic nutrients, yielding a high PRT:CHO ratio (1.4) in cluster III in winter. The lower phytoplankton biomass, CHO:LIP ratios, and concentrations of sestonic biochemical compounds detected in clusters II and III suggest that phytoplankton were in a stationary growth phase as a physiological response to low nutrient concentrations and temperature [18,70]. As nutrient limitation ultimately regulates the total phytoplankton biomass (Chla), the low contribution of phytoplankton to POC under low nutrient conditions was reflected in the lowest BPC concentrations detected in clusters II and III. Under these conditions, sestonic POM is likely dominated by phytodetritus, as indicated by the highest POC:Chla ratio (>200) [26,76].
The high-saline and low-nutrient conditions observed in cluster IV may explain the effect of increasing temperature on phytoplankton physiology and metabolic processes [77]. A higher water temperature resulted in a high metabolic rate and increased concentration of biochemical compounds (especially carbohydrates and lipids), which supports the notion that phytoplankton populations increase carbohydrate and/or lipid production under nutrient-deficient conditions [78,79]. Together with absolute nutrient concentrations, inorganic nutrient ratios are used to identify potential limiting nutrients for phytoplankton growth, as nutrient-uptake rates and carbon-specific photosynthesis (i.e., PP) vary with changes in the phytoplankton community structure [80], thus reflecting different cellular nutrient requirements [81]. The high N:P (>25), Si:DIP (<10), and Si:DIN (<1) ratios detected in cluster IV suggest that an unexpected nitrogen limitation and a colimitation of P and Si resulted in a marked difference in phytoplankton community structure [82]. Similarly, the low PRT:CHO ratio (0.6) observed in cluster IV could be explained by a change in phytoplankton community composition (see below) and a physiological response to the relatively high N:P ratio, resulting in an increase in N-rich protein content in seston; in turn, a silicate limitation resulted in a relatively low diatom abundance, leading to the synthesis of relatively low levels of carbohydrates [23,70]. Similar results have been reported in the Chukchi Sea (18), Laptev and East Siberian Seas (60) and the Cretan Sea (17) as well as in previous studies in Gwangyang Bay (24,62).
A higher water temperature and longer photoperiod may provide more favorable growth conditions in summer, resulting in maximal phytoplankton productivity and high Chla concentrations, as observed in cluster IV. The seasonal discrepancy in the fast growth phase of phytoplankton was also evidenced by the high POC and PN concentrations. This result further indicates that the water temperature and light conditions in summer stimulate phytoplankton growth and may serve as the main controlling factors of phytoplankton physiology in spring and summer in Gwangyang Bay. Similar positive effects of temperature on the PP and biomass of phytoplankton were reported in Gwangyang Bay [24,26,83] and other systems [84,85]. Furthermore, the increased BPC content and lower POC:Chla ratio (~120) of seston observed in cluster IV suggest the prevalence of phytoplankton-dominated organic matter and an increased nutritive food source for higher-level organisms during the warmer months in Gwangyang Bay [61,62].

4.2. Chemotaxonomic Effects of Phytoplankton on Seston Biochemical Composition

Temporal and spatial variabilities in phytoplankton community composition have been well established in Gwangyang Bay [26,66,83]. The size structure of the phytoplankton community is an important factor for the control of the macromolecular composition of seston [86]. Carbohydrates were the major biochemical components of seston in all clusters (Figure 3). Microphytoplankton (i.e., diatoms) are typically opportunists, and have a competitive advantage over small phytoplankton in nutrient-sufficient conditions because of their high capacity for nutrient assimilation [68] and production of a high level of carbohydrates by photosynthesis in the system under dynamic nutrient conditions [87]. Diatoms have larger intracellular spaces, which allow high carbohydrate accumulation [88]. Moreover, under nutrient starvation, diatoms exudate dissolved carbohydrates from their cell walls [89], thus forming extracellular polymeric substances that are a major fraction of carbohydrates [90]. Hence, it may be inferred from the diatoms’ dominance detected across the clusters that the seasonal and spatial variations in carbohydrates are controlled by diatoms (Figure 7a). Proteins were the second most predominant biochemical components of seston. This could be explained by the dominance of cryptophytes after diatoms in all clusters, because they use proteins as an integral part of their cell wall and have a relatively high protein content [23]. Moreover, the significant correlation observed between microphytoplankton and proteins and PRT:CHO ratio in the GAM analysis (p = 0.00 for both) suggests that the grazing pressure was low on microphytoplankton [91,92], and that protein accumulation by microphytoplankton is a potential driver of the PRT:CHO ratio in seston (Figure 7b,d). In contrast, smaller phytoplankton communities (picophytoplankton and nanophytoplankton) regulate the production of lipids under low nutrients, as they appear to adapt to more stable nutrient conditions [93,94]. Small-cell phytoplankton also have a high surface-to-volume ratio [95,96], which renders them more space-efficient for lipid storage, because lipids are densely packed [97]. Thus, a shift in phytoplankton community composition toward picophytoplankton was significantly associated with lipid concentrations (Figure 7c). Furthermore, lipids are a more energy-rich component compared with carbohydrates, and are rapidly accumulated and used [98].
In conclusion, the present study revealed the spatial and temporal variation in the biochemical components of seston and their controlling factors in a temperate coastal embayment of Korea. The distributions of sestonic biochemical components and phytoplankton community composition varied systematically in accordance with environmental conditions. Our results demonstrated that seasonality (riverine input and temperature), spatiality (salinity), and their combination (DIN, SiO2, and SPM) strongly influenced phytoplankton physiology, and thus the biochemical composition of seston. The carbohydrate, protein, and lipid concentrations of seston reflected the bloom physiologies of the large and small phytoplankton groups in response to environmental conditions (nutrients, SPM, and temperature), which support our initial hypothesis that phytoplankton community composition affects the distribution of sestonic biochemical composition. However, our GAM analysis showed nonsignificant relationships between carbohydrate concentrations and microphytoplankton (p = 0.13), and between CHO:LIP ratio and nanophytoplankton (p = 0.60). Similarly, the lack of relationship between some of the variables suggests that the taxonomic composition of phytoplankton plays a considerable, but sometimes limited, role in the determination of the biochemical composition of seston in Gwangyang Bay. Furthermore, the coincidence between the highest BPC concentration and peaks of total Chla provides another explicit explanation for the seasonal and spatial fluctuation in biochemical components, which would be largely governed by physiological status rather than community composition of phytoplankton in the Gwangyang Bay system. We have shown that the PRT:CHO, CHO:LIP, and POC:Chla ratios are good proxies for the physiological status of phytoplankton and highlighted the importance of phytoplankton physiology under varying environmental conditions. Our findings will be potentially useful to understand the metabolic variability of phytoplankton in response to environmental stressors and the allocation of phytoplanktonic carbon to different biochemical compounds of the seston pools in low-turbidity estuarine embayment systems. Given low SPM concentrations and slightly lower C:N ratios than the Redfield ratio in the study system, further research on microbial loop will help us better understand its role in seston dynamics in this unique coastal embayment.

Supplementary Materials

The following are available online at https://www.mdpi.com/article/10.3390/w13223221/s1, Table S1: Distributions of temperature, salinity, dissolved inorganic nitrogen (NH4+, NO2, NO3), silicate (SIO2), and phosphate (PO43−) in Gwangyang Bay during the study period., Table S2: Distributions of suspended particulate matter (SPM), phytoplankton biomass (Chla), particulate organic carbon (POC) and nitrogen (PON) concentrations, and molar POC:PN ratio (C:N), Primary Productivity (PP), carbon and nitrogen stable isotope ratio values (δ13CPOM and δ15NPOM) in Gwangyang Bay during the study period, Table S3: The concentrations of biochemical compounds (carbohydrates: CHO, proteins: PRT, lipids: LIP), biopolymeric carbon (PBC), their ratios (PRT:CHO, CHO:LIP, and POC:Chla) of seston at nine selected stations in Gwangyang Bay during the study period, Table S4: Output marker pigment:chlorophyll a ratio for phytoplankton groups as calculated by CHEMTAX in each cluster in Gwangyang Bay based on the self-organizing map. DIAT, diatoms; DINO, dinoflagellates; CRYP, cryptophytes; PELA, pelagophytes; PRYM, Prymnesiophytes; CHLO, chlorophytes; CYAN, cyanobacteria; PRAS, prasinophytes, Table S5: The generalized additive models (GAMs) analysis of phytoplankton community composition and biochemical components of seston measured in Gwangyang Bay. Bold values indicate that correlation is significant at p < 0.05, Supplementary Figure S1: Visualization of physical and biogeochemical variables on trained Self Organizing Map units.

Author Contributions

Conceptualization, R.B. and C.-K.K.; methodology, R.B., C.K. and H.Y.K.; software, R.B., J.J. and D.K.; validation, R.B. and D.K.; formal analysis, R.B., D.K., C.K., G.K.K. and J.J.; investigation, R.B., D.K., C.K. and G.K.K.; resources, C.-K.K.; data curation, R.B., H.Y.K. and D.K.; writing—original draft preparation, R.B., H.Y.K. and C.-K.K.; writing—review and editing, C.-K.K. and G.K.K.; visualization, R.B. and H.Y.K.; supervision, C.-K.K.; project administration, D.K.; funding acquisition, C.-K.K. All authors have read and agreed to the published version of the manuscript.

Funding

This research was supported by “Long-term change of structure and function in marine ecosystems of Korea”, funded by the Ministry of Oceans and Fisheries Korea.

Institutional Review Board Statement

Not applicable.

Informed Consent Statement

Not applicable.

Data Availability Statement

The data presented in this study are available on request from the corresponding author.

Acknowledgments

We thank shipmasters Sang Gil Jung and Jong Sool Kim for providing sampling facilities (i.e., boats and gears, etc.).

Conflicts of Interest

The authors declare no conflict of interest.

References

  1. Elliott, M.; McLusky, D.S. The need for definitions in understanding estuaries. Estuar. Coast. Shelf Sci. 2002, 55, 815–827. [Google Scholar] [CrossRef] [Green Version]
  2. Baird, D.; Glade, J.M.; Ulanowicz, R.E. The comparative ecology of six marine ecosystems. Philos. Trans. R. Soc. Lond. 1991, 333, 15–29. [Google Scholar] [CrossRef]
  3. Canuel, E.A. Relations between river flow, primary production and fatty acid composition of particulate organic matter in San Francisco and Chesapeake Bays: A multivariate approach. Org. Geochem. 2001, 32, 563–583. [Google Scholar] [CrossRef]
  4. Attrill, M.J.; Rundle, S.D. Ecotone or ecocline: Ecological boundaries in estuaries. Estuar. Coast. Shelf Sci. 2002, 55, 929–936. [Google Scholar] [CrossRef]
  5. Kang, H.Y.; Kim, C.; Kim, D.; Lee, Y.J.; Park, H.J.; Kundu, G.K.; Kim, Y.K.; Bibi, R.; Jang, J.; Lee, K.H.; et al. Identifying patterns in the multitrophic community and food-web structure of a low-turbidity temperate estuarine bay. Sci. Rep. 2020, 10, 16637. [Google Scholar] [CrossRef]
  6. Harmelin-Vivien, M.; Loizeau, V.; Mellon, C.; Beker, B.; Arlhac, D.; Bodiguel, X.; Ferraton, R.; Hermand, X.; Philippon, C.S.P. Comparison of C and N stable isotope ratios between surface particulate organic matter and microphytoplankton in the Gulf of Lions (NW Mediterranean). Cont. Shelf Res. 2008, 28, 1911–1919. [Google Scholar] [CrossRef] [Green Version]
  7. Hecky, R.E.; Kilham, P. Nutrient limitation of phytoplankton in freshwater and marine environments: A review of recent evidence on the effects of enrichment. Limnol. Oceanogr. 1988, 33, 790–822. [Google Scholar] [CrossRef] [Green Version]
  8. McLusky, D.S. The Estuarine Ecosystem; Chapman and Hall: New York, NY, USA, 1989. [Google Scholar]
  9. Bouillon, S.; Gillikin, D.P.; Connolly, R.M. Use of stable isotopes to understand food webs and ecosystem functioning in estuaries. In Treatise on Estuarine and Coastal Science; Wolanski, E., McLusky, D.S., Eds.; Academic Press: Waltham, MA, USA, 2011; pp. 143–173. [Google Scholar] [CrossRef]
  10. Bianchi, T.S. Estuarine chemistry. In Estuarine Ecology; Day, J.W., Crump, B.C., Kemp, W.M., Yanez-Arancibia, A., Eds.; John Wiley & Sons, Inc.: Hoboken, NJ, USA, 2013; pp. 39–83. [Google Scholar]
  11. Fichez, R.; Dennis, P.; Fontaine, M.F.; Jickells, T.C. Isotopic and biochemical composition of particulate organic matter in a shallow water estuary (Great Ouse, North Sea, England). Mar. Chem. 1993, 43, 263–276. [Google Scholar] [CrossRef]
  12. Chaparro, O.R.; Segura, C.J.; Montiel, Y.A.; Thompson, R.J.; Navarro, J.M. Variations in the quantity and composition of seston from an estuary in southern Chile on different temporal scales. Estuar. Coast. Shelf Sci. 2008, 76, 845–860. [Google Scholar] [CrossRef]
  13. Cloern, J.E. Turbidity as a control on phytoplankton biomass and productivity in estuaries. Cont. Shelf Res. 1987, 7, 1367–1381. [Google Scholar] [CrossRef]
  14. Gameiro, C.; Zwolinski, J.; Brotas, V. Light control on phytoplankton production in a shallow and turbid estuarine system. Hydrobiologia 2011, 669, 249–263. [Google Scholar] [CrossRef]
  15. Thompson, P.A.; Guo, M.; Harrison, P.J. Effects of variation in temperature. I. On the biochemical composition of eight species of marine phytoplankton. J. Phycol. 1992, 28, 481–488. [Google Scholar] [CrossRef]
  16. Healey, F.P.; Hendzel, L.L. Physiological indicators of nutrient deficiency in lake phytoplankton. J. Fish. Res. Board Can. 1980, 37, 442–453. [Google Scholar] [CrossRef]
  17. Danovaro, R.; Dell’Anno, A.; Pusceddu, A.; Marrale, D.; Croce, N.D.; Fabiano, M.; Tselepides, A. Biochemical composition of pico-, nano- and micro-particulate organic matter and bacterioplankton biomass in the oligotrophic Cretan Sea (NE Mediterranean). Prog. Oceanogr. 2000, 46, 279–310. [Google Scholar] [CrossRef]
  18. Lee, S.H.; Kim, H.J.; Whitledge, T.E. High incorporation of carbon into proteins by the phytoplankton of the Bering Strait and Chukchi Sea. Cont. Shelf Res. 2009, 29, 1689–1696. [Google Scholar] [CrossRef]
  19. Finkel, Z.V. Light absorption and size scaling of light limited metabolism in marine diatoms. Limnol. Oceanogr. 2001, 46, 86–94. [Google Scholar] [CrossRef] [Green Version]
  20. Finkel, Z.V.; Beardall, J.; Flynn, K.J.; Quigg, A.; Rees, T.A.V.; Raven, J.A. Phytoplankton in a changing world: Cell size and elemental stoichiometry. J. Plankton Res. 2010, 32, 119–137. [Google Scholar] [CrossRef] [Green Version]
  21. Marañón, E. Cell size as a key determinant of phytoplankton metabolism and community structure. Ann. Rev. Mar. Sci. 2015, 7, 241–264. [Google Scholar] [CrossRef] [PubMed] [Green Version]
  22. Marañón, E.; Cermeño, P.; Latasa, M.; Tadonléké, R.D. Temperature, resources, and phytoplankton size structure in the ocean. Limnol. Oceanogr. 2012, 57, 1266–1278. [Google Scholar] [CrossRef]
  23. Finkel, Z.V.; Follows, M.J.; Liefer, J.D.; Brown, C.M.; Benner, I.; Irwin, A.J. Phylogenetic diversity in the macromolecular composition of microalgae. PLoS ONE 2016, 11, e0155977. [Google Scholar] [CrossRef] [PubMed] [Green Version]
  24. Lee, J.H.; Lee, D.; Kang, J.J.; Joo, H.T.; Lee, J.H.; Lee, H.W.; Ahn, S.H.; Kang, C.K.; Lee, S.H. The effects of different environmental factors on the biochemical composition of particulate organic matter in Gwangyang Bay, South Korea. Biogeosciences 2017, 14, 1903–1917. [Google Scholar] [CrossRef] [Green Version]
  25. Whyte, J.N.C. Biochemical composition and energy content of six species of phytoplankton used in mariculture of bivalves. Aquaculture 1987, 60, 231–241. [Google Scholar] [CrossRef]
  26. Bibi, R.; Kang, H.Y.; Kim, D.; Jang, J.; Kundu, G.K.; Kim, Y.K.; Kang, C.K. Dominance of autochthonous phytoplankton-derived particulate organic matter in a low-turbidity temperate estuarine embayment, Gwangyang Bay, Korea. Front. Mar. Sci. 2020, 7, 580260. [Google Scholar] [CrossRef]
  27. Shaha, D.C.; Cho, Y.K.; Kim, T.W.; Valle-Levinson, A. Spatio-temporal variation of flushing time in the Sumjin River estuary. Terr. Atmos. Ocean. Sci. 2012, 23, 119–130. [Google Scholar] [CrossRef] [Green Version]
  28. Kang, Y.; Kang, Y.H.; Kim, J.K.; Kang, H.Y.; Kang, C.K. Year-to-year variation of phytoplankton blooms in an anthropogenically impacted and complex estuary: A novel paradigm for river discharge influence. Mar. Pollut. Bull. 2020, 161, 111756. [Google Scholar] [CrossRef]
  29. Kwon, K.Y.; Moon, C.H.; Yang, H.S. Behavior of nutrient along the salinity gradients in the Seomjin River Estuary. J. Korean Fish. Soc. 2001, 34, 199–206. [Google Scholar]
  30. Kwon, K.Y.; Moon, C.H.; Lee, J.S.; Yang, S.R.; Park, M.O.; Lee, P.Y. Estuarine behavior and flux of nutrients in the Seomjin River estuary. Sea J. Korean Soc. Oceanogr. 2004, 9, 153–163. [Google Scholar]
  31. Kim, C.; Kang, H.Y.; Lee, Y.J.; Yun, S.G.; Kang, C.K. Isotopic variation of macrobenthic invertebrates and their sources of organic matters along an estuarine gradient. Estuar. Coast. 2020, 43, 496–511. [Google Scholar] [CrossRef]
  32. Liénart, C.; Savoye, N.; Bozec, Y.; Breton, E.; Conan, P.; David, V.; Feunteun, E.; Grangeré, K.; Kerhervé, P.; Lebreton, B.; et al. Dynamics of particulate organic matter composition in coastal systems: A spatio-temporal study at multi-systems scale. Prog. Oceanogr. 2017, 156, 221–239. [Google Scholar] [CrossRef] [Green Version]
  33. Kim, B.J.; Ro, Y.J.; Jung, K.Y.; Park, K.S. Numerical modeling of circulation characteristics in the Kwangyang Bay estuarine system. J. Korean Soc. Coast. Ocean Eng. 2014, 26, 253–266. [Google Scholar] [CrossRef]
  34. Kwon, K.Y.; Moon, C.H.; Kang, C.K.; Kim, Y.N. Distribution of particulate organic matters along the salinity gradients in the Seomjin River estuary. J. Korean Fish. Soc. 2002, 25, 86–96. [Google Scholar] [CrossRef]
  35. Nieuwenhuize, J.; Maas, Y.E.M.; Middelburg, J.J. Rapid analysis of organic carbon and nitrogen in particulate materials. Mar. Chem. 1994, 45, 217–224. [Google Scholar] [CrossRef] [Green Version]
  36. Murphy, J.; Riley, J.P.A. Modified single solution method for the determination of phosphate in natural waters. Anal. Chim. Acta. 1962, 27, 31–36. [Google Scholar] [CrossRef]
  37. Helder, W.; de Vries, R.T.P. An automatic phenol-hypochlorite method for the determination of ammonia in sea and brackish water. Neth. J. Sea Res. 1979, 13, 154–160. [Google Scholar] [CrossRef]
  38. Hansen, H.P.; Grasshoff, K. Automated chemical analysis. In Methods of Seawater Analysis; Grasshoff, K., Kremling, K., Ehrhardt, M., Eds.; Verlag Chemie: Weinheim, Germany, 1983; pp. 347–379. [Google Scholar]
  39. Zapata, M.; Rodríguez, F.; Garrido, J.L. Separation of chlorophylls and carotenoids from marine phytoplankton: A new HPLC method using a reversed phase C8 column and pyridine containing mobile phases. Mar. Ecol. Progr. Ser. 2000, 195, 29–45. [Google Scholar] [CrossRef] [Green Version]
  40. Park, H.J.; Choy, E.J.; Kang, C.K. Spatial and temporal variations of microphytobenthos on the common reed Phragmites australis bed in a marine protected area of Yeoja Bay, Korea. Wetlands 2013, 33, 737–745. [Google Scholar] [CrossRef]
  41. Jeffrey, S.W. Application of pigment methods to oceanography. In Phytoplankton Pigments in Oceanography: Guidelines to Modern Methods; Jeffery, S.W., Mantoura, R.F.C., Wright, S.W., Eds.; UNESCO Publishing: Paris, France, 1997; pp. 127–166. [Google Scholar]
  42. Lewitus, A.J.; White, D.L.; Tymowski, R.G.; Geesey, M.E.; Hymel, S.N.; Noble, P.A. Adapting the CHEMTAX method for assessing phytoplankton taxonomic composition in southeastern US estuaries. Estuaries 2005, 1, 160–172. [Google Scholar] [CrossRef]
  43. Lee, Y.W.; Park, M.O.; Kim, Y.S.; Kim, S.S.; Kang, C.K. Application of photosynthetic pigment analysis using a HPLC and CHEMTAX program to studies of phytoplankton community composition. J. Korean Soc. Oceanogr. 2011, 16, 117–124. [Google Scholar] [CrossRef] [Green Version]
  44. Hama, T.; Miyazaki, T.; Ogawa, Y.; Iwakuma, M.; Takahashi, M.; Otsuki, A.; Ichimura, S. Measurement of photosynthetic production of a marine phytoplankton population using a sTable 13C isotope. Mar. Biol. 1983, 73, 31–36. [Google Scholar] [CrossRef]
  45. Kanda, J.; Saino, T.; Hattori, A. Nitrogen uptake by natural populations of phytoplankton and primary production in the Pacific Ocean: Regional variability of uptake capacity. Limnol. Oceanogr. 1985, 30, 987–999. [Google Scholar] [CrossRef]
  46. Fan, C.; Glibert, P.M. Effects of light on nitrogen and carbon uptake during a Prorocentrum minimum bloom. Harmful Algae. 2005, 4, 629–641. [Google Scholar] [CrossRef]
  47. Kwak, J.H.; Lee, S.H.; Hwang, J.; Suh, Y.S.; Park, H.; Chang, K.I.; Kim, K.R.; Kang, C.K. Summer primary productivity and phytoplankton community composition driven by different hydrographic structures in the East/Japan Sea and the Western Subarctic Pacific. J. Geophys. Res. Oceans. 2014, 11, 4505–4519. [Google Scholar] [CrossRef]
  48. Lowry, O.H.; Rosebrough, N.J.; Farr, A.L.; Randall, R.J. Protein measurement with the Folin phenol reagent. J. Boil. Chem. 1951, 193, 265–275. [Google Scholar] [CrossRef]
  49. Dubois, M.; Gilles, K.A.; Hamilton, J.K.; Rebers, P.A.; Smith, F. Colorimetric method for determination of sugars and related substances. Anal. Chem. 1956, 28, 350–356. [Google Scholar] [CrossRef]
  50. Marsh, J.B.; Weinstein, D.B. Simple charring method for determination of lipids. J. Lipid Res. 1966, 7, 574–576. [Google Scholar] [CrossRef]
  51. Bligh, E.G.; Dyer, W.J. A rapid method of total lipid extraction and purification. Can. J. Biochem. Physiol. 1959, 37, 911–917. [Google Scholar] [CrossRef]
  52. Fabiano, M.; Danovaro, R. Composition of organic matter in sediments facing a river estuary (Tyrrhenian Sea): Relationship with bacteria and microphytobenthic biomass. Hydrobiology 1994, 277, 71–84. [Google Scholar] [CrossRef]
  53. Fabiano, M.; Danovaro, R.; Fraschetti, S. A three-year time series of elemental and biochemical composition of organic matter in subtidal sandy sediments of the Ligurian sea (North western Mediterranean). Cont. Shelf Res. 1995, 15, 1453–1469. [Google Scholar] [CrossRef]
  54. Kohonen, T. Self-Organizing Maps, 3rd ed.; Springer: Berlin/Heidelberg, Germany, 2001. [Google Scholar]
  55. Park, Y.S.; Céréghino, R.; Compin, A.; Lek, S. Applications of artificial neural networks for patterning and predicting aquatic insect species richness in running waters. Ecol. Model. 2003, 160, 265–280. [Google Scholar] [CrossRef]
  56. Vesanto, J.; Alhoniemi, E. Clustering of the self-organizing map. IEEE Trans. Neural Netw. 2000, 11, 586–600. [Google Scholar] [CrossRef]
  57. Legendre, P.; Legendre, L. Numerical Ecology, 3rd ed.; Elsevier: Amsterdam, The Netherlands, 2012. [Google Scholar]
  58. Hastie, T.J.; Tibshirani, R.J. Generalized Additive Models; Chapman and Hall/CRC Press: Boca Raton, FL, USA, 1990. [Google Scholar]
  59. Wood, S. Package ‘mgcv’. R Package Version 1.8-36. 2021. Available online: https://CRAN.R-project.org/package=mgcv (accessed on 15 March 2021).
  60. Ahn, S.H.; Whitledge, T.E.; Stockwell, D.A.; Lee, J.H.; Lee, H.; Lee, S.H. The biochemical composition of phytoplankton in the Laptev and East Siberian seas during the summer of 2013. Polar Biol. 2019, 42, 133–148. [Google Scholar] [CrossRef]
  61. Kang, J.J.; Joo, H.; Lee, J.H.; Lee, J.H.; Lee, H.W.; Lee, D.; Kang, C.K.; Yun, M.S.; Lee, S.H. Comparison of biochemical compositions of phytoplankton during spring and fall seasons in the northern East/Japan Sea. Deep Sea Res. II 2017, 143, 73–81. [Google Scholar] [CrossRef]
  62. Kim, Y.; Lee, J.H.; Kang, J.J.; Lee, J.H.; Lee, H.W.; Kang, C.K.; Lee, S.H. River discharge effects on the contribution of small-sized phytoplankton to the total biochemical composition of POM in the Gwangyang Bay, Korea. Estuar. Coast. Shelf Sci. 2019, 226, 106293. [Google Scholar] [CrossRef]
  63. Finkel, Z.V.; Quigg, A.S.; Raven, J.A.; Reinfelder, O.E.; Schofield; Falkowski, P.G. Irradiance and the elemental stoichiometry of marine phytoplankton. Limnol. Oceanogr. 2006, 51, 2690–2701. [Google Scholar] [CrossRef] [Green Version]
  64. Cloern, J.E.; Jassby, A.D.; Schraga, T.S.; Nejad, E.; Martin, C. Ecosystem variability along the estuarine salinity gradient: Examples from longterm study of San Francisco Bay. Limnol. Oceanogr. 2017, 62, 272–291. [Google Scholar] [CrossRef] [Green Version]
  65. Hernando, M.; Schloss, I.; Malanga, G.; Almandoz, G.; Ferreyra, G.; Aguiar, M.; Puntarulo, S. Effects of salinity changes on coastal Antarctic phytoplankton physiology and assemblage composition. J. Exp. Mar. Biol. Ecol. 2015, 466, 110–119. [Google Scholar] [CrossRef]
  66. Jang, P.K.; Lee, W.J.; Jang, M.C.; Lee, J.D.; Lee, W.J.; Chang, M.; Hwang, K.C.; Shin, K. Spatial and temporal distribution of inorganic nutrients and factors controlling their distributions in Gwangyang Bay. Ocean Polar Res. 2005, 27, 359–379. [Google Scholar] [CrossRef] [Green Version]
  67. Kilham, S.S.; Kreeger, D.A.; Goulden, C.E.; Lynn, S.G. Effects of nutrient limitation on biochemical constituents of Ankistrodesmus falcatus. Freshw. Biol. 1997, 38, 591–596. [Google Scholar] [CrossRef]
  68. Litchman, E.; Klausmeier, C.A.; Schofield, O.M.; Falkowski, P.G. The role of functional traits and trade-offs in structuring phytoplankton communities: Scaling from cellular to ecosystem level. Ecol. Lett. 2007, 10, 1170–1181. [Google Scholar] [CrossRef]
  69. Fabiano, M.; Povero, P.; Danovaro, R. Distribution and composition of particulate organic matter in the Ross sea (Antarctica). Polar Biol. 1993, 13, 525–533. [Google Scholar] [CrossRef]
  70. Rhee, G.Y.; Gotham, I.J. The effect of environmental factors on phytoplankton growth: Temperature and the interactions of temperature with nutrient limitation. Limnol. Oceanogr. 1981, 26, 635–648. [Google Scholar] [CrossRef]
  71. Gasparovic, B.; Frka, S.; Koch, B.P.; Zhu, Z.Y.; Bracher, A.; Lechtenfeld, O.J.; Neogi, S.B.; Lara, R.J.; Kattner, G. Factors influencing particulate lipid production in the East Atlantic Ocean. Deep-Sea Res. I 2014, 89, 56–67. [Google Scholar] [CrossRef] [Green Version]
  72. Arin, L.; Morán, X.A.G.; Estrada, M. Phytoplankton size-distribution and growth rates in the Alboran Sea (SW Mediterranean): Short-term variability related to mesoscale hydrodynamics. J. Plankton Res. 2002, 24, 1019–1033. [Google Scholar] [CrossRef] [Green Version]
  73. Putland, J.N.; Iverson, R.L. Phytoplankton biomass in a subtropical estuary: Distribution, size composition, and carbon:chlorophyll ratios. Estuar. Coast. 2007, 30, 878–885. [Google Scholar] [CrossRef]
  74. Garcia, N.S.; Sexton, J.; Riggins, T.; Brown, J.; Lomas, M.W.; Martiny, A.C. High variability in cellular stoichiometry of carbon, nitrogen, and phosphorus within classes of marine eukaryotic phytoplankton under sufficient nutrient conditions. Front. Microbio. 2018, 9, 543. [Google Scholar] [CrossRef] [Green Version]
  75. Pusceddu, A.; Bianchelli, S.; Gambi, C.; Danovaro, R. Assessment of benthic tropic status of marine coastal ecosystems: Significance of meiofaunal rare taxa. Estuar. Coast. Shelf Sci. 2011, 93, 420–430. [Google Scholar] [CrossRef]
  76. Danovaro, R.; Fabiano, M. Seasonal changes in quality and quantity of food available for benthic suspension—Feeders in the Golfo Marconi (North–Western Mediterranean). Estuar. Coast. Shelf Sci. 1997, 44, 726–733. [Google Scholar] [CrossRef]
  77. Gillooly, J.F.; Brown, J.H.; West, G.B.; Savage, V.M.; Charnov, E.L. Effects of size and temperature on metabolic rate. Science 2001, 293, 2248–2251. [Google Scholar] [CrossRef] [PubMed] [Green Version]
  78. Liebezeit, G. Particulate carbohydrate in relation to phytoplankton in the euphotic zone of the Bransfield Strait. Polar Biol. 1984, 2, 225–228. [Google Scholar] [CrossRef]
  79. D’souza, F.; Bhosle, N.B. Variation in the composition of carbohydrates in the Dona Paula Bay (west of India) during May/June 1998. Oceanol. Acta 2001, 24, 221–237. [Google Scholar] [CrossRef] [Green Version]
  80. Cermeño, P.; Estévez-Blanco, P.; Marañón, E.; Fernóndez, E. Maximum photosynthetic efficiency of size-fractionated phytoplankton assessed by 14C uptake and fast repetition rate fluorometry. Limnol. Oceanogr. 2005, 50, 1438–1446. [Google Scholar] [CrossRef] [Green Version]
  81. Maranón, E.; Cermeño, P.; Latasa, M.; Tadonléké, R.D. Resource supply alone explains the variability of marine phytoplankton size structure. Limnol. Oceanogr. 2015, 60, 1848–1854. [Google Scholar] [CrossRef] [Green Version]
  82. Justić, D.; Rabalais, N.N.; Turner, R.E.; Dortch, Q. Changes in nutrient structure of river-dominated coastal water: Stoichiometric nutrient balance and its consequences. Estuar. Coast. Shelf Sci. 1995, 40, 339–356. [Google Scholar] [CrossRef]
  83. Baek, S.H.; Kim, D.; Son, M.; Yun, S.M.; Kim, Y.O. Seasonal distribution of phytoplankton assemblages and nutrient-enriched bioassays as indicators of nutrient limitation of phytoplankton growth in Gwangyang Bay, Korea. Estuar. Coast. Shelf Sci. 2015, 163, 265–278. [Google Scholar] [CrossRef]
  84. Brooks, P.D.; Haas, P.A.; Huth, A.K. Seasonal variability in the concentration and flux of organic matter and inorganic nitrogen in a semiarid catchment, San Pedro River, Arizona. J. Geophys. Res. 2007, 112, G03S04. [Google Scholar] [CrossRef] [Green Version]
  85. Lewandowska, A.M.; Breithaupt, P.; Hillebrand, H.; Hoppe, H.G.; Jürgens, K.; Sommer, U. Responses of primary productivity to increased temperature and phytoplankton diversity. J. Sea Res. 2012, 72, 87–93. [Google Scholar] [CrossRef]
  86. Liefer, J.D.; Garg, A.; Fyfe, M.H.; Irwin, A.J.; Benner, I.; Brown, C.M.; Follows, M.J.; Omta, A.W.; Finkel, Z.V. The Macromolecular Basis of Phytoplankton C:N:P Under Nitrogen Starvation. Front. Microbiol. 2019, 10, 763. [Google Scholar] [CrossRef] [Green Version]
  87. Bhosle, N.B.; Wagh, A.B. Particulate carbohydrates in the Arabian Sea. Oceanol. Acta. 1989, 12, 57–63. Available online: http://drs.nio.org/drs/handle/2264/7254 (accessed on 10 June 2021).
  88. Sicko-Goad, L.M.; Schelske, C.L.; Stoermer, E.F. Estimation of intracellular carbon and silica content of diatoms from natural assemblages using morphometric techniques. Limnol. Oceanogr. 1984, 29, 1170–1178. [Google Scholar] [CrossRef]
  89. Granum, E.; Kirkvold, S.; Myklestad, S.M. Cellular and extracellular production of carbohydrates and amino acids by the marine diatom Skeletonema costatum: Diel variations and effects of N depletion. Mar. Ecol. Prog. Ser. 2002, 242, 83–94. [Google Scholar] [CrossRef] [Green Version]
  90. Wetz, M.S.; Wheeler, P.A. Release of dissolved organic matter by coastal diatoms. Limnol. Oceanogr. 2007, 52, 798–807. [Google Scholar] [CrossRef]
  91. Bergkvist, J.; Thor, P.; Jakobsen, H.H.; Wängberg, S.A.; Selander, E. Grazer-induced chain length plasticity reduces grazing risk in a marine diatom. Limnol. Oceanogr. 2012, 57, 318–324. [Google Scholar] [CrossRef]
  92. Chen, M.; Kim, D.; Liu, H.; Kang, C.K. Variability in copepod trophic levels and feeding selectivity based on stable isotope analysis in Gwangyang Bay of the southern coast of the Korean peninsula. Biogeosciences 2018, 15, 2055–2073. [Google Scholar] [CrossRef] [Green Version]
  93. Martin, G.J.O.; Hill, D.R.A.; Olmstead, I.L.D.; Bergamin, A.; Shears, M.J.; Dias, D.A.; Kentish, S.E.; Scales, P.J.; Botté, C.Y.; Callahan, D.L. Lipid profile remodeling in response to nitrogen deprivation in the microalgae Chlorella sp. (Trebouxiophyceae) and Nannochloropsis sp. (Eustigmatophyceae). PLoS ONE 2014, 9, 1–10. [Google Scholar] [CrossRef] [Green Version]
  94. Irwin, A.J.; Finkel, Z.V.; Schofield, O.M.; Falkowski, P.G. Scaling-up from nutrient physiology to the size-structure of phytoplankton communities. J. Plankton Res. 2006, 5, 459–471. [Google Scholar] [CrossRef] [Green Version]
  95. Cardol, P.; Bailleul, B.; Rappaport, F.; Derelle, E.; Béal, D.; Breyton, C.; Bailey, S.; Wollman, F.A.; Grossman, A.; Moreau, H.; et al. An original adaptation of photosynthesis in the marine green alga Ostreococcus. Proc. Natl. Acad. Sci. USA 2008, 105, 7881–7886. [Google Scholar] [CrossRef] [Green Version]
  96. Six, C.; Sherrard, R.; Lionard, M.; Roy, S.; Campbell, D.A. Photosystem II and pigment dynamics among ecotypes of the green alga Ostreococcus. Plant Physiol. 2009, 151, 379–390. [Google Scholar] [CrossRef] [Green Version]
  97. Subramanian, S.; Barry, A.N.; Pieris, S.; Sayre, R.T. Comparative energetics and kinetics of autotrophic lipid and starch metabolism in chlorophytic microalgae: Implications for biomass and biofuel production. Biotechnol. Biofuels. 2013, 6, 150. [Google Scholar] [CrossRef] [Green Version]
  98. Lacour, T.; Sciandra, A.; Talec, A.; Mayzaud, P.; Bernard, O. Diel variations of carbohydrate and neutral lipids in nitrogen-sufficient and nitrogen-starved cyclostat cultures of Isochrysis sp. J. Phycol. 2012, 48, 966–975. [Google Scholar] [CrossRef]
Figure 1. Map showing the location of Gwangyang Bay on the southern coast of the Korean peninsula (a), as well as the locations of the sampling stations in the bay (b) and in the estuarine channel (c). The gray lines represent water depth, and the dotted areas are intertidal beds: dark gray area, Zostera bed (b); and dark area, Phragmites bed (c).
Water 13 03221 g001
Figure 2. (a) Classification of the samples according to time and space on the Kohonen self-organizing map (SOM) trained with biogeochemical parameters. The acronyms of individual samples are denoted by a combination of the sampling month (February [F], May [M], August [A], and November [N]) and the number of the station (1–9). (b) Dendrogram of the trained SOM units for four clusters based on Ward’s linkage method. The numbers are noted from top to bottom and from left to right on the map. Clusters are indicated by different colors and corresponding numbers.
Water 13 03221 g002
Figure 3. Distributions of the biogeochemical variables, as characterized by their median values in each cluster.
Water 13 03221 g003
Figure 4. Box and whisker plots of the four clusters showing the variations in the concentrations of (a) total suspended particulate matter (SPM), (b) carbohydrates (CHO), (c) proteins (PRT), and (d) lipids (LIP) of POM; (e) protein-to-carbohydrate ratio (PRT:CHO); and (f) carbohydrate-to-lipid ratio (CHO:LIP) in each cluster. The median value of each cluster is indicated by the horizontal bar inside the box. The same superscripts within each panel indicate statistically nonsignificant differences between clusters (p > 0.05).
Water 13 03221 g004
Figure 5. Box and whisker plots showing (a) biopolymeric carbon (BPC), (b) particulate organic carbon (POC), (c) particulate nitrogen (PN), (d) POC:Chla ratio, and (e) C:N ratio; as well as isotopic compositions of particulate organic matter (POM) ((f), δ13CPOM; and (g), δ15NPOM) of four clusters. The median value of each cluster is indicated by the horizontal bar inside the box. The same superscripts within each panel indicate statistically nonsignificant differences between clusters (p > 0.05).
Water 13 03221 g005
Figure 6. Box and whisker plots showing (a) water temperature, (b) salinity, (c) ammonium (NH4+), (d) nitrite (NO2), (e) nitrate (NO3), (f) silicate (SiO2), (g) dissolved inorganic phosphate (DIP = PO43−), (h) total Chla, and (i) phytoplankton primary productivity of four clusters. The median value of each cluster is displayed with the horizontal bar inside the box. The same superscripts indicate statistically nonsignificant differences between clusters (p > 0.05).
Water 13 03221 g006
Figure 7. Generalized additive models (GAMs) best fitted to the biochemical characteristics of seston and phytoplankton size groups (ae). Statistically significant (p < 0.05) relationships are indicated by solid lines, with shaded areas representing the 95% pointwise confidence intervals.
Water 13 03221 g007
Publisher’s Note: MDPI stays neutral with regard to jurisdictional claims in published maps and institutional affiliations.

