Article

Exploring Cruise Tourists’ Preferences and Satisfaction: The Case of Taiwan

1
Department of Accounting, Jiaxing University, Jiaxing 314001, China
2
Department of Health Industry Technology Management, Chung Shan Medical University, Taichung City 40201, Taiwan
3
Department of Medical Management, Chung Shan Medical University Hospital, No. 110, Sec. 1, Jianguo N. Rd., Taichung City 40201, Taiwan
*
Author to whom correspondence should be addressed.
Water 2021, 13(22), 3183; https://doi.org/10.3390/w13223183
Submission received: 20 October 2021 / Revised: 6 November 2021 / Accepted: 9 November 2021 / Published: 11 November 2021
(This article belongs to the Special Issue Port Structures, Maritime Transport and Tourism)

Abstract

:
In this study, the product attributes of cruise tours are distinguished into on-board activities, leisure space, cabin comfort, Michelin restaurant, and refund mechanism, and the multi-attribute utility model of cruise tours is constructed using the choice experiment (CE) method. Of the 575 questionnaires distributed, 439 were valid, with an effective recovery rate of 76.3%. The results revealed the following: (1) when cruisers travel, what they value the most is the quality of service on board, followed by the facilities on board; (2) passengers’ preferences for comfortable pool space and more activities on board are negatively significant, indicating that they do not prefer to add these amenities and experiences to the cruise ship; (3) passengers are willing to pay extra to upgrade the interior cabin to one with a view and to experience the Michelin restaurant; and (4) influenced by the COVID-19 pandemic, cruisers are more willing to manage their own health. Moreover, the pandemic does not reduce their willingness to travel by cruise.

1. Introduction

According to a report by the United Nations World Tourism Organization (UNWTO) (2019), the number of international tourists reached 1.5 billion in 2019 worldwide, with a growth rate of 4% compared with that in 2018, and the cruise industry is the fastest growing segment of the tourism industry [1]. According to a report by the Cruise Lines International Association (CLIA) (2019) [2], the global cruise market is growing steadily at an average rate of 7% per year. In 2017, the number of cruisers in Asia reached 4.06 million, accounting for 15% of the global cruise market, with a growth rate of 20.5%. Taiwan’s cruise market continues to advance with the growth of the Asian cruise market. Currently, cruise operators such as Star Cruises, Royal Caribbean, Princess Cruises, Costa Crociere, and others provide cruise tourism services with the Port of Keelung as their homeport, whereas other cruise ships use the Port of Keelung as the port of call for docking. In 2013, about 400,000 international cruisers visited the Port of Keelung; the number increased to 940,000 in 2018 and up to 1.09 million in 2019, ranking second in Asia with a 7.6% share of cruisers [3].
However, when the outbreak of the COVID-19 pandemic in 2020 impacted the global economy, tourism was one of the industries hit the hardest. As estimated by the World Tourism Council (WTC), approximately 75 million jobs were at risk and USD2.1 trillion was lost globally. According to CLIA, 32 million travelers worldwide were expected to travel by cruise in 2020 originally [2]. However, due to the COVID-19 cases on the Diamond Princess cruise ship, which led to lockdowns and travel restrictions by governments around the world, almost all cruise lines have been suspended, significantly impacting their revenue [4]. For example, the loss was USD530 million per month for Carnival Corporation, USD270 million per month for Royal Caribbean, and USD175 million per month for Norwegian Cruise Line [5]. Only about 600,000 travelers traveled by cruise in 2020 [6]. The COVID-19 cases highlighted the risk of infectious disease transmission to the cruise industry [7]. For tourists, the perception of COVID-19 infection risk and health threat could positively intensify their intention to cancel their travel plans [7]. These behaviors are essential to the tourism industry during the pandemic. Therefore, in the future, we need to pay more attention to the sustainable operation of cruise tourism and the development of tourism safety and strive toward the prevention of related diseases, so that cruisers feel more secure about cruise tours.
Nowadays, cruise operators are constantly marketing their own features and updating their products to be more special and innovative. In addition to actively seeking potential cruisers, they aim to increase existing cruisers’ willingness to revisit. Therefore, it is crucial to understand the reasons and influencing factors for travelers to choose cruise tours to develop appropriate marketing strategies and make the business more competitive [8]. Previously, many scholars have conducted research on cruise facilities and services such as leisure space [1], on-board activities [9], shore excursions [10,11], shipscape and cabin comfort [12], and food and beverages [13,14]).
Xie et al. (2012) [9] discussed the importance of various facilities on cruise ships and found that core services such as rooms, restaurants, and food are the attributes most valued by cruisers. In terms of the direction of cruise development, the attractiveness of cruise facilities is an extremely important factor for travelers to consider that will affect whether they choose cruise as their travel option. Moreover, cruisers will have different demands for different resources provided by the cruise depending on their age, gender, and income. Travelers take cruises to enjoy resources at different levels on cruise ships, and thus, they are willing to pay different or even higher prices depending on the resources they want to experience [15,16]. Willingness to pay (WTP) is the amount that consumers think is most appropriate and are willing to pay for a product [17,18]. Casado-Díaz et al. (2020) [19] pointed out in their study that 44.3% of travelers would pay extra to stay in hotels with water saving devices installed, with an average WTP of EUR 4.29. Ho et al. (2018) [20] found that the additional climate surcharge paid by travelers to mitigate climate change is the highest for short-haul flights (EUR 55 per ton of CO2), followed by long-haul flights (EUR 36 per ton of CO2).
Previous studies on consumer preferences have been conducted mainly by two methods: revealed preference (RP) and stated preference (SP). In particular, the RP method is the use of real market conditions to collect respondents’ actual behaviors for analysis, whereas the SP method is the use of the combination of attributes and levels set in the study to design hypothetical scenarios for respondents to choose from and to obtain data from them for analysis. The common evaluation methods can be divided into two kinds: the contingent valuation method (CVM) and choice experiment (CE). The CVM can only be applied to assess the WTP of a single attribute of a product and cannot compare the WTP of different attributes of a product simultaneously [21], whereas the CE method has the ability to assess multi-attributes and levels and can avoid fallacies in evaluation [22]. Therefore, the CE method has gradually become an important tool for measuring the value of non-market goods [23] and is widely used in the social sciences. Examples include the sharing economy [24,25,26], consumer behavior [27,28], green energy [29,30,31], ecosystem services [32,33,34], forest landscapes [35,36], and so on. In recent years, this method has also been applied to the study of leisure tourism [37,38].
Vogel et al. (2012) [39] applied the CE method to explore cruisers’ perceived value and purchase intention toward cruise routes and ticket prices. Mahadevan and Chang (2017) [40] used the CE method to explore the importance of attribute preferences on cruise ships, and the results of the study revealed that the most preferred attribute among cruisers was a cabin with a view, followed by diverse on-board activities. Lee et al. (2019) [41] used the CE method to explore cruisers’ preferences for various attributes and their WTP in whale-watching tours, and the research results demonstrated that respondents preferred tour groups with high interactivity (e.g., providing interpretation services) and were willing to pay USD9.06 if interpretation services were included in the trip. The second was their WTP for actually seeing whales. If the chance of seeing whales increased from 25% to 50%, cruisers were willing to pay USD10.55, and if it increased to 75%, they were willing to pay USD18.48; furthermore, if access to the whale museum or whale cultural village was offered, they were willing to pay USD17.83 for the entrance fee. Hwang et al. (2019) [42] used the CE method to explore the planning of in-flight casino facilities by international airlines to relieve their customers’ boredom and fatigue emanating from long, tedious flights and found that respondents were willing to pay an additional amount of USD22.44 and USD6.26 to improve the interior environment and service quality of in-flight casinos, respectively.
In summary, previous studies on cruise tours have focused on the preferences for on-board activities, cabin differences, shore excursions, and cruise routes. This study distinguishes the attributes of cruise tours into on-board activities, leisure space, and cabin comfort and adds the attributes of dining experience in a Michelin restaurant and the refund mechanism to the price variables. Moreover, it adopts the CE method to deduce cruisers’ overall preferences and WTP for various service attributes of cruise tours. The research results of the above topics are expected to be used as a reference basis for different tourism distribution channels such as cruise operators or travel agencies.
The paper is organized as follows: Section 2 presents the methodology describing the CE method and presents the data and application; Section 3 discusses the main results; and Section 4 summarizes the conclusions and implications of the paper.

2. Materials and Methods

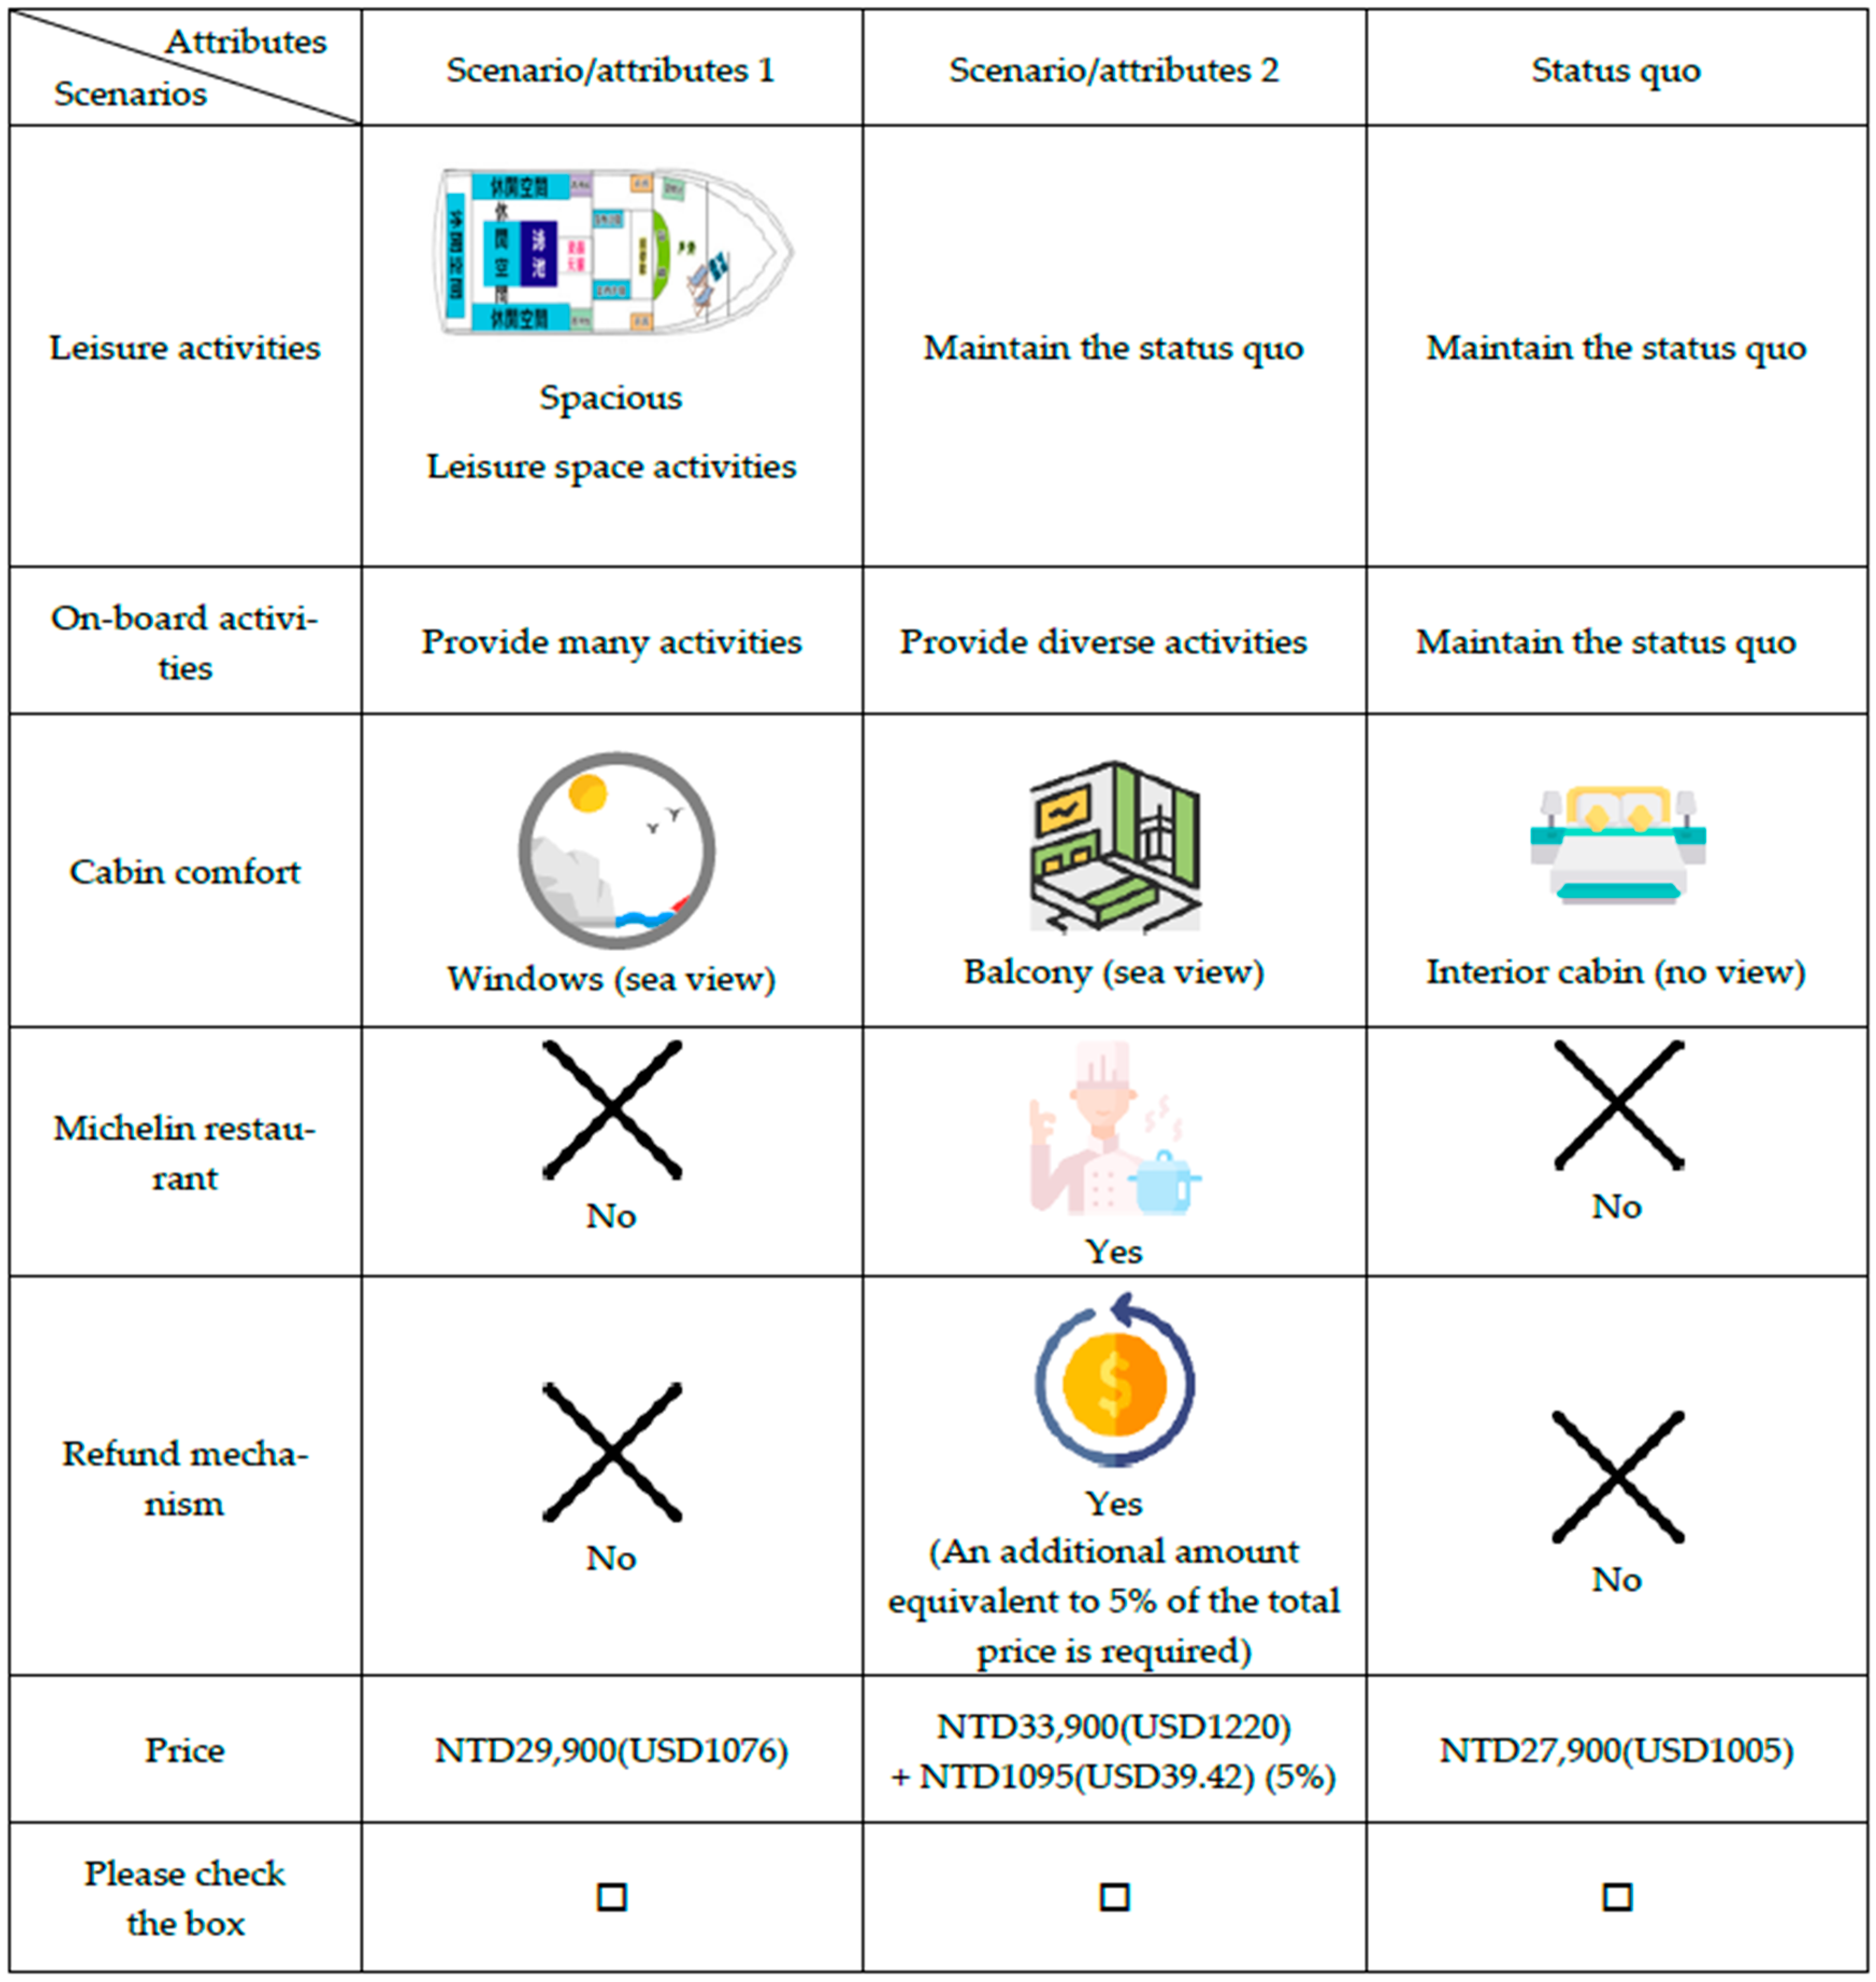
2.1. Choice Experiment Design

This study examines five attributes of cruise tourism: leisure space, on-board activities, cabin comfort, Michelin restaurant, and refund mechanism. The cabin prices are based on the Taiwan–Okinawa 4 days/3 nights itinerary quoted by the Majestic Princess cruise ship. The details are shown in Table 1.
To develop a questionnaire template that was convenient for respondents to fill out, in this study, we used an orthogonal factorial design (via the SPSS orthogonal design) to screen 324 (34 × 22) combinations. After removing the unreasonable combinations, each choice set contained two alternative scenarios with random values and one current scenario. Each questionnaire contained three sets of selected alternatives for five questionnaire versions.
This questionnaire was designed to cover three parts. The first part is the cruisers’ degree of knowledge and attention to cruise itineraries when they participate in cruise tours, as well as their degree of caution on cruise tours under the impact of COVID-19. Respondents were asked to check the boxes in order of the degree of importance they attach to the item, from strongly disagree (1) to strongly agree (5). In the second part, the choice set in the second stage was designed by referring to the prices of the “Taiwan–Okinawa 4 days/3 nights itinerary” provided on the official website of Majestic Princess. Assuming that the respondents were going to travel on the cruise, in addition to the status quo where the services and facilities would not be adjusted or changed, they could choose from the cruise product portfolio consisting of leisure space, on-board activities, cabin comfort, Michelin restaurant, and refund mechanism (as shown in Figure 1) and choose their favorite plan according to their preferences. The third part of the survey is the respondents’ socioeconomic background information, including gender, age, education level, and average personal monthly income. The connotation of each attribute is described as follows.

2.1.1. Leisure Space

Wakefield and Blodgett (1994) [43] pointed out in their research that, as cruisers want to relax comfortably, the limited space on the cruise will magnify their negative emotions about crowding on the cruise ship [44]. Therefore, to ameliorate cruisers’ negative emotions, cruise operators will try to guide cruisers’ view to the ocean as much as possible even in wide and open spaces. For example, they use few decorations and designs on the deck to make cruisers feel that the ship is more spacious. Leisure space on cruise ships can distinguish cruise tourism from other forms of tourism and represents one of the unique features of the cruise experience [45]; therefore, leisure space is included as one of the attributes in this study.

2.1.2. On-Board Activities

Cruisers spend most of their time on board; therefore, cruise ships usually provide a variety of activities and facilities such as social events (e.g., wine tasting, Bingo), educational courses (e.g., cooking, photography), expert lectures on marine life, ports of call, and local culture [9]. Thus, on-board activities are included as one of the attributes in this study.

2.1.3. Cabin Comfort

Gibson and Parkman (2018) [46] noted that passengers focus on the overall comfort of the cabin when taking a cruise, and that cabins with balconies can allow them to comfortably enjoy the ocean view and the unique experience of a cruise [47] but are more expensive compared with standard cabins without ocean views [12]. Therefore, the attribute of cabin comfort is included as one of the reference factors for cruisers to choose a cruise ship.

2.1.4. Michelin Restaurants

Yi et al. (2011) [14] found that Asian cruisers will attach importance to the food and service on board. Many restaurants today are constantly looking for new and improved quality of food and service and are pursuing inclusion in the Michelin Red Guide (or the “Red Guide”), which is highly regarded in the global catering industry, to attract consumers’ WTP more money for internationally rated cuisine and increase restaurant revenue [48,49]. It is still unknown whether Michelin star chefs’ services or meals being offered on board can affect consumers’ willingness to choose. Therefore, this study explores cruisers’ choices when the dining experience of a cruise ship is provided by a Michelin restaurant.

2.1.5. Refund Mechanism

When choosing a product, consumers will take the pricing strategy of the product or service as one of the decision-making factors. The addition of different price ranges or refund mechanisms at the time of payment will result in differential pricing and increase additional charges to maximize revenue or change consumers’ consumption habits [50,51]. In the refund mechanism, consumers can choose whether to pay a fixed percentage of additional fees to receive a full refund in case of subsequent product return or flight cancellation. Therefore, when consumers think that the travel itinerary is very uncertain, e.g., when a trip is canceled due to a typhoon or a flight is canceled due to bad weather, they can use the refund service mechanism to obtain a refund. At present, this refund mechanism has been applied in the aviation and hotel industries [52,53] but not in the cruise industry. Especially with the outbreak of COVID-19 in 2020, the challenge for both shipping companies and travel agencies is not only to prevent and respond to the occurrence of similar infectious diseases, but also to provide different flexible measure options, such as refund mechanisms for canceled flights or reopening reservations. Therefore, the inclusion of a refund mechanism when booking a cruise tour can allow cruisers to make changes according to their own considerations and cruise operators or travel agencies to easily estimate demand or increase their profits. Thus, this study also examines the respondents’ preference for the refund mechanism when booking a cruise.

2.2. Model Selection and Analysis

In this study, we first apply the CE method to construct the multi-attribute utility model of cruise tourism, use the conditional logit (CL) and random parameter logit (RPL) models to estimate the utility functions of cruise tourism, and discuss the differences in WTP for various attributes from the perspectives of the respondents’ socioeconomic background, knowledge of cruise tours, and behaviors. The details are described as follows.

2.2.1. CL

The CL model, which sets all respondents at the same base point, can only be used to assess respondents’ average preferences [54]. Therefore, to obtain more information and understand the heterogeneity of individual preferences, socioeconomic and attitudinal scales can be used as interactions with alternative-specific constants (ASC) or individual attributes and can then be incorporated into the utility functions [55]. Therefore, the formula is expressed as Equation (1):
V i j = A S C j + k   B k X i j k + m   θ j m A S C j × S m i + n   δ k n X i j k × S n i
where Vij is the measurable utility for the j-th product to the i-th respondent, which is an observable item; θjm is the vector of coefficients of the interactions between the ASC and the m-th socioeconomic characteristic of individual i; and δkn is the vector of coefficients of the interactions between attribute k and the n-th socioeconomic characteristic of individual i (Sni).

2.2.2. RPL

Respondents with the same socioeconomic characteristics may have different preferences for cruise attributes; therefore, a separate RPL needs to be estimated. RPL assumes that each attribute is independent and evenly distributed and relaxes the differences in error terms [56,57]. The formula for RPL can be expressed as Equation (2):
U i j = V i j + ε i j = V ( H j ) + ε i j
where Uij is the utility for the attribute combination Hj of the j-th product to the i-th respondent; Vij is the measurable utility for the j-th product to the i-th respondent, which is an observable term εij is the random error, which is an unobservable term; and Hj is the vector of product attributes in the choice set.
Assuming that the respondents’ measurable utility Vij is a linear additive model, Equation (2) can be modified and expressed as Equation (3):
U i j = V i j + ε i j = k = 1 K   α k X j k + β P j + ε i j
where k = 1, 2, …, K; Xjk is the attribute k of the j-th product in the choice set Hj; Pj is the price attribute of the j-th product; and α k and β are the coefficients of the attribute variables Xjk and Pj, respectively.
To compare the differences in product preferences among different groups of consumers, the product attributes in the indirect utility function should be cross-tabulated with the respondents’ socioeconomic characteristics. This is because each respondent’s socioeconomic characteristics are fixed and will not change for choosing a product. Therefore, they cannot be added to the indirect utility function [58]. Thus, Equation (3) is modified and expressed as Equation (4):
U i j = k = 1 K   α k X j k + β P j + k = 1 K   m = 1 M   γ k m X j k D i m + m = 1 M   γ p m P j D i m + ε i j
where Dim is the i-th respondent’s m-th socioeconomic characteristic and γkm and γpm are the cross-term coefficients of attribute variables with socioeconomic characteristics and price attributes.

2.2.3. Marginal Willingness to Pay (MWTP) for Attributes

The coefficients in the logit models represent how changes in the explanatory variables affect the dependent variables. The WTP will be calculated using the ratio of the parameters if the price attribute is included in the attributes. Birol and Koundouri (2008) [59] suggested using the ratio of the coefficient value of a non-price attribute and the coefficient value of a price attribute (WTP) to calculate the MWTP for each attribute. The calculation process mainly involves estimating the distribution of utility coefficients and then deriving the preference distribution of MWTP. Thus, Equation (5) can be deduced:
U n j t = α n ( c n j t + ( β n / α n ) X n j t ) + ε n j t = α n   c n j t + w n X n j t + ε n j t
This is equivalent to using the monetary metric utility function to estimate the parameters in the MWTP [60]. In this study (the permutation of the utility function), the parameter coefficients w = β/α can be interpreted directly as the price vector implied by the non-monetary attribute X, which is helpful for understanding the results of WTP.

2.2.4. Sample Size and Composition

To understand the respondents’ consumption preferences for the attributes of cruise tours, this study used the purposive sampling method to distribute 575 questionnaires to travelers who had traveled on cruises. After deducting the invalid questionnaires, 439 valid questionnaires were obtained, with an effective recovery rate of 76.3%. The respondents’ were all Taiwanese; their socioeconomic backgrounds are shown in Table 2. The majority of them were female (52.6%). Their age was mainly 41–50 years (32.3%), followed by 51–60 years (26.2%), and 31–40 years (18.0%), indicating that middle-aged consumers have more experience in cruise tours than other groups. In terms of education level, the highest percentage (41.5%) is college or university education. The average personal monthly income was mainly in the range of NTD60,001–80,000 (USD2160–2880) (32.1%), followed by NTD80,001–100,000 (USD2880–3600) (24.6%). More than half of the cruisers took a cruise once (60.1%), followed by two to three times (29.2%), and the motivation for taking the cruise was mostly for family travel (70.8%).

3. Results

3.1. Importance Cruisers Attach to the Attributes and Travel Safety of Cruise Tours

The results of this study demonstrate that the respondents attached the highest importance to “on-board services” (4.64), followed by “on-board facilities” (4.27), “tour price” “(4.23), and “number of tour days” (4.20). Presumably, this is because most of the cruise lines surveyed were from Taiwan to Japan and Korea, and the number of days on these lines is 6–7 or 3–4; thus, the number of days is not a priority factor for cruisers—they care more about the service quality of the cruise ships they have chosen, which is the factor influencing their choice of cruise tours. This is in line with the study by Andriotis and Agiomirgianakis (2010) [10], who used factor analysis to classify cruiser satisfaction with the Mediterranean ports of call into five influencing factors, among which on-board service was the most valued by cruisers.
In terms of travel safety, “I will manage my own health well on future cruises” (4.73) is the highest, followed by “I will be cautious about cruise travel in the future” (4.63), “I will pay special attention to the availability of medical staff or resources on future cruises” (4.52), “I will consider a room with a balcony on future cruises” (4.20), and “I will give priority to the total number of people accommodated when choosing a cruise in the future” (3.97), with the lowest mean score given to “I will be less likely to take a cruise after the COVID-19 pandemic” (2.41). The study results demonstrate that although the impact of the COVID-19 pandemic makes respondents cautious about choosing cruise tours in the future, it does not affect their willingness to take a cruise, presumably because cruise tours provide a unique and attractive experience for potential travelers. Therefore, even if there are doubts about travel safety at present, it does not affect experienced and potential travelers’ willingness to take a cruise.

3.2. Cruisers’ Preferred Travel Portfolio

This study analyzes the six most preferred combinations of attributes, including the existing ones for cruise travel, and the results evince that the most preferred attribute combination was the one with “spacious leisure space, many activities available, no sea view (interior cabin), Michelin restaurant available, and 5% commission for refund mechanism, at a total price of NTD29,295 (USD1055) (voyage price NTD27,900 (USD1005) + 5% of the total price on refund, NTD1395 (USD50))” (23.7%). The second most preferred combination was “spacious leisure space, maintain the status quo of on-board activities, sea view (window), no Michelin restaurant, and at a total price of NTD29,900 (USD1076) with refund mechanism” (19.5%). The least preferred combination was the one with “maintain the status quo of leisure activities and on-board activities, no sea view (interior cabin), Michelin restaurant, and 5% commission for refund mechanism, at a total price of NTD29,295 (USD1055)” and the one with “comfortable pool space, diverse activities, no sea view (interior cabin), no Michelin restaurant, and 5% commission for refund mechanism, at a total price of NTD27,900 (USD1005)”, accounting for 15.1% and 15.5%, respectively.
This is presumably because cruisers are not willing to purchase a cruise with only Michelin restaurants and the refund mechanism while other facilities remain unchanged. The cabins alone may be part of the cruisers’ consideration. It was found that, if they were to stay in an interior cabin without the sea view, cruisers expect that changes be made at least in the leisure space and on-board activities before they are willing to make a purchase. They are willing to pay extra to experience cabins with a view to enhance the cabin comfort, so that they can enjoy the sea view comfortably without the disturbances of crowds or noise [12,40]. The findings are consistent with the results of this study.

3.3. Results of CL and RPL

Based on the Equation (1) of the random utility function, this study establishes the multi-attribute utility model to understand consumers’ consumption preferences for cruise tours, as shown in Equation (6):
V i j = A S C j + k   β k X i j k + m   θ j m A S C j × S m i + n   δ k n X i j k × S n i
where i = 1,2,3…, 439 (the sample size is 439) and j = 1, 2, 3..., 6, meaning there are six combinations of cruise tour attributes to choose from.
Equation (6) was analyzed by CL and RPL through NLOGIT4.0 to estimate the coefficient values of cruise tour attributes. The empirical analysis results are summarized in Table 3. The CL assesses the mean preference of respondents on cruise tour attributes, and the RPL assesses the differential preference of respondents on cruise tour attributes. The maintenance of status quo (ASC) was negative and significant at the 5% significance level, indicating that cruisers prefer to change the status quo. The RPL result presented a negative and significant preference for more on-board activities, indicating that respondents think there is no need for frequent activities on-board, whereas it presented a positive preference for cabin comfort (window with a sea view and balcony with a sea view), Michelin restaurants, and a refund mechanism, indicating that the respondents prefer these three levels. As for the result of CL, respondents showed a negative preference for comfortable pool space and more on-board activities, indicating that they do not want to change these two amenities on board; on the contrary, they prefer a balcony with a sea view and a Michelin restaurant on board.
Second, we substituted the coefficient values estimated by the utility function (1) into the theoretical model (6), MWTP = βx/α, to calculate the respondents’ MWTP for each attribute, and in the CL model, they were NTD475 (USD17.10) for comfortable pool space (LSA1), NTD244 (USD8.78) for spacious leisure space (LSA2), NTD496 (USD17.86) for many activities (OA1), NTD233 (USD8.39) for diverse activities (OA2), NTD629 (USD22.64) for sea view (window) (CC1), NTD917 (USD33.01) for sea view (balcony) (CC2), NTD824 (USD29.66) for Michelin restaurant on-board (RM), and NTD146 (USD5.26) for refund mechanism (RF). The MWTP for each attribute in the RPL model was as follows: NTD577 (USD20.77) for comfortable pool space (LSA1), NTD186 (USD6.70) for spacious leisure space (LSA2), NTD622 (USD22.39) for many activities (OA1), NTD281 (USD10.12) for diverse activities (OA2), NTD967 (USD34.81) for sea view (window) (CC1), NTD1216 (USD43.78) for sea view (balcony)(CC2), NTD856 (USD30.82) for Michelin restaurant on-board (RM), and NTD264 (USD9.50) for refund mechanism (RF).
From the results of the above analysis, it was found that the highest rate was for sea view (balcony) (CC2), indicating that cruisers are willing to upgrade their cabin to a sea-view room with a balcony to improve the comfort of the cabin. The results of this study are consistent with the study by Gibson and Parkman (2018) [46], which noted that today’s travelers are more focused on overall cabin comfort, and thus, cabins with a view are more popular with them, and with the study by Mahadevan and Chang (2017) [40], which demonstrated that first-time cruisers are willing to pay an additional AUD 83 to experience a cabin with a view. The FCCA (2013) report also suggests that, if considering only the differences in cabin and USD1700 for a standard interior cabin, cruisers are willing to pay an additional USD400 for a sea-view cabin with window and USD1100 for a deluxe cabin with balcony. According to previous studies, cruisers are willing to pay more to upgrade their cabins, which is consistent with the results of this study.
Third, respondents are willing to pay extra to enter a Michelin restaurant, with an additional NTD824 (USD29.66) in CL and NTD856 (USD30.82) in RPL. The results of this study are consistent with the study by Yi et al. (2011) [14], which found that Asian cruisers attach importance to the food and beverage services on board and that restaurants pursue inclusion in the Michelin Red Guide to attract consumers to pay more for internationally rated cuisine and increase restaurant revenue [48,49]. In addition, in terms of the refund mechanism, it was found that respondents are willing to pay an additional NTD146 (USD5.26) or NTD264 (USD9.50) to receive a full refund in case of subsequent product return or flight cancellation, which is similar to the results of previous studies [52,53]. According to Jiang et al. (2020) [51], sellers use the refund mechanism that adds an additional percentage to the total price, so that when consumers need to cancel subsequent transactions or ask for a full refund of goods or services, the part of the original premium will be taken as the refund fee. Masiero et al. (2020) [61] pointed out that hotels offer travelers the freedom to cancel at the booking stage not only to receive a refund in case of a change in travel plans but also to cancel and re-book at a lower price if the hotel price decreases before the stay. Therefore, a refund mechanism is a guarantee for travelers and their preference for the option with a refund mechanism is consistent with the results of this study.
However, comfortable pool space (LSA1) and many activities (OA1) were negative and significant, indicating that to enlarge pool space, a NTD475 (USD17.10) reduction from the original price of NTD27,900 (USD1005) is needed so that cruisers will be willing to do so, and that to enrich activities on board, a NTD496 (USD17.86) reduction from the original price of NTD27,900 (USD1005) is needed. The study by Chen et al. (2016) [62] demonstrated that among the preferences for cruise tours, cruisers are willing to pay an additional NTD50.24 (USD1.81) for adding “entertainment” facilities. However, for the entertainment facilities and services, this study found that cruisers are willing to add more entertainment facilities only if the price is reduced. According to Zhang et al. (2015) [63], on-board leisure activities and entertainment can affect cruisers’ satisfaction, but the enjoyment benefits of these entertainment activities depend on cruisers’ satisfaction and perceived value. The study by Duman and Mattila (2005) [64] suggested that if cruisers are dissatisfied with leisure activities in their past experiences, they will not want to spend more money to experience these activities on board in the future. Therefore, this study deduces that Taiwanese passengers may be less likely to use the pool facilities while on a cruise ship, and they will be reluctant to spend extra on performance activities if the same content is repeatedly arranged.

3.4. The Effect of Respondents’ Socioeconomic Background on the Differences of MWTP for Cruise Tours

According to the results of the RPL analysis, there are random parameters for the attributes of spacious leisure space (LSA2) and the presence of a Michelin restaurant (RM) on board. Therefore, this study compares the MWTP based on these two attributes and the respondents’ socioeconomic background, and the results are shown in Table 4. It was found that respondents at the age of 41–50 years old and 51–60 years old have a lower MWTP for “maintaining the status quo” than those of other age groups; respondents over 41 years old have a higher MWTP for spacious leisure space (LSA2) than those under 40 years old; respondents over 51 years old have a higher MWTP for having a Michelin restaurant (RM) on board than those under 50 years old. The study by Mahadevan and Chang (2017) [40] showed that cruisers aged 41–50 and over 55 are willing to pay AUD 20.48 and AUD 5.13, respectively, for a more spacious leisure space on board. The study by Harrington et al. (2013b) [65] showed that cruisers aged over 55 years place a higher value on restaurant quality compared to other age groups. The study by Harrington et al. (2013a) [66] showed that consumers aged 41–50 years value the ratings in the Michelin Red Guide more than younger consumers aged 18–40 years, and consequently dine at Michelin restaurants. Therefore, it can be assumed that older cruisers are more willing to pay extra to enjoy restaurants of better quality and with Michelin ratings, which is consistent with the results of this study.
In terms of education level, respondents with a higher education level are more willing to pay extra for the presence of a Michelin restaurant (RM) on board; in terms of average personal monthly income, respondents with a monthly income over NTD60,000 (USD2160) are less likely to prefer “maintaining the status quo” than those with a monthly income under NTD60,000 (USD2160); those with a monthly income over NTD40,000 (USD1440) prefer both spacious leisure space (LSA2) and a Michelin restaurant (RM) on board, indicating that they are more willing to pay more for these two items.

4. Discussion

From the results of the above analysis, it can be found that the most preferred attributes of cruise tours by the respondents were spacious leisure space, more activities, interior cabin without sea view, Michelin restaurant, and refund mechanism, at a price of NTD29,295 (USD1055), followed by the combination of spacious leisure space, maintain the status quo of on-board activities, cabin with window and sea view, no Michelin restaurant, and refund mechanism available, at a price of NTD29,900 (USD1076). The least preferred combination for a cruise tour was the one with only Michelin restaurant and refund mechanism at NTD29,295 (USD1055) and the one with comfortable pool space and diverse on-board activities at NTD27,900 (USD1005), while other aspects remained the same. This is possibly because cruisers pay more attention to cabin comfort, and even if on-board facilities and services are updated, they still prefer a combination with a sea-view cabin to be willing to take the cruise tour. This is in line with the studies by William Jr. [67] and Gibson and Parkman (2018) [46], who found that unlike past cruisers who were more concerned about the full functionality or luxury of the cabin, cruisers today are more concerned about the overall cabin comfort; Lee and Yoo (2015) [68] found that cruisers are willing to spend extra to upgrade their cabins from an interior cabin without a sea view to one with a sea view.
According to the results of the empirical analysis, cruisers have significant preferences for cabin comfort, Michelin restaurants, and refund mechanisms. In the RPL model, it suggests that the sea-view cabin with a window, of the cabin comfort attribute, and the refund mechanism result in significant changes, and this finding is in line with those of Guo and Jiang (2021) [69], who found that when cruise tour companies offer larger and more comfortable cabins or smart cabins for providing better service quality for cruisers, cruisers are more likely to choose these cruise tours, suggesting that cruisers are willing to pay extra for cabin upgrades. This finding is also similar to the result that a refund mechanism is a guarantee for consumers (Masiero et al., 2020) [61], and thus consumers are willing to pay extra for such a service. In terms of leisure space and on-board activities, comfortable pool space and many activities are not preferred, which is similar to Duman and Mattila’s (2005) [64] findings that if cruisers have had a poor experience with on-board activities on previous cruise tours, it may discourage them from spending more time or money on on-board leisure activities in the future. In economics, with the exception of luxury or rare goods, the relative demand for general market goods and non-market goods decreases as prices increase. Although the CL model of this study does not indicate significance in this regard, the RPL model does indicate a negative significance, meaning that cruisers want to spend as little as possible on limited facilities and services. In addition, the ASC variables indicate that there is a significant negative preference for maintaining the status quo of cruise tours.
When comparing respondents’ socioeconomic background with their WTP for cruise attributes, respondents aged 41 and above have a preference for “spacious leisure space” and those aged 51 and above have a preference for “Michelin restaurant on board.” This is in line with Mahadevan and Chang’s (2017) [40] findings that cruisers aged 41–50 years and over 55 years are willing to pay extra for leisure space on board. The results of the study by Harrington et al. (2013a) [66] showed that consumers aged 41–50 years pay more attention to Michelin Red Guide ratings in their choice of Michelin restaurants, and thus, older cruisers are also more willing to pay extra for Michelin-rated restaurants.
According to the results of the empirical analysis, cruisers prefer cabins with a sea view over those without a sea view, and when there is a Michelin restaurant on board, they are more likely to be attracted to those cruise tours and are willing to pay more. Therefore, it is suggested that cruise operators can consider making price adjustments to the cabins on cruise ships based on the WTP in this study, or they can refer to the early bird discount offered by hotel bookings and enable cruisers who book early to enjoy different discounts on their cabins. In terms of Michelin restaurants, they can cooperate with Michelin-certified restaurants and discuss how to create the same quality and experience of Michelin restaurants on cruise ships. At present, Taiwanese cruise ships have only brought in Michelin chefs. Because Michelin will also give different certifications on restaurant comfort and quality markings in addition to food tasting, if cruise operators want to meet cruisers’ needs, they can focus on the dining environment and service quality of restaurants on cruise ships in the future.
In addition, the results of comfortable pool space and provision of many on-board activities are negative and significant, indicating that an increase in pool space will cause negative perceptions among cruisers, or if the pool is the main feature for a cruise ship, it may reduce the willingness of cruisers to travel. Therefore, it is suggested that cruise operators maintain the status quo of pool space so that they can invest resources to attributes preferred by cruisers. With regard to on-board activities, cruisers prefer diverse performance activities or social events of different natures, and they do not prefer the repeated arrangement of the same activity. Therefore, it is fair to say that cruisers want to experience as much as possible the facilities and experiences on the cruise ship when they are on a cruise tour, and their willingness to take the cruise will be reduced if they are only provided with repeated activities. Therefore, it is suggested that cruise operators have different arrangements for activities according to the number of days of the trip. For example, if there are four kinds of theater performances on board, then they can provide two different contents of the performance on one day and the other two different contents on the next day as a cycle. A similar approach can be adopted for educational courses on board so that cruisers can have a more diversified experience.
The results of the empirical analysis indicate that cruisers who are over 31 years old, have a college education or above, and have a monthly income of more than NTD40,000 (USD1440) have a higher MWTP for Michelin restaurants on cruise ships. This study suggests that different ways of marketing can be utilized according to the motivation of travel. According to the statistical results of this study, most cruisers are family travelers, and the amount of money available for family trips is more bounteous; thus, cruise operators can launch a family Michelin feast, wherein two to four people can go to the Michelin restaurants on cruise ships during a certain mealtime for an additional price, so as to increase the sales of Michelin restaurants on board and increase cruisers’ motivation by comparison with other pricing options. However, there are no Michelin restaurants set up on cruise ships yet. Therefore, it is suggested that cruise ship operators first use a similar approach for paid restaurants on board to measure cruisers’ acceptance of this scheme and use the experience as a basis for restaurant marketing when Michelin restaurants are stationed on board in the future.

5. Conclusions

5.1. Conclusions

This study conducted analysis based on the importance of the attributes of cruise tours attached by the respondents and found that the respondents attached more importance to on-board services; thus, the quality of services can be enhanced by focusing on the facilities and services on board to improve cruisers’ satisfaction. In terms of health and safety, it is suggested that the sanitation can be improved or medical and health-related resources on board can be provided to cruisers, so that cruisers can understand that they can seek help when health conditions occur, and hence, they feel that even in limited spaces, they can manage their health through the health and safety policies provided by cruise ships, thereby reducing the risks related to cruise tourism.

5.2. Research Limitations and Future Research Directions

There were limitations in the research process of this study. If the scope of the study can be expanded, we should be able to make a more complete research structure in the future. This paper proposes the following recommendations based on the research findings and limitations:
  • This study only focused on five attributes of cruise tours (leisure space, on-board activities, cabin comfort, Michelin restaurant, and refund mechanism). There are also other attributes related to cruise tours to be explored: for example, the attractiveness of cruise routes or cruisers’ willingness to revisit, which can help to better understand consumers’ preferences for different cruise attributes or how to capture loyal customers’ preferences, thereby increasing the return rate of customers.
  • The development of science and technology has begun to gradually influence the cruise industry. Foreign companies have promoted smart cabins, which can adjust the internal environment through the sensors in the cabin to create a more comfortable cabin space for cruisers. Princess Cruises in Taiwan has also promoted the “Ocean Medallion,” which is a wearable device that can strengthen the interaction between cruisers and service personnel and provide customized services. In the future, we can also explore if cruise ships can add technology-based services and ways to increase cruisers’ willingness to travel and their overall satisfaction by using the technology acceptance model.
  • This study surveyed passengers who have taken cruise tours and not passengers of different groups. The results of this study show that family trips account for the highest proportion for motivation for taking a cruise. Future research can explore the preference and popularity among family groups for cruise tours.

Author Contributions

Three co-authors together contributed to the completion of this article. Formal analysis, investigation, data curation, and writing—original draft preparation, M.-Y.C.; investigation, data curation, review and editing, C.-H.W.; writing—original draft preparation, writing—review and editing, H.-S.C. All authors have read and agreed to the published version of the manuscript.

Funding

This research received no external funding.

Institutional Review Board Statement

Not applicable.

Informed Consent Statement

Not applicable.

Data Availability Statement

Not applicable.

Acknowledgments

I would like to express my sincere appreciation to all the experts who have taken the time to review this article and provide lots of valuable comments.

Conflicts of Interest

The author declares no conflict of interest.

References

  1. Chen, C.A. How can Taiwan create a niche in Asia’s cruise tourism industry. Tour. Manag. 2016, 55, 173–183. [Google Scholar] [CrossRef]
  2. Cruise Lines International Association. 2020 State of the Cruise Industry Outlook. Available online: https://cruising.org/en/news-and-research/press-room/2019/december/clia-releases-2020-state-of-the-cruise-industry-outlook-report (accessed on 23 January 2021).
  3. The Official Website of Cruise in Taiwan of Taiwan International Ports Corporation. 2020. Available online: https://cruise.twport.com.tw/ (accessed on 21 March 2020).
  4. Lueck, M.; Seeler, S.; Radic, A. Hitting the reset button for post-COVID-19 cruise tourism: The case of Akaroa, Aotearoa New Zealand. Acad. Lett. 2021, 2, I9. [Google Scholar] [CrossRef]
  5. Cruise Industry News. Here’s How Much Cash the Cruise Lines Are Burning Through. Available online: https://www.cruiseindustrynews.com/cruise-news/24746-here-are-the-cruise-lines-operating-right-now-2.html (accessed on 22 January 2021).
  6. Statista Research Department. Expected Passenger Cruise Capacity in Operation Worldwide from May 2020 to January 2021, by Month. Available online: https://www.statista.com/statistics/1119828/cruise-capacity-in-operation-forecast-monthly/ (accessed on 10 February 2021).
  7. Xu, W.; Youn, H.-J.; Lee, C.-K. Role of Non-Pharmaceutical Interventions for COVID-19 in Cruise Tourists’ Decision-Making Process: An Extended Model of Goal-Directed Behavior. Sustainability 2021, 13, 5552. [Google Scholar] [CrossRef]
  8. Hung, K.; Petrick, J.F. Why do you cruise? Exploring the motivations for taking cruise holidays, and the construction of a cruising motivation scale. Tour. Manag. 2011, 32, 386–393. [Google Scholar] [CrossRef]
  9. Xie, H.; Kerstetter, D.L.; Mattila, A.S. The attributes of a cruise ship that influence the decision making of cruisers and potential cruisers. Int. J. Hosp. Manag. 2012, 31, 152–159. [Google Scholar] [CrossRef]
  10. Andriotis, K.; Agiomirgianakis, G. Cruise visitors’ experience in a Mediterranean port of call. Int. J. Tour. Res. 2010, 12, 390–404. [Google Scholar] [CrossRef]
  11. Wang, Y.; Jung, K.-A.; Yeo, G.-T.; Chou, C.-C. Selecting a cruise port of call location using the fuzzy-AHP method: A case study in East Asia. Tour. Manag. 2014, 42, 262–270. [Google Scholar] [CrossRef]
  12. Kwortnik, R.J. Shipscape influence on the leisure cruise experience. Int. J. Cult. Tour. Hosp. Res. 2008, 2, 289–311. [Google Scholar] [CrossRef] [Green Version]
  13. Qu, H.; Ping, E.W.Y. A service performance model of Hong Kong cruise travelers’ motivation factors and satisfaction. Tour. Manag. 1999, 20, 237–244. [Google Scholar] [CrossRef]
  14. Yi, S.; Jonathon, G.; Liping, A. Exploring Asian Cruise Travelers’ Travel Experience and Perceptions; Bepress: Berkeley, CA, USA, 2011. [Google Scholar]
  15. Price, L.L.; Marshall, A. Elements of Economics of Industry. Econ. J. 1892, 2, 316. [Google Scholar] [CrossRef] [Green Version]
  16. Govindasamy, R.; Italia, J. Predicting willingness-to-pay a premium for organically grown fresh produce. J. Food Distrib. Res. 1999, 30, 44–53. [Google Scholar]
  17. Wertenbroch, K.; Skiera, B. Measuring Consumers’ Willingness to Pay at the Point of Purchase. J. Mark. Res. 2002, 39, 228–241. [Google Scholar] [CrossRef]
  18. DE Pelsmacker, P.; Driesen, L.; Rayp, G. Do Consumers Care about Ethics? Willingness to Pay for Fair-Trade Coffee. J. Consum. Aff. 2005, 39, 363–385. [Google Scholar] [CrossRef]
  19. Casado-Díaz, A.B.; Sellers-Rubio, R.; Rodriguez-Sanchez, C.; Sancho-Esper, F. Predictors of willingness to pay a price premium for hotels’ water-saving initiatives. J. Travel Tour. Mark. 2020, 37, 773–784. [Google Scholar] [CrossRef]
  20. Ho, C.Q.; Hensher, D.A.; Mulley, C.; Wong, Y.Z. Potential uptake and willingness-to-pay for Mobility as a Service (MaaS): A stated choice study. Transp. Res. Part A Policy Pr. 2018, 117, 302–318. [Google Scholar] [CrossRef]
  21. Choi, A.; Ritchie, B.W.; Papandrea, F.; Bennett, J. Economic valuation of cultural heritage sites: A choice modeling approach. Tour. Manag. 2010, 31, 213–220. [Google Scholar] [CrossRef]
  22. Hoyos, D. The state of the art of environmental valuation with discrete choice experiments. Ecol. Econ. 2010, 69, 1595–1603. [Google Scholar] [CrossRef]
  23. Rudd, M.A. National values for regional aquatic species at risk in Canada. Endanger. Species Res. 2009, 6, 239–249. [Google Scholar] [CrossRef]
  24. Winter, K.; Cats, O.; Martens, K.; van Arem, B. A Stated-Choice Experiment on Mode Choice in an Era of Free-Floating Carsharing and Shared Autonomous Vehicles (No. 17-01321). In Proceedings of the Transportation Research Board 96th Annual Meeting, Washington, DC, USA, 8–12 January 2017. [Google Scholar]
  25. Stoiber, T.; Schubert, I.; Hoerler, R.; Burger, P. Will consumers prefer shared and pooled-use autonomous vehicles? A stated choice experiment with Swiss households. Transp. Res. Part D Transp. Environ. 2019, 71, 265–282. [Google Scholar] [CrossRef]
  26. Yan, Q.; Feng, T.; Timmermans, H. Private Parking Space Owners’ Decision in Response to Shared Parking Schemes under Uncertainty: Results of a Stated Choice Experiment; Eindhoven University of Technology: Washington, DC, USA, 2021. [Google Scholar]
  27. Liu, Q.; Yan, Z.; Zhou, J. Consumer Choices and Motives for Eco-Labeled Products in China: An Empirical Analysis Based on the Choice Experiment. Sustainability 2017, 9, 331. [Google Scholar] [CrossRef] [Green Version]
  28. Boccia, F.; Manzo, R.M.; Covino, D. Consumer behavior and corporate social responsibility: An evaluation by a choice experiment. Corp. Soc. Responsib. Environ. Manag. 2019, 26, 97–105. [Google Scholar] [CrossRef] [Green Version]
  29. Kim, H.-J.; Kim, J.-H.; Yoo, S.-H. Social acceptance of offshore wind energy development in South Korea: Results from a choice experiment survey. Renew. Sustain. Energy Rev. 2019, 113, 109253. [Google Scholar] [CrossRef]
  30. Azarova, V.; Cohen, J.; Friedl, C.; Reichl, J. Designing local renewable energy communities to increase social acceptance: Evidence from a choice experiment in Austria, Germany, Italy, and Switzerland. Energy Policy 2019, 132, 1176–1183. [Google Scholar] [CrossRef] [Green Version]
  31. Neumann, R.; Mehlkop, G. Framing electricity plan choices to enhance green energy usage: A choice experiment with panel data from Germany. Energy Res. Soc. Sci. 2020, 70, 101741. [Google Scholar] [CrossRef]
  32. Rewitzer, S.; Huber, R.; Grêt-Regamey, A.; Barkmann, J. Economic valuation of cultural ecosystem service changes to a landscape in the Swiss Alps. Ecosyst. Serv. 2017, 26, 197–208. [Google Scholar] [CrossRef]
  33. Chaikaew, P.; Hodges, A.W.; Grunwald, S. Estimating the value of ecosystem services in a mixed-use watershed: A choice experiment approach. Ecosyst. Serv. 2017, 23, 228–237. [Google Scholar] [CrossRef] [Green Version]
  34. Owuor, M.A.; Mulwa, R.; Otieno, P.; Icely, J.; Newton, A. Valuing mangrove biodiversity and ecosystem services: A deliberative choice experiment in Mida Creek, Kenya. Ecosyst. Serv. 2019, 40, 101040. [Google Scholar] [CrossRef]
  35. Nordén, A.; Coria, J.; Jönsson, A.M.; Lagergren, F.; Lehsten, V. Divergence in stakeholders’ preferences: Evidence from a choice experiment on forest landscapes preferences in Sweden. Ecol. Econ. 2017, 132, 179–195. [Google Scholar] [CrossRef] [Green Version]
  36. Tyrväinen, L.; Mäntymaa, E.; Juutinen, A.; Kurttila, M.; Ovaskainen, V. Private landowners’ preferences for trading forest landscape and recreational values: A choice experiment application in Kuusamo, Finland. Land Use Policy 2021, 107, 104478. [Google Scholar] [CrossRef]
  37. Castellani, M.; Pattitoni, P.; Vici, L. Pricing Visitor Preferences for Temporary Art Exhibitions. Tour. Econ. 2015, 21, 83–103. [Google Scholar] [CrossRef]
  38. Oppewal, H.; Huybers, T.; Crouch, G.I. Tourist destination and experience choice: A choice experimental analysis of decision sequence effects. Tour. Manag. 2015, 48, 467–476. [Google Scholar] [CrossRef]
  39. Vogel, M.; Papathanassis, A.; Wolber, B. The Business and Management of Ocean Cruises; Cabi: London, UK, 2012. [Google Scholar]
  40. Mahadevan, R.; Chang, S. Valuing shipscape influence to maximise cruise experience using a choice experiment. Int. J. Hosp. Manag. 2017, 67, 53–61. [Google Scholar] [CrossRef]
  41. Lee, C.K.; Mjelde, J.W.; Kim, T.K.; Lee, E.; Choi, Y. Willingness-to-pay for whale tour attributes using a choice experiment. Asia Pac. J. Tour. Res. 2019, 24, 606–617. [Google Scholar] [CrossRef]
  42. Hwang, J.; Lyu, S.O.; Cho, S.-B. In-Flight Casinos, Is It Really a Nonsensical Idea? An Exploratory Approach Using Different Choice Experiments. Sustainability 2019, 11, 3038. [Google Scholar] [CrossRef] [Green Version]
  43. Wakefield, K.L.; Blodgett, J.G. The Importance of Servicescapes in Leisure Service Settings. J. Serv. Mark. 1994, 8, 66–76. [Google Scholar] [CrossRef]
  44. Eroglu, S.A.; Machleit, K.A. An empirical study of retail crowding: Antecedents and consequences. J. Retail. 1990, 66, 201. [Google Scholar]
  45. Xie, H. Examining the Role of Onboard Attributes and Temporal Distance in Individuals’ Pre-Purchase Evaluation of a Cruise (Doctoral Dissertation). 2011. Available online: https://etda.libraries.psu.edu/catalog/12046 (accessed on 13 March 2021).
  46. Gibson, P.; Parkman, R. Cruise Operations Management: Hospitality Perspectives; Routledge: London, UK, 2018. [Google Scholar]
  47. Pullman, M.; Gross, M.A. Ability of Experience Design Elements to Elicit Emotions and Loyalty Behaviors. Decis. Sci. 2004, 35, 551–578. [Google Scholar] [CrossRef]
  48. Surlemont, B.; Johnson, C. The role of guides in artistic industries: The special case of the “star system” in the haute-cuisine sector. Manag. Serv. Qual. 2005, 15, 577–590. [Google Scholar] [CrossRef]
  49. Kiatkawsin, K.; Han, H. What drives customers’ willingness to pay price premiums for luxury gastronomic experiences at michelin-starred restaurants? Int. J. Hosp. Manag. 2019, 82, 209–219. [Google Scholar] [CrossRef]
  50. Becker, N. A Comparative Analysis of the Pricing Systems of Nature Reserves. Tour. Econ. 2009, 15, 193–213. [Google Scholar] [CrossRef]
  51. Jiang, F.; Deng, L.; Zhang, L.; Cai, Y.; Cheung, C.W.; Xia, Z. Review of the Clinical Characteristics of Coronavirus Disease 2019 (COVID-19). J. Gen. Intern. Med. 2020, 35, 1545–1549. [Google Scholar] [CrossRef] [PubMed] [Green Version]
  52. Talluri, K.T.; Van Ryzin, G.J. The Theory and Practice of Revenue Management; Springer Science and Business Media LLC: Berlin/Heidelberg, Germany, 2004; Volume 68. [Google Scholar]
  53. Xie, J.; Gerstner, E. Service Escape: Profiting from Customer Cancellations. Mark. Sci. 2007, 26, 18–30. [Google Scholar] [CrossRef]
  54. Train, K.E. Discrete Choice Methods with Simulation; Cambridge University Press: Cambridge, UK, 2009. [Google Scholar]
  55. Baskaran, R.; Cullen, R.; Colombo, S. Estimating values of environmental impacts of dairy farming in New Zealand. N. Z. J. Agric. Res. 2009, 52, 377–389. [Google Scholar] [CrossRef] [Green Version]
  56. Revelt, D.; Train, K. Mixed Logit with Repeated Choices: Households’ Choices of Appliance Efficiency Level. Rev. Econ. Stat. 1998, 80, 647–657. [Google Scholar] [CrossRef]
  57. Petrin, A.; Train, K. Omitted Product Attributes in Discrete Choice Models; National Bureau of Economic Research: Cambridge, MA, USA, 2003. [Google Scholar]
  58. Burton, M.; Rigby, D.; Young, T.; James, S. Consumer attitudes to genetically modified organisms in food in the UK. Eur. Rev. Agric. Econ. 2001, 28, 479–498. [Google Scholar] [CrossRef] [Green Version]
  59. Birol, E.; Koundouri, P. (Eds.) Choice Experiments Informing Environmental Policy: A European Perspective; Edward Elgar Publishing: Cheltenham, UK, 2008. [Google Scholar]
  60. Train, K.; Weeks, M. Discrete choice models in preference space and willingness-to-pay space. In Applications of Simulation Methods in Environmental and Resource Economics; Springer: Dordrecht, The Netherlands, 2005; Volume 6, pp. 1–16. [Google Scholar]
  61. Masiero, L.; Viglia, G.; Nieto-Garcia, M. Strategic consumer behavior in online hotel booking. Ann. Tour. Res. 2020, 83, 102947. [Google Scholar] [CrossRef]
  62. Chen, J.M.; Zhang, J.; Nijkamp, P. A regional analysis of willingness-to-pay in Asian cruise markets. Tour. Econ. 2016, 22, 809–824. [Google Scholar] [CrossRef] [Green Version]
  63. Zhang, Z.; Ye, Q.; Song, H.; Liu, T. The structure of customer satisfaction with cruise-line services: An empirical investigation based on online word of mouth. Curr. Issues Tour. 2015, 18, 450–464. [Google Scholar] [CrossRef]
  64. Duman, T.; Mattila, A.S. The role of affective factors on perceived cruise vacation value. Tour. Manag. 2005, 26, 311–323. [Google Scholar] [CrossRef]
  65. Harrington, R.J.; Ottenbacher, M.C.; Way, K.A. QSR Choice: Key Restaurant Attributes and the Roles of Gender, Age and Dining Frequency. J. Qual. Assur. Hosp. Tour. 2013, 14, 81–100. [Google Scholar] [CrossRef]
  66. Harrington, R.J.; Fauser, S.G.; Ottenbacher, M.C.; Kruse, A. Key Information Sources Impacting Michelin Restaurant Choice. J. Foodserv. Bus. Res. 2013, 16, 219–234. [Google Scholar] [CrossRef] [Green Version]
  67. William, H., Jr. The Fabulous Interiors of the Great Ocean Liners in Historic Photographs; Dover Publications: New York, NY, USA, 2013. [Google Scholar]
  68. Lee, M.-K.; Yoo, S.-H. Using a Choice Experiment (CE) to Value the Attributes of Cruise Tourism. J. Travel Tour. Mark. 2014, 32, 416–427. [Google Scholar] [CrossRef]
  69. Guo, J.; Jiang, F. A novel electric vehicle thermal management system based on cooling and heating of batteries by refrigerant. Energy Convers. Manag. 2021, 237, 114145. [Google Scholar] [CrossRef]
Figure 1. Example questionnaire choice set.
Water 13 03183 g001
Table 1. Attributes and levels of cruise tours.
AttributesDescription of AttributesLevels
Leisure spaceTo reduce cruisers’ negative emotions caused by crowded space, few decorations and designs are used on the deck of the cruise ship to make them feel more spacious.(1) Maintain the status quo
(2) Comfortable pool space
(3) Spacious leisure space
On-board activitiesThere are usually a variety of activities on board, such as social events (e.g., wine tasting, Bingo.) and performances (e.g., nightclub shows, dance troupes).(1) Maintain the status quo
(2) Provide many activities
(3) Provide diverse activities
Cabin comfortThe cabins are differentiated by the presence or absence of windows, and those with windows are further differentiated in price according to the size of the space.(1) No sea view (interior cabin)
(2) Sea view (window)
(3) Sea view (balcony)
Michelin restaurantIn recent years, some cruise lines have started to add premium restaurants featuring Michelin star chefs to their ships for passengers to choose from.(1) No
(2) Yes
Refund mechanismAt the time of ordering a cruise, cruisers can only be offered a refund based on the cruise line’s assessments of weather conditions and so on. It is impossible for them to decide whether to cancel the voyage based on their own feelings or perceptions.
*** The refund method designed for this study is 5% of the total price and will be charged as the refund fee, i.e., in case of refund, 5% of the total price will be deducted as the processing fee, and the rest will be refunded in full.
(1) No
(2) 2.5%
Note: *** p < 0.001.
Table 2. Demographic variables and travelers’ experience of cruise tours.
VariablesDescriptionSample SizePercentageVariablesDescriptionSample SizePercentage
GenderMale20847.4%Average monthly personal salaryLess than NTD20,000 (USD720) (inclusive)347.8%
Female23152.6%NTD20,001–40,000
(USD720–1440)
296.6%
Age20 years old (inclusive) or less255.7%NTD40,001–60,000
(USD1440–2160)
9421.4%
21–30 years old439.8%NTD60,001–80,000
(USD2160–2880)
14132.1%
31–40 years old7918.0%NTD80,001–100,000
(USD2880–3600)
10824.6%
41–50 years old14232.3%NTD100,001 (USD3600) or more337.5%
51–60 years old11526.2%Number of cruises trips taken1 time26460.1%
61 years old or above368.2%2~3 times12829.2%
OccupationStudent4710.7%4~5 times409.1%
Agriculture, forestry, fishery, and animal husbandry235.2%More than 6 times71.6%
Army, civil service, and education8719.8%Motivation for cruise tourHoneymoon trip419.3%
Service industry13230.1%Family travel31170.8%
Self-employed8920.3%Employee travel439.8%
Retirees81.8%Peer-to-peer travel4410.1%
Other5312.1%
Education levelJunior high school (or below)153.4%
High school15034.2%
College or university18241.5%
Master’s6915.7%
Doctorate235.2%
Note: NTD, new Taiwan dollar (1 NTD = 0.036 USD).
Table 3. Empirical estimation results of CL and RPL.
Attributes and LevelsCLRPL
Coefficientt-valueMWTPCoefficientt-valueStandard deviation of coefficientt-valueMWTP
Leisure space (LSA1)−0.950−5.10 ***NTD475
(USD17.10)
−1.153−6.29 ***1.0325.88NTD577
(USD20.77)
Leisure space (LSA2)0.4872.53 *NTD244
(USD8.78)
−0.3721.71 **0.4082.12 ***NTD186
(USD6.70)
On-board activities (OA1)−0.992−6.64 ***NTD496
(USD17.86)
−1.244−8.26 ***1.1075.61NTD622
(USD22.39)
On-board activities (OA2)0.4662.43 *NTD233
(USD8.39)
0.5611.49 *0.4991.27NTD281
(USD10.12)
Cabin comfort (CC1)1.2582.66 **NTD629
(USD22.64)
1.9340.86 ***1.7221.76NTD967
(USD34.81)
Cabin comfort (CC2)1.8343.74 ***NTD917
(USD33.01)
2.4332.27 ***2.2452.84NTD1,216
(USD43.78)
Michelin restaurant (RM)0.9414.46 ***NTD824
(USD29.66)
1.3111.99 ***1.1290.49 ***NTD856
(USD30.82)
Refund mechanism (RF)0.2912.01 *NTD146
(USD5.26)
0.5270.48 **0.3310.93NTD264
(USD9.50)
Tour price (FUND)−0.002−0.35 −0.002−1.67 *
Number of choice sets878878
Log-likelihood ratio−745.651 −589.744
Note: ***, **, and * are significant at 1%, 5%, and 10%, respectively. LSA1: comfortable pool space; LSA2: spacious leisure space; OA1: many activities; OA2: diverse activities; CC1: sea view (window); CC2: sea view (balcony); RM: Michelin restaurant; RF: refund mechanism; and FUND: tour price.
Table 4. Comparison of respondents’ socioeconomic background and MWTP for cruise tour attributes.
Socioeconomic BackgroundSample SizeASCLSA2RM
Meant-ValueMeant-ValueMeant-Value
GenderMale208−22,453−2.372051.829011.39
Female231−21,862212856
Age20 years (inclusive) or less25−17,623−3.61 **1341.67 *6572.49 **
21–30 years43−19,570156723
31–40 years79−25,237190861
41–50 years142−26,433225880
51–60 years115−27,091241921
61 years or above36−25,746237904
Education levelJunior high school (or below)15−19,8621.281560.866352.14 *
High school150−22,395206749
College or university182−23,412219837
Master’s69−23,561220841
Doctorate23−23,652223863
Average personal monthly salaryLess than NTD20,000(USD720) (inclusive)34−16,522−4.72 ***1272.45 *5982.47 *
NTD20,001–40,000
(USD720–1440)
29−19,658156654
NTD40,001–60,000
(USD1440–2160)
94−21,036184763
NTD60,001–80,000
(USD2160–2880)
141−24,528198839
NTD80,001–100,000
(USD2880–3660)
108−25,563217877
NTD100,001(USD3660)
or more
33−25,980223920
Number of cruise trips taken1 time264−21,8030.751861.027471.88
2~3 times128−24,367197867
4~5 times40−24,766209879
More than 6 times7−25,381199891
***, **, and * are significant at 1%, 5%, and 10%, respectively.
Publisher’s Note: MDPI stays neutral with regard to jurisdictional claims in published maps and institutional affiliations.

