Article

Growth and Nutrient Uptake Characteristics of Heterosigma akashiwo (Raphidophyceae) under Nitrogen and Phosphorus Concentrations in the East China Sea

1
State Key Laboratory of Estuarine and Coastal Research, East China Normal University, Shanghai 200241, China
2
Norwegian Institute for Water Research, 5006 Bergen, Norway
*
Author to whom correspondence should be addressed.
Water 2021, 13(22), 3166; https://doi.org/10.3390/w13223166
Submission received: 29 September 2021 / Revised: 20 October 2021 / Accepted: 30 October 2021 / Published: 10 November 2021
(This article belongs to the Section Biodiversity and Functionality of Aquatic Ecosystems)

Abstract

:
Heterosigma akashiwo is classified as a harmful algal bloom (HAB) species that frequently occurs in eutrophic coastal waters and results in the contamination and mortality of fish and shellfish. The growth of H. akashiwo in four phosphate and nitrate concentration scenarios, representing the observed nutrient concentration ranges in the East China Sea (ECS), was evaluated to further understand the effect of nutrient concentrations on H. akashiwo blooms. The specific growth rate in the exponential growth phase (µ′) and the maximum cell density were lower (17–21% and 41%, respectively) under low phosphorus concentration scenarios, compared to the rates observed under high phosphorus concentration scenarios. The cellular nitrogen-to-phosphorus ratios of H. akashiwo were influenced by the initially supplied N:P ratio and the allocation strategy employed. Phosphorus concentration had a greater influence on the total growth of H. akashiwo than nitrate did, within the natural nutrient conditions of the ECS. These results could serve as a reference for coastal water management and marine ecological management and may be useful for further studies on the simulation and prediction of H. akashiwo blooms, particularly in the ECS.

1. Introduction

Harmful algal blooms (HABs) are recurrent and damaging to the ecosystem and fisheries in coastal waters [1]. Many HAB species produce toxins which can damage other marine organisms and endanger human health [2]. HABs have been receiving increased public attention due to their increasing frequency and intensity as a result of environmental change due to anthropogenic activity, such as eutrophication. A few studies have attempted to understand HAB’ mechanisms in order to monitor and reduce their occurrence [3].
Heterosigma akashiwo, a marine phytoplankton belonging to the family Raphidophyceae, widely distributs in coastal environments [4]. H. akashiwo blooms have caused massive fish deaths, both cultivated and wild populations, due to their toxicity, resulting in significant economic losses. For example, H. akashiwo blooms incur a loss of about USD 4–5 million per year in the waters of British Columbia, with one particularly extreme four-month period in 1997, resulting in a loss of USD 20 million [5]. H. akashiwo blooms have been estimated to result in a loss of USD 2–6 million per episode in Washington state [6].
H. akashiwo blooms may alter the microzooplankton community, including changing the abundance and species composition of the ciliate community [7] and Mesodinium cf. rubrum [8]. Changes in the microzooplankton community could perturb the food web, material and energy flows through ecosystems, and biogeochemical cycling [9].
H. akashiwo blooms have been shown to be moderated by nutrients [10], temperature [11], salinity [12], and light [13]. The eurythermal, euryhaline, and mixotrophic characteristics of H. akashiwo potentially enhance its ability to bloom [4,11]. It can access nutrients by migrating to nutrient-rich depths [14] and can also store phosphate (PO43−) and utilise dissolved organic phosphorus (DOP) under P-depleted conditions [15]. It can also utilise nitrate (NO3), ammonium, and urea as nitrogen sources [4,16]. H. akashiwo may have a competitive advantage over many other phytoplankton species, particularly in low-nutrient and oligotrophic seawater. It has been shown to grow in low-nutrient environments (0.2 μmol L−1 for PO43− and 0.3 μmol L−1 for NO3) [11], respond rapidly to nutrient additions [10], and even become the dominant species [17]. However, its growth rate does not increase when phosphorus is supplied to a nitrogen-deficient system [17].
Most studies on the growth characteristics of H. akashiwo blooms have used nutrient-rich conditions. Therefore, the purpose of this study was to study bloom characteristics under nutrient conditions representing those present during the spring to summer transition in the East China Sea [18].

2. Materials and Methods

2.1. Cultures

The Raphidophyceae member H. akashiwo (CCMA-266) used in this study was originally isolated from the Yangtze River Estuary in May 2010 and provided by Xiamen University. The microalgae were cultured in the exponential growth phase in artificial seawater with silicon-free f/2 medium [17,18] for 11 months before the experiment. Cultures were maintained in an incubator (GXZ-280D, Ningbo Jiangnan Instrument Factory, Ningbo, China) at a light intensity of 200 μmol m−2 s−1, a photoperiod of 12 h:12 h light:dark, and a constant temperature of 20 °C.

2.2. Experimental Setup

All glass and plastic bottles used in the experiments were soaked in 10% (V/V) HCl acid solution for 24 h and rinsed six times using pure water and ultra-pure water (18.2 MΩ·cm). The culture medium was artificial seawater with trace metals and vitamins with silicon-free f/2 medium (Tables S1 and S2).
According to observed nutrient concentration ranges in East China Sea (ECS), a matrix of four artificial seawater–macronutrient scenarios was set up with two initial levels of nitrate nitrogen (N) and phosphorus (P) (Table 1). High-concentrate N (HN) was set at 30 μmol L−1, low-concentrate N (LN) was set at 15 μmol L−1, high-concentrate P (HP) was set at 1 μmol L−1, and low-concentrate P (LP) was set at 0.5 μmol L−1. The resultant seawater media were irradiated with UV light for 30 min, and 3 L of media was filtered through a 0.22 μm sterile membrane (Jinteng, China) into pre-sterilised 4 L borosilicate glass bottles. Triplicates of each nutrient group medium were prepared. The pre-culture of H. akashiwo (approximately 20 mL) was added to each experimental bottle at an initial cell density of 1000 cells mL−1. The experiments were performed in the incubator with bubbled room air (100 ± 10 mL min−1). The incubator was maintained at 20 °C and a light intensity of 200 μmol m−2 s−1 with a 12:12 light:dark period.

2.3. Sampling and Measurement

Cell counts were performed every 24 h on subsamples (10 mL) from each experimental bottle using a FlowCAM 8400 (Fluid Imaging Technologies, Scarborough, ME, USA). Twenty millilitre samples were taken every three days using syringes, filtered through 0.22 μm syringe-driven filters (Nylon, 25 mm), and stored at −20 °C prior to nutrient measurement. Nutrients (NO3, PO43−, and NH4+) were measured by a continuous flow analyser (SAN++, Skalar, Breda, the Netherlands). The detection limits of the instrument were 0.14 μmol L−1 for NO3 and NH4+ and 0.05 μmol L−1 for PO43− according to the user manual. For our measurement, the accuracy of NO3, PO43− and NH4+ was 0.03, 0.03, and 0.01, respectively, and the precision of NO3, PO43−, and NH4+ was 0.08, 0.06, and 0.33, respectively. Twenty millilitre samples were filtered through GF/F (WhatmanTM, Buckinghamshire, UK) on the sixth day and stored at −20 °C in the dark before chlorophyll-a (Chl-a) measurement. The membrane samples of Chl-a were placed in a 15 mL centrifuge tube and extracted using 5 mL of 90% acetone at 4 °C for 24 h and then centrifuged at 5000 rpm at 4 °C for 10 min to obtain the supernatant. The concentration of Chl-a was measured using a Trilogy Laboratory Fluorometer (Trilogy 7200-000, Turner Designs, CA, USA; accuracy: 0.01; the detection limit was 0.02 µg L−1).

2.4. Data and Statistical Analysis

Daily specific growth rates (μ) were calculated using the following formula:
μ = lnCell tb lnCell ta tb ta
where Celltb and Cellta are the cell densities at time tb and ta (tb > ta), respectively. The specific growth rate in the exponential growth phase was denoted by μ′.
The cellular nutrient quota (QN/P) on day tn (tn = 3, 6, 9) was calculated as follows:
Q N / P = Nut t 0 Nut tn Cell tn Cell t 0
where Nutt0, Nuttn, Cellt0 and Celltn are the nutrient (N or P) concentrations in the culture seawater solution and cell densities on day t0 (t0 = 0) and tn (tn = 3, 6, 9), respectively.
The ratio of QN to QP is defined as cellular N:P, since QN and QP was calculated respectively according to Formula (2).
Nutrient uptake rates were calculated as follows:
uptake   rates = Nut t 1 Nut t 2 Cell t 2 Cell t 1 × 1 t 2 t 1
where Nutt1, Nutt2, Cellt1 and Cellt2 are the nutrient concentrations and cell densities on day t1 and t2 (t2 > t1), respectively.
All data in this study are reported as the mean ± standard error (number of samples = 3). Data in different nutrient scenarios were assessed by ANOVA and Post Hoc Tests with the LSD method (R version 4.0.3).

3. Results

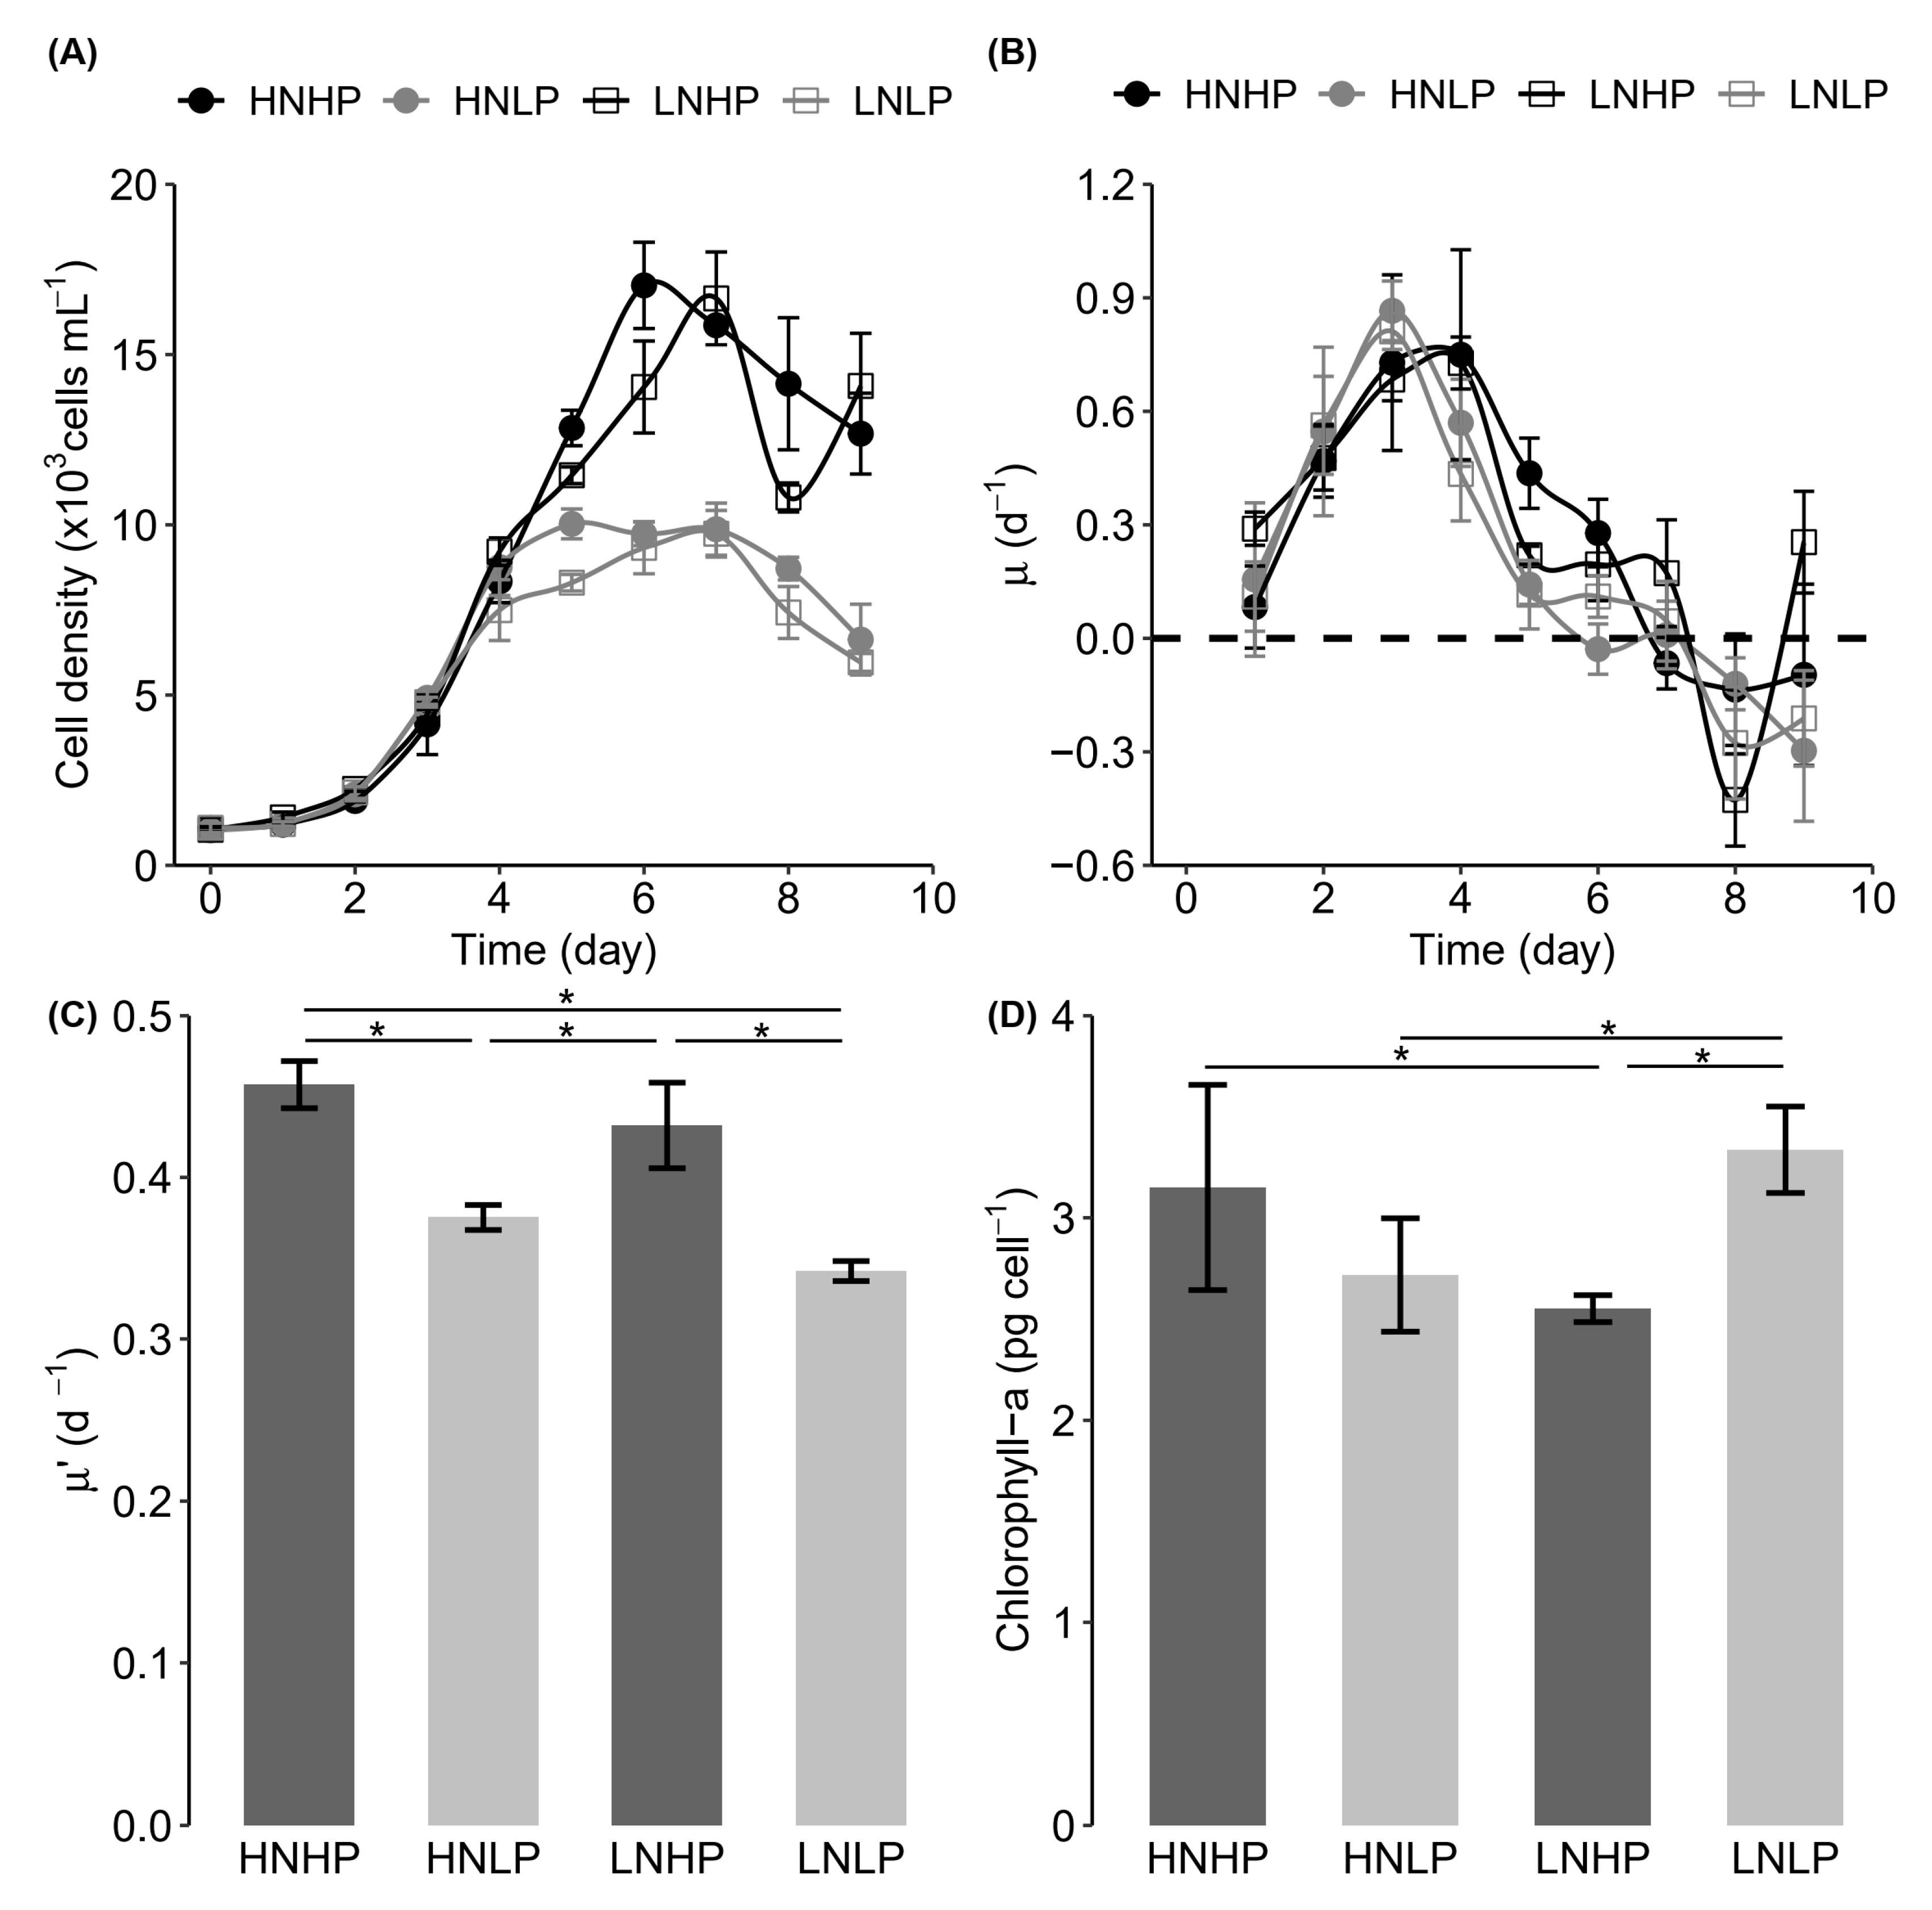
3.1. Growth Response

H. akashiwo was able to grow under all four nutrient scenarios, but it displayed different responses according to the initial N and P concentrations. Cell densities were similar until day 4 (Figure 1A), after which significantly higher cell densities were found under HP conditions than those under LP conditions (Figure 1A, Table S3, HP:LP, F = 61.18, p < 0.001). Except for day 7 and day 9, the cell densities under HN conditions were higher than those under LN conditions with the same initial P treatment, particularly on day 5 (Figure 1A, Table S3, HN:LN, F = 16.638, p = 0.003). Cell density reached a maximum on day 5 in the HNLP scenario (10.02 ± 0.44 × 10³ cells mL−1), followed by the HNHP scenario (17.03 ± 1.26 × 10³ cells mL−1) on day 6, and LNHP (16.65 ± 1.36 × 10³ cells mL−1) and LNLP (9.7 ± 0.68 × 10³ cells mL−1) scenarios on day 7 (Figure 1A). The maximum cell density in the LP scenarios was 41% lower than that in the HP scenarios.
Daily specific growth rates increased in the first three days, falling close to zero on day 7, and became negative by day 8 (Figure 1B). However, the daily specific growth rates under the HP conditions were slightly higher than those under the LP conditions from days 4–6, while the rates were significantly higher in the HNHP scenario than in the HNLP scenario on day 5 and day 6 (p < 0.05).
The specific growth rates of the four scenarios in the exponential growth phase (μ′) were 0.46 ± 0.01 (HNHP), 0.38 ± 0.01 (HNLP), 0.43 ± 0.03 (LNHP), and 0.34 ± 0.01 (LNLP). The μ′ under HP conditions were significantly higher than those under LP conditions, while μ′ did not significantly vary between initial N treatments (Figure 1C, HP:LP, F = 16.295, p = 0.004; HN:LN, F = 0.459, p = 0.517). The μ′ under LP conditions were 17–21% lower than those under HP conditions.
Cellular Chl-a concentrations (pg cell−1) on day 6 were 3.15 ± 0.51 (HNHP), 2.72 ± 0.28 (HNLP), 2.55 ± 0.07 (LNHP), and 3.34 ± 0.21 (LNLP) (Figure 1D). The Chl-a per cell in the HN scenarios was significantly higher than that in the LN scenarios under HP, while the Chl-a in the LN scenarios was significantly higher than that in the HN scenarios under LP (N:P, F = 5.239, p = 0.047; HP:LP, F = 2.582, p = 0.146; HN:LN, F = 2.560, p = 0.148).

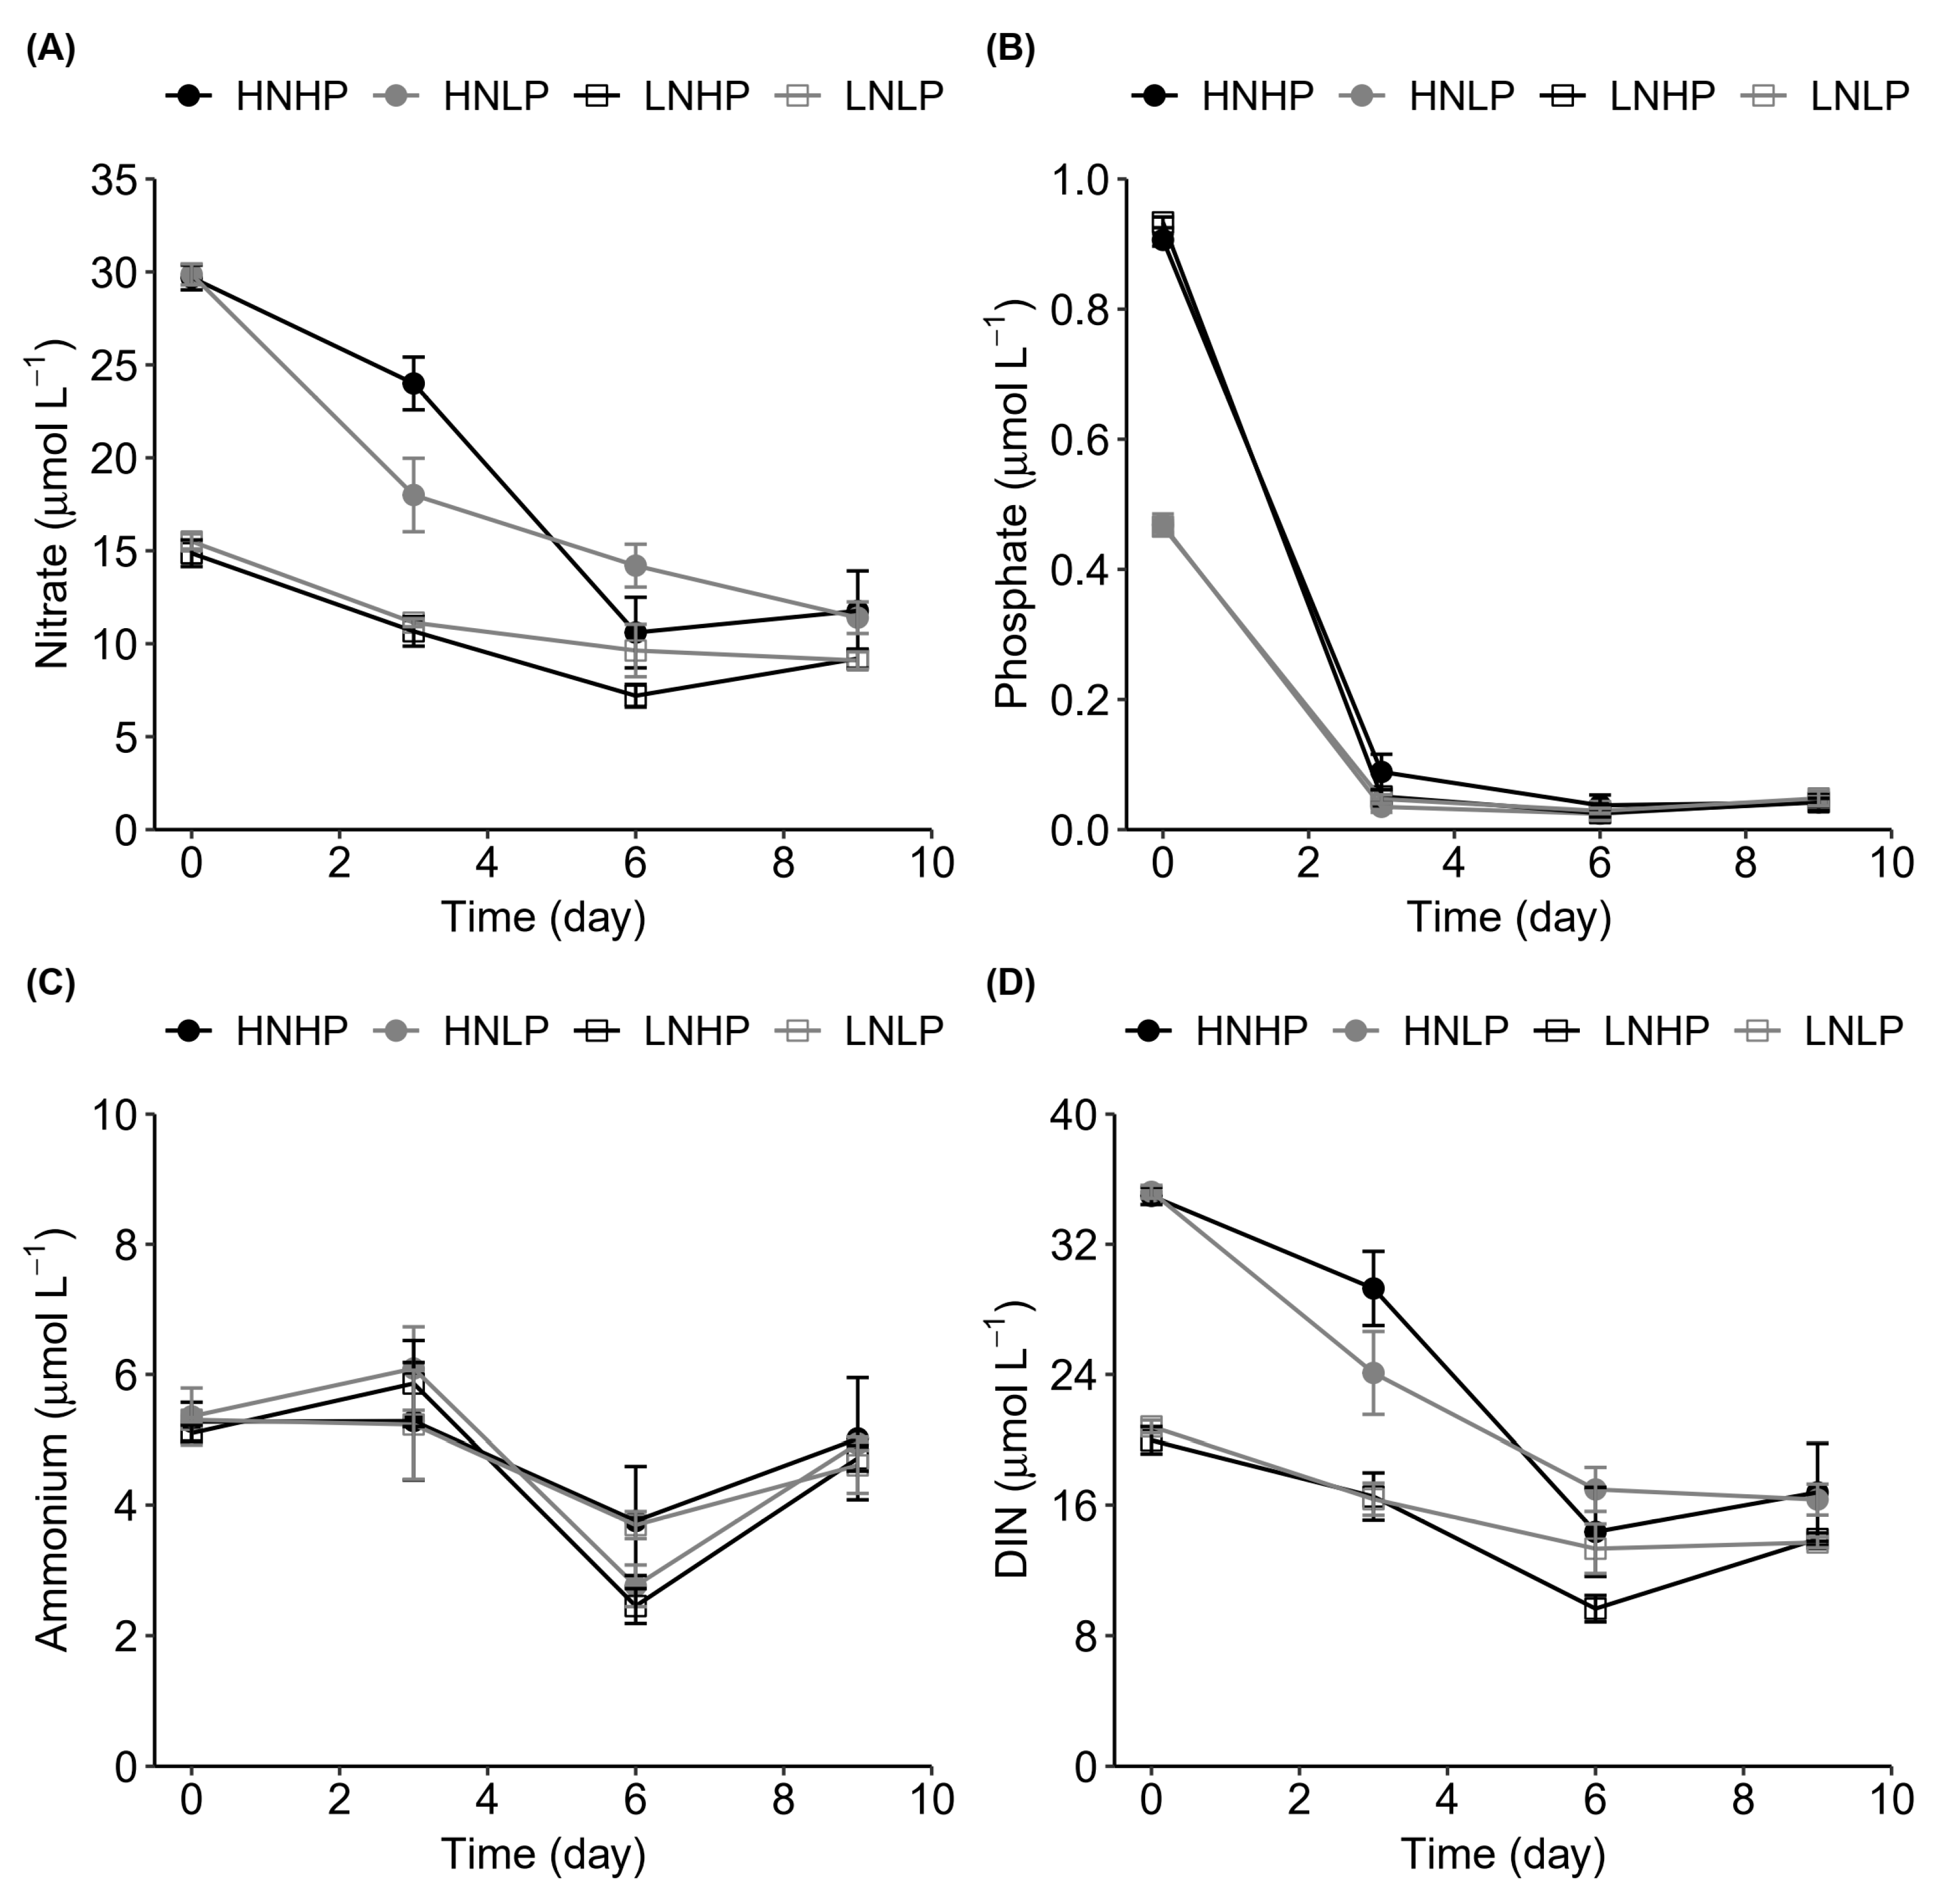
3.2. Nutrient Variation

Initial N and P concentrations were consistent with the planned experimental concentrations (Figure 2A,B). Ammonium was detected from the beginning of the experiment, presumably obtained from the pre-culture (Figure 2C).
Nitrate decreased in the first six days in the four scenarios and then increased during days 6–9 under HP conditions (Figure 2A) while continuingly decreased under LP conditions. The final concentrations of nitrate (µmol L−1) in the four scenarios were 11.77 ± 2.15 (HNHP), 11.40 ± 0.85 (HNLP), 9.20 ± 0.51 (LNHP), and 9.10 ± 0.46 (LNLP). Phosphate was consumed rapidly in the first three days under all scenarios, reaching the level of detection (0.05 μmol L−1) by day 3 under LP and day 6 under HP conditions (Figure 2B).
On the other hand, ammonium decreased from day 3 (5.28–6.09 µmol L−1) to day 6 (2.45–3.69 µmol L−1) after an initial gradual increase, and then increased to 4.61–5.02 µmol L−1 (Figure 2C). The sum of nitrate and ammonium (DIN) is shown in Figure 2D. A surplus of DIN was found in all the scenarios at the end of the experiment (Figure 2D).
The four scenarios showed varying nutrient uptake rates (pmol cell−1 d−1), defined as net negative nutrient concentration changes (Equation (3)), in the three measurement stages (days 0–3, 3–6, and 6–9). Maximum DIN uptake rates were observed in the first stage (0.600 ± 0.127 (HNHP), 0.937 ± 0.180 (HNLP), 0.334 ± 0.211 (LNHP), and 0.416 ± 0.147 (LNLP)) (Figure 3A). DIN uptake rates decreased in stages 2 and 3 (Figure 3A). Maximum phosphate uptake rates were also observed in the first stage (0.108 ± 0.035 (HNHP), 0.037 ± 0.002 (HNLP), 0.087 ± 0.005 (LNHP), and 0.038 ± 0.003 (LNLP)) (Figure 3B). Phosphate uptake rates under HP conditions were higher than those under LP conditions (Figure 3B, HP:LP, F = 9.856, p = 0.004). In addition, phosphate uptake rates decreased to close to zero from day 3 in all the scenarios (Figure 3B).
Since a closed culture system was used in this study, the cellular quotas (QN, QP, Equation (2)) were estimated based on the amount of incremental cell and nutrient concentration change (Figure 3C–E), defined as the net amount of assimilated nutrient. The nitrogen quotas (QN, pmol cell−1) in the four scenarios were 1.311–1.799 (HNHP), 2.088–3.668 (HNLP), 0.482–1.00 (LNHP), and 0.902–1.471 (LNLP) (Figure 3C). The QN in the HNLP scenario was the highest during all the stages, increasing from day 6 to day 9 (p = 0.01), while it remained unchanged in the other scenarios (p = 0.06) (Figure 3C).
The phosphorus quota (QP, pmol cell−1) in each scenario was the highest on day 3 (0.323 ± 0.104 (HNHP), 0.111 ± 0.005 (HNLP), 0.261 ± 0.016 (LNHP), and 0.114 ± 0.009 (LNLP)). QP then decreased to 0.051–0.071 on day 6 and day 9 (Figure 3D). The QP under HP conditions was significantly higher than that under LP conditions on day 3 (HP:LP, F = 11.078, p = 0.003). However, it did not show a significant difference on day 6 and day 9 (Figure 3D, p = 0.353).
The initial nutrient concentrations were set with an N:P ratio of 15 in the LNHP scenario, 30 in HNHP and LNLP, and 60 in HNLP; the hierarchy of cellular nitrogen-to-phosphorus ratios (cellular N:P) was consistent with that of the initial N:P from day 3 to day 9 (N:PHNLP > N:PHNHP and N:PLNLP > N:PLNHP) (Figure 3E). The cellular N:P in each scenario was the lowest on day 3 (6.839 ± 2.738 (HNHP), 25.448 ± 5.201 (HNLP), 3.853 ± 2.515 (LNHP), and 10.511 ± 3.113 (LNLP)) (Figure 3E), after which it increased to 23.656 ± 2.626 in the HNHP scenario, 41.041 ± 2.694 in the HNLP scenario, 11.367 ± 1.764 in the LNHP scenario, and 16.929 ± 3.800 in the LNLP scenario on day 6 (Figure 3E). Except for LNHP, only a slight change was observed from day 6 to day 9 in the other scenarios (Figure 3E, p = 0.664).

4. Discussion

4.1. Heterosigma Akashiwo Growth Response to Nutrient Limitation

Growth rate is reduced under low P conditions in many HAB species, such as Karlodinium veneficum [19,20], Karenia mikimotoi [21,22], and Pseudo-nitzschia spp. [23]. Although the cell densities and growth rates of H. akashiwo under HN conditions were slightly higher than those under LN conditions with the same initial P concentration in the present study, the difference was not statistically significant (Figure 1A,C; Tables S3 and S4). However, the cell densities and µʹ of H. akashiwo were significantly inhibited under LP conditions independent of the nitrogen concentration. Contrary to the present study, HABs could proliferate rapidly when P was supplemented in Chattonella antiqua (Raphidophyceae) [24].
A nutrient addition bioassay experiment in Hakata Bay of Japan also showed that the growth of H. akashiwo was not altered by the addition of N alone but was boosted with the addition of P and N together [10]. However, the positive effect of P on H. akashiwo did not manifest in nitrogen-deficient water (N < 5 μmol L−1) [17]. This indicates that the effect of P on the growth of H. akashiwo depends on sufficient nitrogen concentration. The initial nutrient concentrations of N and P in the present study were 15/30 μmol L−1 and 0.5/1 μmol L−1, respectively, which are similar to those in coastal waters of the ECS where H. akashiwo blooms [18,25]. Both N and P concentrations satisfy the minimum demand of H. akashiwo, indicating that P determines the rate and magnitude of the population development of H. akashiwo under the nutrient scenarios from the ECS and within the experimental setup.
Modelling studies have further clarified the significant positive correlation between DIP concentration and phytoplankton biomass [26]. However, although the growth of HABs tends to be limited by the availability of phosphorus, ecological risks of HABs can persist. For example, many HABs can increase their toxin production in phosphorus-deficient conditions [19,20,21,23,27]. Further studies are needed to determine the changes in the toxicity of H. akashiwo under phosphorus deficiency.

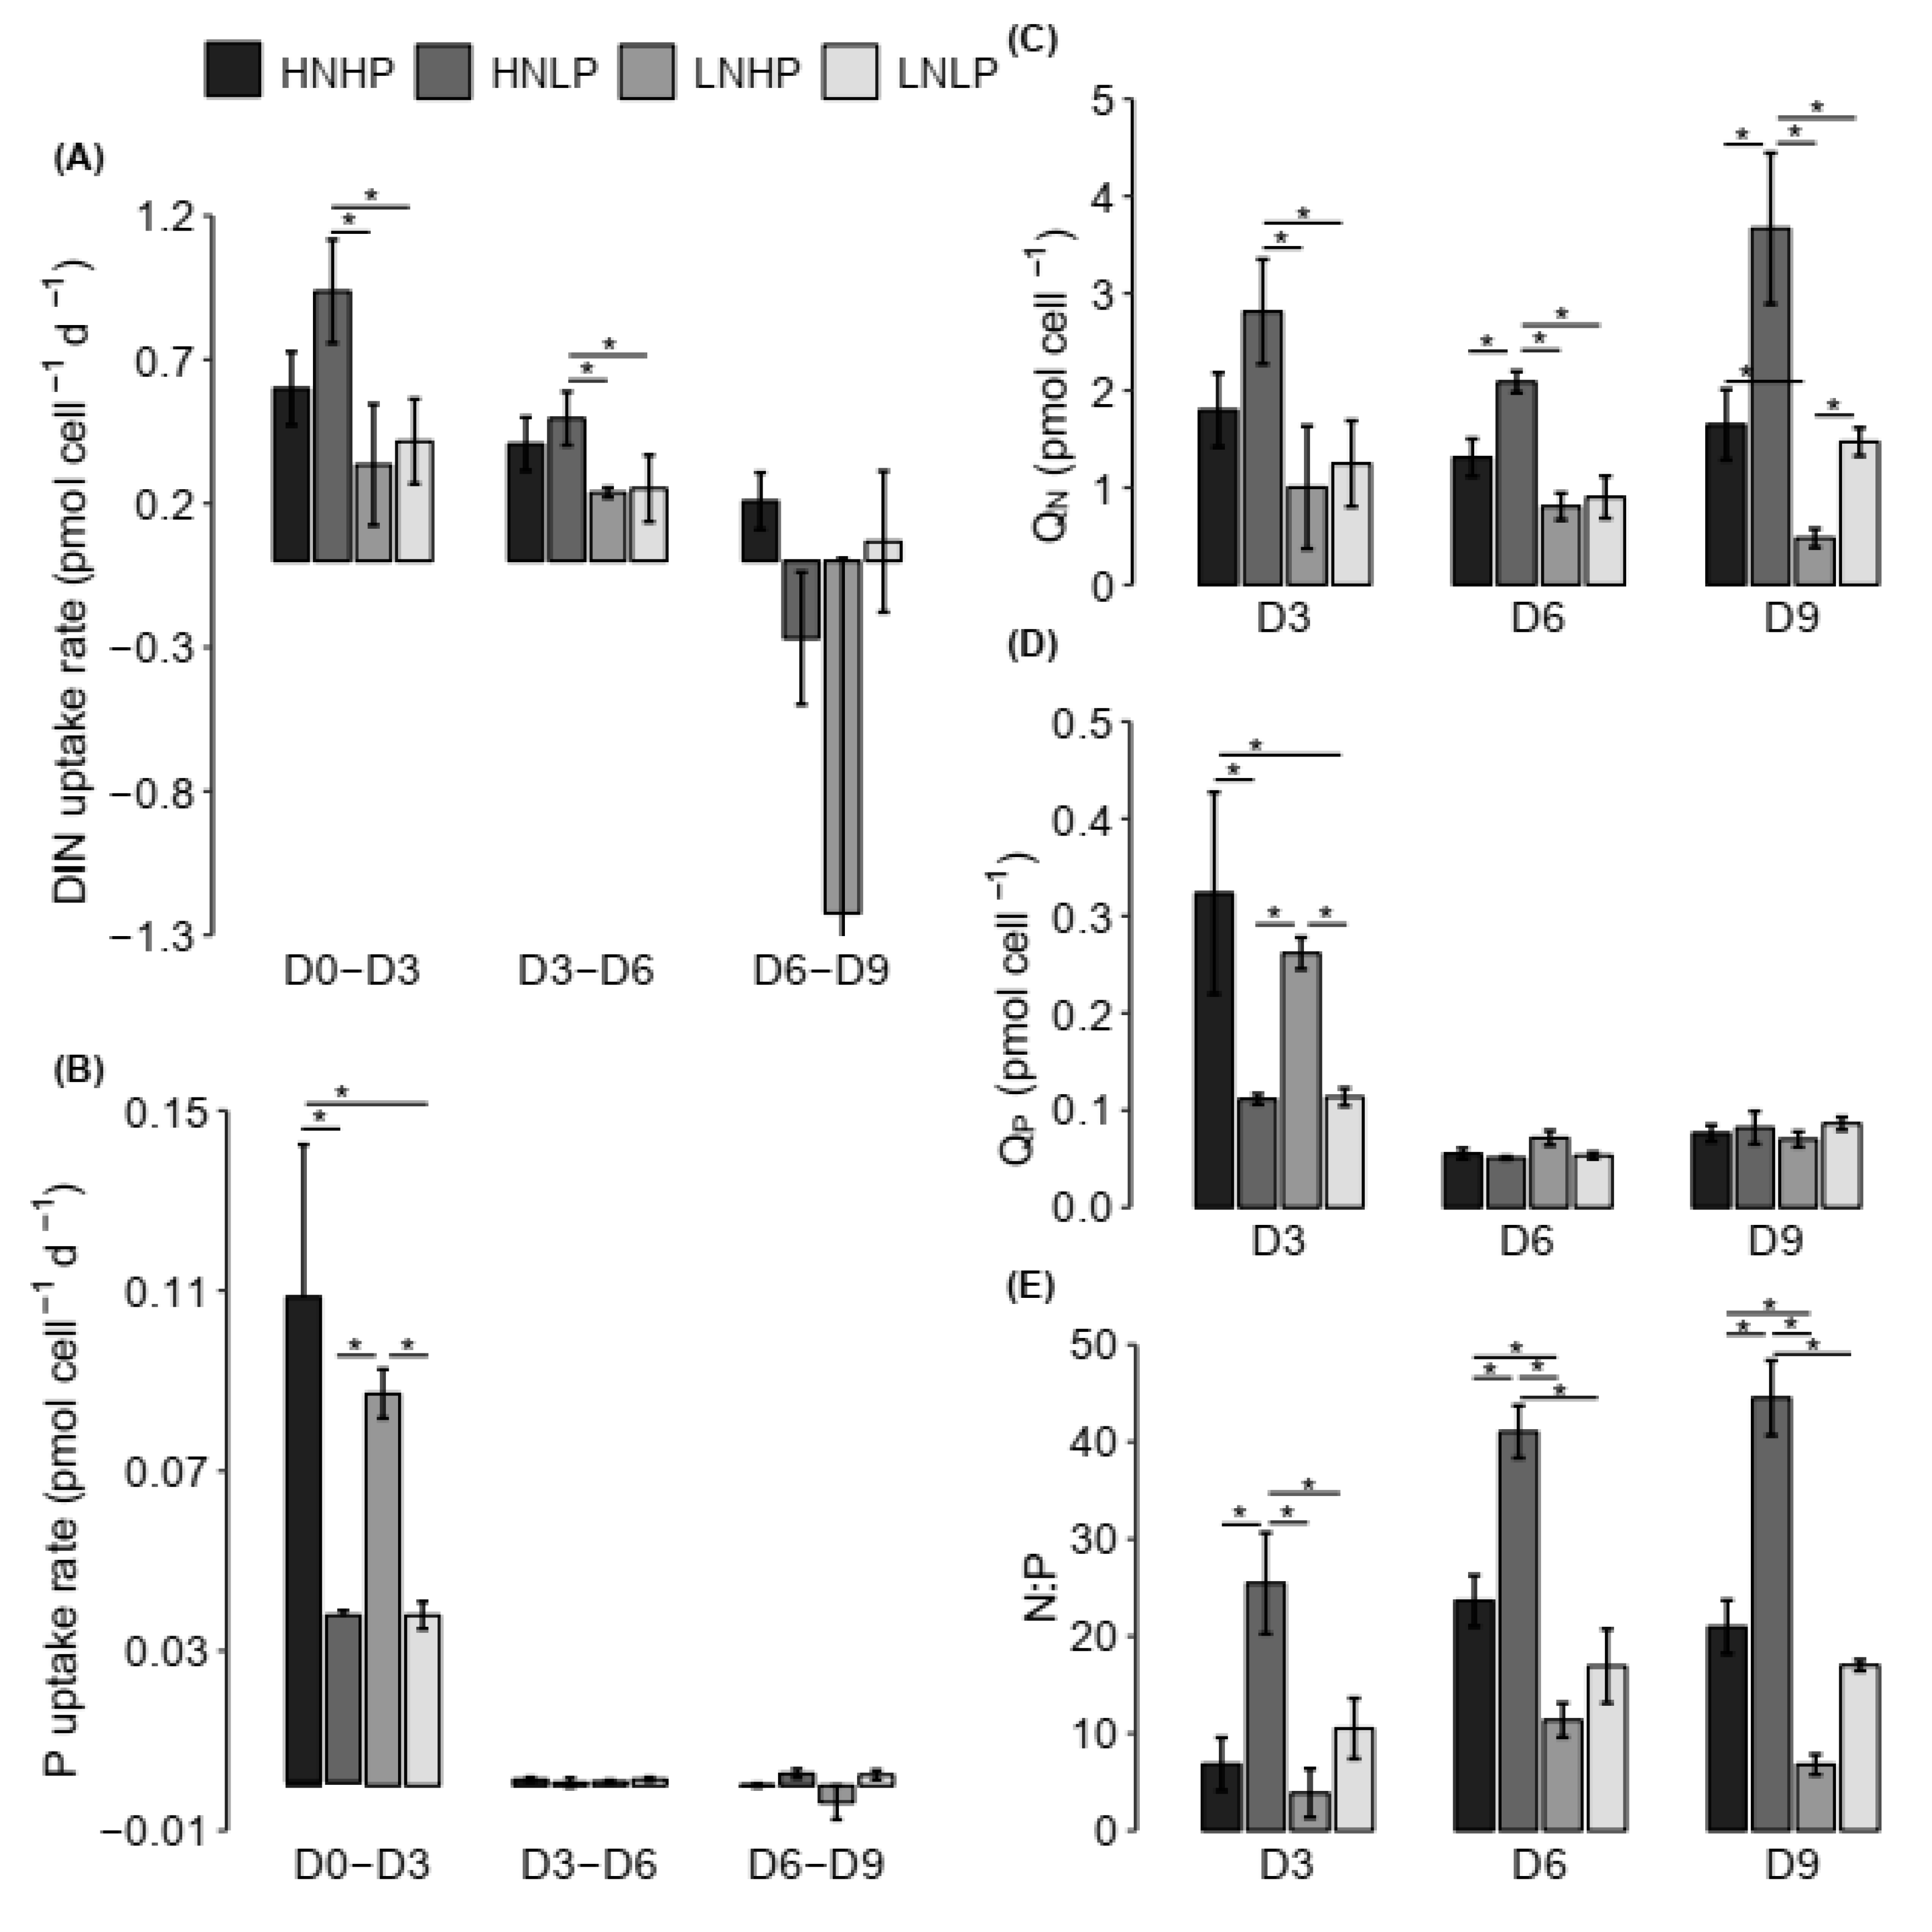
4.2. Nutrient Uptake Dynamics

Some marine phytoplankton species can store DIP and utilise DOP as coping strategies to periodical P limitation [28,29,30]. H. akashiwo also shows coping strategies in response to P deficiency [14,15,31]. In general, P is deficient in the upper layer of stratified waters but sufficient in the lower layer. Owing to its motility, H. akashiwo is able to vertically migrate at night to P-rich depths to accumulate P and store it as polyphosphate. It then returns to the upper layer in the daytime to perform photosynthesis by using the accumulated polyphosphate [14]. Moreover, H. akashiwo can luxuriously consume P when the P-starved cells are exposed to P-rich environments [32]. In addition, the utilisation of DOP is another important coping strategy for H. akashiwo [15,31]. The P-storage strategy can also be seen in our study. Cells were P-starved in the pre-culture. The rapid uptake of P during stage 1 in the experiment (Figure 3B) may indicate luxury consumption of P. It can be seen that P was exhausted on the third day in all scenarios (Figure 2B). However, the populations kept growing until day 6, indicating that H. akashiwo may be using stored phosphorus. Other alternative coping strategies, such as the uptake of DOP or rapid phosphorus recycling [33], were not measured in the present study.

4.3. Stoichiometry of H. akashiwo

The cellular stoichiometry of phytoplankton mainly depends on the nutrient supply ratio [28,34] and the allocation strategy [35]. The results of the present study showed that the cellular N:P ratios were influenced by the initial ratio of nutrient supply (Figure 3E). Although the cellular N:P ratios were not the same as the initially supplied N:P ratios in the different scenarios, the hierarchy of cellular N:P ratios was consistent with that of the initially supplied N:P ratios. For example, the lowest cellular N:P ratio was observed in the LNHP scenario with the lowest initially supplied N:P ratio, while the highest cellular N:P ratio was observed in the HNLP scenario. The cellular N:P ratios varied in each scenario during the present study (Figure 3E). This is because the stoichiometry of H. akashiwo varies during its different growth phases due to changeable dynamic allocation and nutrient demands [36].
The nutrients lost from the seawater mainly result from intracellular accumulation and, to a lesser degree, adsorption [37]. Organic nutrient compounds are also released from phytoplankton cells following metabolism and decomposition. In our present study, we did not determine intracellular accumulation directly and this should be a focus of future work. In order to evaluate the net stoichiometry of H. akashiwo nutrient uptake, QN and QP were estimated from Equation (2), although this may overestimate the nutrient quota per cell.
The largest contributor of cellular QN is proteins, while that of cellular QP is ribosomal RNAs (rRNAs) [38,39]. Therefore, the cellular N:P ratio is determined by the ratio of protein and rRNAs, reflecting changing physiological requirements [40]. Similar QP but different QN were observed in the four scenarios on day 6 and day 9 (Figure 3C,D), which indicates that QN had the greatest influence on the cellular N:P ratio. This suggests that the cellular rRNA contents in all the scenarios were similar, but the protein contents were different.

4.4. Applicability of Low-Nutrient Setup

Numerous studies have focused on the effect of nutrients on the growth of H. akashiwo. However, few studies have paid attention to its growth under realistic nutrient concentrations representing those in the natural environment (Table S5). Model parameterisations should simulate the growth of HAB communities under natural conditions to represent and predict HAB episodes. The nutrient concentrations in the present study were fixed according to those found in the ECS coastal waters during occurrence of H. akashiwo blooming [18]. The maximum cell densities in our study are similar to natural bloom concentrations (103–105 cells mL−1) [41,42,43]. P was shown to be a major factor influencing the population development of H. akashiwo in the ECS by the present study.
Further studies should include competition between other prominent phytoplankton and H. akashiwo under P deficiency as a factor in their analyses. H. akashiwo could outcompete other species in the P-limited waters of the ECS resulting in blooms. The ECS is gradually changing from being nitrogen deficient to being phosphorus deficient [44]; and, an H. akashiwo bloom was observed in the ECS in summer under a very low P concentration [25].

5. Conclusions

Our results showed that the µʹ and the population densities were significantly reduced by 17–21% and 41%, respectively, under low P conditions, indicating that phosphorus concentration is a key factor for the development of H. akashiwo blooms in the ECS. The study showed that the cellular N:P ratio is highly dependent on the initially supplied N:P ratio and the allocation strategy. This study provides new understanding of the growth and nutrient uptake dynamics of H. akashiwo under varying, but realistic, nutrient concentrations, which could serve as a reference for coastal water management and marine ecological management.

Supplementary Materials

The following are available online at https://www.mdpi.com/article/10.3390/w13223166/s1, Table S1: artificial seawater recipe, Table S2: silicon-free f/2 media, Table S3: p-values of one-way ANOVA analysis of cell densities between different nutrient scenarios, Table S4: results of two-way ANOVAs of the effects of nitrate (N) and phosphate (P) and their dual effect on cell densities, Table S5: exponential growth rates (μ, d−1) of Heterosigma akashiwo from references.

Author Contributions

Experiment, data analysis and writing—original draft preparation, A.Y.; methodology, supervision and writing—review and editing, R.G.J.B.; writing—review, Y.W.; data analysis and writing—review, X.L. All authors have read and agreed to the published version of the manuscript.

Funding

This research was funded by the National Thousand Talents Program for Foreign Experts (Grants No. WQ20133100150), Vulnerabilities and Opportunities of the Coastal Ocean (Grants No. SKLEC-2016RCDW01).

Institutional Review Board Statement

Not applicable.

Informed Consent Statement

Not applicable.

Data Availability Statement

Data are contained within the article.

Acknowledgments

Richard Bellerby was supported by the CE2COAST Project Downscaling Climate and Ocean Change to Services: Thresholds and Opportunities (Norwegian Research Council Project No. 321890) through the 2019 “Joint Transnational Call on Next Generation Climate Science in Europe for Oceans” initiated by JPI Climate and JPI Oceans. We deeply thank Quanxing Liu and Guosen Zhang who gave guidance and worked on nutrient determination in this work.

Conflicts of Interest

The authors declare no conflict of interest.

References

  1. Sha, J.; Xiong, H.; Li, C.; Lu, Z.; Zhang, J.; Zhong, H.; Zhang, W.; Yan, B. Harmful algal blooms and their eco-environmental indication. Chemosphere 2021, 274, 129912. [Google Scholar] [CrossRef] [PubMed]
  2. Grattan, L.M.; Holobaugh, S.; Morris, J.G. Harmful algal blooms and public health. Harmful Algae 2016, 57, 2–8. [Google Scholar] [CrossRef] [PubMed] [Green Version]
  3. Wells, M.L.; Karlson, B.; Wulff, A.; Kudela, R.; Trick, C.; Asnaghi, V.; Berdalet, E.; Cochlan, W.; Davidson, K.; De Rijcke, M.; et al. Future HAB science: Directions and challenges in a changing climate. Harmful Algae 2020, 91, 101632. [Google Scholar] [CrossRef] [PubMed]
  4. Kok, J.W.K.; Yeo, D.C.J.; Leong, S.C.Y. Growth and physiological responses of a tropical toxic marine microalga Heterosigma akashiwo (Heterokontophyta: Raphidophyceae) from Singapore waters to varying nitrogen sources and light conditions. Ocean Sci. J. 2015, 50, 491–508. [Google Scholar] [CrossRef]
  5. Mehdizadeh Allaf, M.; Trick, C.G. Multiple-stressor design-of-experiment (DOE) and one-factor-at-a-time (OFAT) observations defining Heterosigma akashiwo growth and cell permeability. J. Appl. Phycol. 2019, 31, 3515–3526. [Google Scholar] [CrossRef]
  6. NOAA Fisheries NWFSC PARR. The Ecophysiology and Toxicity of Heterosigma akashiwo in Puget Sound: A Living Laboratory Ecosystem Approach 2016. Available online: https://www.webapps.nwfsc.noaa.gov/apex/parrdata/inventory/projects/project/581 (accessed on 15 May 2021).
  7. Kamiyama, T. Change in the microzooplankton community during decay of a Heterosigma akashiwo bloom. J. Oceanogr. 1995, 51, 279–287. [Google Scholar] [CrossRef]
  8. Lemley, D.A.; Adams, J.B.; Rishworth, G.M.; Purdie, D.A. Harmful algal blooms of Heterosigma akashiwo and environmental features regulate Mesodinium cf. rubrum abundance in eutrophic conditions. Harmful Algae 2020, 100, 101943. [Google Scholar] [CrossRef]
  9. Jansson, A.; Klais-Peets, R.; Griniené, E.; Rubene, G.; Semenova, A.; Lewandowska, A.; Engström-Öst, J. Functional shifts in estuarine zooplankton in response to climate variability. Ecol. Evol. 2020, 10, 11591–11606. [Google Scholar] [CrossRef]
  10. Shikata, T.; Yoshikawa, S.; Matsubara, T.; Tanoue, W.; Yamasaki, Y.; Shimasaki, Y.; Ma-tsuyama, Y.; Oshima, Y.; Jenkinson, I.R.; Honjo, T. Growth dynamics of Heterosigma akashiwo (Raphidophyceae) in Hakata Bay, Japan. Eur. J. Phycol. 2008, 43, 395–411. [Google Scholar] [CrossRef]
  11. Zhang, Y.; Fu, F.; Whereat, E.; Coyne, K.J.; Hutchins, D.A. Bottom-up controls on a mixed-species HAB assemblage: A comparison of sympatric Chattonella subsalsa and Heterosigma akashiwo (Raphidophyceae) isolates from the Delaware Inland Bays, USA. Harmful Algae 2006, 5, 310–320. [Google Scholar] [CrossRef]
  12. Strom, S.L.; Harvey, E.L.; Fredrickson, K.A.; Menden-Deuer, S. Broad Salinity Tolerance as a Refuge from Predation in the Harmful Raphidophyte Alga Heterosigma akashiwo (Raphidophyceae). J. Phycol. 2013, 49, 20–31. [Google Scholar] [CrossRef]
  13. Butrón, A.; Madariaga, I.; Orive, E. Tolerance to high irradiance levels as a determinant of the bloom-forming Heterosigma akashiwo success in estuarine waters in summer. Estuar. Coast. Shelf Sci. 2012, 107, 141–149. [Google Scholar] [CrossRef]
  14. Watanabe, M.; Kohata, K.; Kunugi, M. Phosphate accumulation and metabolism by Heterosigma akashiwo (Raphidophyceae) during diel vertical migration in a stratified microcosm. J. Phycol. 1988, 24, 22–28. [Google Scholar] [CrossRef]
  15. Wang, Z.; Liang, Y. Growth and alkaline phosphatase activity of Chattonella marina and Heterosigma akashiwo in response to phosphorus limitation. J Envitron. Sci.-China 2015, 28, 1–7. [Google Scholar] [CrossRef]
  16. Herndon, J.; Cochlan, W.P. Nitrogen utilization by the raphidophyte Heterosigma akashiwo: Growth and uptake kinetics in laboratory cultures. Harmful Algae 2007, 6, 260–270. [Google Scholar] [CrossRef]
  17. Baek, S.H.; Lee, M.; Kim, Y. Spring phytoplankton community response to an episodic windstorm event in oligotrophic waters offshore from the Ulleungdo and Dokdo islands, Korea. J. Sea Res. 2018, 132, 1–14. [Google Scholar] [CrossRef]
  18. Ye, L.A.; Zhang, H.B.; Fei, Y.J.; Liu, L.; Li, D.L. Nutrient distributions in the East China Sea and changes over the last 25 years. Appl. Ecol. Environ. Res. 2020, 18, 973–985. [Google Scholar] [CrossRef]
  19. Fu, F.X.; Place, A.R.; Garcia, N.S.; Hutchins, D.A. CO2 and phosphate availability control the toxicity of the harmful bloom dinoflagellate Karlodinium veneficum. Aquat. Microb. Ecol. 2010, 59, 55–65. [Google Scholar] [CrossRef]
  20. Adolf, J.E.; Bachvaroff, T.R.; Place, A.R. Environmental modulation of karlotoxin levels in strains of the cosmopolitan dinoflagellate Karlodinium veneficum (Dinophyceae). J. Phycol. 2009, 45, 176–192. [Google Scholar] [CrossRef] [PubMed]
  21. Wang, H.; Niu, X.; Feng, X.; Goncalves, R.J.; Guan, W. Effects of ocean acidification and phosphate limitation on physiology and toxicity of the dinoflagellate Karenia mikimotoi. Harmful Algae 2019, 87, 101621. [Google Scholar] [CrossRef]
  22. Guan, W.; Li, P. Dependency of UVR-induced photoinhibition on atomic ratio of N to P in the dinoflagellate Karenia mikimotoi. Mar. Biol. 2017, 164, 31. [Google Scholar] [CrossRef]
  23. Lema, K.A.; Latimier, M.; Nézan, É.; Fauchot, J.; Le Gac, M. Inter and intra-specific growth and domoic acid production in relation to nutrient ratios and concentrations in Pseu-do-nitzschia: Phosphate an important factor. Harmful Algae 2017, 64, 11–19. [Google Scholar] [CrossRef] [Green Version]
  24. Yamaguchi, H.; Sai, K. Simulating the vertical dynamics of phosphate and their effects on the growth of harmful algae. Estuar. Coast. Shelf Sci. 2015, 164, 425–432. [Google Scholar] [CrossRef]
  25. Ji, N.; Lin, L.; Li, L.; Yu, L.; Zhang, Y.; Luo, H.; Li, M.; Shi, X.; Wang, D.; Lin, S. Meta-transcriptome analysis reveals environmental and diel regulation of a Heterosigma akashiwo (raphidophyceae) bloom. Environ. Microbiol. 2018, 20, 1078–1094. [Google Scholar] [CrossRef] [PubMed]
  26. Maslukah, L.; Zainuri, M.; Wirasatriya, A.; Salma, U. Spatial Distribution of Chlorophyll-a and Its Relationship with Dissolved Inorganic Phosphate Influenced by Rivers in the North Coast of Java. J. Ecol. Eng. 2019, 20, 18–25. [Google Scholar] [CrossRef]
  27. Guisande, C.; Frangopulos, M.; Maneiro, I.; Vergara, A.R.; Riveiro, I. Ecological advantages of toxin production by the dinoflagellate Alexandrium minutum under phosphorus limitation. Mar. Ecol. Prog. Ser. 2002, 225, 169–176. [Google Scholar] [CrossRef]
  28. Moreno, A.R.; Martiny, A.C. Ecological Stoichiometry of Ocean Plankton. Annu. Rev. Mar. Sci. 2018, 10, 43–69. [Google Scholar] [CrossRef]
  29. Dyhrman, S.T.; Chappell, P.D.; Haley, S.T.; Moffett, J.W.; Orchard, E.D.; Waterbury, J.B.; Webb, E.A. Phosphonate utilization by the globally important marine diazotroph Trichodesmium. Nature 2006, 439, 68–71. [Google Scholar] [CrossRef] [PubMed]
  30. Huang, B.; Ou, L.; Hong, H.; Luo, H.; Wang, D. Bioavailability of dissolved organic phosphorus compounds to typical harmful dinoflagellate Prorocentrum donghaiense Lu. Mar. Pollut. Bull. 2005, 51, 838–844. [Google Scholar] [CrossRef]
  31. Wang, Z.; Liang, Y.; Kang, W. Utilization of dissolved organic phosphorus by different groups of phytoplankton taxa. Harmful Algae 2011, 12, 113–118. [Google Scholar] [CrossRef]
  32. Watanabe, M.; Takamatsu, T.; Kohata, K.; Kunugi, M.; Kawashima, M.; Koyama, M. Luxury phosphate uptake and variation of intracellular metal concentrations in Heterosigma akashiwo (Raphidophyceae). J. Phycol. 1989, 25, 428–436. [Google Scholar] [CrossRef]
  33. Pitta, P.; Nejstgaard, J.C.; Tsagaraki, T.M.; Zervoudaki, S.; Egge, J.K.; Frangoulis, C.; Lagaria, A.; Magiopoulos, I.; Psarra, S.; Sandaa, R.; et al. Confirming the “Rapid phosphorus transfer from microorganisms to mesozooplankton in the Eastern Mediterranean Sea” scenario through a mesocosm experiment. J. Plankton Res. 2016, 38, 502–521. [Google Scholar] [CrossRef]
  34. Hall, S.R. Stoichiometrically Explicit Food Webs: Feedbacks between Resource Supply, Elemental Constraints, and Species Diversity. Annu. Rev. Ecol. Evol. Syst. 2009, 40, 503–528. [Google Scholar] [CrossRef] [Green Version]
  35. Klausmeier, C.A.; Litchman, E.; Daufresne, T.; Levin, S.A. Optimal nitrogen-to-phosphorus stoichiometry of phytoplankton. Nature 2004, 429, 171–174. [Google Scholar] [CrossRef] [PubMed]
  36. Liu, X.; Liu, Y.; Noman, M.A.; Thangaraj, S.; Sun, J. Physiological Changes and Elemental Ratio of Scrippsiella trochoidea and Heterosigma akashiwo in Different Growth Phase. Water 2021, 13, 132. [Google Scholar] [CrossRef]
  37. Jin, J.; Liu, S.M.; Ren, J.L. Phosphorus utilization by phytoplankton in the Yellow Sea during spring bloom: Cell surface adsorption and intracellular accumulation. Mar. Chem. 2021, 231, 103935. [Google Scholar] [CrossRef]
  38. Geider, R.; La Roche, J. Redfield revisited: Variability of C:N:P in marine microalgae and its biochemical basis. Eur. J. Phycol. 2002, 37, 1–17. [Google Scholar] [CrossRef] [Green Version]
  39. Karpinets, T.V.; Greenwood, D.J.; Sams, C.E.; Ammons, J.T. RNA:protein ratio of the unicellular organism as a characteristic of phosphorous and nitrogen stoichiometry and of the cellular requirement of ribosomes for protein synthesis. BMC Biol. 2006, 4, 30. [Google Scholar] [CrossRef]
  40. Loladze, I.; Elser, J.J. The origins of the Redfield nitrogen-to-phosphorus ratio are in a homoeostatic protein-to-rRNA ratio. Ecol. Lett. 2011, 14, 244–250. [Google Scholar] [CrossRef]
  41. Lewitus, A.J.; Schmidt, L.B.; Mason, L.J.; Kempton, J.W.; Wilde, S.B.; Wolny, J.L.; Williams, B.J.; Hayes, K.C.; Hymel, S.N.; Keppler, C.J.; et al. Harmful Algal Blooms in South Carolina Residential and Golf Course Ponds. Popul. Environ. 2003, 24, 387–413. [Google Scholar] [CrossRef]
  42. Lewitus, A.J.; Brock, L.M.; Burke, M.K.; DeMattio, K.A.; Wilde, S.B. Lagoonal stormwater detention ponds as promoters of harmful algal blooms and eutrophication along the South Carolina coast. Harmful Algae 2008, 8, 60–65. [Google Scholar] [CrossRef]
  43. Jeong, H.J.; Yoo, Y.D.; Lim, A.S.; Kim, T.; Lee, K.; Kang, C.K. Raphidophyte red tides in Korean waters. Harmful Algae 2013, 30, S41–S52. [Google Scholar] [CrossRef]
  44. Moon, J.; Lee, K.; Lim, W.; Lee, E.; Dai, M.; Choi, Y.; Han, I.; Shin, K.; Kim, J.; Chae, J. Anthropogenic nitrogen is changing the East China and Yellow seas from being N deficient to being P deficient. Limnol. Oceanogr. 2020, 66, 914–924. [Google Scholar] [CrossRef]
Figure 1. Growth and chlorophyll-a response of Heterosigma akashiwo in the four nutrient scenarios: (A) Changes in cell density (cells mL−1); (B) Daily specific growth rate μ with time (d−1); (C) Specific growth rate in the exponential growth phase μ′ (d−1); (D) Cellular chlorophyll-a concentration (pg cell−1). The error bar represents the standard error (number of samples = 3); The asterisk indicates significant differences (p < 0.05) across scenarios.
Water 13 03166 g001
Figure 2. Nutrient concentration (µmol L−1) changes in the cultures under the four nutrient scenarios. (A) Nitrate; (B) Phosphate; (C) Ammonium; (D) Dissolved inorganic nitrogen (DIN). The error bar represents the standard error (number of samples = 3).
Water 13 03166 g002
Figure 3. Nutrient uptake rate (pmol cell−1 d−1) and conversion in the cultures during different time intervals in the four nutrients scenarios. (A) DIN uptake/release rate; (B) Phosphate uptake/release rate; (C) Nitrogen quota; (D) Phosphorus quota; (E) Cellular N:P. The error bar represents the standard error (number of samples = 3). * p < 0.05.
Water 13 03166 g003
Table 1. Scenarios and nutrient concentration of experiments.
ScenariosConcentration of Nitrate Nitrogen (N)Concentration of Phosphate (P)
HNHP30 μmol L−1 (HN)1 μmol L−1 (HP)
HNLP30 μmol L−1 (HN)0.5 μmol L−1 (LP)
LNHP15 μmol L−1 (LN)1 μmol L−1 (HP)
LNLP15 μmol L−1 (LN)0.5 μmol L−1 (LP)
Publisher’s Note: MDPI stays neutral with regard to jurisdictional claims in published maps and institutional affiliations.

