Article

Effect of Climate Variability Events over the Colombian Caribbean Offshore Wind Resource

by
Martha Bastidas-Salamanca
1 and
Juan Gabriel Rueda-Bayona
2,*
1
Colombian Oceanographic Data Center, Dirección General Marítima, Bogota 111711, Colombia
2
Natural and Environmental Resources Engineering School (EIDENAR), Faculty of Engineering, Universidad del Valle, Cali 760001, Colombia
*
Author to whom correspondence should be addressed.
Water 2021, 13(22), 3150; https://doi.org/10.3390/w13223150
Submission received: 15 October 2021 / Revised: 4 November 2021 / Accepted: 5 November 2021 / Published: 9 November 2021
(This article belongs to the Section Water-Energy Nexus)

Abstract

:
The need for reducing the CO2 emissions and fossil fuel dependence of several countries generated a growing interest for the Renewables. The Caribbean Sea is characterized by persistent and high magnitude winds, which suggest an important source of offshore wind energy. Recent studies reported that the Colombian Caribbean has a relevant opportunity for developing the offshore wind technology which could complement the energy production when the hydroelectric system is under low generation due to persistent dry conditions generated by El Niño events. The offshore wind energy may complement the energy offer of Colombia. Hence, understanding the impact of climate variability events in the Caribbean over the wind magnitude, contributes to the knowledge of the resource availability for a better planning of future offshore wind farms. In this sense, this study analyzed 39 years of Reanalysis wind data through a time series analysis of the Caribbean to identify the lowest wind speed velocities and when and why they occurred. The results showed that winds of the study area represented by the Caribbean Low level, showed the lowest wind speeds in the short, mid, and long term due to the influence of the seasons, El Niño-Southern Oscillation (ENSO) and the Atlantic Multidecadal Oscillation (AMO).

1. Introduction

Historically, economic development has been closely correlated with higher energy consumption and increased greenhouse gas emissions, and the renewable energy may change this correlation in order to contribute to a sustainable development [1,2]. A wide variety of mitigation options can be applied in the energy sector to reduce the CO2 emission levels. Renewable energies have gained worldwide participation in energy systems, driven by new commitments and legislations, however, several risks remain: difficult for accessing the Renewable Energy Technologies (RET) in developing countries, higher investments and operation cost compared to the non-renewables technologies (NRT), insufficient capacity of port infrastructure to import the RET and elements needed for maintenance and reparation, among others. Valentine [3] pointed out that most of the RET are decentralized, which reduce risks related to technological malfunctions or terrorist attacks which could interrupt the domestic energy supply. Then, RET enhances the resilience of the energy supply which contribute to improve the quality of life index and reduces the social inequities and the stress over the natural resources and the environment [4,5].
The concept of energy supply is linked to energy security, which considers that the functioning of an economy requires an uninterrupted energy supply [6]. The Asia Pacific Energy Research Centre (APERC) suggested four dimensions of energy security [7]: availability, accessibility, affordability, and acceptability, called the 4A’s concept. Availability is related to the existence of the resource, accessibility aims to the ability for accessing into the resources which depends on geopolitical, geographical and technological constraints. Affordability is related to the price and investment costs, and the acceptability is about environmental concerns derived from the energy industry. Cherp and Jewell et al. [8] pointed out that energy security comprises the control of critical risks and vulnerabilities (e.g., climate change–variability) of the energy system through the identification of the risk source and the measurement of the impact. Since renewable energy sources are climate dependent, the climate change is a risk for the energy system because it affects the dynamic of the energy potential and its availability, and the magnitude of the impact may be uncertain in the long-term. Edenhofer et al. [9] warned that although it is not foreseeable measuring the impact of climate change over the wind energy source, it is certain that climate change will affect the development of new projects due to the worldwide redistribution of renewable energy potential.
Wind energy has gained popularity and support compared to other RETs because of two factors: the high availability of the resource and the maturity of the technology in terms of cost efficiency [10]. Among the RETs, the offshore wind has gained interest because ocean winds are stronger and more persistent compared to the continental winds due to the absence of physical barriers such as mountains, buildings and vegetation, as well as the available continental areas are reducing because of scarce space availability [11].
The Caribbean has a high potential for offshore wind energy, due to the persistence of local surface winds known as trade winds [12,13,14,15]. In addition, recent studies reported a high offshore wind energy potential for the Caribbean [12,16,17,18,19]. A proper understanding of the climate variability of wind energy allows us to identify the local dynamic of the wind energy potential, from daily time scale (sea-land breezes) to inter-annual and multi-decadal time scales [20]. According with Pryor et al. [21], variations in the annual wind energy density affect the financial viability of new wind farm developments. In this sense, Valentine [22] warned that studies aimed to identify sites for the new offshore wind projects considering only the wind speed as a fundamental factor are unappropriated.
The climate variability analysis in the Caribbean showed that during July and February occurs a seasonal variability event referred as the summer and winter Caribbean low-level jet (CLLJ), generating maximum wind speeds over the 12 m/s at 950 (hPa) equal to 761.7 m of elevation [15]. Whyte et al. [23] found that this seasonal climate event (CLLJ) triggers high winds which control the climate features of the early summer in the Caribbean. The CLLJ may be considered as an important wind resource in the Caribbean, however, it has not been delimited by its spatial coverage, nor its behavior during spring and autumn seasons, and how the wind speed is affected during several climate scenarios. Wang found a link between the CLLJ’s variability and the North Atlantic Subtropical High (NASH) climate event [13]. The NASH modifies the sea level pressure (SLP) gradient in the Caribbean forcing the CLLJ to modify the sea surface temperature (SST) and the rain features in the Caribbean region. Additionally, the CLLJ is remotely related to the SST anomalies in the Pacific and the Atlantic, suggesting that these SST variations affect the NASH [13].
El Niño and the Southern Oscillation are known as ENSO and is considered a relevant climate event, which modifies the distribution and magnitude of the winds over the Caribbean [13]. Particularly in Colombia, ENSO is the primary driver of the hydroclimate [24,25] and this is why some authors have suggested a complementary hydropower-wind based energy matrix in Colombia [18,26]. The Atlantic Multidecadal Oscillation (AMO) is an oceanic phenomenon that appears in the northern part of the Atlantic, which increments and reduces the sea temperatures with a cycle between 20–40 years for each phase (warm and cold); since the mid-90s the Atlantic has been in a warm phase. Wang and Lee documented that the AMO is closely related to decadal size fluctuations of the Atlantic Warm Pool (AWP) within the multidecadal time scale [14], while Klotzbach [27] mentioned that AMO plays a significant role over the behavior in the Caribbean hurricane activity affecting the wind intensities. Stephenson et al. [28] mentioned that AMO has a positive correlation with the annual rainfall in the Caribbean, suggesting that low wind speeds ease the generation of convective process triggering precipitations.
Another important climatic feature is the Intertropical Convergence Zone (ITCZ), which is defined as a narrow zonal band of atmospheric convection alongside the Equator, generated by the convergence between the surface winds of the northern and southern hemispheres. This convergent flow in the ITCZ produces intense convective processes which gathers high cloudiness and rain. During the windiest season in the Caribbean (winds about 8 and 15 m/s), the ITCZ is located in the southernmost position between the 0° and 5° of south latitude. From August to October the ITCZ moves to the 10° and 12° of north latitude what provokes the increment of precipitation over the Colombian Caribbean [29]. On seasonal and longer timescales, the ITCZ typically migrates towards a warming hemisphere, but when El Niño occurs the ITCZ migrates to the south hemisphere [30].
The reviewed studies evidenced the relevance of climate variability over the dynamic of the wind source in the Caribbean. The climate patterns of offshore winds in the Colombian Caribbean are influenced by large, mid and short term periods of climate events such as the AMO, ENSO and the CLLJ respectively. Because of the growing interest in developing new offshore wind projects in the Colombian Caribbean, it is pertinent to identify how these climate events will affect the wind resource, mainly because the planning of new offshore wind farms considers a project lifetime of 25 years [31]. At the moment, there is no open access information about how these climate variability events would affect the wind resource, nor the impact for the Caribbean of negative wind trends over the electricity generation during mid-long terms (5–10 years). Considering the need of understanding the effect of climate variability (multidecadal, interannual and seasonal) over the wind resource in the Colombian Caribbean, this study uses time-series, climate indexes and probability analysis of 39 years (1980–2019) of Reanalysis monthly data to provide information of the wind resource behavior during several climate scenarios.

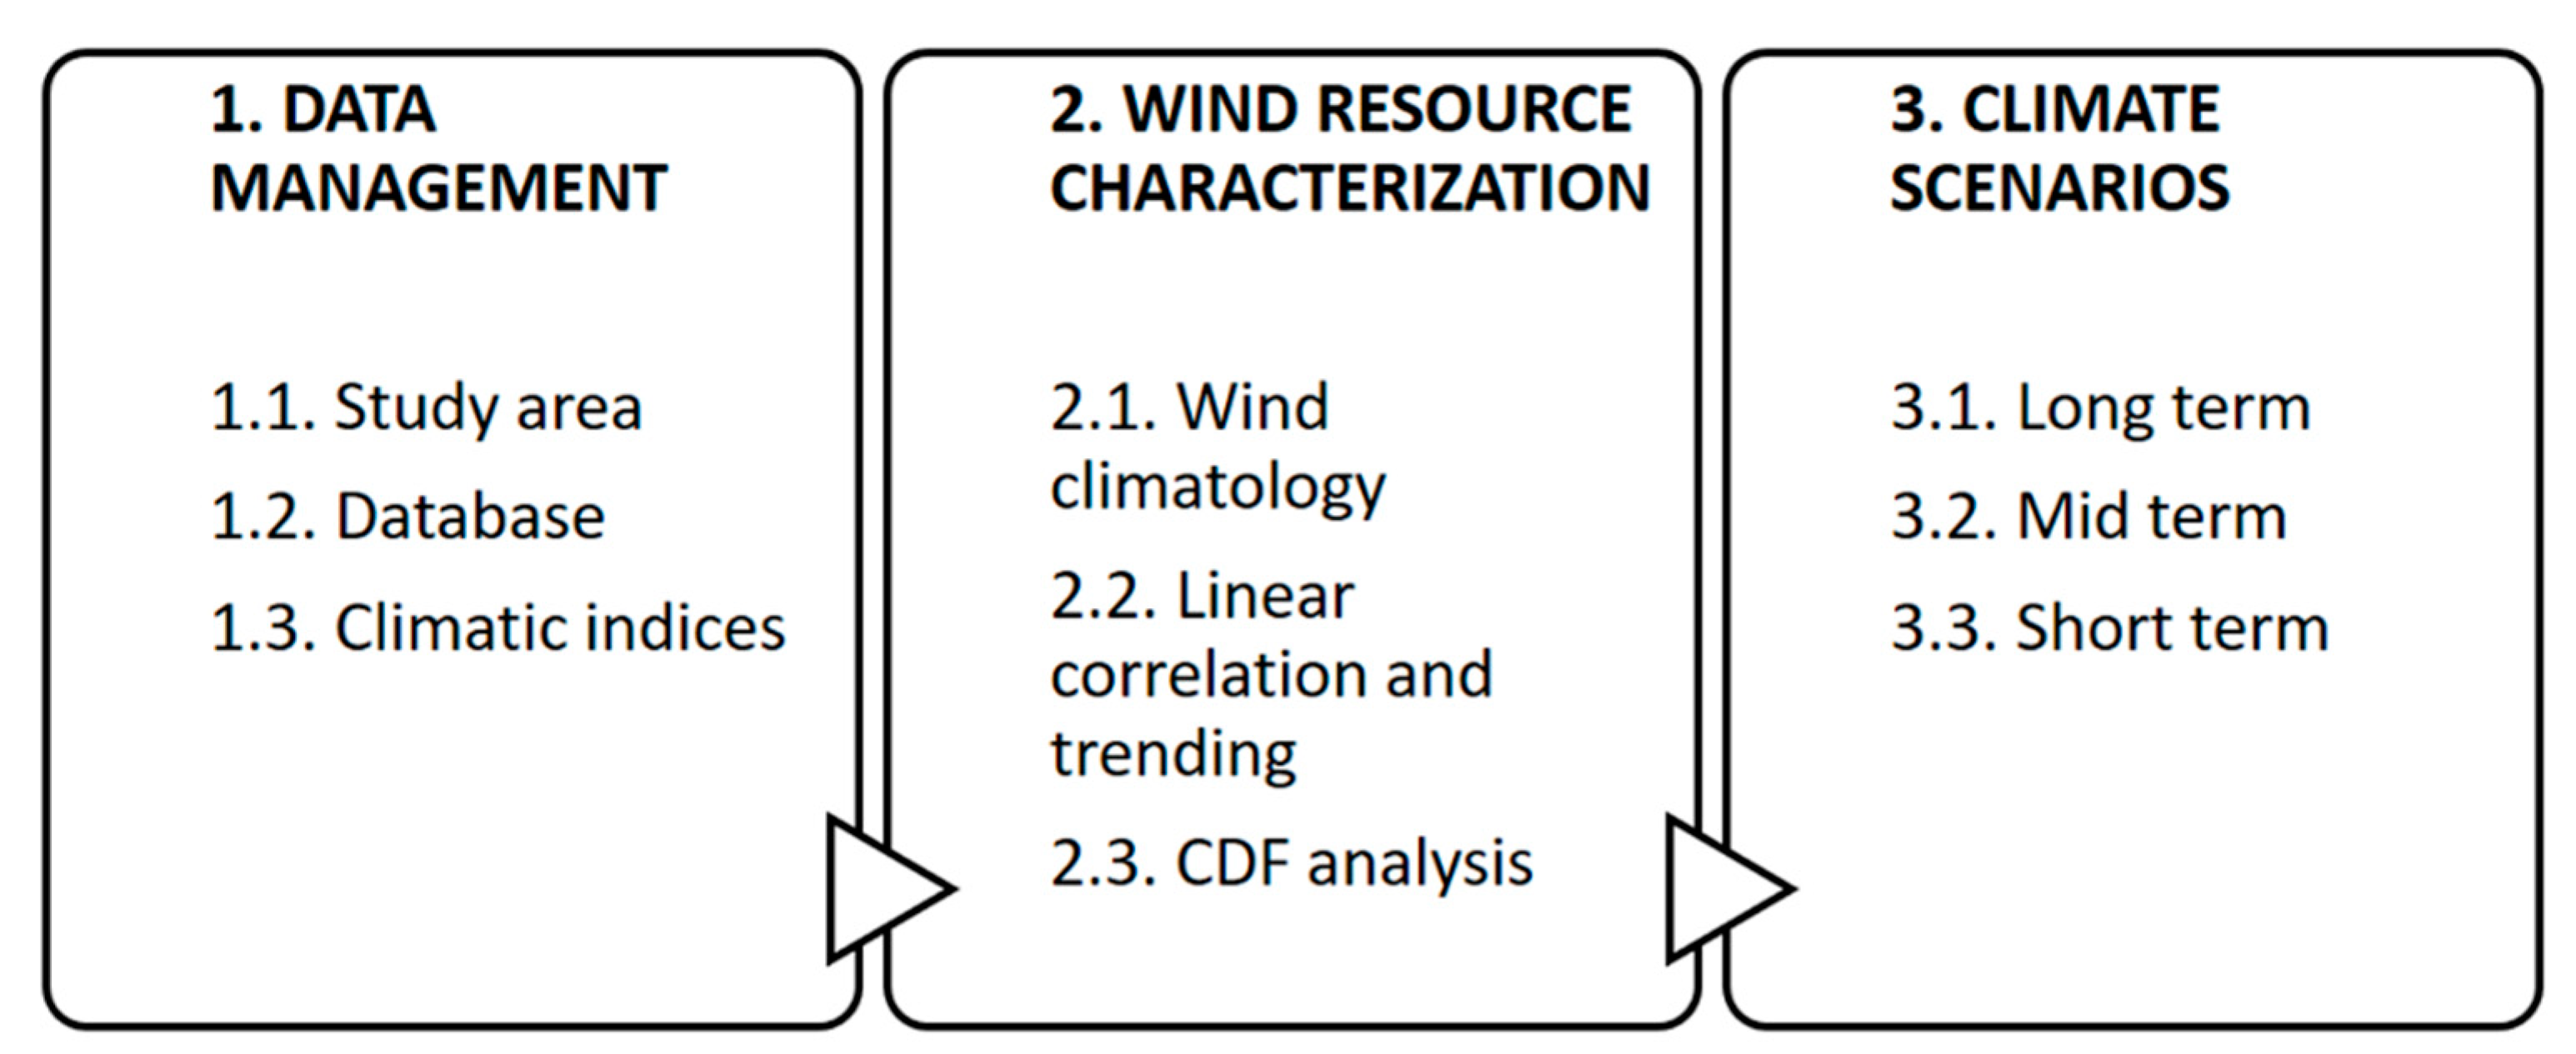
2. Materials and Methods

This research established that the identification of minimum values of wind speed is important for the planning of offshore wind projects, considering that cut-in wind speed of wind turbines is between 3 m/s and 3.5 m/s [31,32]. In this sense, the climate variability events reduce the wind speed in the Colombian Caribbean during several time periods, hence it is important to estimate how minimum would be the wind speed and how much time this decrement would persist. The applied methodology in this study is structured in three stages, and aims to identify the effect of the main climate variability events over the wind speed, considering the decrease of wind speed as a negative effect.
In the first stage (Data Management) are described the study area, the wind datasets and the climate indices. In the stage 2, is performed a time series analysis for detecting multiannual trends considering Pearson correlations for verifying association between the lowest wind speeds and the climatic indices. Also, is carried out a space-time frequency analysis of the wind speed through two cumulative distribution functions (CDF). The first CDF considers all the dataset, and the second CDF is generated using the wind speed data below the first quartile (q1, 25%). The second CDF shows in its q1 the lowest wind speed of the time series, hence, this lowest value will be used as a threshold called by this research as Peak Under Threshold (PUT); the PUT will highlight the lowest wind speed in the time series. Finally, in stage 3 the date of occurrence of the identified PUT values are considered for identifying which climate events occurred and how they affected the wind resource in the long-, mid- and short-term scenarios (Figure 1).

2.1. Data Management

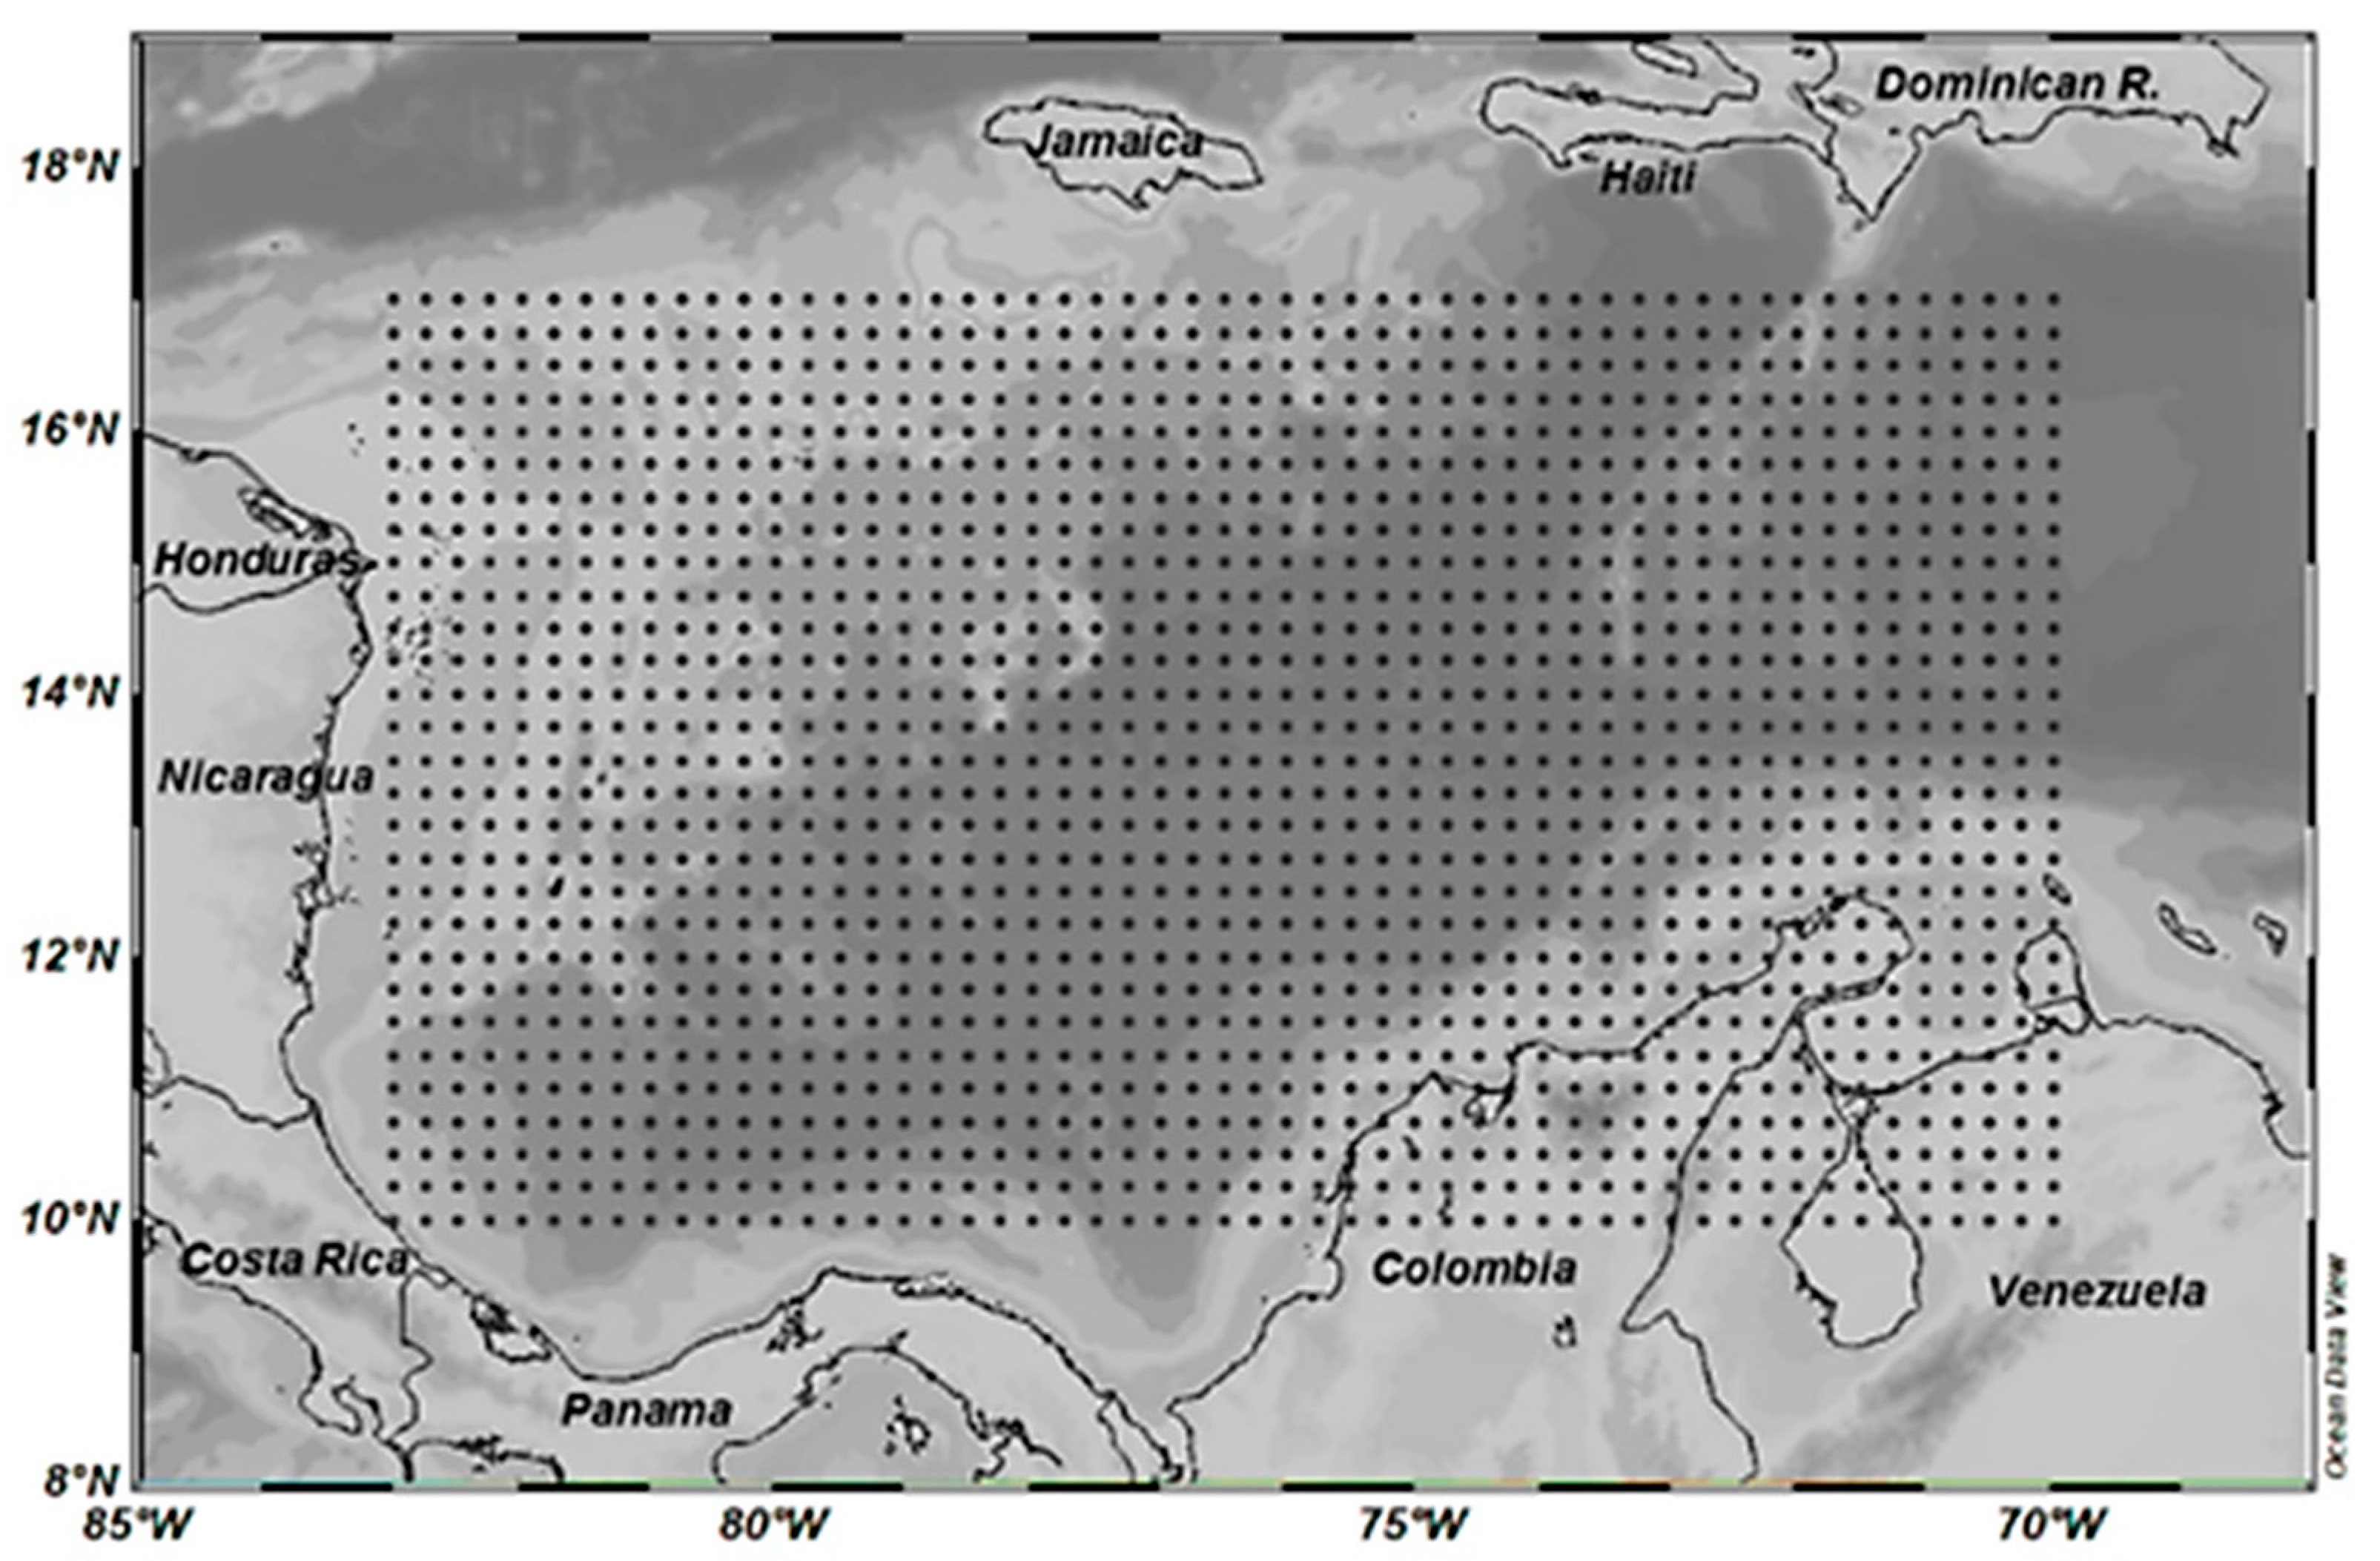
2.1.1. Study Area and Database

The study area is the Colombian Caribbean which borders Haiti, Jamaica and the Dominican Republic in the North, in the South with Panama and Costa Rica, and with Nicaragua and Honduras in the West (Figure 2). To establish the principal features of wind resources in the study area, Reanalysis data from the ERA5 database (https://www.ecmwf.int/en/forecasts/datasets/reanalysis-datasets/era5, (accessed on 22 January 2021)) was used. The downloaded dataset gathers monthly U-V wind data recorded at 761.7 m of elevation (925 hPa), with 31 km of spatial resolution which covers the time period between 1980 and 2019.

2.1.2. Climatic Indices

Previous studies reported that AMO and ENSO are the climate events that widely affect the wind field in the Caribbean [13,23,33]. The extreme phases of ENSO events can be quantified from different indices, one of them is the Oceanic Niño Index (ONI), which is based on sea surface temperature anomalies of the El Niño 3.4 region in the Equatorial Pacific Ocean. To identify a warm period (El Niño) or cold (La Niña), during 3 months must persist a sustained anomaly above-below the 0.5 °C. In this sense, the used sea temperature to calculate the index comes from the Extended Reconstructed Sea Surface Temperature (ERSST.v2) database from the NOAA National Climatic Data Center.
The Atlantic Multidecadal Oscillation (AMO) is an oceanic phenomenon that appears in the northern area of the Atlantic, where ocean temperatures follow a time cycle about 20–40 years for each phase (warm and cold). Throughout this cycle, a maximum and minimum ocean temperatures are registered, therefore since the mid-90s the Atlantic has been in a warm phase. The AMO index is generally defined from the variability of sea surface temperatures in the North Atlantic, where hidden linear trends in the time-series are removed to eliminate the influence of global warming generated by the CO2 emissions. Then, this study used the detrended time series available in the Earth System Research Laboratory at NOAA (https://psl.noaa.gov/data/timeseries/AMO/ (accessed on 23 December 2020)). Also, the monthly SST anomaly imagery from NOAA Environmental Visualization Laboratory (NNVL) was used to evaluate the contrast between the Equatorial Pacific and Caribbean temperature anomalies (https://www.nnvl.noaa.gov/view/globaldata.html#SSTA (accessed on 25 February 2021)) in the short-term scenario.

3. Results

This section comprises the space-time characterization of the wind speed and a frequency analysis to detect the lowest wind speeds between 1980 and 2019.

3.1. Wind Resource Characterization

In the Caribbean the maximum wind speed (>12 m/s) at 761.7 m (950 hPa) of elevation occurs during July and February, known as the summer and winter of the CLLJ [15], hence, this wind value was selected as reference to analyze the monthly spatial distribution within the climatology (1980–2019).

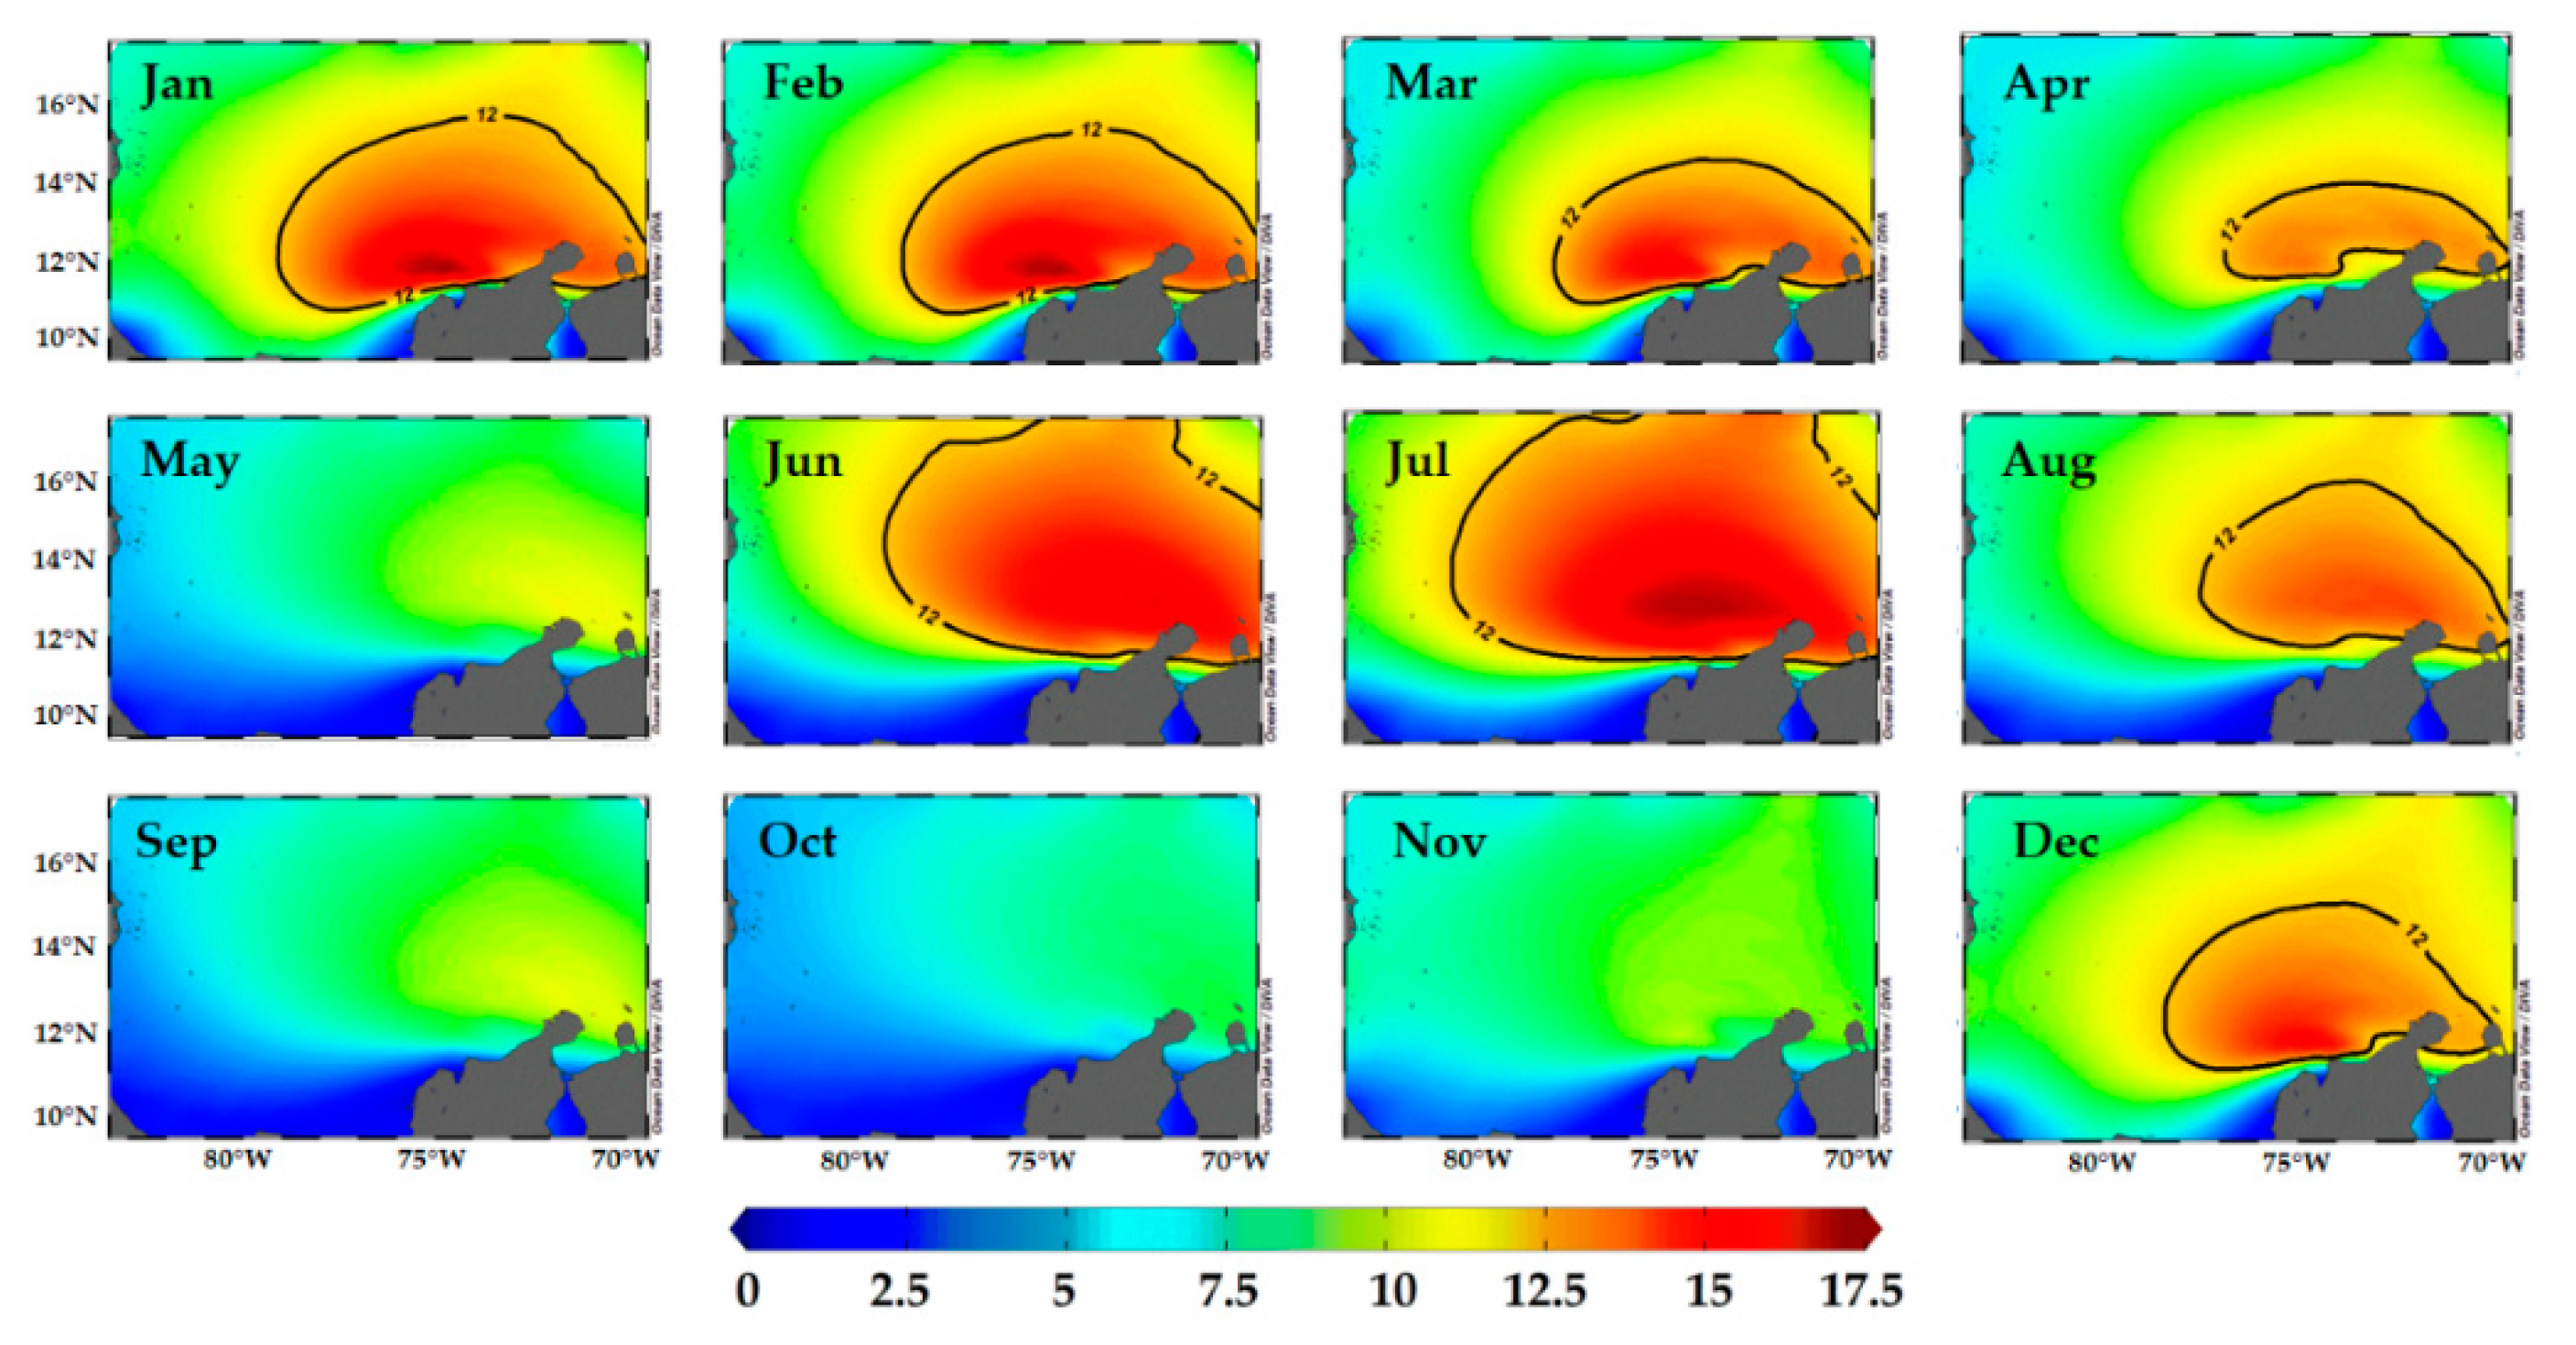
3.1.1. Wind Climatology

The wind climatology of the Colombian Caribbean is shown in Figure 3, where the highest wind speeds were registered in winter (December to February) and summer (June to August), and the lowest wind velocities occurred in autumn (September to November) and spring (May). To delimitate the extension and spatial distribution of the CLLJ in the Caribbean, which represent the wind field in the study area, it was plotted a contour line with the iso-value of 12 m/s. The contour graphs evidenced that the CLLJ shows its maximum extension during July and disappears till November (Figure 3), hence, during these months the wind field is weakened because the ITCZ is over the Caribbean.
The CLLJ’s core is represented by the maximum wind speeds of 17.5 m/s (red contour), where this core during January–February is located in front of the Atlántico and Magdalena departments nearby to the Colombian Caribbean coast (11.75° N, 75° W). The CLLJ’s core decreases from March until May, increasing again its magnitude between June and July and migrating toward 12.75° N–74° W in the north of the Colombian Caribbean coast (La Guajira department). The two aforementioned time periods which showed the increment of the CLLJ’s core, correspond with the drought season of the Caribbean, same periods when the ITCZ is located over the Pacific. Appendini et al. [34] found a similar behavior, which the location of the core of maximum winds of February (12° N, 74.5° W) moved to the north in July.
Several studies contributed to the understanding about the changes of maximum wind speed of CLLJ. Costoya et al., reported that during July and February, the CLLJ is a regional amplification of the tropical North Atlantic easterly winds, meanwhile Cook and Vizy wrote that a strong-weak CLLJ is associated with the decrement-increment of rainfall over the Caribbean Sea [12,35]. The wind fields of CLLJ of this study agrees with the research of Amador [33], where the period between September and November depicts the lowest wind speeds of the CLLJ which ease the convective processes and triggering rainfall along the Caribbean. In technical terms, the months with high wind speed could provide the maximum amount of energy to the Colombian energy system, while the months with the lowest values can be used for the wind farms’ maintenance and repair [19].

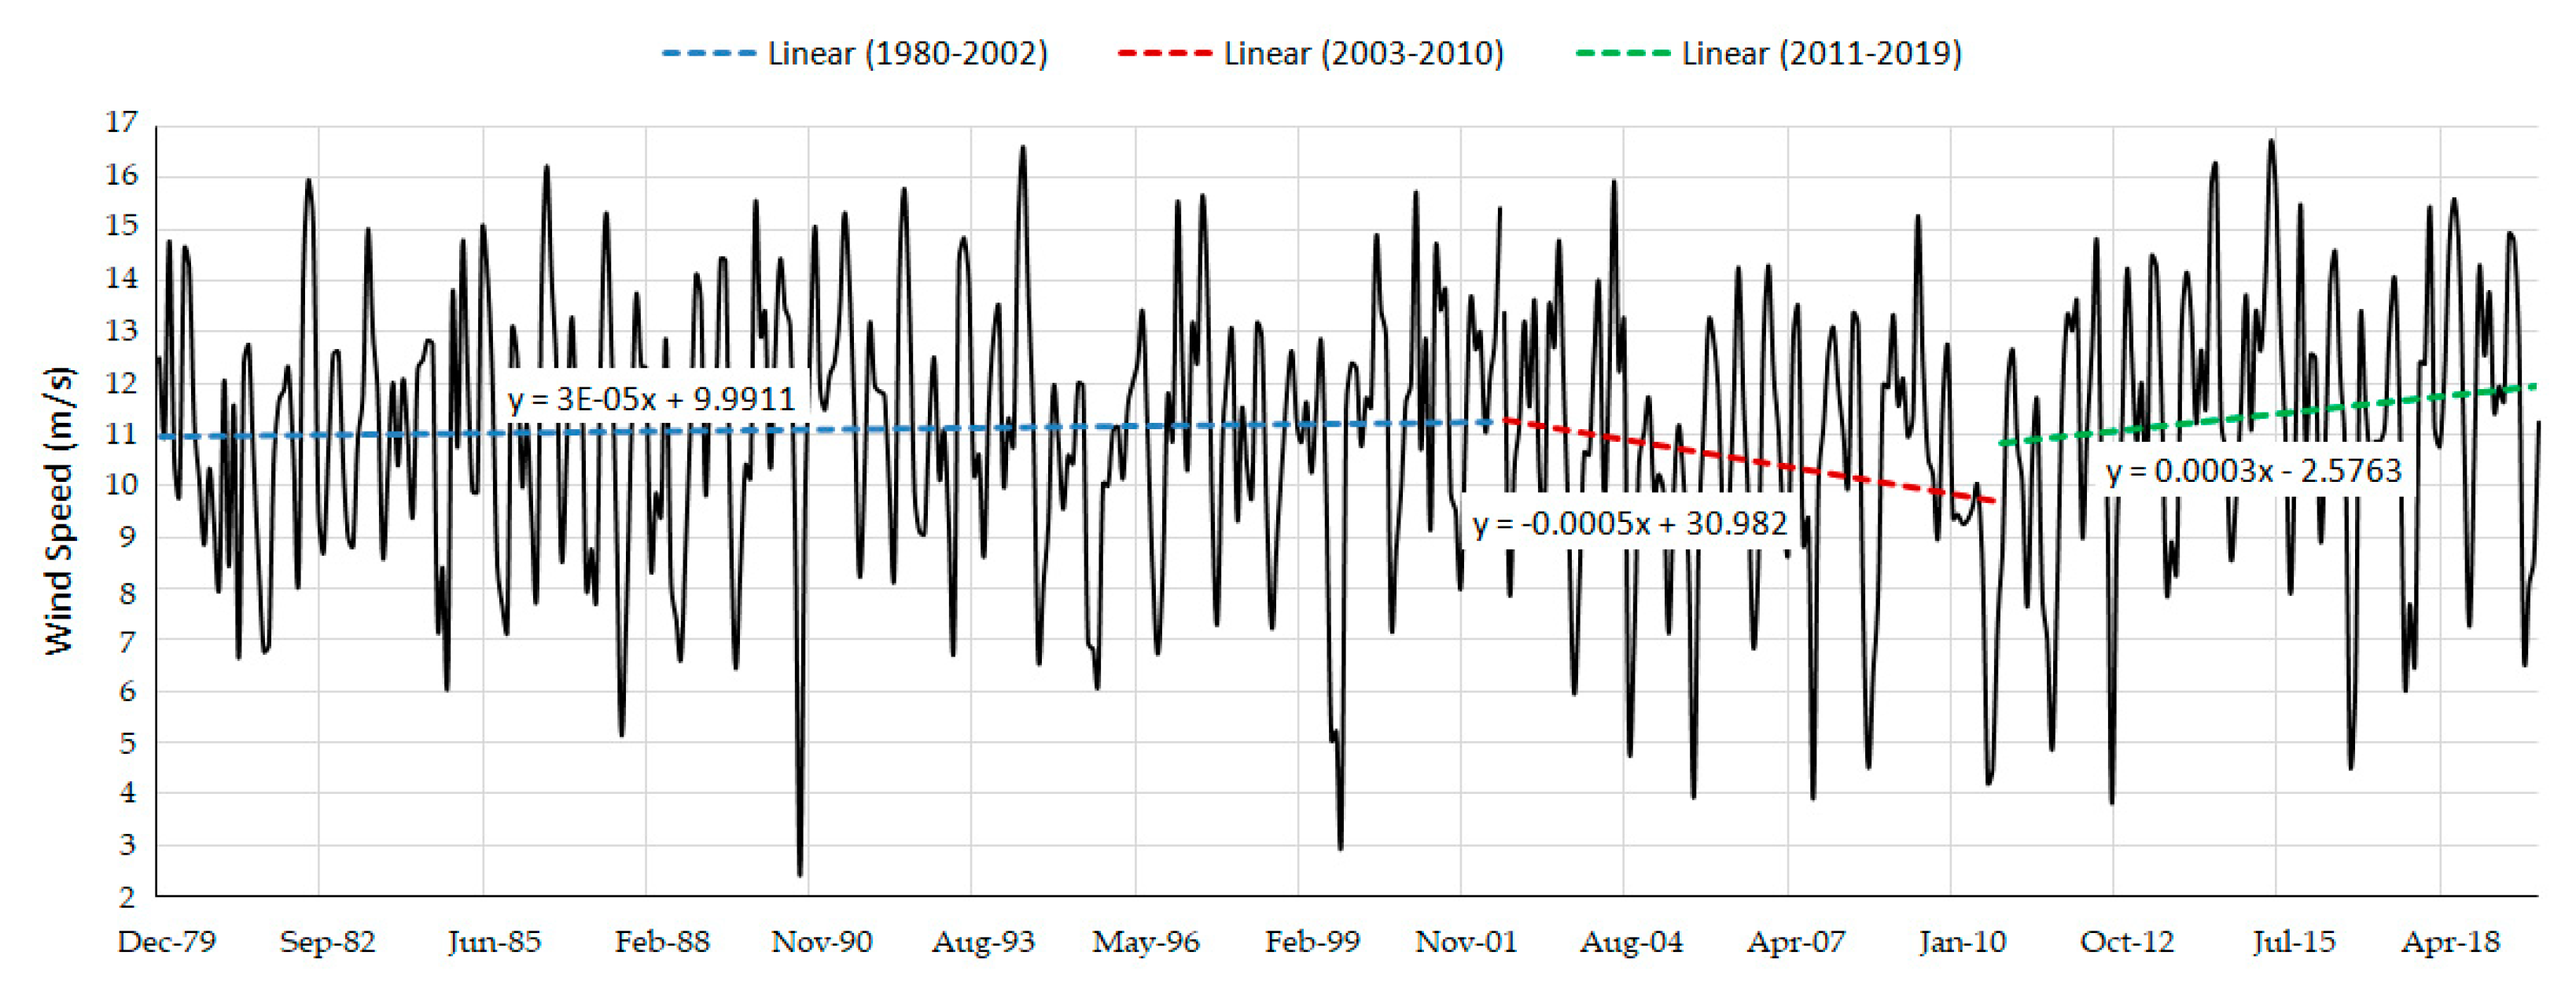
3.1.2. Linear Correlation and Trends
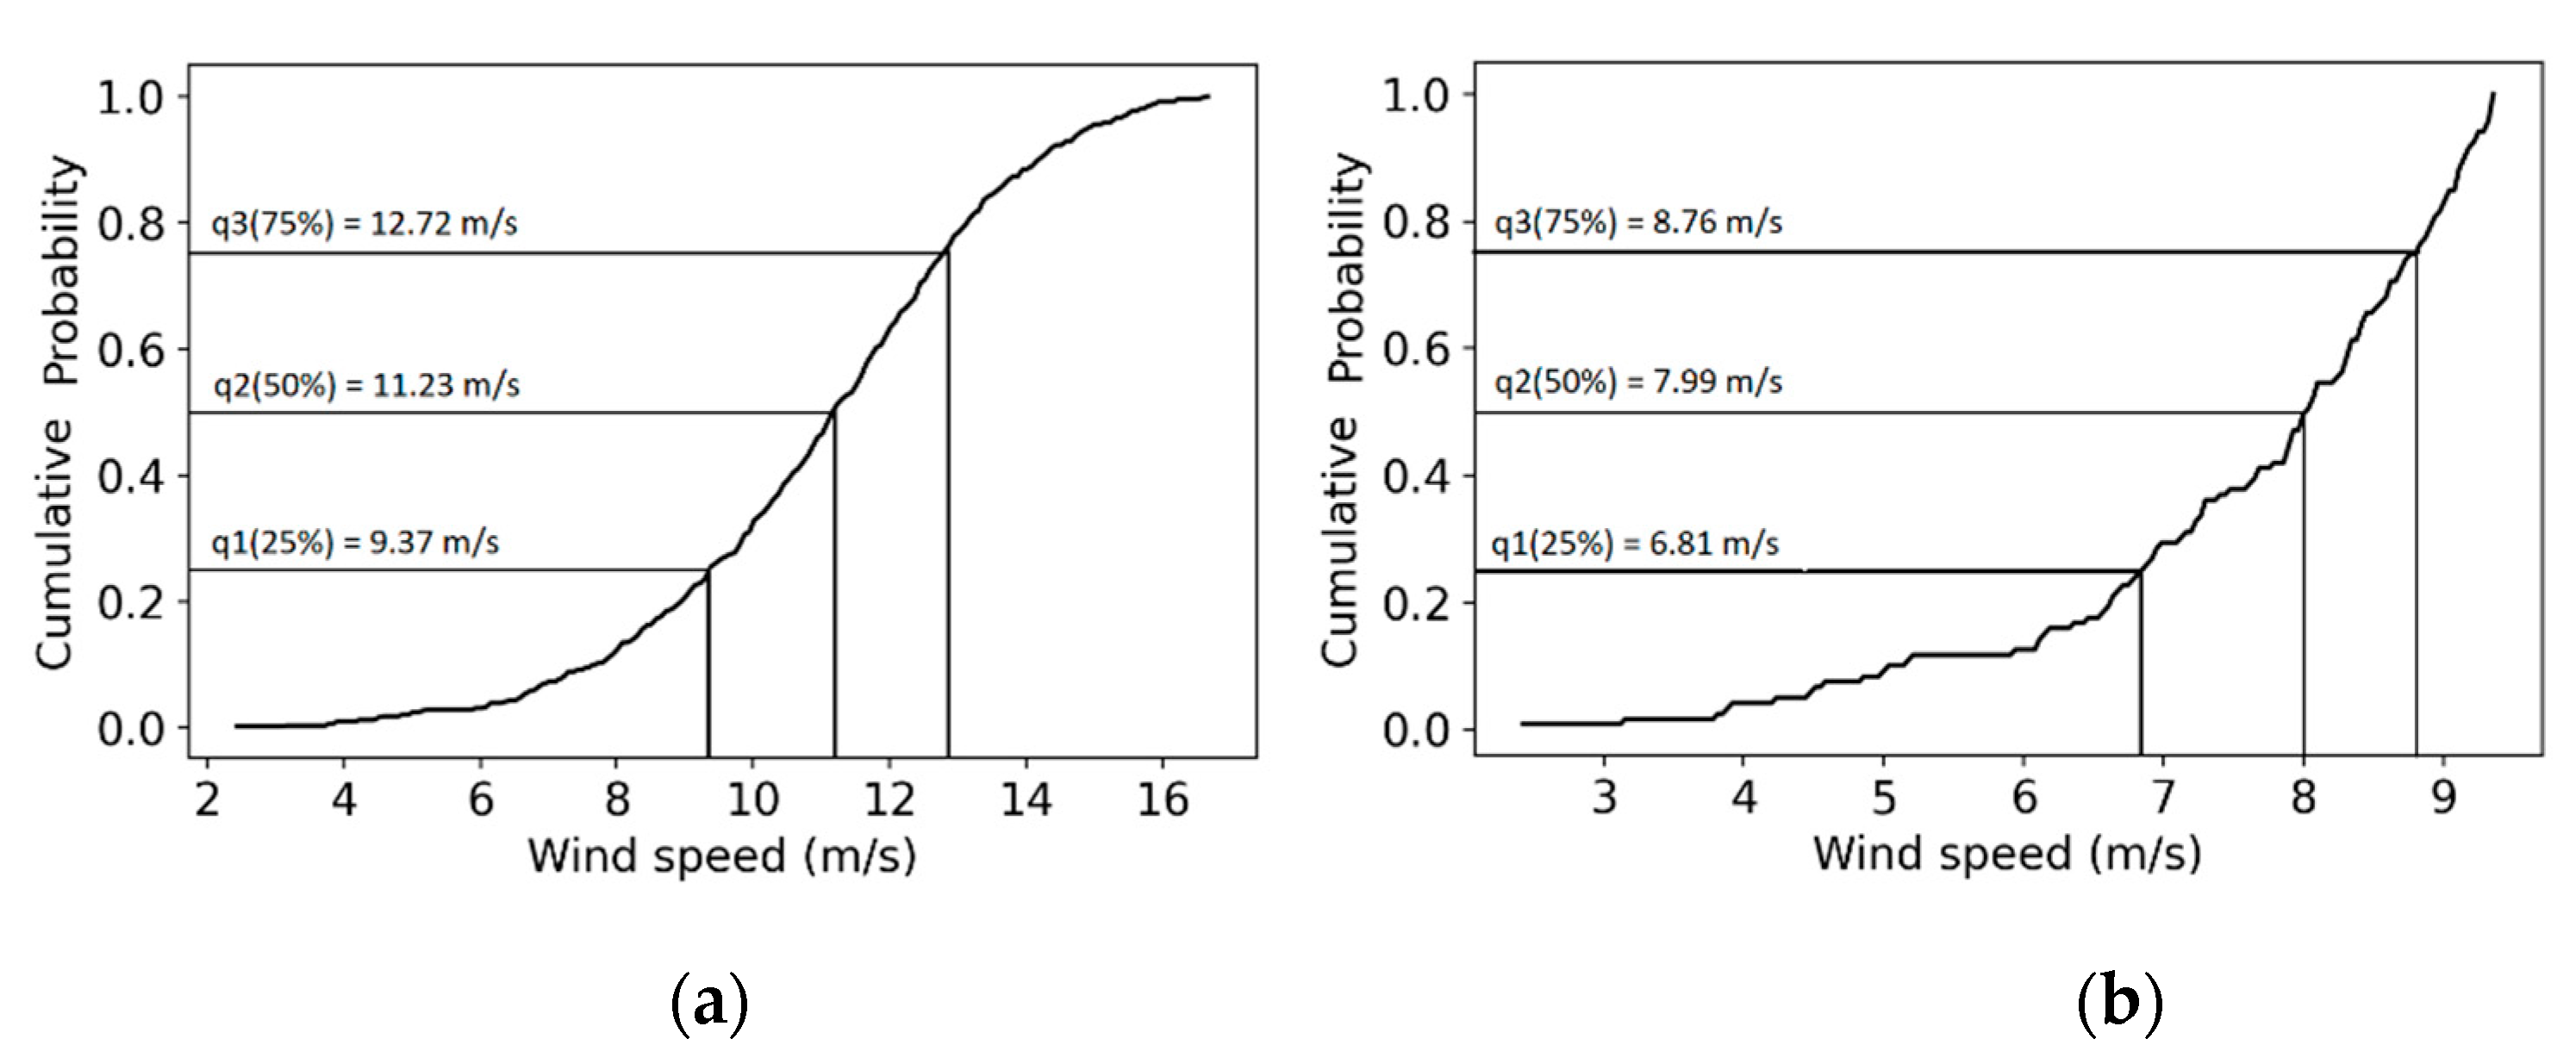
To generate a proper time series for the analysis was used the contour line of 12 m/s of wind speed of July (Figure 3), to delineate the extension of the study area to be extracted and averaged. The generated time series is depicted in (Figure 4) which revealed 3 linear trends of the wind speed behavior between 1980–2019. The time series evaluation using the Pearson’s correlation coefficient showed that the wind magnitude in the area of influence of the CLLJ has a significant positive linear association with ONI (r = 0.16, pvalue < 0.01, n = 480) and a significant negative linear association with AMO (r = −0.15, pvalue < 0.01, n = 480). The aforementioned can be interpreted as follow: the wind speed rises during El Niño events (positive ONI) and decreases when La Niña events occur (negative ONI). On the other hand, the wind speed increases during the negative phase of the AMO and decreases in its positive phase.
The generated time series also showed three trends along the time period. From 1980 to 2000, it was observed a positive trend with annual increments of 0.012 m/s. After the 2000 to 2010 occurred two strong La Niña events (2007–2008 and 2010) reported by the Climate Prediction Centre (CPC) of NOAA, (https://origin.cpc.ncep.noaa.gov/products/analysis_monitoring/ensostuff/ONI_v5.php (accessed on 4 February 2021)), hence, the negative trend of −0.19 m/s per year for this decade is an evidence of La Niña effect over the study area. Also, a significant positive correlation was found between wind speed and La Niña events marked by the ONI (r = 0.23, pvalue < 0.01, n = 123). In this sense, Zheng et al., informed that 2010 showed anomalously low wind speeds in the Caribbean, which generated a relatively bad year for the wind energy production; this decrease of wind speeds in the Colombian Caribbean coast during 2010–2011 was also reported by Bastidas-Salamanca and Rueda-Bayona [16,32]. From the 2010 to 2019 a positive trend is depicted again, with a higher slope of 0.11 m/s per year compared to the observed trend during 1980–2000, then, strong La Niña events have a negative impact over the CLLJ wind speed, changing the positive trend observed in the two above mentioned decades.

3.1.3. CDF Analysis

After the time series analysis of the CLLJ’s wind field in the Caribbean, the frequency analysis of the wind speed dataset was performed. This analysis provided information to determine the probability that a wind speed will be greater than a certain value, which is important because the identification of thresholds helps the offshore projects planning. The second quartile (50%) of the CDF curve (q2) showed winds higher than 11.23 m/s, which exceeded the half of the observation time (Figure 5a). The first quartile (q1) which limits the lowest wind speed records of CDF, reported velocities about 9.37 m/s. Then, all the values recorded below the q1 are considered critical for the cut-in speed of the wind farms. As a result, a new CDF curve was generated only with the wind speed records less than 9.37 m/s, hence, the new q1 (q12) showed 6.81 m/s of wind speed (Figure 5b).
The wind speed value of the new q1 was selected as a threshold for the time series (1980–2019) to identify the dates with the lowest wind velocities, therefore, the values under the second q1 were identified as the Peaks Under Threshold (PUT) gathered in Table 1. As a result, 28 PUT’s values were found and most of them were registered in September and October, which evidence the wind speed decrement of the CLLJ’s core because of the ITCZ.
In Table 1 are listed the lowest wind speed records identified by the PUT, and the associated index of the most relevant climate event for the study area (ENSO, AMO). The blue and red numbers of ONI correspond to La Niña (cold) and El Niño (warm) events, and the AMO’s blue and red numbers represent the negative and positive phase of the event respectively. The association of the lowest wind speed records with the ENSO and AMO will be analyzed for the short, mid and long terms in the following Climate Scenario section.

4. Discussion

4.1. Climate Scenarios

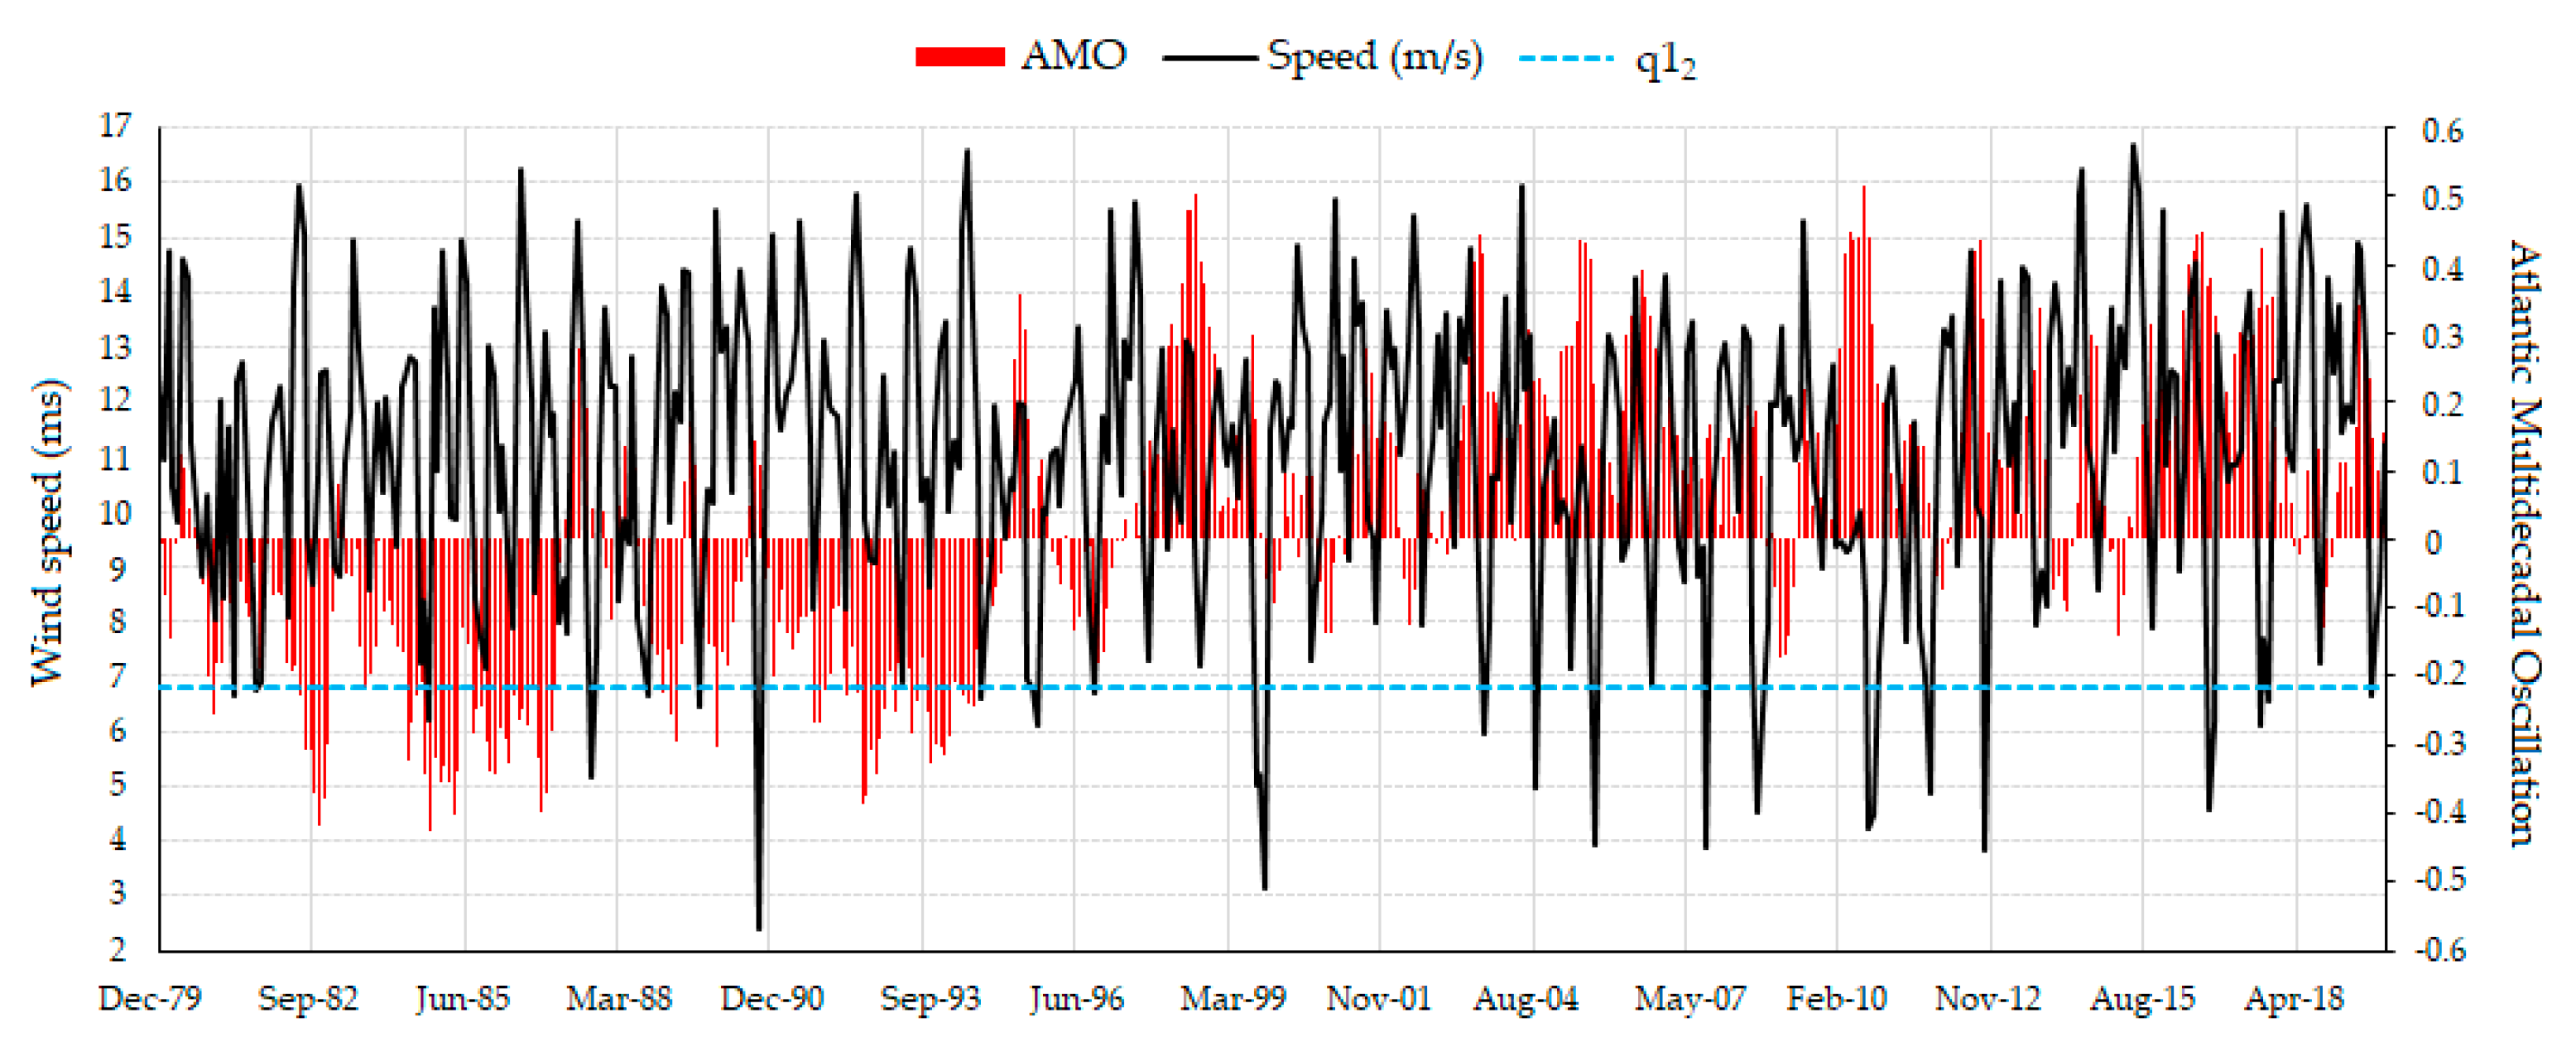
4.1.1. Long-Term Scenario: AMO

The wind speed time series evidenced that the lowest wind speeds (LWS) identified by the PUT were most frequent during the positive phase of AMO corresponding to the period between mid-1997 to 2019, which can be seen through the values below q12 = 6.81 m/s of Figure 6. From the 28 identified PUT values (Table 1, Figure 6), 20 LWS were found in the positive phase and 8 in the negative phase, which corresponds to a 71% and 29% of probability respectively. Nevertheless, in the negative AMO phase the lowest LWS value (2.403 m/s) was recorded and the LWS values in the positive phase were around 4 m/s. In this sense, the negative AMO phase could be considered more critical for the offshore wind farm planning because the wind speed might be below of the cut-in velocity of 3 m/s. Chang and Oey showed that seasonal wind speed fluctuations in the Caribbean have increased near the 1994, when the AMO shifted from negative to positive phase [36]. The Figure 6 revealed high fluctuations of wind speed during the AMO positive phase and the lowest values of wind magnitude during the negative phase.
If the wind resource is not temporarily constant (winds with high variability), the fluctuations will provoke voltage variations during the electricity generation of wind farms. Hence, frequent wind gusts and hourly variations of wind speed will affect the generated power [37].

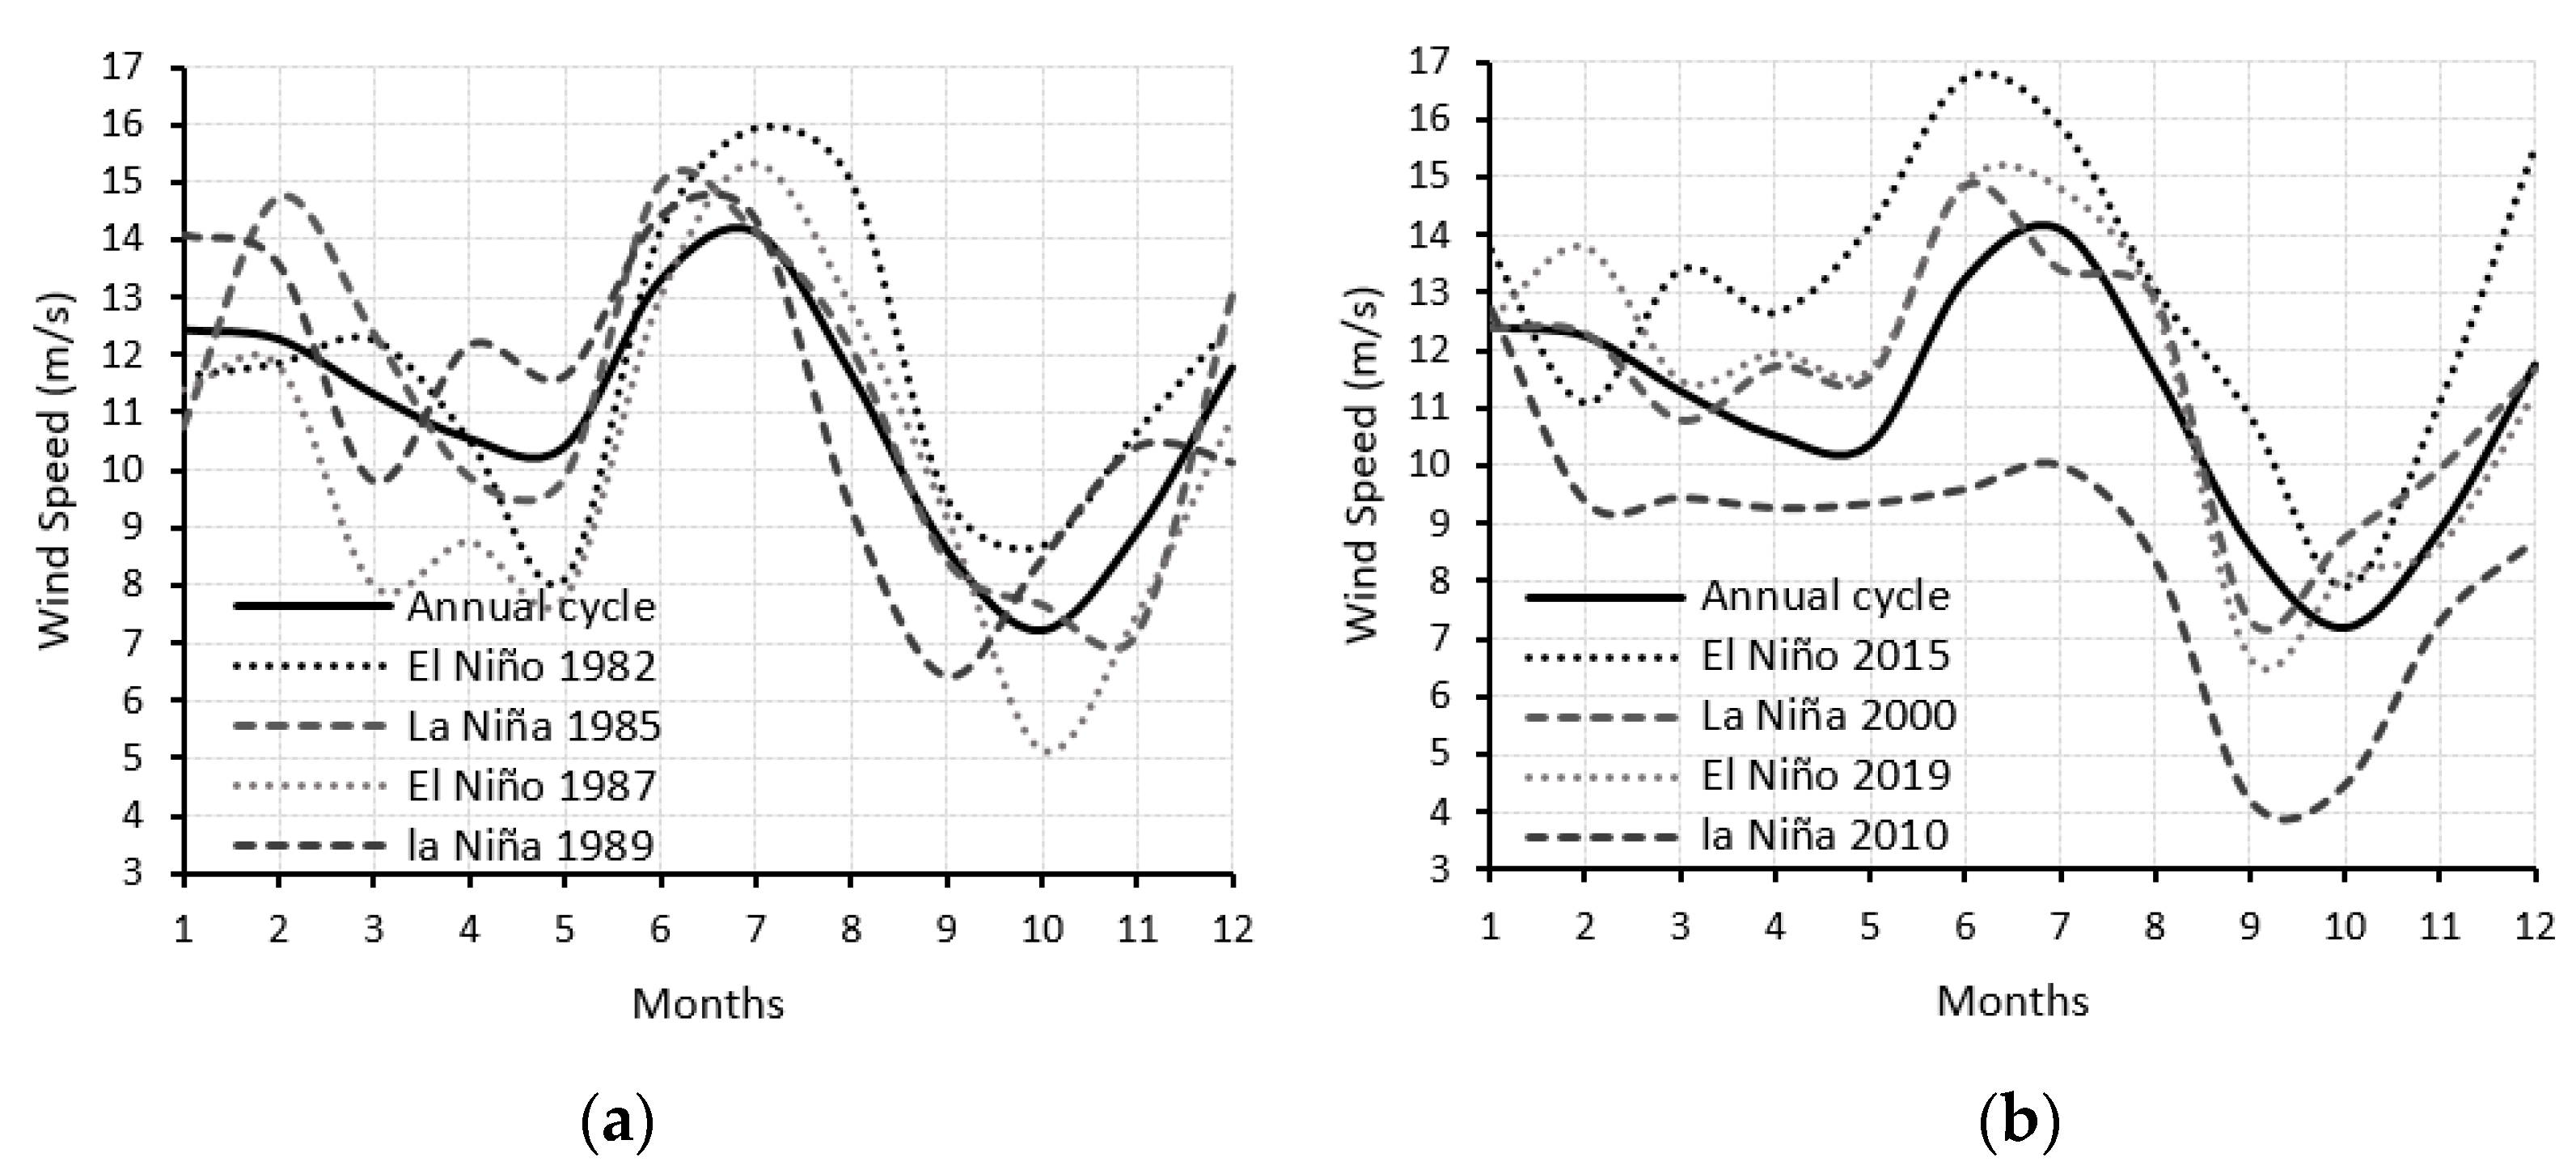
4.1.2. Middle-Term Scenario: AMO + ENSO

Half of the identified LWS by the PUT occurred during La Niña events and only 3 of them were registered during the El Niño events. Then, was necessary the analysis of the annual cycle among the years when the ENSO events occurred. As a result, the annual cycle showed a semi-annual variation (Figure 7), with two maxima in summer (July) and winter (January) and two minima in the autumn (October) and spring (May). For the AMO negative phase, two La Niña events (1985, 1989) and two El Niño events (1982, 1987) were analyzed (Figure 7a). The comparison revealed that during La Niña, the maximum wind speed (14–15 m/s) occurred in winter and summer, and the El Niño provoked a more deviation of wind speeds, showing the minimum (5 m/s) and maximum (16 m/s) wind speed values.
For the AMO positive phase analysis were selected two La Niña events, the 2000 as the longest and the 2010 as the strongest, similarly for the two El Niño events of 2015 (strongest) and 2019 (longest) seen in Figure 7b. The results evidenced that La Niña of 2000 reduced the wind speed below the mean annual cycle with a low wind speed of 4 m/s registered in September. Contrary, the El Niño event of 2015 showed the highest wind speeds close to 17 m/s in June.
These results reflect that the annual cycle of the winds changes with the occurrence of ENSO events combined with the AMO phases, where the positive AMO phase affects the wind speed, with higher winds during El Niño and lower winds during La Niña. These results agreed with the study of Ruiz-Ochoa and Bernal who showed that during El Niño [38], in December to February and March to May, the wind speed of CLLJ’s core is lower, meanwhile, during June to August and September to October the speed is higher. The previous behavior of wind speed during El Niño is opposite during La Niña where the wind speed is higher in winter and lower in summer. The aforementioned by Ruiz-Ochoa and Bernal seems to be correct for ENSO events, but not for negative AMO, because they used an older 1948–2006 database, and did not analyze later climate events in the positive phase as was performed in this study [38]. Similar findings to this study were reported by Wang who found that the correlation with ENSO depends on the season, since ENSO’s teleconnections were different in the winter and summer [13].

4.1.3. Short-Term Scenario: AMO + ENSO + Season

The wind speed changes found during the AMO phases + ENSO events and their association with the semi-annual variability depicted in the annual cycle (Figure 7), pointed that the semiannual signal must be considered for the planning of future wind energy projects. In fact, the LWS values were registered mainly in the second semester, between the months of September and October. The association of LWS with ENSO evidenced that when the LWS in October 2011 occurred during La Niña, the Pacific experienced lower SST and the Caribbean was anomalously warm (Figure 8a).
This study found that September 2010 reported a LWS on the same date reported by Bastidas Salamanca and Figueroa Casas [39], with warm SST anomalies in the Caribbean and cold in the tropical Pacific. Also, September 2010 and October 2011 were characterized by low wind speeds and heavy rains due to La Niña event of 2010–2011, affecting to Colombia with electric storms, floods, and landslides [40]. The previous climate scenario agrees with the findings of Giannini et al. [41], who shown that the precipitation over the Caribbean Sea was strongly influenced by SST anomalies of the AWP and the eastern tropical Pacific. Because of the location of the Caribbean along a relatively land-free tropical strip, the interannual variability of the rainy season is influenced by the Atlantic Ocean [42]. During El Niño of October 1987 (Figure 8b), the tropical Pacific showed high SST anomalies (warmer than usual) and the Caribbean evidenced neutral-negative anomalies of SST (cooler than normal), what could have reduced the kinetic energy of wind fields provoking the LWS identified in this study for the same date (Table 1, Figure 6).
Regarding to short-term wind field in the Caribbean, it was observed the changes in magnitude and distribution of the CLLJ were the delimiter of the 12 m/s contour line (Figure 3), and the displacement of the CLLJ’s core evidenced the time-space variability of the wind resource, allowing to visualize how the wind resource changes and could affect the electricity generation of the offshore wind farms. Also, this study identified two different behaviors in the wind annual cycle: La Guajira department has its maximum in July, while in Atlántico department the maximum occurs at the beginning of the year, similar to the findings of Rueda-Bayona et al., [19]. During the months of LWS when the rains predominate (May and October) the CLLJ’s wind field depicts wind speeds below the 12 m/s with a weakened and unclear core.
Knowing the effects of short-term variability (within the year) because of the seasons, between 3 to 5 years due to the ENSO events (mid-term), or the effect of AMO during long-term periods (more than 10 years), allows us to understand the dynamics of the offshore wind energy resource. As a result, considering the effects of climate variability and natural phenomena over the wind field in the Caribbean will ease the planning and development of sustainable new offshore projects. In this way, the analysis presented here addresses the availability definition of the 4A’s concept, where the results of this research contribute with information of to the availability of wind resource in several time scales. In Colombia, there are several challenges to address the other 4A’s dimensions, for example, APERC mentioned several issues that limit the accessibility to the renewable energy: the lack of financial subsidization, scarce commitment to promote the use of renewables and the access to affordable technology [7]. Also, Edsand [43] reported that the insufficient knowledge base and political support for developing new wind energy projects in Colombia is an important barrier for the development of this renewable. Also, the implementation of offshore wind projects in Colombia will require important changes within the administrative and legal framework because actual normative and procedures are guided to traditional energy technologies (hydro, solar, onshore wind) (Rueda-Bayona et al., 2019b).
Sustainable wind energy projects consider a stable energy supply throughout the year guaranteeing a regular conversion efficiency [12], hence, understanding the relative offshore wind power prospects and contingencies, is especially important in the forthcoming years to propitiate investments decisions in the wind sector [44]. Then, relevant parameters to consider for closing the gap of unprofitability are the decommissioning costs, the load factor and costs of operation and maintenance [45].
The evaluation of the wind speed time series (1980–2019) in this research, reported a negative trend of wind speed in the first decade of the year 2000, a period that was marked by two La Niña events (2007–2008 and 2010). In the time series were identified 28 LWS records, most of them occurred in September and October, which matches approximately when the AMO turned from cold to warm phase. Also, half of the LWS values occurred during La Niña events and only 3 of them occurred during El Niño events.

5. Conclusions

The availability of the wind resource is a topic of interest for the energy security, then, identifying the effect of short, mid, and long climate variability events over the wind speed is important for the electricity generation. The Caribbean Sea depicted high potential for the offshore wind power development due to high persistence and magnitude of wind speeds. In the short term, the presence of CLLJ in the winter and summer seasons comprises high wind speed about 12 m/s, however, the CLLJ is affected by longer climate events such as the AMO and ENSO events. The 12 m/s contour line delimited the presence of the CLLJ over the Caribbean Sea, which shows its maximum extension in July (followed by June, January and February). The 12 m/s contour line disappears in May, September, October and November which shows the absence of CLLJ in the study area, hence, during these months the winds exhibit low wind speed values because of the effect of the ITCZ. In this sense, this study lists the most important features of the effect of the climate variability events over the wind speeds in the Caribbean Sea:
  • Long-term scenario (AMO), showed that from the identified 28 LWS values along the time series (1980–2019), 20 (71%) were found during AMO positive and 8 (29%) in AMO negative. The lowest LWS (2.403 m/s) occurred during positive AMO. The wind speed increases in the negative phase of the AMO and decrease in its positive phase. The largest fluctuations in the wind magnitude were found during the positive phase, but the lowest values were recorded during the negative phase.
  • Middle-term scenario (AMO + ENSO): the second lowest LWS (3.140 m/s) retrieved from the time series occurred during a positive AMO combined with La Niña event (nov-99). A significant positive correlation was found between wind speed and La Niña events during the AMO positive phase.
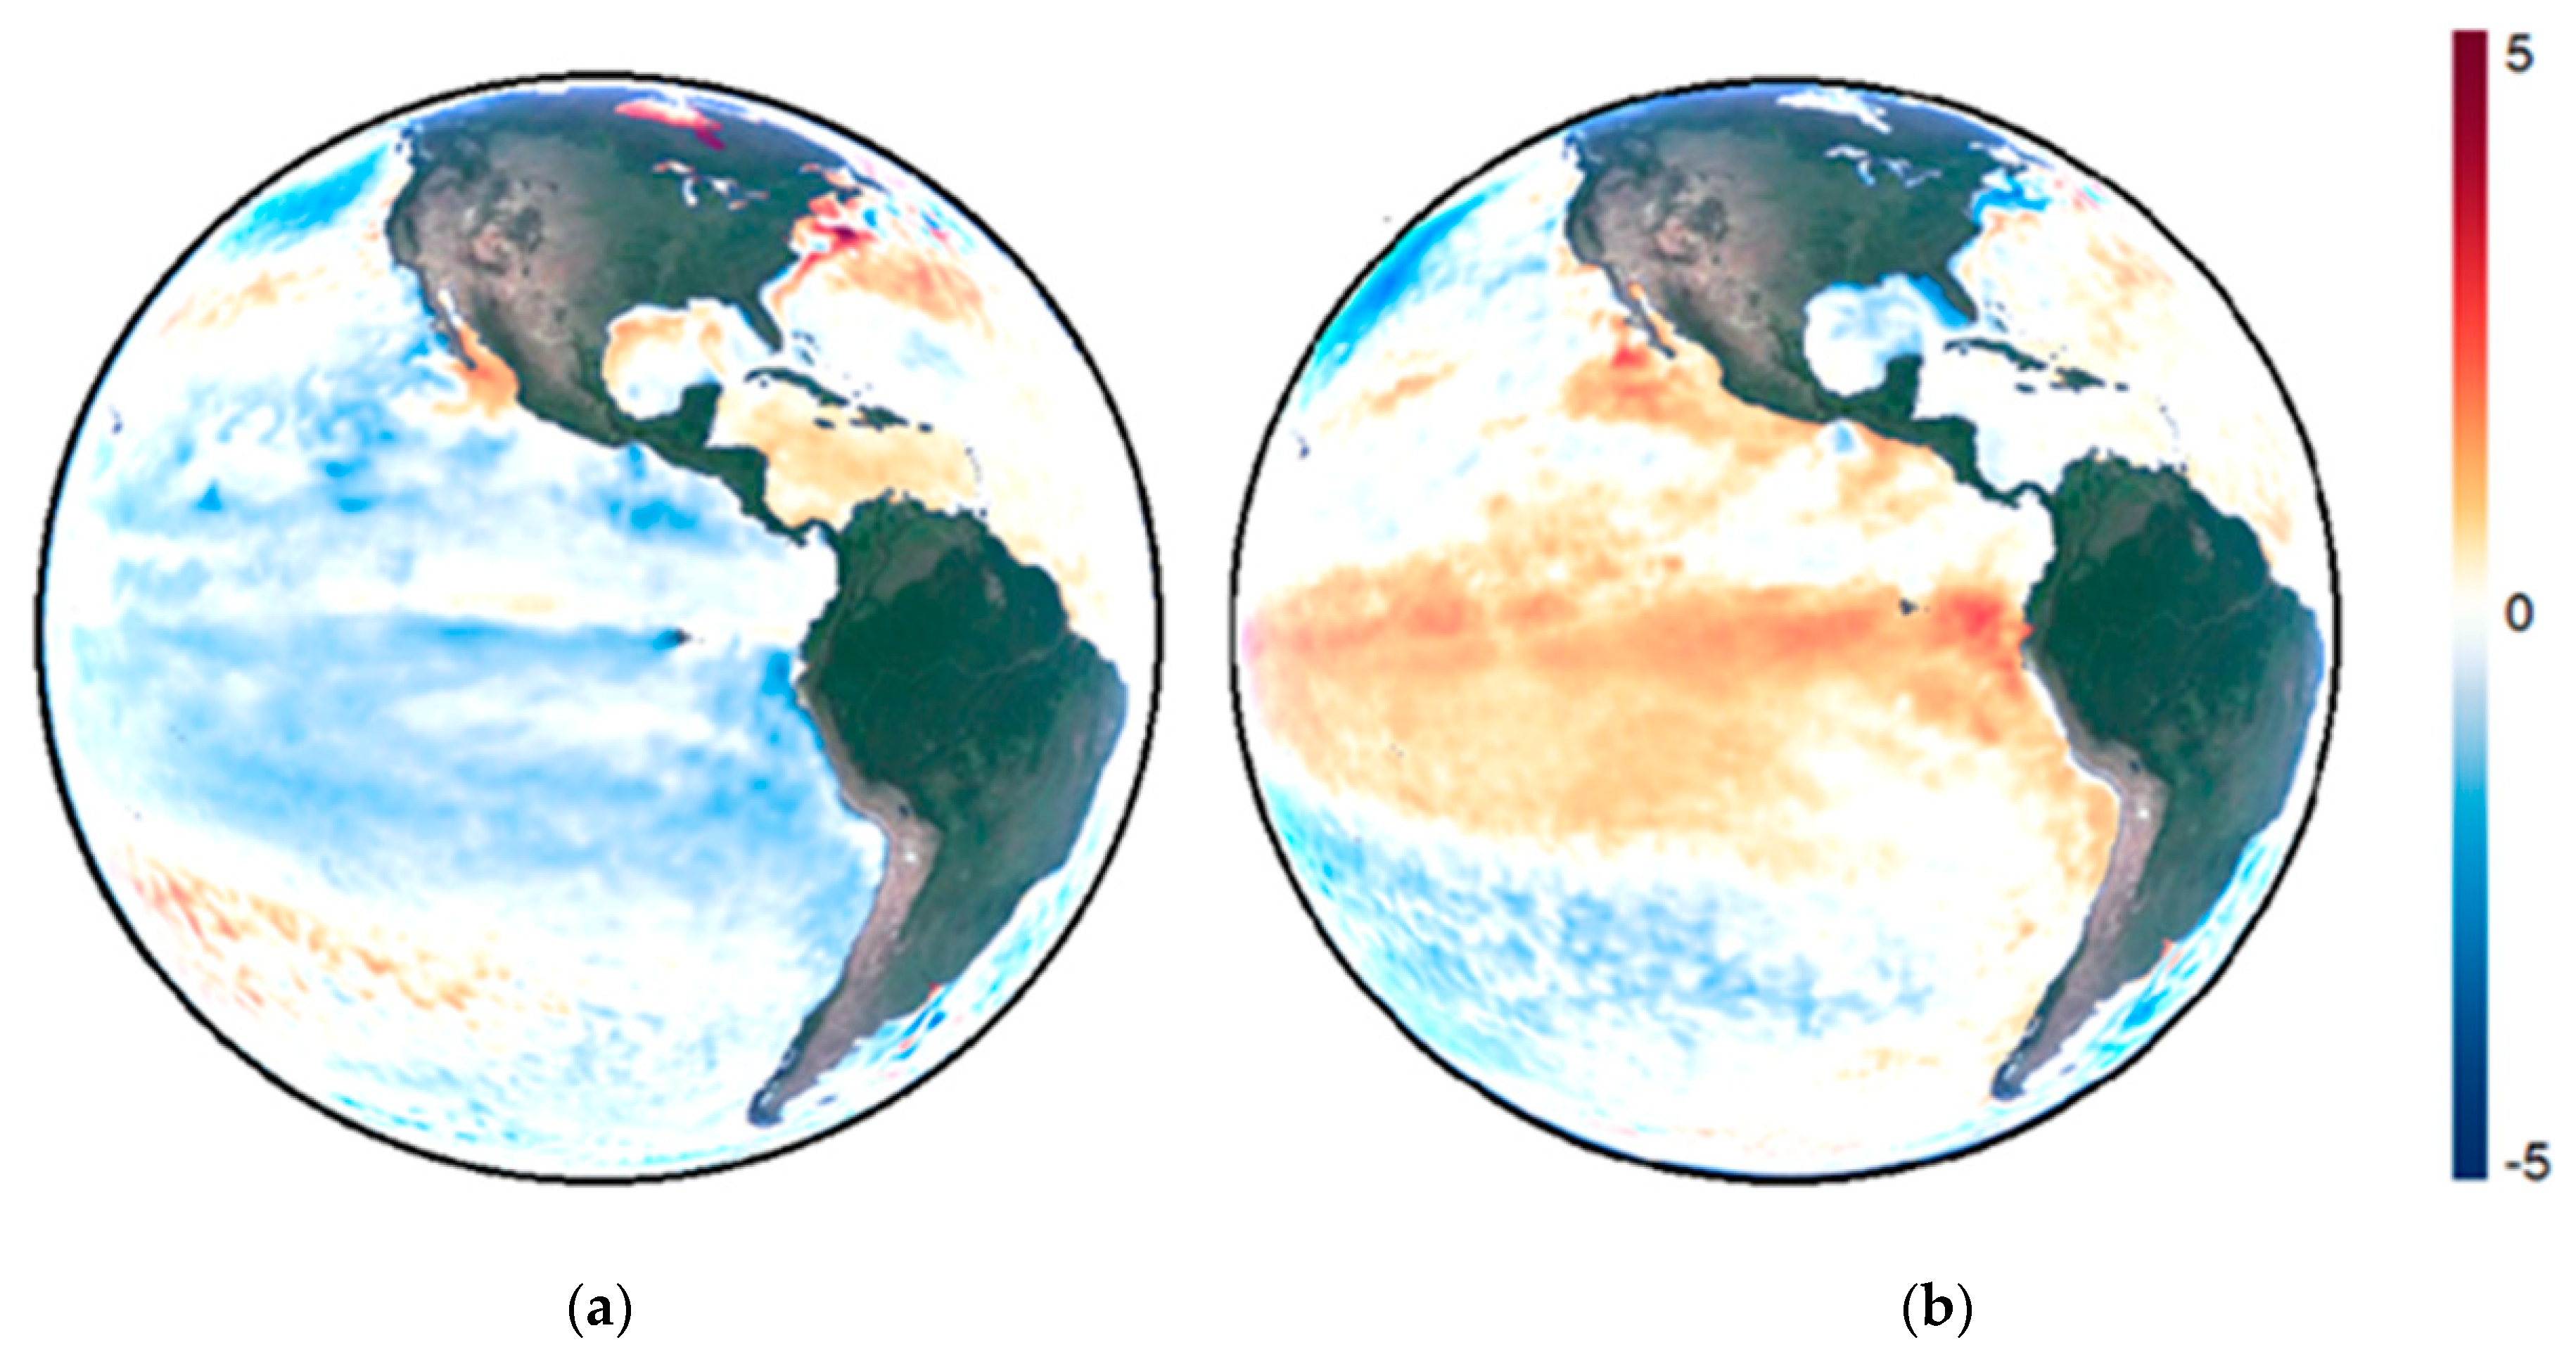
  • Short-term scenario (AMO + ENSO + season): the positive anomalies of SST in the Caribbean, and low SST in the tropical Pacific due to La Niña (2011) reduced the wind speed of the CLLJ.
  • The climatology of the Caribbean winds showed a semi-annual variation, with two maxima in the summer (JJA) and winter (DJF) and two minima in the autumn (SON) and spring (May).
The climate variability analysis of the wind speed in the Caribbean showed that short-, mid- and long-term events generate the lowest wind speed in the study area, and the time series analysis showed that recurrent La Niña events were associated with a negative trend seen during the 2001–2010 years. Hence, this study contributed novel information about the effects of climate events over the wind resource, where the local winds represented by the CLLJ decreased due to the effect of AMO and ENSO events. Finally, the results of spatial and temporal variability of the wind resource shown in this research, may be considered for planning future offshore wind projects, considering the impact of the AMO, ENSO and season over the wind speed behavior.

Author Contributions

Conceptualization, J.G.R.-B. and M.B.-S.; methodology, J.G.R.-B.; software, M.B.-S.; validation, J.G.R.-B. and M.B.-S.; J.G.R.-B. and M.B.-S.; investigation, M.B.-S.; resources, J.G.R.-B.; writing—original draft preparation, J.G.R.-B. and M.B.-S.; writing—review and editing, J.G.R.-B. and M.B.-S.; visualization, M.B.-S.; supervision, J.G.R.-B.; project administration, J.G.R.-B. All authors have read and agreed to the published version of the manuscript.

Funding

This research received no external funding.

Data Availability Statement

All data are contained within the article.

Acknowledgments

The authors thank to the Journal and anonymous reviewers for their time and constructive comments.

Conflicts of Interest

Authors declare no conflict of interest.

References

  1. Cabello, J.J.; Balbis, M.; Sagastume, A.; Pardo, A.; Cabello, M.J.; Rey, F.J.; Rueda-Bayona, J.G. A look to the electricity generation from non-conventional renewable energy sources in Colombia. Int. J. Energy Econ. Policy 2019, 9, 15–25. [Google Scholar] [CrossRef]
  2. Sagastume Gutiérrez, A.; Balbis Morejón, M.; Cabello Eras, J.J.; Cabello Ulloa, M.; Rey Martínez, F.J.; Rueda-Bayona, J.G. Data supporting the forecast of electricity generation capacity from non-conventional renewable energy sources in Colombia. Data Br. 2020, 28, 104949. [Google Scholar] [CrossRef]
  3. Valentine, S.V. Emerging symbiosis: Renewable energy and energy security. Renew. Sustain. Energy Rev. 2011, 15, 4572–4578. [Google Scholar] [CrossRef]
  4. González, J.; Etter, A.; Sarmiento, A.; Orrego, S.; Ramírez, C.; Cabrera, E.; Vargas, D.; Galindo, G.; García, M.; Ordoñez, M. Análisis de Tendencias y Patrones Espaciales de Deforestación En Colombia; Instituto de Hidrología, Meteorología y Estudios Ambientales-IDEAM: Santander, Spain, 2017; ISBN 9789588067483. [Google Scholar]
  5. World Energy Council. World Energy Trilemma Index 2020; World Energy Council: London, UK, 2020. [Google Scholar]
  6. Kruyt, B.; van Vuuren, D.P.; de Vries, H.J.M.; Groenenberg, H. Indicators for energy security. Energy Policy 2009, 37, 2166–2181. [Google Scholar] [CrossRef]
  7. APERC. A Quest for Energy Security in the 21st Century; Asia Pacific Energy Research Centre: Tokyo, Japan, 2007. [Google Scholar]
  8. Cherp, A.; Jewell, J. The concept of energy security: Beyond the four as. Energy Policy 2014, 75, 415–421. [Google Scholar] [CrossRef] [Green Version]
  9. Edenhofer, O.; Pichis-Madruga, P.M.; Sokona, Y. Fuentes de Energía Renovables y Mitigación Del Cambio Climatico; Prensa de la Universidad de Cambridge: Cambridge, UK, 2011; ISBN 9789291693313. [Google Scholar]
  10. Esteban, M.D.; Diez, J.J.; López, J.S.; Negro, V. Why offshore wind energy? Renew. Energy 2011, 36, 444–450. [Google Scholar] [CrossRef] [Green Version]
  11. Pimenta, F.; Kempton, W.; Garvine, R. Combining meteorological stations and satellite data to evaluate the offshore wind power resource of Southeastern Brazil. Renew. Energy 2008, 33, 2375–2387. [Google Scholar] [CrossRef]
  12. Costoya, X.; deCastro, M.; Santos, F.; Sousa, M.C.; Gómez-Gesteira, M. Projections of wind energy resources in the Caribbean for the 21st century. Energy 2019, 178, 356–367. [Google Scholar] [CrossRef]
  13. Wang, C. Variability of the Caribbean Low-Level Jet and its relations to climate. Clim. Dyn. 2007, 29, 411–422. [Google Scholar] [CrossRef] [Green Version]
  14. Wang, C.; Lee, S.K. Atlantic warm pool, Caribbean low-level jet, and their potential impact on Atlantic hurricanes. Geophys. Res. Lett. 2007, 34, 1–5. [Google Scholar] [CrossRef] [Green Version]
  15. Muñoz, E.; Busalacchi, A.J.; Nigam, S.; Ruiz-Barradas, A. Winter and summer structure of the Caribbean low-level jet. J. Clim. 2008, 21, 1260–1276. [Google Scholar] [CrossRef]
  16. Zheng, C.W.; Li, C.Y.; Li, X. Recent Decadal Trend in the North Atlantic Wind Energy Resources. Adv. Meteorol. 2017, 2017, 7257492. [Google Scholar] [CrossRef] [Green Version]
  17. Chadee, X.T.; Clarke, R.M. Large-scale wind energy potential of the Caribbean region using near-surface reanalysis data. Renew. Sustain. Energy Rev. 2014, 30, 45–58. [Google Scholar] [CrossRef]
  18. Rueda-Bayona, J.G.; Guzmán, A.; Eras, J.J.C.; Silva-Casarín, R.; Bastidas-Arteaga, E.; Horrillo-Caraballo, J. Renewables energies in Colombia and the opportunity for the offshore wind technology. J. Clean. Prod. 2019, 263, 121584. [Google Scholar] [CrossRef]
  19. Rueda-Bayona, J.G.; Guzmán, A.; Eras, J.J.C. Wind and power density data of strategic offshore locations in the Colombian Caribbean coast. Data Br. 2019, 27, 1–4. [Google Scholar] [CrossRef]
  20. Jung, C.; Taubert, D.; Schindler, D. The temporal variability of global wind energy—Long-term trends and inter-annual variability. Energy Convers. Manag. 2019, 188, 462–472. [Google Scholar] [CrossRef]
  21. Pryor, S.C.; Barthelmie, R.J.; Schoof, J.T. Inter-annual variability of wind indices across Europe. Wind Energy An. Int. J. Prog. Appl. Wind Power Convers. Technol. 2006, 9, 27–38. [Google Scholar] [CrossRef]
  22. Valentine, S.V. Understanding the variability of wind power costs. Renew. Sustain. Energy Rev. 2011, 15, 3632–3639. [Google Scholar] [CrossRef]
  23. Whyte, F.S.; Taylor, M.A.; Stephenson, T.S.; Campbell, J.D. Features of the Caribbean low level jet. Int. J. Climatol. 2008, 28, 119–128. [Google Scholar] [CrossRef]
  24. Poveda, G.; Álvarez, D.M.; Rueda, Ó.A. Hydro-climatic variability over the Andes of Colombia associated with ENSO: A review of climatic processes and their impact on one of the Earth’s most important biodiversity hotspots. Clim. Dyn. 2011, 36, 2233–2249. [Google Scholar] [CrossRef]
  25. Poveda, G.; Waylen, P.R.; Pulwarty, R.S. Annual and inter-annual variability of the present climate in northern South America and southern Mesoamerica. Palaeogeogr. Palaeoclimatol. Palaeoecol. 2006, 234, 3–27. [Google Scholar] [CrossRef]
  26. Henao, F.; Viteri, J.P.; Rodríguez, Y.; Gómez, J.; Dyner, I. Annual and interannual complementarities of renewable energy sources in Colombia. Renew. Sustain. Energy Rev. 2020, 134, 110318. [Google Scholar] [CrossRef]
  27. Klotzbach, P.J. The influence of El Niño-Southern Oscillation and the Atlantic multidecadal Oscillation on Caribbean tropical cyclone activity. J. Clim. 2011, 24, 721–731. [Google Scholar] [CrossRef]
  28. Stephenson, T.S.; Vincent, L.A.; Allen, T.; Van Meerbeeck, C.J.; Mclean, N.; Peterson, T.C.; Taylor, M.A.; Aaron-Morrison, A.P.; Auguste, T.; Bernard, D.; et al. Changes in extreme temperature and precipitation in the Caribbean region, 1961–2010. Int. J. Climatol. 2014, 34, 2957–2971. [Google Scholar] [CrossRef]
  29. Andrade, C. Análisis de la velocidad del viento en el mar Caribe. Boletín Científico CIOH 1993, 13, 33–43. [Google Scholar] [CrossRef]
  30. Schneider, T.; Bischoff, T.; Haug, G.H. Migrations and dynamics of the intertropical convergence zone. Nature 2014, 513, 45–53. [Google Scholar] [CrossRef] [PubMed]
  31. Karimirad, M. Offshore Energy Structures; Springer: Berlin, Germany, 2014. [Google Scholar]
  32. Bastidas-Salamanca, M.; Rueda-Bayona, J. Pre-feasibility assessment for identifying locations of new offshore wind projects in the Colombian Caribbean. Int. J. Sustain. Energy Plan. Manag. 2021, 32, 139–154. [Google Scholar] [CrossRef]
  33. Amador, J.A. The Intra-Americas Sea low-level jet: Overview and future research. Ann. N. Y. Acad. Sci. 2008, 1146, 153–188. [Google Scholar] [CrossRef] [Green Version]
  34. Appendini, C.M.; Urbano-Latorre, C.P.; Figueroa, B.; Dagua-Paz, C.J.; Torres-Freyermuth, A.; Salles, P. Wave energy potential assessment in the Caribbean Low Level Jet using wave hindcast information. Appl. Energy 2015, 137, 375–384. [Google Scholar] [CrossRef]
  35. Cook, K.H.; Vizy, E.K. Hydrodynamics of the Caribbean low-level jet and its relationship to precipitation. J. Clim. 2010, 23, 1477–1494. [Google Scholar] [CrossRef]
  36. Chang, Y.L.; Oey, L.Y. Coupled response of the trade wind, SST gradient, and SST in the caribbean sea, and the potential impact on loop current’s interannual variability. J. Phys. Oceanogr. 2013, 43, 1325–1344. [Google Scholar] [CrossRef]
  37. Ibrahim, H.; Ghandour, M.; Dimitrova, M.; Ilinca, A.; Perron, J. Integration of wind energy into electricity systems: Technical challenges and actual solutions. Energy Procedia 2011, 6, 815–824. [Google Scholar] [CrossRef] [Green Version]
  38. Ruiz-Ochoa, M.; Bernal, G. Seasonal and interannual wind variability into the NCEP / NCAR reanalysis data on the Colombian basin, Caribbean sea. Av. En Recur. Hidráulicos 2009, 20, 7–20. [Google Scholar]
  39. Bastidas Salamanca, M.L.; Figueroa Casas, A. Seguimiento satelital de las condiciones océano-atmosféricas asociadas a los eventos de precipitación en Colombia durante el evento La Niña 2010–2011. Boletín Científico CIOH 2014, 32, 123–134. [Google Scholar] [CrossRef]
  40. Hoyos, N.; Escobar, J.; Restrepo, J.C.; Arango, A.M.; Ortiz, J.C. Impact of the 2010–2011 La Niña phenomenon in Colombia, South America: The human toll of an extreme weather event. Appl. Geogr. 2013, 39, 16–25. [Google Scholar] [CrossRef]
  41. Giannini, A.; Cane, M.A.; Kushnir, Y. Interdecadal Changes in the ENSO Teleconnection to the Caribbean Region and the North Atlantic Oscillation. J. Clim. 2001, 14, 2867–2879. [Google Scholar] [CrossRef]
  42. Taylor, M.A.; Enfield, D.B.; Chen, A.A. Influence of the tropical Atlantic versus the tropical Pacific on Caribbean rainfall. J. Geophys. Res. Ocean. 2002, 107, 10–11. [Google Scholar] [CrossRef] [Green Version]
  43. Edsand, H.E. Identifying barriers to wind energy diffusion in Colombia: A function analysis of the technological innovation system and the wider context. Technol. Soc. 2017, 49, 1–15. [Google Scholar] [CrossRef]
  44. Makridis, C. Offshore wind power resource availability and prospects: A global approach. Environ. Sci. Policy 2013, 33, 28–40. [Google Scholar] [CrossRef]
  45. Schwanitz, V.J.; Wierling, A. Offshore wind investments—Realism about cost developments is necessary. Energy 2016, 106, 170–181. [Google Scholar] [CrossRef]
Figure 1. Proposed methodology for identifying the climatic scenarios from the lowest wind speed values.
Water 13 03150 g001
Figure 2. Study area and spatial coverage of the analyzed Reanalysis data (gray dots).
Water 13 03150 g002
Figure 3. Monthly average of wind speed (m/s) of CLLJ in the Caribbean at 925 hPa. The black contour line delimits the presence of the CLLJ in the study area.
Water 13 03150 g003
Figure 4. Time series of CLLJ (925 hPa) between 1980–2019 indicating linear trends.
Water 13 03150 g004
Figure 5. (a) Cumulative distribution function of the wind speed for the period 1980–2019; (b) second Cumulative distribution function of the wind speed using the wind speed below the q1.
Water 13 03150 g005
Figure 6. Wind speed series at 925 hPa, AMO index and q12 threshold.
Water 13 03150 g006
Figure 7. Wind Speed within the CLLJ area during several ENSO events. (a) Negative; (b) Positive phases of AMO.
Water 13 03150 g007
Figure 8. Sea surface temperature anomalies (°C) during: (a) October 2011–La Niña; (b) October 1987–El Niño. Data source: https://www.nnvl.noaa.gov/view/globaldata.html#SSTA (accessed on 25 February 2021).
Water 13 03150 g008
Table 1. Lowest wind speeds registered between 1980–2019 retrieved from the second q1 of CDF. Blue and red colors represent a negative and positive phase of the event respectively.
Date
(Month-Year)
Wind Speed
(m/s)
ONI (ENSO)AMO
May-816.640−0.300−0.084
Oct-816.760−0.100−0.187
Nov-846.185−0.900−0.424
Oct−875.1611.5000.046
Oct-886.637−1.500−0.175
Sep−896.446−0.200−0.099
Oct-902.4030.3000.108
Oct-946.6110.700−0.067
Oct-956.123−1.0000.094
Oct-966.717−0.400−0.153
Sep-995.034−1.2000.176
Oct-995.221−1.3000.008
Nov-993.140−1.50−0.058
Oct-035.9500.3000.417
Sep-044.9870.7000.231
Oct-053.921−0.3000.228
Oct-073.892−1.4000.148
Sep-084.520−0.3000.189
Oct-086.346−0.4000.093
Sep-104.217−1.6000.440
Oct-104.482−1.7000.314
Oct-114.864−1.1000.053
Oct-123.8170.2000.32
Oct-164.577−0.7000.37
Nov-166.144−0.7000.38
Sep-176.112−0.4000.339
Nov-176.563−0.9000.341
Sep-196.6570.1000.235
Publisher’s Note: MDPI stays neutral with regard to jurisdictional claims in published maps and institutional affiliations.

