Abstract
Recognizing that, over the last several years, extreme rainfall has led to hazardous stress in humans, animals, plants, and even infrastructure, in the present study, we aimed to investigate the characteristics of droughts over the Free State (FS) Province of South Africa in order to determine the future likelihood of reoccurrences of precipitation extremes using the generalized extreme value distribution (GEV) and extreme frequency analysis (EFA). In this regard, daily rainfall datasets from nine South African weather service homogenous climatic districts, spanning from 1980 to 2019, were used to compute: (a) the total annual rainfall, (b) the Effective Drought Index (EDI), and (c) the Standard Precipitation Index (SPI). The SPI was calculated for 3, 6, and 12 month accumulation periods (hereafter SPI-3, SPI-6, and SPI-12, respectively). The trend analysis results of the EDI and SPI-3, -6, and -12 showed that the Free State Province is generally negative, illustrating persistent drought. An analysis of the GEV parameters across the EDI and SPI-3, -6, and -12 values illustrated that the location, scale, and shape parameters exhibited a noticeable spatial variability across the Free State Province with the location parameter largely negative, the scale parameter largely positive, while the shape parameter pointed to an inherent Type III (Weibull) GEV distribution. In addition, the return levels for the drought/wet duration and severity of the EDI and SPI-3, -6, and -12 values generally showed increasing patterns across the corresponding return periods; the spatial contrasts were only noticeable in the return levels derived from the wet/drought duration and severity derived from SPI-3, -6, and -12 values (and not in the EDI). Further, the EFA results pointed to a noticeable spatial contrast in the return periods derived from the EDI and SPI-3, -6, and -12 values for each of the extreme precipitation categories: moderately wet, severely wet, extremely wet to moderately dry, and severely dry. Over four decades, the FS Province has generally experienced a suite of extreme precipitation categories ranging from moderately wet, severely wet, extremely wet to moderately dry, severely dry, and extremely dry conditions. Overall, the present study contributes towards implementation of effective drought early warning systems and can be used to enhance drought related policy and decision making in support of water resource management and planning in the FS Province.
1. Introduction
Extreme weather patterns can be viewed as complex spatiotemporal physical and societal processes that act as a cascade of events, ultimately causing major impacts that transcend many environmental, socioeconomic, and political regimes. Extreme weather events include heatwaves, droughts, floods, wildfires, concurrent wind, and intense rainfall. Climate change has exacerbated the frequency, intensity, severity, and duration of droughts at all geographical scales. This phenomenon can be detrimental, often leading to loss of lives and destruction of properties [1,2,3,4,5,6,7,8,9]. The major climatic drivers of drought events are precipitation and temperature. It has been observed that extreme rainfall has a detrimental consequence on food and water security, creating unrest and prompting migrations, among other factors [10]. It is projected that climate change will alter the pattern of occurrence of wet/dry months in the future with severe consequences for agricultural production and food security [11]. However, it has been observed that precipitation has increased in various regions of the world and reduced in others, with little or no net change in the entire amount of precipitation [12]. Drought is one of the most destructive natural phenomena because its effects extend over a large area and last for a long time, albeit slowly [13]. Overall, drought has the characteristic of long periods of water shortage that negatively affect edaphic, hydrological, meteorological, and social aspects [14,15,16].
South Africa is known to be a semi-arid/arid country, associated with hydroclimatic extremes such as droughts and floods. Droughts over South Africa are characterized by rainfall variability caused by atmospheric circulation configurations and exchanges in westerly and easterly circulations [17]. Drought is persistent over the entire South African landscape due to its semi-aridity [18,19]. In addition, the likelihood of aggravated drought impacts is inevitable due to different driving factors such as climate change and land-use change.
Drought indices are considered to be the best tools for monitoring drought at different timescales. In this regard, a number of such indices have been developed and these include the Agricultural Reference Index for Drought (ARID) [20], Bhalme and Mooley Drought Index (BMDI) [21], Crop Moisture Index (CMI) [22], China Z-Index (CZI) [23], Effective Drought Index (EDI) [24], Reconnaissance Drought Index (RDI) [25], Soil Moisture Drought Index (SMDI) [26], Soil Moisture Deficit Index (SMDI) [27], Standardized Precipitation Evapotranspiration Index (SPEI) [28], Standardized Precipitation Index (SPI) [29], Surface Water Supply Index (SWSI) [30], and the Vegetation Health Index (VHI) [31], among others. These indices rely on incessant functions of hydro-meteorological variables such as temperature, precipitation, potential evapotranspiration, soil water, groundwater, run-off, and streamflow (World Meteorological Organization (WMO) [32]).
Several different drought indices have been compared in different regions of the world. For example, a study by Jain et al. [33] compared six drought indices for the Ken River Basin, India, stated that EDI is the most suitable index for monitoring drought conditions in the region. A comparison of the suitability of seven drought indices for drought monitoring in the basin was presented in [34] and the SPI and EDI were recommended; additionally, their study found that the EDI was more responsive to drought and performed better than the SPI. Keyantash et al. [35] analyzed and ranked indices for drought in two areas of the United States and concluded deciles and SPI were the best among the range of drought indices analyzed. On the basis of six verdict criteria, [36] examined the performance of three drought indicators in the Upper Niger basin and ranked the SPI first among the meteorological drought indices.
McKee et al. [29] developed the Standardized Precipitation Index (SPI) to measure how far a given period’s accumulated precipitation deviated from the average. The SPI is one of frequently employed drought indices for examining meteorological drought. Additionally, the Effective Drought Index (EDI) was proposed by Byun and Wilhite [24] to monitor drought duration and severity by effectively determining precipitation using the present month’s rainfall and weighted rainfall over the preceding period calculated with a time-dependent reduction function. While periodicity of drought is highly complex, there is a need to effectively monitor drought in order to mitigate its effects [37]. The 3-month accumulation period of SPI timescales is effective for assessing drought over a short-term scale, while the -6- and -12-month accumulation periods are effective for assessing drought over a long-term scale. In the present study, the EDI and SPI (at 3-, 6-, and 12-month accumulation periods) were calculated and analyzed based on 4 decades of rainfall data.
A return period refers to the estimation of the time over which there is a likelihood of the occurrence of a particular magnitude of drought [38]. The extreme frequency analysis (EFA), which involves the use of historical records of hydrological events, is commonly used to create guidance for the expected future probability of occurrence. The EFA is crucial, owing to its environmental and economic impact [39]. The results from previous studies have demonstrated the importance of return period estimation for effective policy formulation, hazard preparedness, and, in some cases, it has been integrated for climate change adaptation [40]. Several research studies have indicated that historical trends in the frequency of heavy to extreme hydrological events [41] were linked to increased global average air, ocean, and near-surface temperatures, widespread melting of snow and ice, and rising global average sea level [42,43,44]. Climate change impacts have been increasing at an alarming rate, necessitating constant monitoring and evaluation of climate change indicators across all climate-sensitive sectors. This involves monitoring climatological variables including precipitation, evaporation, and air temperature, by using, for example, integrated models to model interactions between natural and human processes [45]; assessment of patterns in hydrological statistical parameters of climate variables (e.g., annual mean, median, minimum, and maximum) [46,47,48,49]; general extreme value (GEV) analysis to calculate the probability distribution and return periods of extreme events [50,51]; and drought monitoring using drought indices and drought monitoring indicators [18,52,53,54,55].
Despite the vulnerability of the South African landscape to drought, there is only limited information on the estimation of return levels for particular periods for the phenomena at a local scale that could inform effective planning. Therefore, numerous drought indices and indicators have been analyzed over South Africa; although limited studies have estimated the return levels for specific periods of major drought events. Consequently, in this study, we aim to assess the performance of the EDI, SPI-6, and SPI-12 for the probable occurrence of extreme drought in the Free State Province of South Africa, through the following: (i) The trend is carried out to determine if there is a decreasing or increasing trend in the precipitation, EDI, SPI-3, SPI-6, and SPI-12 values. (ii) The extreme value analysis (EVA) is used to evaluate the location, scale, and shape of the distribution. (iii) The return levels are estimated for drought using EVA and return period using the extreme frequency analysis (EFA). The results of this study are intended to contribute to the selection of the most appropriate indices for drought monitoring, and therefore aid the development of localized early warning systems which are vital for enhancing preparedness and building the adaptive capacity of those vulnerable to the adverse impacts of drought (especially the small-scale farmers) in the Free State Province.
2. Materials and Methods
2.1. Study Area
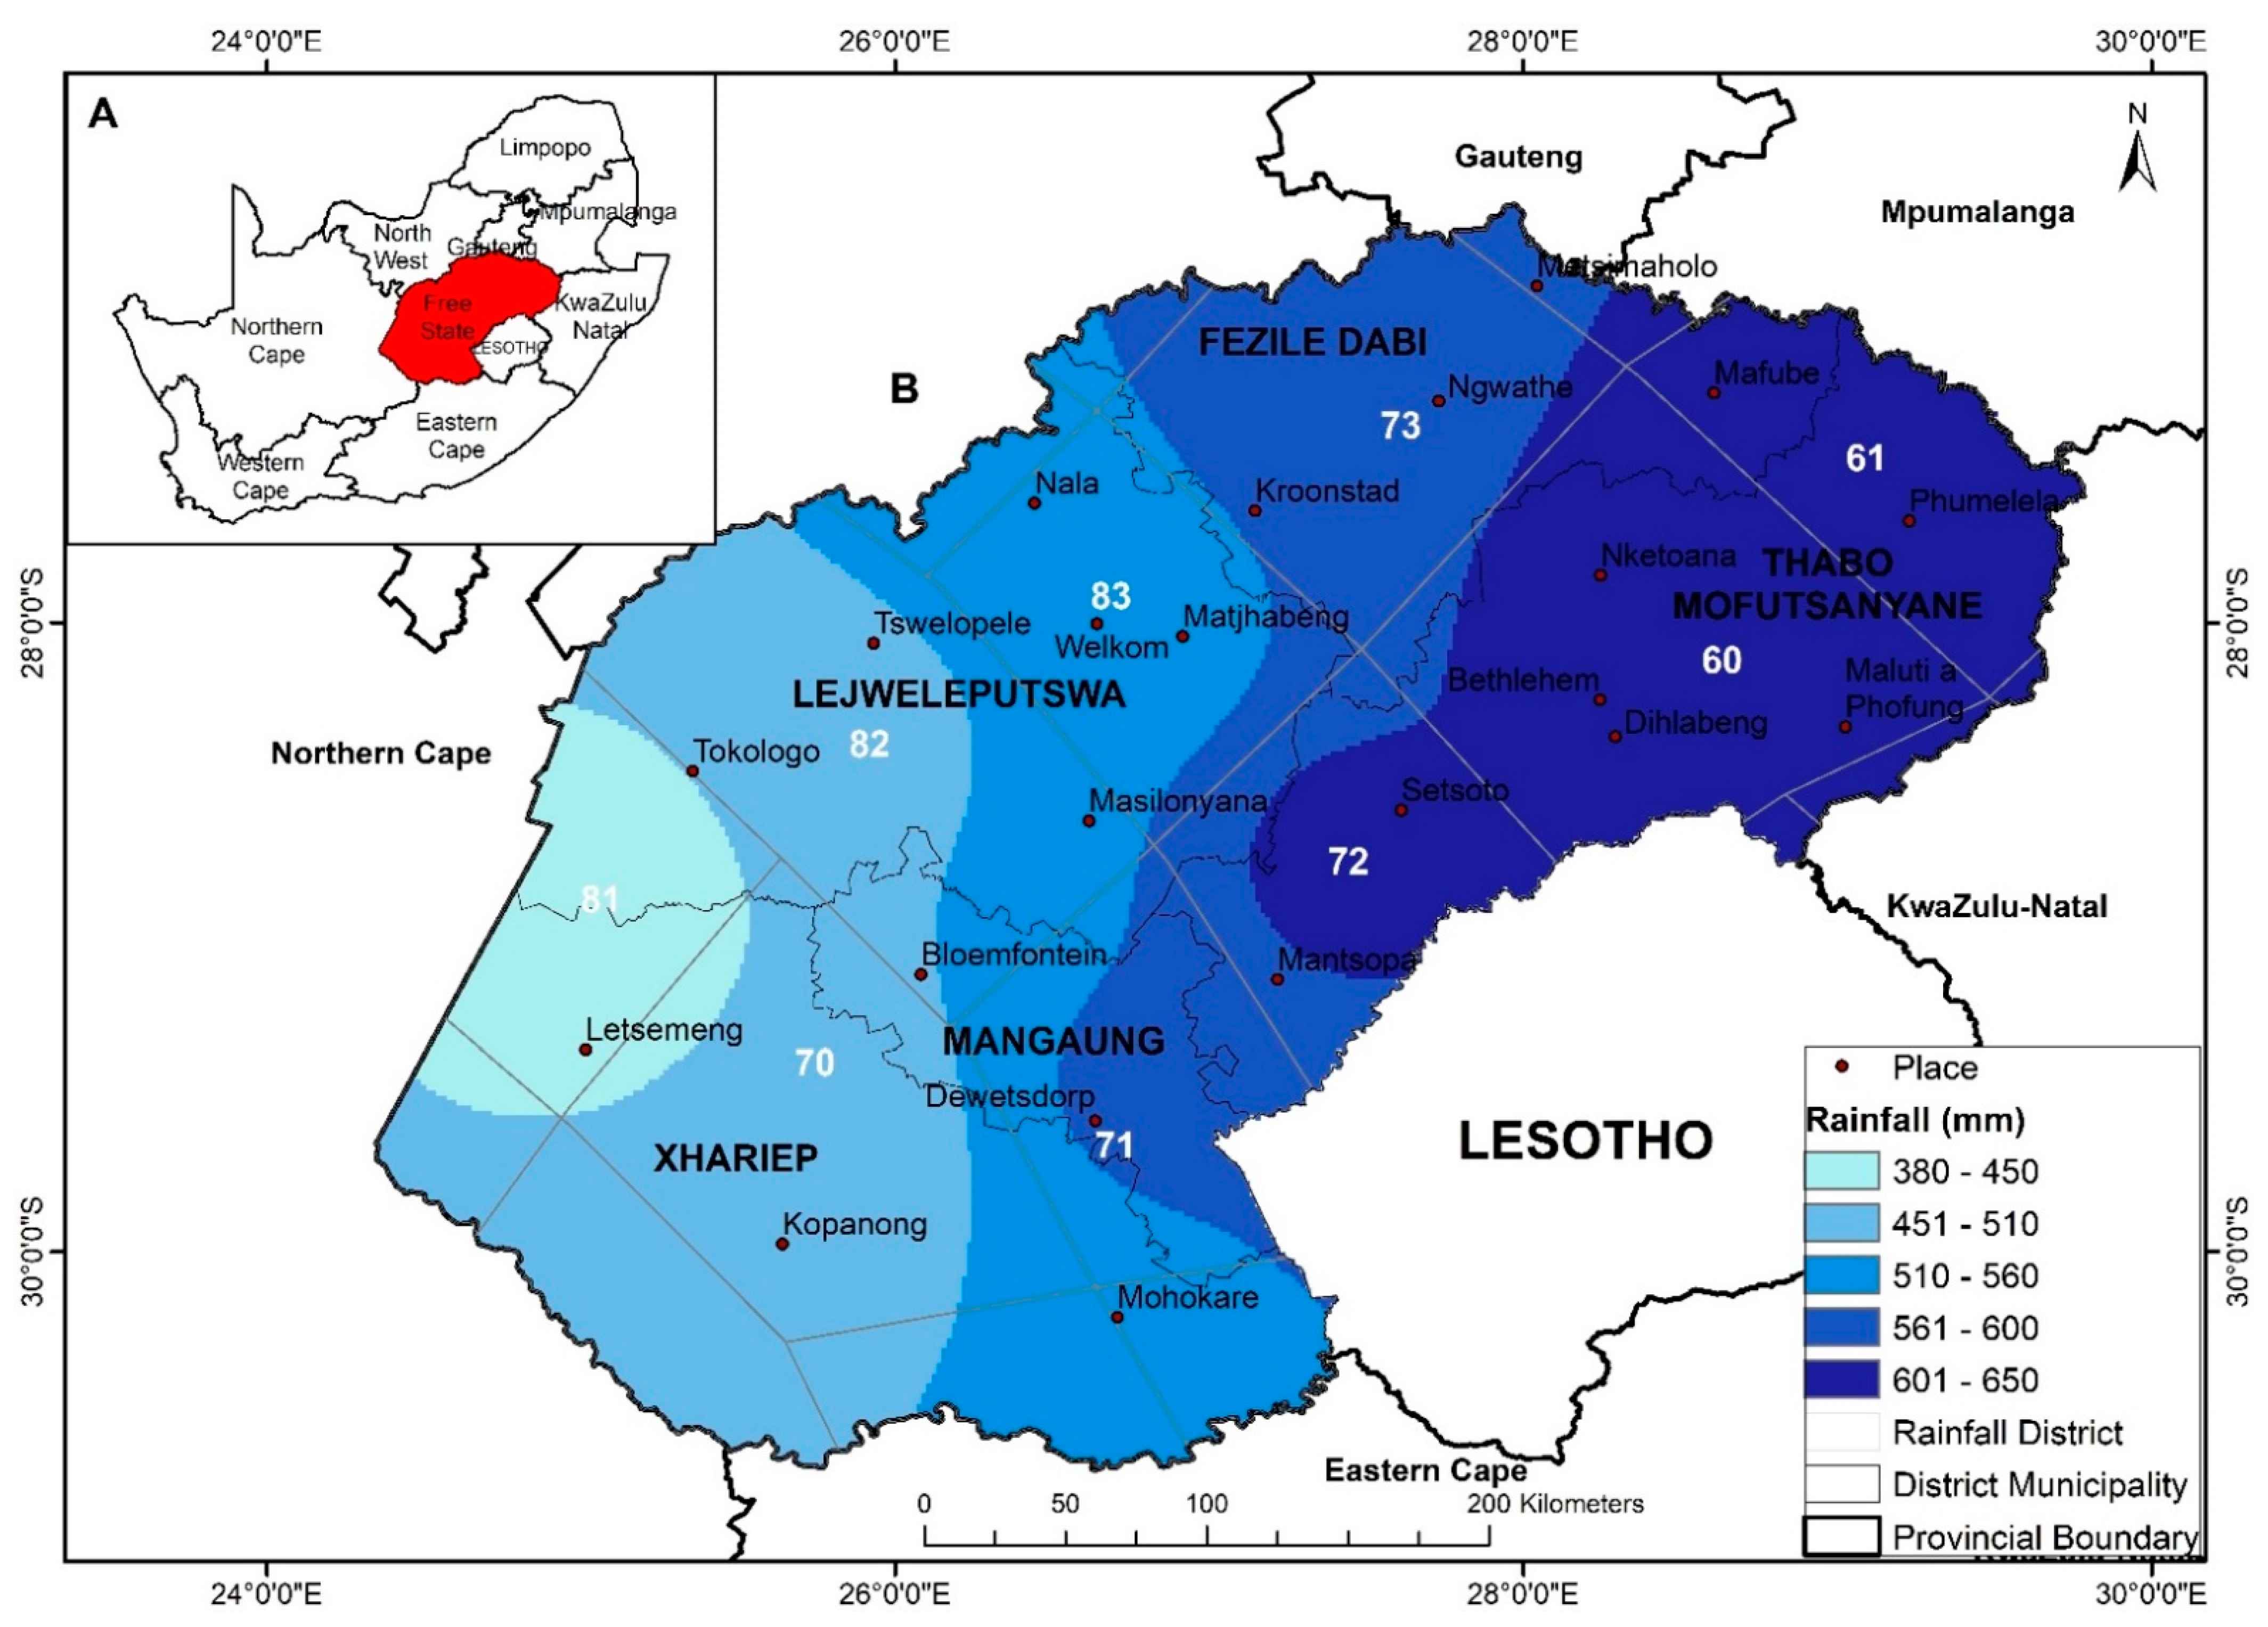
This study was undertaken in the Free State (FS) Province of South Africa, as shown in Figure 1. This province covers an estimated 129,825 km2 which makes it the third largest province in terms of landmass in South Africa. It is located between latitudes 26.6° S and 30.7° S and longitudes 24.3° E and 29.8° E. The FS Province is bordered by Lesotho and six other provinces, namely Northwest, Northern Cape, Eastern Cape, Gauteng, KwaZulu-Natal, and Mpumalanga. Moreover, the FS province is characterized by chilly winters (ranging from cold (1 °C) to mild (17 °C)), plenty of sunshine (from 15 to 32 °C), and summer rains (500–600 mm/yr). Major economic activities that contribute significantly to the province’s gross domestic product include mining (9.6%), trade (10.7%), agriculture (20.1%), and community service (24.7%) [56]. The Vaal irrigated area is located in the northeastern part of the country, which nourishes the small assortment of farming towns.
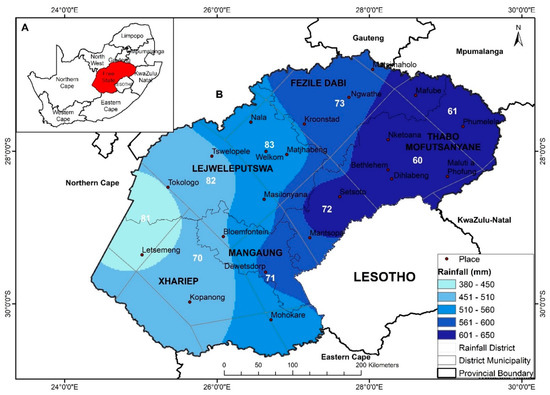
Figure 1.
Map of rainfall districts for the Free State Province of South Africa (SAWB, 1972) with named municipalities showing the average of the annual total rainfall 1980–2019.
The FS Province substantially contributes to the agricultural economy of the country, for instance, about 30% of the country’s maize production is from the province [57]. The province’s agriculture is extremely dependent on rainfall with only 10% or less of the province under irrigation. The province is divided into the following 5 district municipalities (Figure 1): Thabo Mofutsanyane, where rainfall Districts 60, 61, and 72 are located, receives total annual rainfall amounts ranging from 601 to 650 mm/year; Mangaung, where district 71 is located, receives total annual rainfall amounts ranging from 561 to 600 mm/year, 40% receives total annual rainfall amounts ranging from 510 to 560 mm/year, and 20% receives total annual rainfall amounts ranging from 451 to 510 mm/year; Fezile Dabi, where district 73 is located, with annual rainfall averages of 561–600 mm/year Lejweleputswa, where three rainfall districts are located, Districts 83, 82, and 81 have average annual rainfall amounts of 510–560 mm/year, 451–510 mm/year, and 380–450 mm/year, respectively; and Xhariep, where two rainfall districts are located, District 70 (60% receives rainfall averages from 451 to 510 mm/year) and District 81 (which receives rainfall averages from 380 to 450 mm/year). Note that rainfall District 81 cuts across two district municipalities, that is, Lejweleputswa and Xhariep.
2.2. Materials
The present study considered monthly rainfall data spanning from 1980 to 2019. The data were collected from nine (9) rainfall climatic districts distributed across the FS Province. The selected districts are part of the 94 rainfall climatic districts across South Africa, as delineated by the South African Weather Service (SAWS). These rainfall districts have long-term monthly rainfall totals recorded from 1921 to the present. However, the data were used from the period considered to be reliable with good quality control (1980 to the present). Generally, the districts are delineated by estimating the annual march of maximum rainfall and the boundaries between winter, whole-year, and summer rainfall regions. Therefore, in calculating the daily district rainfall total, the average of the values available in the district was taken. The SAWS updates these rainfall districts on a monthly basis. For additional and detailed information on the rainfall climate districts, refer to [50].
2.3. Methods
2.3.1. Standardized Precipitation Index
In the present study, the SPI was calculated based on a methodology reported in [29] for 3-, 6-, and 12-month accumulation periods. In particular, the SPI was calculated by fitting a gamma distribution described by Equation (1), to monthly rainfall data as follows:
where α > 0 represents the shape parameter, β > 0 is a scalar parameter, x > 0 represents the amount of rainfall, and Γ(α) is the gamma function given by Equation (2) as follows:
where n is the number of observations. The gamma distribution in Equation (1) was used to compute the cumulative probability function, as per Equation (3) as follows:
Then, the cumulative probability function (Equation (3)) was converted/transformed into the standard normal distribution to yield the SPI, a time series consisting of both positive and negative values considered to be wet and dry conditions, respectively. The resulting SPI values were categorized based on the classification in Table 1.

Table 1.
Range of SPI and EDI values for drought [24].
2.3.2. Effective Drought Index
The EDI, which is computed solely based on precipitation input, quantifies the standardized deficiency or excess of water resources. In this regard, monthly rainfall totals were used to compute the monthly EDI for the FS Province. The summed value of monthly rainfall totals with a time-dependent reduction function is given by Equation (4), described in [24], as:
where Pm is the precipitation of m months and i represents the duration of summation for a year (considered in this study) which is the most dominant precipitation cycle globally. In this way, 365 can represent a value of the total water resources available or stored over a period of time.
The EDI values are normally standardized to allow a better comparison for different locations with varying climatic zones. The present study adopted the drought classification in [24] to categorize and interpret the EDI values.
A trend analysis across the indices was carried out by using the modified Mann–Kendall (MMK) test [58]. The MMK is the modified version of the original form of the Mann–Kendall test. This trend test takes into consideration issues relating to autocorrelation in the datasets. In this study, the test was tested for significance at a 95% confidence level.
2.3.3. Extreme Value and Return Level Analyses
In the present study, the generalized extreme value distribution (GEV), which is defined by three parameters, i.e., position, size, and shape, was used to evaluate the characteristics of precipitation and derived drought indices (EDI, SPI-3, SPI-6, and SPI-12). The GEV distribution was fitted to the yearly maximum precipitation time series, yielding an estimate of the position, size, and shape parameters that are appropriate for explaining the underlying probability distribution of precipitation extremes. The calculated parameters were evaluated using the Gumbel, Frechet, and Weib (also known as Type I, Type II, and Type III extreme value distributions, respectively) classes of the GEV family of distributions [58]. The shape parameter determines the differences between these families of distributions. When a shape parameter is equal to zero, greater than zero, or less than zero, the GEV distribution corresponds to Type I, Type II, and Type III severe value distributions, respectively. Furthermore, in this analysis, the shape parameter was used to find the extreme value distribution that best fits/describes precipitation and the drought indices’ extremes in the rainfall district of the Free State Province from 1980 to 2019. A probability density function is used to integrate these distributions into the GEV which is expressed as:
where and , GEV is a three-parameter distribution with the Gumbel distribution as its limiting value at as follows:
where the reduced variate is y as follows:
The location parameter, , is used to define the size of the minima, and the scale parameter, , is used to determine the range of the minima. For the shape parameter (Weibull), the GEV distribution has a finite upper tail, while for (Fréchet) and (Gumbel), there is no upper limit. The shape parameter is used to determine the shape of the distribution. In this regard, the shape parameter controls the amount of skewness, the difference between the mean and the median of the distribution.
An extreme value model can be extrapolated using two methods: the distributional method and the return level method. With the return level method, larger areas can be mapped to quantiles of the EV model and conclusions are drawn. Whereas a distributional analysis is intended to directly determine a minimum from that extrapolated area. The , also referred to as the return level, is defined as the thickness not to be exceeded in inspection blocks. According to the following equation, an average sample of thickness minima will have more thickness measurements than the return level [59]:
In the present extreme value analysis, we calculated the return levels of the drought parameters associated with the 5-, 10-, 20-, and 50-year return periods. In the analysis, (a) firstly, the equivalent probabilities were determined from the return periods; (b) second, the GEV distribution parameters were calculated and the goodness of fit tested using the Kolmogorov–Smirnov test; (c) finally, the return levels for each of the drought indices were calculated using the equivalent probabilities in (a) for each of the return periods. These analyses were undertaken using the fevd function of extRemes R Package.
2.3.4. Extreme Frequency Analysis (EFA)
Several existing methods are available for recurrence estimation and EFA. Graphical representation is the simplest method that involves the use of a straight line fitting the quantile expression and the flood discharge value. The graphical representation linearizes the relationship between the cumulative frequency and the quantile probabilistically [60,61,62]. The Gumbel law is easy to use, therefore, it was selected among the several two-parameter distributions. Inserting the reduced variable in the Gumbel distribution expression , enabled the possibility of plotting the discharge values on the axes , and thereafter finding the best possible fit straight line. Equation (9) can be used to calculate the empirical frequency of a given discharge value as follows:
where is the sample size; is the value equivalent to the rank ; and is a coefficient, usually fixed to 0.5, as suggested by Brunet-Moret [62].
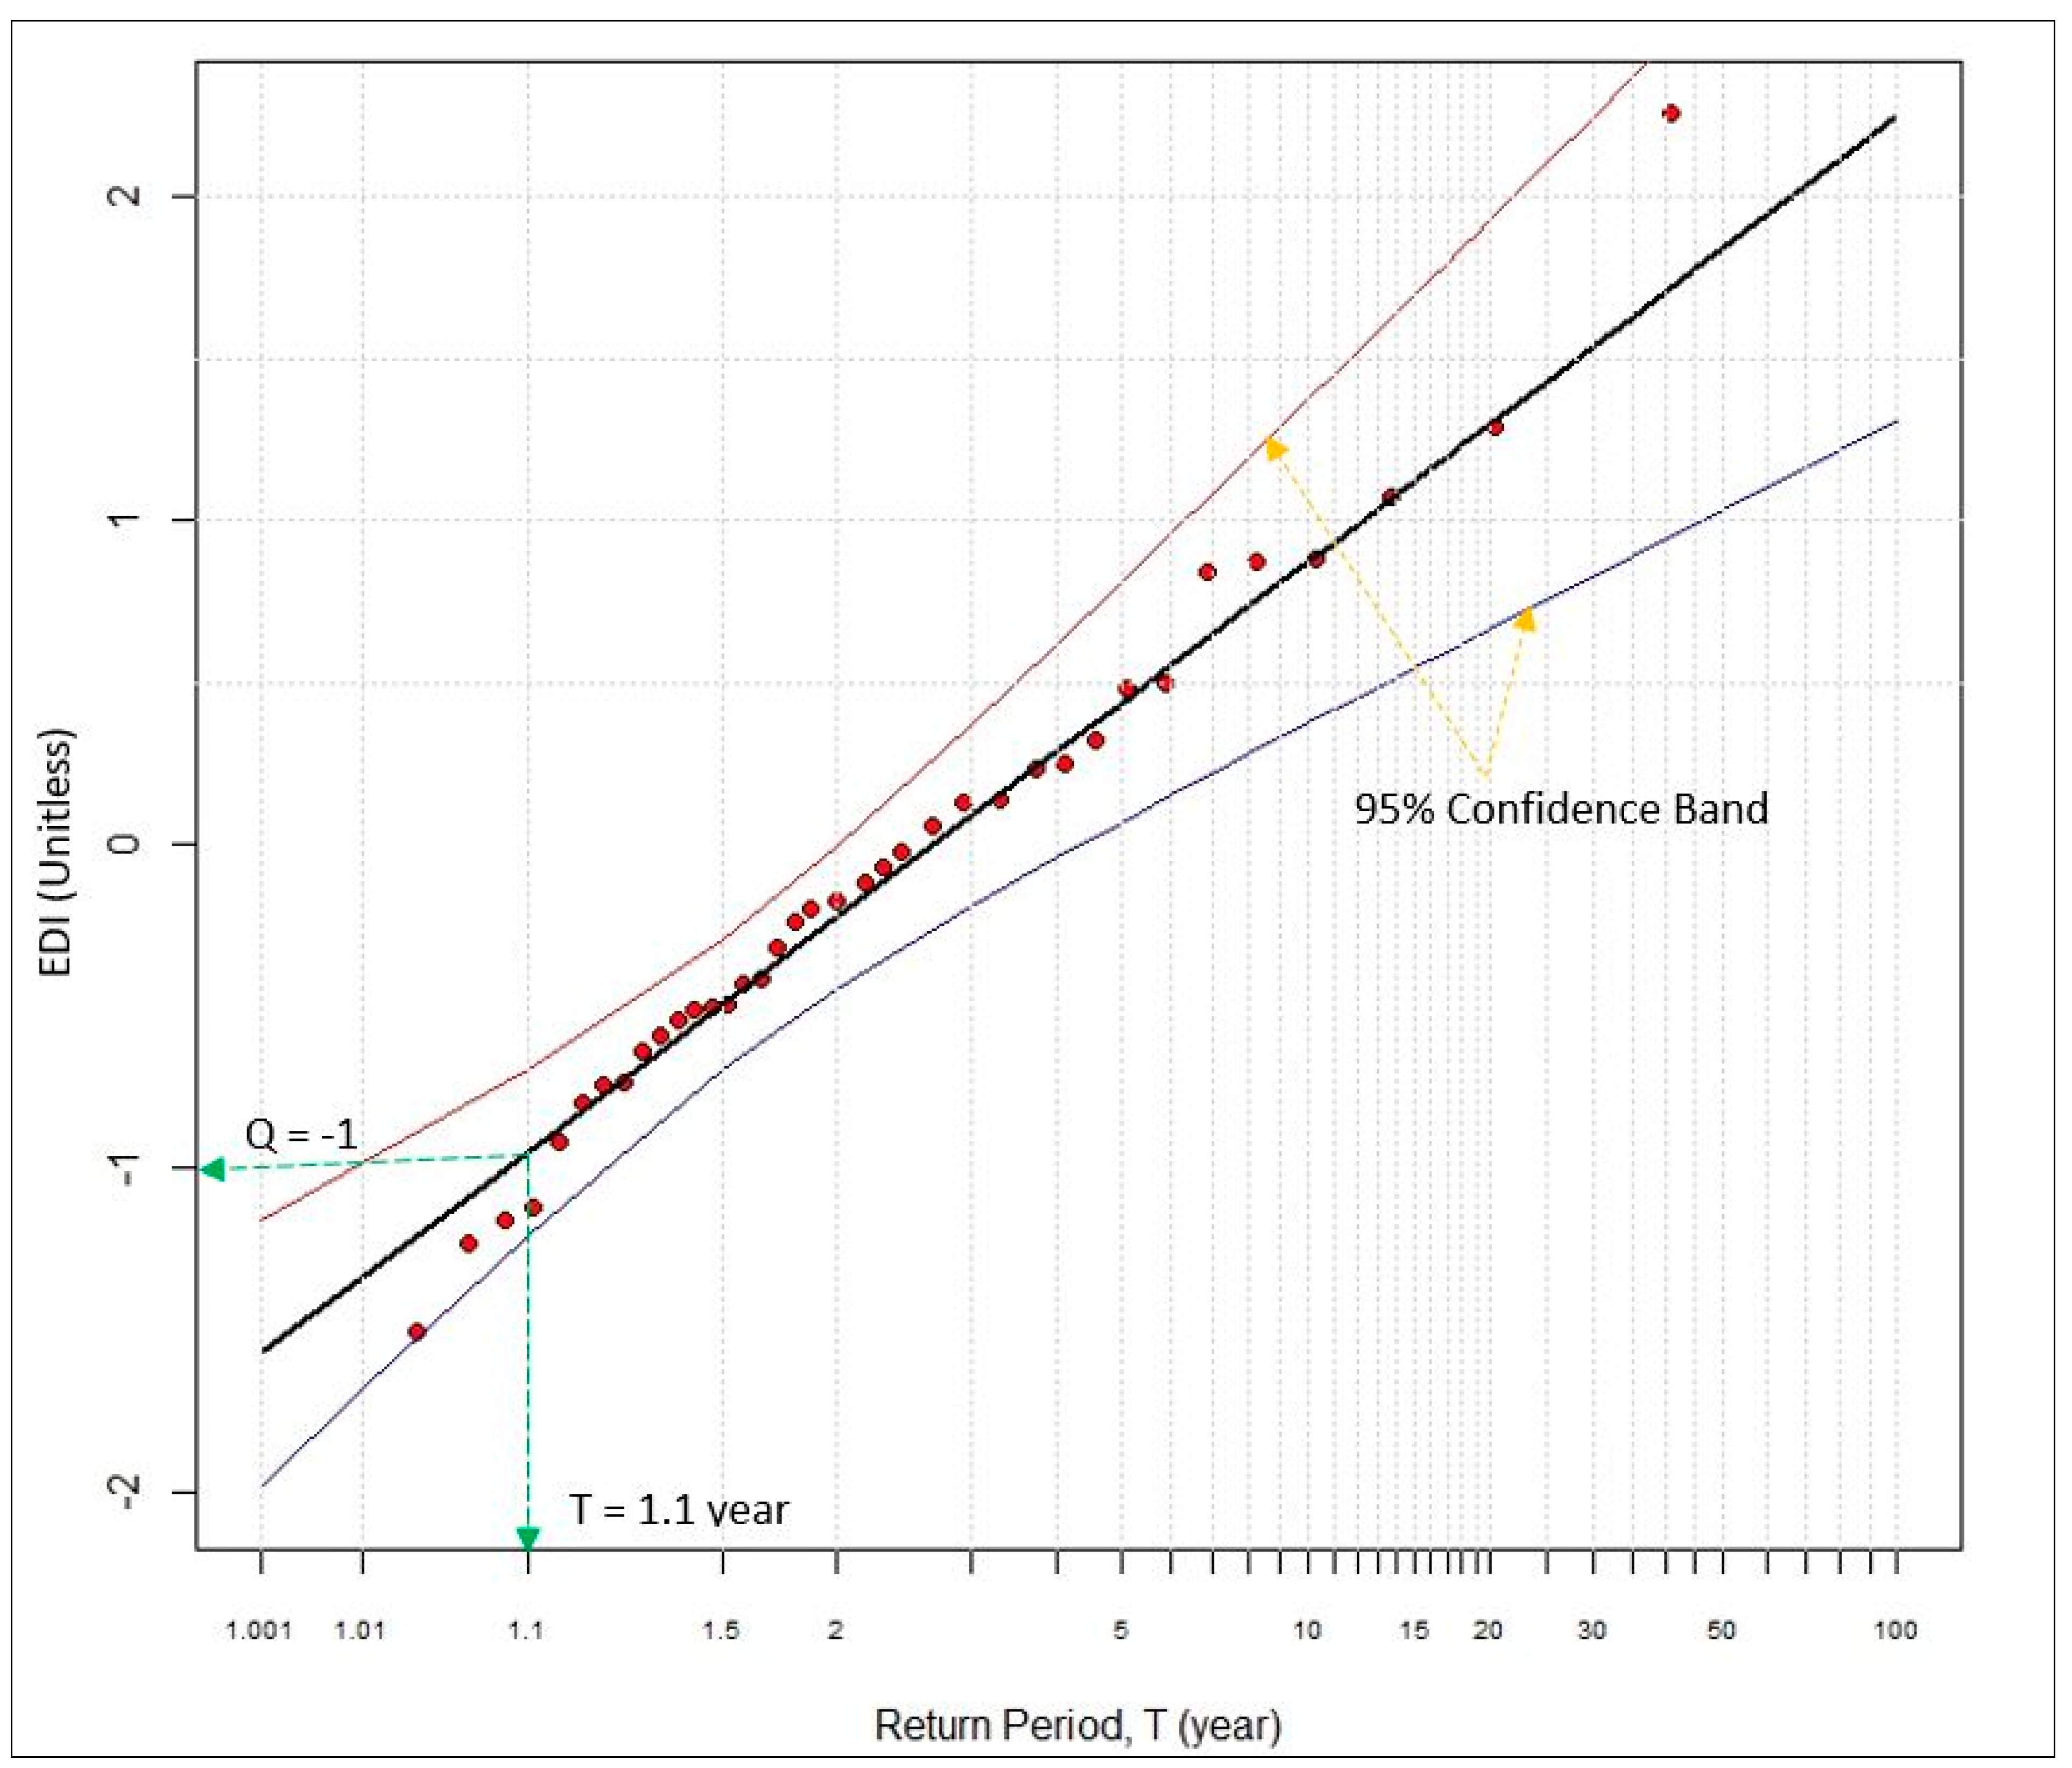
For this study, the extreme frequency analysis was used to estimate the likelihood of the reoccurrence of drought using the EDI, SPI-3, SPI-6, and SPI-12 values. Drought characteristics, such as the frequency of dry/wet years, drought and severity, and corresponding patterns based on the MMK trend test, were calculated using the SPI-3, SPI-6, and SPI-12 accumulation periods as well as the EDI time series. The drought categories namely extremely wet, severely wet, moderately wet, normal, moderately dry, severely dry, and extremely dry were derived based on Table 1 (SPI and EDI values [24]). This was also used for the threshold for the drought indices in both the GEV and the EFA analysis. To guide interpretation, plotted in Figure 2 is the return periods of EDI over District 60 (Dis60) from 1980 to 2019. The thick straight line in the middle of the plot signifies the calculated probability distribution. The pair of red and blue lines represents the confidence band, that is, there is a 95% chance that the calculated values will fall within this limit.
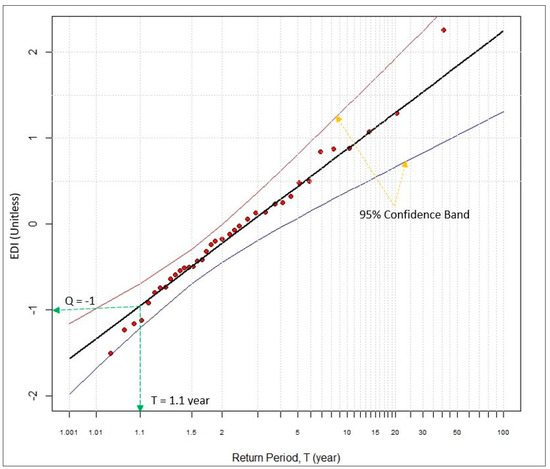
Figure 2.
Sample plot of frequency analysis using the Effective Drought Index (EDI) for the period from 1980 to 2019, illustration to guide interpretation.
3. Results
3.1. Historical Analysis
The results of the historical annual rainfall from 1980 to 2019 over the FS Province is illustrated in Figure 3. The results indicate that 1992, 1994, 2003, and 2015 were dry years (red bars) being <75% of the normal period (1985–2010) and 1988, 1996, 2001, 2006 (shown as blue bars) were wet years (>125% of the normal period). The year 2015 is particularly referred to as the warmest calendar year on record in South Africa with widespread below-normal rainfall across the entire country.

Figure 3.
Annual rainfall (% of the normal period) 1980–2019, with the normal period being 1985–2010. Red bars indicate dry years (<75% of normal) and blue bars wet years (>125% of normal). An average of the total rainfall in the districts’ homogenous areas for Free State Province. Source: SAWS provincial rainfall data.
3.2. Trend Analysis
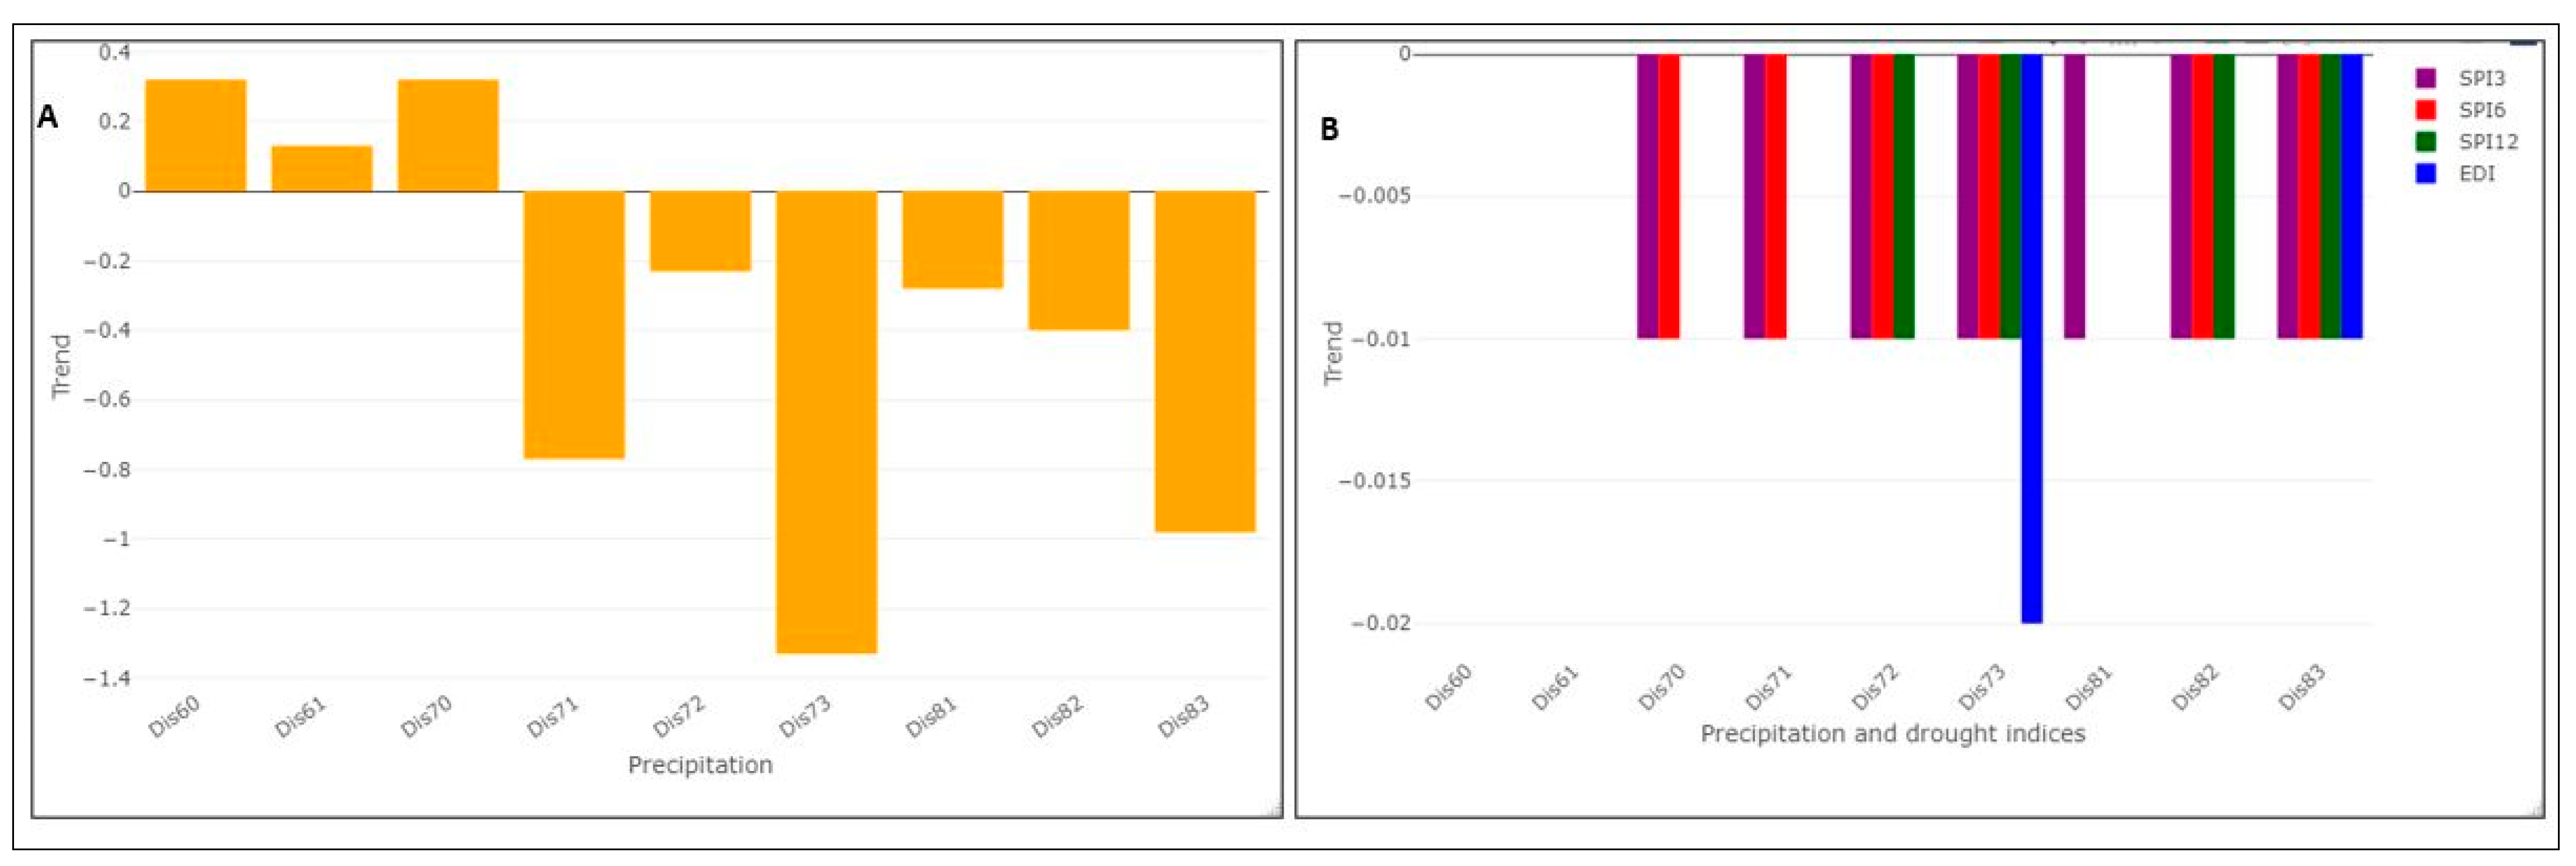
To examine the distribution of the wet and dry years from 1980 to 2019 for the rainfall districts of the FS Province, the trend analysis of the precipitation, SPI-3, SPI-6, SPI-12, and EDI values was carried out (Figure 4). The results of the MMK trend analysis show that there is a positive non-significant trend in precipitation for Dis60, -61, and -70. Rainfall Districts 71, 72, 73, 81, 82, and 83 exhibit non-significant trends in precipitation. The SPI-3, SPI-6, SPI-12, and EDI values show negative trends ranging from −0.01 to −0.02 across the rainfall districts. Dis73 depicts the lowest negative trend for the precipitation values (Figure 4A, −1.4) as well as the EDI values (Figure 4B, −0.02)
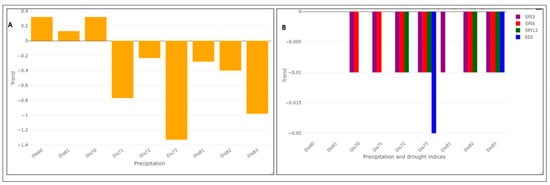
Figure 4.
(A) Trend analysis of precipitation; (B) Effective Drought Index (EDI) and Standard Precipitation Index (SPI)-3, -6 and -12 values, over the Free State Province from 1980 to 2019.
3.3. Extreme Value Analysis
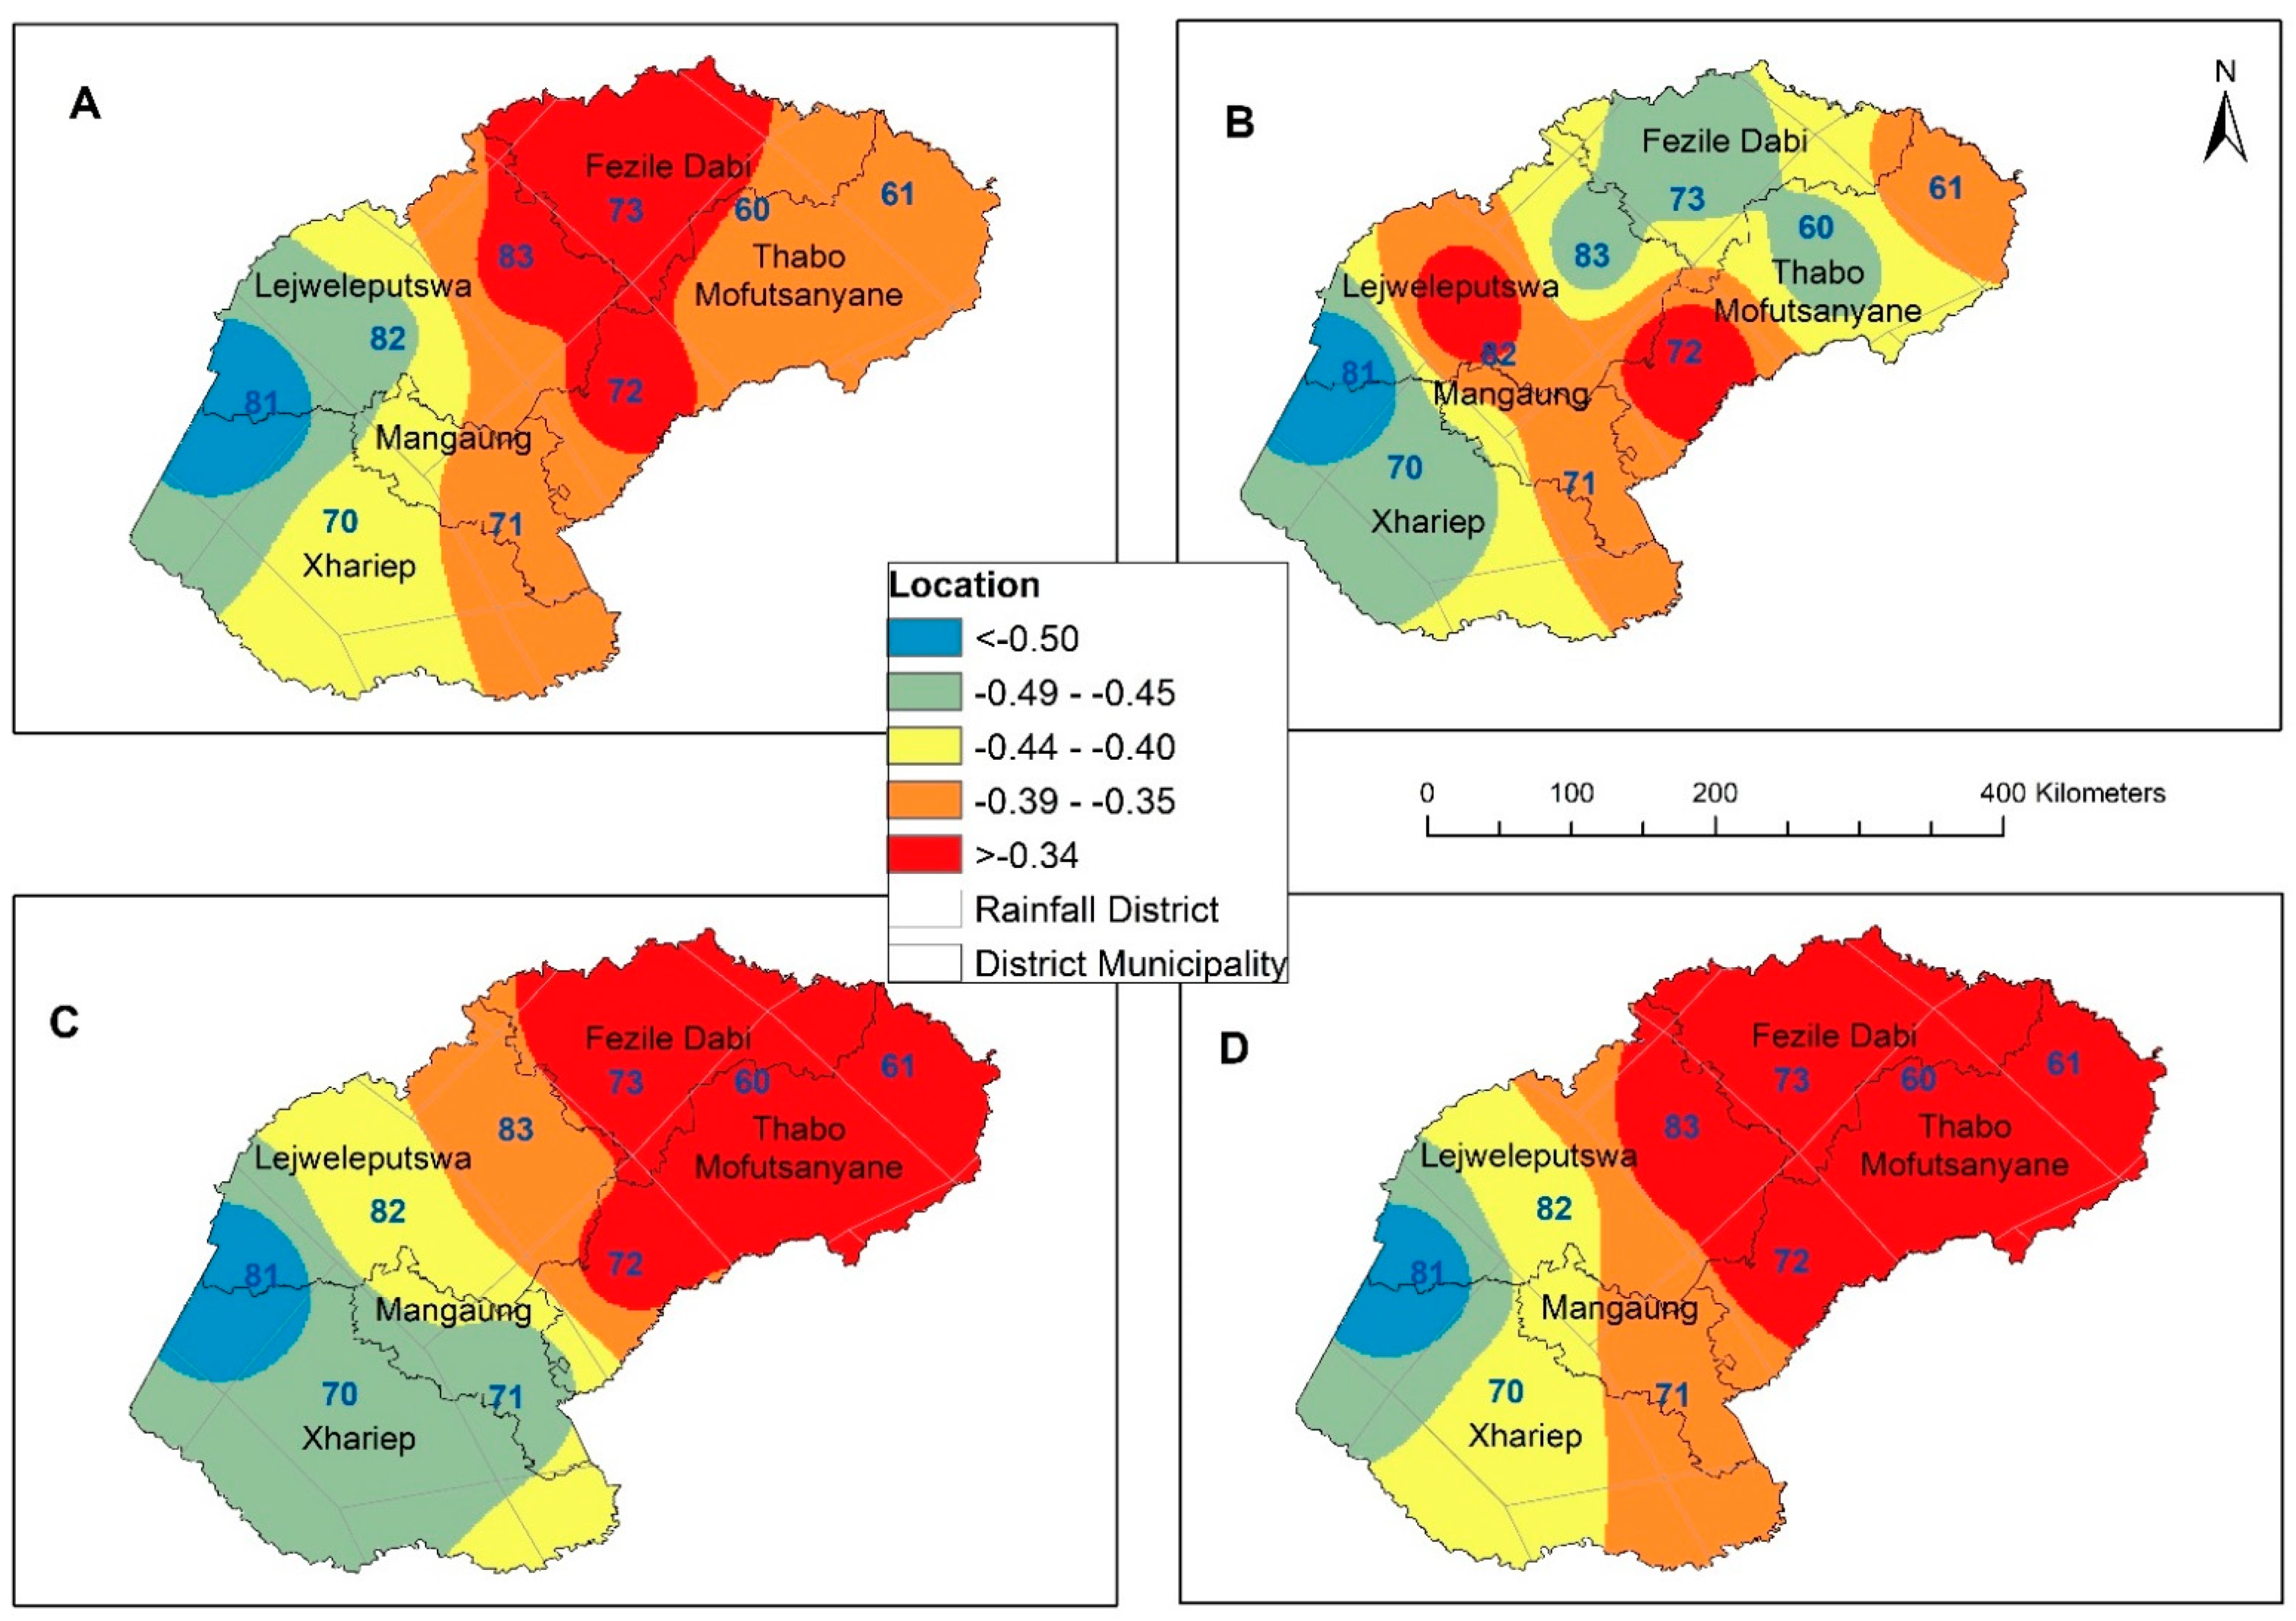
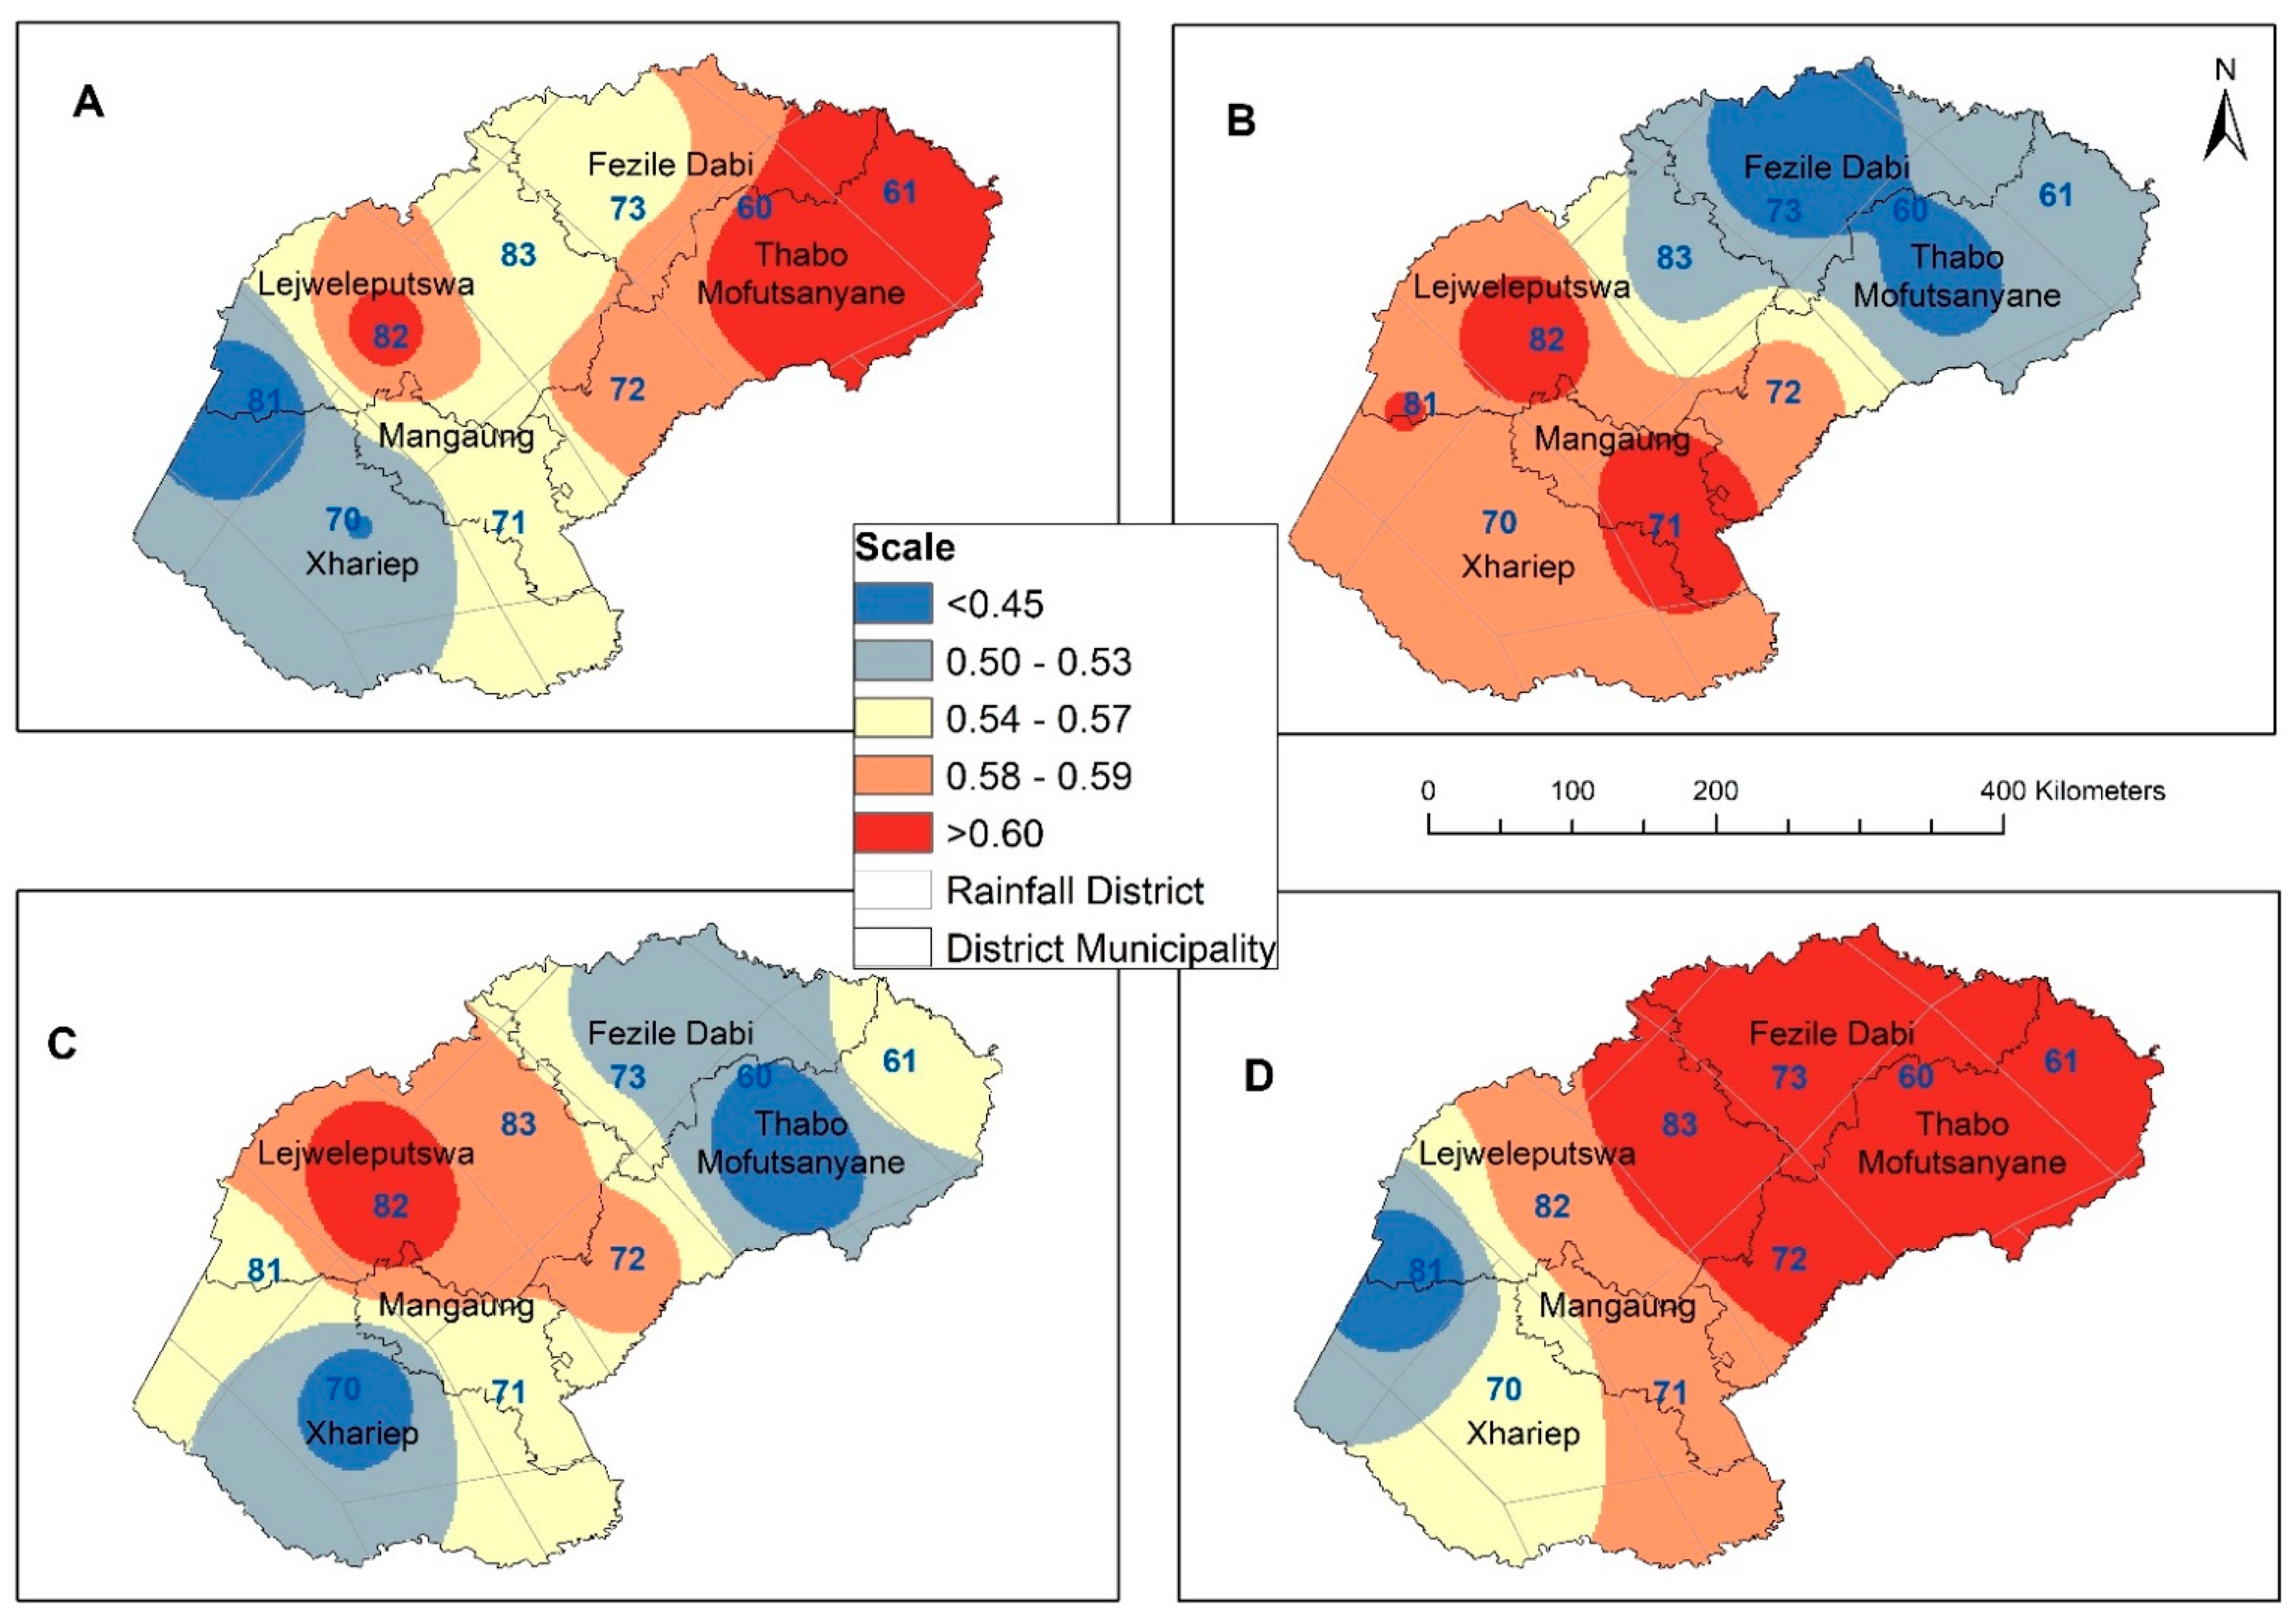
Figure 5, Figure 6 and Figure 7 show the results of the GEV distribution analysis, displaying the estimated location, scale, and shape parameters, across the rainfall districts and indices. The location parameter values for EDI, SPI-3, SPI-6, and SPI-12 range from −0.54 to −0.35, from −0.22 to−0.19, from −0.33 to −0.25, and from −0.47 to −0.33, respectively (Figure 5). Furthermore, 35% of the location parameter EDI values for the Free State Province are between −0.39 and −0.35 (Figure 5A); about 45% and 55% of the location parameter values for SPI-6 and SPI-12 are greater than −0.34 (Figure 5B,C).
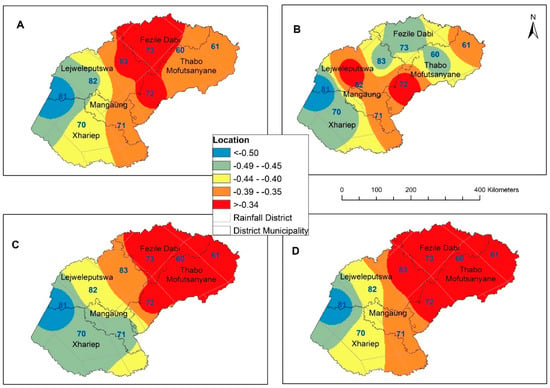
Figure 5.
The distribution of location parameter values of extremes over the Free State (FS) Province from 1980 to 2019: (A) EDI; (B) SPI-3; (C) SPI-6; (D) SPI-12.
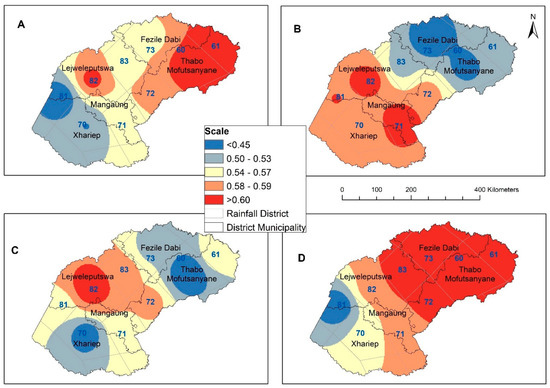
Figure 6.
The distribution of scale parameter values of extremes over the Free State Province from 1980 to 2019: (A) EDI; (B) SPI-3; (C) SPI-6; (D) SPI-12.
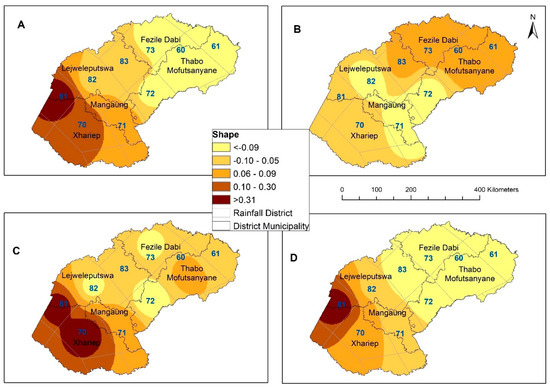
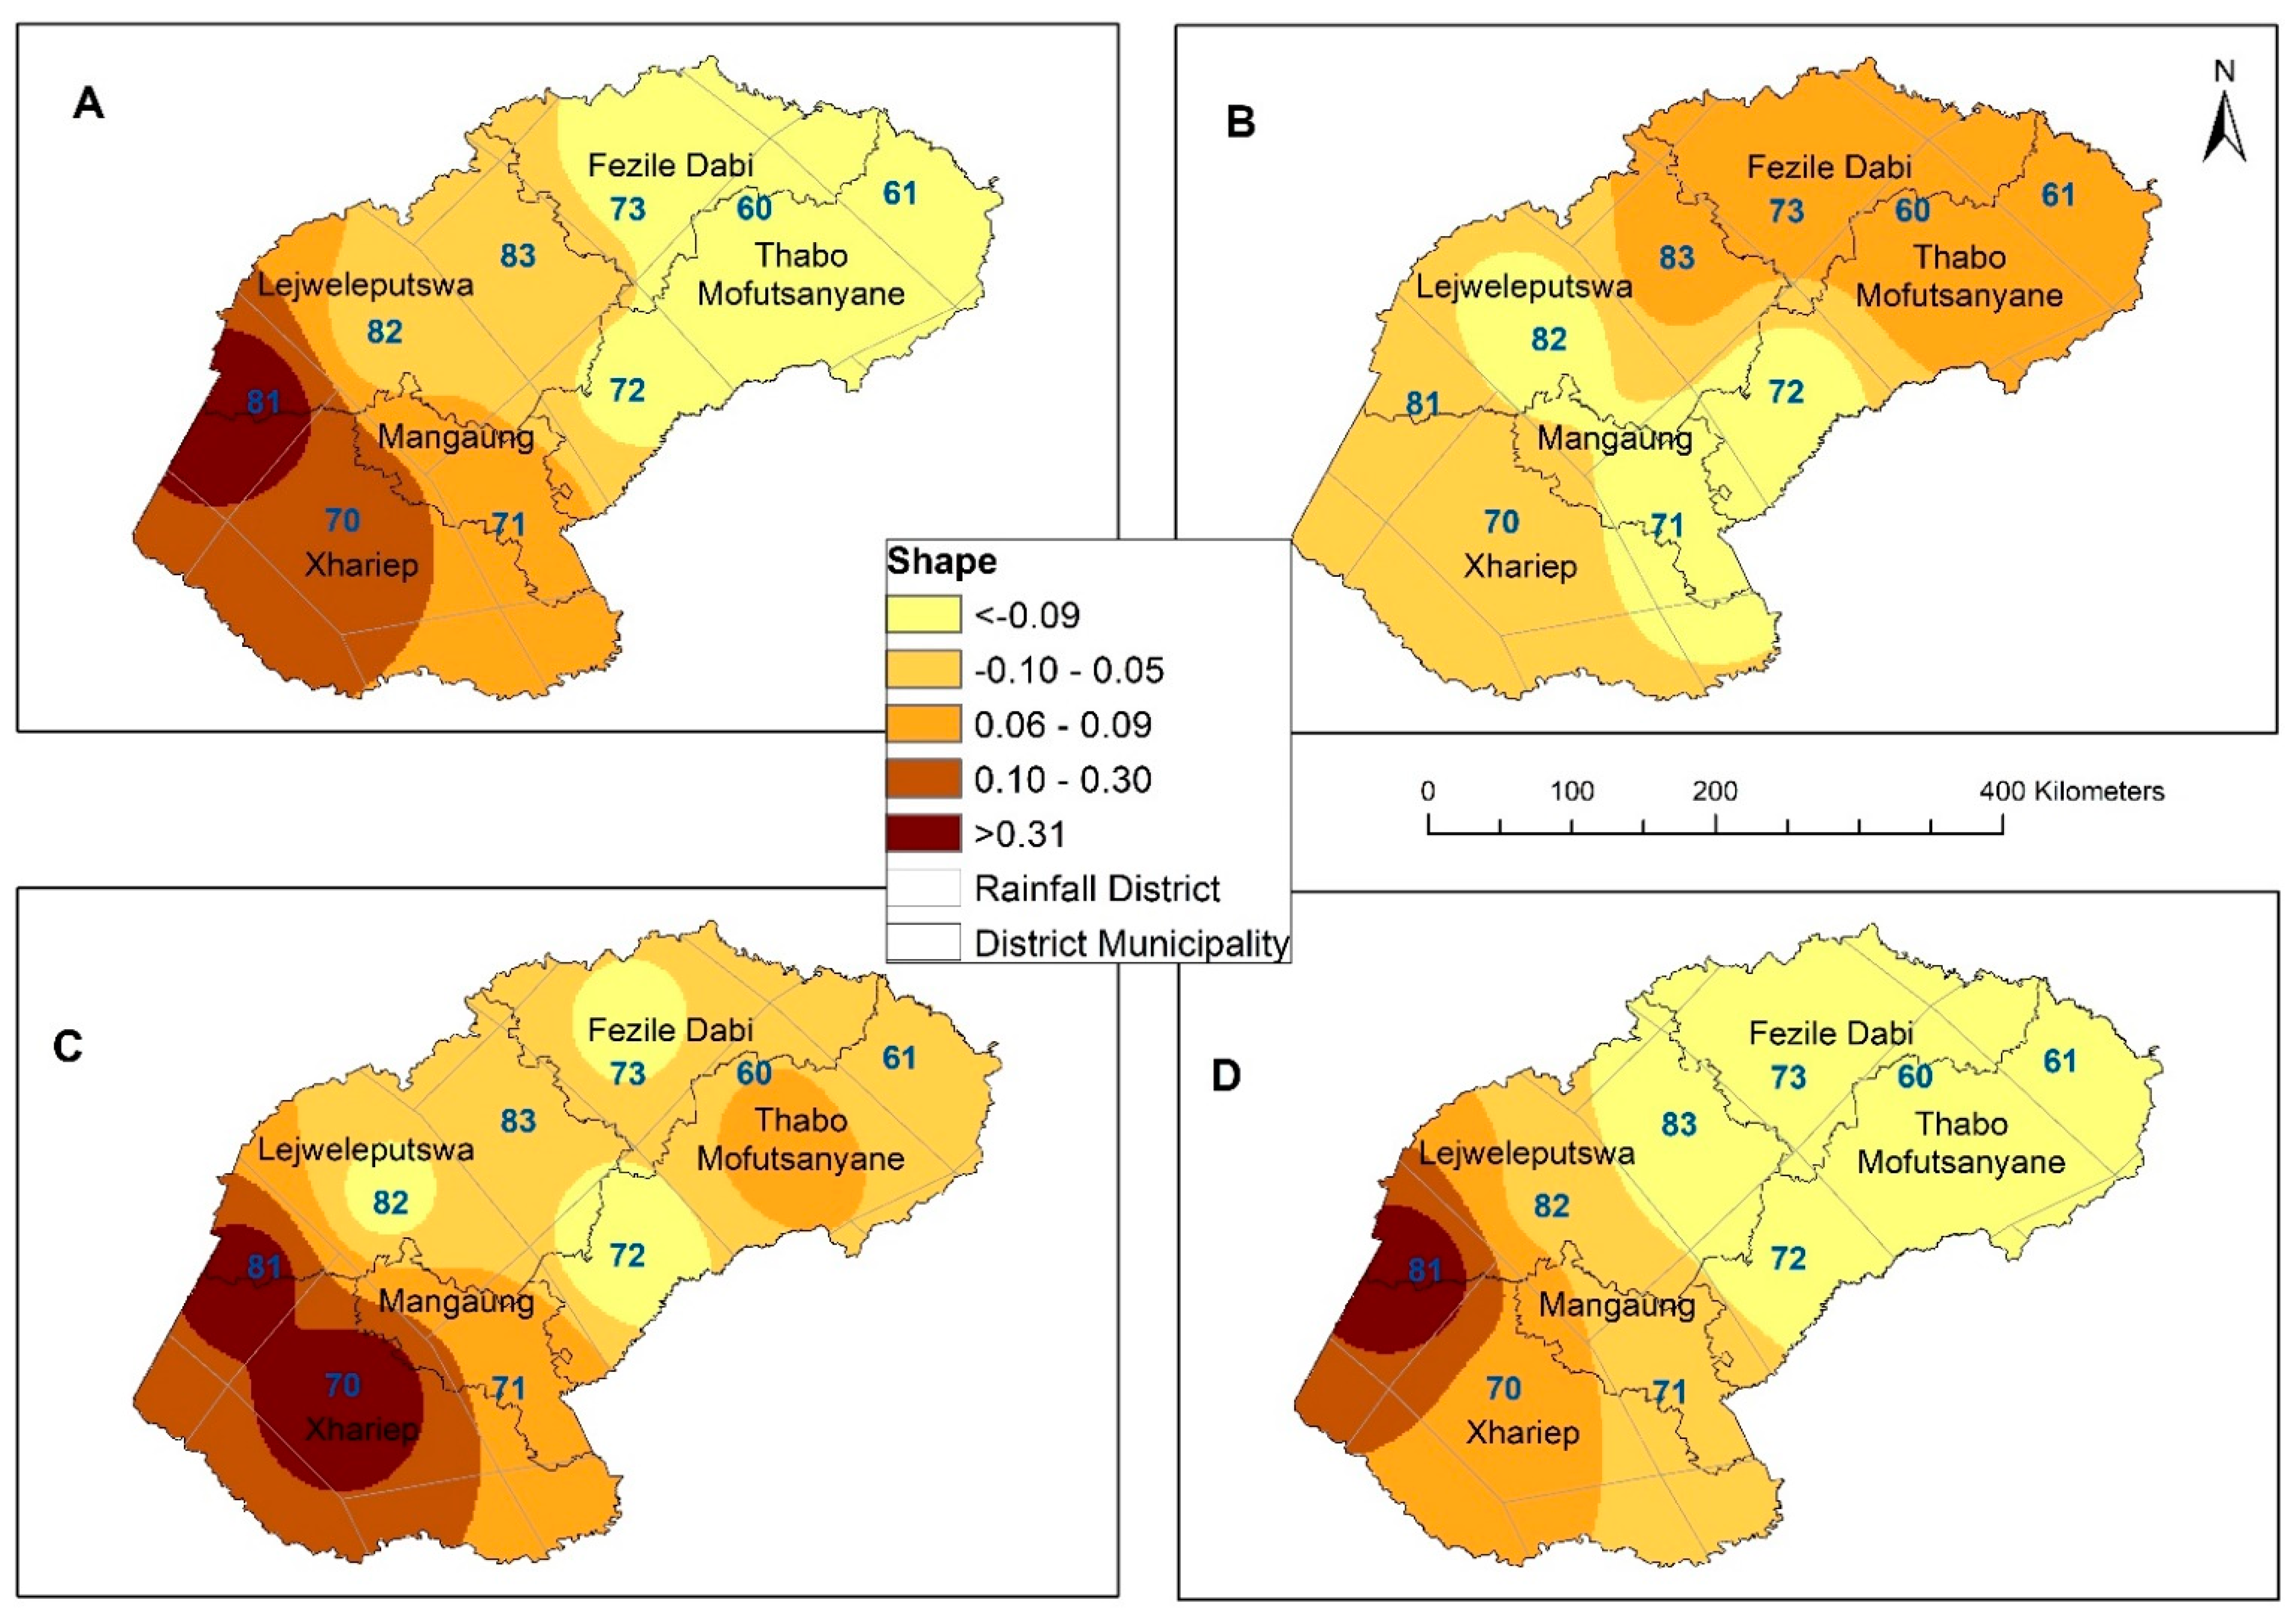
Figure 7.
The distribution of shape parameter values of extremes over the Free State Province from 1980 to 2019: (A) EDI; (B) SPI-3; (C) SPI-6; (D) SPI-12.
Figure 6 illustrates the spatial distribution of the scale parameter values across the indices in the Free State Province. The scale parameter values range from 0.33 to 0.82. From Figure 6, 35% of the scale parameter EDI values and SPI-6 values range between 0.54 and 0.57 (Figure 6A, C respectively). Furthermore, 56% of the scale parameter SPI-12 values are greater than 0.60. The scale parameter SPI-3 values (Figure 6B) range from 0.37 to 0.52.
The shape parameter values of the EDI and the SPIs across the selected accumulation timesteps are shown in Figure 7. The shape parameter values range between −0.01 and 0.33 across the rainfall districts. A negative distribution of the shape parameter values is observed for the EDI in Dis60, -61, -72, -73, and -82 (Figure 7A); also, for SPI-6 in Dis60, -61, -71, -72, -73, -82, and -83 (Figure 7B); and for SPI-12 in Dis60, -61, -70, -71, -72, -73, -82, and -83 (Figure 7C). Given the shape parameter values, Type III (Weibull) of the GEV distribution best describes the EDI and SPI index extremes for the districts. Furthermore, a positive distribution of shape parameter values is detected for the EDI in Dis70, -71, and -81, also for SPI-6 in Dis70 and -81, and for SPI-12 in Dis81. The Type II (Fréchet) extreme value distribution best describes the drought indices for these districts. There is a slight difference in the SPI-3 shape parameter values, as a negative distribution of shape parameter values is detected across the rainfall districts, i.e., −0.25 to −0.02. According to the shape parameter values, Type III (Weibull) of the GEV distribution best describes the extremes of the SPI-3 values for all districts. Furthermore, 45% of the distribution of EDI shape parameter values and 55% of the distribution of SPI-12 shape parameter values in the Free State Province are less than −0.09. Approximately 30% of the distribution of the SPI-6 shape parameter values in the Free State Province range from −0.10 to 0.05.
3.4. Return Level Analysis
3.4.1. Return Level Analysis for Drought Conditions
Table 2 depicts the drought duration return levels based on the EDI, SPI-3, SPI-6, and SPI-12 indices across the nine climatic rainfall districts of the Free State Province for the 2-, 5-, 10-, 20-, and 50-year periods, respectively. According to Table 2, based on the EDI results, there is a likelihood that drought conditions will occur for a duration period ranging from 2 to approximately 7 months in the next 5-, 10-, and 20-year periods, while in the next 50 years, drought conditions are likely to occur for a duration period of approximately 2 to 8 months. Dis72 and -82 seem to have a longer period of drought conditions when the EDI values are considered. The return levels for the drought duration with the EDI values show no change for all the districts across the years. From the SPI-3 values, drought durations range from 2 to approximately 5 months for the 5- and 10-year periods; 2 to approximately 6 months for the 20-year period, and 2 to approximately 8 months for the 50-year period. Dis71 seems to have a longer period of drought conditions with SPI-3 values. The return levels for drought duration with the SPI-3 values remain constant in Dis61 and Dis70 over the years. For the SPI-6 values, drought duration ranges from 2 to approximately 6 months for the 5-year period, 2 to approximately 8 months for the 10-year period, 2 to approximately 12 months for the 20-year period, and 2 to approximately 20 months for the 50-year period. Dis82 and -83 exhibit the longest period of drought conditions with SPI-6 values. No change is observed in the return levels for drought duration with the SPI-6 values for the study period across the districts and years. From the SPI-12 values, drought duration ranges from 2 to approximately 6 months for the 5-year period, 2 to approximately 9 months for the 10-year period, 2 to approximately 12 months for the 20-year period, and 2 to approximately 19 months for the 50-year period. Dis82 exhibits the longest period of drought condition associated with the SPI-12 values. Similarly, there is no change in the return levels for the drought duration associated with the SPI-12 values in Dis60, -72, and -83 across the years.

Table 2.
The drought duration return levels for the 2-, 5-, 10-, 20-, and 50-year periods.
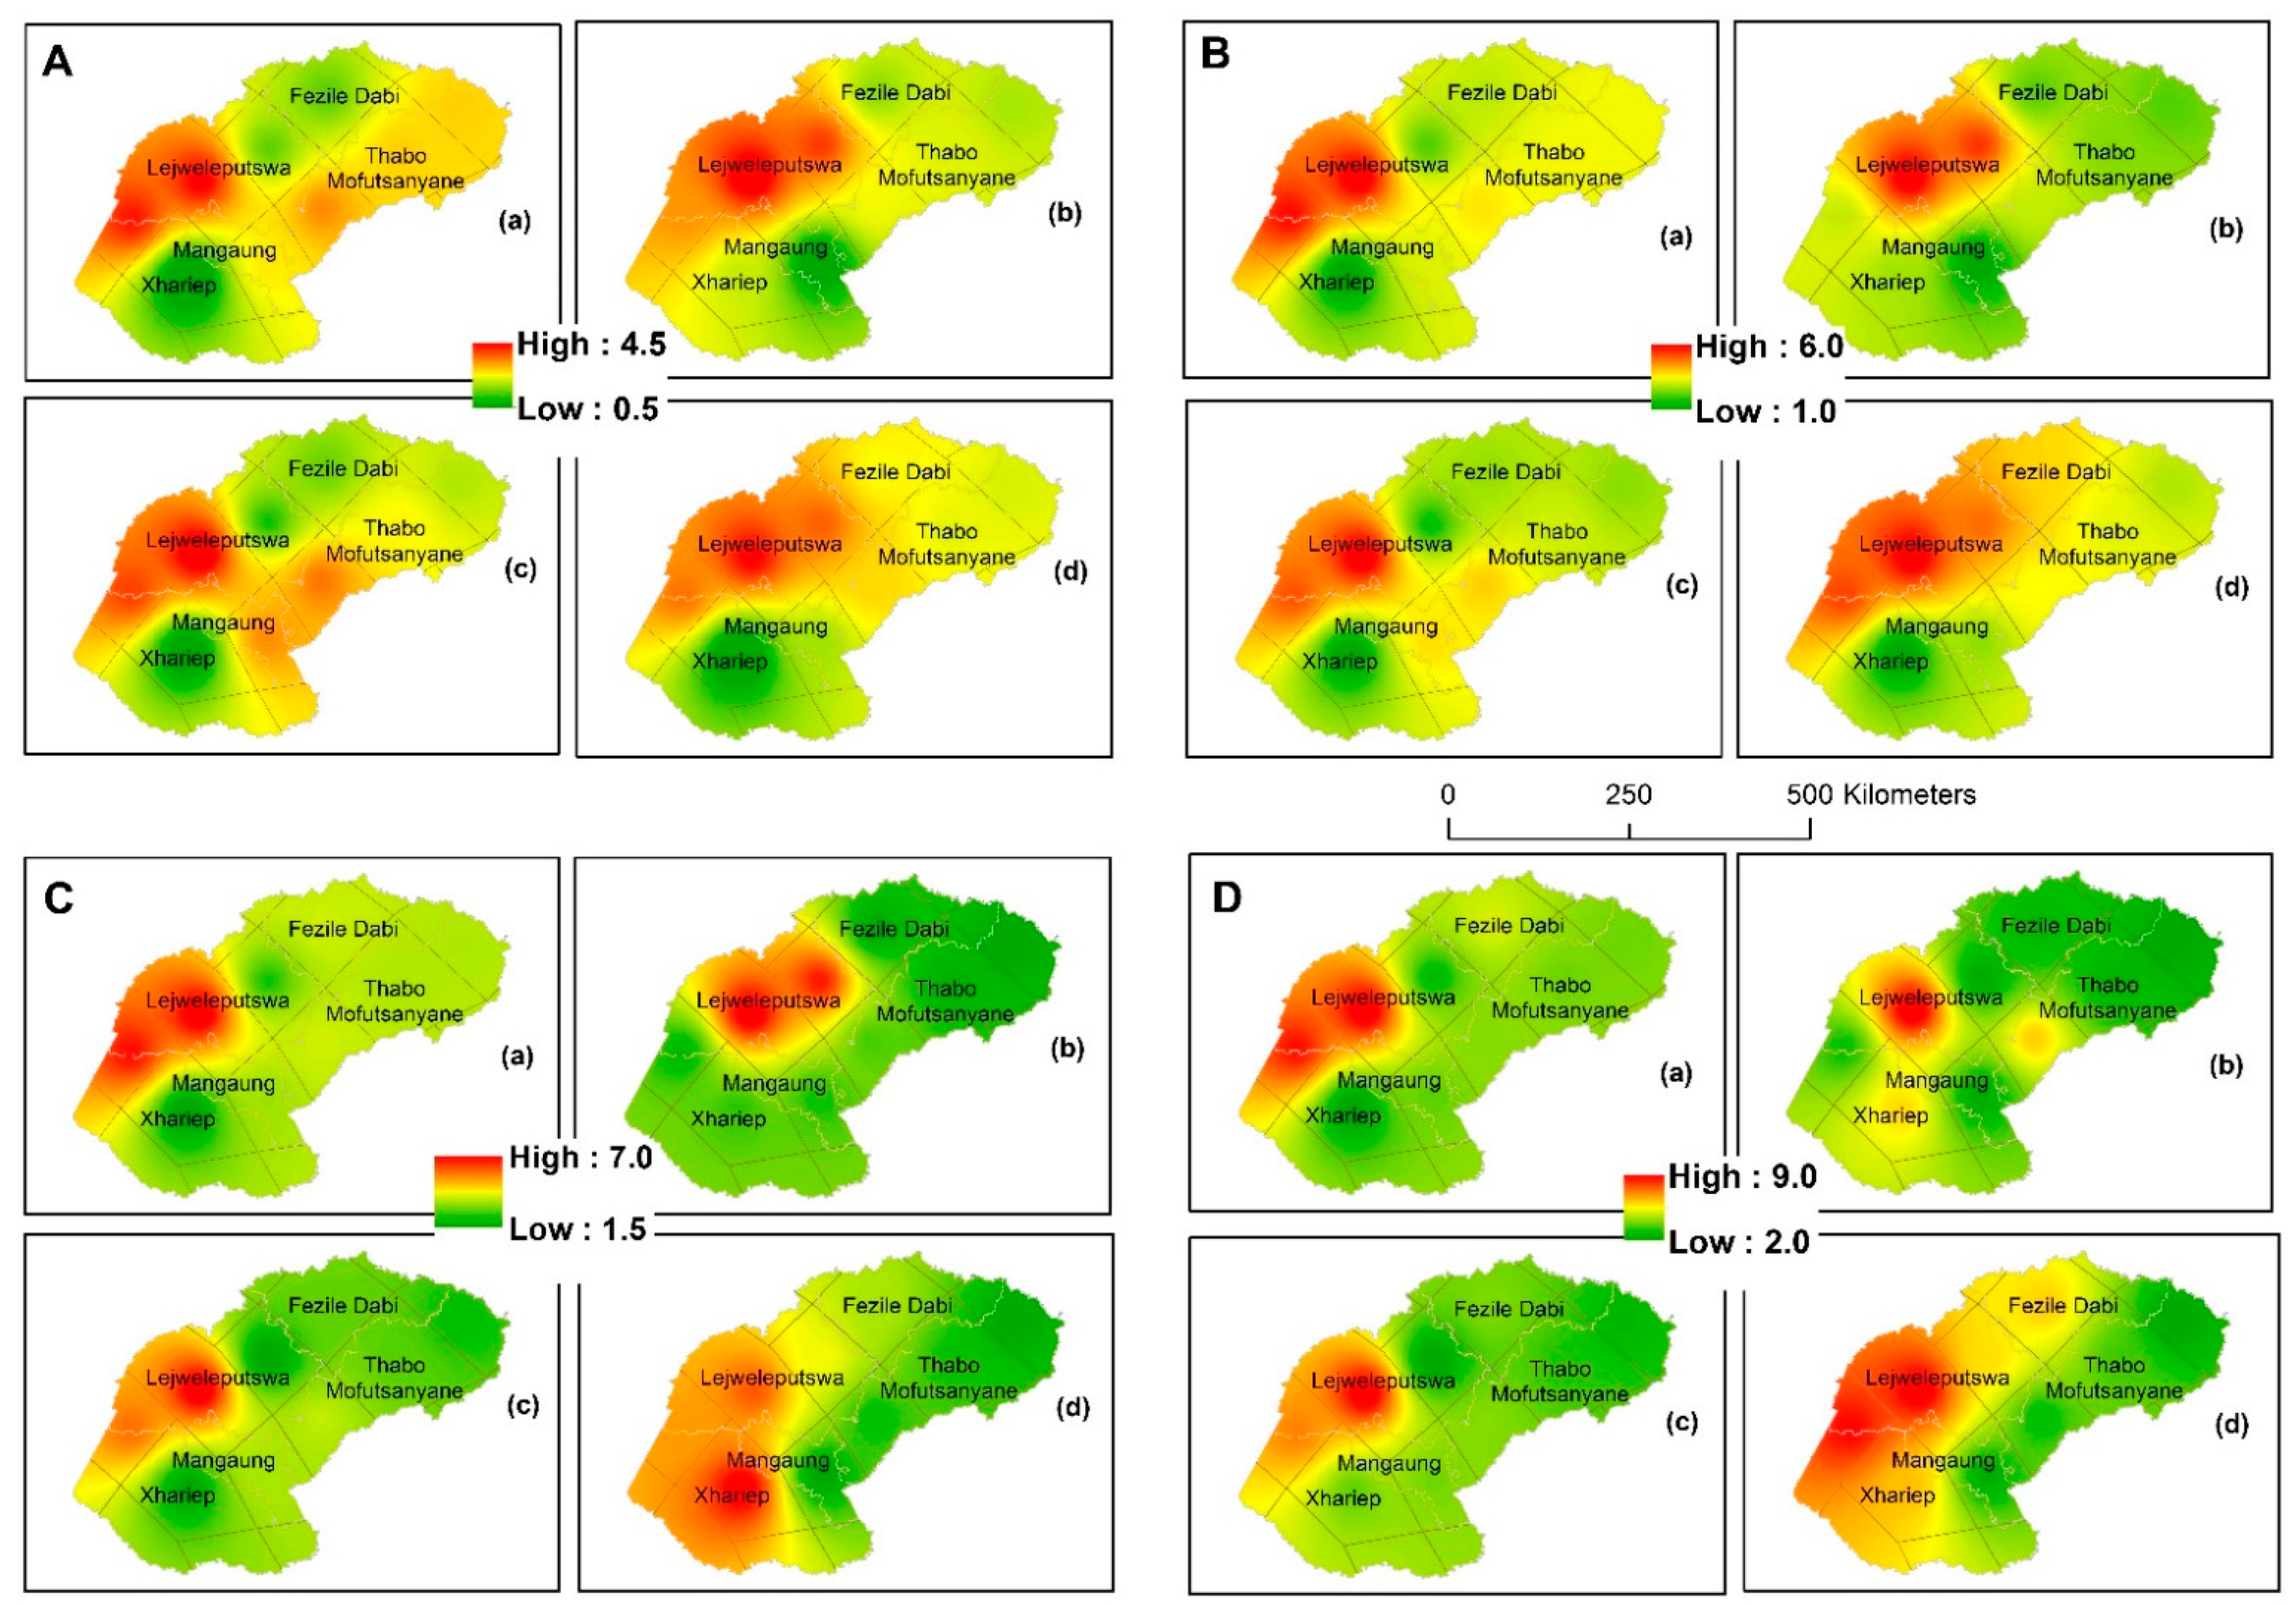
Figure 8 depicts the spatial distribution of the drought severity return levels for the 5-, 10-, 20- and 50-year return periods over the Free State Province from 1980 to 2019 using the EDI, SPI-3, SPI-6, and SPI-12 values. According to the EDI analysis, drought severity is expected to increase in Lejweleputswa (Dis82) across the studied return periods. Less severe drought is detected in Xhariep (Dis70) for all the return periods with the exception of the 10-year return period. The return levels for drought severity associated with the EDI values show no change in Dis83 across the years. With the SPI-3 values, high drought severity is detected in Lejweleputswa, specifically, in Dis81 and -82 for the 5- and 20-year return periods; Dis82 and -83 for the 10-year return period; and Dis81, -82 and -83 for the 50-year return period. The return levels for drought severity based on the SPI-3 values depict no change in Dis83 across the years. From the return levels corresponding to drought severity derived from SPI-6, Lejweleputswa depicts high drought severity, specifically, in Dis81 and -82 for the 5- and 20-year return periods and Dis82 and -83 for the 10-year return period. No noticeable change is detected in drought severity return levels associated with the SPI-6 values in Dis83 across the selected return periods. High drought severity is also detected in Lejweleputswa (Dis82) and Xhariep (Dis70) for the 50-year return period with the SPI-12 values. Noticeable less drought severity is detected in the SPI values in Fezile Dabi (Dis73), Thabo Mofutsanyane (Dis60, -61, and -72), Mangaung (Dis71), and Xhariep (Dis70) for the 10-year return period with SPI-3 and SPI-6 values and the 20-year return period with SPI-12 values. Dis71 and Dis72 depict no change in return levels for the SPI-12 analysis across the years.
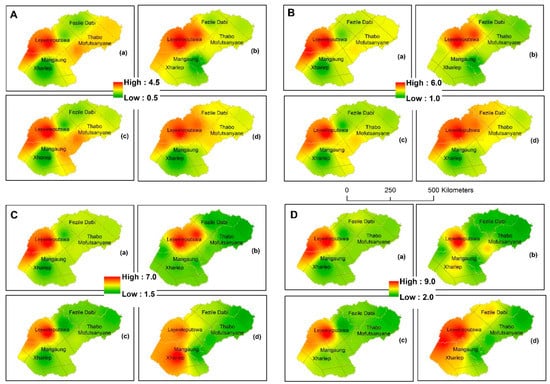
Figure 8.
Spatial distribution of the drought severity return levels for the 5- (a), 10- (b), 20- (c), and 50-year (d) return periods, over the Free State Province from 1980 to 2019: (A) EDI; (B) SPI-3; (C) SPI-6; (D) SPI-12.
3.4.2. Return Level Analysis for Wet Conditions
Table 3 depicts the probable wet duration return levels based on the EDI, SPI-3, SPI-6, and SPI-12 indices in the nine climatic rainfall districts of the Free State Province for the 2-, 5-, 10-, 20- and 50-year return periods. On the basis of the EDI values, the duration of wet conditions ranges from 2 to approximately 4 months for the 5-year return period, 2 to approximately 5 months for the 10-year return period, 2 to approximately 6 months for the 20-year return period, and 2 to approximately 7 months for the 50-year return period. Moreover, the EDI values for Dis72 show the longest wet condition. On the basis of the EDI values for Dis60, -61, -81, and -83 for the period of study, the return levels for wet conditions depict no change across the return periods. The duration of wet conditions in the Free State Province with the SPI-3 ranges from 2 to approximately 4 months for the 5-, 10- and 20-year return periods, and the return level for the 50-year return period is between 2 to approximately 5 months. According to the SPI-3 values, Dis70 exhibits the longest wet conditions. According to the SPI-3 values for Dis81, the return levels for wet duration depict no change across the return periods. With the SPI-6 values, the return levels for the duration of wet conditions for the 5-year event range from 2 to approximately 4 months, 2 to approximately 5 months for the 10-year event, 2 to approximately 6 months for the 20-year event, and 2 to approximately 7 months for the 50-year event. On the basis of the SPI-6, Dis73 shows the longest wet conditions. On the basis of the SPI-6 values for Dis60, -61, -70, -81, -82, and -83, the return levels for wet duration depict no change across the return periods. On the basis of the SPI-12 values, the likely return levels for the durations of wet conditions are: for the 5-year event, from 2 to approximately 5 months; for the 10-year event, the wet duration ranges from 2 to approximately 7 months; for the 20-year event, the wet duration ranges from 2 to approximately 9 months; and for the 50-year event, the wet duration ranges from 2 to approximately 13 months. For the SPI-12, Dis83 exhibits the longest wet conditions. On the other hand, areas covered by Dis81 and -83, exhibit no changes in the return levels for the wet duration across all the selected return periods.

Table 3.
Wet durations return levels for 2-, 5-, 10-, 20-, and 50-year events.
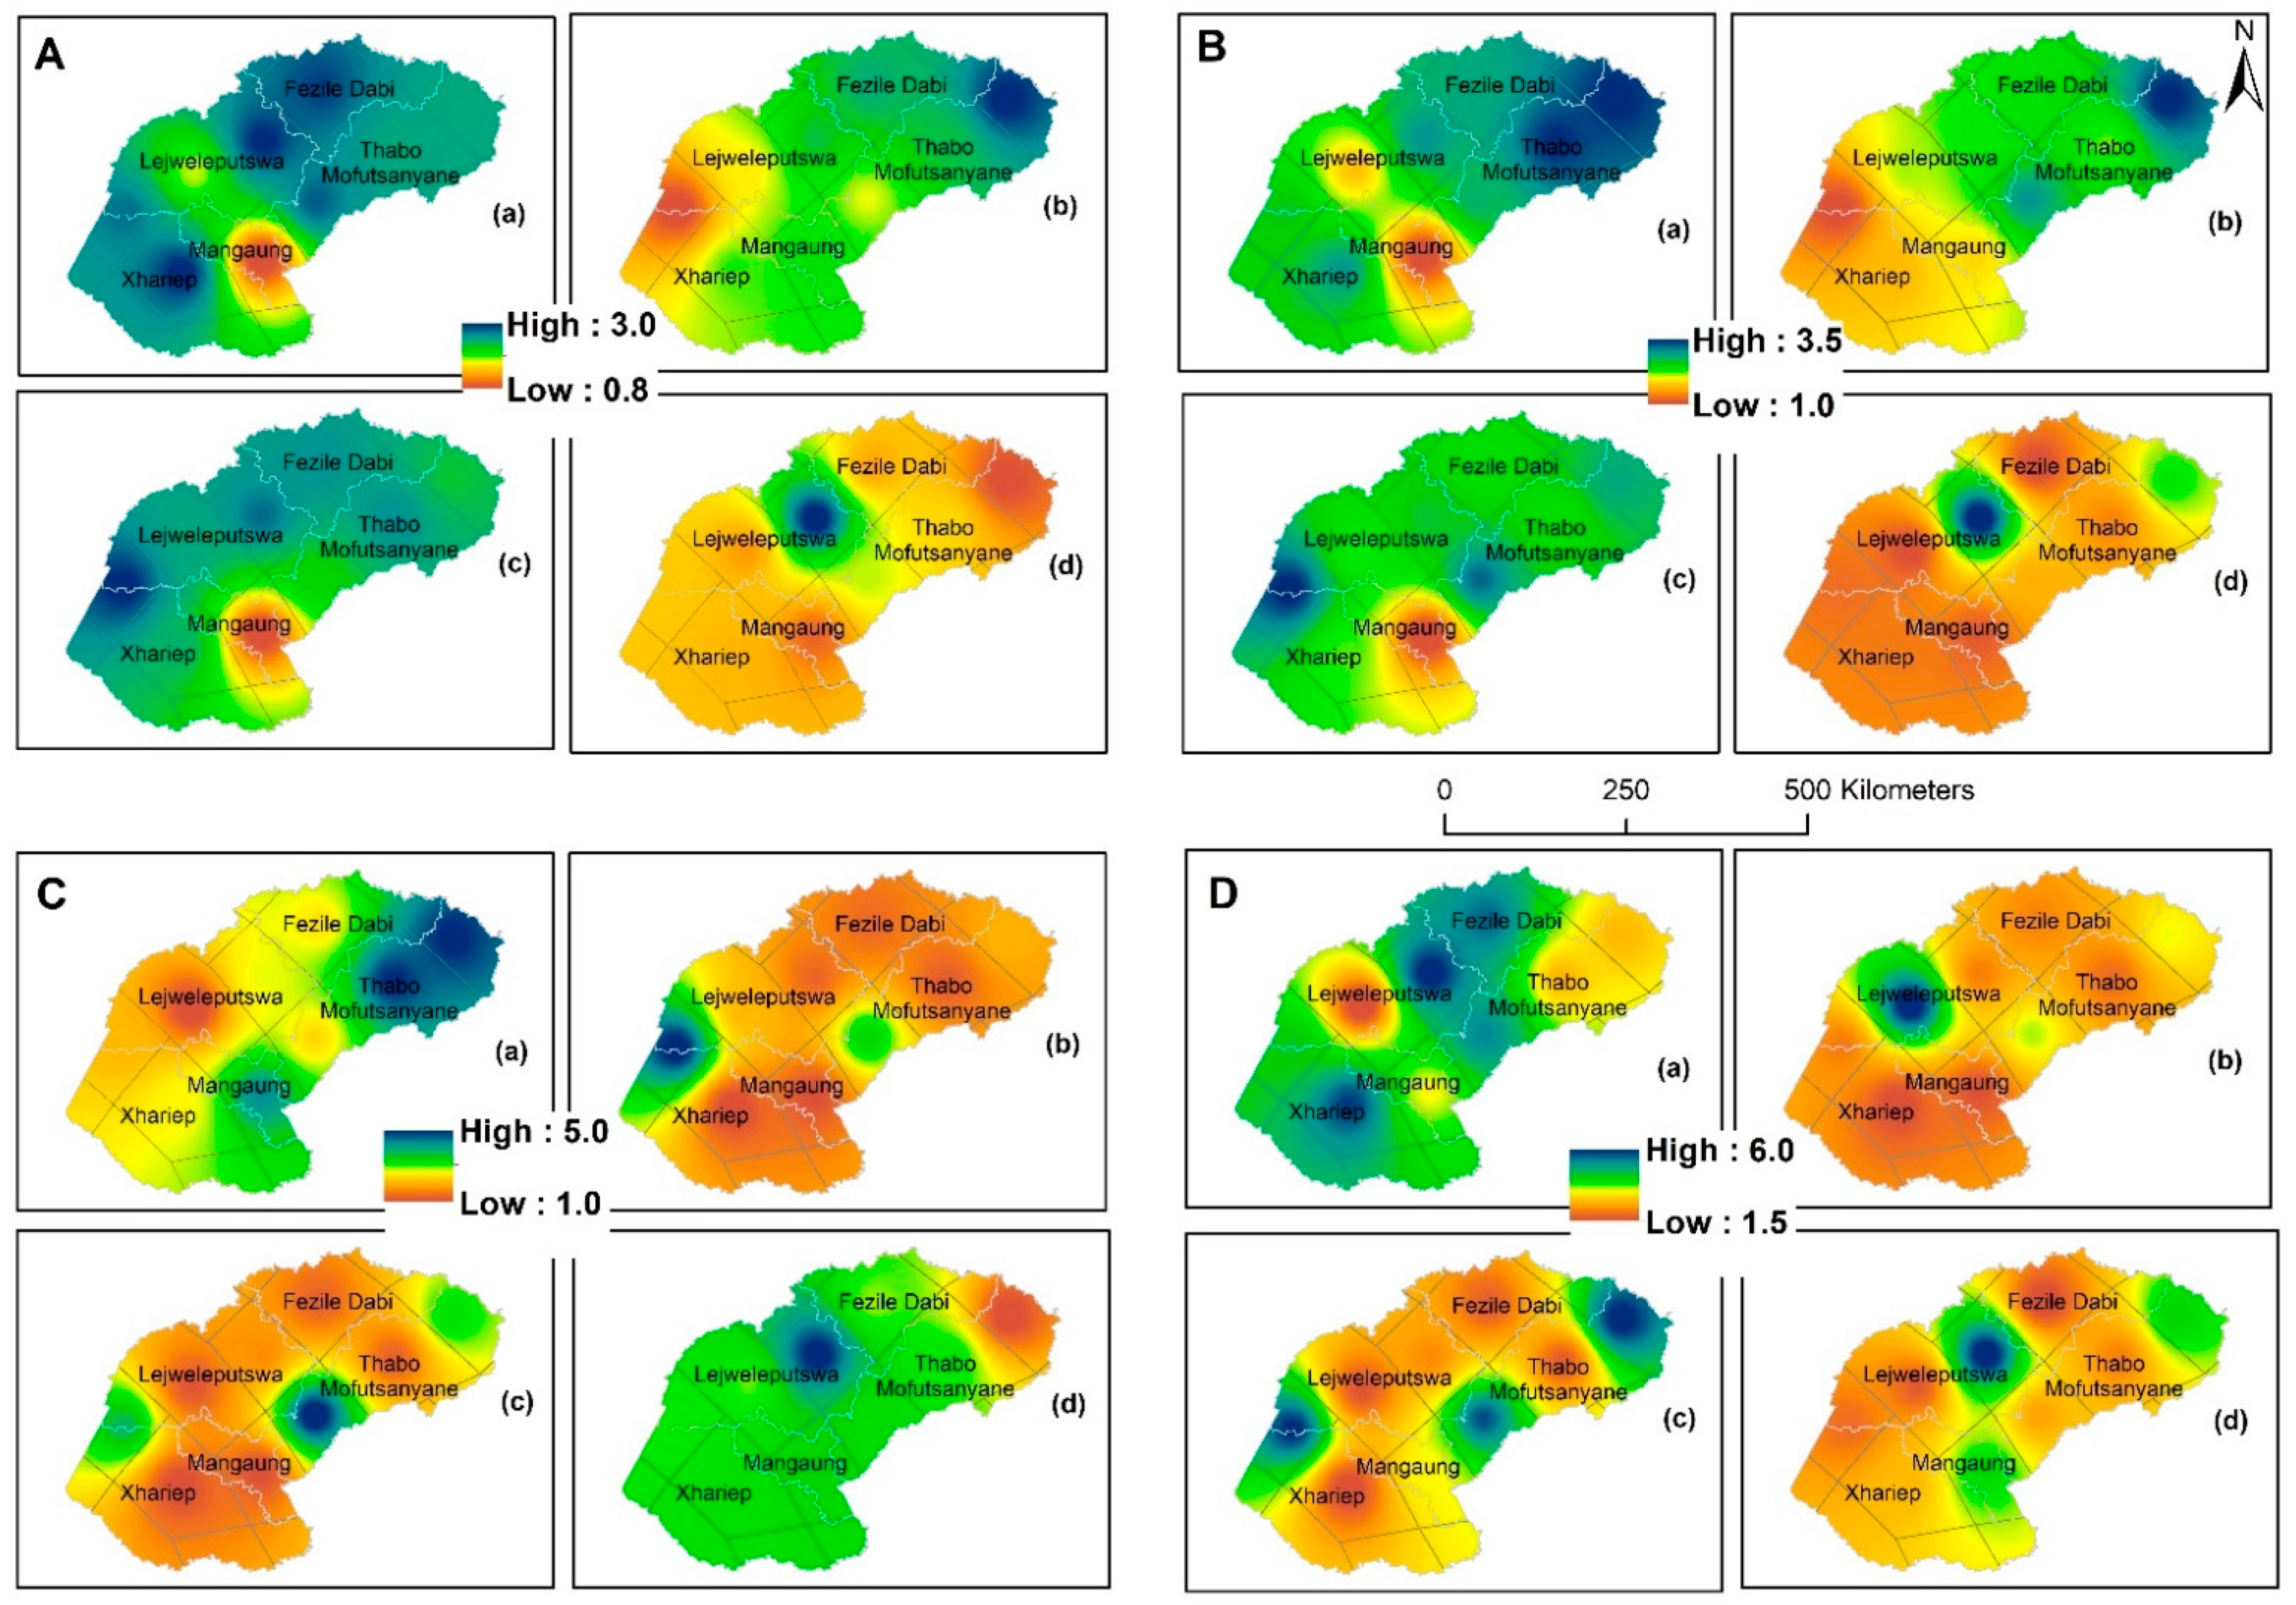
Figure 9 depicts the spatial distribution of wet severity for the 5-, 10-, 20-, and 50-year periods over the Free State Province from 1980 to 2019 using the EDI, SPI-3, SPI-6, and SPI-12 values. According to the EDI analysis, wet severity is expected to increase in Fezile Dabi (Dis73), Lejweleputswa (Dis83), and Xhariep (Dis70), and decrease in Mangaung (Dis71) for the 5-year period. Furthermore, wet severity is expected to increase in Thabo Mofutsanyane (Dis61) and become less in Lejweleputswa (Dis82) for the 10-year period. Additionally, wet severity is expected to increase in Lejweleputswa (Dis81), while less severity is expected in Mangaung (Dis71) for the 20-year period. Wet severity is expected to increase in Lejweleputswa (Dis83), while it is expected to decrease in Thabo Mofutsanyane (Dis61) and Mangaung (Dis71) over the next 50 years. The return levels for wet severity derived from the EDI values show no change across Dis60, -61, and -82 over the selected return periods. Examining the SPI-3 values showed that wet severity is expected to increase in Thabo Mofutsanyane (Dis60 and -61) for the 5- and 10-year periods, in Lejweleputswa (Dis81) for the 20-year period, and in Lejweleputswa (Dis83) for the 50-year period. However, minimal severity is detected in Mangaung (Dis71) for the 5- and 20-year periods; in Lejweleputswa (Dis81) for the 10-year period; and in Fezile Dabi (Dis73), Lejweleputswa (Dis82 and -81), Xhariep (Dis70), and Mangaung (Dis71) for the 50-year period. The return levels for drought severity with the SPI-3 values depict no change in Dis60 and -81 across the years. Furthermore, the SPI-6 values indicate that wet severity is likely to increase in Thabo Mofutsanyane (Dis60 and -61) for the 5-year period; in Lejweleputswa (Dis81) for the 10-year period; in Thabo Mofutsanyane (Dis72) for the 20-year period; and Lejweleputswa (Dis83) for the 50-year period. While less wet severity is likely to occur in Lejweleputswa (DIS 82) for the 5-year period; in Fezile Dabi (Dis73), Thabo Mofutsanyane (Dis60), Mangaung (Dis71), Lejweleputswa (Dis82), and Xhariep (Dis70) for the 10- and 20-year periods; in Lejweleputswa (Dis83) for the 50-year period. No change is detected in drought severity return levels associated with the SPI-6 values in Dis60, -61, -73, and -81 across the years.
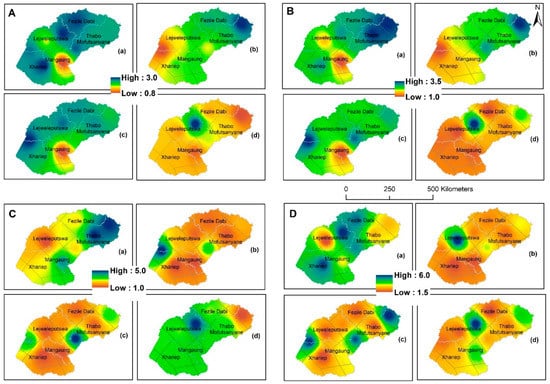
Figure 9.
Spatial distribution of wet severity for the 5- (a), 10- (b), 20- (c), and (d) 50-year (d) periods over the Free State Province from 1980 to 2019: (A) EDI; (B) SPI-3; (C) SPI-6; (D) SPI-12.
With the SPI-12 analysis, wet severity is expected to increase in the following districts: Lejweleputswa (Dis83), Xhariep (Dis70), and Fezile Dabi (Dis73) for the 5-year period; Lejweleputswa (Dis82) for the 10-year period; Thabo Mofutsanyane (Dis61 and -72) for the 20-year period; and Lejweleputswa (Dis83) for the 50-year period. However, less wet severity is expected in Lejweleputswa (Dis82) for the 5-year period; Thabo Mofutsanyane (Dis60), Mangaung (Dis71), and Xhariep (Dis70) for the 10-year period; in Fezile Dabi (Dis73), Thabo Mofutsanyane (Dis60), Lejweleputswa (Dis82), and Xhariep (Dis70) for the 20-year period; and in Fezile Dabi (Dis73), Thabo Mofutsanyane (Dis60), and Lejweleputswa (Dis82) for the 50-year period. Dis60, -61, and -81 depict no change in return levels for the SPI-12 analysis across the years.
3.5. Dry Return Periods Based on Extreme Frequency Analysis (EFA) in the Free State Province
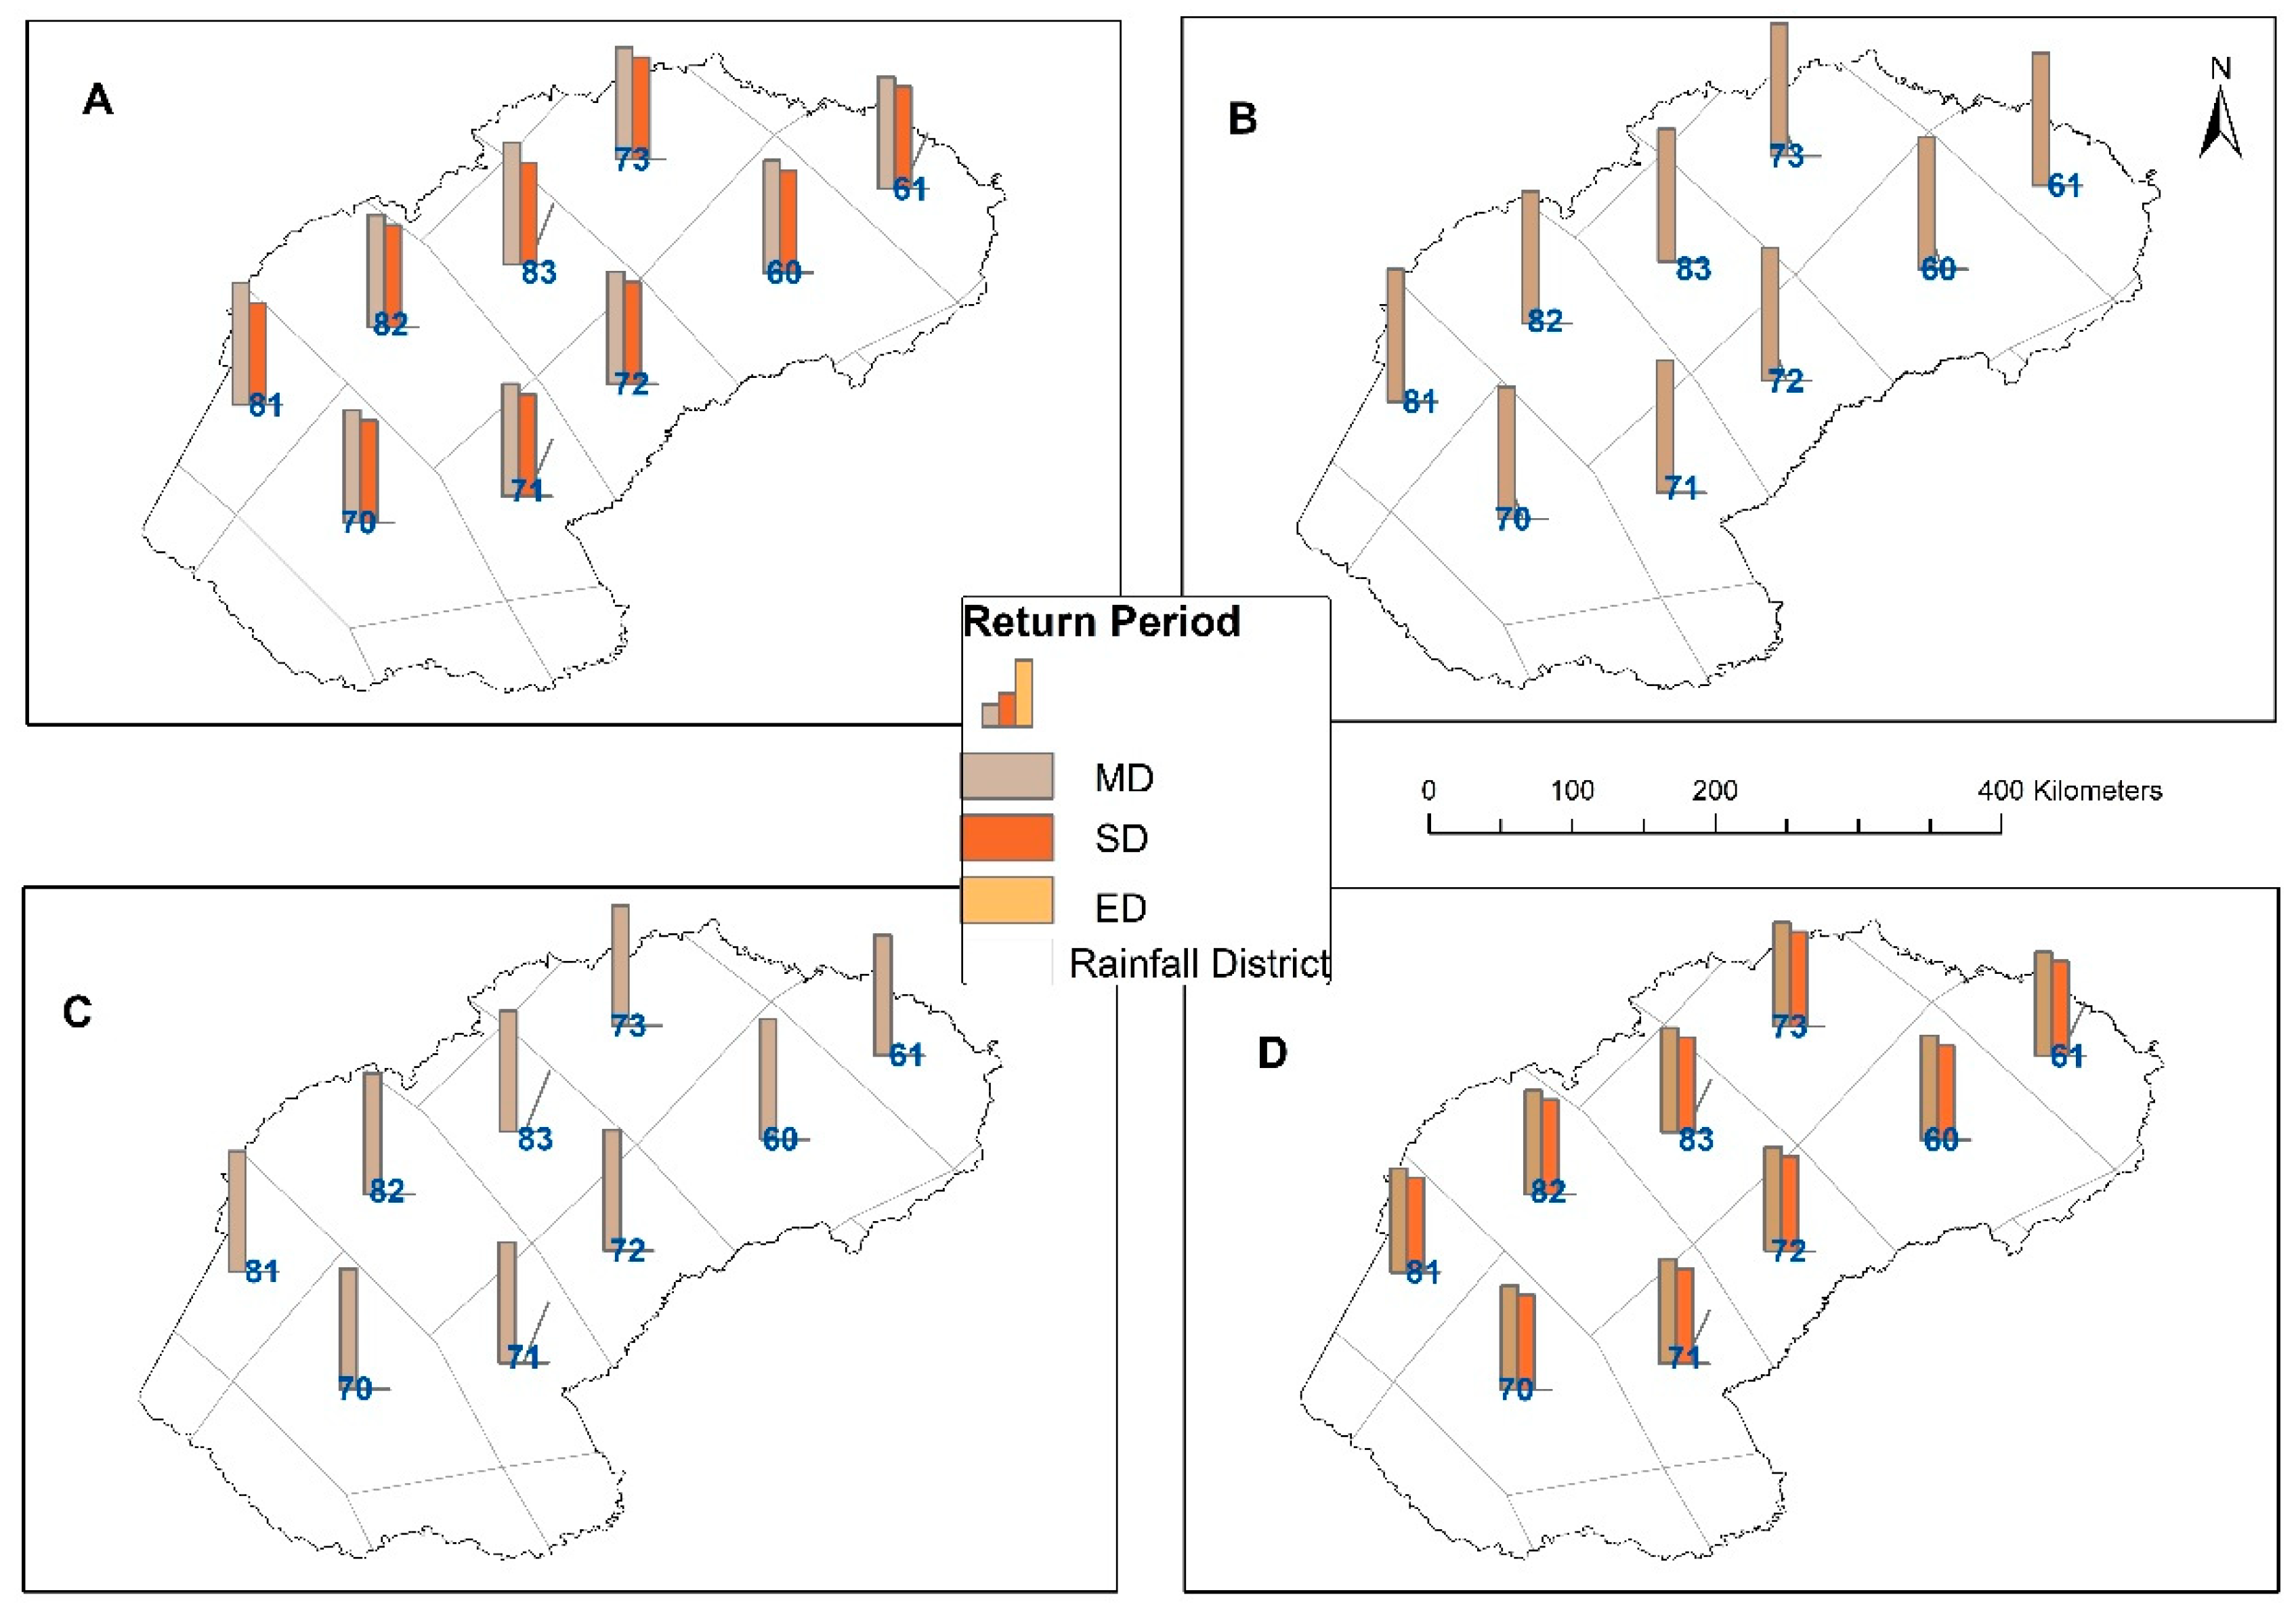
The return period was calculated to ascertain the likelihood of occurrence of a particular magnitude of drought. Here, moderately wet, severely wet, extremely wet, moderately dry, severely dry, and extremely dry are considered (based on Table 1). The results for the return levels over the 4 decades are displayed in Figure 10. In all the rainfall districts, all drought indices show moderately dry conditions with varying return periods; EDI ranging from 1 to 2 years (Table 2 and Figure 10A), for SPI-3 and SPI-6 the moderately dry return period is 1 year (Table 2 and Figure 10B,C), and the SPI-12 return period is 1.1 years (Table 2 and Figure 10D). This indicates a moderately dry climate across the study site. According to the EDI and SPI-12 values, severe dry conditions are observed across the rainfall districts with a 1-year return period. During the study period, none of the drought indices detected extremely dry conditions in any of the rainfall districts.
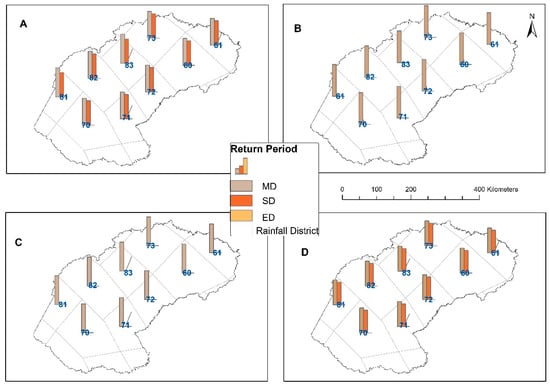
Figure 10.
Return period based on extreme frequency analysis for dry period in the Free State Province: (A) EDI; (B) SPI-3; (C) SPI-6; (D) SPI-12, from 1980 to 2019 (MD, moderately dry; SD, severely dry; ED, extremely dry).
3.6. Wet Return Periods Based on Extreme Frequency Analysis (EFA) in the Free State Province
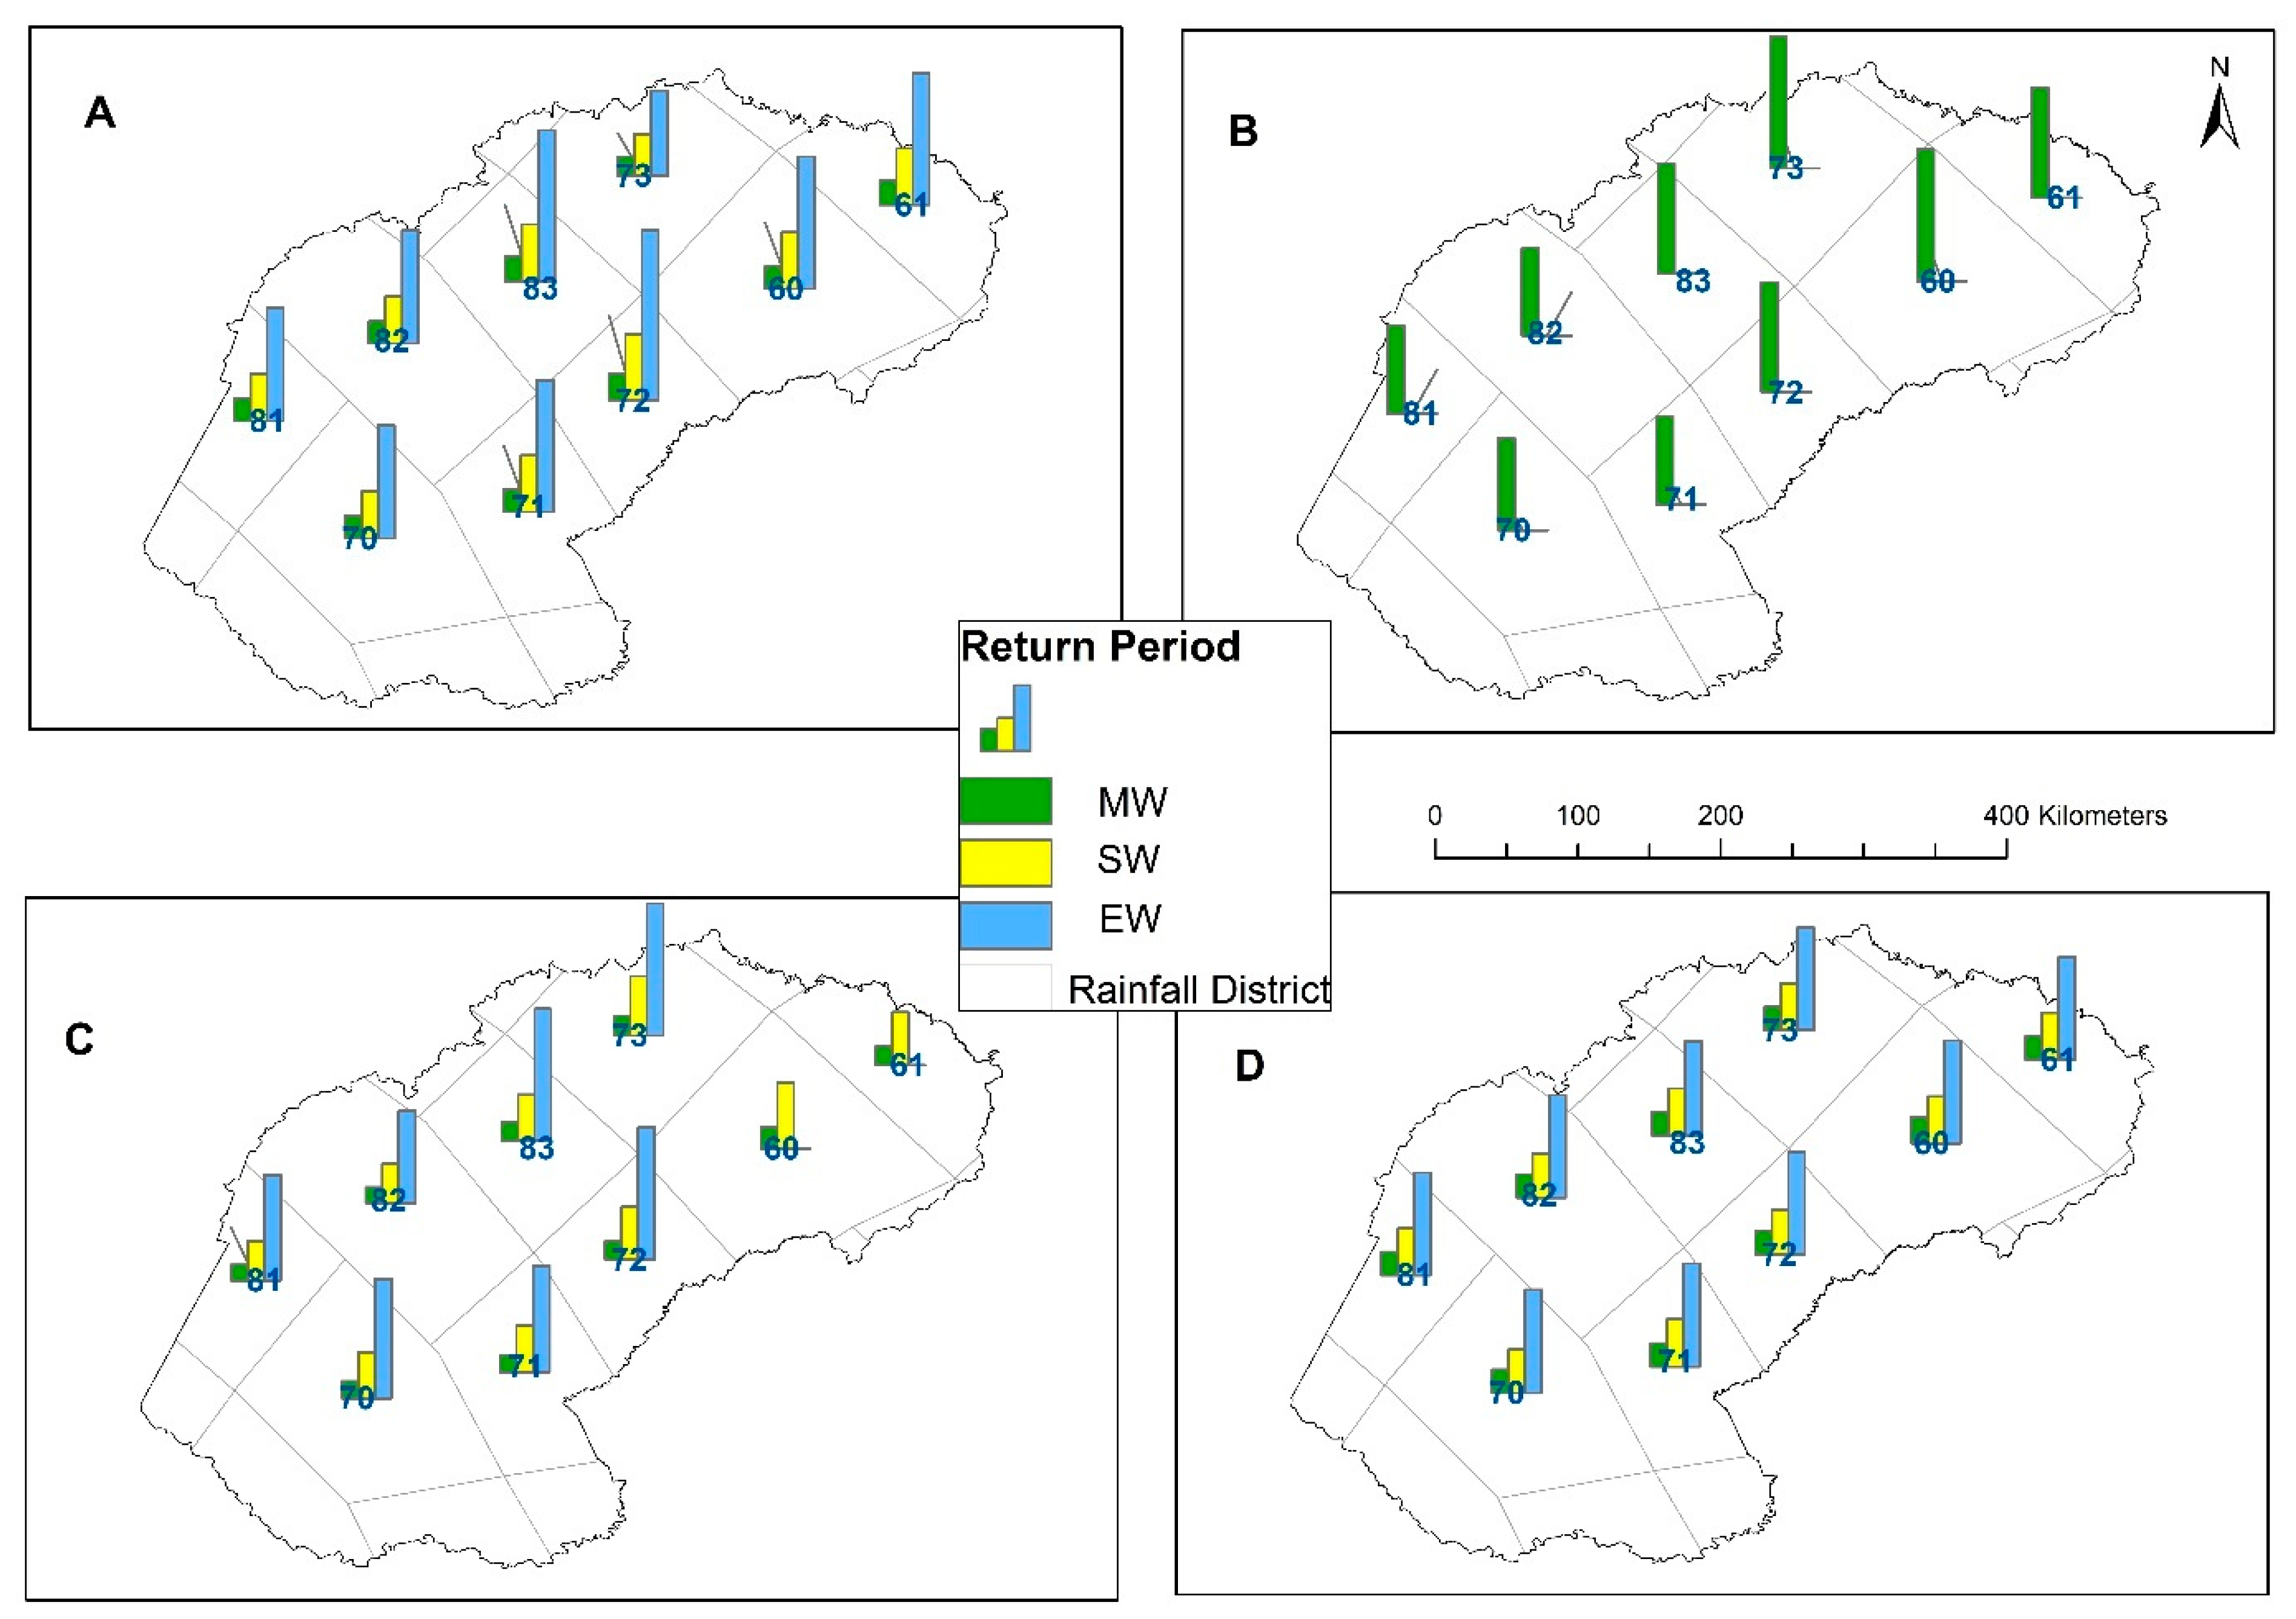
The EDI and SPI indices computed over the study period 1980–2019 exhibit moderately wet conditions across the rainfall districts, with varying return periods (see Figure 11). When the extreme frequency analysis was carried out using the SPI-3 values, all the districts showed a moderately wet condition with the likelihood of its occurrence ranging from 20 to 30 years. The FS Province is likely to experience moderately wet climate ranging between 12 and 16 years based on the SPI-6 analysis. While the return period for EDI values varies from 12 to 14 years, that of SPI-12 values varies from 8 to 9 years. Therefore, the Free State Province is unlikely to experience moderately wet weather regularly. All the rainfall districts of the Free State Province depict severely wet conditions, for example, severe wet conditions are likely to occur with return period ranges from 30 to 40 years (SPI-6), from 25 to 30 years (EDI), and from 15 to 16 years (SPI 12). Extreme wet conditions were observed across the rainfall districts with the exception of Dis60 and -61 for the SPI-6 values. The return periods range from 7 to 100 years (SPI-6), from 60 to 100 years (EDI), and from 32 to 35 years (SPI-12). Therefore, the SF Province is rarely expected to be extremely wet.
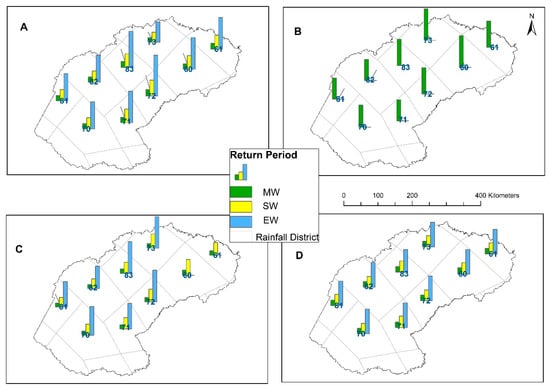
Figure 11.
Return period based on the extreme frequency analysis for wet period in the Free State Province: (A) EDI; (B) SPI-3; (C) SPI-6; (D) SPI-12, from 1980 to 2019 (MW, moderately wet; SW, severely wet; EW, extremely wet).
3.7. Frequency Distribution of Precipitation and the Drought Indices
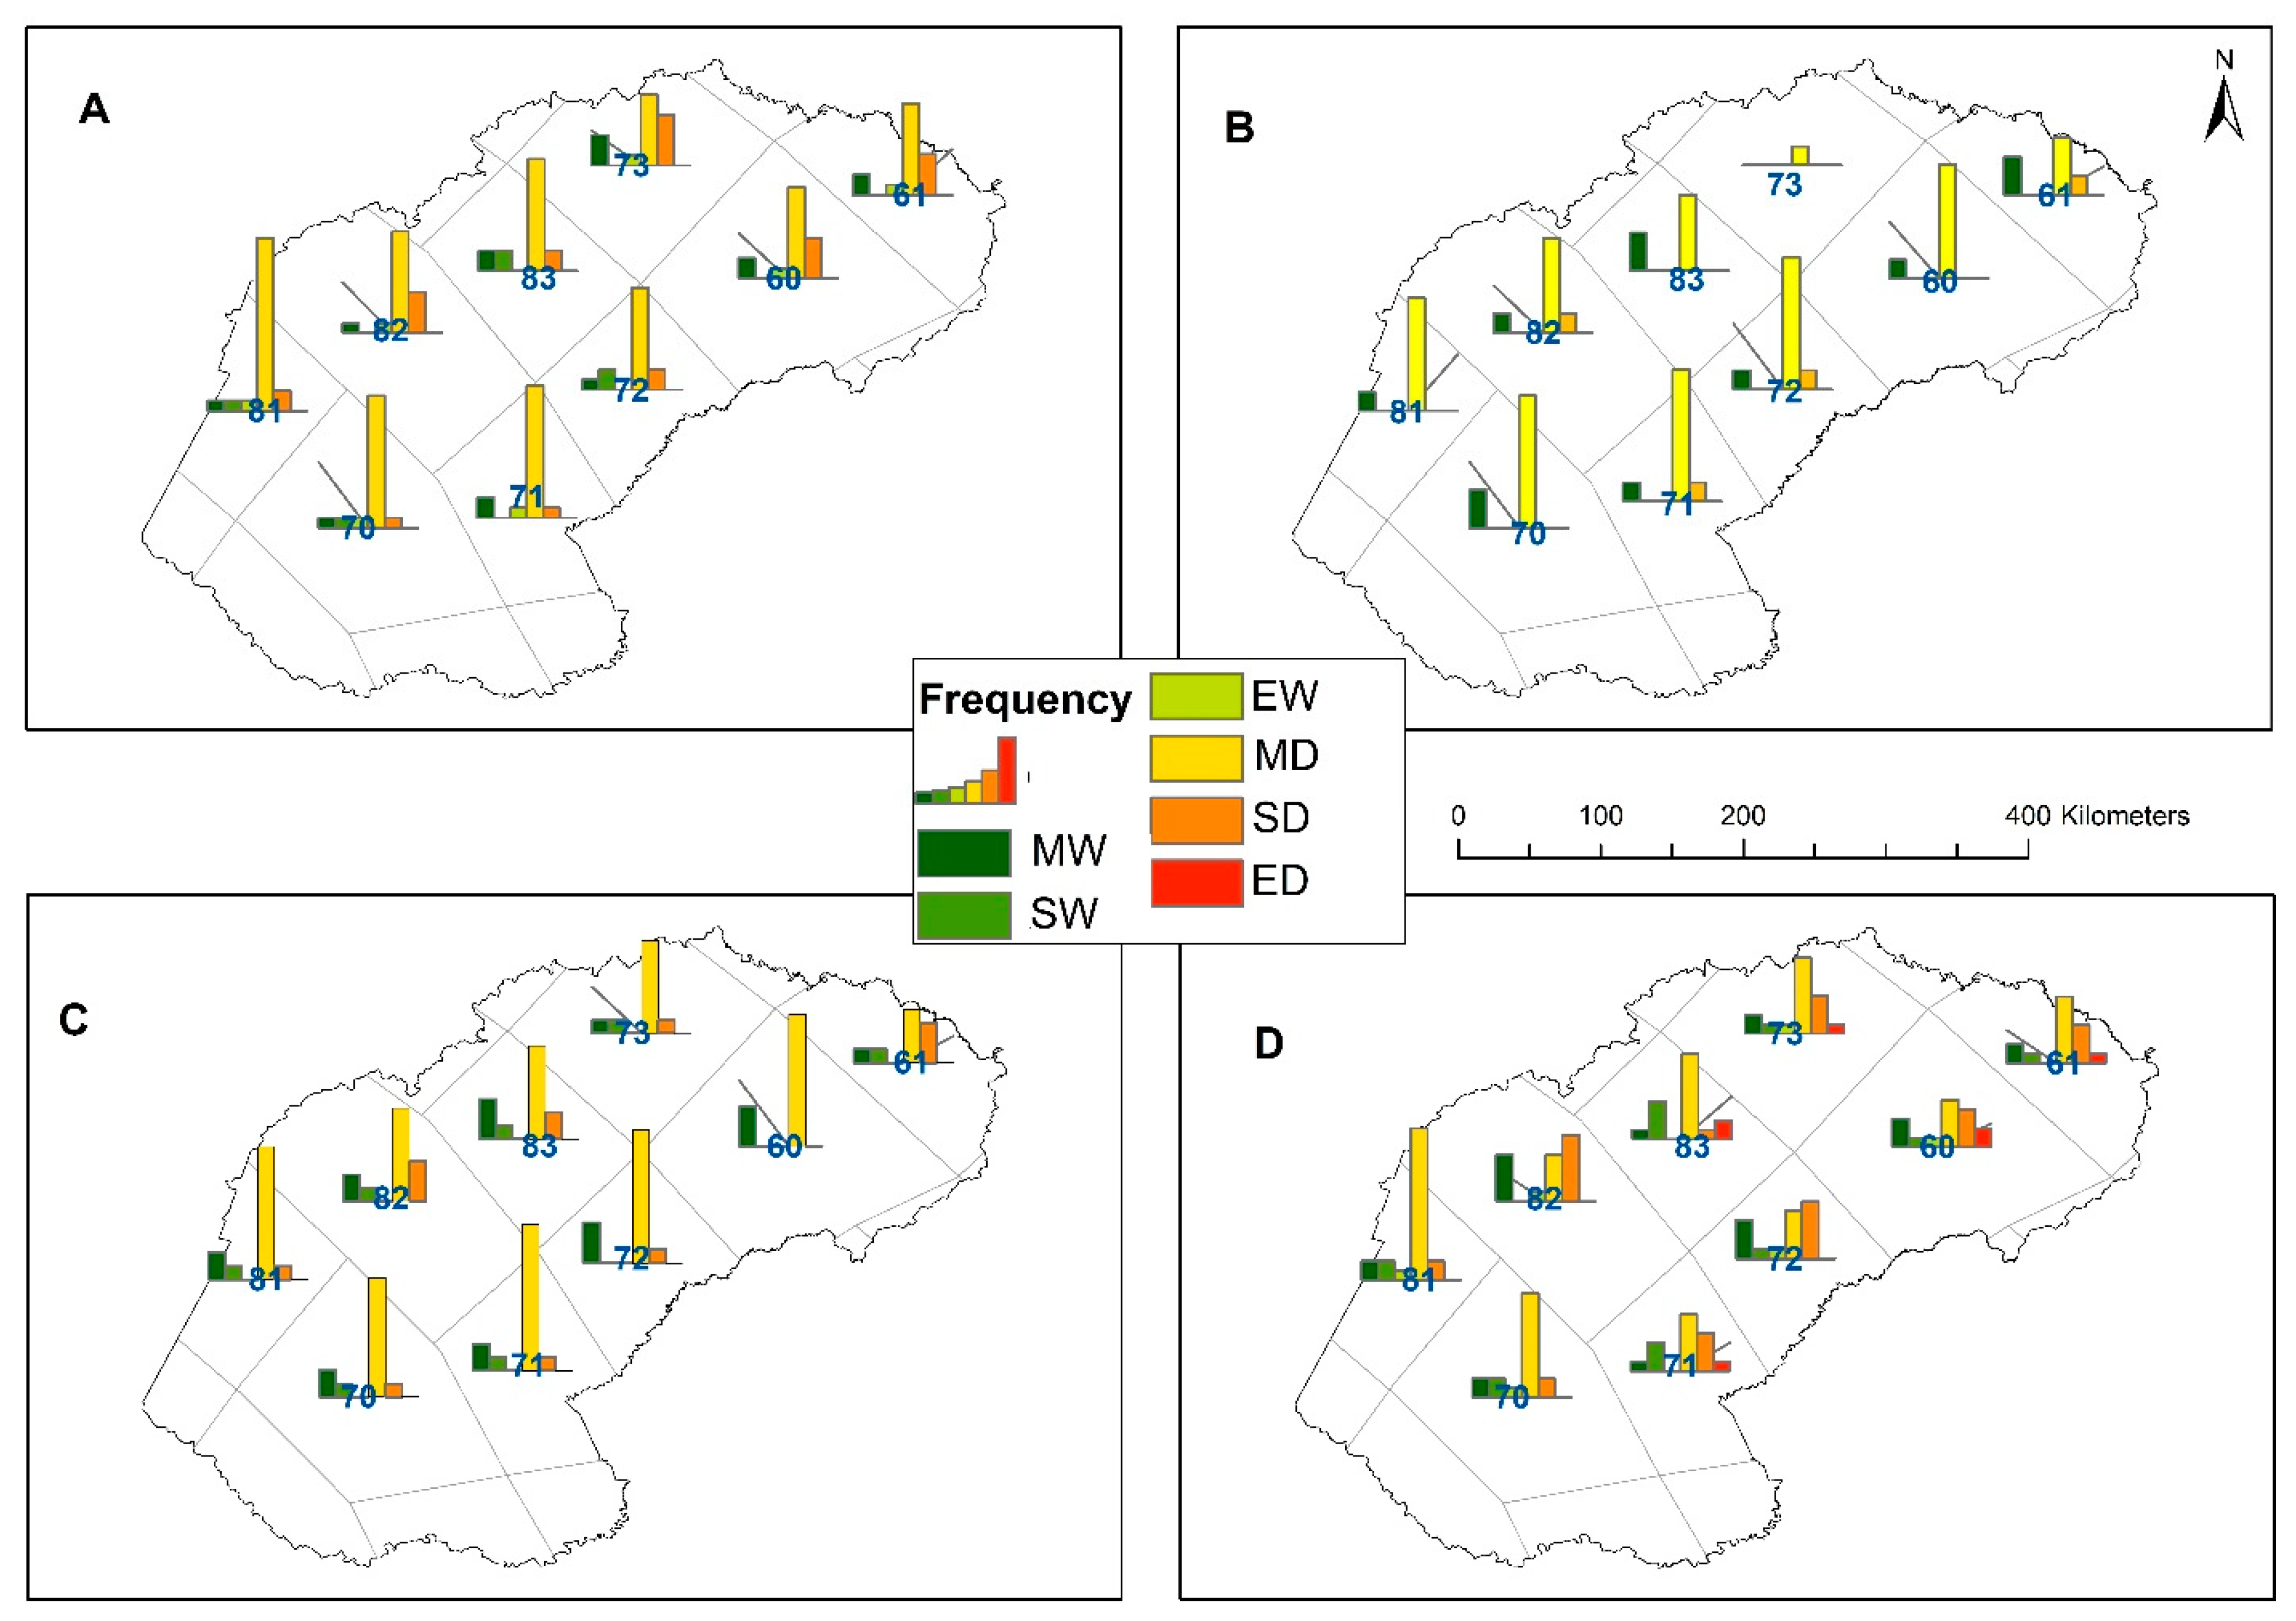
When the drought indices were considered, the results were derived from the frequency distribution as shown in Figure 12A–D (moderately wet, severely wet, extremely wet, moderately dary, severely dry, and extremely dry are based on Table 1). A moderately dry condition occurred about 8–17 times over the four decades (based on EDI), 1–7 (SPI-3), 4–11 (SPI-6), and 5–16 (SPI-12). According to the EDI values, a severe dry condition occurred every 1–4 times. With the SPI-3 values, severely dry conditions occurred once in four districts (Dis61, -71, -72, and -82). Using SPI-6, severe dry conditions occurred from one to three times. Similarly, severe dry conditions occurred starting from the lowest of one time and peaking at seven times for SPI-12 during the period 1980–2019. Extremely dry conditions were detected with the SPI-12 values in the frequency distribution ranging between one and two times throughout the study period. The Free State Province rarely experienced moderately wet conditions, as its frequency ranged from one to two times during the analyzed period (EDI), from one to three times (SPI-6), and from one to five times (SPI-12). Five of the rainfall districts (Dis70, -72, -73, -81, and -83) experienced severe wet conditions, ranging from one to two times (EDI). Severe wet conditions occurred once across the rainfall districts, with the exceptions of Dis60 and -72 (SPI-6). Similar results were observed ranging from one to four times across all the rainfall when the SPI-12 values were considered. The SPI-12 values indicated that extreme wet conditions occurred in six rainfall districts (Dis60, -70, -72, -73, -81, and -82) once during the study period. According to the EDI values, extremely wet conditions occurred once in the following rainfall districts: Dis60, -61, --70, -71, -81, and -82. During the study period, the values of SPI-3 and SPI-6 did not show extremely wet conditions.
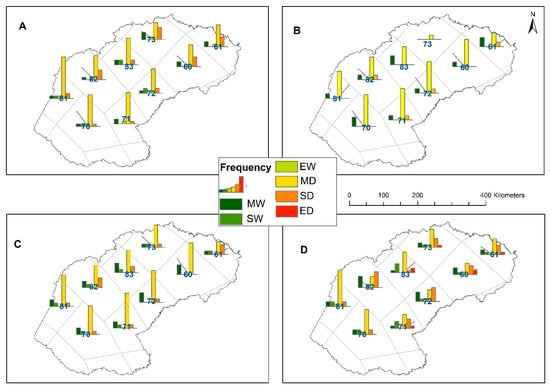
Figure 12.
Frequency of EDI, SPI-3, SPI-6, and SPI-12 in the Free State Province from 1980 to 2019: (A) EDI; (B) SPI-3; (C) SPI-6; (D) SPI-12 (MW, moderately wet; SW, severely wet; EW, extremely wet; MD, moderately dry; SD, severely dry; ED, extremely dry).
4. Discussion and Conclusions
In this study, monthly rainfall totals from nine (9) climatic rainfall districts distributed across the Free State (FS) Province were used to compute the EDI and SPIn (for n = 3-, 6- and 12-month accumulation periods) indices. These indices were used to evaluate precipitation extreme events for the period spanning 1980–2019. The results indicate that the FS Province has experienced a decrease in precipitation over the study period. This is evidenced by negative trends observed in 66.7% of the rainfall districts, although the detected trends were not statistically significant. These findings are in accordance with a study by [18], who reported negative trends in the precipitation concentration index during the period spanning 1985–2015. Moreover, the results agree with a study by [63], who reported increases in extreme rainfall indices over the southern parts of the FS Province during 1910–2004. In addition, [63,64] reported increased dry spell duration observed in most parts of the FS Province over the same period. The decreasing trend in precipitation could be attributed to seasonality effects, leading to high variability in precipitation intensity, distribution patterns, and duration [65]. Other factors may include increases in the occurrences of extreme and inter-annual variability of rainfall within the province [63].
Negative trends were observed in both the EDI and SPI across the accumulation periods and rainfall districts. The results agree a study by [54], who reported negative trends in both the SPI and the Standardized Precipitation Evapotranspiration Index detected in approximately 60% of rain-gauge stations over the FS Province during 1985–2015. Similar results have been reported in neighboring provinces, for example, in the Western Cape [55] as well as the Eastern Cape provinces [53]. The results presented in this study suggest that the Free State Province has continued to experience prolonged drought conditions over the period 1980–2019. The creeping drought conditions, which are attributed to reduced levels of precipitation, resulted in the declaration of the province as a drought disaster area in 2015/2016. The results on the return level analysis suggest that drought conditions are likely to persist into the future. In particular, the return level analysis indicates that drought is likely to increase in duration lasting between 2 and ~7 months based on the EDI and SPI-3 and up to ~20 months from the SPI-6 and -12 accumulation period analyses. Similarly, drought severity is expected to increase with localized districts’ variations.
The Lejweleputswa district municipality is mostly expected higher drought severity across the 5-, 10-, 20-, and 50-year studied periods. In general, the probability of the return levels increases with persisting period, for example, the longer periods (20 and 50 years) show greater return levels in drought duration and severity. It is worth noting that the FS Province is also likely to experience wet conditions in the future, based on the findings associated with 5-, 10-, 20- and 50-year studied periods. The expected wet conditions range between the lowest of 2 to ~6 months (EDI, SPI-3, and SPI-6) and the maximum of ~12 months based on the SPI-12 analysis. Overall, the expected dry and wet conditions exhibit localized variability, with most district municipalities likely to experience mild to moderate conditions. Nonetheless, the impacts of these conditions can be detrimental towards various climate-sensitive and socioeconomic sectors, including water resources, agriculture, food security, health, and energy, among others, within the region.
The FS Province is one of the agricultural food baskets of South Africa [54], contributing between 35 and 40% of the national maize production [66,67]; other agricultural yields include 53% of sorghum, 37% of wheat, 33% of potatoes, 30% of groundnuts, and 18% of meat [67]. The province is also home to manufacturing economic activities, including Sasol, which is considered to be one of the largest synthetic fuel companies in South Africa. Consequently, persistent occurrences of droughts or floods threaten the livelihood of the citizens within the province. South Africa is generally a water scarce country. Prolonged drought conditions are likely to exacerbate water shortages in a province that is facing high unemployment rate, low economic growth, and migration, among other challenges [68].
In conclusion, the results presented in this study can be summarized as follows:
- (a)
- Whilst the return levels for the drought/wet duration and severity of EDI and SPI-3, -6 and -12 values generally showed increasing patterns across the corresponding return periods, the spatial contrasts were only noticeable in the return levels derived from the wet/drought duration and severity derived from SPI-3, -6, and -12 values (and not from the EDI values).
- (b)
- The EFA results point to a noticeable spatial contrast in the return periods derived from the EDI and SPI-3, -6, and -12 values for each of the extreme precipitation categories: moderately wet, severely wet, extremely wet to moderately, and severely dry.
- (c)
- Over the four decades, the Free State Province has generally experienced a suite of extreme precipitation categories ranging from moderately wet, severely wet, extremely wet to moderately dry, severely dry, and extremely dry conditions.
Overall, albeit there are subtle differences, the results illustrate that both EDI and SPI indices capture the inherent trends, return levels, and spatial-temporal contrasts of precipitation extremes. These indices could, therefore, be included in a suite of tools for precipitation extreme monitoring and prediction in support of vulnerable communities and, in particular, small-scale farmers in the Free State Province, South Africa. Therefore, the present study contributes towards implementation of effective drought early warning systems and can be used to enhance drought related policy and decision making in support of water resource management and planning in the FS province.
Author Contributions
O.M.A. conceived the research; O.M.A. and C.M.B. collected and cleaned the data; O.M.A., J.O.B. and A.M.A. analyzed the data; O.M.A. and A.M.A. drafted the original paper; M.M., J.O.B. and C.M.B. edited the draft. All authors have read and agreed to the published version of the manuscript.
Funding
The project reported in this paper is partially funded by SIDA, through the Swedish International Development Cooperation Agency, the Foreign Ministry of the Netherlands, the South African Department of Science and Technology, and USAID under award no. AID-OAA-F-17-00034, and Under Securing Water for Food: A Grand Challenge for Development FRA number SOL-OAA-16-000176. The project is also partially funded by the South Africa Research Foundation (NRF) grant for 2019: Thuthuka Funding Instrument (unique grant no. 117800). This research is also supported by the African Institute for Mathematical Sciences, www.nexteinstein.org (accessed on 3 October 2021), with financial support from the Government of Canada, provided through Global Affairs Canada, www.international.gc.ca (accessed on 3 October 2021), and the International Development Research Centre, www.idrc.ca (accessed on 3 October 2021).
Institutional Review Board Statement
The study does not involve the use of humans or animals.
Informed Consent Statement
Not applicable.
Data Availability Statement
Data used for this study can be made available upon request.
Acknowledgments
The authors gratefully acknowledge financial support from the Department of Science and Technology (DST), the National Research Foundation (NRF) and the African Institute for Mathematical Sciences (AIMS).
Conflicts of Interest
The authors declare no conflict of interest.
References
- Dalu, M.T.; Shackleton, C.M.; Dalu, T. Influence of land cover, proximity to streams and household topographical location on flooding impact in informal settlements in the Eastern Cape, South Africa. Int. J. Disaster Risk Reduct. 2018, 28, 481–490. [Google Scholar] [CrossRef]
- Simane, B.; Beyene, H.; Deressa, W.; Kumie, A.; Berhane, K.; Samet, J. Review of climate change and health in Ethiopia: Status and gap analysis. Ethiop J. Health Dev. 2016, 30, 28–41. [Google Scholar] [PubMed]
- Ligtvoet, W.; Van Minnen, J.; Franken, R. The Effect of Climate Change in the Netherlands: 2012; PBL Netherlands Environmental Assessment Agency: The Hague, The Netherlands, 2013. [Google Scholar]
- Gornall, J.; Betts, R.; Burke, E.; Clark, R.; Camp, J.; Willett, K.; Wiltshire, A. Implications of climate change for agricultural productivity in the early twenty-first century. Philos. Trans. R. Soc. B Biol. Sci. 2010, 365, 2973–2989. [Google Scholar] [CrossRef] [PubMed]
- Bates, B.C.; Kundzewicz, Z.W.; Wu, S.; Palutikof, J.P. (Eds.) Climate Change and Water; Technical Paper of the Intergovernmental Panel on Climate Change; IPCC Secretariat: Geneva, Switzerland, 2008; p. 210. [Google Scholar]
- Douglas, I.; Alam, K.; Maghenda, M.; Mcdonnell, Y.; Mclean, L.; Campbell, J. Unjust waters: Climate change, flooding and the urban poor in Africa. Environ. Urban. 2008, 20, 187–205. [Google Scholar] [CrossRef]
- Turral, H.; Burke, J.; Faures, J.M. Climate Change, Water and Food Security; FAO: Rome, Italy, 2008. [Google Scholar]
- Nchito, W.S. Flood risk in unplanned settlements in Lusaka. Environ. Urban. 2007, 19, 539–551. [Google Scholar] [CrossRef]
- Kjeldsen, T.; Smithers, J.; Schulze, R. Regional flood frequency analysis in the KwaZulu-Natal province, South Africa, using the index-flood method. J. Hydrol. 2002, 255, 194–211. [Google Scholar] [CrossRef]
- Tebaldi, C.; Hayhoe, K.; Arblaster, J.M.; Meehl, G.A. Going to the Extremes—An Intercomparison of Model-Simulated His-torical and Future Changes in Extreme Events. Clim. Chang. 2006, 79, 185–211. [Google Scholar] [CrossRef]
- Abiodun, B.J.; Makhanya, N.; Petja, B.; Abatan, A.A.; Oguntunde, P.G. Future projection of droughts over major river basins in Southern Africa at specific global warming levels. Theor. Appl. Clim. 2018, 137, 1785–1799. [Google Scholar] [CrossRef]
- Trenberth, K. Changes in precipitation with climate change. Clim. Res. 2011, 47, 123–138. [Google Scholar] [CrossRef]
- Marengo, J.A.; Torres, R.R.; Alves, L.M. Drought in Northeast Brazil—Past, Present, and Future. Theor. Appl. Climatol. 2016, 129, 1189–1200. [Google Scholar] [CrossRef]
- Wilhite, D.A.; Glantz, M.H. Understanding: The Drought Phenomenon: The Role of Definitions. Water Int. 1985, 10, 111–120. [Google Scholar] [CrossRef]
- Cunha, A.P.; Tomasella, J.; Ribeiro-Neto, G.G.; Brown, M.; Garcia, S.R.; Brito, S.B.; Carvalho, M.A. Changes in the spatial-temporal patterns of droughts in the Brazilian Northeast. Atmos. Sci. Lett. 2018, 19, e855. [Google Scholar] [CrossRef]
- Cunha, A.P.; Zeri, M.; Leal, K.D.; Costa, L.; Cuartas, L.A.; Marengo, J.A.; Tomasella, J.; Vieira, R.M.; Barbosa, A.A.; Cunningham, C.; et al. Extreme Drought Events over Brazil from 2011 to 2019. Atmosphere 2019, 10, 642. [Google Scholar] [CrossRef]
- Tyson, P.D.; Whyte, R.A. The Weather and Climate of South Africa; Oxford University Press: Cape Town, Southern Africa, 2000; pp. 212–213. ISBN 0195718062. [Google Scholar]
- Botai, C.; Botai, J.O.; Adeola, A. Spatial distribution of temporal precipitation contrasts in South Africa. South Afr. J. Sci. 2018, 114, 70–78. [Google Scholar] [CrossRef]
- Adisa, O.M.; Botai, J.O.; Adeola, A.M.; Botai, C.M.; Hassen, A.; Darkey, D.; Tesfamariam, E.; Adisa, A.T.; Adisa, A.F. Analysis of drought conditions over major maize producing provinces of South Africa. J. Agric. Meteorol. 2019, 75, 173–182. [Google Scholar] [CrossRef]
- Woli, P.; Jones, J.E.; Ingram, K.; Paz, J. Forecasting Drought Using the Agricultural Reference Index for Drought (ARID): A Case Study. Weather Forecast. 2013, 28, 427–443. [Google Scholar] [CrossRef]
- Bhalme, H.N.; Mooley, D.A. Large-Scale droughts/floods and monsoon circulation. Mon. Weather Rev. 1980, 108, 1197–1211. [Google Scholar] [CrossRef]
- Palmer, W.C. Keeping Track of Crop Moisture Conditions, Nationwide: The New Crop Moisture Index. Weatherwise 1968, 21, 156–161. [Google Scholar] [CrossRef]
- Wu, H.; Hayes, M.J.; Weiss, A.; Hu, Q. An evaluation of the Standardized Precipitation Index, the China-Z Index and the Statistical Z-Score. Int. J. Clim. 2001, 21, 745–758. [Google Scholar] [CrossRef]
- Byun, H.; Wilhite, D.A. Objective quantification of drought severity and duration. J. Clim. 1999, 12, 2747–2756. [Google Scholar] [CrossRef]
- Tsakiris, G.; Pangalou, D.; Vangelis, H. Regional Drought Assessment Based on the Reconnaissance Drought Index (RDI). Water Resour. Manag. 2006, 21, 821–833. [Google Scholar] [CrossRef]
- Hollinger, S.E.; Isard, S.A.; Welford, M.R. A new soil moisture drought index for predicting crop yields. In Proceedings of the 8th Conference on Applied Climatology, Anaheim, CA, USA, 17–22 January 1993; pp. 187–190. [Google Scholar]
- Narasimhan, B.; Srinivasan, R. Development and evaluation of Soil Moisture Deficit Index (SMDI) and Evapotranspiration Deficit Index (ETDI) for agricultural drought monitoring. Agric. For. Meteorol. 2005, 133, 69–88. [Google Scholar] [CrossRef]
- Vicente-Serrano, S.M.; Beguería, S.; Lopez-Moreno, I. A Multiscalar Drought Index Sensitive to Global Warming: The Standardized Precipitation Evapotranspiration Index. J. Clim. 2010, 23, 1696–1718. [Google Scholar] [CrossRef]
- McKee, T.B.; Doesken, N.J.; Kleist, J. The relationship of drought frequency and duration to time scales. In Proceedings of the 8th Conference on Applied Climatology, Anaheim, CA, USA, 17–22 January 1993; pp. 179–184. [Google Scholar]
- Shafer, B.A.; Dezman, L.E. Development of a surface water supply index (SWSI) to assess the severity of drought conditions in snowpack runoff areas. In Proceedings of the 50th Annual Western Snow Conference, Colorado State University, Fort Collins, CO, USA, 19–23 April 1982; pp. 164–175. (In Preprints). [Google Scholar]
- Dalezios, N.; Blanta, A.; Spyropoulos, N.; Tarquis, A. Risk identification of agricultural drought for sustainable agroecosys-tems. Nat. Hazards Earth Syst. Sci. 2014, 14, 2435–2448. [Google Scholar] [CrossRef]
- WMO (World Meteorological Organization). Drought and Agriculture; Technical Note No. 138, Report of the CAgM Workin Group on Assessment of Drough; WMO: Geneva, Switzerland, 1975; p. 127. [Google Scholar]
- Jain, V.K.; Pandey, R.P.; Jain, M.; Byun, H.-R. Comparison of drought indices for appraisal of drought characteristics in the Ken River Basin. Weather. Clim. Extremes 2015, 8, 1–11. [Google Scholar] [CrossRef]
- Morid, S.; Smakhtin, V.; Moghaddasi, M. Comparison of seven meteorological indexes for drought monitoring in Iran. Int. J. Climatol. 2006, 26, 971–985. [Google Scholar] [CrossRef]
- Keyantash, J.; Dracup, J.A. The Quantification of Drought: An Evaluation of Drought Indices. Bull. Am. Meteorol. Soc. 2002, 83, 1167–1180. [Google Scholar] [CrossRef]
- Okpara, J.N.; Tarhule, A. Evaluation of drought indices in the Niger Basin, West Africa. J. Geogr. Earth Sci. 2015, 3, 1–32. [Google Scholar]
- Adisa, O.M.; Masinde, M.; Botai, J.O. Assessment of the Dissimilarities of EDI and SPI Measures for Drought Determination in South Africa. Water 2021, 13, 82. [Google Scholar] [CrossRef]
- Reis, D.; Stedinger, J.R. Bayesian MCMC flood frequency analysis with historical information. J. Hydrol. 2005, 313, 97–116. [Google Scholar] [CrossRef]
- Bobee, B.; Rasmussen, P.F. Recent Advances in Flood Frequency Analysis. U.S. National Report 1991–1994. In Proceedings of the Twenty-First General Assembly International Union of Geodesy and Geophysics Boulder, Boulder, CO, USA, 2–14 July 1995; pp. 1111–1116. [Google Scholar]
- Van Campenhout, J.; Houbrechts, G.; Peeters, A.; Petit, F. Return Period of Characteristic Discharges from the Comparison between Partial Duration and Annual Series, Application to the Walloon Rivers (Belgium). Water 2020, 12, 792. [Google Scholar] [CrossRef]
- Kanae, S.; Oki, T.; Kashida, A. Changes in Hourly Heavy Precipitation at Tokyo from 1890 to 1999. J. Meteorol. Soc. JPN. 2004, 82, 241–247. [Google Scholar] [CrossRef]
- IPCC. Working Group I Contribution to the IPCC Fifth Assessment Report, Climate Change 2013: The Physical Science Basis; IPCC: Geneva, Switzerland, 2013. [Google Scholar]
- IPCC. Climate change 2007: Impacts, Adaptations, and Vulnerability. Contribution of Working Group Fourth Assessment Report of the IPCC.; Parry, M.L., Canziani, O.F., Palutikof, J.P., van der Linden, P.J., Hanson, C.E., Eds.; Cambridge University Press: Cambridge, UK, 2007. [Google Scholar]
- Nicholson, S.E.; Nash, D.J.; Chase, B.M.; Grab, S.W.; Shanahan, T.M.; Verschuren, D.; Asrat, A.; Lézine, A.M.; Umer, M. Tem-perature variability over Africa during the last 2000 years. Holocene 2013, 23, 1085–1094. [Google Scholar] [CrossRef]
- Stern, D.I.; Gething, P.; Kabaria, C.; Temperley, W.H.; Noor, A.M.; Okiro, E.; Shanks, G.D.; Snow, R.; Hay, S. Temperature and Malaria Trends in Highland East Africa. PLoS ONE 2011, 6, e24524. [Google Scholar] [CrossRef]
- Giuliani, M.; Li, Y.; Castelletti, A.; Gandolfi, C. A coupled human-natural systems analysis of irrigated agriculture under changing climate. Water Resour. Res. 2016, 52, 6928–6947. [Google Scholar] [CrossRef]
- Zhang, X.; Harvey, K.D.; Hogg, W.D.; Yuzyk, T.R. Trends in Canadian streamflow. Water Resour. Res. 2001, 37, 987–998. [Google Scholar] [CrossRef]
- Brabets, T.P.; Walvoord, M.A. Trends in streamflow in the Yukon River Basin from 1944 to 2005 and the influence of the Pacific Decadal Oscillation. J. Hydrol. 2009, 371, 108–119. [Google Scholar] [CrossRef]
- Love, D.; Uhlenbrook, S.; Twomlow, S.; van der Zaag, P. Changing hydroclimatic and discharge patterns in the northern Limpopo Basin, Zimbabwe. SA J. Radiol. 2010, 36, 1–14. [Google Scholar]
- Kruger, A.; Nxumalo, M. Historical rainfall trends in South Africa: 1921–2015. Water SA 2017, 43, 285. [Google Scholar] [CrossRef]
- Muchuru, S.; Botai, C.M.; Botai, J.O.; Adeola, A.M. The hydrometeorology of the Kariba Catchment Area based on the Prob-ability distributions. Earth Interact. 2015, 19, 1–18. [Google Scholar] [CrossRef]
- Arreyndip, N.A.; Joseph, E. Generalized extreme value distribution models for the assessment of seasonal wind energy po-tential of Debuncha, Cameroon. J. Renew. Energy 2016, 2016, 9357812. [Google Scholar]
- Botai, C.M.; Botai, J.O.; Adeola, A.M.; deWit, J.P.; Ncongwane, K.P.; Zwane, N.N. Drought risk assessment in the Eastern Cape Province of South Africa. Copulas Lens. Water 2020, 12, 1938. [Google Scholar]
- Botai, C.M.; Botai, J.O.; Dlamini, L.; Zwane, N.; Phaduli, E. Characteristics of Droughts in South Africa: A Case Study of Free State and Northwest Provinces. Water 2016, 8, 439. [Google Scholar] [CrossRef]
- Botai, C.M.; Botai, J.O.; De Wit, J.P.; Ncongwane, K.P.; Adeola, A.M. Drought Characteristics over the Western Cape Province, South Africa. Water 2017, 9, 876. [Google Scholar] [CrossRef]
- Rouault, M.; Richard, Y. Intensity and spatial extent of droughts in southern Africa. Geophys. Res. Lett. 2005, 32, 1–4. [Google Scholar] [CrossRef]
- Free State Province (FSP). Free State Province Provincial Growth and Development Strategy (PGDS) 2005–2014; Free State Provincial Government: Bloemfontein, South Africa, 2005; p. 18.
- Hamed, K.; Rao, A.R. A modified Mann-Kendall trend test for autocorrelated data. J. Hydrol. 1998, 204, 182–196. [Google Scholar] [CrossRef]
- Coles, S. An Introduction to Statistical Modeling of Extreme Values; Springer: London, UK, 2001. [Google Scholar] [CrossRef]
- Kumar, S.; Merwade, V.; Kam, J.; Thurner, K. Streamflow trends in Indiana: Effects of long term persistence, precipitation and subsurface drains. J. Hydrol. 2009, 374, 171–183. [Google Scholar] [CrossRef]
- Klemow, M.K.; Bartlow, A.; Crawford, J.; Kocher, N.; Shah, J.; Ritsick, M. Herbal Medicine Biomolecular and Clinical Aspects, 2nd ed.; Benzie, I.F.F., Wachtel-Galor, S., Eds.; CRC Press: Boca Raton, FL, USA, 2011; ISBN 9781439807132. [Google Scholar]
- Brunet-Moret, Y. Rank statistics. Mr. Cah. Orstom. Série Hydrol. 1973, 10, 133–151. [Google Scholar]
- Kruger, A.C. Observed trends in daily precipitation indices in South Africa: 1910–2004. Int. J. Clim. 2006, 26, 2275–2285. [Google Scholar] [CrossRef]
- Moeletsi, M.; Walker, S. Rainy season characteristics of the Free State Province of South Africa with reference to rain-fed maize production. Water SA 2012, 38, 775–782. [Google Scholar] [CrossRef]
- Thomas, A.C.; Pershing, A.J.; Friedland, K.D.; Nye, J.; Mills, K.E.; Alexander, M.A.; Record, N.R.; Weatherbee, R.; Henderson, M.E. Seasonal trends and phenology shifts in sea surface temperature on the North American northeastern continental shelf. Elem. Sci. Anthr. 2017, 5, 48. [Google Scholar] [CrossRef]
- Moeletsi, M.; Moopisa, S.G.; Walker, S.; Tsubo, M. Development of an agroclimatological risk tool for dryland maize production in the Free State Province of South Africa. Comput. Electron. Agric. 2013, 95, 108–121. [Google Scholar] [CrossRef]
- Department of Agriculture, Forestry and Fisheries. Abstract of Agricultural Statistics; National Department of Agri-culture, Forestry and Fisheries: Pretoria, South Africa, 2019; p. 8. Available online: www.daff.gov.za (accessed on 5 October 2021).
- Free State Economy Green Strategy. 2014. Available online: https://www.environment.gov.za/sites/default/files/docs/greeneconomystrategy_freestate.pdf (accessed on 21 September 2021).
Publisher’s Note: MDPI stays neutral with regard to jurisdictional claims in published maps and institutional affiliations. |
© 2021 by the authors. Licensee MDPI, Basel, Switzerland. This article is an open access article distributed under the terms and conditions of the Creative Commons Attribution (CC BY) license (https://creativecommons.org/licenses/by/4.0/).

