Parsimonious Models of Precipitation Phase Derived from Random Forest Knowledge: Intercomparing Logistic Models, Neural Networks, and Random Forest Models
Abstract
:1. Introduction
2. Study Area and Data
3. Methods
3.1. Quality Control of Data
3.2. Precipitation Phase Forecasting
3.2.1. Data Availability Scenarios (DAS)
3.2.2. Logistic Models
- : fraction of rain;
- parameters to be calibrated;
- air temperature and relative humidity (predictors used in the model).
- is a temperature. For LM2 and LM3, Th and Td were used;
- are parameters to be calibrated.
3.2.3. Artificial Neural Networks Models
3.2.4. Random Forest Models
3.2.5. Metrics of Evaluation
Metrics of Fraction Quantification
- and are the standard deviation of the simulated and the observed fractions.
- is the linear correlation.
Metrics of Detection
- and are the observed and the simulated snow indicators.
Normalization of Metrics
- is the normalized value of a x metric for a model i.
3.3. Meteorological Drivers
3.4. Development of LM Models from the Knowledge of Artificial Intelligence Models
- fr(rain) is the fraction of rain;
- , , are parameters to be calibrated;
- x1 and x2 are independent variables extracted from MDG.
4. Results
4.1. Evaluation of Artificial Intelligence Methods for Precipitation Phase Forecasting
4.1.1. Logistic Models
4.1.2. ANN Models
4.1.3. Random Forest Models
4.1.4. Intercomparison of LM, ANN, and RF Models
4.2. Meteorological Drivers
4.3. Development of Parsimonious Logistic Models with Predictors Derived from RF Information
4.3.1. Implementation of Logistic Models Based on AI Knowledge
4.3.2. Evaluation of Logistic Models Derived from MDG Predictors
5. Discussion
5.1. Models for Precipitation Phase and Predictor Variables
5.2. Precipitation Phase Trends and Climate Change
6. Conclusions
Author Contributions
Funding
Institutional Review Board Statement
Informed Consent Statement
Data Availability Statement
Acknowledgments
Conflicts of Interest
References
- Vuille, M. Climate Change and Water Resources in the Tropical Andes; Technical Note No. IDB-TN-515; Inter-American Development Bank: Washington, DC, USA, 2013; Volume 29. [Google Scholar]
- Favier, V.; Wagnon, P.; Chazarin, J.P.; Maisincho, L.; Coudrain, A. One-Year Measurements of Surface Heat Budget on the Ablation Zone of Antizana Glacier 15, Ecuadorian Andes. J. Geophys. Res. Atmos. 2004, 109, 15. [Google Scholar] [CrossRef] [Green Version]
- Harpold, A.A.; Kaplan, M.L.; Klos, P.Z.; Link, T.; McNamara, J.P.; Rajagopal, S.; Schumer, R.; Steele, C.M. Rain or Snow: Hydrologic Processes, Observations, Prediction, and Research Needs. Hydrol. Earth Syst. Sci. 2017, 21, 1–22. [Google Scholar] [CrossRef] [Green Version]
- Vuille, M.; Bradley, R.; Keimig, F. Climate Variability in the Andes of Ecuador and Its Relation to Tropical Pacific and Atlantic Sea Surface Temperature Anomalies. J. Clim. 2000, 13, 2520–2535. [Google Scholar] [CrossRef]
- Gray, D.M.; Prowse, T.D. The Handbook of Hydrology; Maidment, D., Ed.; McGraw-Hil: New York, NY, USA, 1992; p. 824. ISBN 978-0070397323. [Google Scholar]
- Fassnacht, S.; Kouwen, N.; Soulis, E. Surface Temperature Adjustment to Improve Weather Radar Representation of Multi-Temporal Winter Precipitation Accumulation. J. Hydrol. 2001, 253, 148–168. [Google Scholar] [CrossRef]
- Froidurot, S.; Zin, I.; Hingray, B.; Gautheron, A. Sensitivity of Precipitation Phase over the Swiss Alps to Different Meteorological Variables. J. Hydrometeorol. 2014, 15, 685–696. [Google Scholar] [CrossRef]
- L’hôte, Y.; Chevallier, P.; Coudrain, A.; Lejeune, Y.; Etchevers, P. Relationship between Precipitation Phase and Air Temperature: Comparison between the Bolivian Andes and the Swiss Alps/Relation Entre Phase de Précipitation et Température de Air: Comparaison Entre Les Andes Boliviennes et Les Alpes S. Hydrol. Sci. J. 2005, 50, null-997. [Google Scholar] [CrossRef]
- Harder, P.; Pomeroy, J. Estimating Precipitation Phase Using a Psychrometric Energy Balance Method. Hydrol. Process. 2013, 27, 1901–1914. [Google Scholar] [CrossRef]
- Feiccabrino, J.; Lundberg, A. Precipitation Phase Discrimination in Sweden. In Proceedings of the 65th Eastern Snow Conference, Fairlee, VT, USA, 28–30 May 2008; pp. 239–254. [Google Scholar]
- Jennings, K.S.; Winchell, T.S.; Livneh, B.; Molotch, N.P. Spatial Variation of the Rain-Snow Temperature Threshold across the Northern Hemisphere. Nat. Commun. 2018, 9, 1148. [Google Scholar] [CrossRef] [Green Version]
- Quick, M.C.; Pipes, A. U.B.C. Watershed Model. Hydrol. Sci. J. 1977, 153–162. [Google Scholar] [CrossRef]
- Kienzle, S.W. A New Temperature Based Method to Separate Rain and Snow. Hydrol. Process. 2008, 22, 5067–5085. [Google Scholar] [CrossRef]
- Stewart, R.E. Precipitation Types in the Transition Region of Winter Storms. Bull. Am. Meteorol. Soc. 1992, 73, 287–296. [Google Scholar] [CrossRef] [Green Version]
- Bicknell, B.R.; Imhoff, J.C.; Kittle, J.L., Jr.; Donigian, A.S., Jr.; Johanson, R.C. Hydrological Simulation Program-Fortran: User’s Manual; US Environmental Protection Agency: Athens, GA, USA, 1997.
- Marks, D.; Winstral, A.; Reba, M.; Pomeroy, J.; Kumar, M. An Evaluation of Methods for Determining During-Storm Precipitation Phase and the Rain/Snow Transition Elevation at the Surface in a Mountain Basin. Adv. Water Resour. 2013, 55, 98–110. [Google Scholar] [CrossRef]
- Wagnon, P.; Lafaysse, M.; Lejeune, Y.; Maisincho, L.; Rojas, M.; Chazarin, J.P. Understanding and Modeling the Physical Processes That Govern the Melting of Snow Cover in a Tropical Mountain Environment in Ecuador. J. Geophys. Res. Atmos. 2009, 114, 1–14. [Google Scholar] [CrossRef]
- Lejeune, Y.; Bouilloud, L.; Etchevers, P.; Wagnon, P.; Chevallier, P.; Sicart, J.-E.; Martin, E.; Habets, F. Melting of Snow Cover in a Tropical Mountain Environment in Bolivia: Processes and Modeling. J. Hydrometeorol. 2007, 8, 922–937. [Google Scholar] [CrossRef]
- Campozano, L.; Célleri, R.; Trachte, K.; Bendix, J.; Samaniego, E. Rainfall and Cloud Dynamics in the Andes: A Southern Ecuador Case Study. Adv. Meteorol. 2016, 2016, 3192765. [Google Scholar] [CrossRef] [Green Version]
- Ye, H.; Cohen, J.; Rawlins, M. Discrimination of Solid from Liquid Precipitation over Northern Eurasia Using Surface Atmospheric Conditions. J. Hydrometeorol. 2013, 14, 1345–1355. [Google Scholar] [CrossRef] [Green Version]
- Jennings, K.S.; Molotch, N.P. The Sensitivity of Modeled Snow Accumulation and Melt to Precipitation Phase Methods across a Climatic Gradient. Hydrol. Earth Syst. Sci. 2019, 23, 3765–3786. [Google Scholar] [CrossRef] [Green Version]
- Aggarwal, S.K.; Goel, A.; Singh, V.P. Stage and Discharge Forecasting by {SVM} and {ANN} Techniques. Water Resour. Manag. 2012, 26, 3705–3724. [Google Scholar] [CrossRef]
- Francou, B.; Vuille, M.; Favier, V.; Cáceres, B. New Evidence for an ENSO Impact on Low-Latitude Glaciers: Antizana 15, Andes of Ecuador, 0°28′S. J. Geophys. Res. Atmos. 2004, 109, 17. [Google Scholar] [CrossRef]
- OTT HydroMet. Operating Instructions Present Weather Sensor OTT Parsivel 2; OTT HydroMet: Kempten, Germany, 2016; p. 52. [Google Scholar]
- Battaglia, A.; Rustemeier, E.; Tokay, A.; Blahak, U.; Simmer, C. PARSIVEL Snow Observations: A Critical Assessment. J. Atmos. Ocean. Technol. 2010, 27, 333–344. [Google Scholar] [CrossRef]
- Tokay, A.; Wolff, D.B.; Petersen, W.A. Evaluation of the New Version of the Laser-Optical Disdrometer, OTT Parsivel2. J. Atmos. Ocean. Technol. 2014, 31, 1276–1288. [Google Scholar] [CrossRef]
- Raupach, T.H.; Berne, A. Correction of Raindrop Size Distributions Measured by Parsivel Disdrometers, Using a Two-Dimensional Video Disdrometer as a Reference. Atmos. Meas. Tech. 2015, 8, 343–365. [Google Scholar] [CrossRef] [Green Version]
- Angulo-Martinez, M.; Begueria, S.; Latorre, B.; Fernández-Raga, M. Comparison of Precipitation Measurements by OTT Parsivel and Thies LPM Optical Disdrometers. Hydrol. Earth Syst. Sci. 2018, 22, 2811–2837. [Google Scholar] [CrossRef] [Green Version]
- Gualco, L.; Campozano, L.; Robaina, L.; Maisincho, L.; Muñoz, L.; Carlos, J. Corrections of Raindrop Size Distribution Measured by Parsivel OTT 2 Disdrometer under Windy Conditions in Antizana Massif, Ecuador. Water 2021, 13, 2576. [Google Scholar] [CrossRef]
- Bolton, D. The Computation of Equivalent Potential Temperature. Mon. Weather Rev. 1980, 108, 1046–1053. [Google Scholar] [CrossRef] [Green Version]
- Garratt, J.R. The Atmospheric Boundary Layer; Cambridge Atmospheric and Space Science Series; Cambridge University Press: Cambridge, UK, 1994; ISBN 9780521467452. [Google Scholar]
- Koistinen, J.; Saltikoff, E. Experience of Customer Products of Accumulated Snow, Sleet and Rain. Adv. Weather Radar Syst. 1998, 397–406. [Google Scholar]
- Uyanık, G.K.; Güler, N.N.N.; Uyanik, G.K.; Güler, N.N.N. A Study on Multiple Linear Regression Analysis. Procedia Soc. Behav. Sci. 2013, 106, 234–240. [Google Scholar] [CrossRef] [Green Version]
- Agatonovic-Kustrin, S.; Beresford, R. Basic Concepts of Artificial Neural Network (ANN) Modeling and Its Application in Pharmaceutical Research. J. Pharm. Biomed. Anal. 2000, 22, 717–727. [Google Scholar] [CrossRef]
- Du, K.L. Clustering: A Neural Network Approach. Neural Netw. 2010, 23, 89–107. [Google Scholar] [CrossRef]
- Stangierski, J.; Weiss, D.; Kaczmarek, A. Multiple Regression Models and Artificial Neural Network ({ANN}) as Prediction Tools of Changes in Overall Quality during the Storage of Spreadable Processed Gouda Cheese. Eur. Food Res. Technol. 2019, 245, 2539–2547. [Google Scholar] [CrossRef] [Green Version]
- Jain, A.; Kumar, A.M. Hybrid Neural Network Models for Hydrologic Time Series Forecasting. Appl. Soft Comput. 2007, 7, 585–592. [Google Scholar] [CrossRef]
- Sarica, A.; Cerasa, A.; Quattrone, A. Random Forest Algorithm for the Classification of Neuroimaging Data in Alzheimers Disease: A Systematic Review. Front. Aging Neurosci. 2017, 9, 329. [Google Scholar] [CrossRef] [PubMed]
- Breiman, L. Random forests. Mach. Learn. 2001, 45, 5–32. [Google Scholar] [CrossRef] [Green Version]
- Ali, J.; Khan, R.; Ahmad, N.; Maqsood, I. Random Forests and Decision Trees. Int. J. Comput. Sci. Issues 2012, 9, 272–278. [Google Scholar]
- Liaw, A.; Wiener, M. Classification and Regression by RandomForest. R News 2002, 2, 18–22. [Google Scholar]
- Tyralis, H.; Papacharalampous, G.; Langousis, A. A Brief Review of Random Forests for Water Scientists and Practitioners and Their Recent History in Water Resources. Water 2019, 11, 910. [Google Scholar] [CrossRef] [Green Version]
- Knoben, W.J.M.; Freer, J.E.; Woods, R.A. Technical Note: Inherent Benchmark or Not? Comparing Nash-Sutcliffe and Kling-Gupta Efficiency Scores. Hydrol. Earth Syst. Sci. 2019, 23, 4323–4331. [Google Scholar] [CrossRef] [Green Version]
- Nicodemus, K.K. Letter to the Editor: On the Stability and Ranking of Predictors from Random Forest Variable Importance Measures. Brief. Bioinform. 2011, 12, 369–373. [Google Scholar] [CrossRef] [Green Version]
- Calle, M.L.; Urrea, V. Letter to the Editor: Stability of Random Forest Importance Measures. Brief. Bioinform. 2010, 12, 86–89. [Google Scholar] [CrossRef] [Green Version]
- Casellas, E.; Bech, J.; Veciana, R.; Pineda, N.; Rigo, T.; Miró, J.R.; Sairouni, A. Surface Precipitation Phase Discrimination in Complex Terrain. J. Hydrol. 2021, 592, 125780. [Google Scholar] [CrossRef]
- Manciati, C.; Villacis, M.; Taupin, J.-D.; Cadier, E.; Galárraga-Sánchez, R.; Cáceres, B. Empirical Mass Balance Modelling of South American Tropical Glaciers: Case Study of Antisana Volcano, Ecuador. Hydrol. Sci. J. 2014, 59, 1519–1535. [Google Scholar] [CrossRef] [Green Version]
- Thériault, J.M.; Stewart, R.E. On the Effects of Vertical Air Velocity on Winter Precipitation Types. Nat. Hazards Earth Syst. Sci. 2007, 7, 231–242. [Google Scholar] [CrossRef] [Green Version]
- Basantes-Serrano, R.; Rabatel, A.; Francou, B.; Vincent, C.; Maisincho, L.; Cáceres, B.; Galarraga, R.; Alvarez, D. Slight Mass Loss Revealed by Reanalyzing Glacier Mass-Balance Observations on Glaciar Antisana 15 (Inner Tropics) during the 1995–2012 Period. J. Glaciol. 2016, 62, 124–136. [Google Scholar] [CrossRef] [Green Version]
- Fehlmann, M.; Gascón, E.; Rohrer, M.; Schwarb, M.; Stoffel, M. Estimating the Snowfall Limit in Alpine and Pre-Alpine Valleys: A Local Evaluation of Operational Approaches. Atmos. Res. 2018, 204, 136–148. [Google Scholar] [CrossRef]
- Jomelli, V.; Khodri, M.; Favier, V.; Brunstein, D.; Ledru, M.P.; Wagnon, P.; Blard, P.H.; Sicart, J.E.; Braucher, R.; Grancher, D.; et al. Irregular Tropical Glacier Retreat over the Holocene Epoch Driven by Progressive Warming. Nature 2011, 474, 196–199. [Google Scholar] [CrossRef] [Green Version]
- Mark, B.G.; Bury, J.; McKenzie, J.M.; French, A.; Baraer, M. Climate Change and Tropical Andean Glacier Recession: Evaluating Hydrologic Changes and Livelihood Vulnerability in the Cordillera Blanca, Peru. Ann. Assoc. Am. Geogr. 2010, 100, 794–805. [Google Scholar] [CrossRef]
- López-Moreno, J.I.; Pomeroy, J.W.; Morán-Tejeda, E.; Revuelto, J.; Navarro-Serrano, F.M.; Vidaller, I.; Alonso-González, E. Changes in the Frequency of Global High Mountain Rain-on-Snow Events Due to Climate Warming. Environ. Res. Lett. 2021, 16, 94021. [Google Scholar] [CrossRef]
- Campozano, L.; Ballari, D.; Montenegro, M.; Avilés, A. Future Meteorological Droughts in Ecuador: Decreasing Trends and Associated Spatio-Temporal Features Derived From {CMIP}5 Models. Front. Earth Sci. 2020, 8, 17. [Google Scholar] [CrossRef]
- Bradley, R.S.; Vuille, M.; Diaz, H.F.; Vergara, W. Threats to Water Supplies in the Tropical Andes. Clim. Chang. Sci. 2006, 312, 1755. [Google Scholar] [CrossRef]
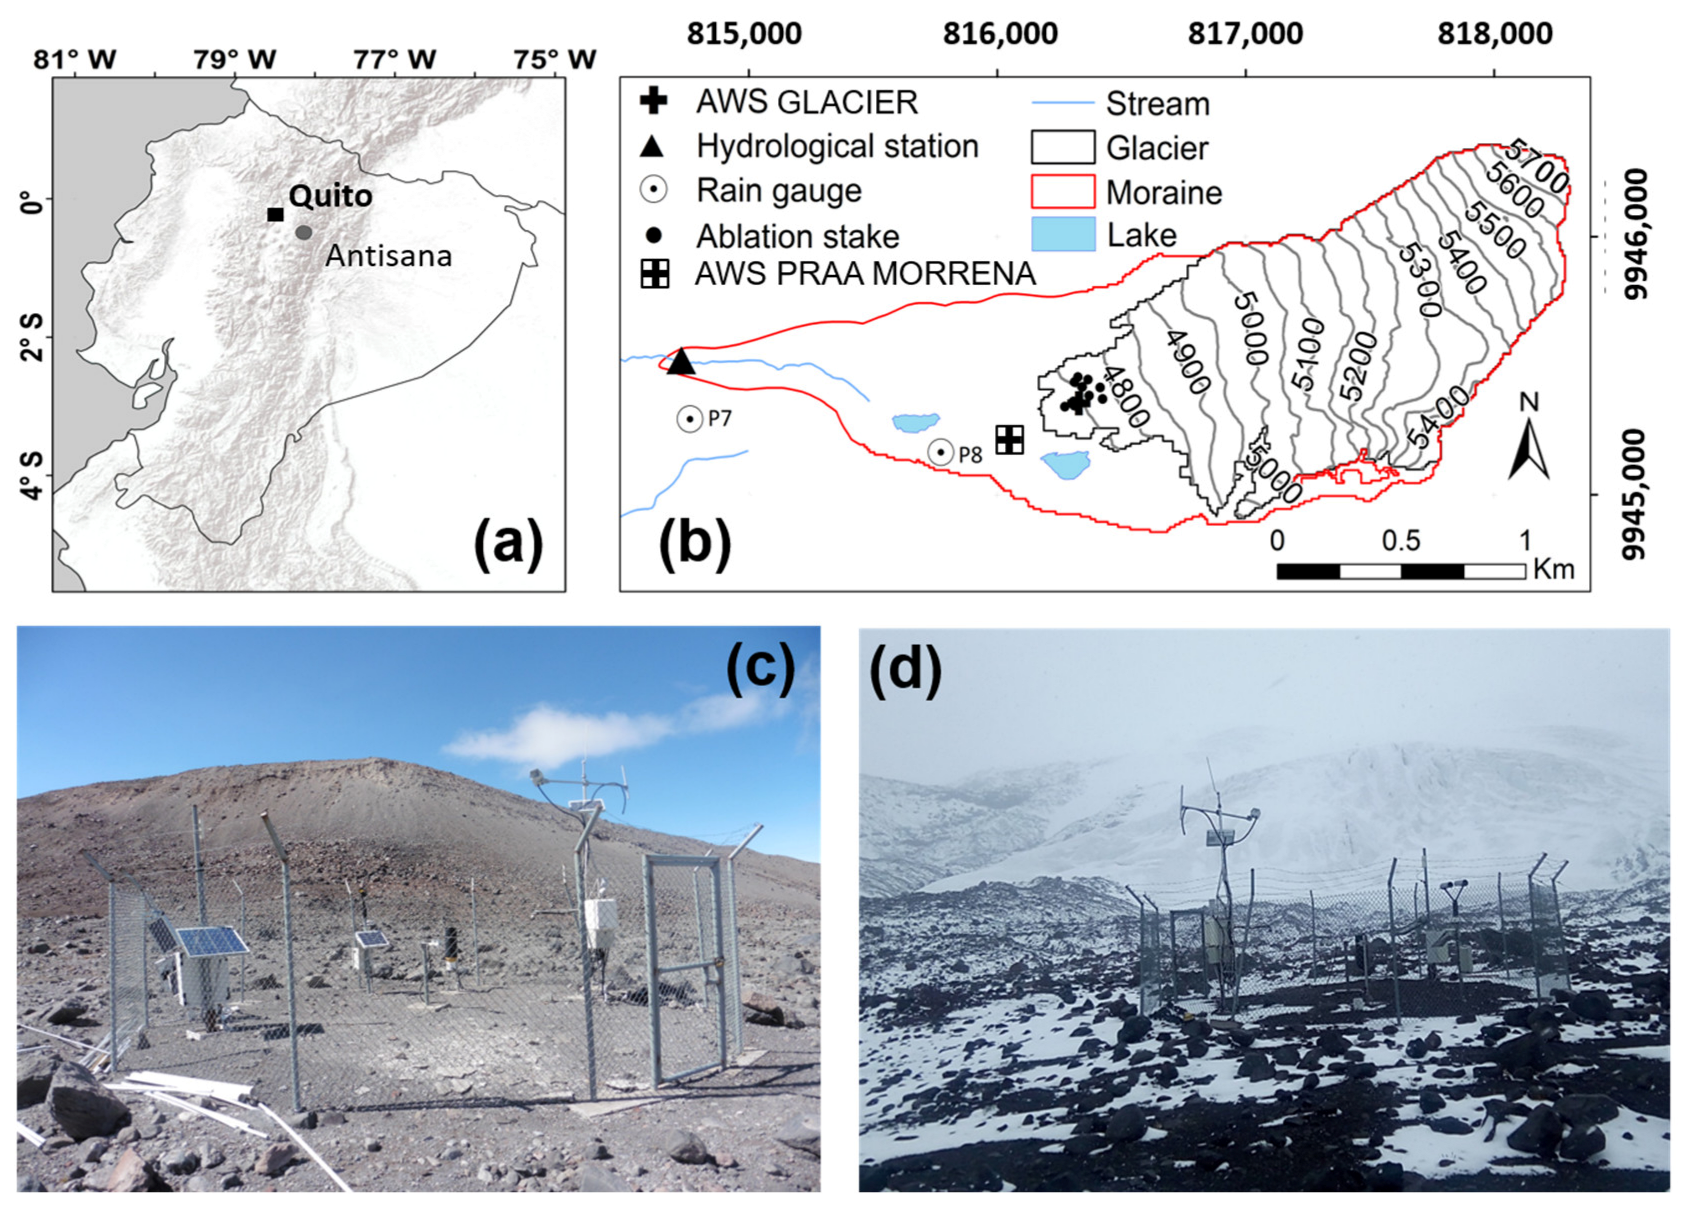
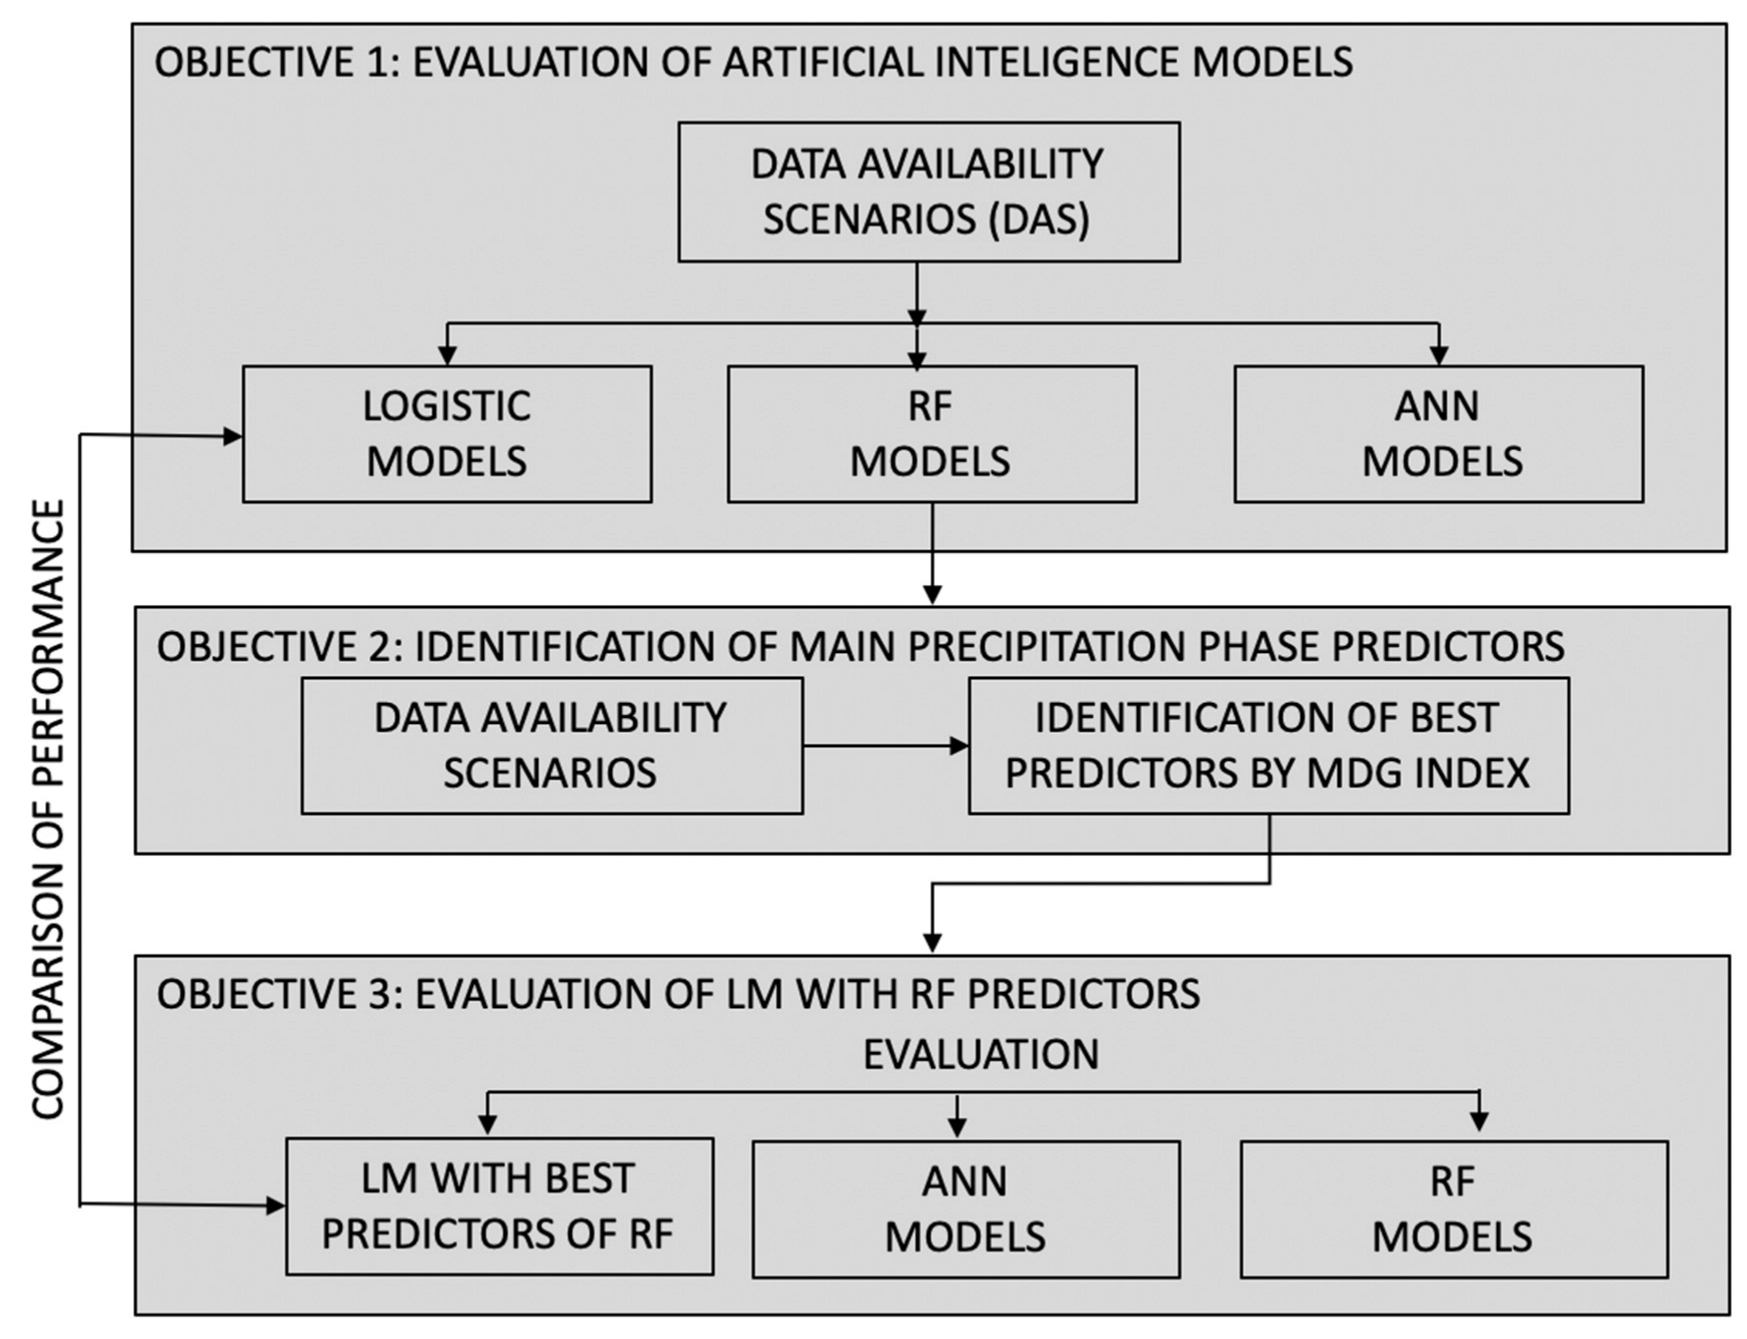
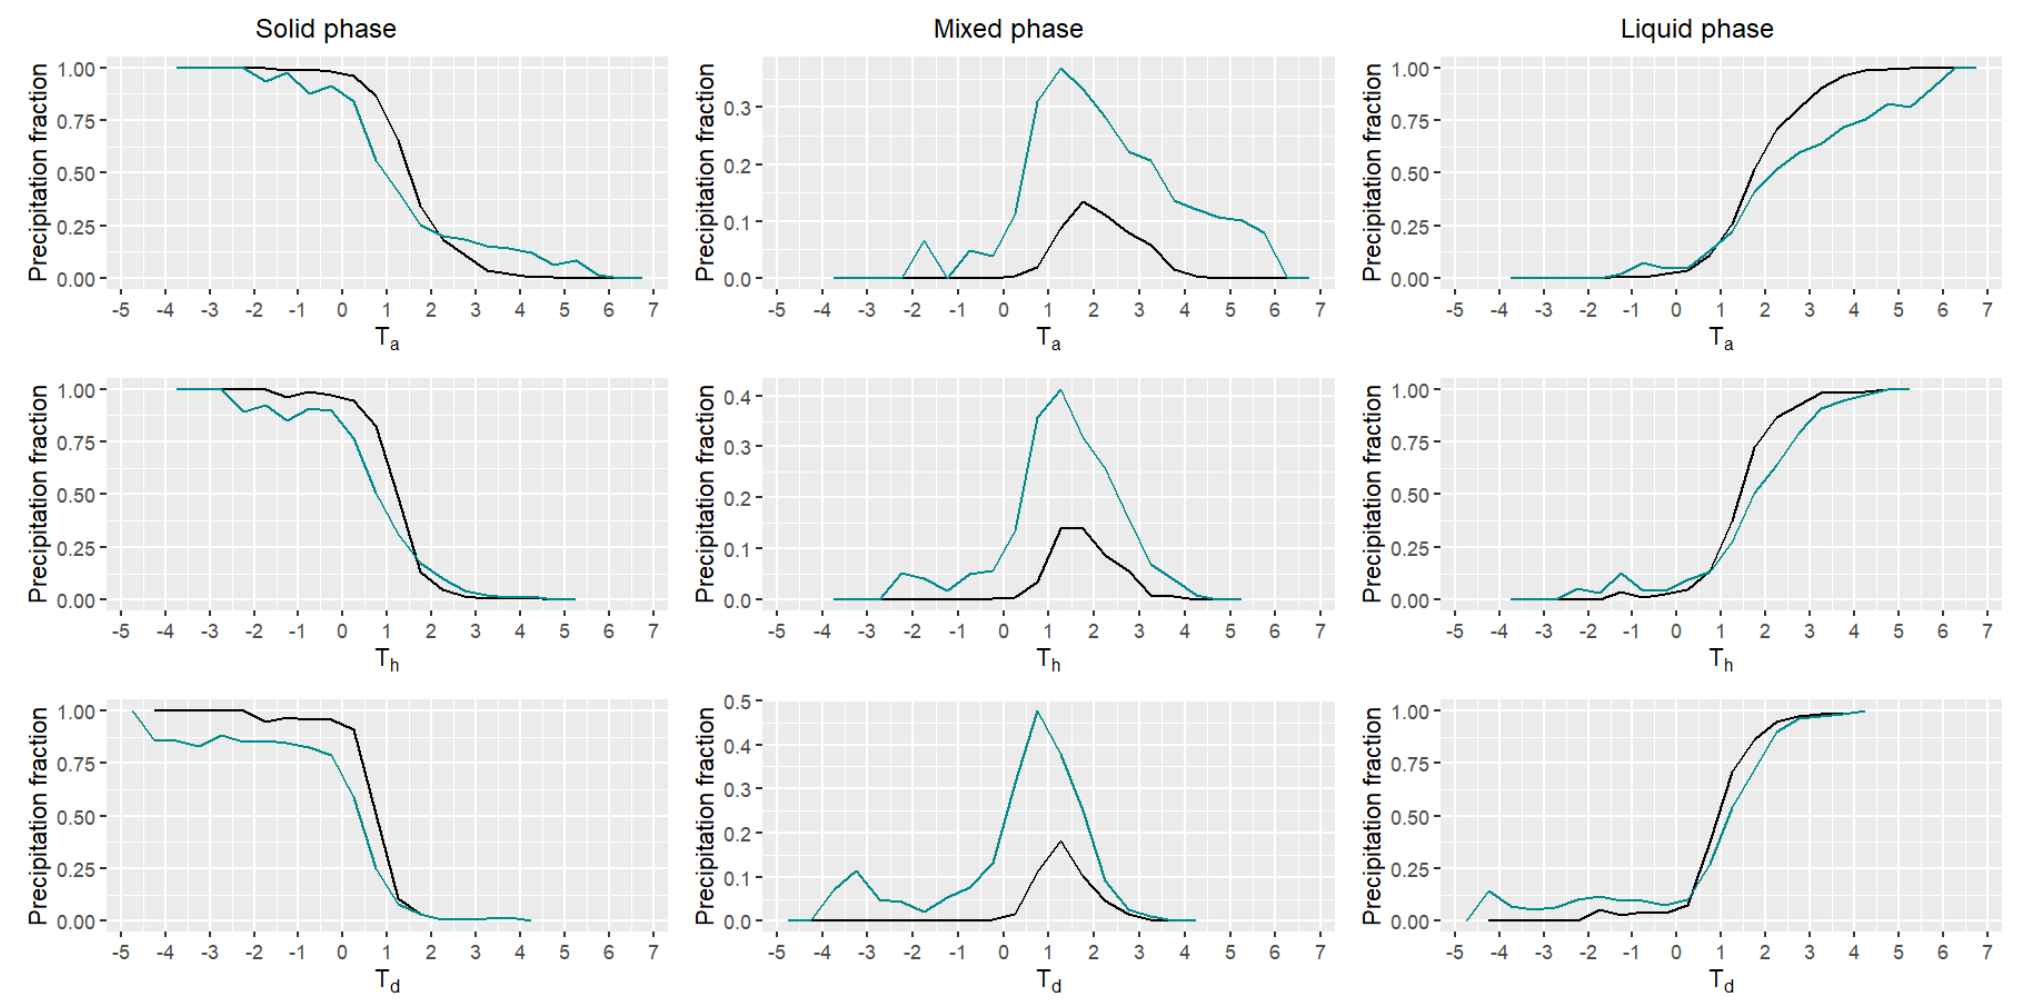

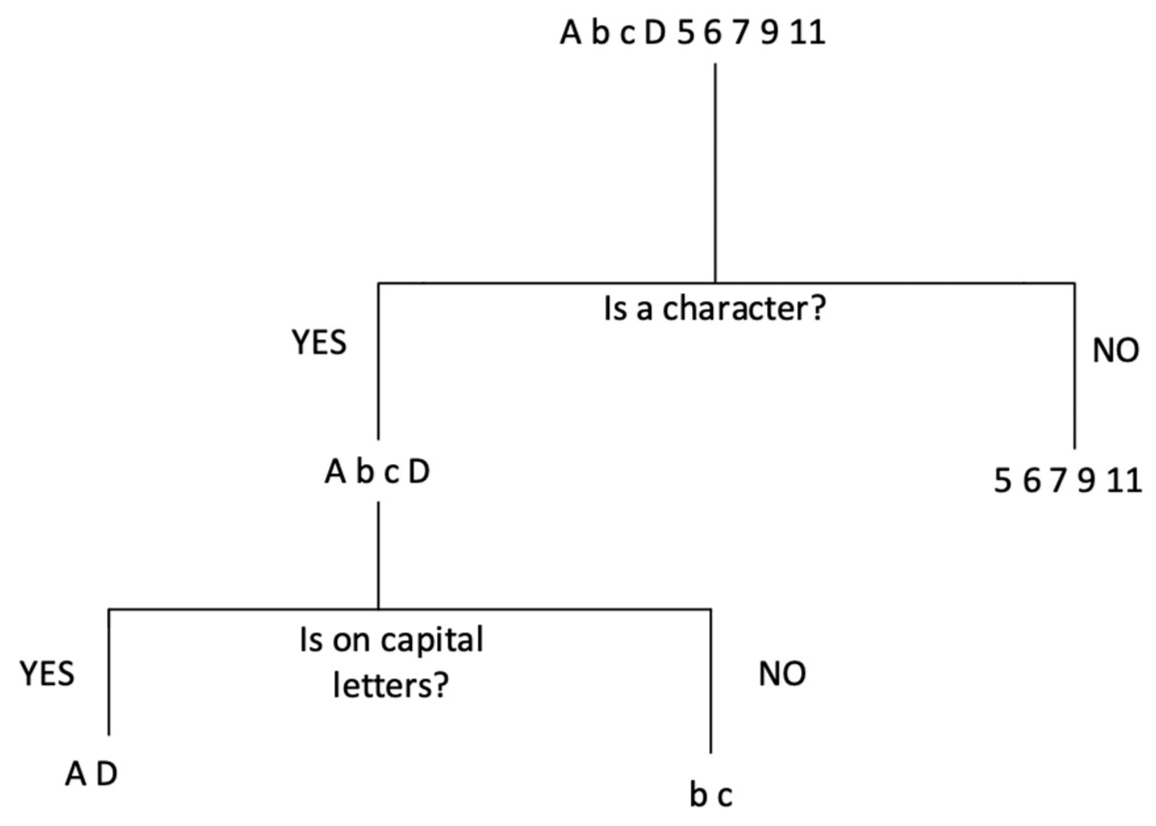

| Variable (Unit) | Sensor (Height) | Nominal Accuracy |
|---|---|---|
| Air temperature (°C) | Vaisala HPM45AC-shielded (2.00 m) | ±0.2 °C |
| Relative humidity (%) | Vaisala HPM45AC-shielded (2.00 m) | ±2% (0–90%) |
| Wind speed (m ) | Young 05103 (3.5 m) | ±0.3 m |
| Wind direction (° deg) | Young 05103 (3.5 m) | ±3 deg |
| Incoming and outgoing SWR (W ) | Kipp & Zonen CNR4 0.3 < λ < 2.8 µm (1.00 m) | Daily value ±10% |
| Incoming and outgoing LWR (W ) | Kipp & Zonen CNR4-G3 5 < λ < 50 µm (1.00 m) | Daily value ±10% |
| Variable | Description | Units |
|---|---|---|
| Date | Date and hour | Format UTC |
| Month, hour | Month and hour | Dimensionless |
| SWRI, SWRR, LWRR, LWRI | Incoming and outgoing SW and LW radiation | |
| , , | Air, hydrometeor, and dew point temperature | °C |
| RH, SH | Relative and specific humidity | %, g/kg |
| P | Precipitation | mm |
| PP | Precipitation phase: 0,0.5,1 for solid, mixed, liquid | Dimensionless |
| DAS | SWRI | SWRR | LWRR | LWRI | T | RH | SH | WSPEED | WDIR | T.DewP | T.H |
|---|---|---|---|---|---|---|---|---|---|---|---|
| 1 | X | X | X | X | X | X | X | X | X | ||
| 2 | X | X | X | X | |||||||
| 3 | X | X | X | X | X | X | X | X | X | X | X |
| 4 | X | X | X | X | X | X | X | ||||
| 5 | X | X | X | ||||||||
| 6 | X | X | |||||||||
| 7 | X | ||||||||||
| 8 | X |
| LM1 | LM2 | LM3 | |
|---|---|---|---|
| Metric | Range and Interpretation | Metric | Range and Interpretation |
|---|---|---|---|
| r2 | max 1 is a perfect model | N_r2 | [0–1]: 0 is the best model |
| kge | max 1 is a perfect model | N_kge | [0–1]: 0 is the best model |
| rmse | value of 0 is perfect model | N_rmse | [0–1]: 0 is the best model |
| nash | max 1 is a perfect model | N_nash | [0–1]: 0 is the best model |
| bias | value of 0 is perfect model | N_bias | [0–1]: 0 is the best model |
| CSI | max 1 is a perfect model | N_CSI | [0–1]: 0 is the best model |
| PU | value of 0 is perfect model | N_PU | [0–1]: 0 is the best model |
| PM | value of 0 is perfect model | N_PM | [0–1]: 0 is the best model |
| SFC | value of 0 is perfect model | N_SFC | [0–1]: 0 is the best model |
| PDA | value of 0 is perfect model | N_PDA | [0–1]: 0 is the best model |
| Model | LM1 | LM2 | LM3 | ||||
|---|---|---|---|---|---|---|---|
| Parameter | α | Β | γ | bh | ch | bd | cd |
| Min | −11.02 | −1.67 | 0.02 | 12.26 | 0.15 | 4.38 | 0.17 |
| P50 | −4.65 | −1.63 | 0.08 | 13.88 | 0.16 | 4.62 | 0.19 |
| Max | 0.96 | −1.57 | 0.14 | 15.88 | 0.17 | 5.09 | 0.2 |
| MODEL | r2 | kge | rmse | nash | bias | CSI | PU | PM | SFC | PDA | Score |
|---|---|---|---|---|---|---|---|---|---|---|---|
| LM 1 | 0.989 | 0.979 | 0.043 | 0.989 | −0.008 | 0.74 | 0.68 | 0.008 | −0.005 | 255.655 | 4 |
| LM 2 | 0.992 | 0.965 | 0.041 | 0.991 | −0.003 | 0.841 | 0.729 | 0.003 | −0.046 | 212.131 | 2 |
| LM 3 | 0.981 | 0.948 | 0.063 | 0.979 | 0.004 | 0.868 | 0.807 | 0.003 | −0.121 | 220.246 | 4 |
| RF_1 | 0.997 | 0.963 | 0.035 | 0.996 | 0.002 | 0.905 | 0.07 | 0.049 | 0.017 | 70.4 | 1 |
| RF_2 | 0.997 | 0.964 | 0.035 | 0.996 | 0.002 | 0.895 | 0.072 | 0.055 | 0.023 | 77.8 | 1 |
| RF_3 | 0.997 | 0.962 | 0.037 | 0.996 | 0.003 | 0.903 | 0.069 | 0.05 | 0.016 | 71.1 | 0 |
| RF_4 | 0.998 | 0.963 | 0.035 | 0.996 | 0.006 | 0.891 | 0.068 | 0.057 | 0.01 | 78.5 | 2 |
| RF_5 | 0.998 | 0.967 | 0.032 | 0.997 | 0.004 | 0.886 | 0.074 | 0.059 | 0.012 | 84.9 | 2 |
| RF_6 | 0.998 | 0.965 | 0.034 | 0.996 | 0.004 | 0.888 | 0.073 | 0.058 | 0.01 | 83.2 | 1 |
| RF_7 | 0.997 | 0.98 | 0.033 | 0.997 | −0.007 | 0.83 | 0.099 | 0.088 | 0.014 | 134.4 | 5 |
| RF_8 | 0.996 | 0.976 | 0.042 | 0.995 | −0.004 | 0.849 | 0.091 | 0.078 | −0.001 | 117.9 | 1 |
| ANN_1 | 0.995 | 0.942 | 0.05 | 0.991 | 0.012 | 0.898 | 0.059 | 0.054 | 0.007 | 69.3 | 3 |
| ANN_2 | 0.995 | 0.936 | 0.054 | 0.99 | 0.013 | 0.891 | 0.055 | 0.058 | 0.005 | 72.2 | 1 |
| ANN_3 | 0.995 | 0.947 | 0.048 | 0.992 | 0.012 | 0.9 | 0.059 | 0.053 | −0.002 | 68.3 | 5 |
| ANN_4 | 0.994 | 0.934 | 0.055 | 0.989 | 0.015 | 0.885 | 0.052 | 0.062 | 0.002 | 74.8 | 1 |
| ANN_5 | 0.994 | 0.932 | 0.058 | 0.989 | 0.015 | 0.879 | 0.052 | 0.065 | 0 | 79 | 1 |
| ANN_6 | 0.995 | 0.935 | 0.054 | 0.99 | 0.015 | 0.882 | 0.052 | 0.063 | 0.001 | 76.6 | 2 |
| ANN_7 | 0.987 | 0.9 | 0.087 | 0.975 | 0.01 | 0.842 | 0.052 | 0.087 | −0.001 | 104.8 | 2 |
| ANN_8 | 0.985 | 0.89 | 0.092 | 0.971 | 0.014 | 0.87 | 0.052 | 0.07 | −0.005 | 85 | 1 |
| MEAN VALUES | |||||||||||
| LM | 0.987 | 0.964 | 0.049 | 0.986 | −0.002 | 0.816 | 0.738 | 0.005 | −0.057 | 229.344 | 2 |
| RF | 0.997 | 0.967 | 0.035 | 0.996 | 0.001 | 0.881 | 0.077 | 0.062 | 0.013 | 89.775 | 5 |
| ANN | 0.992 | 0.927 | 0.062 | 0.986 | 0.013 | 0.881 | 0.054 | 0.064 | 0.001 | 78.75 | 4 |
| Model | ||||||
|---|---|---|---|---|---|---|
| Parameter | α | β | γ | α | β | γ |
| Min | 38.21 | 1.05 | −14.72 | −5.82 | −2.30 | −0.06 |
| P50 | 59.57 | 2.62 | −8.55 | 0.31 | −1.92 | 0.44 |
| Max | 101.60 | 5.57 | −5.40 | 3.55 | −1.69 | 1.37 |
Publisher’s Note: MDPI stays neutral with regard to jurisdictional claims in published maps and institutional affiliations. |
© 2021 by the authors. Licensee MDPI, Basel, Switzerland. This article is an open access article distributed under the terms and conditions of the Creative Commons Attribution (CC BY) license (https://creativecommons.org/licenses/by/4.0/).
Share and Cite
Campozano, L.; Robaina, L.; Gualco, L.F.; Maisincho, L.; Villacís, M.; Condom, T.; Ballari, D.; Páez, C. Parsimonious Models of Precipitation Phase Derived from Random Forest Knowledge: Intercomparing Logistic Models, Neural Networks, and Random Forest Models. Water 2021, 13, 3022. https://doi.org/10.3390/w13213022
Campozano L, Robaina L, Gualco LF, Maisincho L, Villacís M, Condom T, Ballari D, Páez C. Parsimonious Models of Precipitation Phase Derived from Random Forest Knowledge: Intercomparing Logistic Models, Neural Networks, and Random Forest Models. Water. 2021; 13(21):3022. https://doi.org/10.3390/w13213022
Chicago/Turabian StyleCampozano, Lenin, Leandro Robaina, Luis Felipe Gualco, Luis Maisincho, Marcos Villacís, Thomas Condom, Daniela Ballari, and Carlos Páez. 2021. "Parsimonious Models of Precipitation Phase Derived from Random Forest Knowledge: Intercomparing Logistic Models, Neural Networks, and Random Forest Models" Water 13, no. 21: 3022. https://doi.org/10.3390/w13213022
APA StyleCampozano, L., Robaina, L., Gualco, L. F., Maisincho, L., Villacís, M., Condom, T., Ballari, D., & Páez, C. (2021). Parsimonious Models of Precipitation Phase Derived from Random Forest Knowledge: Intercomparing Logistic Models, Neural Networks, and Random Forest Models. Water, 13(21), 3022. https://doi.org/10.3390/w13213022


