Abstract
Presenting groundwater quality assessment for different usages using one index is helpful to monitor the quality of this invaluable resource and reduce the cost of freshwater production, particularly in arid and semi-arid regions. The drinking groundwater quality index (DGWQI) is one the best indicators for groundwater quality assessment. Therefore, the purpose of the present research was to assess and map the groundwater quality of an aquifer for freshwater production in a semi-arid region, using GIS-based spatial analysis of DGWQI. For this goal, mean data from 70 wells collected during 2010–2018 were used. Results showed that total dissolved solids (TDS), electrical conductivity (EC), and total hardness (TH) had the highest impact on groundwater quality that exceed the permissible range for drinking purposes. Results also revealed that 42% of samples had a DGWQI value between 0 and 100 (appropriate quality class). Sensitivity analysis determined that Mg2+, EC, and TDS with highest mean variation indexes of 18.98, 20.68, and 19.04, respectively, were the most sensitive parameters in the calculation of DGWQI. According to R2 and RMSE, the ordinary kriging and spherical semi-variogram model had good performance for spatial analysis for all DGWQI, Mg2+, EC, and TDS. The DGWQI map showed that in the southern parts the groundwater (50% of the area) had unsuitable quality for drinking.
1. Introduction
Groundwater is a vital natural resource in the arid and semi-arid regions [1,2,3,4], where freshwater for human consumption is generally scarce [4,5,6]. Due to rapid population growth, the need for fresh water is increasing worldwide [7,8,9]. However, freshwater resources are limited, and their distribution is heterogeneous. In Iran, a shortage of freshwater resources is an obstacle to economic, social, and cultural development [3,10,11,12]. Groundwater is considered the critical resource of water for potation, agriculture, and industry in Iran. Assessment of groundwater quality requires the application of tools and techniques due to the abundance of quality data. One of the well-known methods for assessing groundwater quality for drinking is to use the drinking groundwater quality index (DGWQI) [13,14]. In this method, the influence of water quality indicators is presented as a single number (indicating the quality of groundwater). The WHO quality standard for drinking water is commonly used in the calculation of DGWQI [15,16,17,18]. In some countries, DGWQI has been introduced into legal acts and is often used by the authorities supervising water quality. The advantage of DGWQI over other evaluation approaches is that it identifies the overall state of water quality without conducting an individual interpretation of particular factors [4,10].
One of the main problems in assessing groundwater quality is the impossibility of sampling from all locations [19]. One of the appropriate solutions in spatial analysis of environmental data is the use of interpolation methods, called geostatistics in GIS [1,20,21,22]. Kriging is one of the best geostatistical methods that uses semi-variogram information to estimate variables in non-sampled points [20,21].
There have been many studies on the use of the DGWQI around the world [18]. However, very few studies have been conducted in the evaluation of geostatistical analysis of this index, especially in Iran. Sandra-Kumar et al. [7] assessed the groundwater quality of Rajam (India) using GWQI. The pH, EC, turbidity, chlorine, and total hardness parameters were considered to calculate the GWQI index. The results showed that according to the GWQI index, the groundwater was of poor quality for drinking. GIS and Geostatistic have been widely used for mapping the groundwater contamination [23,24]. Mohebbi et al. [25] investigated the groundwater quality of urban areas in Iran for drinking using the DGWQI. In this study, 23 water quality indicators were selected as input parameters. According to the results, about 95% of the groundwater was of good quality for drinking. Ostovari et al. [4] evaluated Lordegan groundwater in Iran using the DGWQI. They showed that the groundwater quality decreased from the north to the southwest of the study site due to intensive agricultural activities, geological formations, and municipal wastewater. Soleimani et al. [26] evaluated Qorveh and Dehgolan groundwater quality in Kurdistan province based on the DGWQI using data from 50 wells and, nine physicochemical parameters were measured for calculating the DGWQI. Results showed that 36% of the samples had excellent water quality, and 64% of the samples fell into the good quality class for drinking purposes. Bidhuri and Khan [27], using the interpolation model mapping, showed that the water quality index (WQI) of Delhi was unpotable for domestic usage.
Currently, there have been no published works for assessing the drinking groundwater quality index (DGWQI) using the GIS-geostatistical method in southern Iran. Hence, the goal is to evaluate the groundwater quality of the Marvdasht aquifer and conduct its geostatistical analysis. The Marvdasht aquifer is the most vital aquifer in the Fars Province of Iran, which supplies drinking water for three cities and hundreds of villages with more than 500,000 people. Hence, the objectives are as follows: (1) to investigate the Marvdasht groundwater’s suitability for drinking using DGWQI; (2) to identify the sensitive parameters for DGWQI calculation; (3) to conduct the geostatistical analysis of the DGWQI and its important parameters, and (4) to map the DGWQI and its important parameters.
2. Materials and Methods
2.1. Study Area
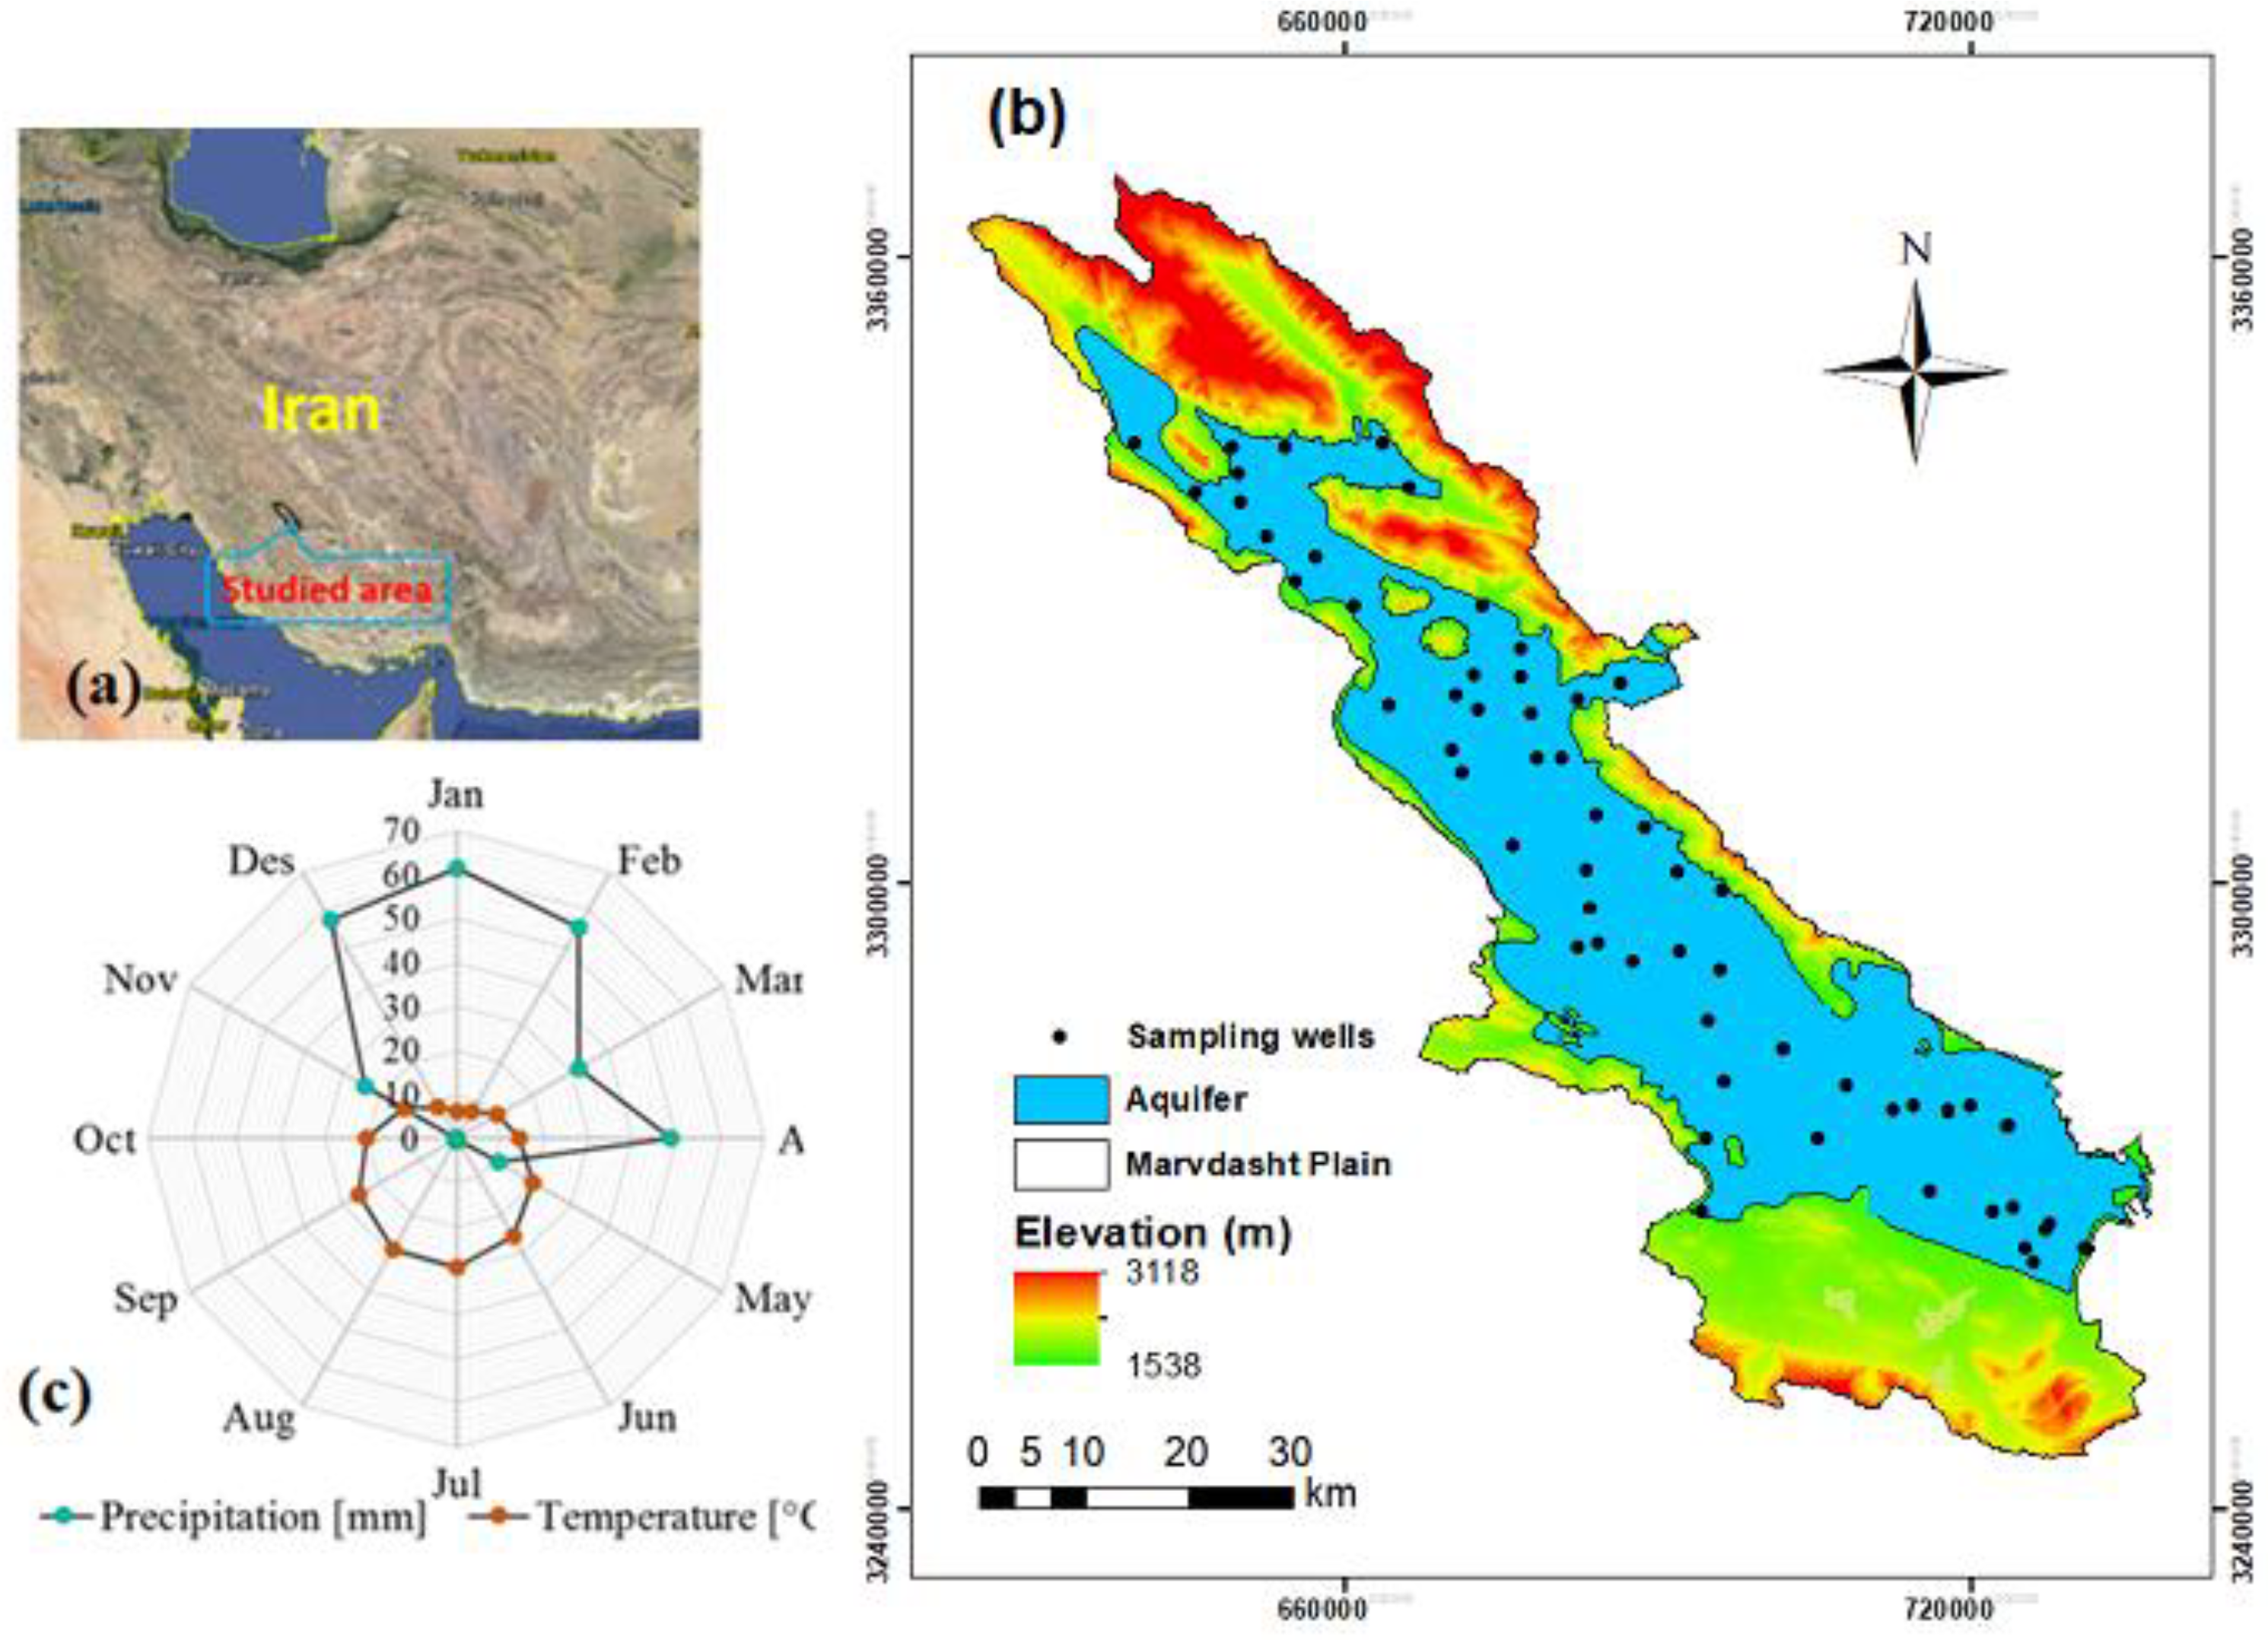
Marvdasht plain, which is located in semi-arid region of Fars, southern Iran (Figure 1a,b) (29°190′–30°200′ N and 52°150′–53°270′), with an area of around 3900 km2 (~160 × 24 km) has an average precipitation and temperature of 291.7 mm and 17.5 °C, respectively [3] (Figure 1c). The main crops in this region are wheat, rice, and maize, and Inceptisols, Entisols, and Aridisols are the most common soil types [28]. Therefore, soils are mainly calcareous with an average CaCO3−2 of 45%. According to studies in the study site [1,2,3], the mean of the soil water infiltration varies between 0.8 to 3.4 cm h−1.
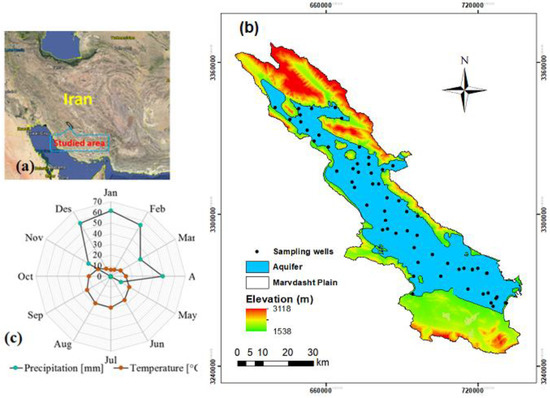
Figure 1.
Location of study area in the Marvdasht plain (UTM), northeast Fars province in Iran (a), distribution of sample points (b) and average monthly precipitation and temperature (from 2001 to 2018) (c).
2.2. Marvdasht Aquifer
The Marvdasht aquifer with an area of 1986.4 km2 is located in the center of the study site and extends from the northwest to the southwest [3]. The groundwater flows from high altitude in the north to the altitude in the south, where there isa high amount of salt and carbonates, causing lower groundwater quality. In the present study, all water samples were collected from an integrated aquifer, which is shown in Figure 1c. According to the report of the Ministry of Power of Iran [2,29], the groundwater level varied from 20 m in the north of the site to 45 m in the south of the site with an average of 35 m [3].
2.3. Geology of the Study Site
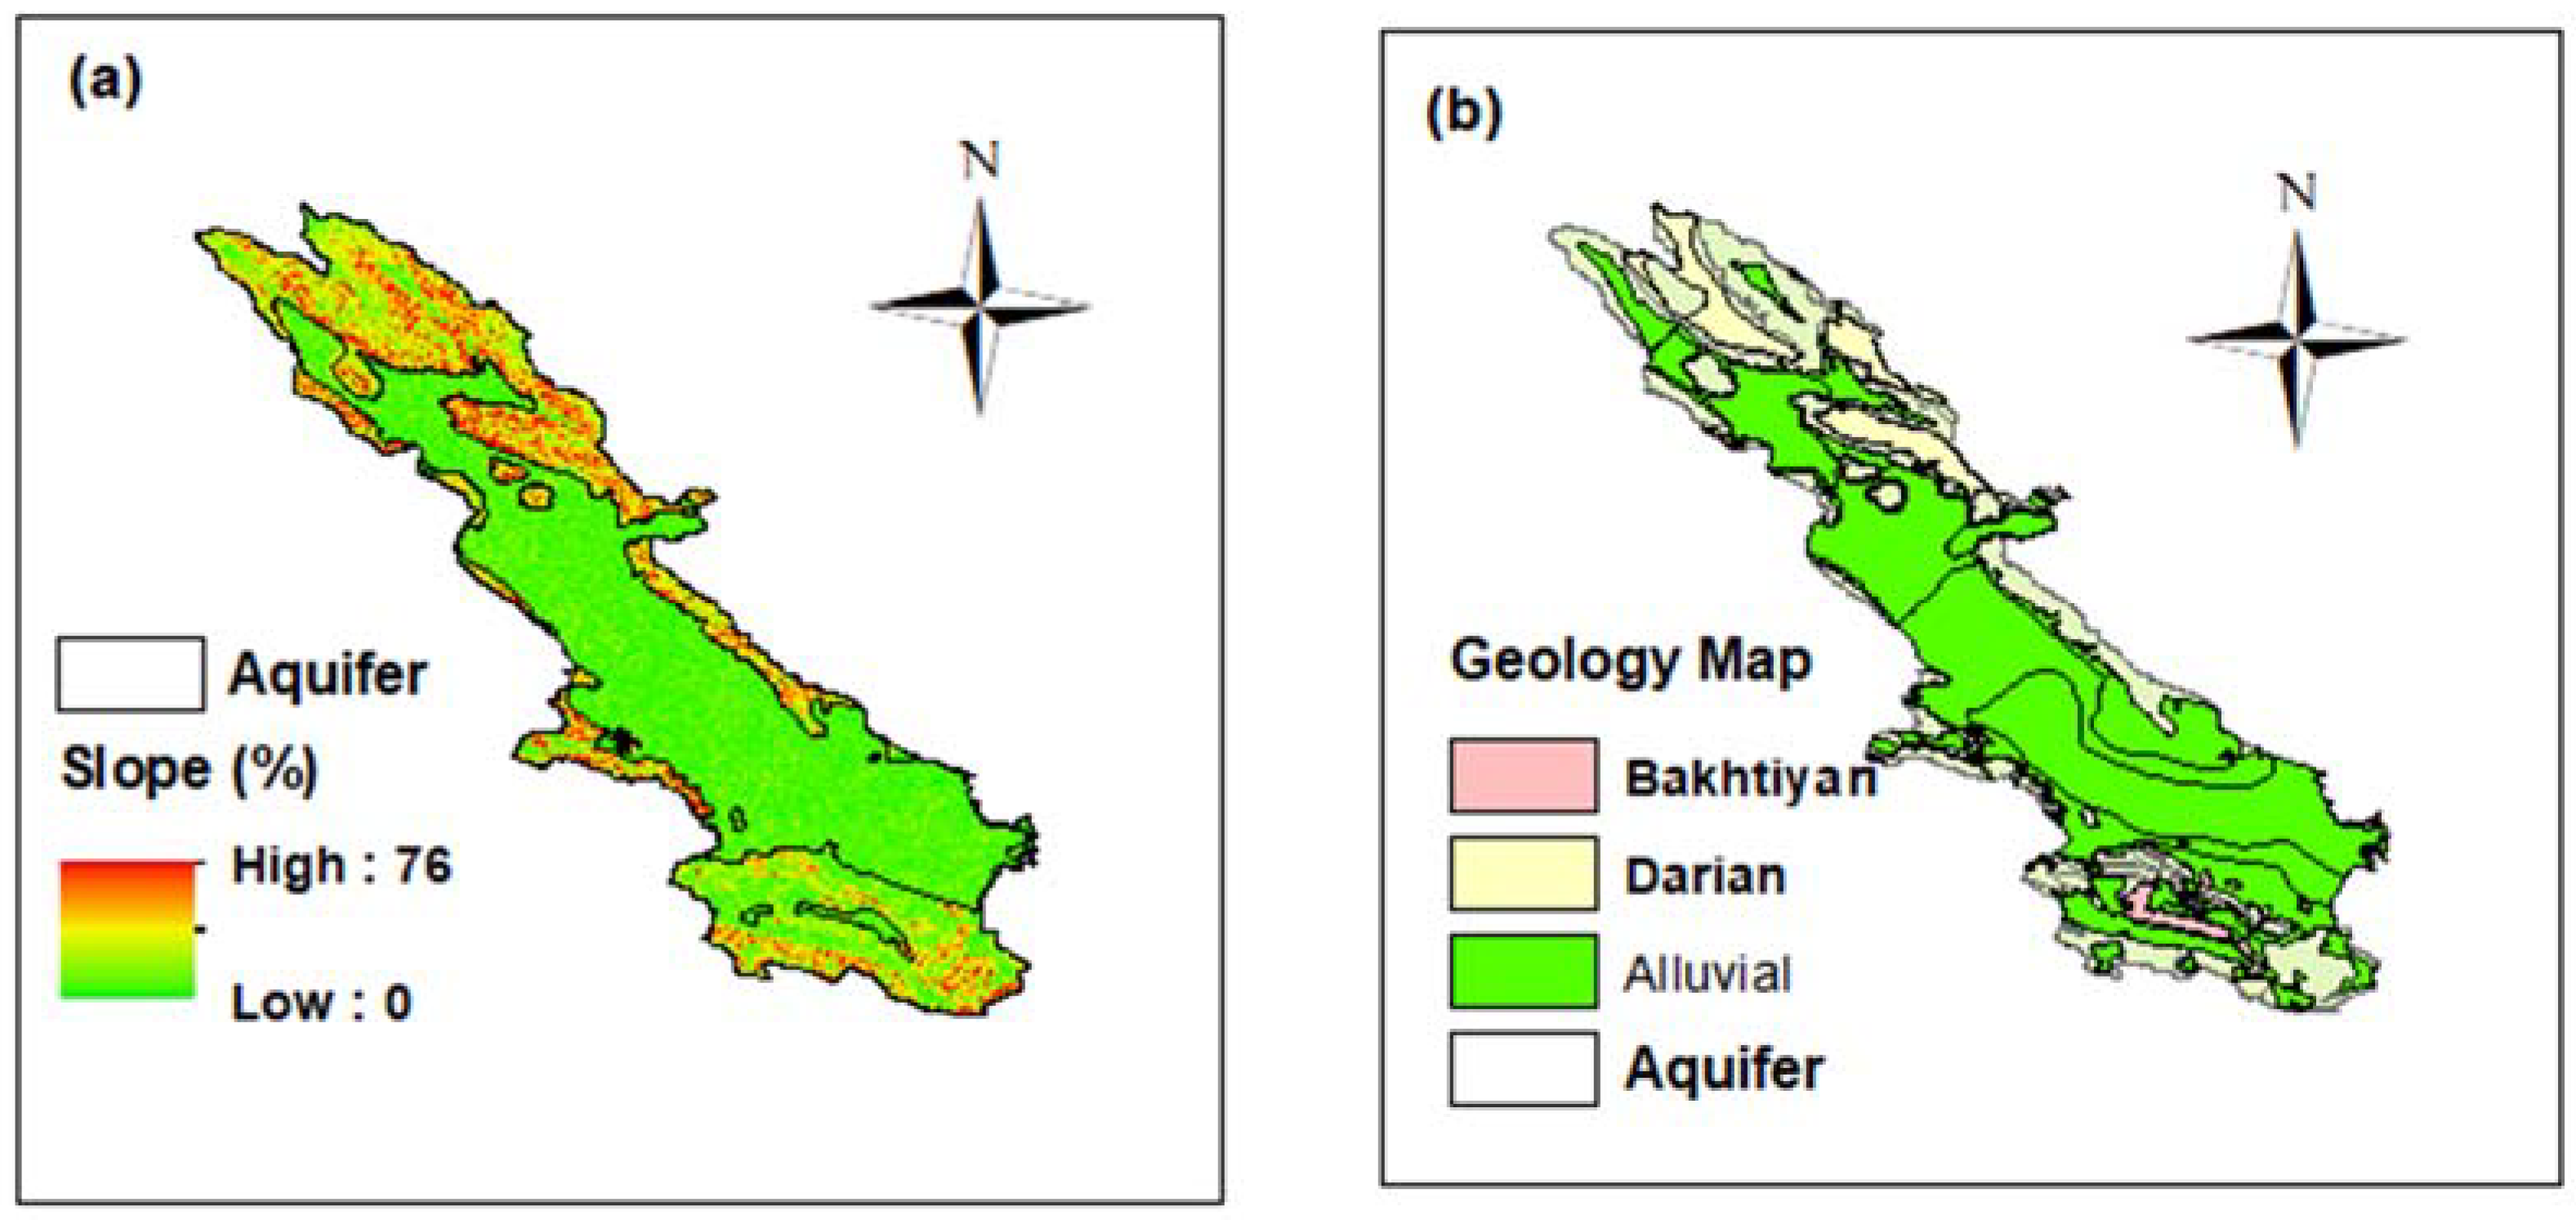
The altitude of the study area varies in the range of 1500–2460 m with a mean of 2070 m above sea level [2,3]. The slope of the study site varies from 0 in the central parts of the site to 76% in the mountainous regions, which are found mainly in the north of the study site. As shown in Figure 2a, the Marvdasht aquifer extends into the flat parts, having less than 10% slope. As presented in Figure 2b, the studied aquifer is located in the alluvial formation, covering from north to south of the site. Bakhtiyari and Hormuz [1,2], which have high amount of calcium carbonate, are the typical geological formations in the study site [29]. The center of the study area is a flat plain with intensive agricultural activities, while the elevated zones of the study area are predominantly mountainous [29].
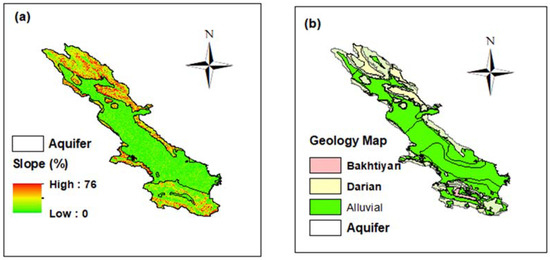
Figure 2.
Slope map (a) and geological map (b) of the study site.
2.4. Sampling and Analysis
For investigating the groundwater quality, water samples were collected from 70 agricultural, industrial selected wells, and aqueducts, which are located across the study site far from cites or other pollution sources, during 2010–2018, mainly in 2015 and 2018 (Figure 1b). The samples were collected form pumped wells, which provide water for irrigation. During the sampling period (2010–2018), due to not pumping the water, a few wells were sampled two or three times; however, most of the wells were sampled at least four times. Hence, in this study, we used the mean quality data of this sampling period (2010–2018). Due to the effects of long-time sampling on the biological water quality indicators, only 11 chemical water quality indicators (presented in Table 1) were obtained according to the APHA (1998) standard; however, the sample were kept in the cool boxes and transferred to the lab as soon as possible. Therefore, biological aspects of groundwater quality were considered in the present study. EC and pH were determined using a pH-EC meter. The amount of total dissolved solids (TDS) was measured based on the weighing method [1,2]. Chloride (Cl−) was measured via titration with AgNO3. Flame photometry was used for sodium (Na+) and potassium (K+) and, titration with EDTA and sulfuric acid was applied for calcium (Ca2+), magnesium (Mg2+), and bicarbonate (HCO3−), respectively [30]. The sulfate (SO42−) level was obtained using the spectrophotometry method. The total hardness (TH) and total alkalinity (TA) were determined according to Boyd [31] as follows:
where Ca2+, Mg2+, and HCO3− are calcium, magnesium, and bicarbonate (meq/L).
TH (mg/L) = (Ca2+ + Mg2+) × 50
TA (mg/L) = (HCO3−) × 50

Table 1.
Summary statistics of physicochemical indicators of Marvdasht groundwater.
Prior to statistical analysis, the charge balance error (CBE) index was used for the investigation of the accuracy of data as follows:
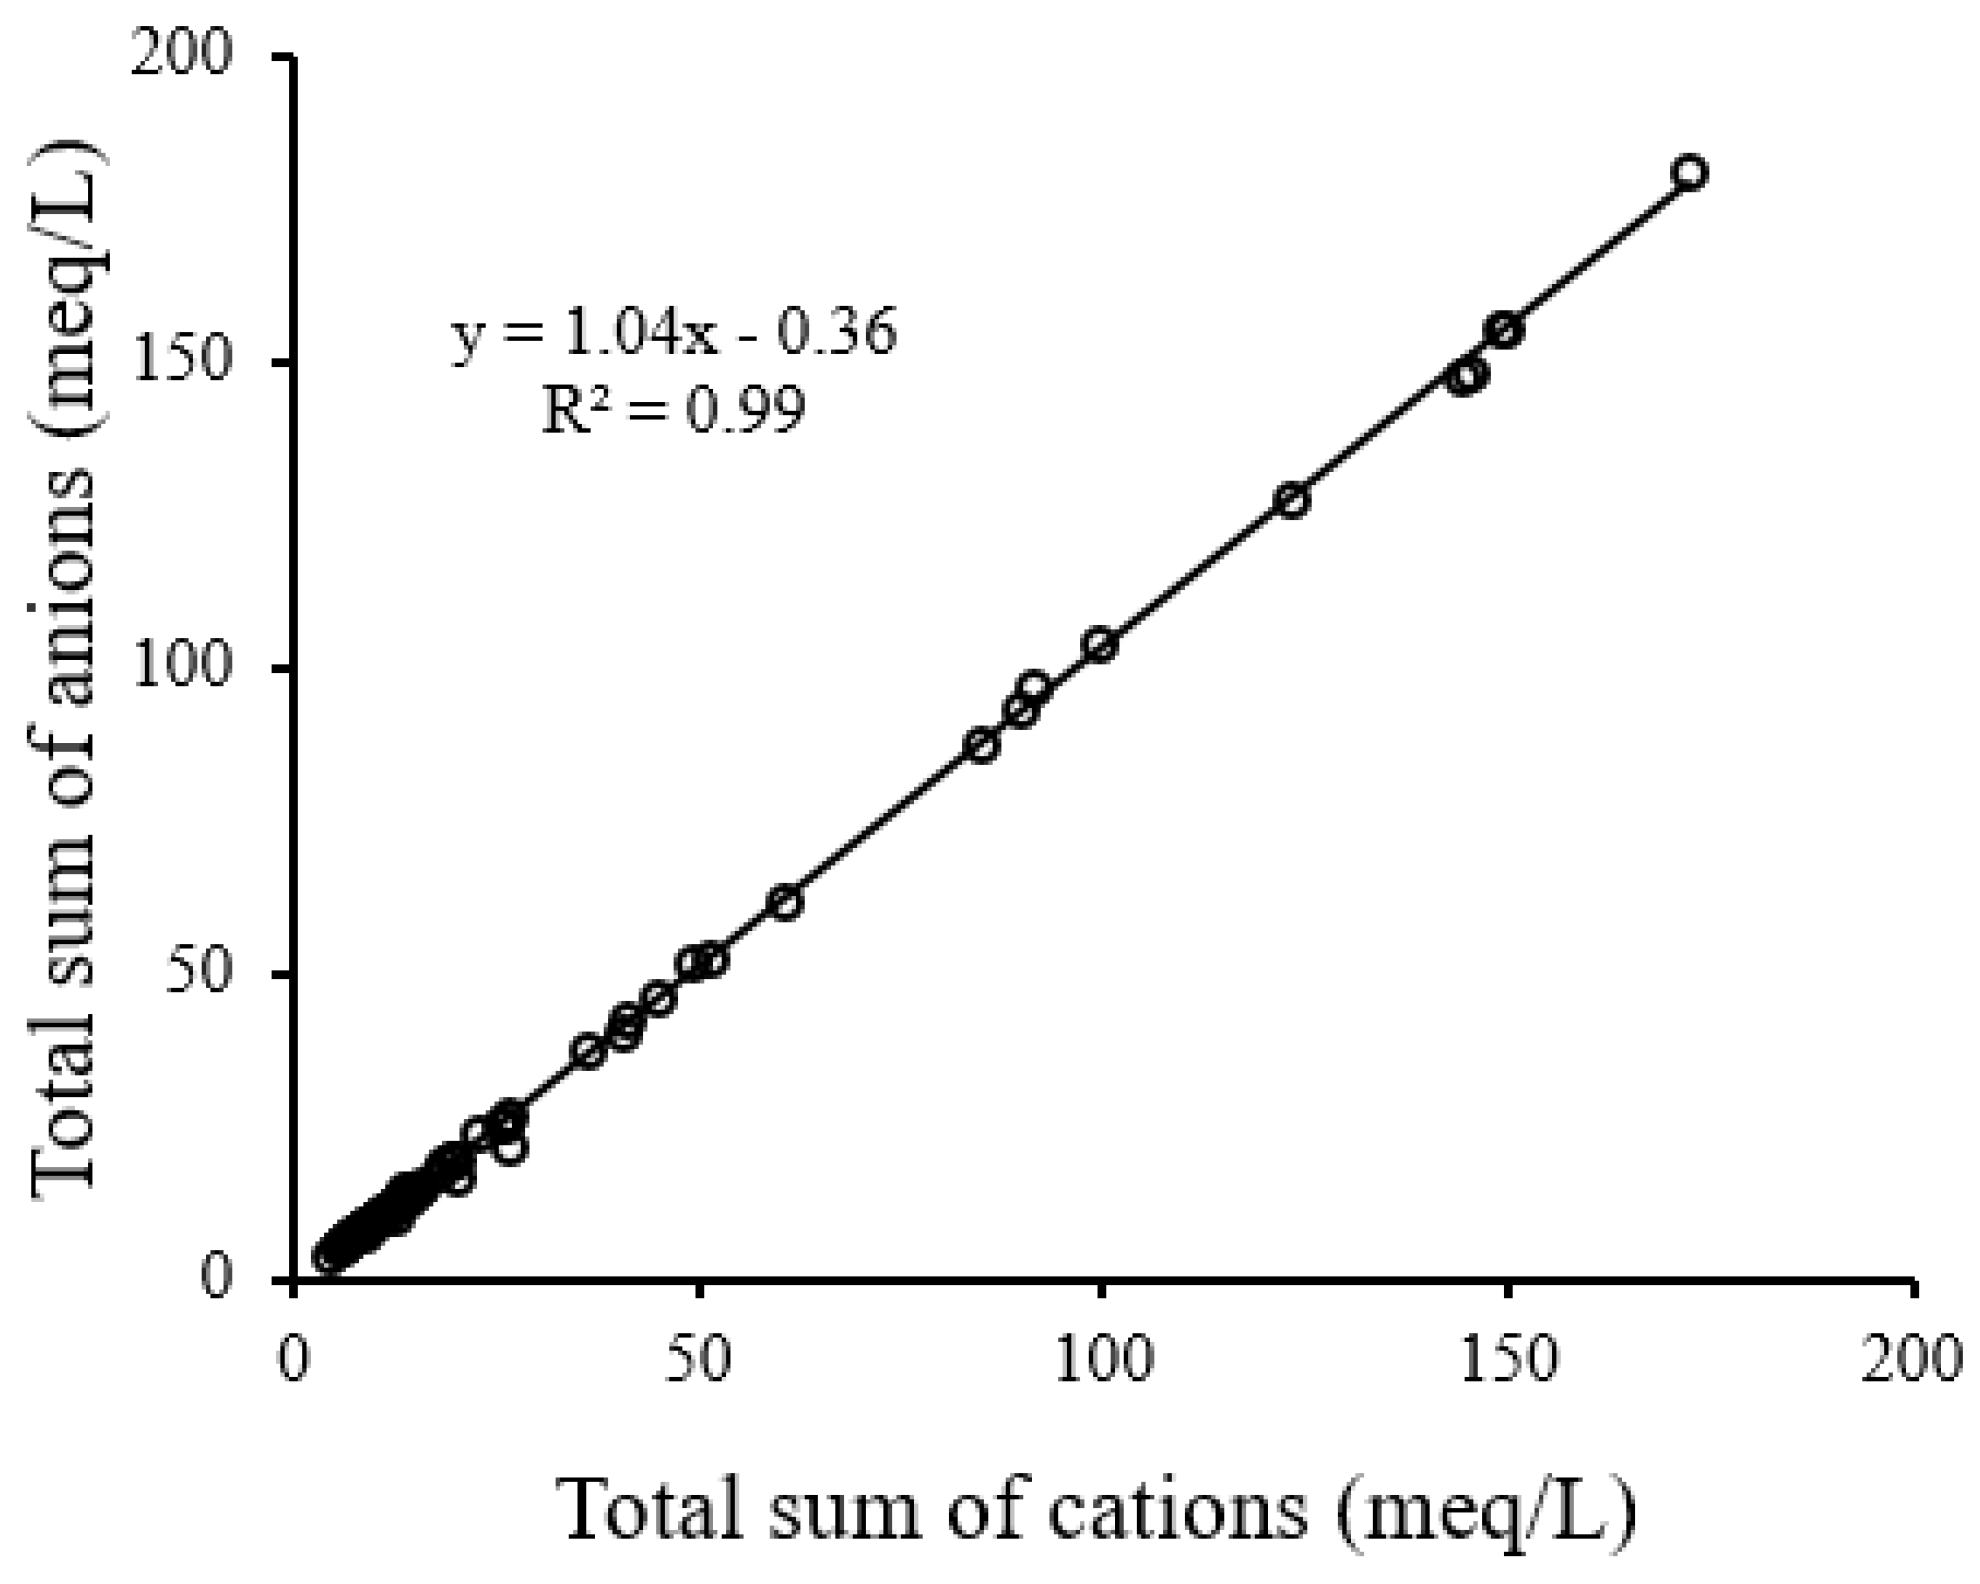
A CBE < 5% indicates the data are acceptable for analysis [6]. A CBE of 1.3% proves the high accuracy of chemical analysis of groundwater quality parameters [6]. Figure 3 supports Equation (3) by presenting a perfect relationship between the total sum of cations and anions (meq/L) for all 70 groundwater samples. The hydro-chemical analysis was carried out in Aqua software.
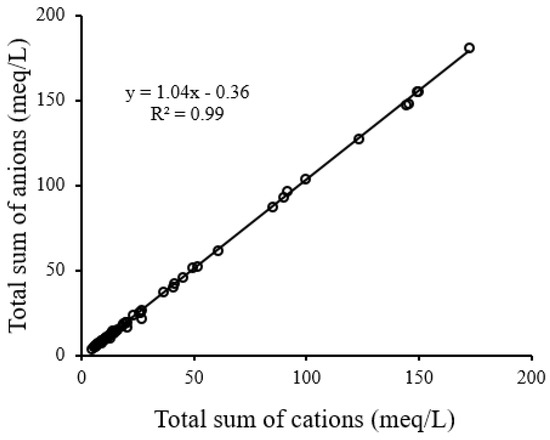
Figure 3.
Total sum of cations (TSC) versus total sum of and anions (TSA).
2.5. Drinking Groundwater Index (DGWQI)
The steps performed to calculate the drinking groundwater quality index are presented below:
(I) The weight of each groundwater quality indicator (Gwi) was determined as follows: The weight of groundwater indicators varied between 1 and 5. Weights 1 and 5 belonged to the least and most effective indicators of groundwater quality, respectively [32]. The relative weight (GWr) was calculated as follows:
where Gwi was the weight of each groundwater quality indicator and was the sum of the weight of the n indicators.
(II) The quality ratio (qi) for a single indicator was determined as follows:
where qi was the quality ratio, Ci was the amount of indicator (mg/L), and DSi was the WHO standard for the indicator, the ideal value was Cio = 0.
(III) The drinking groundwater quality index (DGWQI) was calculated as follows:
where GWr was relative weight and qi was the quality ratio.
2.6. DGWQI Sensitivity Analysis
Sensitivity analysis was used to determine the most (or least) influential GW quality indicator of the groundwater quality. In the present study, the removal approach [33] was employed to check the effect indicators for the calculation of DGWQI as follows [34]:
where Vwi = variation index (%) without ith indicator, DGWQI = drinking groundwater quality index with all the 11 indicators.
Vwi = [(DGWQI − DGWQI wi)/DGWQI] × 100
2.7. Geostatistical Analysis
The maps of DGWQI and its sensitive indicators were generated by applying ordinary kriging (OK) in ArcGIS version10.0 [35]. The semi-variogram is a geostatistical tool to visualize, model, and interpret the spatial dependence in regionalized parameters [4]. The simple definition of the semi-variogram is the half squared-difference variation of the regionalized variable by distance and is a practical measure of average spatial changes [10]. Some important features to show the variogram include the following: (i) range (radius of influence), (ii) sill (observed variance when the semi-variogram levels off at large distances), and (iii) nugget (observed variance at zero distance) [10]. The semi-variogram was calculated using Equation (1) [36,37].
where , , and were measured indicators at the location of xi, the variogram for a lag distance h between and and the number of data pairs, respectively [38,39]. Range, sill, and nugget are important features to show the variogram [38]. The ordinary kriging (OK) was calculated as follows [37]:
where λi and were the weight of a particular predicted quality indicator at the selected. OK is a weighted linear combination of the measured data [39,40,41].
2.8. Performance Evaluation
The performance of the variogram was tested using cross-validation. The performance of the OK was examined with the coefficient of determination (R2) (Equation (10)), mean error (ME) (Equation (11)), and root mean square error (RMSE) (Equation (12)).
where N was the number of data, Yi were measured, and were estimated data. Statistical analyses such as description statistic and correlation were done using Statistica 8.0 software [42,43].
3. Results and Discussion
3.1. Descriptive of Groundwater Quality Indicator
A summary of chemical groundwater quality indicators is presented in Table 1. The pH varied in the range 7.30 to 8.25 (Table 1), indicating that the groundwater is mainly alkaline, which can be related to the dominant carbonate formations in the study site. The EC values ranged from 50.5 to 14,695.0 μS/cm, and the average TDS was 2400.7 mg/L (Table 1), indicating that groundwater is not suitable for potation [17]. Only 28.5% of the samples had TDS < 600 mg/L, which is considered desirable for drinking [18].
In addition, according to Table 1, majority of the samples had TH less than the allowable limit (500 mg/L). Accordingly, Ca2+ and Mg2+ varied from 52.0 to 838.6 mg/L and 11.6 to 836.5 mg/L, respectively. Only 16% of the samples had Mg2+ within the permissible limit (<35 mg/L). The Na+ varied from 6.0 to 2200.4 mg/L (Table 1). The Cl− varied between 13.5 and 5117.7 mg/L and, based on WHO guidelines [17], in 28.5% of samples, the Cl−1 exceed the maximum allowable range (600 mg/L).
3.2. Hydro-Geochemical Assessment
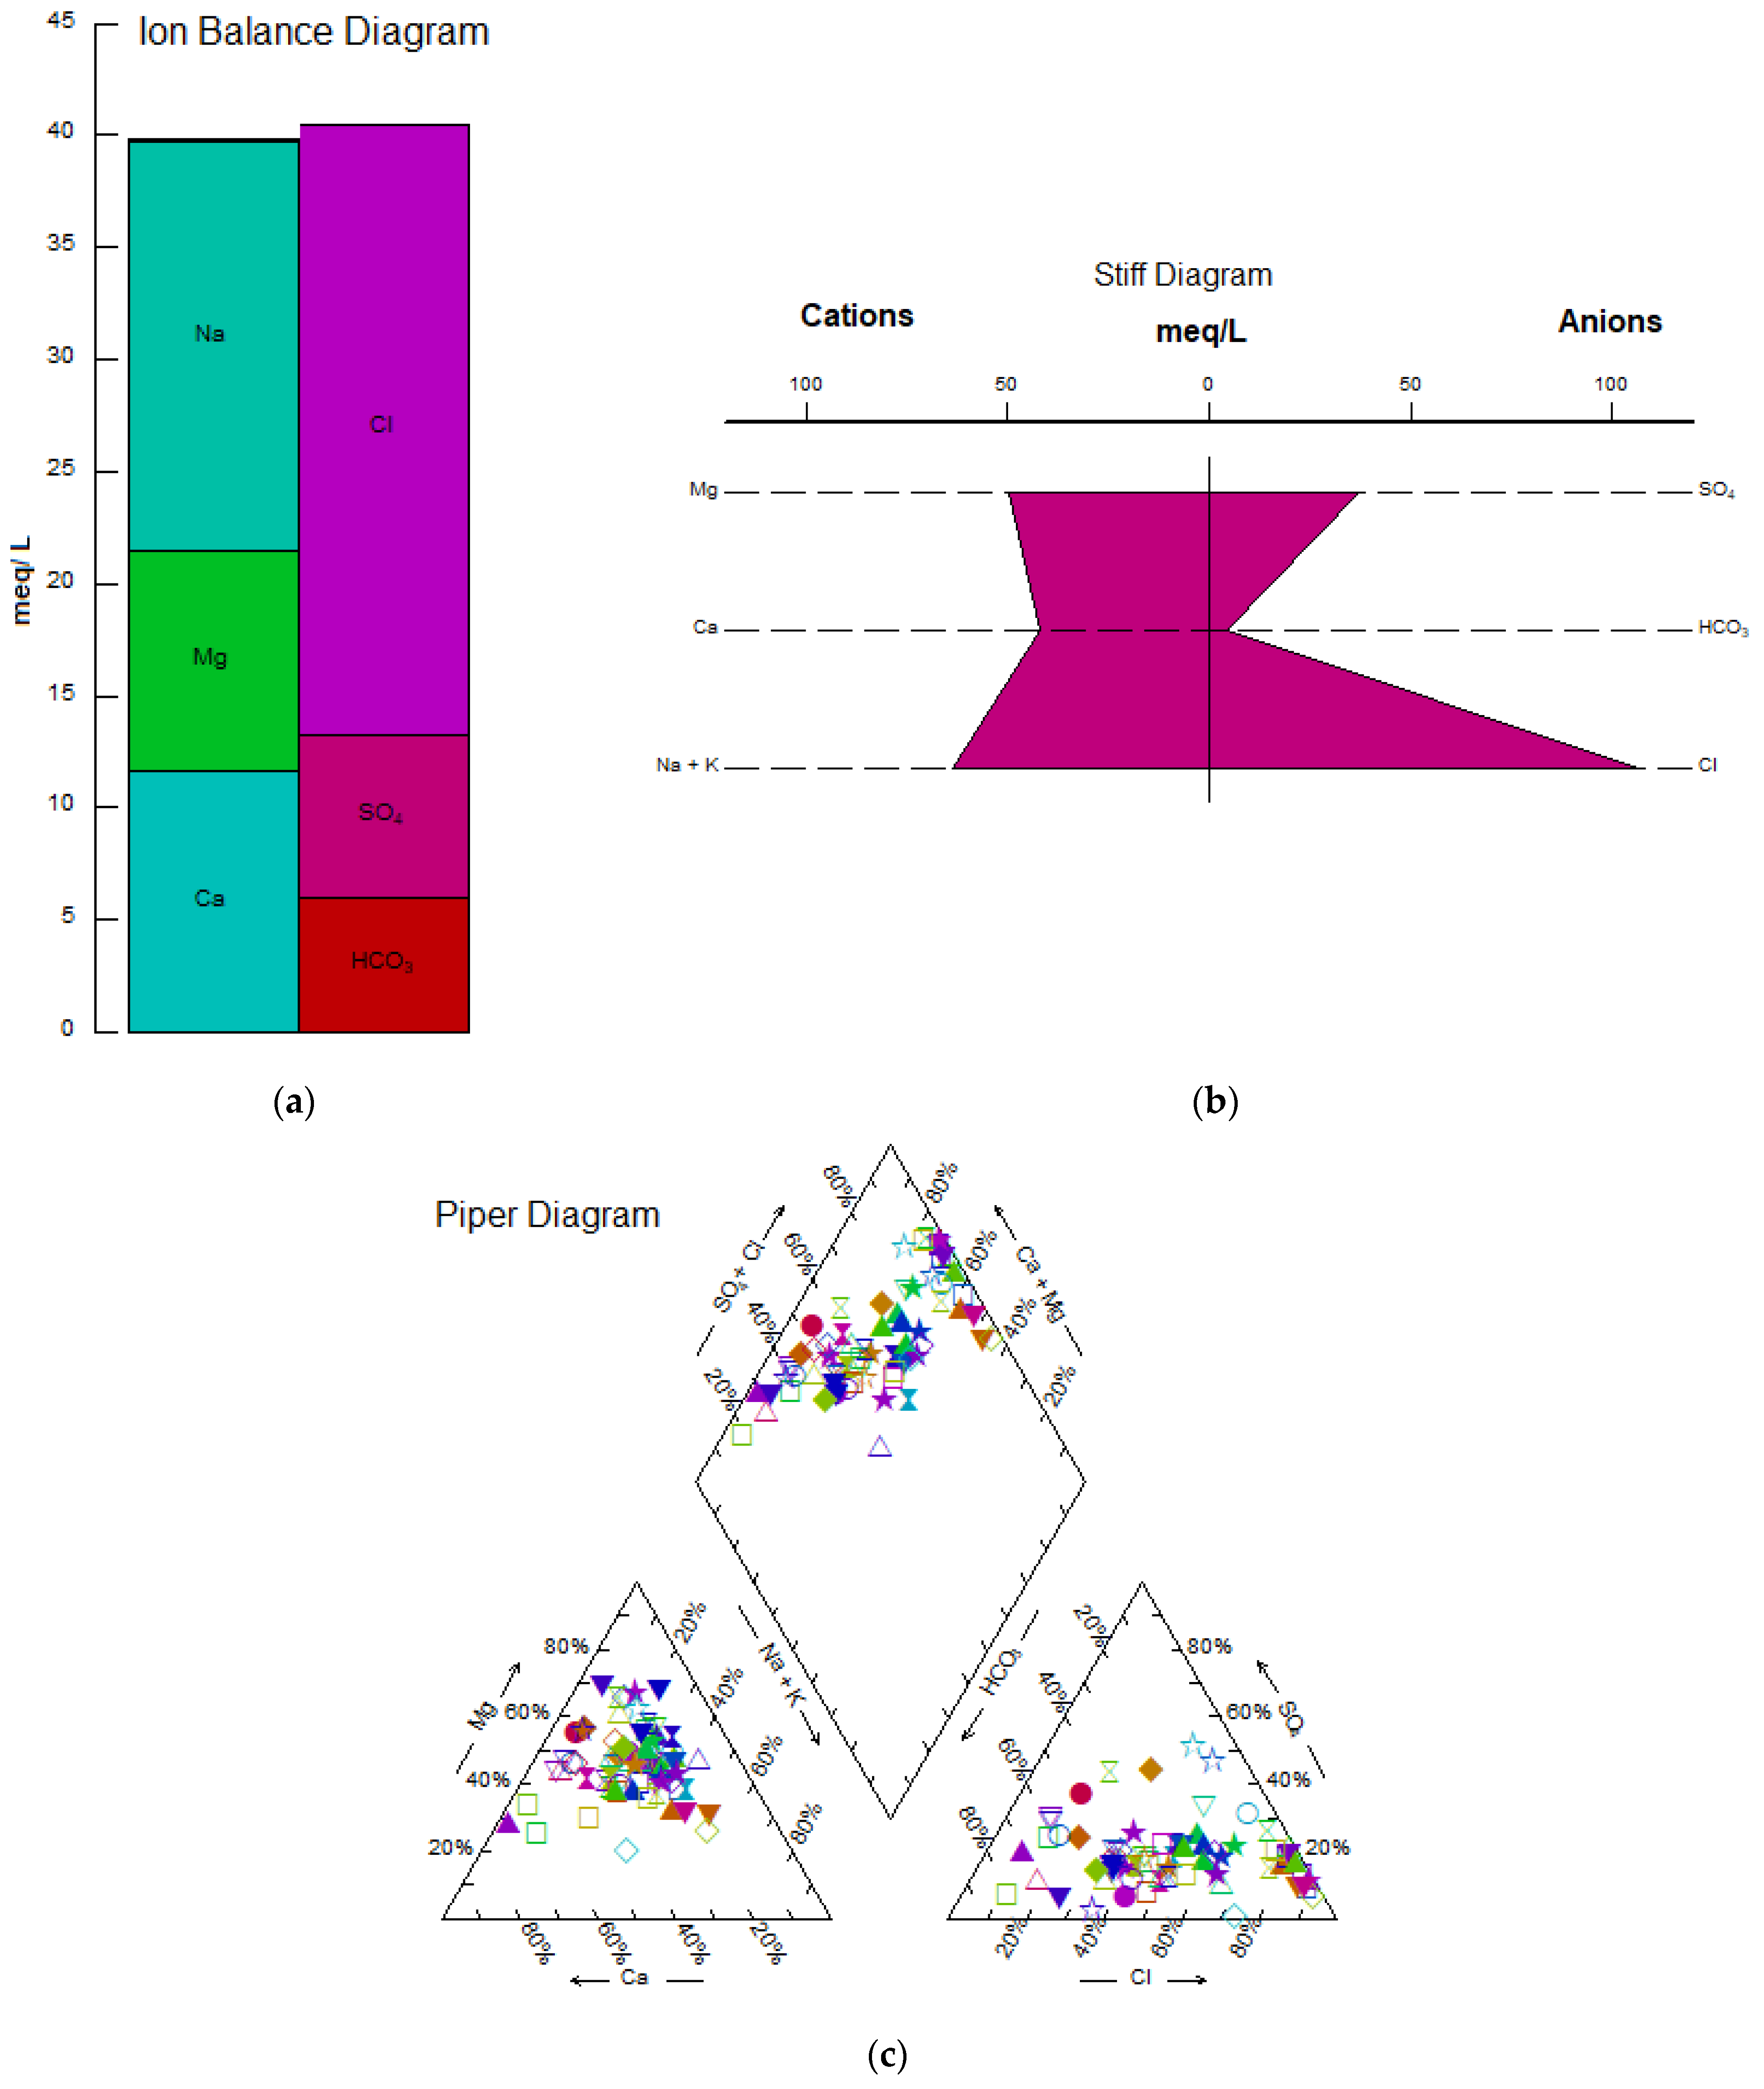
Piper, Stiff, and ion balance diagrams were employed to determine the main ions and the type of water samples (Figure 4). Ion balance (Figure 4a) declares the validity of chemical analysis (total cations = 94% of total anions). The Stiff diagram (Figure 4b) shows that Cl− is the dominant anion (48% of the samples) followed by SO42− (28% of the samples) and HCO3− (24% of the samples). Furthermore, the Stiff diagram indicates that Na+ is the dominant cation followed by Mg2+ and Ca2+. Ca2+, Mg2+, and Na+ + K+ cover 24%, 22%, and 54% of total samples, respectively. According to Honarbakhsh et al. [2], the Marvdasht groundwater was rich in Na-CL; Mg2+ was the most important cation due to the possibility of marl formation with large quantities of dolomite. Another possible reason for the high amount of Mg2+ in Marvdasht groundwater could be the charging of the Marvdasht via the Kor River that passes through the chalky-saline formation of Gachsaran and transports urban sewage [1,3]. According to the Piper diagram (Figure 4b), all samples were classified into three main water types; the dominant one was Ca-Mg-SO4-Cl water type that accounted for 47% of the samples. This could be due to incongruently dissolution and weathering of carbonate materials from carbonate formations such as Asmari by dissolved CO2 that existed in the study site. The second water type was Ca-Mg-HCO3 (42% of the samples) followed by the water type of Na-Cl- SO4 including 13% of the samples. Honarbakhsh et al. [2] showed that the carbonate and silicate weathering process in the Marvdasht aquifer controls the chemistry of this groundwater.
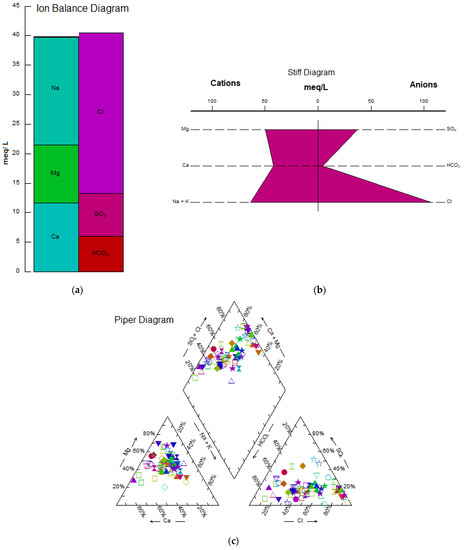
Figure 4.
Ion balance (a), Stiff (b), and Piper (c) diagrams of the Marvdasht groundwater.
3.3. Calculation of Drinking Groundwater Quality Index (DGWQI)
Table 2 shows the recommended weight values of each groundwater quality indicator and steps of DGWQI calculation. The weight of each quality indicator was determined based on its role in groundwater quality. The highest weight of five was assigned to TDS due to its important role in water quality followed by TH and chloride with weights of four, which is in line with Bawoke and Anteneh [6]. According to the average DGWQI of 293, the groundwater of the study area is classified as non-potable. In 42% of samples, DGWQI values were between 0 and 100 (appropriate quality class), in 25% of samples, the DGWQI values were between 100 and 200 (poor class); in 10% of samples, DGWQI values were between 200 and 300 (very poor class); and in 22% of the samples, DGWQI values were more than 300 (non-drinking class). According to Table 2, EC with QW = 62, TDS with QW = 58, and Mg2+ with QW = 58 were the most influential indicators on DGWQI calculation, while pH with QW = 6.1, sulfate with QW = 10.5, and TA with QW = 11 had little effect on the DGWQI calculation.

Table 2.
Permissible values of quality indicators for drinking based on WHO recommendations (2011) and the relative weight assigned to each indicator.
The correlation coefficient values between DGWQI and quality indicators are presented in Table 3. All groundwater indicators except TA had a significant correlation with DGWQI (Table 3, p < 0.05). There was a relatively significant correlation between Mg2+ with Cl− and Ca2+ (p < 0.05), indicating the presence of carbonate formations in the study area [29], which is supported by Mehrjerdi et al. [12] and Kalantari et al. [44]. In addition, Na+ was significantly correlated with Cl− and Mg2+ (p < 0.05). Ostovari et al. [3] reported a significant link between Ca2+ and Mg2+ in the Lordegan aquifer. Similarly, Heshmati [10] also highlighted a robust correlation between Ca2+ and Mg2+ with Cl− and SO42-. pH was negatively correlated with all indicators and DGWQI, which in line with findings by Ramakrishnaiah et al. [32] and Mehrjerdi et al. [12]. There was a strong and significant correlation between EC and TDS and TH (Table 3, p < 0.05) due to Ca2+ and Mg2+, which are the major cations associated with the hardness and TDS, which is supported by the results of Ramakrishnaiah et al. [32], Mehrjerdi et al. [12], and Ishaku [45]. On the other hand, TA was correlated with TH and pH, which is in agreement with Rafferty [46] and Mehrjerdi et al. [12].

Table 3.
DGWQI correlation coefficients with Marvdasht groundwater quality indicators.
3.4. Sensitivity Analysis
Table 4 gives the results of the indicator removal analysis for all the quality indicators. Mg2+, EC, and TDS with the highest mean value of the variation index of 18.98, 20.68, and 19.04 were the most sensitive indicators in the calculation of DGWQI. Jafri et al. [11] and Bawoke and Anteneh [6] showed that high EC and TDS in groundwater were the main indicators in Abhar. It means that these indicators had the highest influence on DGWQI. This result was in agreement with the findings of Babiker et al. [5], Machiwal et al. [34], and Ostovari et al. [4]. The indicators Na+ (VI = 4.5) and K+ (VI = 1.14) had the lowest impact on the DGWQI calculation.

Table 4.
Results of the indicator removal sensitivity analysis (VI).
3.5. Geostatistical Analysis of DGWQI
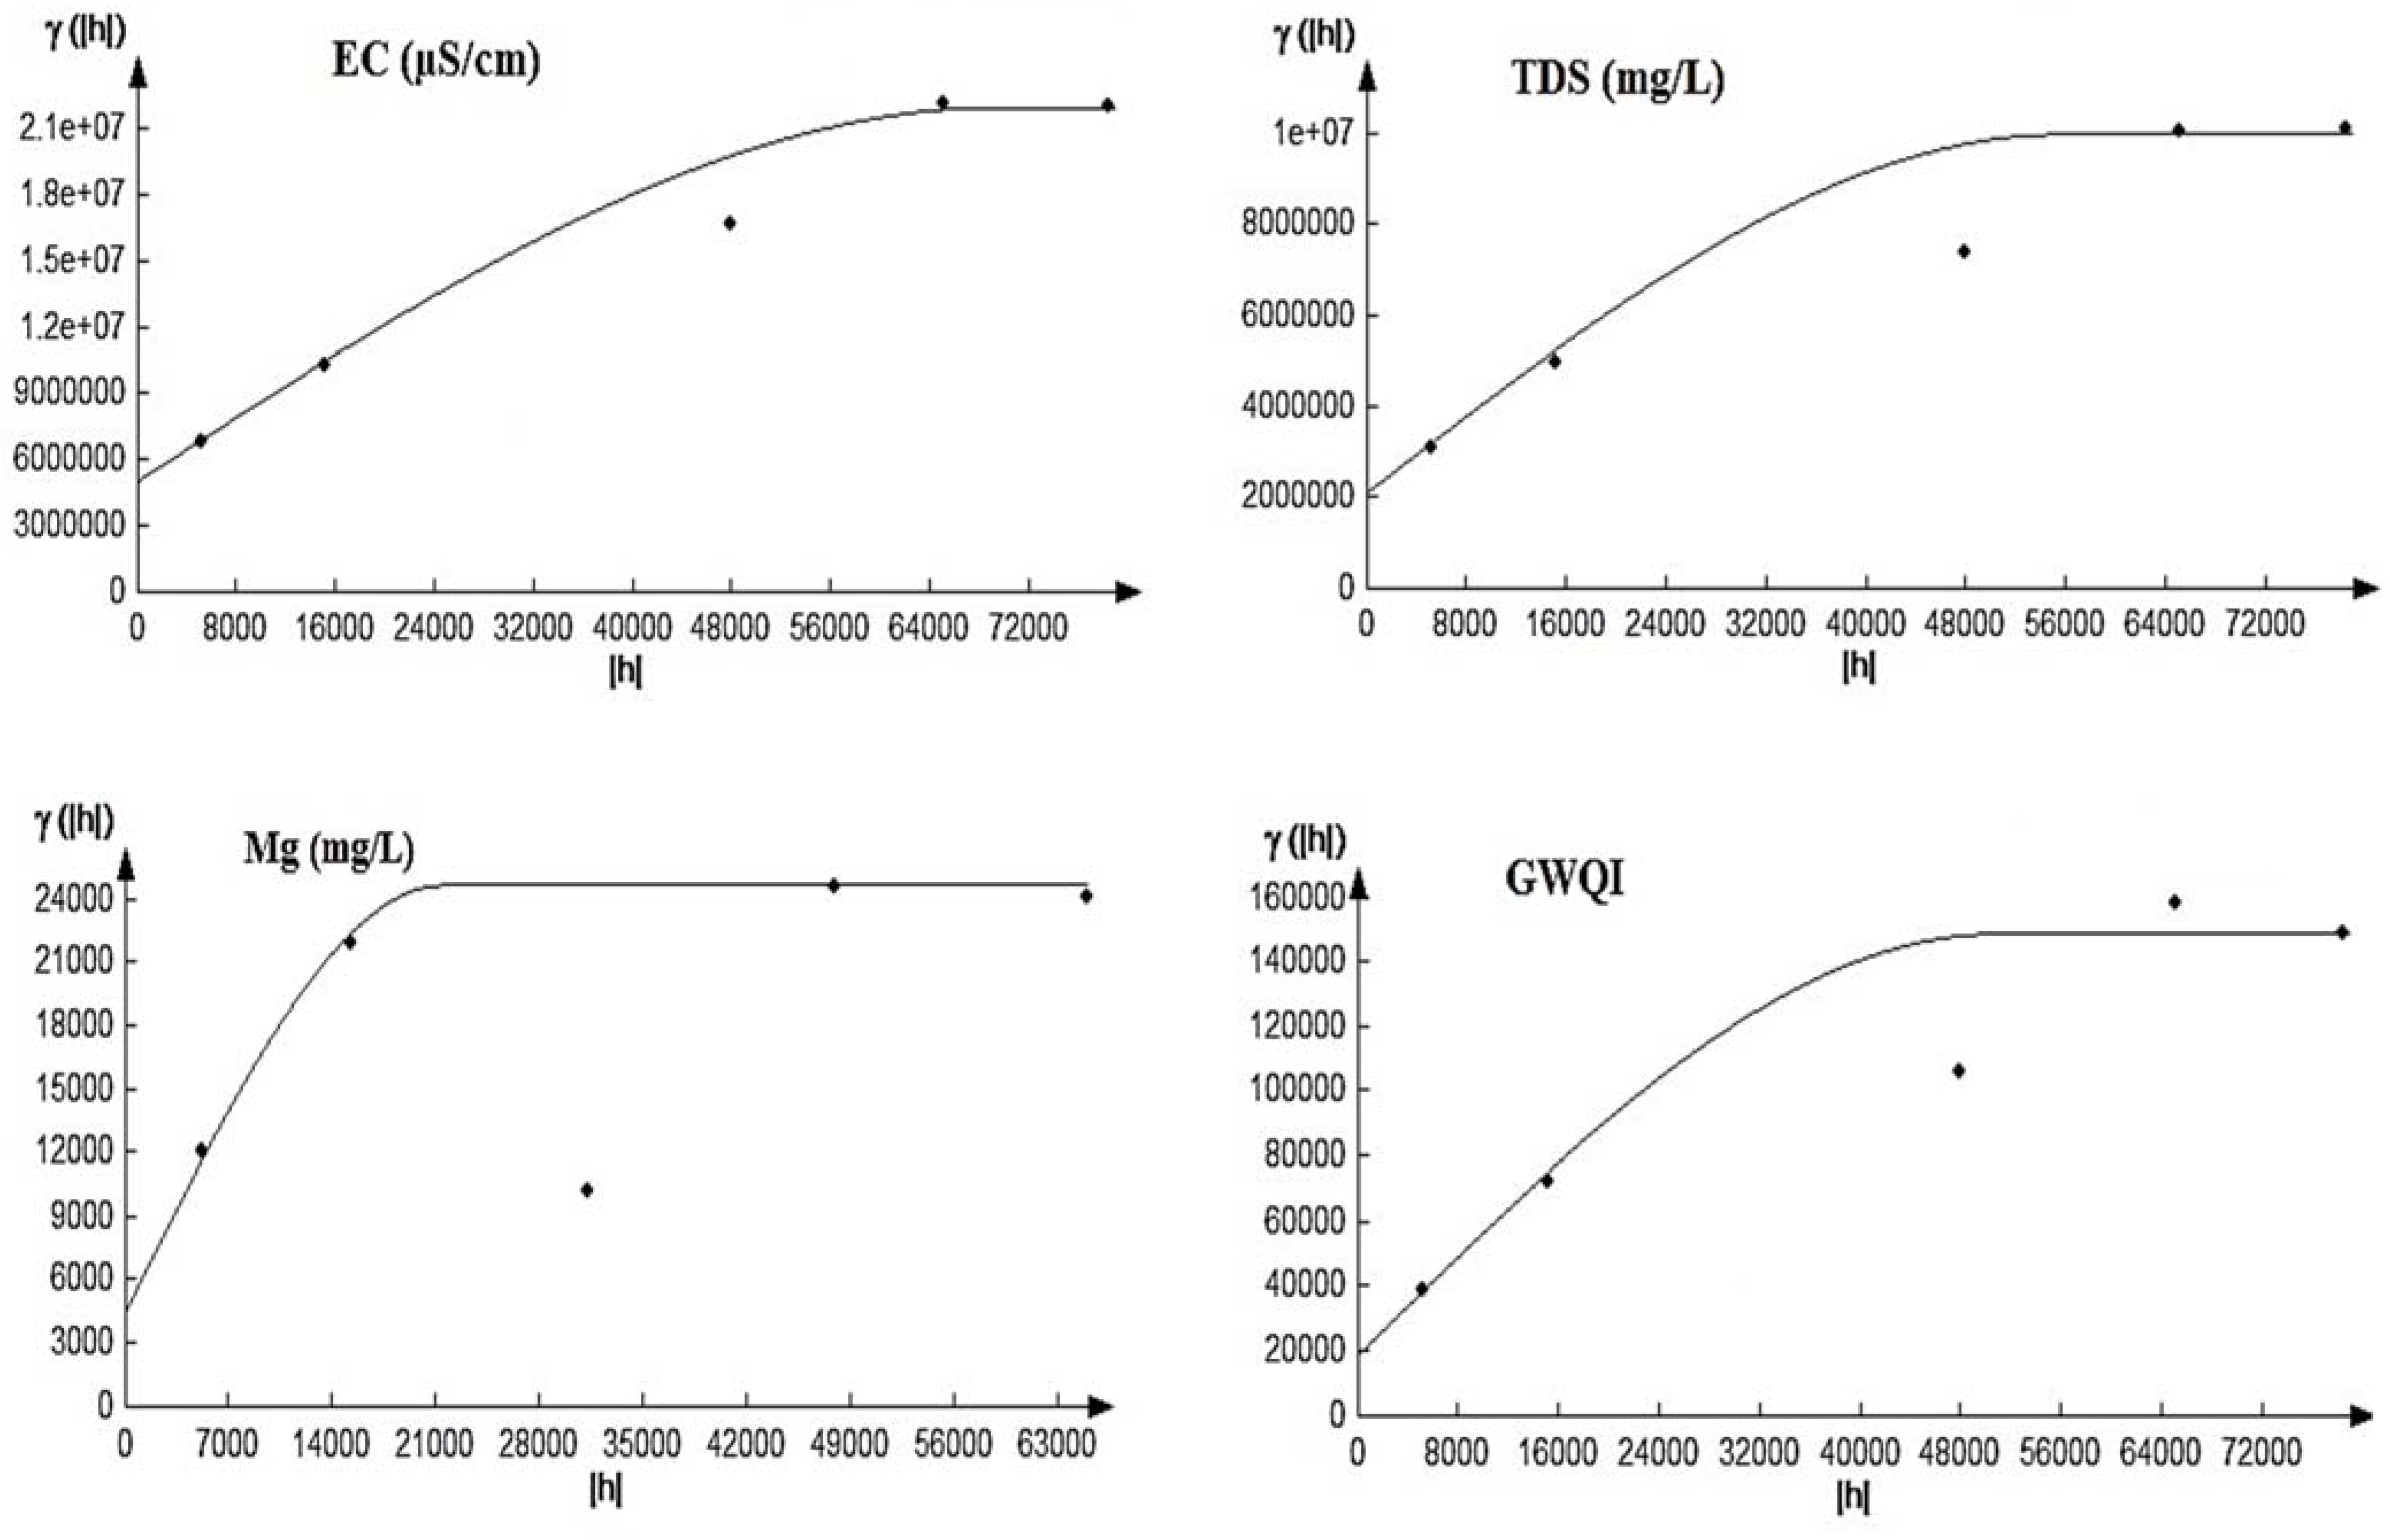
Figure 5 shows the best-fitted variograms of DGWQI and the parameters of EC, TDS, and Mg2+ that had the highest influence on DGWQI. For DGWQI, EC, TDS, and Mg2+, the variogram spherical model had the best performance, which could be due to the high correlation between DGWQI and EC, TDS, and Mg2+. In Arsanjan groundwater, the spherical model was the best model for TDS and pH.
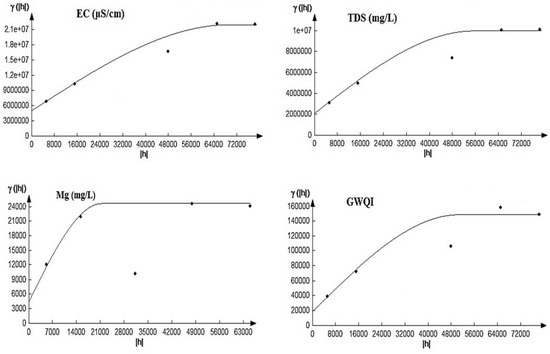
Figure 5.
Semi- variograms fitted to DGWQI, EC, TDS, and Mg2+. EC: electrical conductivity; TDS: total dissolved solids; Mg2+: magnesium; GWQI: groundwater quality index.
Table 5 gives the features of the semi-variograms for DGWQI, EC, TDS, and Mg2+. The spatial dependency for quality indicators and DGWQI was specified via the C0/sill ratio. According to the C0/sill ratio, a relatively spatial dependency (i.e., 0.27–0.44) was found for DGWQI, EC, TDS, and Mg2+ (Table 5). This means that estimations were relatively strong and reliable in the range. The range values for EC and Mg2+ were almost equal, which could be because of the presence of dolomite stones with high Mg2+.

Table 5.
Semi-variograms of DGWQI, EC, TDS, and Mg2+.
Sanches [47], Mehrjerdi et al. [12], Ostovari et al. [4], and Heshmati [10] used a spherical model to show the spatial variation pattern for Na+, SO42−, HCO3−, Cl−, and Ca2+ and Mg2+.
The results of OK methodology for mapping DGWQI, EC, TDS, and Mg2+ are given in Table 6. The R2, RMSE, and ME values of the OK for TDS and EC were close, which could be due to the very high correlation between EC and TDS (Table 3). Several studies have reported that the OK method is the best method for mapping groundwater quality indicators [10,12]. Sanches [47] and Ostovari et al. [3] reported the good performance of the kriging method using data from 36 and 40 wells. However, the present study was conducted using quality data from 70 wells, which provided robust results.

Table 6.
The results of OK for DGWQI, EC, TDS, and Mg2+. EC: electrical conductivity; TDS: total dissolved solids; Mg2+: magnesium; GWQI: groundwater quality index.
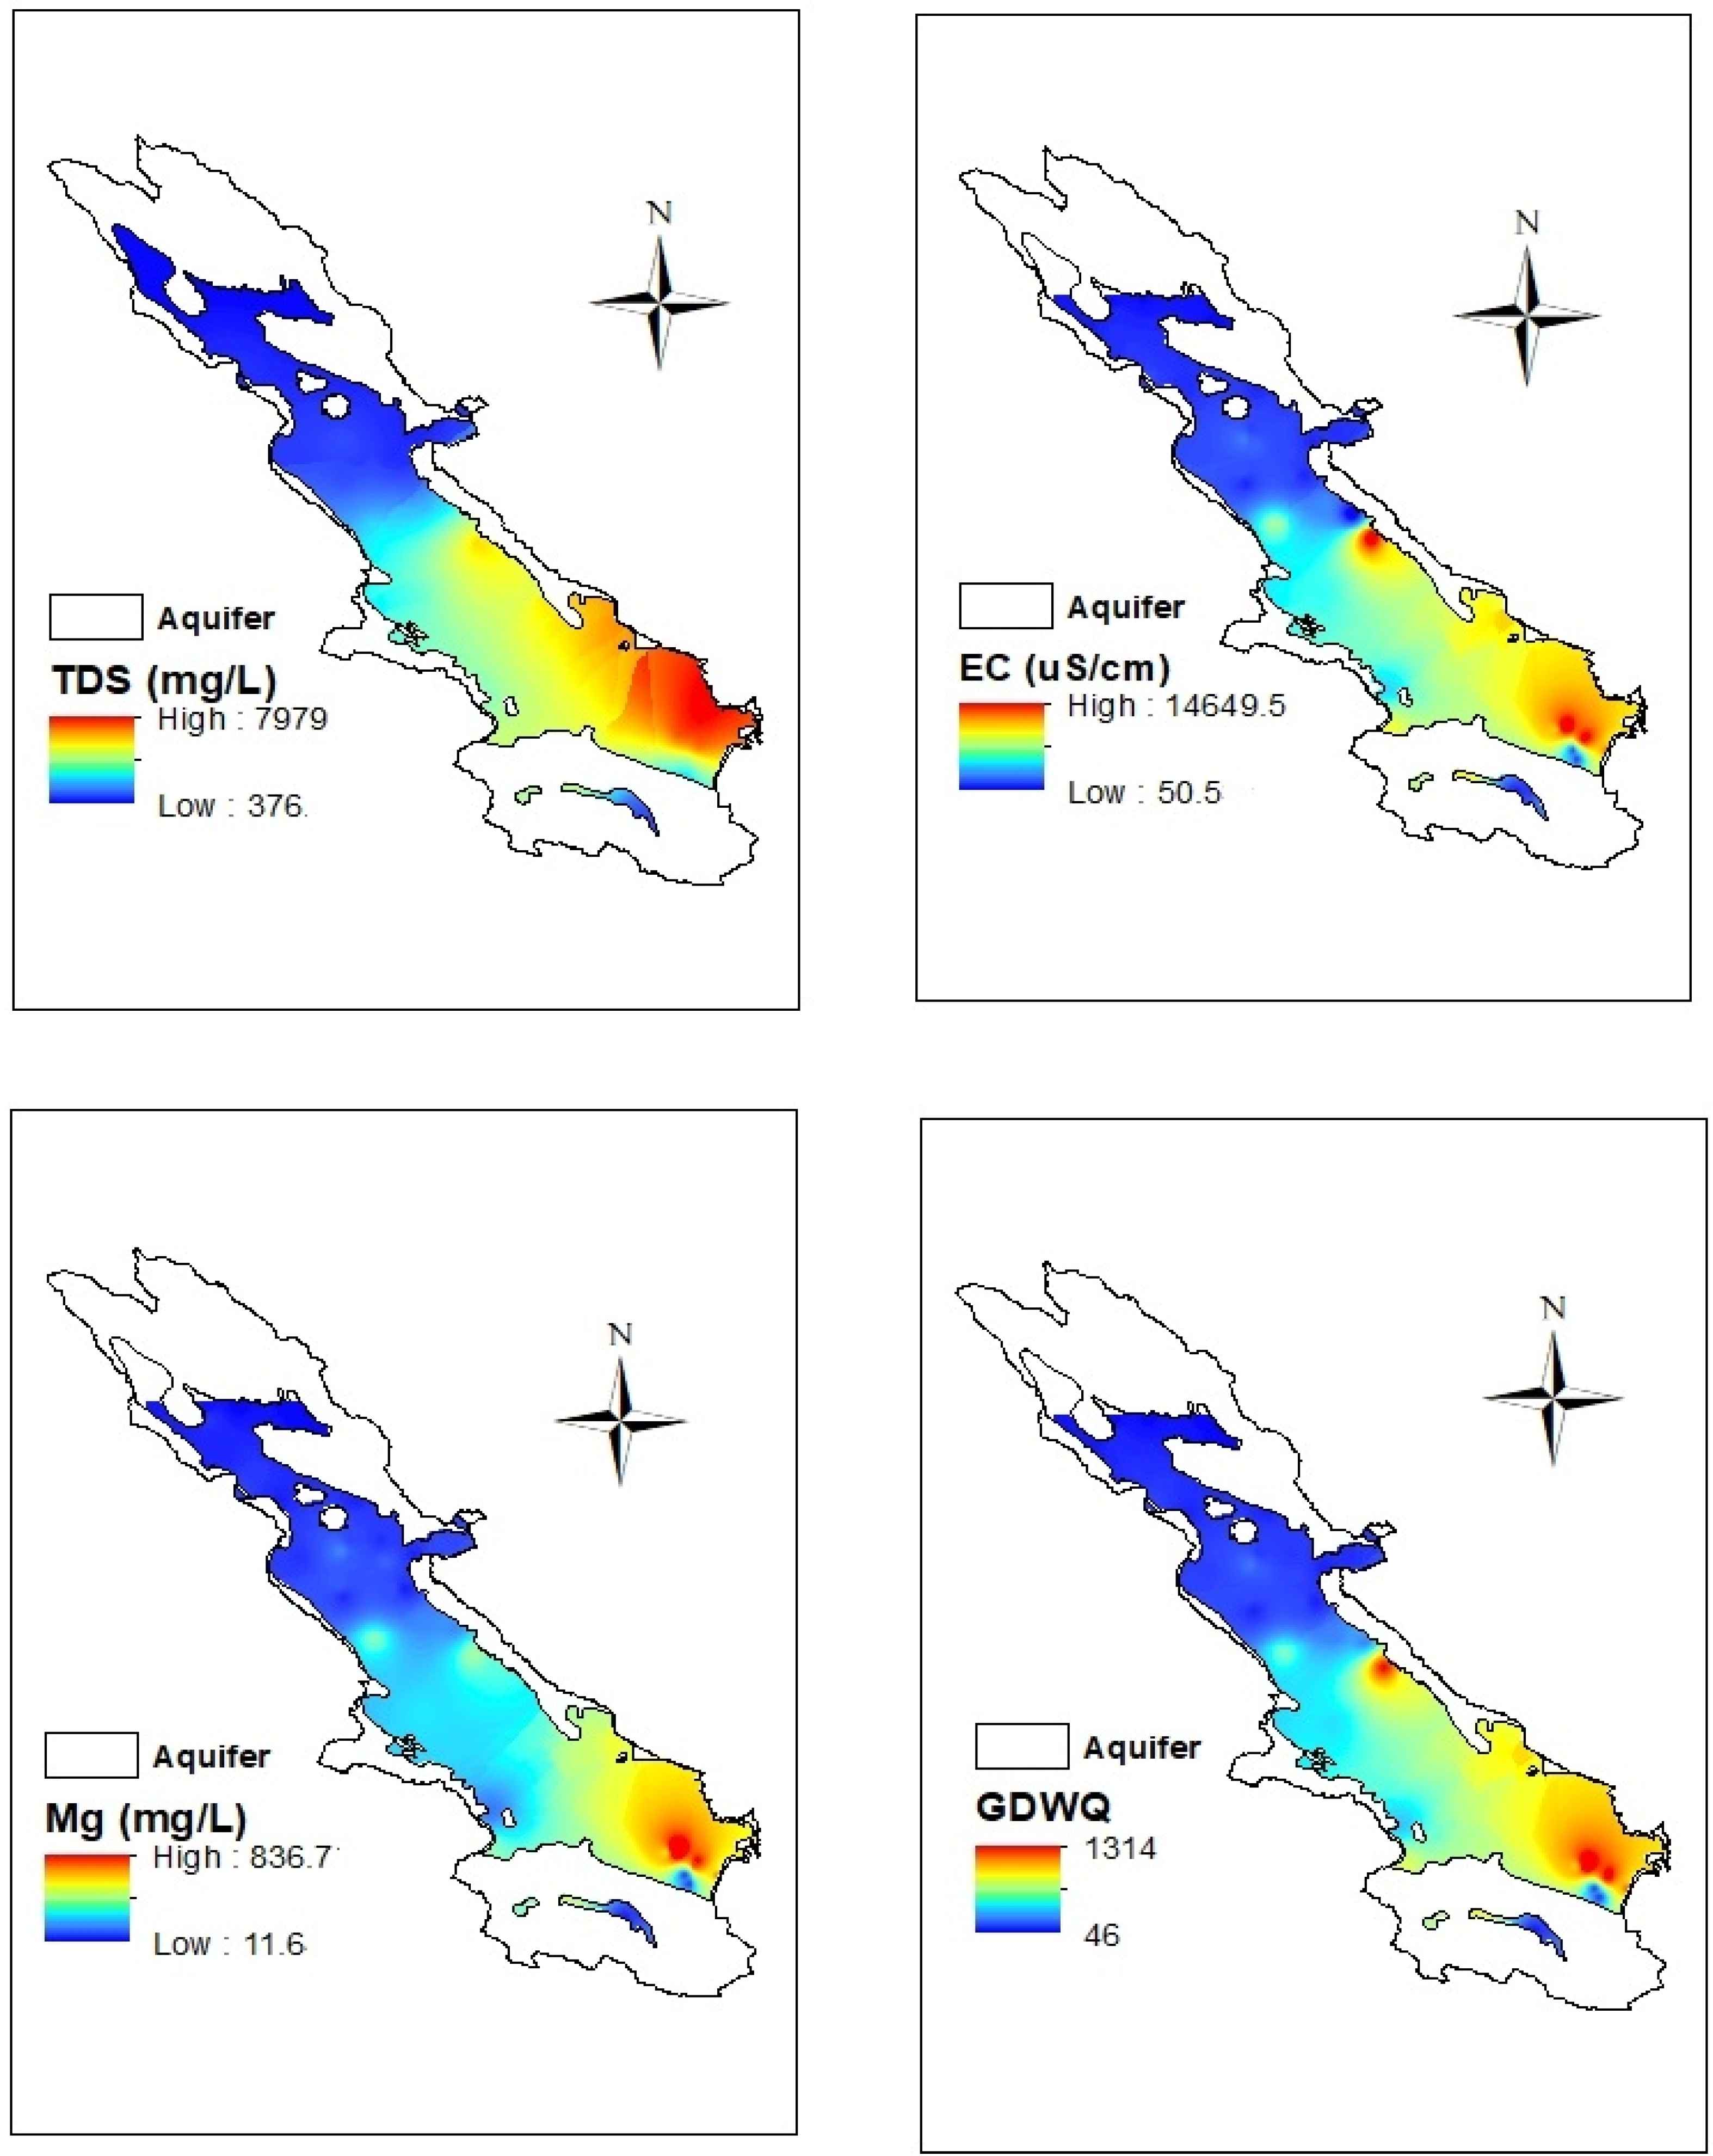
The estimated maps for all DGWQI, EC, TDS, and Mg2+ by applying the OK method are depicted in Figure 6. Spatial variations of all DGWQI, EC, TDS, and Mg2+ had the same trend; enhancing from the northeast to the southwest of the aquifer. TDS values ranged from 376 mg/L in the northern parts to 7979 mg/L in the southern parts of the aquifer. In the northwestern parts, the amount of TDS and EC was lower than the WHO standard for drinking, but by moving to the south of the aquifer, the quality of groundwater in terms of TDS and EC decreased and groundwater became unsuitable for drinking according to WHO (2011). The EC value varied from 50.5 μS/cm in the northern parts to 14,649.5 μS/cm in the southern parts of the aquifer. The DGWQI value varied from 46 in the northern to 1314 in the southern parts of the aquifer. Therefore, groundwater quality was appropriate in the northern parts and unsuitable for drinking in the southern parts [32]. Geological formations in the northern and central parts of the plain are alluvial and Sarvak limestone (Figure 2b), which are very compact, hard, and low solubility [4,48]. The Dorodzan dam located in the northern part of the site charges the groundwater of this area. While in the southeast, the presence of Sarvestan sediments (gypsum-saline) and Hormoz igneous rocks can lead to a decrease in groundwater quality [29,49]. Furthermore, in this area, gypsum-marl formations containing gray lime and dolomite calcium and magnesium carbonate along with evaporitic sediments reduce groundwater quality [29,50]. Therefore, EC, TDS, Mg2+, and then the DGWQI in the southeastern parts of Marvdasht aquifer were high. In addition to geological reasons, the recharging the aquifer by the Kor River is another reason for the low quality of groundwater in the southern part. Furthermore, the entry of industrial, municipal, and agricultural wastewater reduces the quality of the Kor River, which ultimately reduces the quality of groundwater in the southeastern part of the aquifer, which charges the Marvdasht aquifer, resulting in a decrease of groundwater quality in that part of the site. In addition, as mentioned, the groundwater flows from high altitude in the north to the altitude in the south, where there are high amounts of salt and carbonates, causing lower groundwater quality.
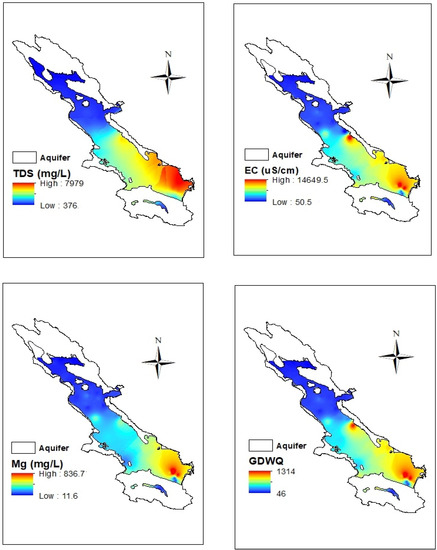
Figure 6.
The mean groundwater drinking quality index (DGWQI) map of Marvdasht. EC: electrical conductivity; TDS: total dissolve solid; Mg2+: magnesium; GWQI: groundwater quality index.
According to the DGWQI classification [32], Marvdasht groundwater was divided into four classes (Table 7). The largest class (in the southeastern part of the aquifer) with an area of 993.5 km2 (50% of the aquifer area) belonged to DGWQI class >300, which puts the groundwater quality in the non-potable class. The smallest class (in the central area of the aquifer) with an area of 99.3 km2 (5% of the aquifer area) belonged to the DGWQI class between 200 and 300, which puts the groundwater quality in the poor class for drinking. In the northwestern parts of the aquifer, DGWQI < 100 shows an appropriate quality for drinking.

Table 7.
DGWQI classification of Marvdasht groundwater according to Ramakrishnaiah et al. [32].
4. Conclusions
This research was conducted to investigate the groundwater quality of the Marvdasht aquifer, for drinking purposes by using data collected for five years (2010–2018). The Marvdasht plane, with more than three million residents, is one of the critical regions regarding the freshwater supply in southern Iran, where freshwater is generally vital for human consumption. According to the results, the main source of major elements was attributed to carbonate rocks. Results showed that TDS, EC, and TH were significantly important in terms of drinking purposes. According to the drinking ground water quality index (DGWQI), appropriate quality class (DGWQI between 0 and 100) was observed for 42% of the groundwater samples. Sensitivity analysis identified Mg2+, EC, and TDS with as the most sensitive indicators in the calculation of DGWQI with the highest mean variation index. According to the C0/sill ratio, a relatively strong spatial dependency (i.e., 0.27–0.44) was observed for DGWQI, EC, TDS, and Mg2+. The DGWQI map showed that the northern parts of the Marvdasht groundwater (31% of the Marvdasht aquifer with a 615.7 km2 area) had appropriate quality for drinking, where Dorodzan dam provides water for two big cities. We concluded that the use of GIS-based geostatistical analysis of DGWQI is a simple and trustworthy method to assess and interpret the groundwater quality for drinking purposes.
Author Contributions
Conceptualization, Q.Z. and B.Z.; methodology, Q.Z.; software, Q.Z. and Z.L.; formal analysis, Q.Z. and B.Z.; investigation, Q.Z. and F.D.; resources, Q.Z.; data curation, Y.O.; writing—original draft preparation, Q.Z.; writing—review and editing, Q.Z., Z.L. and Y.O.; supervision, Q.Z. and Z.L.; project administration, Q.Z. and Z.L. All authors have read and agreed to the published version of the manuscript.
Funding
Social science planning in Shandong Province “Application of GIS in pre-Qin Environmental Archaeology in Haidai area” (19czkj15).
Institutional Review Board Statement
Not applicable.
Informed Consent Statement
Not applicable.
Data Availability Statement
There is no reported data.
Conflicts of Interest
The authors declare no conflict of interest.
References
- Honarbakhsh, A.; Azma, A.; Nikseresht, N.; Mousazadeh, M.; Eftekhari, M.; Ostovari, Y. Hydro-chemical assessment and GIS-mapping of groundwater quality indicators in semi-arid regions. J. Water Supply Res. Technol.-Aqua 2019, 68, 509–522. [Google Scholar] [CrossRef]
- Honarbakhsh, A.; Tahmoures, M.; Tashayo, B.; Mousazadeh, M.; Ingram, B.; Ostovari, Y. GIS-based assessment of groundwater quality for drinking purpose in northern part of Fars province, Marvdasht. J. Water Supply Res. Technol.-Aqua 2019, 68, 187–196. [Google Scholar] [CrossRef]
- Ostovari, Y.; Asgari, K.; Beigi-Harchegani, H. A fuzzy logic approach for assessment and mapping of groundwater irrigation quality: A case study of Marvdasht aquifer, Iran. Arch. Agron. Soil Sci. 2015, 61, 711–723. [Google Scholar] [CrossRef]
- Ostovari, Y.; Beigi, H.; Heshmati, S. A GIS-based assessment of drinking quality of Lordegan groundwater using a GWQ index. Iran. Remote Sens. GIS 2016, 7, 107–120. (In Persian) [Google Scholar]
- Babiker, I.; Mohamed, A.; Hiyama, T. Assessing groundwater quality using GIS. Water Resour. Manag. 2007, 21, 699–715. [Google Scholar] [CrossRef]
- Bawoke, G.; Anteneh, Z.L. Spatial assessment and appraisal of groundwater suitability for drinking consumption in Andasa watershed using water quality index (WQI) and GIS techniques: Blue Nile Basin, Northwestern Ethiopia. Cogent Eng. 2020, 7, 1748950. [Google Scholar] [CrossRef]
- Sandara-Kumar, K.; Kumar Pitta, S.; Ratnakanth, B.; Hanumantha, R. Assessment and mapping of groundwater quality using geographical information systems. Int. J. Eng. Sci. Technol. 2010, 2, 6035–6046. [Google Scholar]
- Zhang, K.; Wang, Q.; Chao, L.; Ye, J.; Li, Z.; Yu, Z.; Tao, Y.; Ju, Q. Ground observation-based analysis of soil moisture spatiotemporal variability across a humid to semi-humid transitional zone in China. J. Hydrol. 2019, 574, 903–914. [Google Scholar] [CrossRef]
- Olusola, F.O. Groundwater quality evaluation for drinking, domestic and irrigation uses in parts of ode irele local government area of Ondo state, Nigeria. Water. Conserv. Manag. 2020, 4, 32–41. [Google Scholar] [CrossRef]
- Heshmati, S.S. Mapping of some ground water quality index in Shahrekord Plain for various used. Master’s Thesis, Shahrekord University, Shahrekord, Iran, 2011; p. 130. (In Persian). [Google Scholar]
- Jafari, K.; Asghari, F.B.; Hoseinzade, E.; Heidari, Z.; Radfard, M.; Faraji, H. Groundwater quality assessment for drinking and agriculture purposes in Abhar city, Iran. Data Brief 2019, 19, 1033–1039. [Google Scholar] [CrossRef]
- Mehrjerdi, R.; Zareian, M.; Mahmodi, S.; Heidari, A. Spatial distribution of groundwater quality with geostatistics (Case study: Yazd-Ardakan plain). World. Appl. Sci. J. 2008, 4, 9–17. [Google Scholar]
- Wang, P.; Wang, L.; Leung, H.; Zhang, G. Super-Resolution Mapping Based on Spatial-Spectral Correlation for Spectral Imagery. IEEE. Trans. Geosci. Remote Sens. 2021, 59, 2256–2268. [Google Scholar] [CrossRef]
- Yang, S.; Wan, X.; Wei, K.; Ma, W.; Wang, Z. Silicon recovery from diamond wire saw silicon powder waste with hydrochloric acid pretreatment: An investigation of Al dissolution behavior. Waste Manag. 2021, 120, 820–827. [Google Scholar] [CrossRef] [PubMed]
- Boyd, C.E. Water Quality, an Introduction; Springer International Publishing: Cham, Switzerland, 2000; 323p. [Google Scholar]
- Xiong, Z.; Tang, Z.; Chen, X.; Zhang, X.; Zhang, K.; Ye, C. Research on Image Retrieval Algorithm Based on Combination of Color and Shape Features. J. Signal Process. Syst. 2019, 93, 139–146. [Google Scholar] [CrossRef]
- WHO. Guidelines for Drinking-Water Quality, 4th ed.; Recommendations; World Health Organization (WHO): Geneva, Switzerland, 2011; Volume 1, p. 564. [Google Scholar]
- WHO. Guidelines for Drinking-Water Quality, 4th ed.; Incorporating the 1st Addendum; Health Organization (WHO): Geneva, Switzerland, 2017; Volume 24, 631p. [Google Scholar]
- Chiles, J.P.; Delfiner, P. Geostatistics. In Modeling Spatial Uncertainty; John Wiley and Sons: New York, NY, USA, 1999; 695p. [Google Scholar]
- Belkhiri, L.; Tiri, A.; Mouni, L. Spatial distribution of the groundwater quality using kriging and Co-kriging interpolations. Groundw. Sustain. Dev. 2020, 11, 100473. [Google Scholar] [CrossRef]
- Julínek, T.; Duchan, D.; Říha, J. Mapping of uplift hazard due to rising groundwater level during floods. J. Flood Risk Manag. 2020, 34, 162–174. [Google Scholar] [CrossRef]
- Venkatramanan, S.; Chung, S.Y.; Kim, T.H.; Prasanna, M.V.; Hamm, S.Y. 2014 Assessment and Distribution of Metals Contamination in Groundwater: A Case Study of Busan City, Korea. Water Qual. Expo Health 2015, 7, 219–225. [Google Scholar] [CrossRef]
- Venkatramanan, S.; Viswanathan, P.M.; Chung, S.Y. GIS and Geostatistical Techniques for Groundwater Science, 1st ed.; Elsevier: Amsterdam, The Netherlands, 2019; 389p. [Google Scholar]
- Petrula, L.; Říha, J.; Julínek, T. Evaluation of groundwater contamination in former military airport area. Gradevinar 2018, 70, 337–343. [Google Scholar]
- Mohebbi, M.R.; Reza Saeedi, R.; Montazeri, A.; Labbafi, S.; Oktaie, S.; Abtahi, M.; Mohagheghian, A. Assessment of water quality in groundwater resources of Iran using a modified drinking water quality index (DWQI). Ecol. Indic. 2013, 30, 28–34. [Google Scholar] [CrossRef]
- Soleimani, H.; Nasri, O.; Ojaghi, B.; Pasalarib, H.; Hosseini, M.; Hashemzadeh, B.; Kavosi, A.; Masoumi, S.; Radfard, M.; Adibzadeh, A.; et al. Data on drinking water quality using water quality index (WQI) and assessment of groundwater quality for irrigation purposes in Qorveh & Dehgolan, Kurdistan, Iran. Data Brief 2018, 20, 375–386. [Google Scholar]
- Bidhuri, S.; Khan, M.M.A. Assessment of ground water quality of central and southeast districts of NCT of Delhi. J. Geol. Soc. India 2020, 95, 95–103. [Google Scholar] [CrossRef]
- USDA. Keys to Soil Taxonomy, 11th ed.; USDA National Resources Conservation Service: Washington, DC, USA, 2010. [Google Scholar]
- Sangab-Zgros, C. Report of the Fars Regional Water Authority; Detailed Project on the Study of Groundwater of Marvdasht-Kharame Plain; Shiraz Water Organization: Shiraz, Iran, 2009; 225p. [Google Scholar]
- APHA. Standard Methods for Examination of Water and Wastewater, 20th ed.; American Public Health Association Inc.: Washington, DC, USA, 1998. [Google Scholar]
- Boyd, C.E. Water Quality, an Introduction, 3rd ed.; Springer International Publishing: Cham, Switzerland, 2016; 323p. [Google Scholar]
- Ramakrishnaiah, C.R.; Sadadhiv, C.; Rangnna, G. Assessment of water quality index for the groundwater in Tumkur Taluk, Karnataka State, India. J. Chem. 2009, 6, 523–530. [Google Scholar] [CrossRef] [Green Version]
- Lodwick, W.A.; Monson, W.; Svoboda, L. Attribute error and sensitivity analysis ofmap operations in geographical information systems: Suitability analysis. Int. J. Geogr. Inform. Syst. 1990, 4, 413–428. [Google Scholar]
- Machiwal, D.; Madan, K.J.; Bimal, C.M. GIS-based assessment and characterization of groundwater quality in a hard-rock hilly terrain of Western India. Environ. Monit. Assess. 2011, 174, 645–663. [Google Scholar] [CrossRef]
- ESRI Inc. ArcGisTM. Version 10.0. 2010. Available online: www.esri.com (accessed on 3 October 2021).
- Matheron, G. Principles of geostatistics. Econ. Geol. 1963, 58, 1246–1266. [Google Scholar] [CrossRef]
- Webster, R.; Oliver, M.A. Geostatistics for Environmental Scientist; John Wiley and Sons: Hoboken, NJ, USA, 2001. [Google Scholar]
- Zekai, S. Spatial Modeling Principles in Earth Sciences; Springer: Berlin/Heidelberg, Germany, 2009; 358p. [Google Scholar]
- Mirzaee, S.; Ghorbani-Dashtaki, S.; Mohammadi, J.; Asadi, H.; Asadzadeh, F. Spatial variability of soil organic matter using remote sensing data. Catena 2016, 145, 118–127. [Google Scholar] [CrossRef]
- Tashayo, B.; Honarbakhsh, A.; Akbari, M.; Ostovari, Y. Digital mapping of Philip model parameters for prediction of water infiltration at the watershed scale in a semi-arid region of Iran. Geoderma Reg. 2020, 22, e00301. [Google Scholar] [CrossRef]
- Ostovari, Y.; Ghorbani, S.; Bahrami, H. Soil loss prediction by an integrated system using RUSLE. GIS and remote sensing in semi-arid region. Geoderma Reg. 2017, 11, 28–36. [Google Scholar] [CrossRef]
- Ostovari, Y.; Ghorbani, S.; Bahrami, H. Modification of the USLE K factor for soil erodibility assessment on calcareous soils in Iran. Geomorphology 2016, 273, 385–395. [Google Scholar] [CrossRef]
- Ostovari, Y.; Moosavi, A.A.; Pourghasemi, H.R. Soil loss tolerance in calcareous soils of a semiarid region: Evaluation, prediction, and influential parameters. Land Degrad. Dev. 2020, 31, 2156–2167. [Google Scholar] [CrossRef]
- Kalantari, N.; Rahimi, M.H.; Akbari, A. Hydrochemical study of the intermediate water plain using statistical models, hydro-chemical charts and fuzzy logic. Geol. Q. Iran. 2009, 9, 15–25. (In Persian) [Google Scholar]
- Ishaku, J.M. Assessment of groundwater quality index for Jimeta-Yola area, Northeastern Nigeria. J. Geol. Min. Res. 2011, 3, 219–231. [Google Scholar]
- Rafferty, R. Scaling in Geothermal Heat Pump Systems; Geo-Heat Center Oregon Institute of Technology, Campus Drive: Klamath Falls, OR, USA, 2000; pp. 11–15. [Google Scholar]
- Sanches, F. Mapping groundwater quality variables using PCA and geostatistics: A case study of Bajo Andarax, southeastern Spain. Hydrol. Sci.-J. 2001, 46, 227–242. [Google Scholar]
- Lin, X.; Li, Z.; Liang, B.; Zhai, H.; Cai, W.; Nan, J.; Tao, Y.; Wang, A. Accelerated microbial reductive dechlorination of 2,4,6-trichlorophenol by weak electrical stimulation. Water Res. 2019, 162, 236–245. [Google Scholar] [CrossRef] [PubMed]
- Yang, Y.; Tao, L.; Yang, H.; Iglauer, S.; Wang, X.; Askari, R.; Sun, H. Stress sensitivity of fractured and vuggy Carbonate: An X-Ray computed tomography analysis. J. Geophys. Res. Solid Earth 2020, 125, e2019JB018759. [Google Scholar] [CrossRef]
- Chao, L.; Zhang, K.; Wang, J.; Feng, J.; Zhang, M. A Comprehensive evaluation of five evapotranspiration datasets based on ground and GRACE satellite observations: Implications for improvement of evapotranspirationr Algorithm. Remote Sens. 2021, 13, 2414. [Google Scholar] [CrossRef]
Publisher’s Note: MDPI stays neutral with regard to jurisdictional claims in published maps and institutional affiliations. |
© 2021 by the authors. Licensee MDPI, Basel, Switzerland. This article is an open access article distributed under the terms and conditions of the Creative Commons Attribution (CC BY) license (https://creativecommons.org/licenses/by/4.0/).

