
Hyper-Nutrient Enrichment Status in the Sabalan Lake, Iran

 ,
,  , , and
Abstract
:1. Introduction
2. Materials and Methods
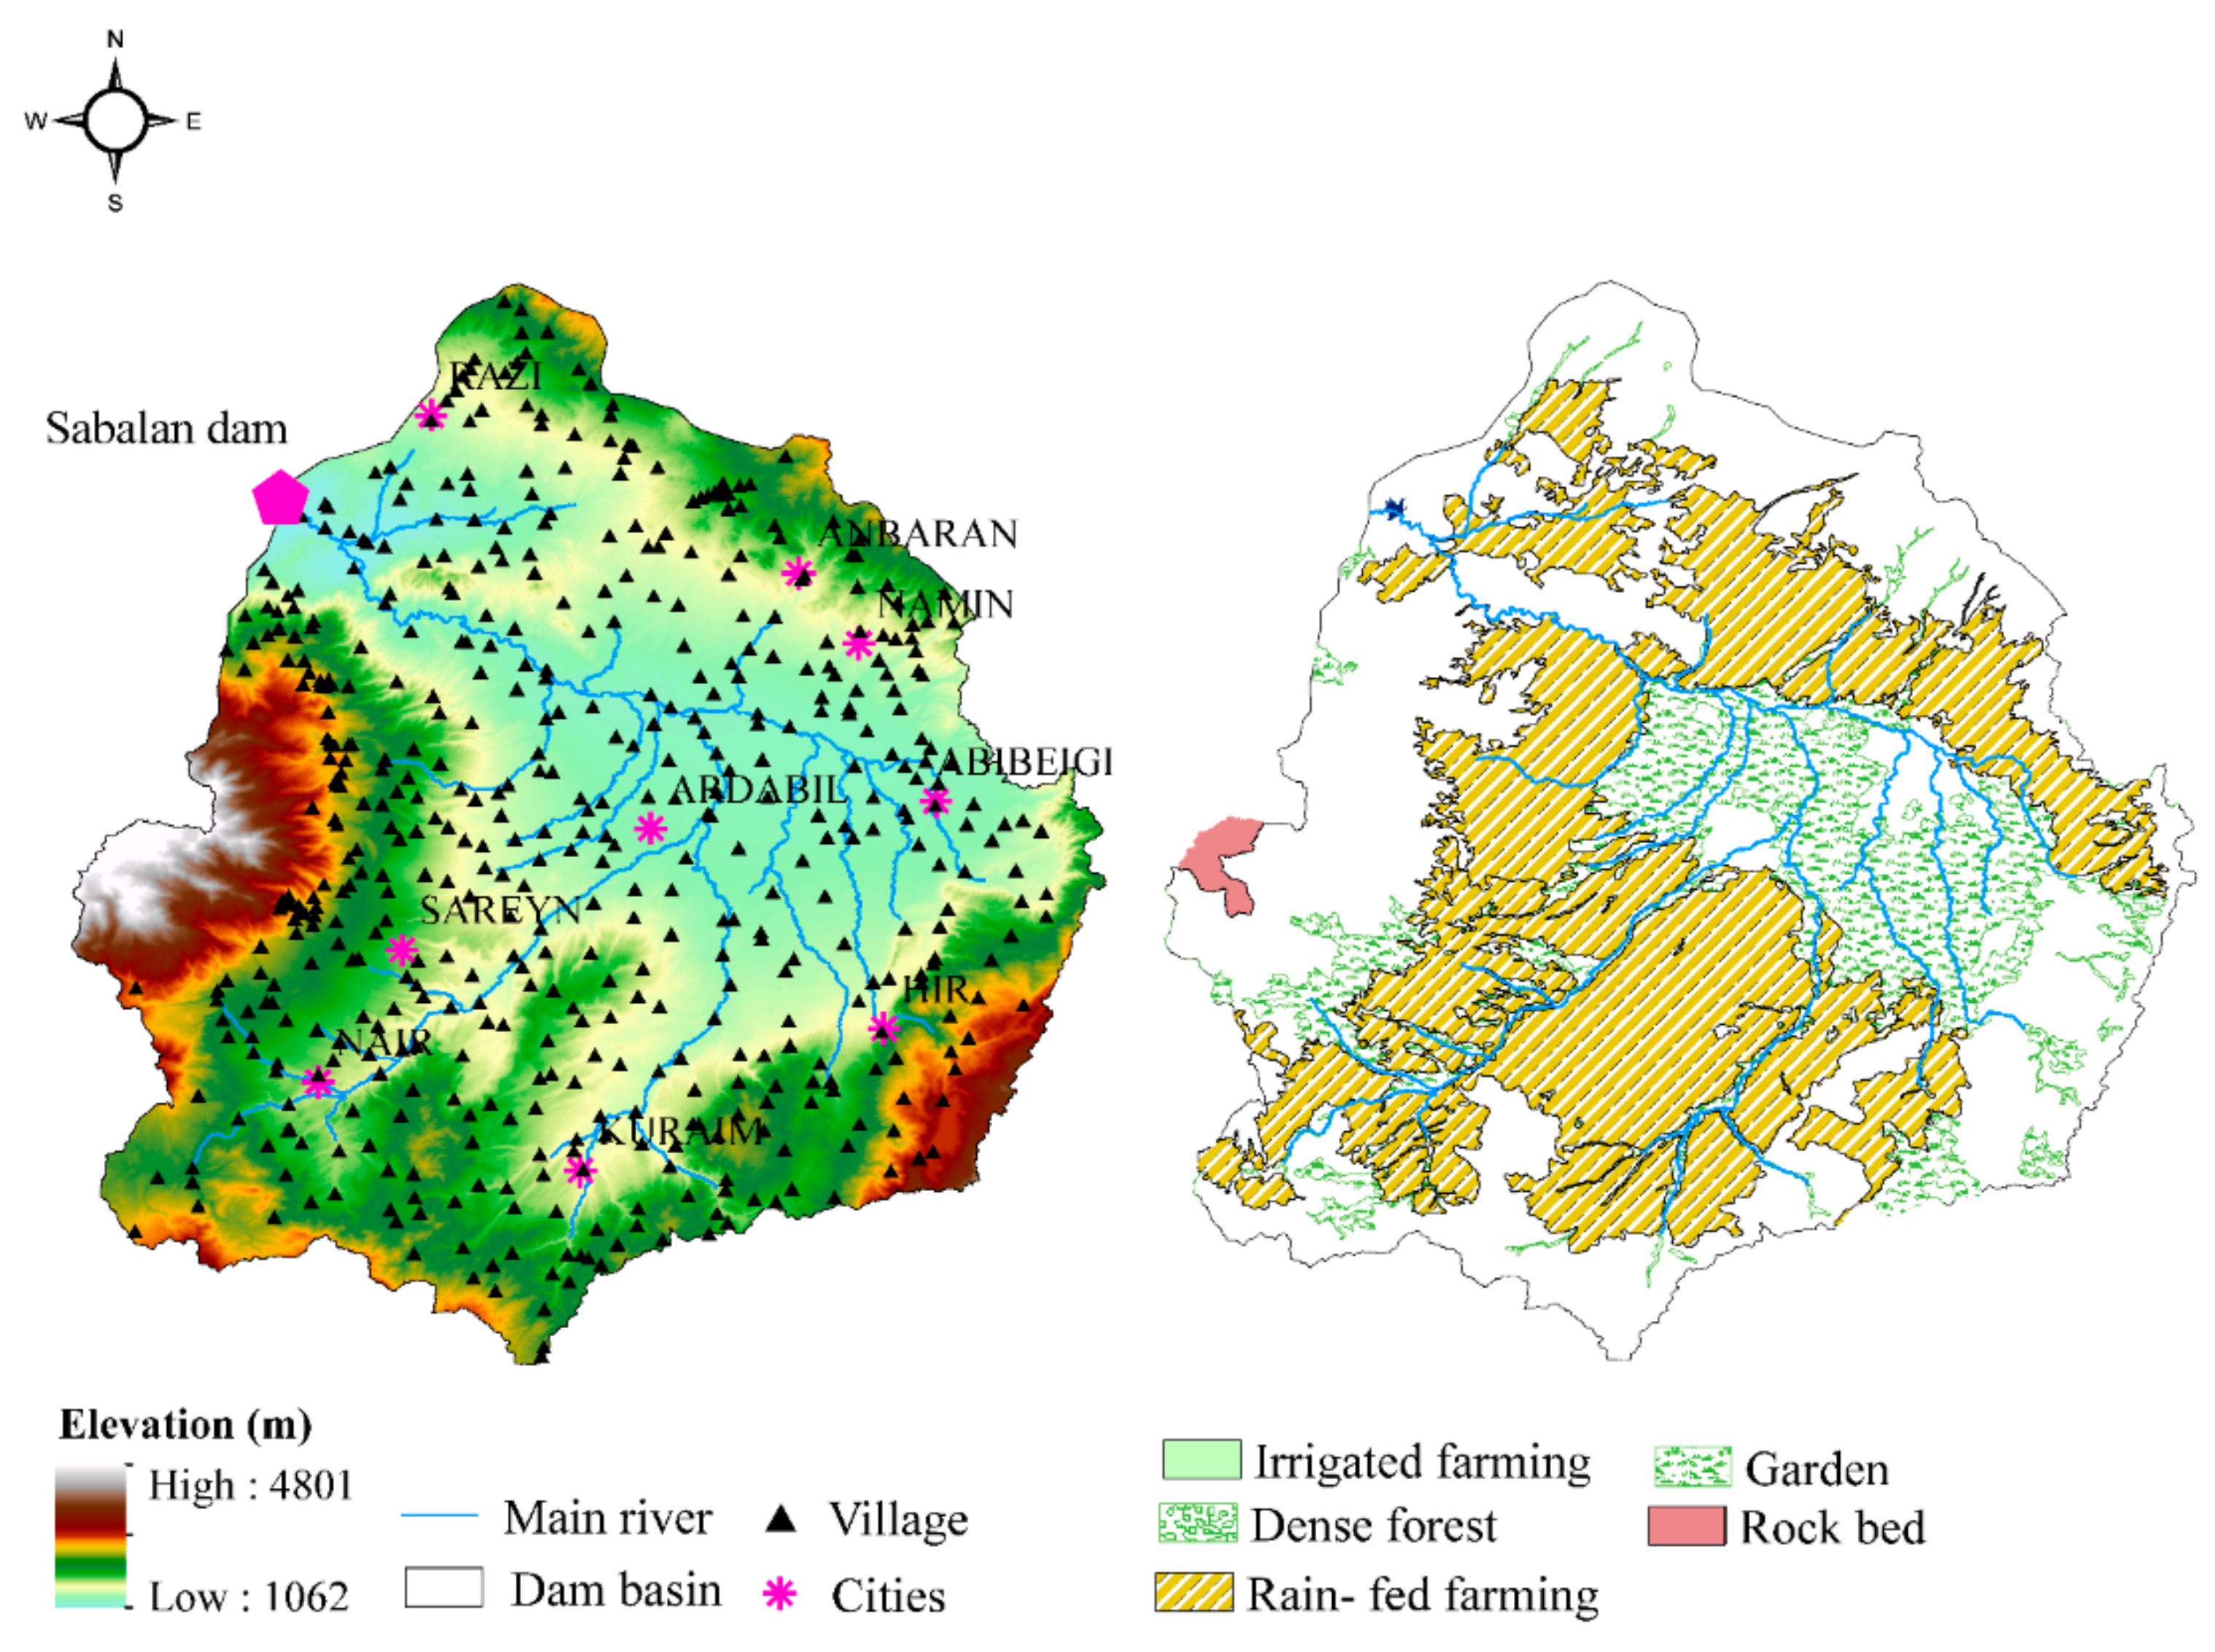
2.1. Study Site
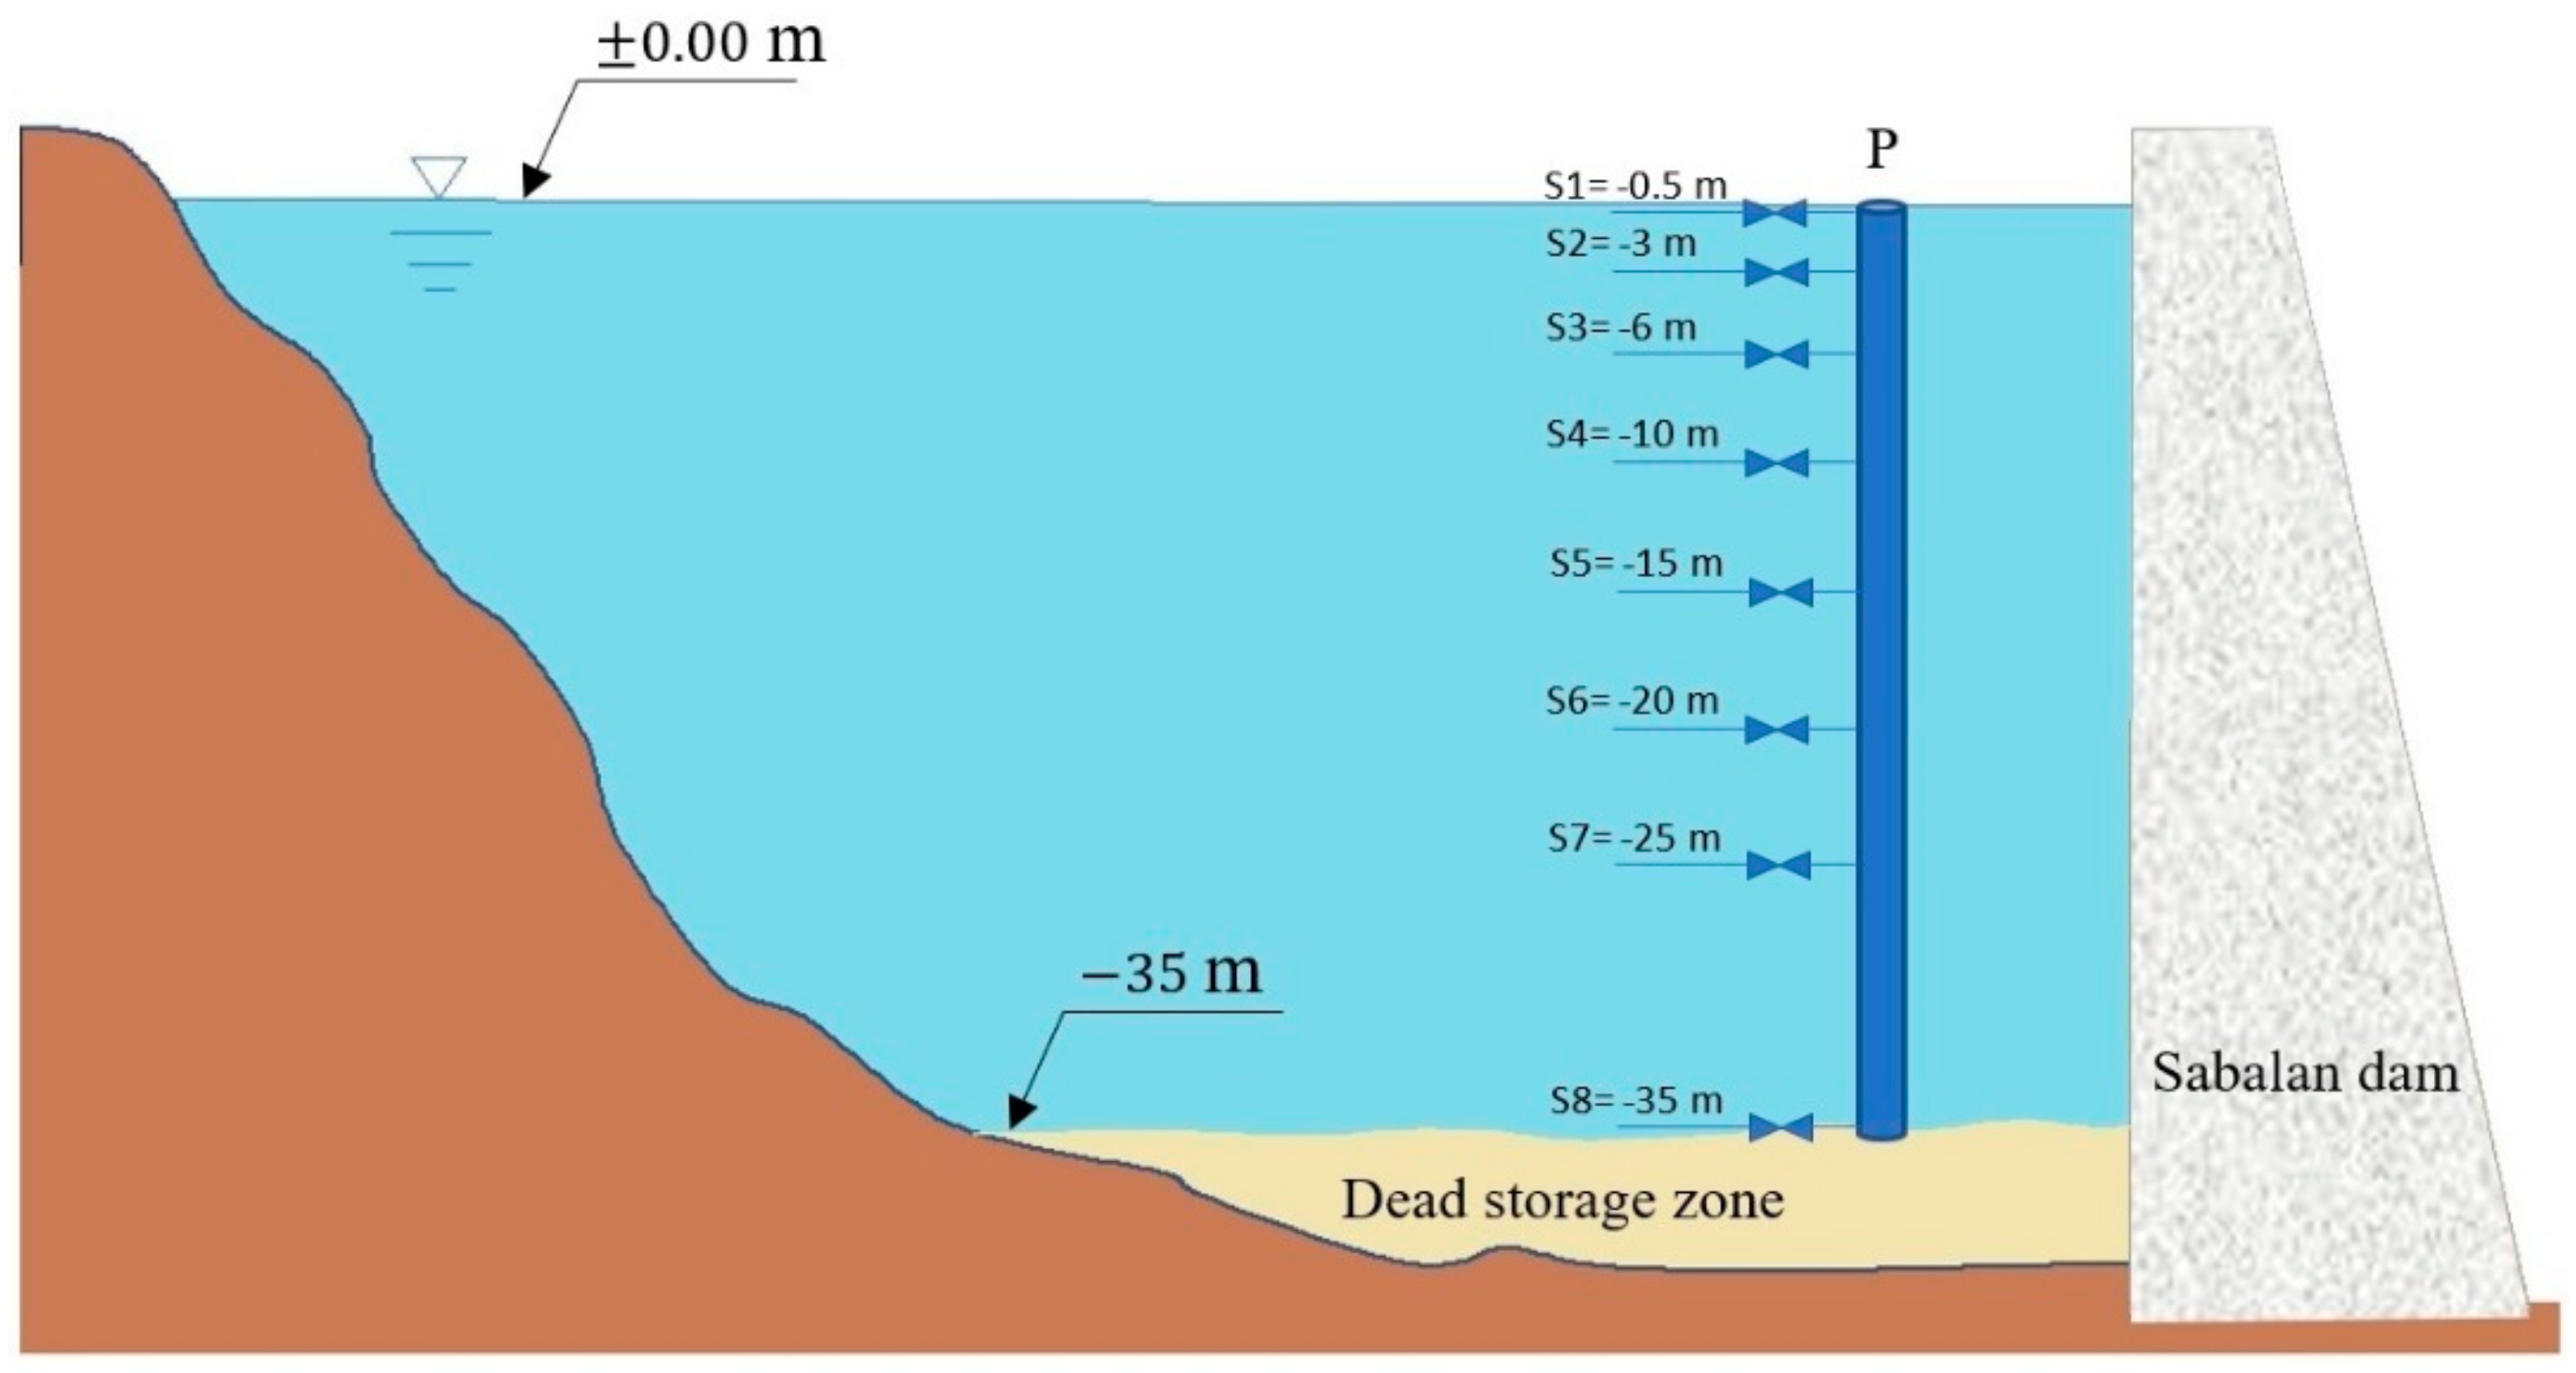
2.2. Sampling
2.3. Nutrients and Trophic State Indices
2.4. Statistical Analysis of the Data
3. Results and Discussion
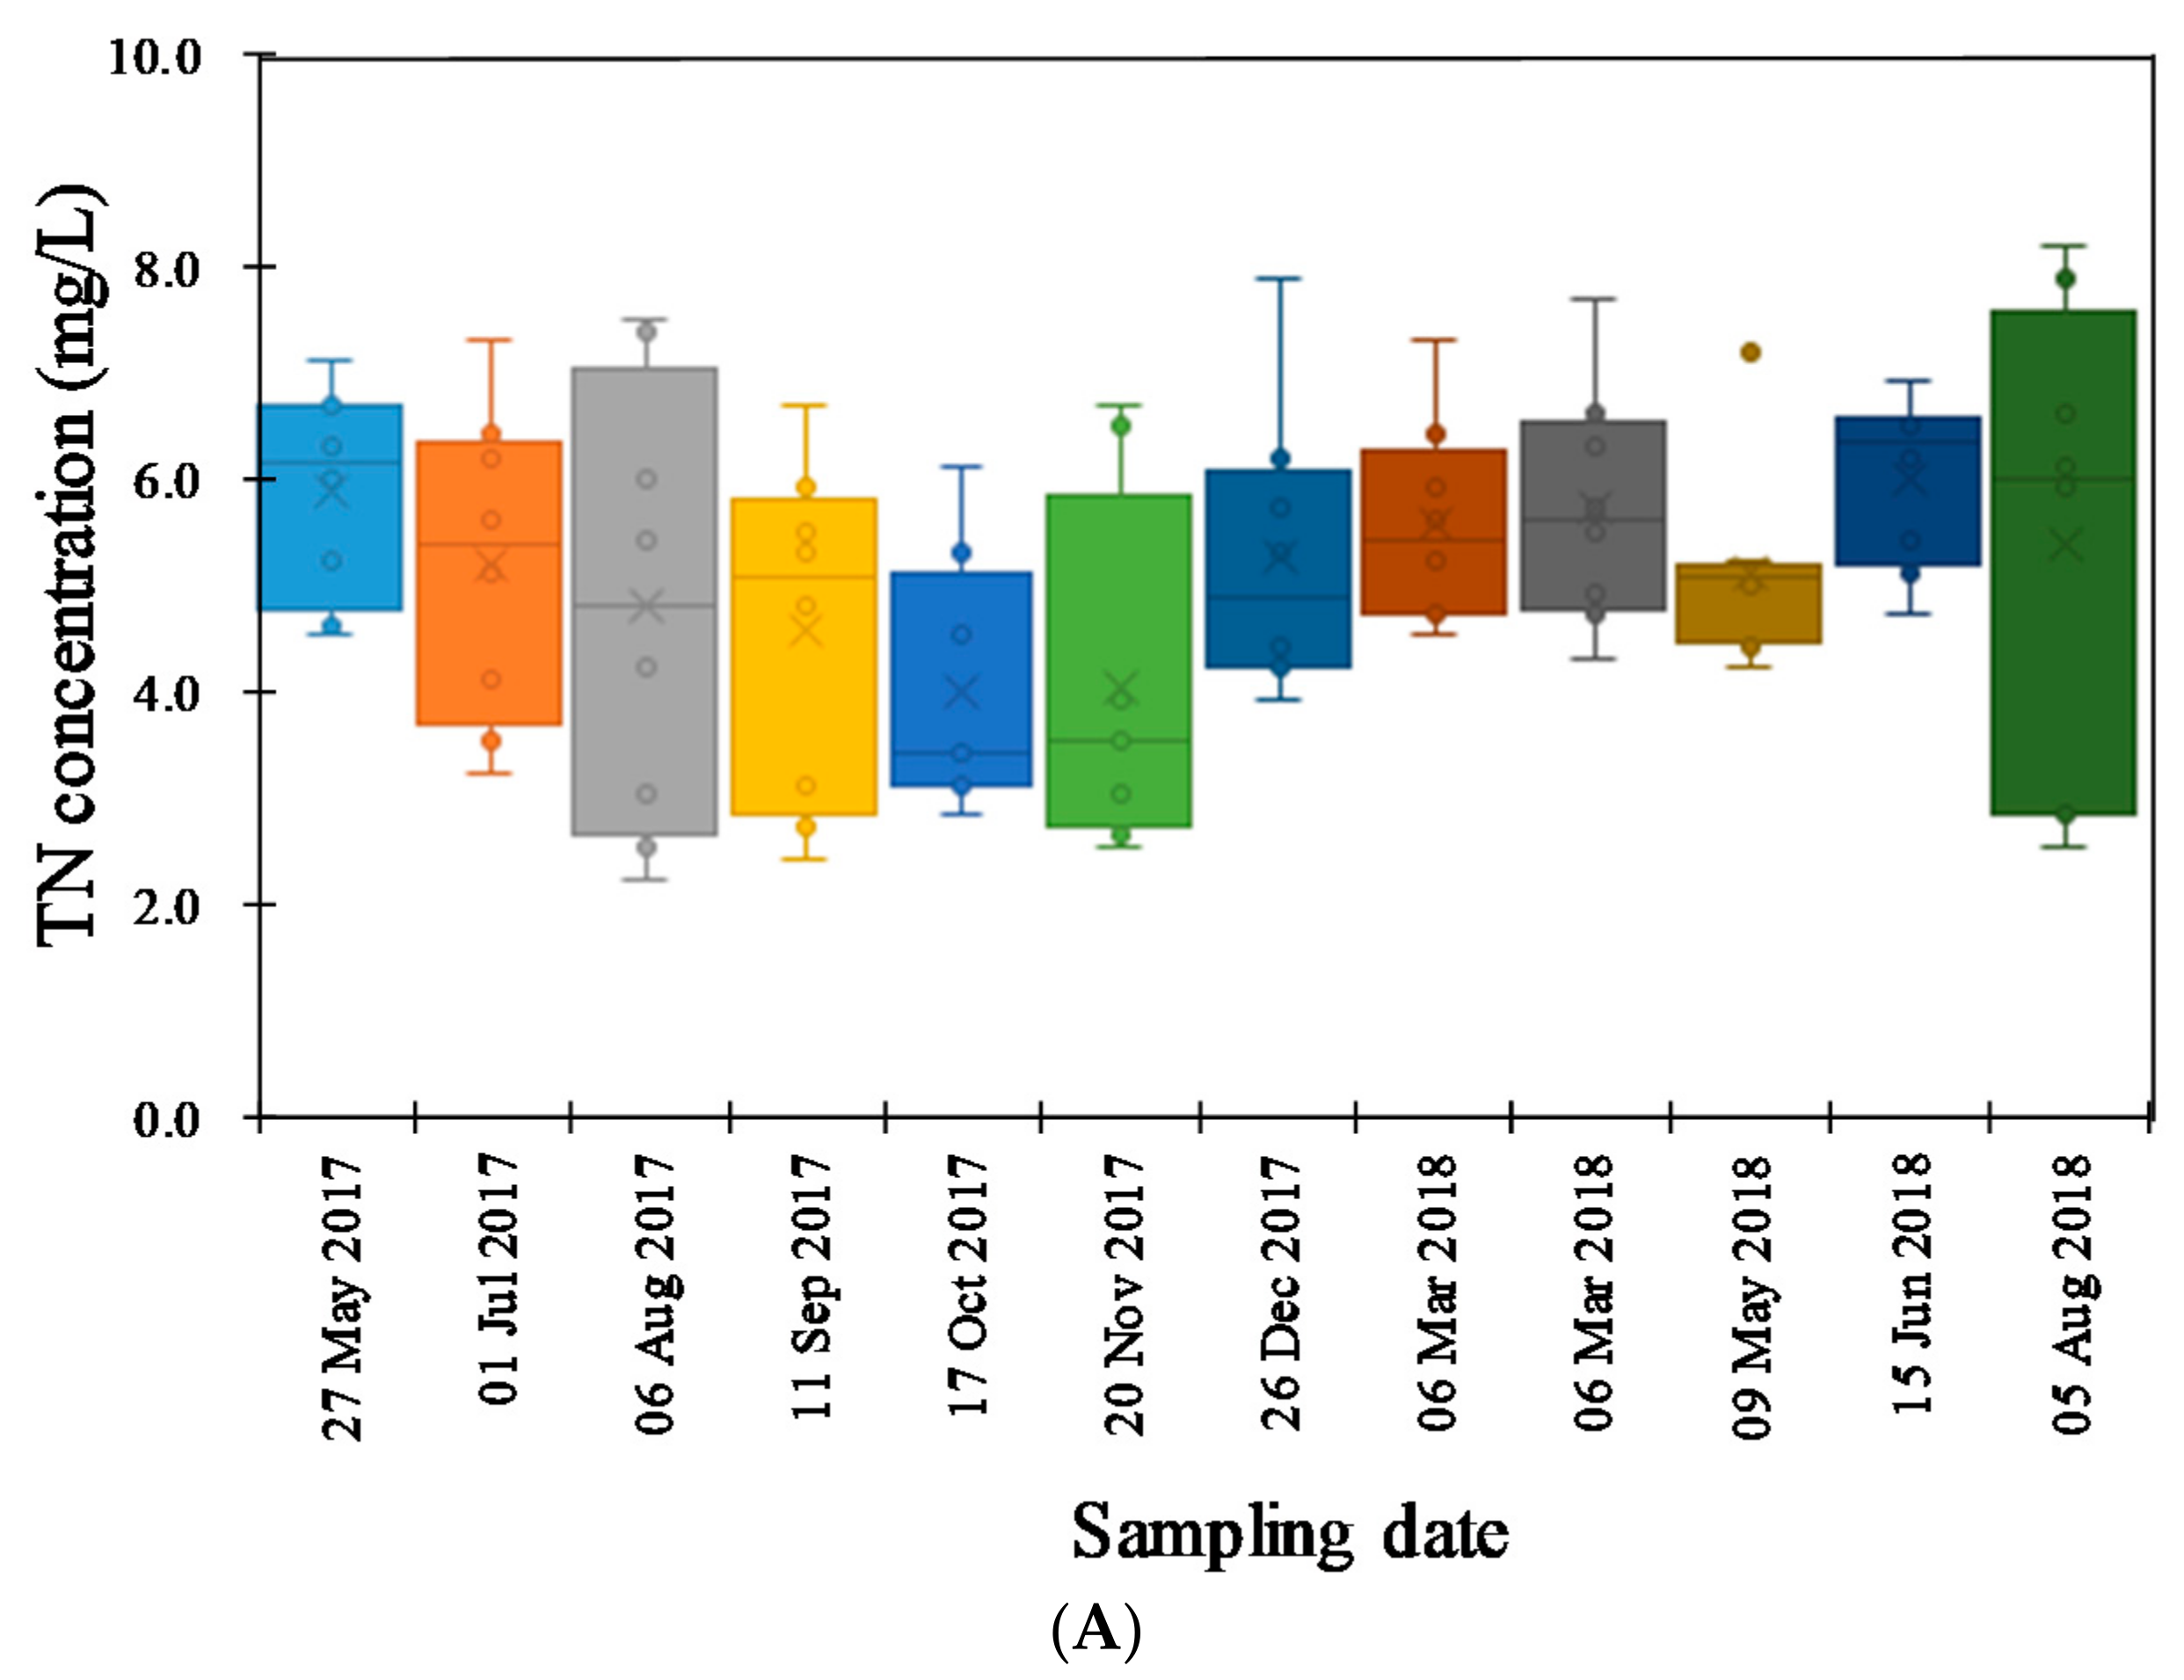
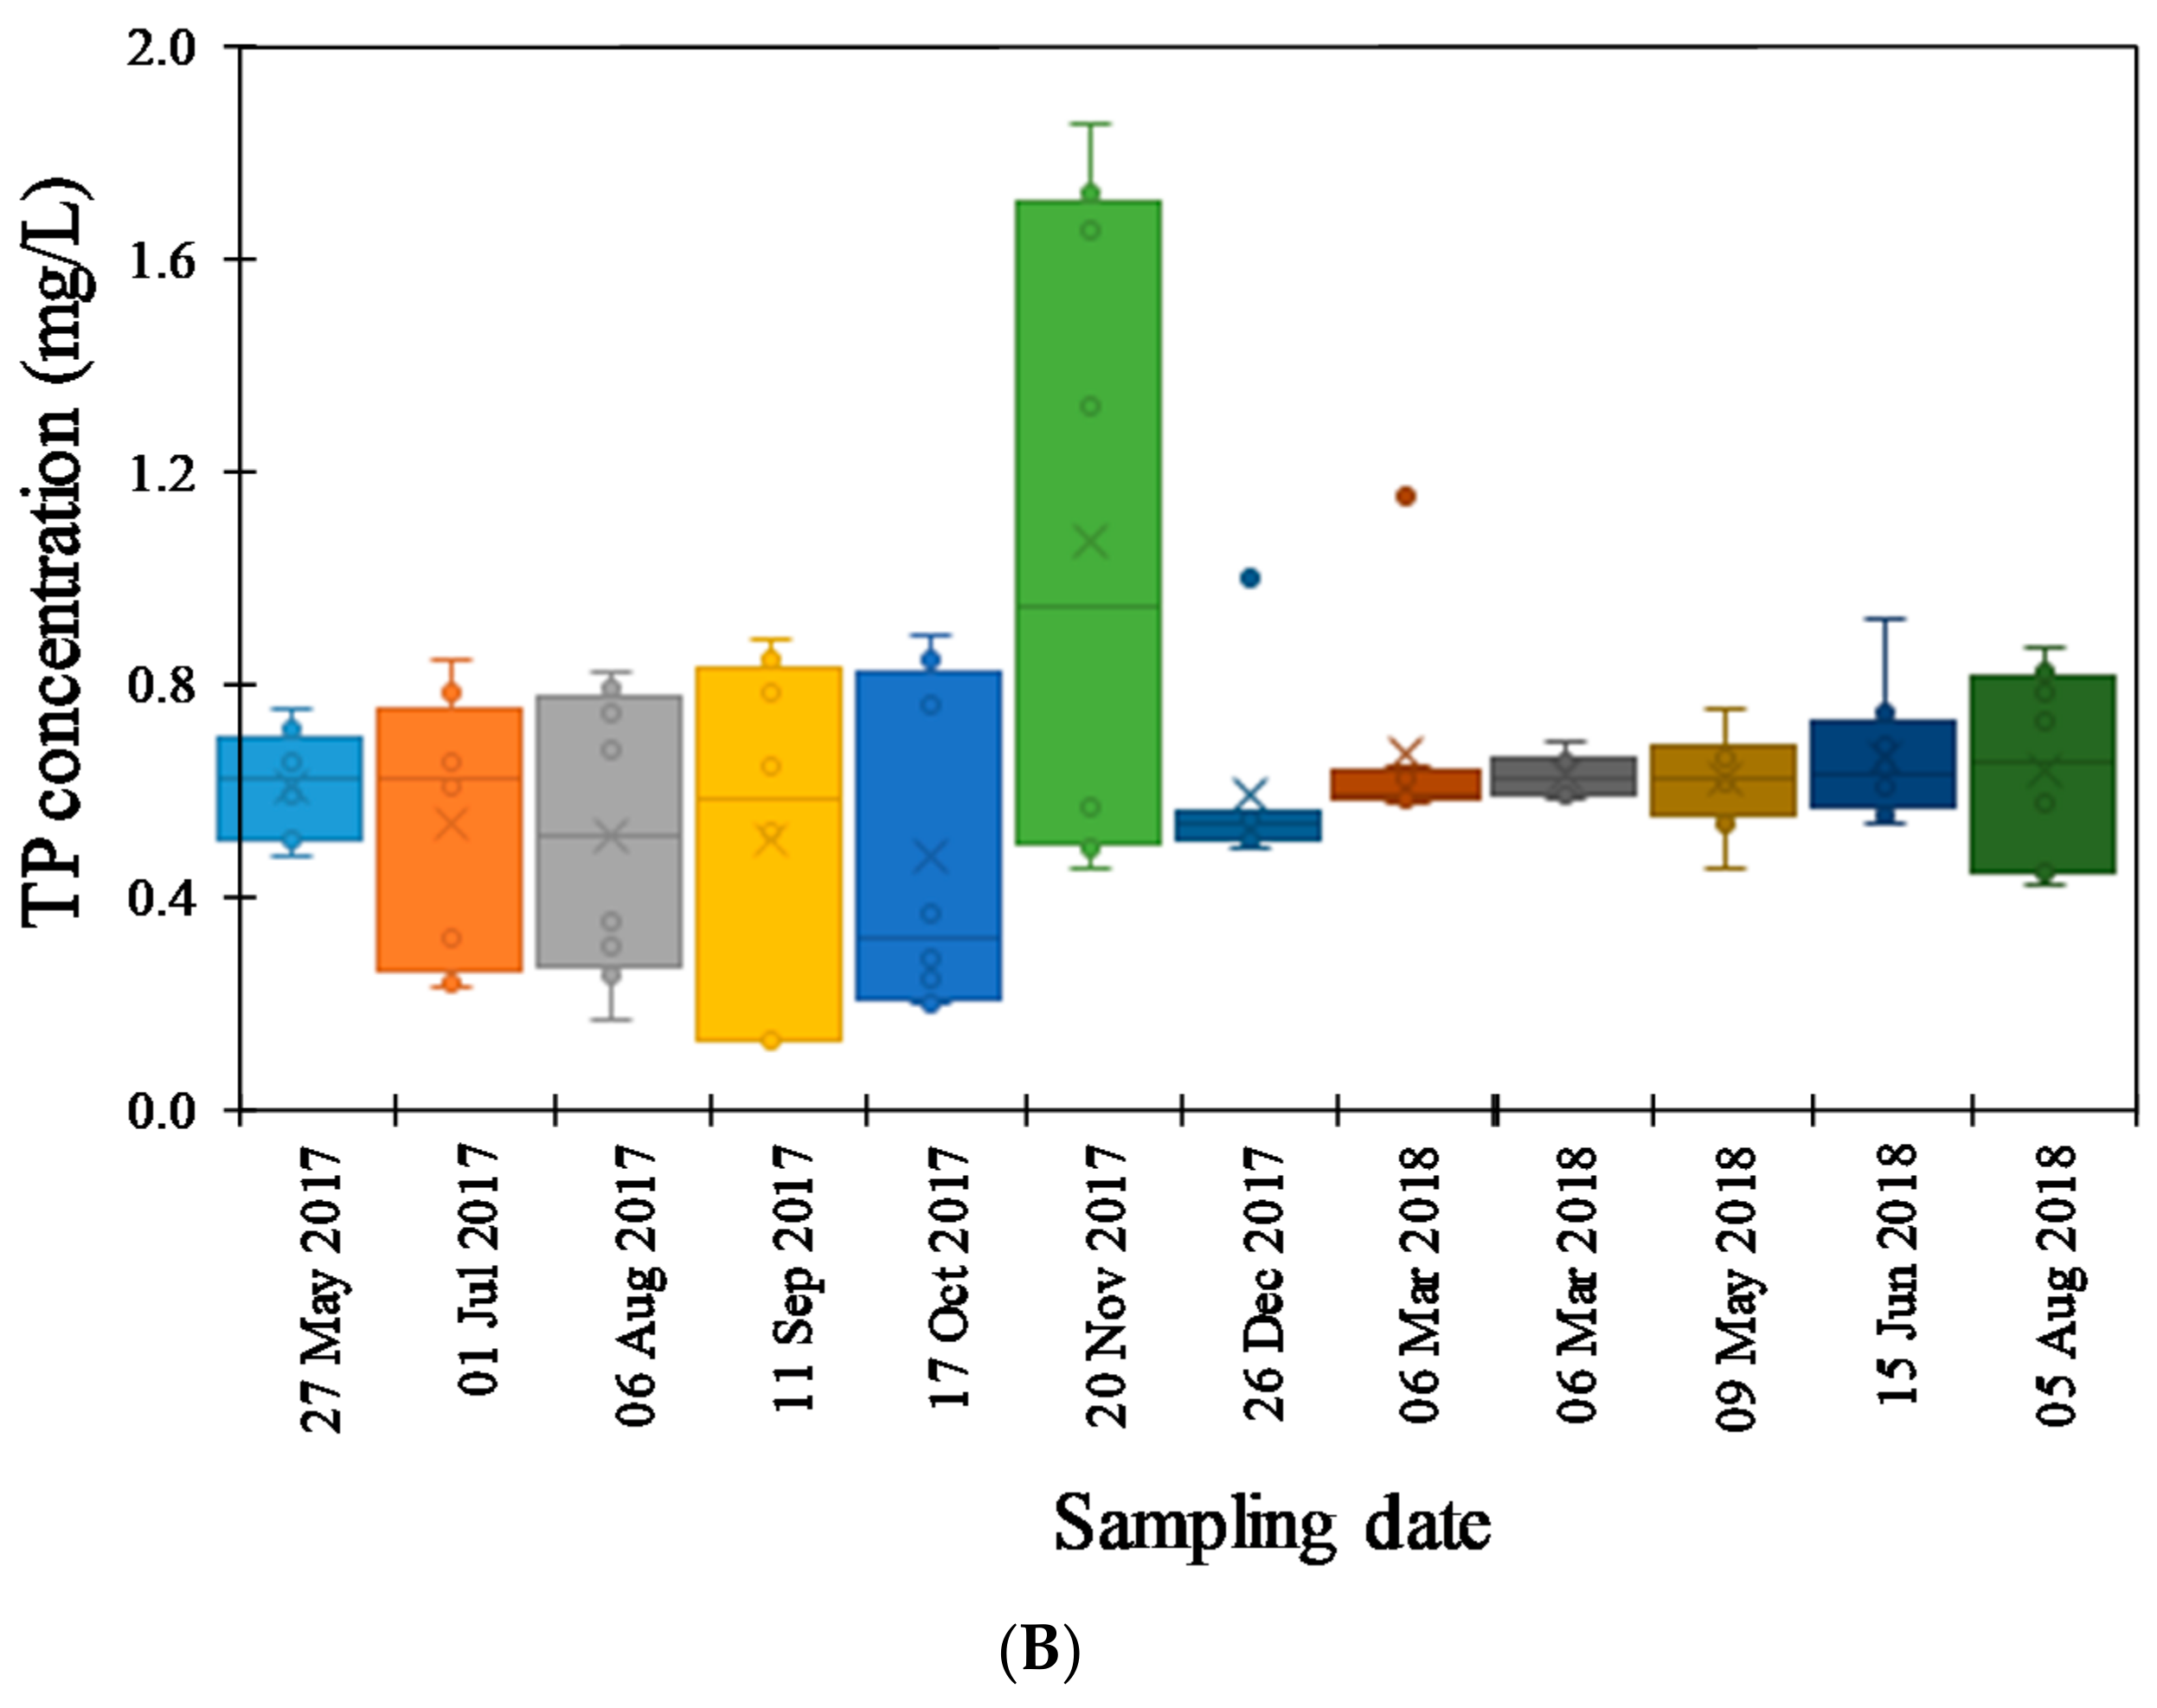
3.1. Hyper-Nutrient Enrichment
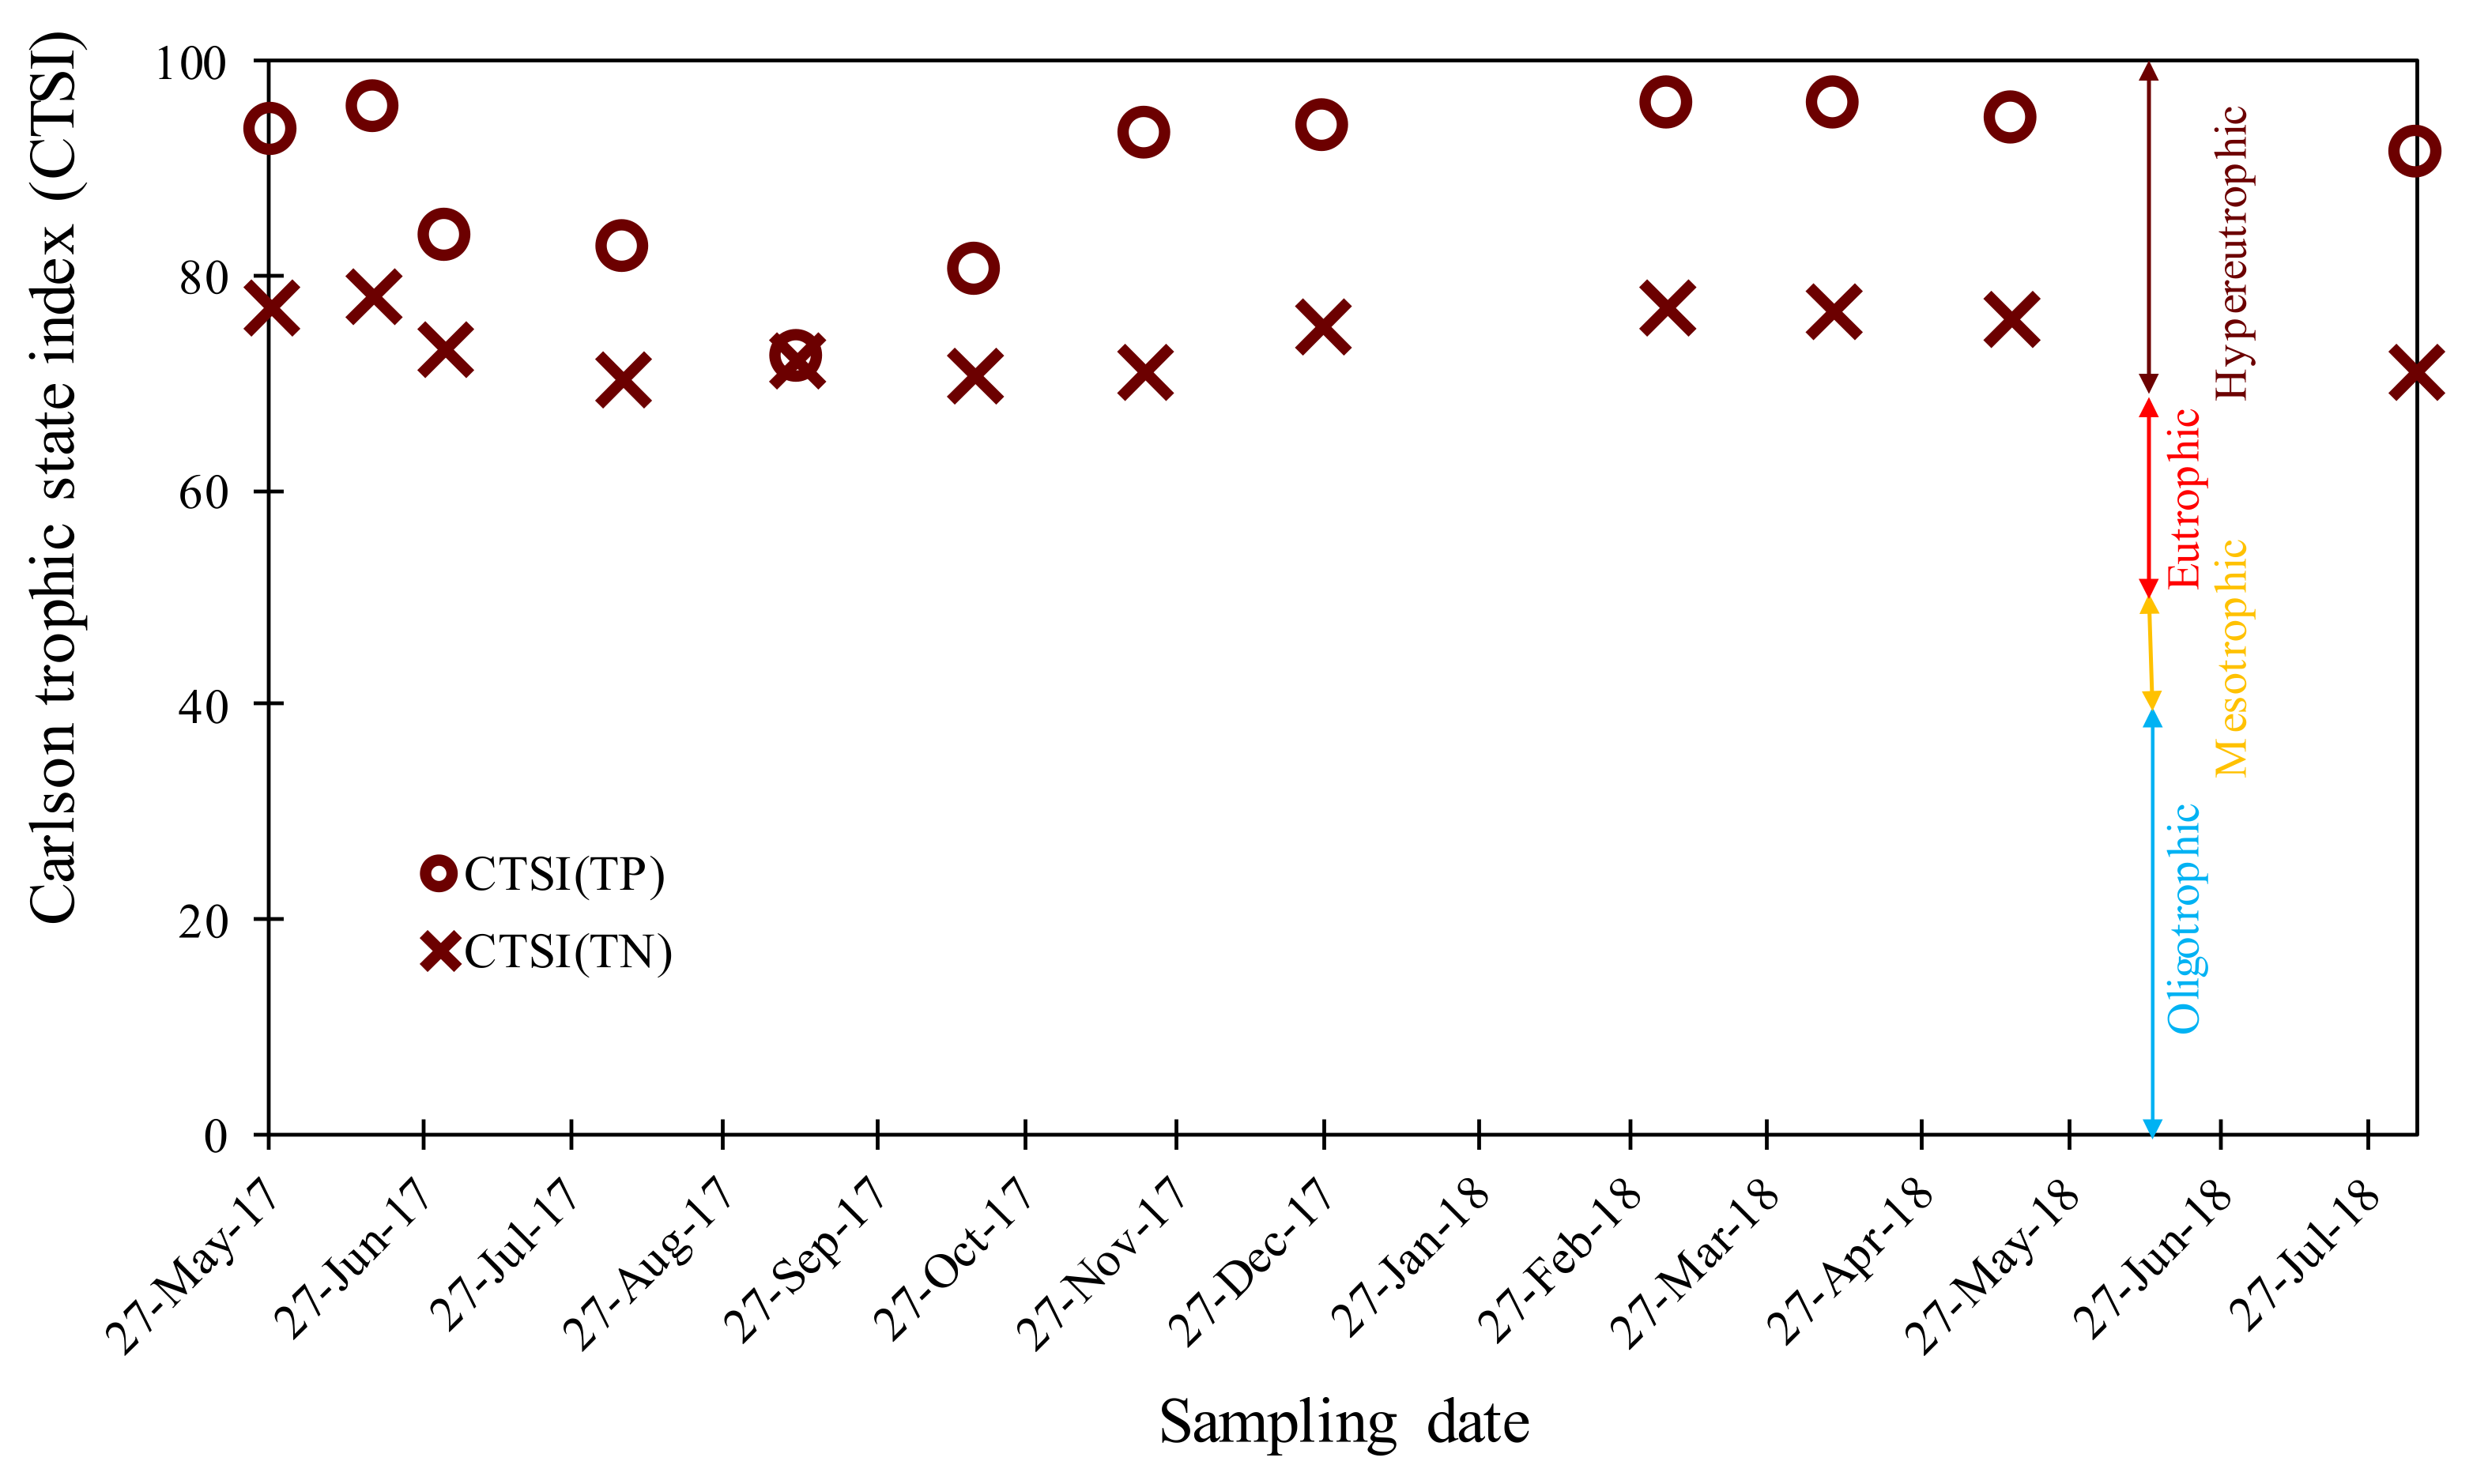
3.2. Trophic State of the Sabalan Reservoir
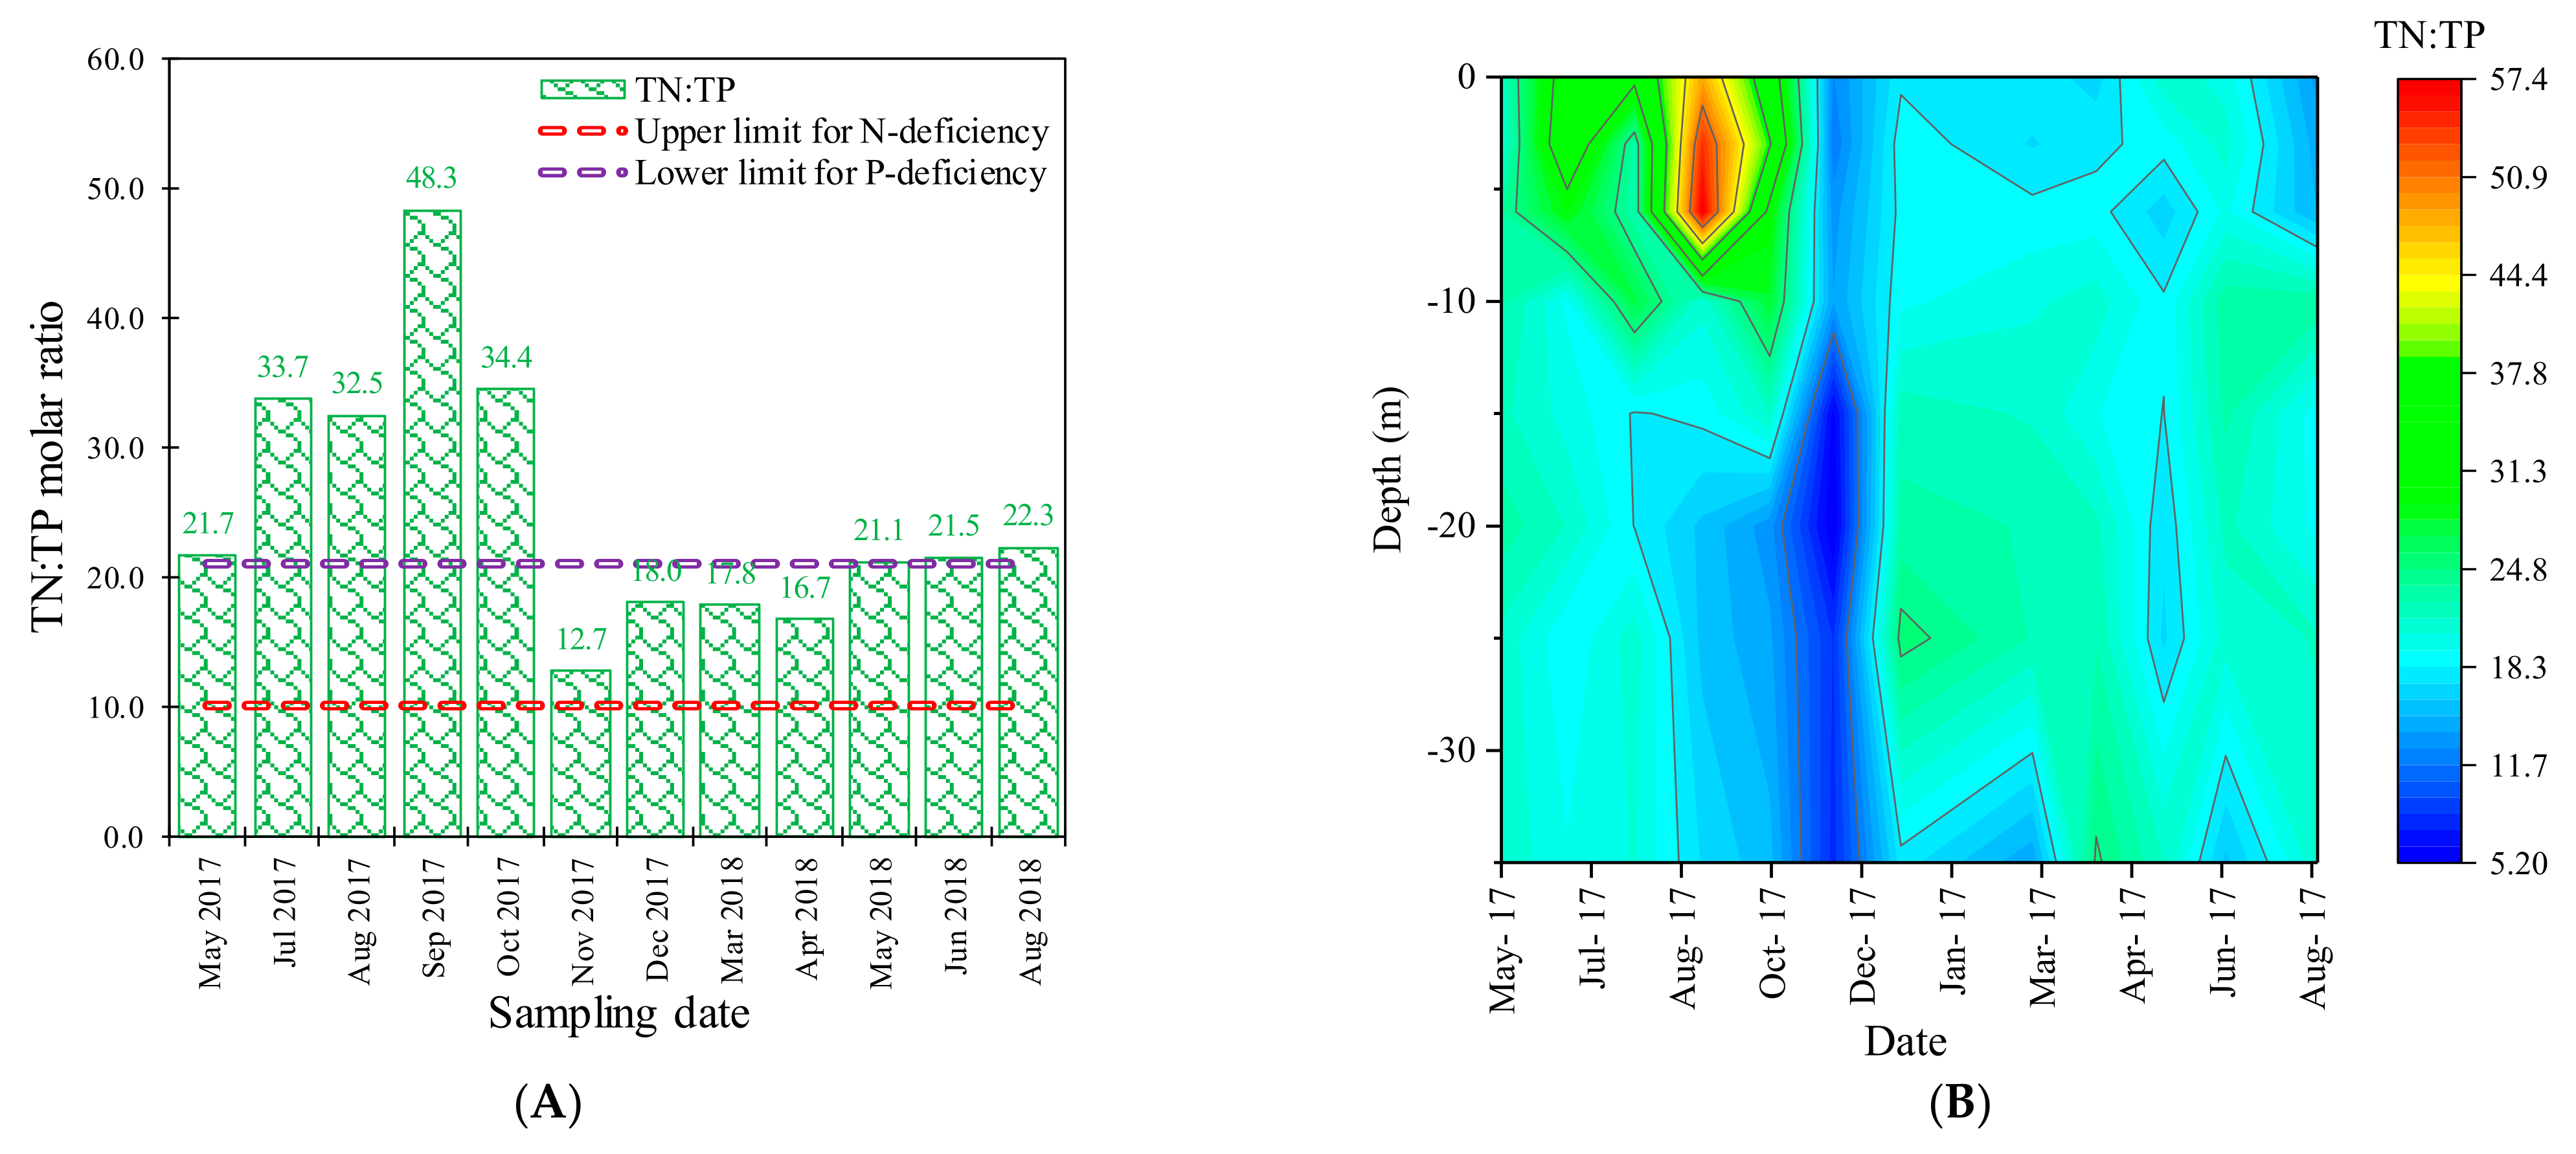
3.3. Limiting Factor
4. Conclusions
Author Contributions
Funding
Institutional Review Board Statement
Informed Consent Statement
Data Availability Statement
Acknowledgments
Conflicts of Interest
References
- Atique, U.; An, K.-G. Landscape heterogeneity impacts water chemistry, nutrient regime, organic matter and chlorophyll dynamics in agricultural reservoirs. Ecol. Indic. 2019, 110, 105813. [Google Scholar] [CrossRef]
- Withers, P.J.A.; Neal, C.; Jarvie, H.P.; Doody, D.G. Agriculture and Eutrophication: Where Do We Go from Here? Sustainability 2014, 6, 5853–5875. [Google Scholar] [CrossRef] [Green Version]
- Islam, S.T.; Dar, S.A.; Sofi, M.S.; Bhat, S.U.; Sabha, I.; Hamid, A.; Jehangir, A.; Bhat, A.A. Limnochemistry and Plankton Diversity in Some High Altitude Lakes of Kashmir Himalaya. Front. Environ. Sci. 2021, 9, 681965. [Google Scholar] [CrossRef]
- Maghrebi, M.; Noori, R.; Bhattarai, R.; Yaseen, Z.M.; Tang, Q.; Al-Ansari, N.; Mehr, A.D.; Karbassi, A.; Omidvar, J.; Farnoush, H.; et al. Iran’s Agriculture in the Anthropocene. Earth’s Future 2020, 8, e2020EF001547. [Google Scholar] [CrossRef]
- IWRM (Iran Water Resources Management Company). Iran’s Dam Characteristics. 2020. (In Persian). Available online: http://daminfo.wrm.ir/fa/dam/stats (accessed on 14 August 2021).
- Wetzel, R.G. Land-water interfaces: Metabolic and limnological regulators. SIL Proc. 1990, 24, 6–24. [Google Scholar] [CrossRef]
- Soares, M.C.S.; Marinho, M.; Huszar, V.L.M.; Branco, C.W.C.; Azevedo, S.M.F.O. The effects of water retention time and watershed features on the limnology of two tropical reservoirs in Brazil. Lakes Reserv. Res. Manag. 2008, 13, 257–269. [Google Scholar] [CrossRef]
- Atique, U.; An, K.-G. Reservoir Water Quality Assessment Based on Chemical Parameters and the Chlorophyll Dynamics in Relation to Nutrient Regime. Pol. J. Environ. Stud. 2019, 28, 1043–1061. [Google Scholar] [CrossRef]
- Noori, R.; Tian, F.; Ni, G.; Bhattarai, R.; Hooshyaripor, F.; Klöve, B. ThSSim: A novel tool for simulation of reservoir thermal stratification. Sci. Rep. 2019, 9, 18524. [Google Scholar] [CrossRef] [PubMed] [Green Version]
- Thornton, K.W.; Kimmel, B.L.; Payne, F.E. Reservoir Limnology: Ecological Perspectives, 1st ed.; John Wiley & Sons: New York, NY, USA, 1990. [Google Scholar]
- Noori, R.; Ansari, E.; Bhattarai, R.; Tang, Q.; Aradpour, S.; Maghrebi, M.; Haghighi, A.T.; Bengtsson, L.; Kløve, B. Complex dynamics of water quality mixing in a warm mono-mictic reservoir. Sci. Total Environ. 2021, 777, 146097. [Google Scholar] [CrossRef] [PubMed]
- Noori, R.; Yeh, H.-D.; Ashrafi, K.; Rezazadeh, N.; Bateni, S.M.; Karbassi, A.; Kachoosangi, F.T.; Moazami, S. A reduced-order based CE-QUAL-W2 model for simulation of nitrate concentration in dam reservoirs. J. Hydrol. 2015, 530, 645–656. [Google Scholar] [CrossRef]
- Hughes, R.M.; Dunham, S.; Maas-Hebner, K.G.; Yeakley, J.; Schreck, C.; Harte, M.; Molina, N.; Shock, C.C.; Kaczynski, V.W.; Schaeffer, J. A review of urban water body challenges and approaches: (1) Rehabilitation and remediation. Fisheries 2014, 39, 18–29. [Google Scholar] [CrossRef] [Green Version]
- Conley, D.J.; Paerl, H.W.; Howarth, R.; Boesch, D.F.; Seitzinger, S.P.; Havens, K.E.; Lancelot, C.; Likens, G.E. Ecology: Controlling eutrophication: Nitrogen and Phosphorus. Science 2009, 323, 1014–1015. [Google Scholar] [CrossRef] [PubMed]
- Luo, Y.; El-Madany, T.; Ma, X.; Nair, R.; Jung, M.; Weber, U.; Filippa, G.; Bucher, S.F.; Moreno, G.; Cremonese, E.; et al. Nutrients and water availability constrain the seasonality of vegetation activity in a Mediterranean ecosystem. Glob. Chang. Biol. 2020, 26, 4379–4400. [Google Scholar] [CrossRef] [PubMed]
- Modabberi, A.; Noori, R.; Madani, K.; Ehsani, A.H.; Mehr, A.D.; Hooshyaripor, F.; Kløve, B. Caspian Sea is eutrophying: The alarming message of satellite data. Environ. Res. Lett. 2020, 15, 124047. [Google Scholar] [CrossRef]
- Yaseen, T.; Bhat, S.U. Assessing the nutrient dynamics in a Himalayan warm Monomictic lake. Water Air Soil Pollut. 2021, 232, 1–21. [Google Scholar] [CrossRef]
- Schindler, D.W. Evolution of Phosphorus limitation in lakes. Science 1977, 195, 260–262. [Google Scholar] [CrossRef] [Green Version]
- Carlson, R.E. A trophic state index for lakes1. Limnol. Oceanogr. 1977, 22, 361–369. [Google Scholar] [CrossRef] [Green Version]
- Klippel, G.; Macêdo, R.L.; Branco, C.W.C. Comparison of different trophic state indices applied to tropical reservoirs. Lakes Reserv. Res. Manag. 2020, 25, 214–229. [Google Scholar] [CrossRef]
- Bomfim, E.D.O.; Kraus, C.N.; Lobo, M.T.M.P.S.; Nogueira, I.D.S.; Peres, L.G.M.; Boaventura, G.R.; Laques, A.-E.; Garnier, J.; Seyler, P.; Marques, D.M.; et al. Trophic state index validation based on the phytoplankton functional group approach in Amazon floodplain lakes. Inland Waters 2019, 9, 309–319. [Google Scholar] [CrossRef]
- Kim, J.; Atique, U.; Mamun, M.; An, K.-G. Long-Term Interannual and Seasonal Links between the Nutrient Regime, Sestonic Chlorophyll and Dominant Bluegreen Algae under the Varying Intensity of Monsoon Precipitation in a Drinking Water Reservoir. Int. J. Environ. Res. Public Health 2021, 18, 2871. [Google Scholar] [CrossRef]
- Montagud, D.; Soria, J.M.; Soria-Perpiñà, X.; Alfonso, T.; Vicente, E. A comparative study of four indexes based on zooplankton as trophic state indicators in reservoirs. Limnetica 2019, 38, 291–302. [Google Scholar] [CrossRef]
- Aradpour, S.; Noori, R.; Vesali Naseh, M.R.; Hosseinzadeh, M.; Safavi, S.; Ghahraman-rozger, F.; Maghrebi, M. Alarming carcinogenic and non-carcinogenic risk of heavy metals in Sabalan dam reservoir, Northwest of Iran. Environ. Pollut. Bioavailab. 2021, 33, 278–291. [Google Scholar] [CrossRef]
- Noori, R. Reduced-order Modeling of Eutrophication and Water Quality of the most Important Dams in Ardabil Province (Case Study: Sabalan Dam); Applied Research Plan ARE-93037. Regional Water Company of Ardabil, Ministry of Energy: Iran, 2020. (In Persian) [Google Scholar]
- Aradpour, S.; Noori, R.; Tang, Q.; Bhattarai, R.; Hooshyaripor, F.; Hosseinzadeh, M.; Haghighi, A.T.; Klöve, B. Metal contamination assessment in water column and surface sediments of a warm monomictic man-made lake: Sabalan Dam Reservoir, Iran. Hydrol. Res. 2020, 51, 799–814. [Google Scholar] [CrossRef]
- ILEC (International Lake Environment Committee). Guidelines of Lake Management. Reservoir Water Quality Management; International Lake Environment Committee Foundation: Kusatsu, Shiga, Japan, 1999; Volume 9, Available online: http://hdl.handle.net/20.500.11822/29399 (accessed on 25 July 2021).
- Baird, R.B.; Eaton, A.D. Standard Methods for the Examination of Water and Wastewater, 23rd ed.; American Public Health Association (APHA), American Water Works Association (AWWA) and Water Environment Federation (WEF): Washington, DC, USA, 2017. [Google Scholar]
- Michalski, M.F.P.; Conroy, N. Water Quality Evaluation for the Lake Alert Study; Technical Report-No. OL21745621M; Ministry of the Environment: Toronto, ON, Canada, 1972; Available online: https://gafutalulus.iprintingbooks.icu/water-quality-evaluation-for-the-lake-alert-study-book-37298zx.php (accessed on 18 July 2021).
- Morris, D.P.; Lewis, W.M. Phytoplankton nutrient limitation in Colorado mountain lakes. Freshw. Biol. 1988, 20, 315–327. [Google Scholar] [CrossRef]
- Sterner, R.W.; Grover, J.P. Algal growth in warm temperate reservoirs: Kinetic examination of nitrogen, temperature, light, and other nutrients. Water Res. 1998, 32, 3539–3548. [Google Scholar] [CrossRef]
- Grover, J.P.; Sterner, R.W.; Robinson, J.L. Algal growth in warm temperate reservoirs: Nutrient-dependent kinetics of individual taxa and seasonal patterns of dominance. Arch. Hydrobiol. 1999, 145, 1–23. [Google Scholar] [CrossRef]
- Maberly, S.C.; King, L.; Dent, M.M.; Jones, R.I.; Gibson, C.E. Nutrient limitation of phytoplankton and periphyton growth in upland lakes. Freshw. Biol. 2002, 47, 2136–2152. [Google Scholar] [CrossRef]
- Bernal-Brooks, F.W.; Dávalos-Lind, L.; Lind, O.T. Seasonal and spatial variation in algal growth potential and growth-limiting nutrients in a shallow endorheic lake: Lake Pátzcuaro (Mexico). Lakes Reserv. Res. Manag. 2003, 8, 83–93. [Google Scholar] [CrossRef]
- Dzialowski, A.R.; Wang, S.-H.; Lim, N.-C.; Spotts, W.W.; Huggins, D.G. Nutrient limitation of phytoplankton growth in central plains reservoirs, USA. J. Plankton Res. 2005, 27, 587–595. [Google Scholar] [CrossRef]
- Kolzau, S.; Wiedner, C.; Rücker, J.; Köhler, J.; Köhler, A.; Dolman, A. Seasonal Patterns of Nitrogen and Phosphorus Limitation in Four German Lakes and the Predictability of Limitation Status from Ambient Nutrient Concentrations. PLoS ONE 2014, 9, e96065. [Google Scholar] [CrossRef] [Green Version]
- Mischler, J.A.; Taylor, P.G.; Townsend, A.R.; Mischler, J.A.; Taylor, P.G.; Townsend, A.R. Nitrogen Limitation of Pond Ecosystems on the Plains of Eastern Colorado. PLoS ONE 2014, 9, e95757. [Google Scholar] [CrossRef] [Green Version]
- Kratzer, C.R.; Brezonik, P.L. A Carlson-Type Trophic State Index for Nitrogen in Florida Lakes. JAWRA J. Am. Water Resour. Assoc. 1981, 17, 713–715. [Google Scholar] [CrossRef]
- Carlson, R.E.; Simpson, J. A Coordinator’s Guide to Volunteer Lake Monitoring Methods; North American Lake Management Society: Madison, WI, USA, 1996; p. 305. [Google Scholar]
- Sakamoto, M. Primary production by phytoplankton community in some Japanese lakes and its dependence on lake depth. Arch. Hydrobiol. 1966, 62, 1–28. [Google Scholar]
- Sterner, R.W.; Andersen, T.; Elser, J.J.; Hessen, D.O.; Hood, J.M.; McCauley, E.; Urabe, J. Scale-dependent carbon:nitrogen:phosphorus seston stoichiometry in marine and freshwaters. Limnol. Oceanogr. 2008, 53, 1169–1180. [Google Scholar] [CrossRef]
- Dokulil, M.; Chen, W.; Cai, Q. Anthropogenic impacts to large lakes in China: The Tai Hu example. Aquat. Ecosyst. Health Manag. 2000, 3, 81–94. [Google Scholar] [CrossRef]
- Xu, H.; Paerl, H.W.; Qin, B.; Zhu, G.; Gaoa, G. Nitrogen and phosphorus inputs control phytoplankton growth in eutrophic Lake Taihu, China. Limnol. Oceanogr. 2009, 55, 420–432. [Google Scholar] [CrossRef] [Green Version]
- Emadodin, I.; Narita, D.; Bork, H.R. Soil degradation and agricultural sustainability: An overview from Iran. Environ. Dev. Sustain. 2012, 14, 611–625. [Google Scholar] [CrossRef]
- Thebo, A.L.; Drechsel, P.; Lambin, E.F.; Nelson, K.L. A global, spatially-explicit assessment of irrigated croplands influenced by urban wastewater flows. Environ. Res. Lett. 2017, 12, 074008. [Google Scholar] [CrossRef]
- Wu, Z.; Liu, Y.; Liang, Z.; Wu, S.; Guo, H. Internal cycling, not external loading, decides the nutrient limitation in eutrophic lake: A dynamic model with temporal Bayesian hierarchical inference. Water Res. 2017, 116, 231–240. [Google Scholar] [CrossRef]
- Wang, M.; Xu, X.; Wu, Z.; Zhang, X.; Sun, P.; Wen, Y.; Wang, Z.; Lu, X.; Zhang, W.; Wang, X.; et al. Seasonal Pattern of Nutrient Limitation in a Eutrophic Lake and Quantitative Analysis of the Impacts from Internal Nutrient Cycling. Environ. Sci. Technol. 2019, 53, 13675–13686. [Google Scholar] [CrossRef]
- Jargal, N.; Atique, U.; Mamun, M.; An, K.-G. Seasonal and Long-Term Connections between Trophic Status, Sestonic Chlorophyll, Nutrients, Organic Matter, and Monsoon Rainfall in a Multipurpose Reservoir. Water 2021, 13, 1720. [Google Scholar] [CrossRef]
- Khormali, F.; Toomanian, N. Soil-Forming Factors and Processes. In The Soils of Iran; Roozitalab, M., Siadat, H., Farshad, A., Eds.; (World Soils Book Series); Springer: Hillerød, Denmark, 2018. [Google Scholar] [CrossRef]
- Noori, R.; Maghrebi, M.; Mirchi, A.; Tang, Q.; Bhattarai, R.; Sadegh, M.; Noury, M.; Haghighi, A.T.; Kløve, B.; Madani, K. Anthropogenic depletion of Iran’s aquifers. Proc. Natl. Acad. Sci. USA 2021, 118, e2024221118. [Google Scholar] [CrossRef] [PubMed]
- Maghrebi, M.; Noori, R.; Partani, S.; Araghi, A.; Barati, R.; Farnoush, H.; Haghighi, A.T. Iran’s Groundwater Hydrochemistry. Earth Space Sci. 2021, 8, e2021EA001793. [Google Scholar] [CrossRef]
- Mamun, M.; Kim, J.Y.; An, K.-G. Multivariate Statistical Analysis of Water Quality and Trophic State in an Artificial Dam Reservoir. Water 2021, 13, 186. [Google Scholar] [CrossRef]
- Akbay, N. Seasonal distribution of large phytoplankton in the Keban Dam Reservoir. J. Plankton Res. 1999, 21, 771–787. [Google Scholar] [CrossRef] [Green Version]
- Mankiewicz-Boczek, J.; Jaskulska, A.; Pawelczyk, J.; Gągała-Borowska, I.; Serwecińska, L.; Dziadek, J. Cyanophages Infection of Microcystis Bloom in Lowland Dam Reservoir of Sulejów, Poland. Microb. Ecol. 2015, 71, 315–325. [Google Scholar] [CrossRef]
- Teodoru, C.; Wehrli, B. Retention of Sediments and Nutrients in the Iron Gate I Reservoir on the Danube River. Biogeochemistry 2005, 76, 539–565. [Google Scholar] [CrossRef]
- Varol, M. Dissolved heavy metal concentrations of the Kralkızı, Dicle and Batman dam reservoirs in the Tigris River basin, Turkey. Chemosphere 2013, 93, 954–962. [Google Scholar] [CrossRef] [PubMed]
- Harris, T.; Smith, V.H.; Graham, J.L.; Van de Waal, D.; Tedesco, L.P.; Clercin, N. Combined effects of nitrogen to phosphorus and nitrate to ammonia ratios on cyanobacterial metabolite concentrations in eutrophic Midwestern USA reservoirs. Inland Waters 2016, 6, 199–210. [Google Scholar] [CrossRef] [Green Version]
- Woldeab, B.; Beyene, A.; Ambelu, A.; Buffam, I.; Mereta, S.T. Seasonal and spatial variation of reservoir water quality in the southwest of Ethiopia. Environ. Monit. Assess. 2018, 190, 163. [Google Scholar] [CrossRef] [PubMed]
- Burford, M.A.; Johnson, S.A.; Cook, A.J.; Packer, T.V.; Taylor, B.M.; Townsley, E.R. Correlations between watershed and reservoir characteristics, and algal blooms in subtropical reservoirs. Water Res. 2007, 41, 4105–4114. [Google Scholar] [CrossRef] [PubMed] [Green Version]
- Nukazawa, K.; Kihara, K.; Suzuki, Y. Negligible contribution of reservoir dams to organic and inorganic transport in the lower Mimi River, Japan. J. Hydrol. 2017, 555, 288–297. [Google Scholar] [CrossRef]
- Huang, Y.; Li, Y.; Ji, D.; Nwankwegu, A.S.; Lai, Q.; Yang, Z.; Wang, K.; Wei, J.; Norgbey, E. Study on nutrient limitation of phytoplankton growth in Xiangxi Bay of the Three Gorges Reservoir, China. Sci. Total Environ. 2020, 723, 138062. [Google Scholar] [CrossRef] [PubMed]
- Li, Y.; Zhang, Y.; Shi, K.; Zhu, G.; Zhou, Y.; Zhang, Y.; Guo, Y. Monitoring spatiotemporal variations in nutrients in a large drinking water reservoir and their relationships with hydrological and meteorological conditions based on Landsat 8 imagery. Sci. Total Environ. 2017, 599–600, 1705–1717. [Google Scholar] [CrossRef] [PubMed]
- Li, T.; Zhang, Y.; He, B.; Yang, B.; Huang, Q. Periodically hydrologic alterations decouple the relationships between physicochemical variables and chlorophyll-a in a dam-induced urban lake. J. Environ. Sci. 2020, 99, 187–195. [Google Scholar] [CrossRef] [PubMed]
- Padedda, B.M.; Sechi, N.; Lai, G.G.; Mariani, M.A.; Pulina, S.; Sarria, M.; Satta, C.T.; Virdis, T.; Buscarinu, P.; Lugliè, A. Consequences of eutrophication in the management of water resources in Mediterranean reservoirs: A case study of Lake Cedrino (Sardinia, Italy). Glob. Ecol. Conserv. 2017, 12, 21–35. [Google Scholar] [CrossRef]
- Geng, M.; Wang, K.; Yang, N.; Li, F.; Zou, Y.; Chen, X.; Deng, Z.; Xie, Y. Evaluation and variation trends analysis of water quality in response to water regime changes in a typical river-connected lake (Dongting Lake), China. Environ. Pollut. 2021, 268, 115761. [Google Scholar] [CrossRef]
- Oliver, A.A.; Dahlgren, R.A.; Deas, M.L. The upside-down river: Reservoirs, algal blooms, and tributaries affect temporal and spatial patterns in nitrogen and phosphorus in the Klamath River, USA. J. Hydrol. 2014, 519, 164–176. [Google Scholar] [CrossRef] [Green Version]
- Jones, J.R.; Knowlton, M.F.; Obrecht, D.V.; Cook, E.A. Importance of landscape variables and morphology on nutrients in Missouri reservoirs. Can. J. Fish. Aquat. Sci. 2004, 61, 1503–1512. [Google Scholar] [CrossRef]
- Muñoz-Nájera, M.A.; Tapia-Silva, F.O.; Barrera-Escorcia, G.; Ramírez-Romero, P. Statistical and geostatistical spatial and temporal variability of physico-chemical parameters, nutrients, and contaminants in the Tenango Dam, Puebla, Mexico. J. Geochem. Explor. 2019, 209. [Google Scholar] [CrossRef]
- Dar, S.; Bhat, S.U.; Aneaus, S.; Rashid, I. A geospatial approach for limnological characterization of Nigeen Lake, Kashmir Himalaya. Environ. Monit. Assess. 2020, 192, 121. [Google Scholar] [CrossRef]
- Tao, K.; Liu, Y.; Ke, T.; Zhang, Y.; Xiao, L.; Li, S.; Wei, S.; Chen, L.; Hu, T. Patterns of bacterial and archaeal communities in sediments in response to dam construction and sewage discharge in Lhasa River. Ecotoxicol. Environ. Saf. 2019, 178, 195–201. [Google Scholar] [CrossRef]
- Wang, J.; Ding, C.; Tao, J.; Jiang, X.; Heino, J.; Ding, L.; Su, W.; Chen, M.; Zhang, K.; He, D. Damming affects riverine macroinvertebrate metacommunity dynamics: Insights from taxonomic and functional beta diversity. Sci. Total Environ. 2020, 763, 142945. [Google Scholar] [CrossRef]
- Fisher, T.R.; Harding, L.W., Jr.; Stanley, D.W.; Ward, L.G. Phytoplankton, nutrients, and turbidity in the Chesapeake, Delaware, and Hudson estuaries. Estuar. Coast. Shelf Sci. 1988, 27, 61–93. [Google Scholar] [CrossRef]
- Dortch, Q.; Whitledge, T.E. Does nitrogen or silicon limit phytoplankton production in the Mississippi River plume and nearby regions? Cont. Shelf Res. 1992, 12, 1293–1309. [Google Scholar] [CrossRef]
- Ding, Y.; Wang, S.; Zhang, W.; Feng, M.; Yu, R. A rule of hydrological regulating on nutritional status of Poyang Lake, since the operation of the Three Gorges Dam. Ecol. Indic. 2019, 104, 535–542. [Google Scholar] [CrossRef]
- Zhang, B.; Guo, J.-S.; Fang, F.; Li, Z.; Fu, C. Concentration of nutrients in the soil in water-level-fluctuating zone of Three Gorges Reservoir. Ecohydrol. Hydrobiol. 2012, 12, 105–114. [Google Scholar] [CrossRef] [Green Version]
- Mamun, M.; Kwon, S.; Kim, J.-E.; An, K.-G. Evaluation of algal chlorophyll and nutrient relations and the N:P ratios along with trophic status and light regime in 60 Korea reservoirs. Sci. Total Environ. 2020, 741, 140451. [Google Scholar] [CrossRef]
- Yang, C.; Nan, J.; Yu, H.; Li, J. Embedded reservoir and constructed wetland for drinking water source protection: Effects on nutrient removal and phytoplankton succession. J. Environ. Sci. 2019, 87, 260–271. [Google Scholar] [CrossRef]
- Jurczak, T.; Wagner, I.; Wojtal-Frankiewicz, A.; Frankiewicz, P.; Bednarek, A.; Łapińska, M.; Kaczkowski, Z.; Zalewski, M. Comprehensive approach to restoring urban recreational reservoirs. Part 1–Reduction of nutrient loading through low-cost and highly effective ecohydrological measures. Ecol. Eng. 2019, 131, 81–98. [Google Scholar] [CrossRef]
- Li, N.; Wang, J.; Yin, W.; Jia, H.; Xu, J.; Hao, R.; Zhong, Z.; Shi, Z. Linking water environmental factors and the local watershed landscape to the chlorophyll a concentration in reservoir bays. Sci. Total Environ. 2020, 758, 143617. [Google Scholar] [CrossRef]
- Nwankwegu, A.S.; Li, Y.; Huang, Y.; Wei, J.; Norgbey, E.; Lai, Q.; Sarpong, L.; Wang, K.; Ji, D.; Yang, Z.; et al. Nutrient addition bioassay and phytoplankton community structure monitored during autumn in Xiangxi Bay of Three Gorges Reservoir, China. Chemosphere 2020, 247, 125960. [Google Scholar] [CrossRef] [PubMed]
- Nikolai, S.J.; Dzialowski, A.R. Effects of internal phosphorus loading on nutrient limitation in a eutrophic reservoir. Limnologica 2014, 49, 33–41. [Google Scholar] [CrossRef]
- Yan, Z.; Kangas, P.C.; Yuan, X.; Chen, Y.; Zhang, Y.; Li, J.; Su, Y.; Gao, X.; Chen, N. Flow conditions influence nutrient removal at an artificial lake and a drinking water reservoir with an algal floway. Algal Res. 2018, 35, 245–252. [Google Scholar] [CrossRef]
- Abu Hilal, A.H.; Abu Alhaija, M.M. Nutrients in water and sediments of King Talal Dam-Jordan. Jordan J. Biol. Sci. 2010, 147, 1–14. [Google Scholar]
- Hu, J.; Qiao, Y.; Zhou, L.; Li, S. Spatiotemporal distributions of nutrients in the downstream from Gezhouba Dam in Yangtze River, China. Environ. Sci. Pollut. Res. 2012, 19, 2849–2859. [Google Scholar] [CrossRef]
- Hara, J.; Atique, U.; An, K.-G. Multiyear Links between Water Chemistry, Algal Chlorophyll, Drought-Flood Regime, and Nutrient Enrichment in a Morphologically Complex Reservoir. Int. J. Environ. Res. Public Health 2020, 17, 3139. [Google Scholar] [CrossRef] [PubMed]
- Vollenweider, R.A. The Scientific Basis of Lake and Stream Eutrophication, with Particular Reference to Phosphorus and Nitrogen as Eutrophication Factors; Organisation for Economic Cooperation and Development: Paris, France, 1968; p. 159. [Google Scholar]
- Dillon, P.J.; Rigler, F.H. The phosphorus-chlorophyll relationship in lakes1,2. Limnol. Oceanogr. 1974, 19, 767–773. [Google Scholar] [CrossRef]
- Hecky, R.E. The eutrophication of Lake Victoria. Int. Ver. Theor. Angew. Limnol. Verh. 1993, 25, 39–48. [Google Scholar] [CrossRef]
- Sterner, R.W. C:N:P stoichiometry in Lake Superior: Freshwater sea as end member. Inland Waters 2011, 1, 29–46. [Google Scholar] [CrossRef] [Green Version]
- Jekatierynczuk-Rudczyk, E.; Zielinski, P.; Grabowska, M.; Ejsmont-Karabin, J.; Karpowicz, M.; Więcko, A. The trophic status of Suwałki Landscape Park lakes based on selected parameters (NE Poland). Environ. Monit. Assess. 2014, 186, 5101–5121. [Google Scholar] [CrossRef] [PubMed] [Green Version]
- Haghighi, A.T.; Sadegh, M.; Behrooz-Koohenjani, S.; Hekmatzadeh, A.A.; Karimi, A.; Kløve, B. The mirage water concept and an index-based approach to quantify causes of hydrological changes in semi-arid regions. Hydrol. Sci. J. 2019, 65, 311–324. [Google Scholar] [CrossRef]
- Rueda, F.; Ostos, E.M.; Armengol, J. The residence time of river water in reservoirs. Ecol. Model. 2006, 191, 260–274. [Google Scholar] [CrossRef]
- Meals, D.W.; Dressing, S.A.; Davenport, T.E. Lag Time in Water Quality Response to Best Management Practices: A Review. J. Environ. Qual. 2010, 39, 85–96. [Google Scholar] [CrossRef]
- Andradóttir, H.; Rueda, F.J.; Armengol, J.; Marcé, R. Characterization of residence time variability in a managed monomictic reservoir. Water Resour. Res. 2012, 48, W11505. [Google Scholar] [CrossRef]
- Qi, H.; Lu, J.; Chen, X.; Sauvage, S.; Sanchez-Pérez, J.-M. Water age prediction and its potential impacts on water quality using a hydrodynamic model for Poyang Lake, China. Environ. Sci. Pollut. Res. 2016, 23, 13327–13341. [Google Scholar] [CrossRef] [PubMed]
- Tong, Y.; Li, J.; Qi, M.; Zhang, X.; Wang, M.; Liu, X.; Zhang, W.; Wang, X.; Lu, Y.; Lin, Y. Impacts of water residence time on nitrogen budget of lakes and reservoirs. Sci. Total Environ. 2018, 646, 75–83. [Google Scholar] [CrossRef]
- Noori, R.; Berndtsson, R.; Adamowski, J.F.; Abyaneh, M.R. Temporal and depth variation of water quality due to thermal stratification in Karkheh Reservoir, Iran. J. Hydrol. Reg. Stud. 2018, 19, 279–286. [Google Scholar] [CrossRef]
- Dickman, M. Some Effects of Lake Renewal on Phytoplankton Productivity and Species Composition 1. Limnol. Oceanogr. 1969, 14, 660–666. [Google Scholar] [CrossRef]
- Gomes, L.; Miranda, L.E. Hydrologic and climatic regimes limit phytoplankton biomass in reservoirs of the Upper Paraná River Basin, Brazil. Hydrobiologia 2001, 457, 205–214. [Google Scholar] [CrossRef]
- Lee, S.; Lee, S.; Kim, S.H.; Park, H.; Park, S.; Yum, K. Examination of Critical Factors Related to Summer Chlorophyll a Concentration in the Sueo Dam Reservoir, Republic of Korea. Environ. Eng. Sci. 2012, 29, 502–510. [Google Scholar] [CrossRef] [PubMed] [Green Version]
- Zhao, F.; Zhan, X.; Xu, H.; Zhu, G.; Zou, W.; Zhu, M.; Kang, L.; Guo, Y.; Zhao, X.; Wang, Z.; et al. New insights into eutrophication management: Importance of temperature and water residence time. J. Environ. Sci. 2021, 111, 229–239. [Google Scholar] [CrossRef]


| Study Area | Sampling Details | Sampling Period (Interval) | TN (mg/L) | TP (mg/L) | Reference |
|---|---|---|---|---|---|
| Sabalan reservoir, Iran | Water column | 2017–2018 (monthly) | Mean = 4.2 Max = 8.8 Min = 2.0 | Mean = 0.61 Max = 1.85 Min = 0.11 | This study |
| Sabalan reservoir, Iran | Surface layers | 2017–2018 (monthly) | Mean = 3.1 Max = 4.6 Min = 2.0 | Mean = 0.39 Max = 0.61 Min = 0.11 | This study |
| Paldang reservoir, South Korea | Surface layers | 1996–2019 (annually) | Mean = 2.3 Max = 2.8 Min = 1.9 | Mean = 0.043 Max = 0.071 Min = 0.028 | Mamun et al. [52] |
| Keban dam reservoir, Turkey | Water column | 1991–1993 (seasonally) | Mean = 3.7 Max = 12 Min = 2 | Mean = 0.11 Max = 0.175 Min = 0.025 | Akbay et al. [53] |
| Dam reservoir of Sulejów, Poland | Water column | 2009–2013 (monthly) | Mean = 2.46 Max = 6.72 Min = 0.1 | Mean = 0.138 Max = 0.45 Min = 0.01 | Mankiewicz-Boczek et al. [54] |
| Iron Gates I reservoir, Romania | Water column | 2001 (bimonthly) | Mean = 1.35 Max = 1.6 Min = 0.7 | Mean = 0.12 Max = 0.16 Min = 0.032 | Teodoru and Wehrli [55] |
| Batman dam reservoir, Turkey | Surface layers | 2008–2009 (bimonthly) | Mean = 0.67 Max = 1.088 Min = 0.217 | Mean = 0.061 Max = 0.136 Min = 0.016 | Varol [56] |
| Four Midwestern United States reservoirs | Surface layers | 2001–2012 (monthly) | Mean = 1.68 Max = 7.96 Min = 0.16 | Mean = 0.103 Max = 1.77 Min = 0.014 | Harris et al. [57] |
| Gilgel Gibe reservoir, Ethiopia | Surface layers | 2014–2015 (seasonally) | Mean = 1.606 StD = 0.17 | Mean = 0.184 StD = 0.015 | Woldeab et al. [58] |
| Seven reservoirs in subtropical southeast Queensland, Australia | Water column | 2004–2005 (seasonally) | Mean = 0.48 StD = 0.066 | Mean = 0.024 StD = 0.016 | Burford et al. [59] |
| Three dams constructed over Mimi River, Japan | Surface layers | 2012–2014 | Mean = 0.25 Max = 0.40 Min = 0.15 | Mean = 0.035 Max = 0.2 Min = 0.005 | Nukazawa et al. [60] |
| Three Gorges Reservoir, China | Surface layers | 2015 (autumn) | Mean = 1.485 StD = 0.309 | Mean = 0.128 StD = 0.013 | Huang et al. [61] |
| Xin’anjiang Reservoir, China | Surface layers | 2013–2014 (randomly) | Mean = 1.017 Max = 1.783 Min = 0.661 | Mean = 0.019 Max = 0.066 Min = 0.002 | Li et al. [62] |
| Hanfeng dam reservoir, China | Surface layers | 2013–2014 (seasonally) | Mean = 1.95 Max = 3.51 Min = 1.05 | Mean = 0.138 Max = 0.33 Min = 0.05 | Li et al. [63] |
| Dongting lake, China | Surface layers | 2004–2018 (randomly) | Mean = 1.46 Max = 2.05 Min = 1.12 | Mean = 0.1 Max = 0.17 Min = 0.03 | Geng et al. [64] |
| Lake Cedrino, Italy | Water column | 2010–2011 Monthly | Mean = 2.371 Max = 2.026 Min = 0.681 | Mean = 0.101 Max = 0.296 Min = 0.027 | Padedda et al. [65] |
| Klamath river dam, USA | Surface layers | 2010–2011 (monthly) | Mean = 1.26 Max = 2.79 Min = 0.69 | Mean = 0.10 Max = 0.15 Min = 0.07 | Oliver et al. [66] |
| Missouri reservoir, USA | Surface layers | 1978–2002 (annually) | Mean = 0.7 Max = 2.330 Min = 0.200 | Mean = 0.045 Max = 0.182 Min = 0.006 | Jones et al. [67] |
| Tenango Dam, Mexico | Surface layers | June 2015 | Mean = 1.51 StD = 0.65 | Muñoz-Nájera et al. [68] | |
| Nigeen Lake, India | Surface layers | May to November 2015 | Min = 0.104 Max = 0.688 | Dar et al. [69] | |
| Lhasa River Dam, Tibet | Sediment | August 2017 | Mean = 1.5 StD = 0.057 | Mean = 0.0512 StD = 0.0024 | Tao et al. [70] |
| Nanla River, China | Surface layers | 2019 Monthly | Mean = 1.37 StD = 1.13 | Mean = 0.18 STD = 0.12 | Wang et al. [71] |
| Delaware, USA | Water column | March 1982–October 1983 | Mean = 0.035 StD = 0.012 | Mean = 0.0014 StD = 0.003 | Fisher et al. [72] |
| Mississippi River, USA | Surface layers | 21 July–1 August 1987 | Mean = 0.176 StD = 0.182 | Mean = 0.319 StD = 182 | Dortch and Whitledge [73] |
| Three Gorges Dam, China | Surface layers | 2003–2015 monthly | Max = 1.3 Min = 0.64 | Max = 0.110 Min = 0.046 | Ding et al. [74] |
| Three Gorges Reservoir, China | Surface layers | April 2010 | Mean = 0.865 Max = 1.903 Min = 0.127 | Mean = 0.592 Max = 1.365 Min = 0.205 | Zhang et al. [75] |
| 4 Multipurpose Reservoirs, Korea | Surface layers | 2015–2017 monthly | Mean = 1.85 Max = 3.45 Min = 0.57 | Mean = 0.018 Max = 0.147 Min = 0.003 | Mamun et al. [76] |
| Lake Taihu, China | Epilimnion layer | April 2017–September 2018 monthly | Mean = 0.70 Max = 1.40 Min = 0.32 | Mean = 0.05 Max = 0.1 Min = 0.02 | Yang et al. [77] |
| Bzura River, Poland | Surface layers | 2010–2012 and 2014–2016 biweekly | Mean = 1.15 StD = 0.28 | Mean = 0.26 StD = 0.09 | Jurczak et al. [78] |
| Danjiangkou Reservoir, China | Surface layers | 2015–2018 May and Sep | Mean = 1.69 Max = 5.99 Min = 0.76 | Mean = 0.09 Max = 0.36 Min = 0.02 | Li et al. [79] |
| Three Gorges Reservoir, China | Surface layers | August 19 e September 12, 2018 | Mean = 1.49 StD = 0.031 | Mean = 0.13 StD = 0.01 | Nwankwegu et al. [80] |
| Grand Lake, Oklahoma, USA | Surface layers | June–October 2011 monthly | Mean = 0.642 Max = 1 Min = 0.3 | Mean = 0.077 Max = 0.13 Min = 0.04 | Nikolai and Dzialowski [81] |
| Jiangdong Reservoir, China | Surface layers | April to August 2016 daily | Mean = 2.53 StD = 0.33 | Mean = 0.15 StD = 0.02 | Yan et al. [82] |
| King Talal Dam, Jordan | Surface layer | 2007–2008 (seasonally) | Mean = 59.1 StD = 8.23 | Mean = 5.6 StD = 0.45 | Abu Hilal et al. [83] |
| Gezhouba Dam, China | Surface layer | 2008–2009 (Monthly) | Mean = 1.8 StD = 0.03 | Mean = 0.18 StD = 0.01 | Hu et al. [84] |
| Soyang reservoir, South Korea | Surface layer | 1992–2013 | Mean = 1.5 Max = 2.9 Min = 0.73 | Mean = 0.017 Max = 0.237 Min = 0.001 | HaRa et al. [85] |
© 2021 by the authors. Licensee MDPI, Basel, Switzerland. This article is an open access article distributed under the terms and conditions of the Creative Commons Attribution (CC BY) license (https://creativecommons.org/licenses/by/4.0/).
Share and Cite
Noori, R.; Ansari, E.; Jeong, Y.-W.; Aradpour, S.; Maghrebi, M.; Hosseinzadeh, M.; Bateni, S.M. Hyper-Nutrient Enrichment Status in the Sabalan Lake, Iran. Water 2021, 13, 2874. https://doi.org/10.3390/w13202874
Noori R, Ansari E, Jeong Y-W, Aradpour S, Maghrebi M, Hosseinzadeh M, Bateni SM. Hyper-Nutrient Enrichment Status in the Sabalan Lake, Iran. Water. 2021; 13(20):2874. https://doi.org/10.3390/w13202874
Chicago/Turabian StyleNoori, Roohollah, Elmira Ansari, Yong-Wook Jeong, Saber Aradpour, Mohsen Maghrebi, Majid Hosseinzadeh, and Sayed M. Bateni. 2021. "Hyper-Nutrient Enrichment Status in the Sabalan Lake, Iran" Water 13, no. 20: 2874. https://doi.org/10.3390/w13202874
APA StyleNoori, R., Ansari, E., Jeong, Y.-W., Aradpour, S., Maghrebi, M., Hosseinzadeh, M., & Bateni, S. M. (2021). Hyper-Nutrient Enrichment Status in the Sabalan Lake, Iran. Water, 13(20), 2874. https://doi.org/10.3390/w13202874