Article

Digested Sludge Quality in Mesophilic, Thermophilic and Temperature-Phased Anaerobic Digestion Systems

1
Department of Water Technology and Environmental Engineering, University of Chemistry and Technology, Technicka, 5, 166 28 Prague, Czech Republic
2
GEMMA—Group of Environmental Engineering and Microbiology, Department of Civil and Environmental Engineering, Universitat Politècnica de Catalunya·BarcelonaTech, c/Jordi Girona 1–3, Building D1, 08034 Barcelona, Spain
*
Author to whom correspondence should be addressed.
Water 2021, 13(20), 2839; https://doi.org/10.3390/w13202839
Submission received: 30 August 2021 / Revised: 28 September 2021 / Accepted: 7 October 2021 / Published: 12 October 2021

Abstract

:
Anaerobic digestion (AD) technology is commonly used to treat sewage sludge from activated sludge systems, meanwhile alleviating the energy demand (and costs) for wastewater treatment. Most often, anaerobic digestion is run in single-stage systems under mesophilic conditions, as this temperature regime is considered to be more stable than the thermophilic one. However, it is known that thermophilic conditions are advantageous over mesophilic ones in terms of methane production and digestate hygienisation, while it is unclear which one is better concerning the digestate dewaterability. Temperature-phased anaerobic digestion (TPAD) is a double-stage AD process that combines the above-mentioned temperature regimes, by operating a thermophilic digester followed by a mesophilic one. The aim of this study is to compare the digestate quality of single-stage mesophilic and thermophilic AD and TPAD systems, in terms of the dewaterability, pathogenic safety and lower calorific value (LCV) and, based on the comparison, consider digested sludge final disposal alternatives. The research is conducted in lab-scale reactors treating waste-activated sludge. The dewaterability is tested by two methods, namely, centrifugation and mechanical pressing. The experimental results show that the TPAD system is the most beneficial in terms of organic matter degradation efficiency (32.4% against 27.2 for TAD and 26.0 for MAD), producing a digestate with a high dewaterability (8.1–9.8% worse than for TAD and 6.2–12.0% better than for MAD) and pathogenic safety (coliforms and Escherichia coli were not detected, and Clostridium perfringens were counted up to 4.8–4.9 × 10³, when for TAD it was only 1.4–2.5 × 10³, and for MAD it was 1.3–1.8 × 10⁴), with the lowest LCV (19.2% against 15.4% and 15.8% under thermophilic and mesophilic conditions, respectively). Regarding the final disposal, the digested sludge after TAD can be applied directly in agriculture; after TPAD, it can be used as a fertilizer only in the case where the fermenter HRT assures the pathogenic safety. The MAD digestate is the best for being used as a fuel preserving a higher portion of organic matter, not transforming into biogas during AD.

1. Introduction

Nowadays, sustainable sewage sludge management shifts to introduce the implementation of a resource recovery approach rather than only dispose produced sludge. It turns WWTPs into water resource recovery facilities (WRRF) [1,2]. Hence, the sludge is converted into energy, nutrients, and other valuable substances (metals, specific organic substances). All of the above mentioned can be reused in different spheres of our life, including agriculture (fertilizers), various industries (biopolymers, fuels) and communal services (heat) [2,3,4]. By this, lower emissions of pollutants to the environment are reached [5]. Consequently, a better environmental protection level is achieved.
The recovery of resources and final reuse may cover around 30% of the costs for sewage sludge handling [6], which is an important amount, given that the sewage sludge handling usually takes up to 50% of the wastewater treatment expenses [7].
Sewage sludge from activated sludge WWTP comprises the so-called primary sludge, produced during the primary wastewater treatment in sedimentation tanks; secondary sludge is produced during the secondary wastewater treatment in biological reactors as a result of microbial growth. Normally, the ratio of the produced sludge types may vary from 40 to 70% of primary to secondary sludge [8,9]. At small and medium WWTPs (<50,000 PE), the primary sedimentation step may be absent, having only secondary sludge production. Secondary sludge is also known as waste-activated sludge (WAS) [10].
Anaerobic digestion (AD) is one of the most widespread and favourable means of sewage sludge handling at medium to large WWTPs using the activated sludge system. AD consists of the biodegradation of organic matter under anaerobic conditions, leading to the production of biogas (mostly composed of methane) and a stabilised digestate [11]. The AD process has four steps, namely, rate-limiting hydrolysis, acidogenesis, acetogenesis and methanogenesis [12]. Each of these steps is performed by a specific type of bacteria or archaea. During sludge digestion, hydrolysis is the rate-limiting process; therefore, innovative technologies such as the TPAD are trying to improve this step. AD may be carried out under different temperature conditions, namely, psychrophilic (0–20 °C), mesophilic (35–40 °C) and thermophilic (50–60 °C), by using single-stage or double-stage processes [11,12]. At the single-stage AD process, all four steps of AD take place in the same reactor simultaneously. In this case, all types of bacteria and/or archaea (under thermophilic conditions, methanogenic microorganisms are represented only by archaea) have to co-survive in a restricted range of pH values (±1.0 pH) [13], controlled by an organic loading rate (OLR) and hydraulic retention (HRT). The pH balance is an important monitored factor that helps to avoid the inhibition of methanogens known as slow growers under an increased OLR and/or shortened HRT. It is also important to mention that, along with increasing the AD temperature, when switching from mesophilic to thermophilic or even hypothermophilic conditions, the pH balance starts to be the more crucial aspect that can lead not only to a limited methane production, but also to a complete digester failure [14]. Due to this, there are a lot of studies conducted on different pre-treatment applications in order to promote methane production [15,16]. The so-called temperature-phased anaerobic digestion (TPAD) consists of two stages which are carried out in two anaerobic reactors implemented in series, a thermophilic followed by a mesophilic one [17,18]. TPAD systems combine the advantages of single-stage mesophilic and thermophilic systems by splitting the different types of microorganisms physically: the first two AD steps take place in the first reactor and the other two AD steps happen in the second reactor. This allows to manipulate the conditions of the rate-limiting hydrolysis by increasing the temperature and/or increasing the OLR/shortening HRT, in a much broader way excluding the direct negative influence on the methanogens located in the second digester, which promotes a higher organic matter degradation rate and, consequently, a higher methane production [19].
With regard to the environmental impacts, AD systems with the higher efficiency of organic matter degradation are more environmentally friendly. In terms of the whole WWTP, the life cycle assessment analysis showed the lowest burden on the environment from TPAD and, within the sludge line, TAD and TPAD were more beneficial than the more stable in operation MAD [2].
There are plenty of full-scale references of single-stage anaerobic digestion systems in Europe under both mesophilic and thermophilic conditions [20]. At the same time, there is no such variety of temperature-phased anaerobic digestion system examples [21], even though its beneficial performance at lab-scale [22] and full-scale [7] has already been proved. There have been several studies conducted in recent decades on TPAD efficiency over single-stage mesophilic and thermophilic reactors [21,23,24]. To the best of our knowledge, the performance of two-stage systems outcompetes mesophilic and thermophilic single-stage systems in both organic matter degradation and methane production [24,25,26]. However, “to close the loop” of digestion efficiency, a digestate quality assessment is needed. In particular, digestate dewaterability is relevant in order to reduce the digestate volume and management costs, while hygienisation is an important issue upon the land application of the digestate.
Dewaterability is a complex quality parameter of sewage sludge describing the ability of sludge flocs to “lose” water, which is entrapped inside. According to the difficulty of its removal, all water that is present in the sewage sludge can be divided into three types: free water which is unaffected by solid particles, interstitial water which is physically trapped inside the space between particles, and surface water which is adsorbed onto the surface of solid particles [27,28,29].
There are a lot of methods for sewage sludge dewaterability characterization [30] such as the capillary suction time, filterability testing, sludge centrifugation and sludge pressing. However, it is challenging to find a good correlation between lab-scale results and full-scale dewatering efficiency. A good correlation between lab-scale and full-scale dewatering efficiency plays an important role when conducting the trials of dewatering mechanisms, choosing a flocculant and its proper dosage. The above-mentioned processes are costly and depend on the type of dewatering equipment [31], and at lab-scale its performance could be cheaper and faster with the same extent of reliability. Hence, this research focuses on two methods of mechanical dewatering that are, in principle, similar to the dewatering processes used in full-scale WWTP, namely, centrifugation and mechanical pressing, and the calculation of the universal parameter of dewaterability obtained by [31].
The lower calorific value (LCV) is an important indicator of the efficient energy recovery from the digested sludge by incineration, pyrolysis, gasification, etc. The LCV is determined by the original sludge composition, degradation efficiency and dewaterability. Regarding the LCV of digested sludge, the efficiency of dewatering plays a major role, as poor dewaterability means a large amount of water in the sludge and this results in a low (often negative) LCV, because the energy value of organic matter in the sludge is lower than the energy needed to evaporate the water present. Hence, the LCV provides additional information on the quality of the digested sludge which helps to select the optimal final disposal solution from both an economic and environmental point of view [32].
Finally, pathogen removal is one of the crucial parameters for a safe treated sludge reuse in agricultural land. The legislation strictly defines which pathogen removal extent should be reached for each type of sewage sludge’s final disposal, especially in the case of use as a fertiliser in agriculture [33].
The aims of the study are to provide a comprehensive comparison on the single-stage mesophilic and thermophilic AD and TPAD systems in terms of the process performance (organic matter removal and methane production) and digestate quality (dewaterability, pathogenic safety and energy value expressed as a lower calorific value) and, based on the obtained data, suggest the best alternatives for final digested sludge disposal.

2. Materials and Methods

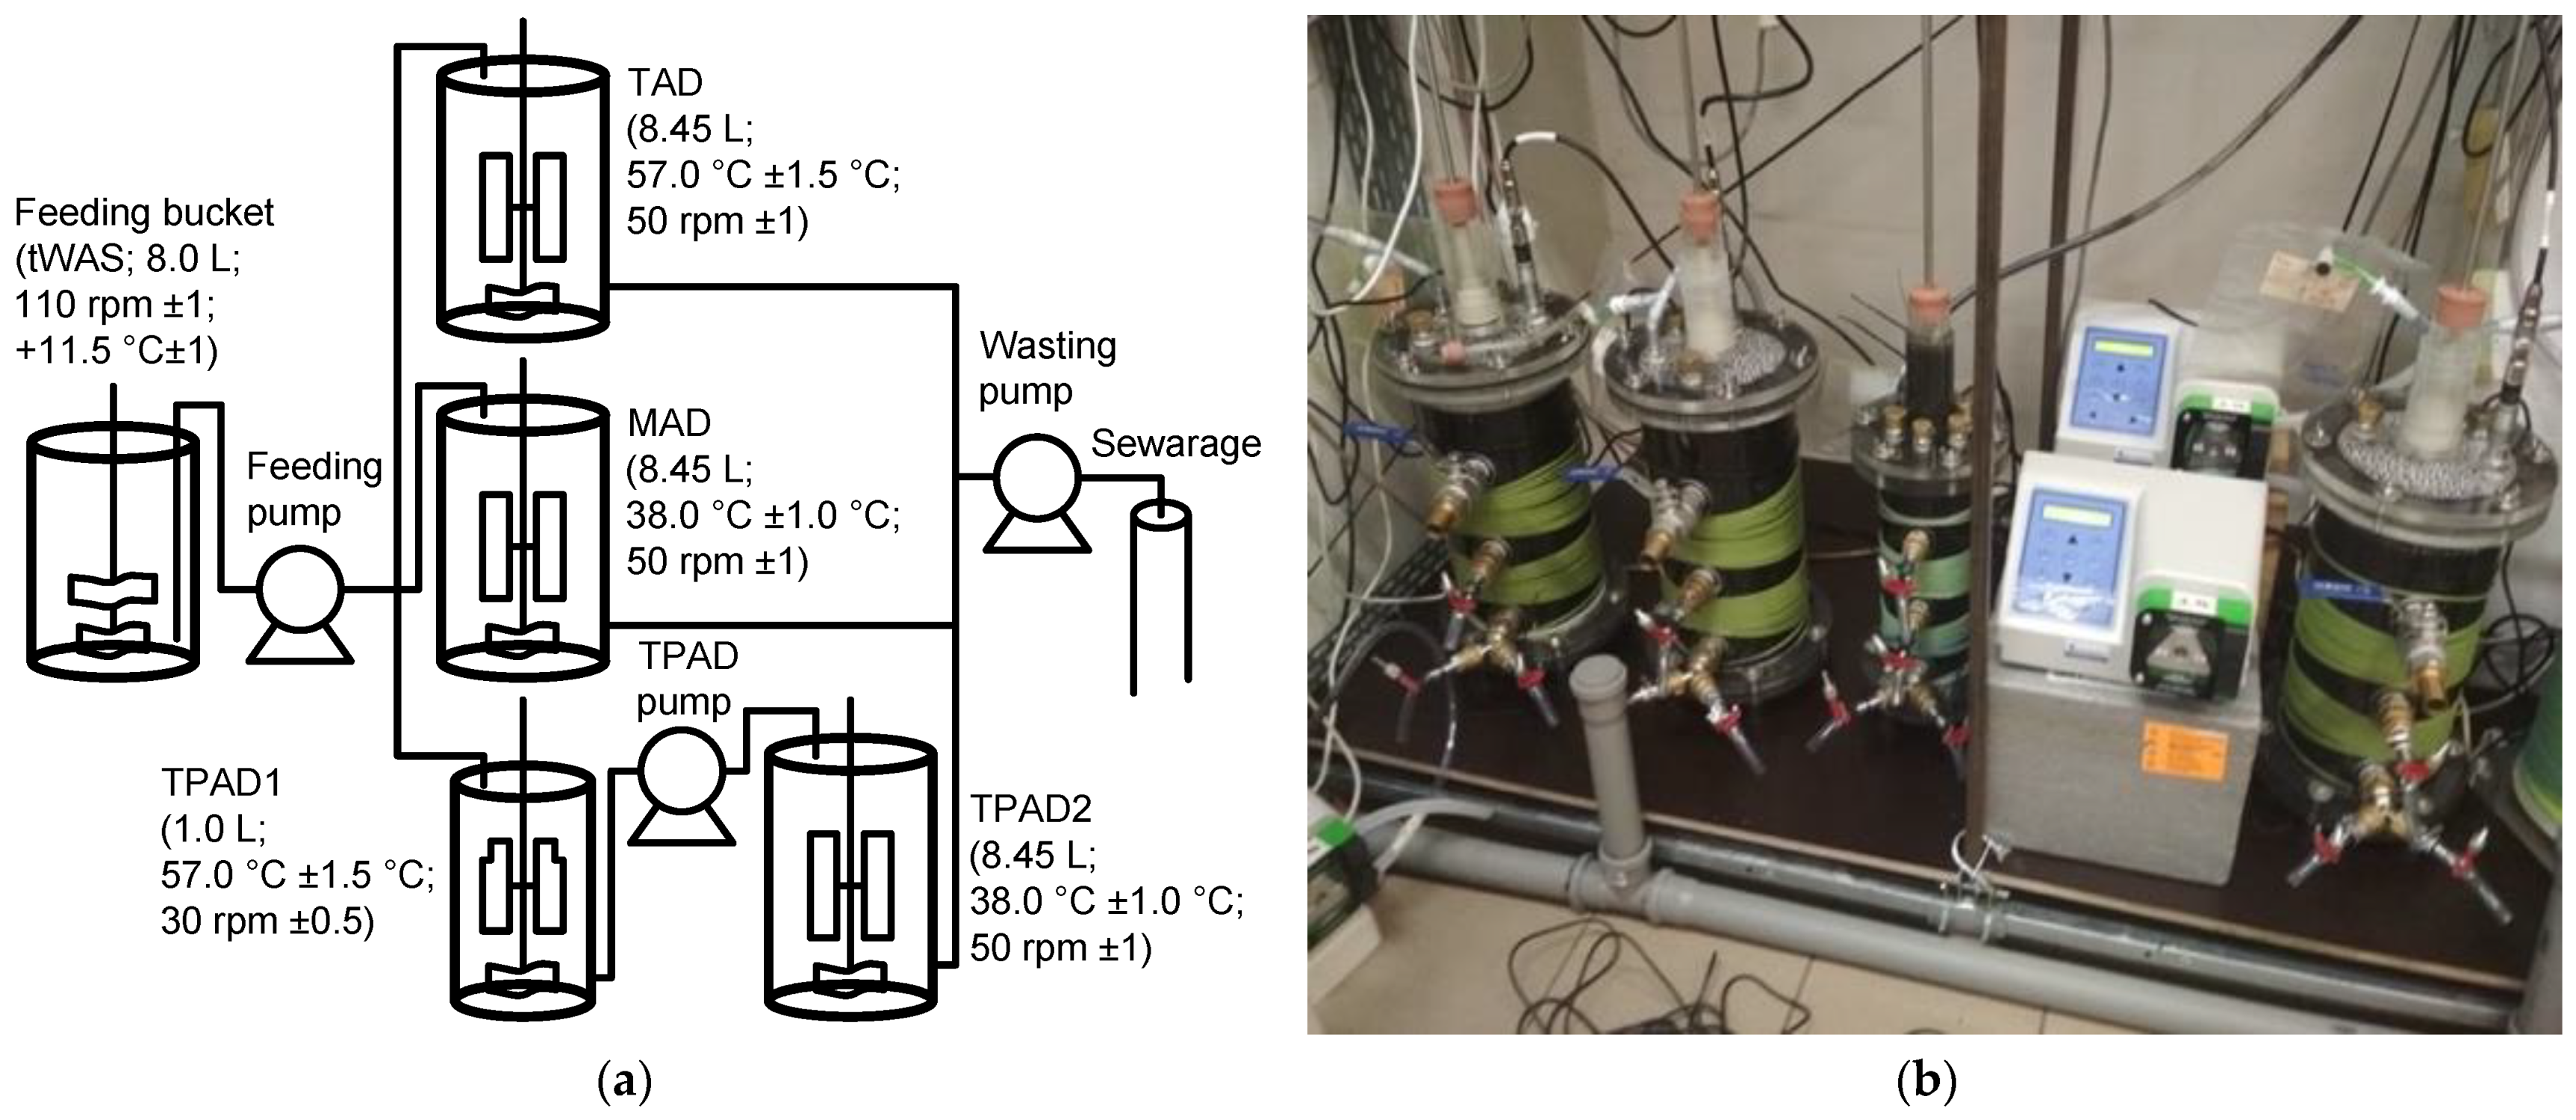
2.1. Experimental Set-Up

The experimental laboratory set-up consisted of three AD systems: single-stage thermophilic, single-stage mesophilic and double-stage TPAD (Figure 1).
The reactors were composed of thermoresistant plastic with standing temperatures of up to 60 °C. The mesophilic, thermophilic and second stage of the TPAD reactors had a working volume of 8.45 L, while the first stage of the TPAD (fermenter) had a working volume of 1.45 L, all of them with a headspace volume of around 1.0 L. The feeding and wasting processes were automated and governed by LabVIEW 2012 software version 12.0 (32-bit) ran on embedded controller cRIO 9074 (both, the software and controller from National Instruments, Prague, Czech Republic). There were three programmed cased drive peristaltic tube pumps (Verderflex Vantage 3000 P R3I EU, Verder s.r.o., Prague, Czech Republic): the feeding pump; the TPAD pump that transferred pre-digested sludge from the first stage to the second stage of TPAD; the wasting pump (Figure 1). All pumps were calibrated at least once per month, as all AD digestates and WAS used as a substrate were non-Newtonian, viscous fluids.
At first, the digestate was withdrawn from TPAD2; then, TPAD pump added pre-digested sludge from TPAD1 to TPAD2; then, the fermenter was fed by running the feeding pump. After that, the digestate was withdrawn from the single-stage mesophilic reactor and, immediately after that, it was fed. Finally, some digestate was taken from the thermophilic reactor and the same amount of substrate was added back to substitute for the withdrawn volume. The whole cycle took around thirty minutes and happened once per twenty-four hours (semi-continuous model of reactor feeding) at the same time.
The gas meter RITTER MilliGascounter (RITTER Apparatebau GmbH and Co, Bochum, Germany) were used to estimate the biogas flow.
All data were monitored online and logged in.
The whole period of experiments was divided into two phases: Phase A and Phase B. Phase A lasted for 5 months (HRT = 19.0 days; ORL = 2.24–2.25 kg VS·m−3·day−1) and Phase B for 3 months (HRT = 13.5 days; ORL. = 3.58–3.62 kg VS·m−3·day−1). The AD performance of single- and double-stage systems was evaluated in terms of organic matter degradation, methane production and digestate quality. To do so, the two above-mentioned sets of experiments were conducted, with the following operational parameters (Table 1):
The reactors were inoculated with digested sludge from the full-scale anaerobic digesters at Czech municipal wastewater treatment plants and thickened waste-activated sludge (WAS) was used as a substrate. The substrate was kept in the fridge under 11.5 ± 1.0 °C, continuously mixed at 110 ± 2 rpm. The sludge samples were characterized in terms of total suspended solids (TSS), volatile suspended solids (VSS), total and soluble chemical oxygen demand (tCOD and sCOD), pH.
The start-up period lasted fifty days (about threefold of HRT). To monitor the reactors performance, the following parameters were analysed regularly: pH (online), temperature (online), biogas volume (every day), biogas composition (three times per week), volatile fatty acid (VFA), VSS and TSS contents (once per week). The digestate quality was evaluated by measuring the dewaterability, hygienisation and LCV, as described in the following sections.

2.2. Digestate Dewaterability

The digestate dewaterability, was evaluated by two methods: (1) separation via centrifugation; (2) filtration and compression via mechanical pressing.

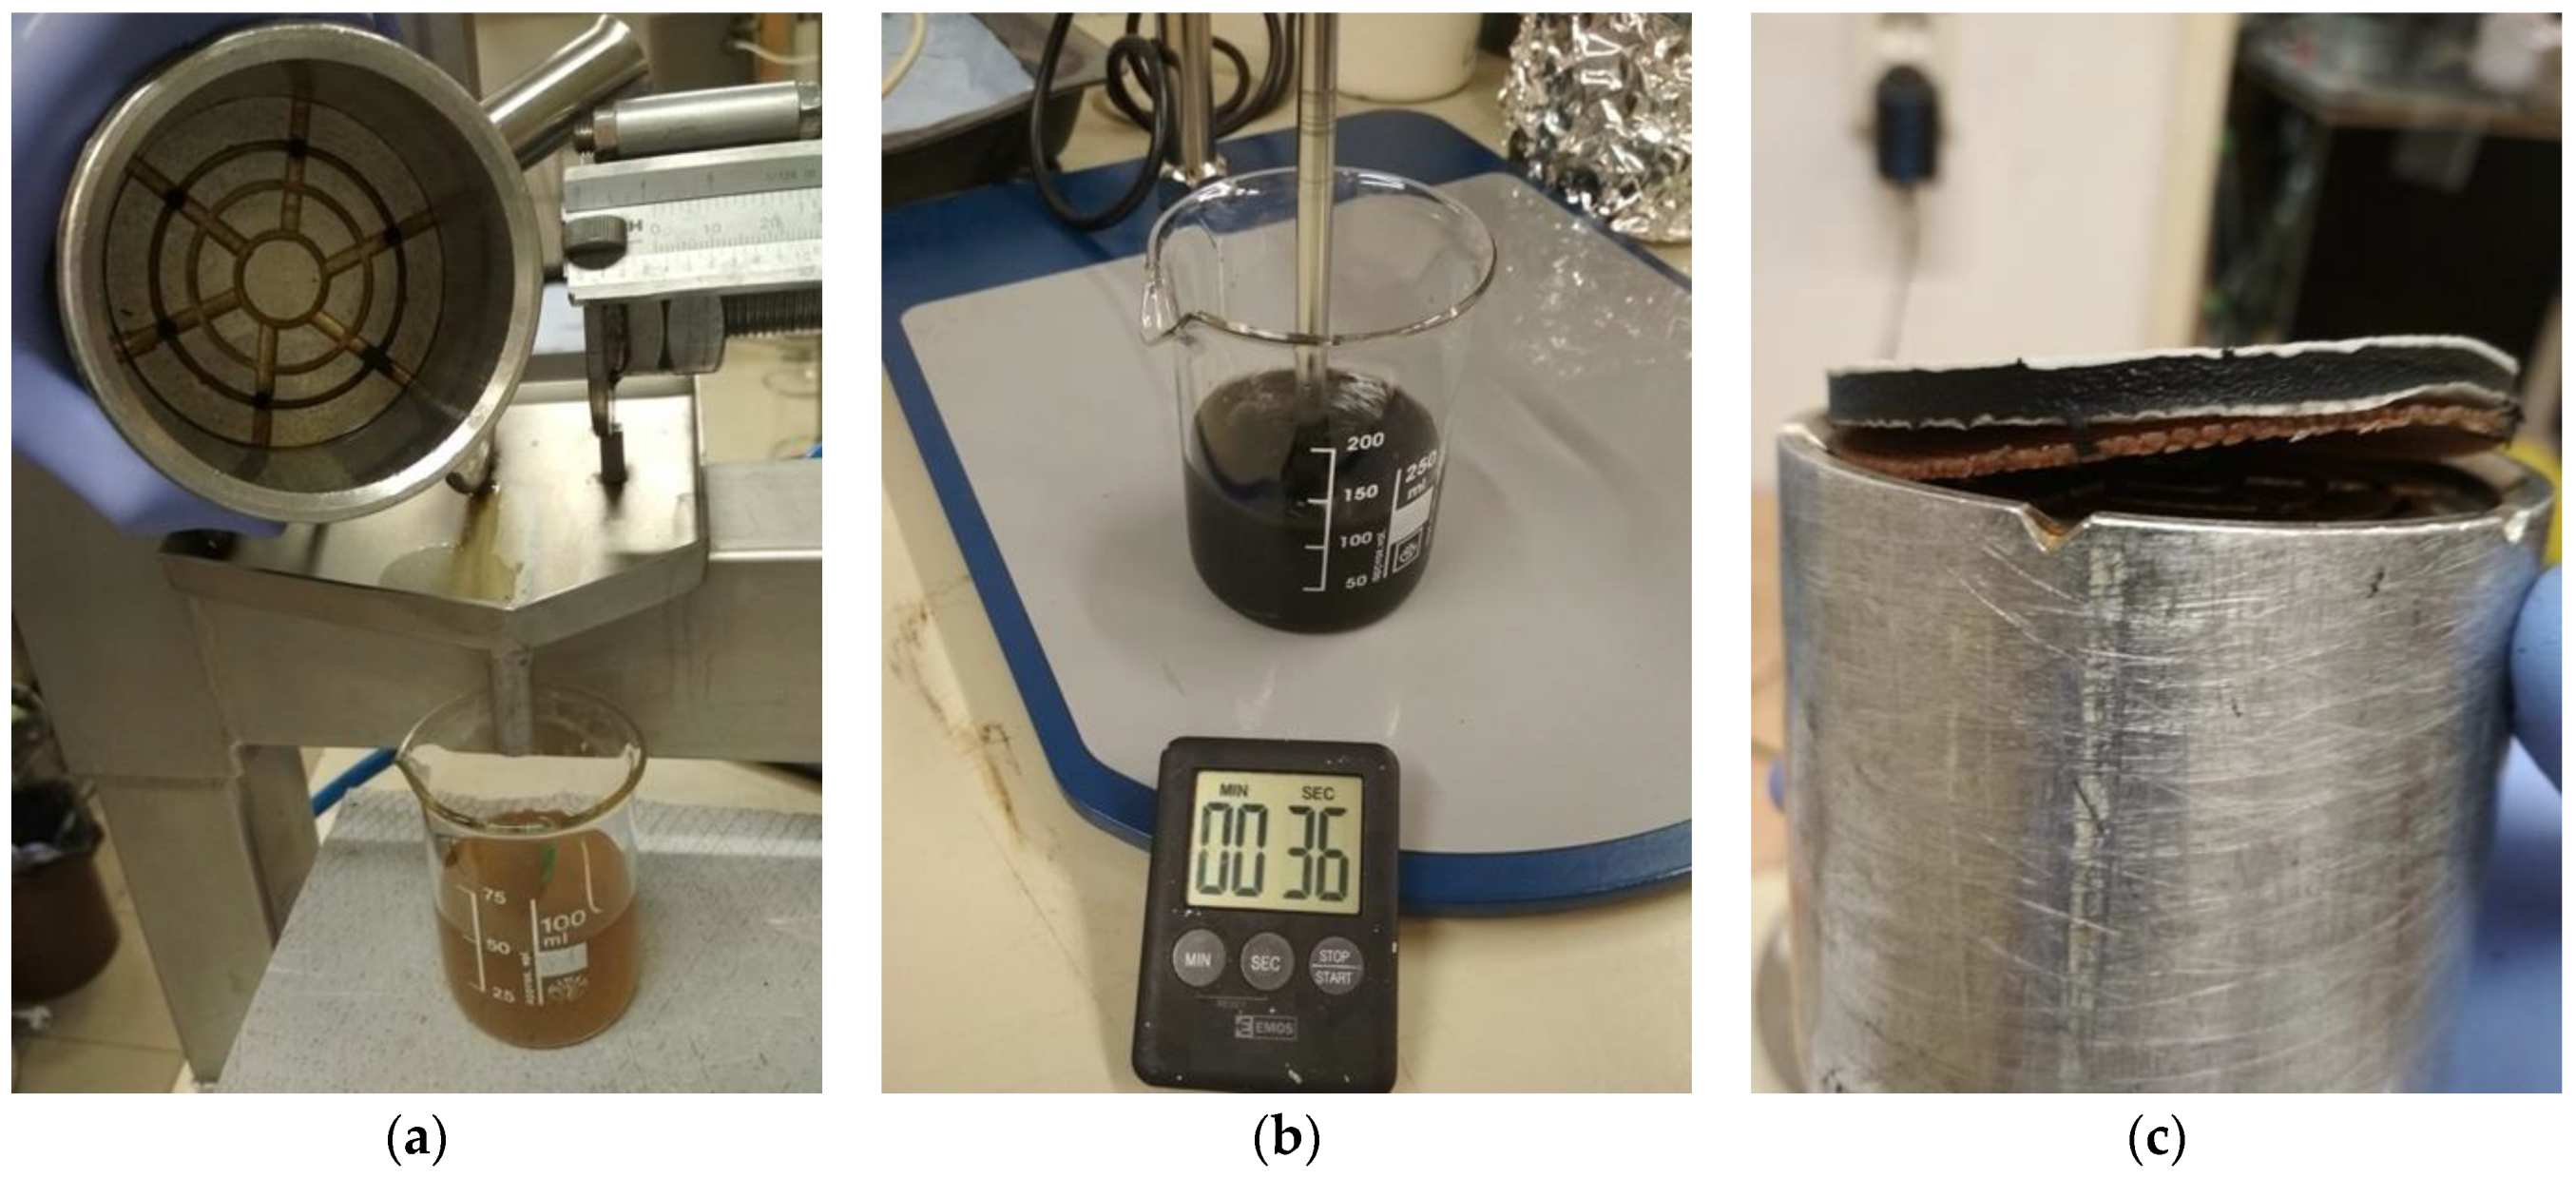
2.2.1. Centrifugation

The principle of this method is measuring the sludge cake concentration after centrifugation. For this method, all samples were centrifuged in Sigma 3–16 P (SIGMA Laborzentrifugen GmbH, Osterode am Harz, Germany) at 13,083 rpm for 10 min, and the weight of the separated fugate was measured. The higher the weight, the better the dewaterability of the sludge.
Digestate samples were centrifuged and, then, the weight of the separated fugate and sludge cake were measured. Afterwards, the concentration of TS in the sludge cake was calculated as a ratio between the amount of TS in the sample and the weight of the separated sludge cake.
The dewaterability of the digestate was calculated by the dewaterability coefficient (%), calculated from (Equation (1)):
W dry   matter W s l u d g e   c a k e × 100 %
where Wdry matter is the weight of dry matter in the centrifuged sample (g); Wsludge cake is the weight of sludge cake after centrifugation (g).
It is important to note that separation by centrifugation characterized the quality of the original digested sludge without flocculant addition.

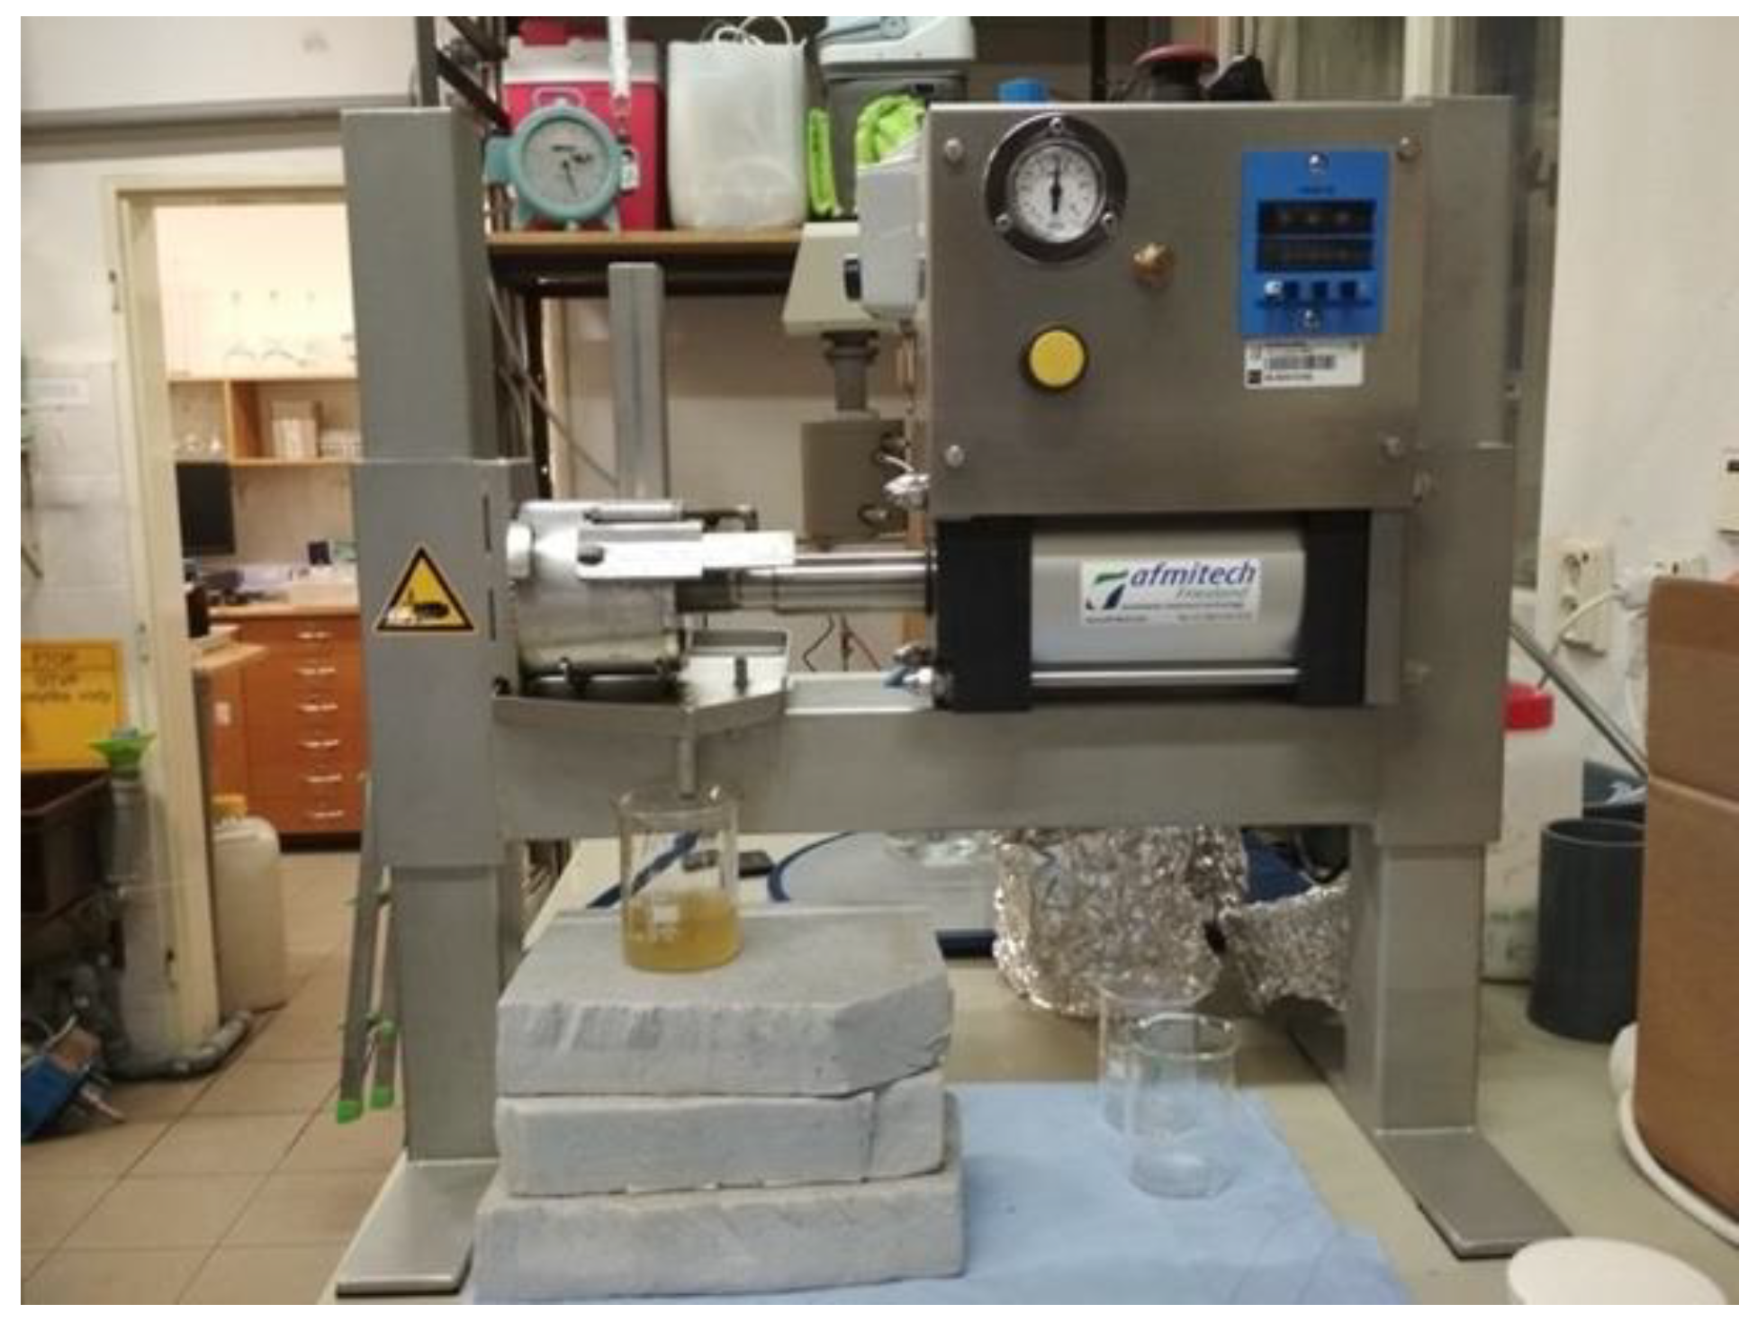
2.2.2. Mechanical Pressing

This method was carried out using a mini-press Mareco MMP-3/2 (Amfitech Friesland BV, Joure, The Netherlands) (Figure 2).
The experimental procedure was as follows: Initially, the TS concentration of digestate samples from each reactor was determined. Following, 1 L of concentrated polymer SUPERFLOC C-494HMW (Kemifloc a.s., Prerov, Czech Republic) solution (5.0 g/L) was prepared and used within 4–8 h. Tap water was used to prepare the suspension. Then, it was mixed thoroughly at 1000 rpm by a blade impeller until no flocs were observed. The corresponding volume (18–23 mL) of flocculant stock solution was then added to 50 mL of digestate, which was defined in advance based on the TS concentration measurement and for each type of digestate. The digestate sample with flocculant dosage was then mixed at 700 rpm for 3 min (Figure 3).
The pressing was performed under 5 bar and lasted 1000 s (a full cycle of mini-press, Mareco). The supernatant (Figure 3a) was weighted on the calibrated analytical balance Acculab ALC-3100.2. The quality of supernatant in terms of its cleanness was assessed every time visually. The TS concentration of the sludge cake produced by sludge pressing was determined.

2.3. Elemental Analysis and Lower Calorific Value

The elemental analysis (EA) of the digestate was performed in order to calculate two parameters—the lower calorific value and universal factor to describe AD substrates—which were used to estimate the sludge cake TSS concentration in full-scale AD [31], the so-called C/N × ash parameter (Equation (2)):
5.53 × C N × a s h + 7.14
where C/N is the ratio between C and N content in the digestate; ash is the mass fraction (1-VSS/TSS) (the empirical values obtained experimentally were 5.53 and 7.14 for VSS and TSS, respectively).
For the EA, an integrated sample was collected for each type of digestate over a period of 4 days in a row, and dried at 105 °C. EA was performed in triplicate every other week with the Elementar vario EL Cube (Elementar Analysensysteme GmbH, Langenselbold, Germany).
The lower calorific value was calculated based on the average data on ash content from the EA of digestate samples. Thus, the LCVsludge (kJ·kg−1) was calculated according to (Equation (3)) [34]:
L C V s l u d g e = 4.18 × ( 94.19 × C 0.5501 52.14 × H )
where 4.18, 92.19, 0.5501, 52.14 are empirical coefficients calculated on the basis of experimental data; C is the carbon weight fraction (%); H is the hydrogen weight fraction, (%).

2.4. Pathogenic Bacteria Indicators

Digestate hygienisation was evaluated by assessing the pathogenic bacteria indicators. Firstly, digestate samples were pre-treated as follows: 1 g of a digested sludge sample was diluted in 9 mL of physiological solution (9 g of NaCl in 1 L of distilled water and then sterilised). Then, it was diluted to 10−2 and 10−3. To measure the total counts of bacteria, as indicators of organotrophic and faecal contamination, the following microorganisms were chosen: culturable aerobic microorganisms cultivated at 22 °C and 36 °C [35], total coliforms and E. coli [36,37] and Clostridium perfringens [38]. The cultivation procedure for microorganisms cultivated at 22 °C and 36 °C was as described below: 1 mL of the pre-treated and diluted digested sludge sample was added to a Petri dish; then, the sterilised growth medium [35] was poured into the Petri dish. The procedure of the faecal contamination indicators cultivation was slightly different: 0.2 mL of the pre-treated and diluted digested sludge sample was placed directly on the surface of the sterilised growth medium [36,37,38] placed in a Petri dish earlier.

2.5. Analytical Methods

2.5.1. Biogas Production and Composition

Biogas production was measured by the Ritter MilliGascounter “MGC-1 V3.4 PMMA” (Qmin = 1 mL/h; Qmax = 1 L/h; Pmax: 5.0 mbar; preciseness: ±3%) from RITTER Apparatebau GmbH and Co, Bochum, Germany. The MilliGascounters were filled with the HCl 1.8% solution at the liquid phase to avoid any dissolving and outgassing processes (mainly, this relates to the presence of CO2) to the greatest possible extent.
The biogas composition was assessed using the gas chromatograph (GC) Shimadzu GC-2014 (Shimadzu Europa, Duisburg, F.R. Germany) with a thermal conductivity detector (temperature 185 °C) and injection via on-column with packed column (packed by HayeSep D 100/120 mash; oven: isotherm 130 °C, flow 30 mL/min; carrier gas—Helium). A total of 1.0 mL of biogas produced was withdrawn with a tight syringe, and introduced into the column, which evaluated the gaseous composition. The percentage of carbon dioxide, methane and nitrogen was detected in each sample. Hydrogen content was monitored using GC 8000 Top Gas Chromatograph by CE Instruments Ltd., Hindley Green, UK, with a thermal conductivity detector (temperature 185 °C) and injection via on-column with packed column (packed by HayeSep D 100/120 mash; oven: isotherm 100 °C, flow 30 mL/min; carrier gas—Helium). The specific methane production Qsp.methane (L/gCODadded) was calculated in the following way (Equation (4)):
Q s p . m e t h a n e = Q m e t h a n e ( W d o s e × C O D s u b s t r a t e )
where Qmethane—daily methane production, L/day; Wdose—substrate volume added, L/day; CODsubstrate—COD concentration in the substrate, gCODadded/L.

2.5.2. Suspended Solids

The solid analysis of the sludge formed the basic characterization of the sample. The test determined the content of Total Solids (TS), Volatile Solids (VS), Dissolved Solids (DS), Fixed Solids (FS), Total Suspended Solids (TSS) and Volatile Suspended Solids (VSS). In order to determine the solid content of the sludge, the procedures described by Standard Methods, APHA [39] were used.

2.5.3. Chemical Oxygen Demand

All samples were analysed accordingly to the Standard Methods [39]. To determine the total COD (tCOD), the samples were usually diluted, so that measured COD values fell within the detection limits of the spectrophotometer Hach Lange DRB-3900 (Hach, Prague, Czech Republic) set at 600 nm wavelength. For boiling the samples, an incubating mineralizer Hach Lange DRB-200 (Hach, Prague, Czech Republic) was used. All samples were measured in triplicates.

2.5.4. Temperature, pH and VFA Measurement

The monitored temperature, as well as pH of the media, were measured online by means of Polilyte Plus H Arc 225 from Hamilton Bonaduz AG, Rapperswil-Jona, Switzerland. All four probes were connected to the computer and LabView 2012 software to be able to log the data online.
The VFAs were measured weekly, employing GC Shimadzu GC-2010 (Europa, Duisburg, F.R. Germany) with a flame ionization detector and capillary column CP-Vax58 of 25 m length and 0.25 mm inner diameter (HPST s.r.o., Prague, Czech Republic). The oven program was the following: 70 °C with a rate of 15 °C/min to 134 °C and isotherm for 1 min. Total time of analysis was 5.27 min. Injection temperature was 270 °C at the split mode. Detector temperature was 300 °C.
The samples were prepared by centrifuging the digestate for 10 min at 13,083 rpm in the centrifuge Sigma 3–16 P (SIGMA Laborzentrifugen GmbH, Osterode am Harz, Germany), filtered through a filter ACRODISC PSF (Filter Concept s.r.o., Ostrava, Czech Republic) with a 0.45 µm diameter pore size and diluted ten times before the measurement.
The VFA concentration QVFA (g/gCODadded) was calculated in the following way (according to Equation (5)):
Q V F A = C V F A × V r e a c t o r W d o s e × C O D s u b s t r a t e
where CVFA—daily VFA concentration, g/L; Vreactor—working volume of the reactor, L; Wdose—substrate volume added, L/day; CODsubstrate—COD concentration in the substrate, gCODadded/L.

2.6. Statistics

For performing the statistical analysis, statistical technique ANOVA (Analysis of Variance) was used.
A one-way ANOVA technique was applied. That meant that only one independent variable—the temperature of AD process—was used. Statistical verification of significance was performed at significance level a = 0.05. For statistically significant results, the further Scheffé’s method was applied.
The Scheffé’s method was used for the multiple comparison of the average values (or contrasts). The estimation of each contrast for three procedures was defined as follows (according to Equation (6)):
ψ ^ i , j = x ¯ i x ¯ j
where i ≠ j and were equal, from 1 to 3, to the number of contrasts.
The Scheffé’s test is the most conservative procedure as it provides the narrowest confidence interval. The confidence interval within Scheffé’s test is defined as (Equation (7)):
ψ ^ i , j   ±   ( I 1 ) × s × F × ( 1 r i + 1 r j )
where ψ ^ i , j is the i-, j- contrast, I is a number of parameter levels (in this case, I = 3), ri, rj is a number of repetition in i-, j- levels; s—the residual standard deviation (from ANOVA), F is the critical F-value for (1-a) and ((I-1); (N-I)) degrees of freedom, N is the total number of experiments in ANOVA table.
If the confidence interval for i-, j- contrast contained zero value, the contrast was non-significant.

3. Results and Discussion

3.1. Anaerobic Digestion Performance

The organic matter degradation efficiency was one of the fundamental parameters of the AD process. As the substrate characteristics changed during the digester operation, the average values of VS and VSS, and removal efficiency, were calculated separately for both experimental periods: Phase A with an HRT of 19 days and Phase B with an HRT of 13.5 days (Table 2).
The achieved VS removal efficiency (23–32%) was relatively low, which reflected the fact that only thickened waste-activated sludge was used as a substrate, and that the systems were operated at a relatively high organic loading rate of 2.24–2.25 kg·m−3·day−1 (Phase A) and 3.58–3.62 kg·m−3·d−1 (Phase B) as a result of the relatively short HRT (Table 1). Similar VS removal rates (30–40%) were measured by [40] for WAS as a substrate. Oppositely, [22] registered the additional 8% of VS removal at TPAD compared to the conventional MAD. The results showed that the VS removal efficiency decreased by only 2–5% after changing from 19 days (Phase A) to 13.5 days (Phase B) of HRT: 4.3% for TAD, 1.7% for MAD and 4.1% for TPAD. In terms of VSS, there was a slight removal rate increase of 1% for TAD, which was negligible as the standard deviation was around the same value, a bigger removal rate increase of 4% for MAD and 4.8% for TPAD. This meant that shortening the HRT reduced the degradation efficiency of all AD systems. However, the acceptable efficiency was still achieved even at a significantly shortened HRT, especially in TPAD. The authors of [41] also stated higher efficiencies for the organic matter removal rate (30%) and methane production (26–60%) at TPAD than at any single-stage AD with the same HRT.
The operation of the TAD at a short retention time was the least stable, which resulted in a poor VS degradation efficiency and the accumulation of VFA (Table 3).
Table 3 shows the average VFA concentrations in the various digesters. The highest concentration of VFA was found in TPAD1, where acidogenesis was the aim. The high concentration of VFA in TAD indicated a lower stability of the thermophilic process under the tested conditions for both HRTs. In contrast, both mesophilic digesters (MAD and TPAD2) showed very low VFA concentrations and a stable performance at both HRTs.
The results of methane production (Table 4) corresponded well with the VS degradation efficiency (Table 2).
The double-stage TPAD system achieved the highest specific methane production in both periods: 233 mL/g COD added vs. 170 mL/g COD added for the TAD and 156 mL/g COD added for the MAD (Phase A) and 172 mL/g COD added vs. 116.5 mL/g COD added for the TAD and 134 mL/g COD added for the MAD (Phase B). Indeed, the TPAD system reached comparable results with an HRT of 13.5 days (172 mL/g COD added) to TAD and MAD with an HRT of 19 days (170 and 156 mL/g COD, respectively). According to the statistical analysis performed, the difference in methane production at both Phases was statistically significant for all AD systems. The correlations were considered statistically significant at a 95% confidence interval (a < 0.05). The authors of [42] also proved that TPAD showed a better performance in terms of methane production of up to 20% in comparison to the single-stage MAD.
The double-stage TPAD system in principle separated the AD stages: hydrolysis and acidogenesis took place in the 1st stage, while acetogenesis and methanogenesis occurred in the 2nd stage [43]. Therefore, the second stage of the TPAD (TAPD2) was expected to have the highest methane content in biogas (Table 5).
Moreover, the methane content in TPAD1 was expected to be much lower because of the very short retention time (2.0 days). According to the literature, the generation time of methanogens may vary in a broad range of 0.1–12.4 days [32]. In this case, the presence of methanogens can be explained by the production of a biofilm on the digester walls and the mixing device. To our best knowledge, a much higher retention time of the biofilm in comparison with the suspended biomass allowed for an accumulation of methanogens inside the digester, as the HRT of TPAD1 of 2 days was not enough to avoid washing out the methanogens [22]. However, the presence of fast-growing methanogens (generation time 4–12 h) could not be ruled out either [44], especially when any of the other means for methanogenic inhibition such as lowering the pH and dosing methanogenic inhibitors were not performed [19].
Our experimental results suggested that the TPAD system was beneficial due to an improved hydrolysis and acidogenesis in the first stage, and optimized conditions for methanogenesis in the second stage. Such a system seemed to be sufficiently efficient, mainly at a short total HRT of TPAD up to 14 days, which could reduce the footprint and investment costs. The authors of [45] stated HRT to be a crucial parameter that can influence the efficiency of AD, and an HRT of 30 days allows all types of AD to become more or less the same in terms of biogas production, which makes the more energy-demanding TAD and TPAD less economically interesting. The authors of [42,46] underlined that the first stage of TPAD was the most efficient at 2–3 days, when the total HRT was less than 20 days.

3.2. Digestate Dewaterability

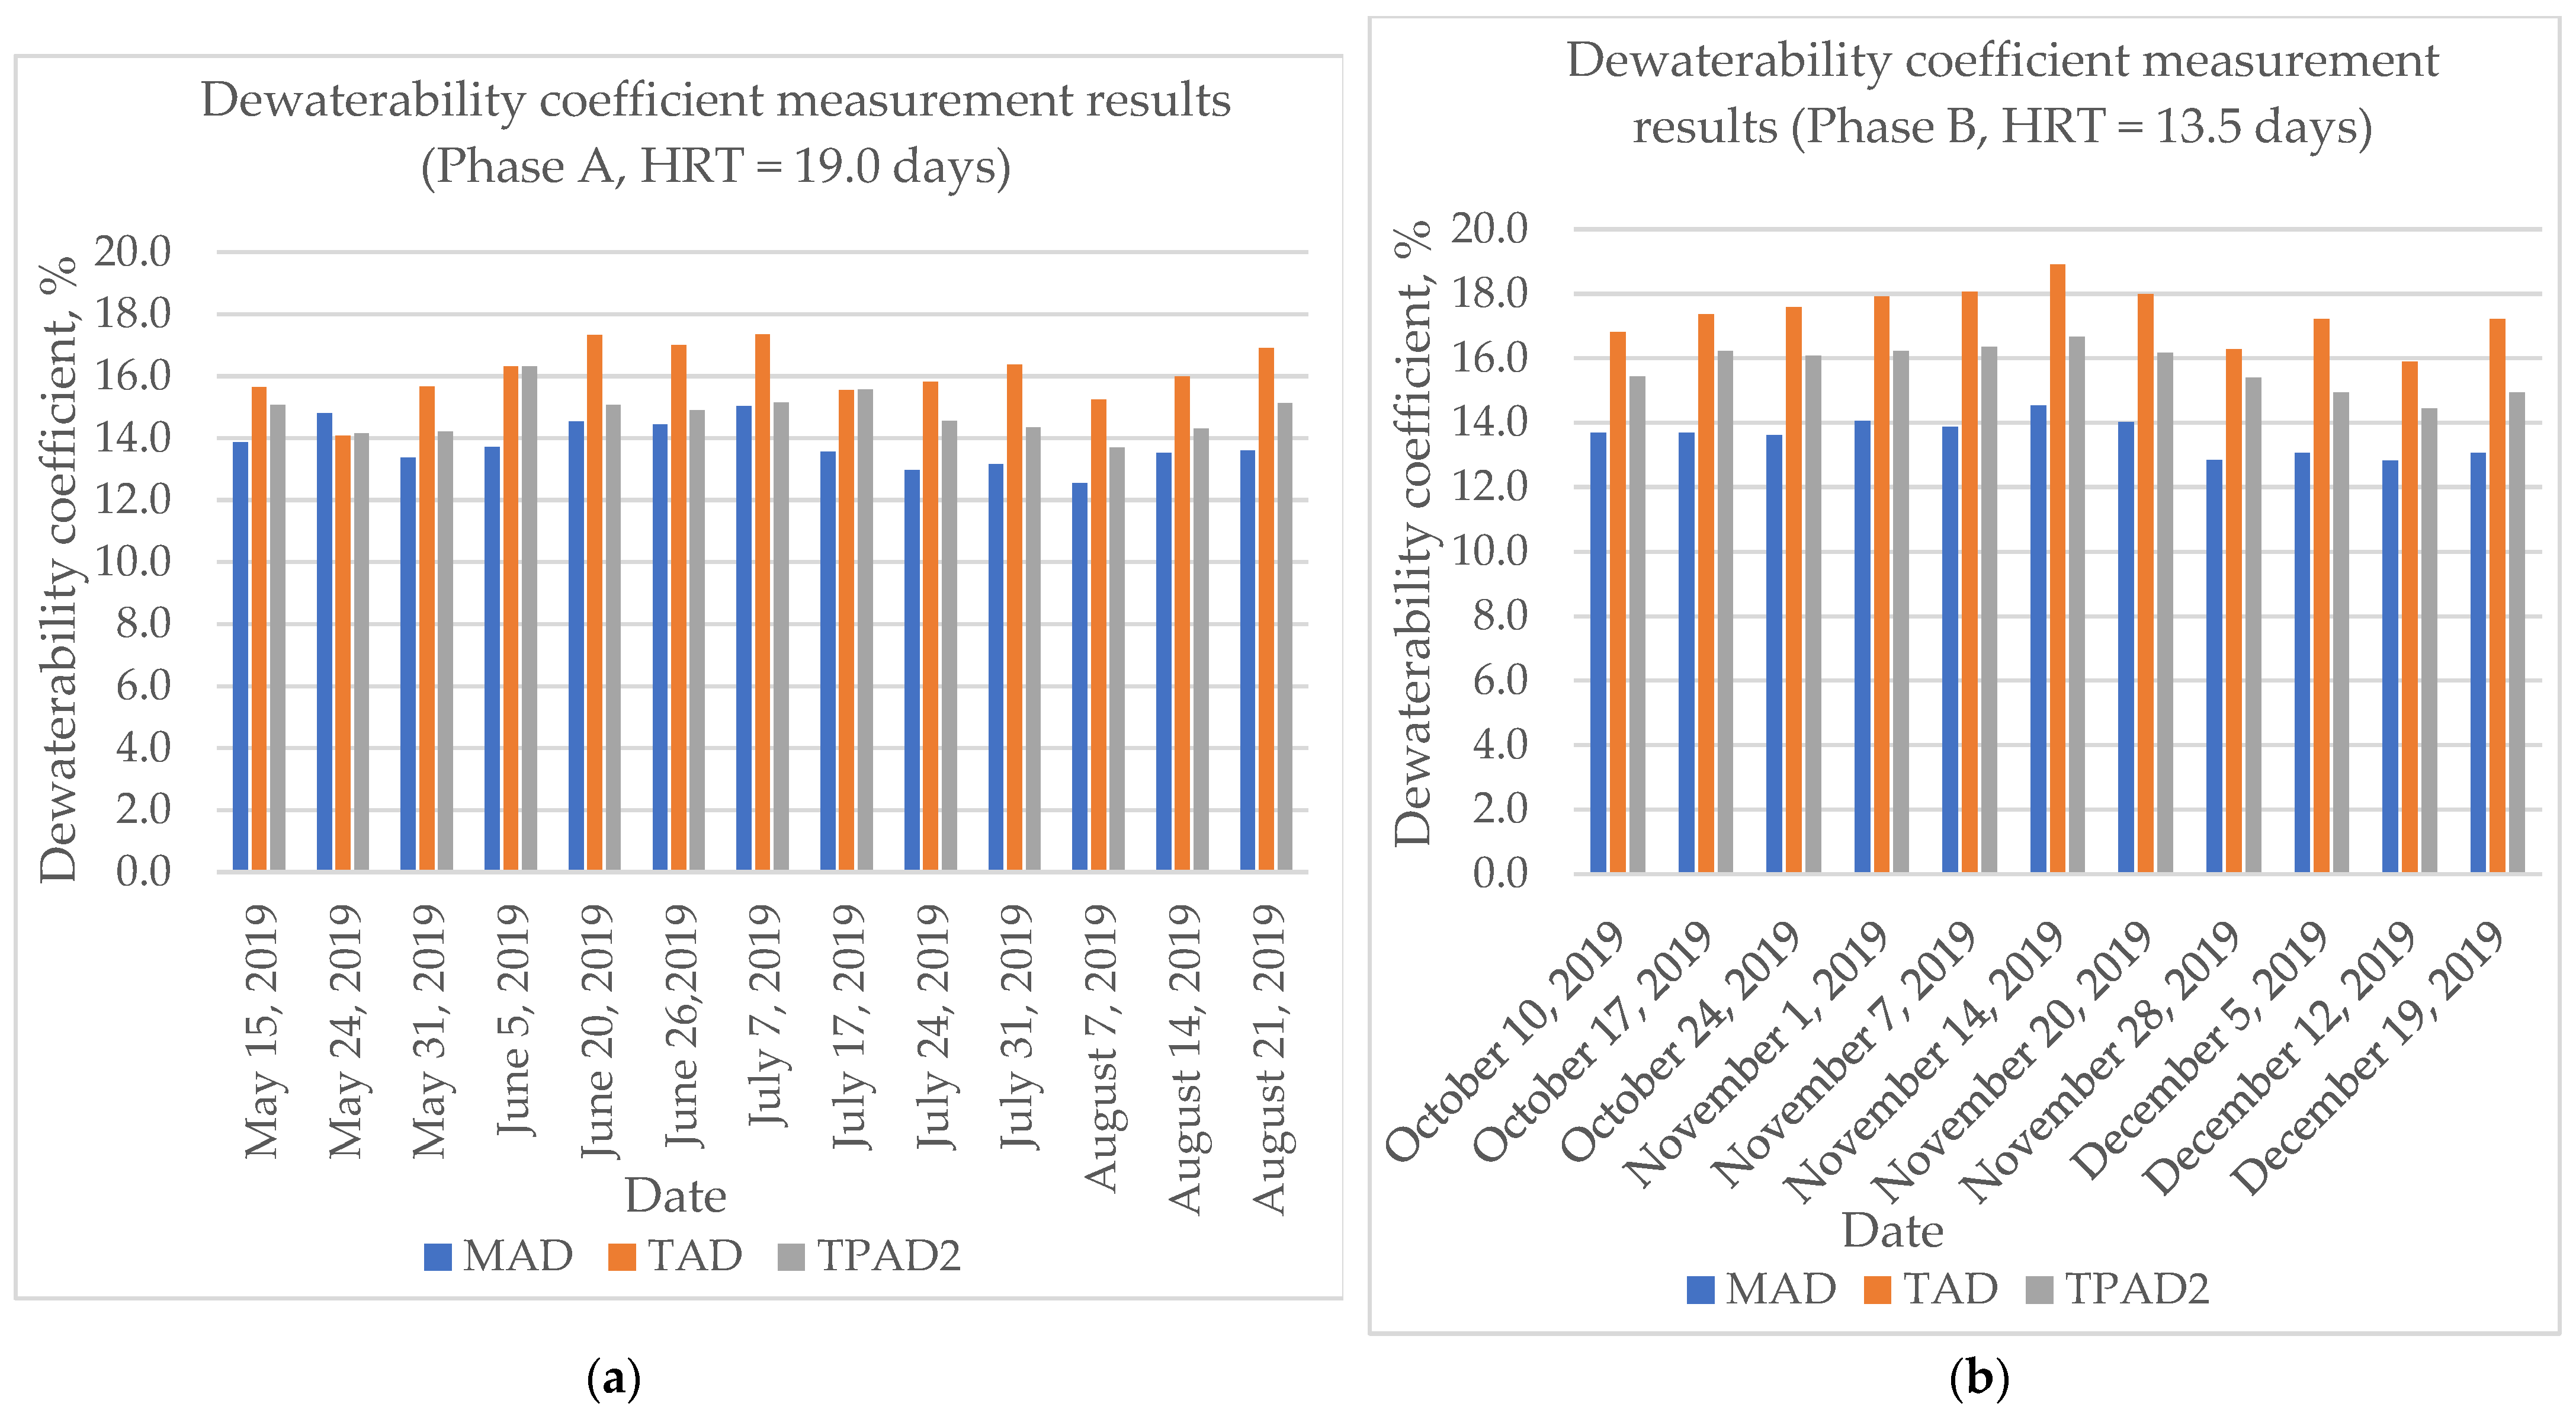
3.2.1. Centrifugation

The dewaterability of the digestates from the TAD, MAD and TPAD systems was determined by means of a dewaterability coefficient, which allowed for us to assess the concentration of dry matter in a dewatered digestate sample. Thus, the higher dewaterability coefficient, the better dewatering efficiency (Table 6, Figure 4).
It was found that the difference among dewaterability coefficients was relatively small, but still statistically significant among all types of AD systems at both Phases. Hence, the best dewaterability was determined for the digestate from TAD, followed by TPAD and MAD. Furthermore, decreasing the HRT from 19 to 13.5 days did not decrease the dewaterability; in fact, it was slightly increased for TAD and TPAD.
Specifically, at 19 days of HRT, the digestates’ dewaterability was 13.8%, 14.8% and 16.1% for the MAD, TPAD and TAD (Figure 4a), respectively; while, at 13.5 days of HRT, the digestates dewaterability was 13.6%, 15.7% and 17.4% for the MAD, TPAD and TAD (Figure 4b), respectively (Table 6). Therefore, the dewaterability of TAD was 9.8% and 8.1% higher than TPAD at 19 and 13.5 days of HRT, respectively, while the dewaterability of TAD was 21.8% and 14.3% higher than MAD at 19 and 13.5 days of HRT, respectively.
Hence, despite just a slight effect of the HRT change from 13.5 to 19 days on all types of AD digestate dewaterability, the digestate from TAD showed, continuously, a better performance concerning the ability to “lose” water under the centrifugal forces. The worst quality of digestate after MAD can be explained by a lower degradability of the sludge in terms of VSS (Table 2).

3.2.2. Mechanical Pressing

To the best of our knowledge, the sludge cake concentrations obtained by the mechanical pressing method was in good agreement with the range of results generally achieved in full-scale wastewater treatment plants [47,48]. The ratio between the wet sample and dry cake weight showed how much the digestate could be dewatered. The results of mechanical pressing are depicted in Table 7.
In agreement with centrifugation results, the digestate dewaterability did not decrease with HRT. In fact, it was slightly improved after decreasing the HRT from 19 to 13.5 days (Table 7). In addition, the optimal dose of flocculant was slightly lower at the shorter HRT: 35 vs. 30–23.5 g/kgTS for 19 and 13.5 days of HRT, respectively. However, statistically, the obtained results turned out to be insignificant.
The results of different dewaterability measurement methods were quite different, which went along with the literature [31]. However, the trend was similar to another study where TAD-digested sludge showed a better ability to be dewatered and demanded a higher flocculant consumption [49].
The way dewaterability influences the final disposal is straightforward: it is always better when it is as high as possible as by removing the contained water, the sludge reduces in volume, which is beneficial, at least in transportation expenses and any following final disposal starting from old-fashioned landfilling and heading to its reuse in road construction via incineration or direct usage in agriculture [10,29,32].

3.3. Elemental Analysis and Lower Calorific Value

The digested sludge quality was also characterized by the elemental analysis (Table 8).
Furthermore, the lower calorific value was calculated according to the literature [34] and assessed with respect to the initial value of the substrate LCV (Table 9).
During the AD process, part of the substrate organic matter content was biodegraded and converted into methane; thus, reducing the lower energy content of the sludge, here determined by the LCV [50]. The highest LCV decrease was observed in TPAD (around 19% with HRT of 19 days), which supported the highest rate of organics transformation into biogas. In addition, according to the statistical ANOVA test, it was assessed that the obtained LCV data were significantly different only at Phase A (HRT = 19.0 days) and in between TAD–TPAD and MAD–TPAD. This went along with the data on the VS removal rate (Table 2): 32.4% of VS removal at TPAD against 27.2% at TAD and 26.0% at MAD. The same trend was observed regarding the methane production (Table 4): 233.1 mL/g CODadded at TPAD vs. 169.4 mL/g CODadded at TAD and 156.0 mL/g CODadded at MAD. Which brings us to interesting hypotheses: (1) the longer the HRT, the bigger the difference among the introduced AD systems; (2) the longer the HRT, the bigger the difference between single- and double-stage AD systems.
Considering the sludge cake concentration presented in Table 9, it can be stated that, despite the leftover water content, the real calorific value (related to the wet sludge cake after dewatering) remained quite high, which is important especially when thermal treatment is applied as the final treatment process. As it is known, according to Tanner’s triangle, the autothermic process of combustion is highly dependent of the fuel LCV and possible unless the LCV of the digestate is lower than 50% of the loss in the LCV [51].
It was reported that an elemental analysis of the sludge can also be used for the prediction of the dewatered sludge cake TSS concentration [31]. The results depicted in Table 10 had a certain extent of correlation with the solids content of digestate samples after mechanical pressing, shown in Table 7.
It was noted that at Phase A (HRT = 19.0 days), the correlation coefficient was around 1.0 for all AD systems. At Phase B (HRT = 13.5 days), the correlation coefficient was approximately 20% lower than for the correspondent AD system. It showed that, at a longer HRT, the theoretically calculated prognosis on sludge cake solids concentration was closer (±10%) to the experimental results of the dewatering process by mechanical pressing than at the shorter HRT (lower by 20–30%, on average). This means that at HRTs shorter than 19.0 days, the calculated results on sludge dewaterability properties and based on EA should be verified by laboratory experiments. There might be obtained actual results better than anticipated by theoretical calculations.

3.4. Hygienisation Efficiency Assessment

It is known that sewage sludge contains different types of pathogens, including eggs of parasitic worms, bacteria and viruses. AD is one of the effective methods for the reduction in pathogens to allow the safe application of digested sludge for agriculture [4]. However, depending on the temperature regime, the results of hygienisation may vary: after MAD, the digestate did not meet the requirements that would permit to apply the digestate as a fertilizer to soil; meanwhile, after TAD, the digestate possessed higher pathogenic safety results [52]. Thus, normally, the TAD digestate meets the requirements of Class A biosolids, which are not feasible for MAD [53].
Microbiological analyses were performed to evaluate the potential of digestate to be applied on agricultural fields, directly or after a post-treatment step, which is one of the final disposal applications of digestate [3] (Table 11).
Table 11 shows that both digestion systems using thermophilic conditions outperformed the mesophilic one. Concerning the mesophilic conditions, the reduction in pathogenic bacteria was less efficient. Decreasing the HRT from 19 to 13.5 days did not impair the pathogenic safety in all evaluated AD systems, since the results could be even better.
The statistics revealed that the only significant difference in microbiological tests was observed for Phase A with 19.0 days of HRT regarding two microbiological parameters of coliforms and Escherichia coli, and only in relation to TAD and TPAD towards MAD. The difference between TAD and TPAD was insignificant. TPAD achieved only slightly worse results in comparison with TAD; however, the hygienisation was sufficient for the application of digested sludge to soil, only in the case of Phase A with 19.0 days of HRT. It was also noticed that, though the first stage of TPAD under thermophilic conditions showed a number of coliforms and Escherichia coli below the detection level, after changing to mesophilic conditions in the second stage, they appeared again, which might be of concern when defining the HRT of each stage of the double-stage AD system. However, in the TAD digestate, as well as in the TPAD digestate, pathogens were present in significantly lower amounts than after the MAD process. This went along with the results obtained by [49], which stated that after 2 days of the fermenter HRT under thermophilic conditions, some pathogens were not detected, and after 3 days of the fermenter HRT, Escherichia coli was completely deactivated. The assured pathogenic safety of TAD-digested sludge and the sludge obtained after the TPAD system with an HRT of the fermenter being long enough for the full deactivation of faecal indicators, allows for the sludge to be directly used in agriculture [5].

3.5. Comparison of Results

All the data obtained were evaluated and placed into Table 12 for a better assessment.
When considering Table 12, all the measured parameters can be split into five groups (for Phases A and B altogether, as there was a negligible difference between the Phases): (1) organic matter degradation efficiency and methane production; (2) process stability (VFA content); (3) sludge quality (dewaterability); (4) final disposal as a fuel (LCV); (5) final disposal as a fertilizer (microbiological parameters). An additional 6th group was assessed for Phase A only—(6) environmental burden (LCA)—, as the LCA was performed only at an HRT of 19 days [2]. The results are depicted in Table 13.
Based on Table 13, it can be stated that at both Phases and, correspondently, at both HRTs of 19 and 13.5 days, TAD outperformed. Additionally, the included LCA estimation [2] allowed TAD to obtain more “points” and improve the final mark from 1.40 to 1.33. The difference, according to the five-group-parameter averages, TAD obtained a 0.2-point advantage over TPAD, and TPAD obtained a 0.6-point advantage over MAD, which resulted in a difference between TAD and MAD of up to 0.8. Looking at the six-group average values, it can be claimed that the results were even more improved for TAD and worsened for TPAD and MAD. The TAD advantage over TPAD grew up to 0.34 points, and the TPAD advantage went up to 0.66 points; the overall difference between TAD and MAD went up to 1.0.
It is important to mention that Table 13 represents quite a rough estimation, as only the main characteristics of the AD process were compared. In addition, each characteristic of AD had a different value economically—and ecologically—wise, which has to be considered when making a choice of AD systems for implementation at each WWTP individually. Hence, a bigger number of groups could be presented, and, in its turn, each group (including the introduced ones) could contain more AD parameters. Nevertheless, it gave a good overview of single—and double—stage AD systems according to main process characteristics specifically grouped according to the total AD efficiency, its stability, digestate quality and its possible final disposal.
The obtained data can be compared with the data published earlier—Table 14.
In addition to Table 14 data, it is needed to mention that [41,54,55] stated that the TPAD process with 15 days of HRT outperforms any of the single-stage systems in terms of dewaterability, though there are still many unsettled issues about the sludge dewaterability measurement and assessment [32]. The same was valid concerning pathogenic safety, with the only exceptional requirement of a minimum HRT of the 1st stage, which should be equal to 3 days. Hence, these studies indicate that TPAD seems to be the most beneficial alternative among other AD systems at a short HRT, similarly as in the presented study.

4. Conclusions

Based on the results obtained in this study, the following conclusions can be drawn:
  • Organic matter removal and methane production experimental data clearly showed that TPAD obtained the best results, followed by TAD and, finally, by MAD.
  • Regarding the dewaterability, the results varied depending on the physical mechanism of the dewatering test. By centrifugation without flocculant addition, the highest dewaterability was obtained by TAD, which was 8.1% and 9.8% higher than TPAD and 14.3% and 21% higher than MAD during both HRTs (13.5 and 19.0 days, respectively). The mechanical pressing results showed the statistical insignificance among the AD systems.
  • The calorific value of the sludge was reduced by 19.2% after TPAD at Phase A with an HRT of 19 days, which was the only statistically significant difference between TPAD and TAD/MAD. At Phase B with an HRT of 13.5, none of the AD systems showed any statistical difference in relation to the other ad systems.
  • The deactivation of pathogens was proven for the TAD digestate regardless of the HRT, but not for the MAD digestate, while TPAD showed different results depending on the HRT. It seems that the HRT of the first stage of TPAD is crucial in relation to the TPAD digestate’s pathogenic safety. Hence, the possibility of using the TPAD digestate directly for agricultural purposes might still be a concern.
To sum up the digested quality evaluation, several sludge properties were quantified and compared to aggregate data for making a decision about the suitability of different sludge types for different sludge valorisation routes. It was shown that the TAD digestate can be applied directly in agriculture, while the TPAD digestate might also be used as a fertilizer successfully, depending on the fermenter HRT assuring pathogenic safety. With the highest absolute value of LCV (for dry sludge), MAD was the best for being used as a fuel, preserving a higher portion of organic matter not transformed into biogas, but losing this advantage due to the worst dewaterability in comparison with TAD and TPAD. In terms of the environmental burden, TAD turned out to be the most environmentally friendly one, followed by TPAD and MAD.
In agreement with other studies, it can be stated that the double-stage TPAD system was the most beneficial AD system among the others, allowing a flexible sludge valorisation in different ways. However, its output is highly dependent on: (1) the AD substrate and its characteristics; (2) properly selected operating parameters such as the temperature regime, HRT and OLR.

Author Contributions

Conceptualization, P.J. and I.F.; methodology, P.J. and I.F.; software, J.H. and I.L.; validation, P.J. and I.F.; formal analysis, I.L.; investigation, I.L.; resources, J.H., J.Ř.-A. and I.L.; data curation, I.L.; writing—original draft preparation, I.L.; writing—review and editing, J.Ř.-A., P.J. and I.F.; supervision, P.J. and I.F.; project administration, P.J.; funding acquisition, P.J. and I.F. All authors have read and agreed to the published version of the manuscript.

Funding

This research was funded by the European Union’s Horizon 2020 research and innovation programme under the Marie Skłodowska-Curie grant agreement no 676070. This communication reflects only the authors’ view and the Research Executive Agency of the EU is not responsible for any use that may be made of the information it contains.

Institutional Review Board Statement

Not applicable.

Informed Consent Statement

Not applicable.

Data Availability Statement

The data presented in the study are available upon request from the correspondent author.

Acknowledgments

I.F. is grateful to the Government of Catalonia (Consolidated Research Group 2017 SGR 1029).

Conflicts of Interest

The authors declare no conflict of interest. The funders had no role in the design of the study; in the collection, analyses, or interpretation of data; in the writing of the manuscript, or in the decision to publish the results.

Abbreviations

ADanaerobic digestion
CODchemical oxygen demand
EAelemental analysis
GCgas chromatography
HRThydraulic retention time
LCAlife cycle assessment
LCVlower calorific value
MADmesophilic anaerobic digestion
OLRorganic loading rate
PEpeople equivalent
SL-LCAlife cycle assessment of each AD system analysed separately as an AD system only with the functional unit of 1 m3 of produced methane
sCODsoluble chemical oxygen demand
tCODtotal chemical oxygen demand
TADthermophilic anaerobic digestion
TPADtemperature-phased anaerobic digestion
TPAD1the first stage (fermenter) of TPAD
TPAD2the second stage of TPAD
TStotal solids
TSStotal suspended solids
Vreactor working volume
VFAvolatile fatty acid
VSvolatile solids
VSSvolatile suspended solids
WASwaste-activated sludge
WRRFwater resource recovery facility
WWTPwastewater treatment plant
WWTP-LCAlife cycle assessment of each AD system analysed separately as a part of the whole WWTP with the functional unit of 1 m3 of treated wastewater

References

  1. Zhao, G.; Garrido-Baserba, M.; Reifsnyder, S.; Xu, J.-C.; Rosso, D. Comparative energy and carbon footprint analysis of biosolids management strategies in water resource recovery facilities. Sci. Total Environ. 2019, 665, 762–773. [Google Scholar] [CrossRef]
  2. Lanko, I.; Flores, L.; Garfí, M.; Todt, V.; Posada, J.A.; Jenicek, P.; Ferrer, I. Life Cycle Assessment of the mesophilic, thermophilic, and temperature-phased anaerobic digestion of sewage sludge. Water 2020, 12, 3140. [Google Scholar] [CrossRef]
  3. Kominko, H.; Gorazda, K.; Wzorek, Z. Potentiality of sewage sludge-based organo-mineral fertilizer production in Poland considering nutrient value, heavy metal content and phytotoxicity for rapeseed crops. J. Environ. Manag. 2019, 248, 109283. [Google Scholar] [CrossRef] [PubMed]
  4. Pauline, A.L.; Joseph, K. Hydrothermal carbonization of oily sludge for solid fuel recovery – investigation of chemical characteristics and combustion behaviour. J. Anal. Appl. Pyrolysis 2021, 157, 105235. [Google Scholar] [CrossRef]
  5. Seleiman, M.F.; Santanen, A.; Mäkelä, P.S.A. Recycling sludge on cropland as fertilizer – Advantages and risks. Resour. Conserv. Recycl. 2020, 155, 104647. [Google Scholar] [CrossRef]
  6. Chen, T.; Qiu, X.; Feng, H.; Yin, J.; Shen, D. Solid digestate disposal strategies to reduce the environmental impact and energy consumption of food waste-based biogas systems. Bioresour. Technol. 2021, 325, 124706. [Google Scholar] [CrossRef]
  7. Neczaj, E.; Grosser, A. 31—Biogas production by thermal hydrolysis and thermophilic anaerobic digestion of waste-activated sludge. Ind. Munic. Sludge 2019, 741–781. [Google Scholar] [CrossRef]
  8. Ferrer, I.; Vazquez, F.; Font, X. Long term operation of a thermophilic anaerobic reactor: Process stability and efficiency at decreasing sludge retention time. Bioresour. Technol. 2010, 101, 2972–2980. [Google Scholar] [CrossRef] [PubMed] [Green Version]
  9. Markis, F.; Baudez, J.-C.; Parthasarathy, R.; Slatter, P.; Eshtiaghi, N. The apparent viscosity and yield stress of mixtures of primary and secondary sludge: Impact of volume fraction of secondary sludge and total solids concentration. Chem. Eng. J. 2016, 288, 577–587. [Google Scholar] [CrossRef]
  10. Liu, H.; Li, X.; Zhang, Z.; Nghiem, L.D.; Gao, L.; Wang, Q. Semi-continuous anaerobic digestion of secondary sludge with free ammonia pretreatment: Focusing on volatile solids destruction, dewaterability, pathogen removal and ist implications. Water Res. 2021, 202, 117481. [Google Scholar] [CrossRef]
  11. Jiang, X.; Lyu, Q.; Bi, L.; Xie, Y.; Ji, G.; Huan, C.; Xu, L.; Yan, Z. Improvement of sewage sludge anaerobic digestion through synergistic effect combined trace elements enhancer with enzyme pretreatment and microbial community response. Chemosphere 2022, 286, 131356. [Google Scholar] [CrossRef] [PubMed]
  12. Micolucci, F.; Gottardo, M.; Pavan, P.; Cavinato, C.; Bolzonella, D. Pilot scale comparison of single and double-stage thermophilic anaerobic digestion of food waste. J. Clean. Prod. 2018, 171, 1376–1385. [Google Scholar] [CrossRef]
  13. Chen, Y.; Jiang, S.; Yuan, H.; Zhou, Q.; Gu, G. Hydrolysis and acidification of waste activated sludge at different pHs. Water Res. 2007, 41, 683–689. [Google Scholar] [CrossRef] [PubMed]
  14. Wan, J.; Jing, Y.; Zhang, S.; Angelidaki, I.; Luo, G. Mesophilic and thermophilic alkaline fermentation of waste activated sludge for hydrogen production: Focusing on homoacetogenesis. Water Res. 2016, 102, 524–532. [Google Scholar] [CrossRef] [PubMed]
  15. Wu, S.-L.; Wei, W.; Ni, B.-J. Enhanced methane production from anaerobic digestion of waste activated sludge through preliminary pretreatment using calcium hypochlorite. J. Environ. Manag. 2021, 295, 113346. [Google Scholar] [CrossRef] [PubMed]
  16. Liang, Z.; Shen, N.; Lu, C.; Chen, Y.; Guan, Y. Effective methane production from waste activated sludge in anaerobic digestion via formic acid pretreatment. Biomass Bioenergy 2021, 151, 106176. [Google Scholar] [CrossRef]
  17. Qasim, S.R. Wastewater Treatment Plants: Planning, Design, and Operation, 2nd ed.; Routledge: Boca Raton, FL, USA, 1999. [Google Scholar] [CrossRef]
  18. Lin, R.; Cheng, J.; Ding, L.; Murphy, J.D. Improved efficiency of anaerobic digestion through direct interspecies electron transfer at mesophilic and thermophilic temperature ranges. Chem. Eng. J. 2018, 350, 681–691. [Google Scholar] [CrossRef]
  19. Ruffino, B.; Campo, G.; Cerutti, A.; Scibilia, G.; Lorenzi, E.; Zanetti, M. Comparative analysis between a conventional and a temperature-phased anaerobic digestion system: Monitoring of the process, resources transformation and energy balance. Energy Convers. Manag. 2020, 223, 113463. [Google Scholar] [CrossRef]
  20. Li, X.; Guo, S.; Peng, Y.; He, Y.; Wang, S.; Li, L.; Yhao, M. Anaerobic digestion using ultrasound as pretreatment approach: Changes in waste activated sludge, anaerobic digestion performances and digestive microbial populations. Biochem. Eng. J. 2018, 139, 139–145. [Google Scholar] [CrossRef]
  21. Oles, J.; Dichtl, N.; Niehoff, H. Full scale experience of two stage thermophilic/mesophilic sludge digestion. Water Sci. Technol. 1997, 36, 449–456. [Google Scholar] [CrossRef]
  22. Qin, Y.; Higashimori, A.; Wu, L.-J.; Hojo, T.; Kubota, K.; Li, Y.-Y. Phase separation and microbial distribution in the hyperthermophilic-meso-type temperature-phased anaerobic digestion (TPAD) of waste activated sludge (WAS). Bioresour. Technol. 2017, 245, 401–410. [Google Scholar] [CrossRef]
  23. Ma, D.; Li, A.; Zhang, L.; Wang, D.; Ji, G. Mechanical compression assisted conductive drying of thin-film dewatered sewage sludge: Process performance, heat and mass transfer behavior. Waste Manag. 2021, 126, 41–51. [Google Scholar] [CrossRef]
  24. Sakarika, M.; Stavropoulos, K.; Kopsahelis, A.; Koutra, E.; Zafiri, C.; Kornaros, M. Two-stage anaerobic digestion harnesses more energy from the co-digestion of end-of-life dairy products with agro-industrial waste compared to the single-stage process. Biochem. Eng. J. 2020, 153, 107404. [Google Scholar] [CrossRef]
  25. Nguyen, P.-D.; Truong Tran, N.-S.; Nguyen, T.-T.; Dang, B.-T.; Thi Le, M.-T.; Bui, X.-T.; Mukai, F.; Kobayashi, H.; Ngo, H.-H. Long-term operation of the pilot scale two-stage anaerobic digestion of municipal biowaste in Ho Chi Minh City. Sci. Total Environ. 2021, 766, 142562. [Google Scholar] [CrossRef]
  26. Shi, Z.; Zhao, R.; Wan, J.; Li, B.; Shen, Y.; Zhang, S.; Luo, G. Metagenomic analysis reveals the fate of antibiotic resistance genes in two-stage and one-stage anaerobic digestion of waste activated sludge. J. Hazard. Mater. 2021, 406, 124595. [Google Scholar] [CrossRef]
  27. Yuan, D.; Wang, Y.; Qian, X. Variations of internal structure and moisture distribution in activated sludge with stratified extracellular polymeric substances extraction. Water ResearcInternational Biodeterior. Biodegrad. 2017, 116, 1–9. [Google Scholar] [CrossRef]
  28. Zhang, W.; Xu, Y.; Dong, B.; Dai, X. Characterizing the sludge moisture distribution during anaerobic digestion process through various approaches. Sci. Total Environ. 2019, 675, 184–191. [Google Scholar] [CrossRef] [PubMed]
  29. Wei, H.; Gao, B.; Ren, J.; Li, A.; Yang, H. Coagulation/flocculation in dewatering of sludge: A review. Water Res. 2018, 143, 608–631. [Google Scholar] [CrossRef]
  30. Abu-Orf, M.M.; Dentel, S.K. Effect of mixing on the rheological characteristics of conditioned sludge: Full-scale studies. Water Sci. Technol. 1997, 36, 51–60. [Google Scholar] [CrossRef]
  31. Svennevik, O.K.; Beck, G.; Rus, E.; Westereng, B.; Higgins, M.; Solheim, O.E.; Nilsen, P.J.; Horn, S.J. CNash-A novel parameter predicting cake solids of dewatered digestates. Water Res. 2019, 158, 350–358. [Google Scholar] [CrossRef] [PubMed]
  32. Wu, B.; Dai, X.; Chai, X. Critical review on dewatering of sewage sludge: Influential mechanism, conditioning technologies and implications to sludge re-utilizations. Water Res. 2020, 180, 115912. [Google Scholar] [CrossRef]
  33. Astals, S.; Venegas, C.; Peces, M.; Jofre, J.; Lucena, F.; Mata-Alvarez, J. Balancing hygienization and anaerobic digestion of raw sewage sludge. Water Res. 2012, 46, 6218–6227. [Google Scholar] [CrossRef] [PubMed]
  34. Nzihou, J.F.; Hamidou, S.; Bouda, M.; Koulidiati, J.; Segda, B.G. Using Dulong and Vandralek formulas to estimate the calorific heating value of a household waste model. Int. J. Sci. Eng. Res. 2014, 5, 1878–1883. [Google Scholar]
  35. Technical Committee CEN/TC 230 “Water Analysis”. ISO 6222: 1999 Water Quality—Enumeration of Culturable Micro-Organisms—Colony Count by Inoculation in a Nutrient Agar Culture Medium; ISO (The International Organization for Standardization): Geneva, Switzerland, 1999. [Google Scholar]
  36. Technická Normalizační Komise. ČSN 75 7835 (757835): 2009 Jakost Vod—Stanovení Termotolerantních Koliformních Bakterií a Escherichia coli [Water Quality—Enumeration of Thermotolerant Coliform Bacteria and Escherichia coli]; Úřad pro Technickou Normalizaci, Metrologii a Státní Zkušebnictví: Prague, Czech Republic, 2009. [Google Scholar]
  37. Technická Normalizační Komise. ČSN 75 7837 (757837): 2010 Jakost Vod—Stanovení Koliformních Bakterií v Nedesinfikovaných Vodách [Water Quality—Enumeration of Coliform Bacteria in Non-Disinficated Waters]; Úřad pro Technickou Normalizaci, Metrologii a Státní Zkušebnictví: Prague, Czech Republic, 2010. [Google Scholar]
  38. EU, C.D. 98/83/EC of Council of 3rd of November 1998 on the quality of water intended for human consumption. Off. J. Eur. Commun. 1998, L330, 32–54. [Google Scholar]
  39. APHA. Standard Methods for the Examination of Water and Wastewater, 22rd ed.; Rice, E.W., Baird, R.B., Eaton, A.D., Clesceri, L.S., Eds.; American Public Health Association (APHA): Washington, DC, USA; American Water Works Association (AWWA): Denver, FL, USA; Water Environment Federation (WEF): Chicago, IL, USA, 2012. [Google Scholar]
  40. Ge, H.; Jensen, P.D.; Batstone, D.J. Increased temperature in the thermophilic stage in temperature phased anaerobic digestion (TPAD) improves degradability of waste activated sludge. J. Hazard. Mater. 2020, 187, 355–361. [Google Scholar] [CrossRef] [PubMed]
  41. Fernández-Rodríguez, J.; Pérez, M.; Romero, L.I. Semicontinuous Temperature-Phased Anaerobic Digestion (TPAD) of Organic Fraction of Municipal Solid Waste (OFMSW). Comparison with single-stage processes. Chem. Eng. J. 2016, 285, 409–416. [Google Scholar] [CrossRef]
  42. Amodeo, C.; Hattou, S.; Buffier, P.; Benbelkacem, H. Temperature phased anaerobic digestion (TPAD) of organic fraction of municipal solid waste (OFMSW) and digested sludge (DS): Effect of different hydrolysis conditions. Waste Manag. 2021, 126, 21–29. [Google Scholar] [CrossRef] [PubMed]
  43. Cao, Z.; Hülsemann, B.; Wüst, D.; Illi, L.; Oechsner, H.; Kruse, A. Valorization of maize silage digestate from two-stage anaerobic digestion by hydrothermal carbonization. Energy Convers. Manag. 2020, 222, 113218. [Google Scholar] [CrossRef]
  44. Weimer, P.J. Manipulating ruminal fermentation: A microbial ecological perspective. J. Anim. Sci. 1998, 76, 3114–3122. [Google Scholar] [CrossRef]
  45. Xiao, B.; Qin, Y.; Zhang, W.; Wu, J.; Qiang, H.; Liu, J.; Li, Y.-Y. Temperature-phased anaerobic digestion of food waste: A comparison with single-stage digestions based on performance and energy balance. Bioresour. Technol. 2018, 249, 826–834. [Google Scholar] [CrossRef]
  46. Wu, L.-L.; Kobayashi, T.; Li, Y.-Y.; Xu, K.-Q. Comparison of single-stage and temperature-phased two-stage anaerobic digestion of oily food waste. Energy Convers. Manag. 2015, 106, 1174–1182. [Google Scholar] [CrossRef]
  47. Toutian, V.; Barjenbruch, M.; Loderer, C.; Remy, C. Pilot study of thermal alkaline pretreatment of waste activated sludge: Seasonal effects on anaerobic digestion and impact on dewaterability and refractory COD. Water Res. 2020, 182, 115910. [Google Scholar] [CrossRef]
  48. Cai, Y.; Zheng, Z.; Wang, X. Obstacles faced by methanogenic archaea originating from substrate-driven toxicants in anaerobic digestion. J. Hazard. Mater. 2021, 403, 123938. [Google Scholar] [CrossRef]
  49. Lloret, E.; Pastor, L.; Pradas, P.; Pascual, J.A. Semi full-scale thermophilic anaerobic digestion (TAnD) for advanced treatment of sewage sludge: Stabilization process and pathogen reduction. Chem. Eng. J. 2013, 232, 42–50. [Google Scholar] [CrossRef]
  50. Menon, U.; Suresh, N.; George, G.; Ealias, A.M.; Saravanakumar, M.P. A study on combined effect of Fenton and Free Nitrous Acid treatment on sludge dewaterability with ultrasonic assistance: Preliminary investigation on improved calorific value. Chem. Eng. J. 2020, 382, 123035. [Google Scholar] [CrossRef]
  51. Flaga, A. The aspects of sludge thermal utilization. In Conference Paper; Institute of Heat Engineering and Air Protection, Cracow University of Technology: Cracow, Poland, 2010. [Google Scholar]
  52. Hupfauf, S.; Winkler, A.; Wagner, A.O.; Podmirseg, S.M.; Insam, H. Biomethanation at 45 °C offers high process efficiency and supports hygienisation. Bioresour. Technol. 2020, 300, 122671. [Google Scholar] [CrossRef]
  53. Fu, B.; Wang, Y.; Liu, H.; Chen, Y.; Jiang, Q.; Liu, H. Balancing energy production and pathogen removal during temperature phased anaerobic digestion of sewage sludge. Fresenius Environ. Bull. 2014, 23, 1643–1649. [Google Scholar]
  54. Riau, V.; Angeles De La Rubia, M.; Perez, M. Temperature-phased anaerobic digestion (TPAD) to obtain class A biosolids: A semi-continuous study. Bioresour. Technol. 2010, 101, 2706–2712. [Google Scholar] [CrossRef] [PubMed]
  55. Nabaterega, R.; Kumar, V.; Khoei, S.; Eskicioglu, C. A review on two-stage anaerobic digestion options for optimizing municipal wastewater sludge treatment process. J. Environ. Chem. Eng. 2021, 9, 105502. [Google Scholar] [CrossRef]
Figure 1. Scheme (a) and picture (b) of lab-scale experimental set-up.
Water 13 02839 g001
Figure 2. Laboratory mini-press (Mareco MMP-3/2).
Water 13 02839 g002
Figure 3. Digestate dewatering by mechanical pressing: (a) digestate with flocculant dosage; (b) mixing at 700 rpm for 3 min; (c) dewatered digestate.
Water 13 02839 g003
Figure 4. Dewaterability coefficient at Phase A (a) and at Phase B (b).
Water 13 02839 g004
Table 1. Anaerobic digestion operational parameters.
Type of ReactorAbbreviationPhase A, Lasting 5 MonthsPhase B, Lasting 3 MonthsPhase A and Phase B
HRT, DaysTemperature Range, °CHRT, DaysTemperature Range, °CMixing Speed, rpm **
Single-stage, thermophilicTAD19.057 ± 1.5 °C13.557 ± 1.0 °C *50 ± 1
Single-stage, mesophilicMAD19.038 ± 1.5 °C13.538 ± 1.0 °C *50 ± 1
Double-stage, thermophilic, the first stageTPAD12.057 ± 1.5 °C2.057 ± 1.0 °C *30 ± 1
Double-stage, mesophilic, the second stageTPAD217.038 ± 1.5 °C11.538 ± 1.0 °C *50 ± 1
* Footnote 1. All digesters at Phase B were insulated to decrease temperature fluctuation. ** Footnote 2. All digesters were continuously mixed at the fixed speed. Footnote 3. TAD—thermophilic anaerobic digestion; MAD—mesophilic anaerobic digestion; TPAD—temperature-phased anaerobic digestion; TPAD1—the first stage of TPAD; TPAD2—the second stage of TPAD; HRT—hydraulic retention time.
Table 2. Organic matter removal in the mesophilic, thermophilic and temperature-phased anaerobic digestion systems.
PhaseParameterTADMADTPAD1TPAD2Substrate
Phase A,
at HRT =
19.0 days
Digestate VS, g/L30.8 ± 1.731.3 ± 2.635.4 ± 4.128.6 ± 1.042.3 ± 4.1
VS removal, %27.226.016.332.4-
Digestate VSS, g/L21.0 ± 1.825.2 ± 2.628.0 ± 3.022.2 ± 1.737.5 ± 3.4
VSS removal, %44.032.825.340.8-
Phase B,
at HRT =
13.5 days
Digestate VS, g/L32.6 ± 0.932.0 ± 0.735.6 ± 1.030.1 ± 0.546.5 ± 0.6
VS removal, %22.924.315.828.8-
Digestate VSS, g/L21.6 ± 1.223.7 ± 0.727.6 ± 0.620.8 ± 0.842.2 ± 2.1
VSS removal, %42.936.826.444.5-
Footnote 1. VS and VSS removal in TPAD2 column express the total efficiency of the TPAD process. Footnote2. VS—volatile solids; VSS—volatile suspended solids; TAD—thermophilic anaerobic digestion; MAD—mesophilic anaerobic digestion; TPAD—temperature-phased anaerobic digestion; TPAD1—the first stage of TPAD; TPAD2—the second stage of TPAD; HRT—hydraulic retention time.
Table 3. The VFA concentration.
PhasesVFAs, mgCOD/L
TADMADTPAD1TPAD2
Phase A, HRT = 19.0 days3858.3 ± 973.1519.1 ± 184.57451.8 ± 1777.7522.4 ± 145.4
Phase B, HRT = 13.5 days4821.1 ± 195.0328.9 ± 43.27809.7 ± 534.0366.8 ± 17.9
Footnote. VFA—volatile fatty acids; TAD—thermophilic anaerobic digestion; MAD—mesophilic anaerobic digestion; TPAD—temperature-phased anaerobic digestion; TPAD1—the first stage of TPAD; TPAD2—the second stage of TPAD; HRT—hydraulic retention time.
Table 4. Specific methane production.
PhaseMethane Production, mL/g CODadded
TADMADTPAD1TPAD2TPAD
Phase A, at HRT = 19 days169.4 ± 9.2156.0 ± 9.146.1 ± 4.0186.9 ± 10.7233.1 ± 12.0
Phase B, at HRT = 13.5 days116.5 ± 12.0133.9 ± 26.440.2 ± 8.1132.0 ± 9.8172.3 ± 11.6
Footnote. COD—chemical oxygen demand; HRT—hydraulic retention time; TAD—thermophilic anaerobic digestion; MAD—mesophilic anaerobic digestion; TPAD—temperature-phased anaerobic digestion; TPAD1—the first stage of TPAD; TPAD2—the second stage of TPAD; HRT—hydraulic retention time.
Table 5. Biogas composition.
PhaseBiogas Content, %
TADMADTPAD1TPAD2
CH4CO2CH4CO2CH4CO2CH4CO2
Phase A,
at HRT = 19 days
61.7 ± 4.834.7 ± 5.066.1 ± 1.830.2 ± 3.658.9 ± 12.833.2 ± 8.470.9 ± 2.724.7 ± 2.7
Phase B,
at HRT = 13.5 days
61.7 ± 1.733.5 ± 2.364.2 ± 2.129.9 ± 1.653.4 ± 4.739.8 ± 5.071.4 ± 1.323.8 ± 0.9
Footnote. TAD—thermophilic anaerobic digestion; MAD—mesophilic anaerobic digestion; TPAD—temperature-phased anaerobic digestion; TPAD1—the first stage of TPAD; TPAD2—the second stage of TPAD; HRT—hydraulic retention time.
Table 6. Dewaterability coefficient of the digestates from MAD, TAD and TPAD reactors.
PhaseDewaterability Coefficient, %
TADMADTPAD2
Phase A, at HRT = 19 days16.1 ± 0.913.8 ± 0.714.8 ± 0.7
Phase B, at HRT = 13.5 days17.4 ± 0.913.6 ± 0.615.7 ± 0.7
Footnote. TAD—thermophilic anaerobic digestion; MAD—mesophilic anaerobic digestion; TPAD—temperature-phased anaerobic digestion; TPAD2—the second stage of TPAD; HRT—hydraulic retention time.
Table 7. The results of mechanical pressing.
PhaseParameterTADMADTPAD2
Phase A, at HRT = 19.0 daysTS of sludge cake, %25.0 ± 1.026.1 ± 3.825.6 ± 1.7
polymer dose, g/kgTS35.035.035.0
Phase B, at HRT = 13.5 daysTS of sludge cake, %30.8 ± 4.231.4 ± 2.428.7 ± 4.3
polymer dose, g/kgTS30.030.032.5
Footnote. TS—total solids; TAD—thermophilic anaerobic digestion; MAD—mesophilic anaerobic digestion; TPAD—temperature-phased anaerobic digestion; TPAD2—the second stage of TPAD; HRT—hydraulic retention time.
Table 8. The elemental composition of digested sludge (average values).
PhaseElement, %TADMADTPAD1TPAD2Substrate
Phase A,
at HRT = 19.0 days
N3.87 ± 0.054.23 ± 0.214.31 ± 0.053.83 ± 0.225.37 ± 0.13
C25.70 ± 0.2725.56 ± 0.2527.32 ± 0.7024.60 ± 0.1930.26 ± 0.50
H4.39 ± 0.144.36 ± 0.124.65 ± 0.114.29 ± 0.064.97 ± 0.19
S0.85 ± 0.020.84 ± 0.010.84 ± 0.010.88 ± 0.040.77 ± 0.01
O65.20 ± 0.4865.01 ± 0.5962.88 ± 0.8766.41 ± 0.5158.64 ± 0.82
Phase B,
at HRT = 13.5 days
N4.50 ± 0.065.18 ± 0.175.06 ± 0.074.61 ± 0.076.50 ± 0.03
C30.75 ± 0.5330.45 ± 0.3432.58 ± 0.0729.80 ± 0.5935.28 ± 0.30
H4.77 ± 0.214.74 ± 0.184.95 ± 0.234.63 ± 0.275.31 ± 0.20
S0.92 ± 0.030.98 ± 0.010.90 ± 0.030.99 ± 0.010.81 ± 0.01
O59.06 ± 0.7958.66 ± 0.2856.52 ± 0.3559.97 ± 0.8052.10 ± 0.50
Footnote. TAD—thermophilic anaerobic digestion; MAD—mesophilic anaerobic digestion; TPAD—temperature-phased anaerobic digestion; TPAD1—the first stage of TPAD; TPAD2—the second stage of TPAD; HRT—hydraulic retention time.
Table 9. Lower calorific value of the digested sludges and substrate.
PhaseTADMADTPAD1TPAD2Substrate
LCV, kJ/kgLoss in LCV, %LCV, kJ/kgLoss in LCV, %LCV, kJ/kgLoss in LCV, %LCV, kJ/kgLoss in LCV, %LCV, kJ/kgLoss in LCV, %
Phase A, at HRT = 19.0 days9157 ± 7615.49111 ± 7315.89742 ± 25110.08750 ± 6319.210,827 ± 155-
Phase B, at HRT = 13.5 days11,127 ± 9713.010,949 ± 13714.311,715 ± 298.410,793 ± 8915.612,783 ± 8.9-
Footnote. LCV—lower calorific value; TAD—thermophilic anaerobic digestion; MAD—mesophilic anaerobic digestion; TPAD—temperature-phased anaerobic digestion; TPAD1—the first stage of TPAD; TPAD2—the second stage of TPAD; HRT—hydraulic retention time.
Table 10. Sludge cake solids prediction for the digestate after AD and its correlation with mechanical pressing results.
PhaseTADMADTPADSubstrate
Cake Solids as TSS, %Correl.
Coef.
Cake Solids as TSS, %Correl.
Coef.
Cake
Solids as TSS, %
Correl.
Coef.
Cake Solids as TSS, %Correl.
Coef.
Phase A, at HRT = 19.0 days26.51.0623.80.9125.61.0020.4-
Phase B, at HRT = 13.5 days23.60.7720.60.6622.90.8016.0-
Footnote. TSS—total suspended solids; TAD—thermophilic anaerobic digestion; MAD—mesophilic anaerobic digestion; TPAD—temperature-phased anaerobic digestion; correl. coef.—correlation coefficient between the mechanical pressing results (Table 7) and sludge cake solids concentration calculated according to [31]; HRT—hydraulic retention time.
Table 11. Microbiological characterization of the digested sludge concerning the pathogenic safety.
PhaseMicrobiological ParameterWAS from the Feeding Bucket, Stored at +11.5 °CTADMADTPAD1TPAD2
Phase A,
at HRT = 19.0 days
Microorganisms cultivated at 22 °C, CFU/g *2.5 × 1062.1 × 1046.2 × 1043.7 × 1041.3 × 105
Microorganisms cultivated at 36 °C, CFU/g *1.2 × 1061.4 × 1047.4 × 1043.3 × 1049.1 × 104
COLI, CFU/g *8.2 × 10⁴<1299<138
E. coli, (CFU/g *4.9 × 10⁴<1155<1<1
CLO, CFU/g *2.3 × 1042.5 × 1031.3 × 1041.5 × 1044.8 × 103
Phase B,
at HRT = 13.5 days
Microorganisms cultivated at 22 °C, CFU/g *2.8 × 1071.4 × 1051.2 × 1064.0 × 1051.2 × 106
Microorganisms cultivated at 36 °C, CFU/g *1.2 × 1072.2 × 1059.8 × 1059.7 × 1051.7 × 106
COLI, CFU/g *3.7 × 10⁴<138<1<1
E. coli, (CFU/g *2.0 × 10³<120<1<1
CLO, CFU/g *5.0 × 1041.4 × 1031.8 × 1049.2 × 1034.9 × 103
* Footnote 1. CFU—colony-forming units; TC22 °C—total counts of culturable microorganisms at 22 °C; TC36 °C—total counts of culturable microorganisms at 36 °C; COLI—total counts of coliforms, ECOLI—total counts of Escherichia coli, CLO—total counts of Clostridium perfringens. Footnote 2. WAS—waste-activated sludge; TAD—thermophilic anaerobic digestion; MAD—mesophilic anaerobic digestion; TPAD—temperature-phased anaerobic digestion; TPAD1—the first stage of TPAD; TPAD2—the second stage of TPAD; HRT—hydraulic retention time.
Table 12. Comparison of the obtained data concerning TAD, MAD and TPAD.
PhaseParameterTADMADTPAD1TPAD2TPAD
Phase A,
at HRT = 19.0 days
VS removal, %+-ND++ND
VFA concentration, mgCOD/L+++-++ND
Methane production, mL/gCODadded++++-+++++
Dewaterability coefficient, %++-ND+ND
Polymer dose, g/kgTS--ND-ND
LCV, kJ/kg++ND-ND
Cake solids as TSS, %++-ND+ND
Microorganisms cultivated at 22 °C, CFU/g++++++-ND
Microorganisms cultivated at 36 °C, CFU/g++++++-ND
COLI, CFU/g+-++ND
E. coli, CFU/g+-++ND
CLO, CFU/g+--+ND
WWTP-LCA *+-NDND++
SL-LCA **+++NDND0
Phase B,
at HRT = 13.5 days
VS removal, %--ND+ND
VFA concentration, mgCOD/L+++-++ND
Methane production, mL/gCODadded++++-+++++
Dewaterability coefficient, %++-ND+ND
Polymer dose, g/kgTS--ND+ND
LCV, kJ/kg++ND-ND
Cake solids as TSS, %++-ND+ND
Microorganisms cultivated at 22 °C, CFU/g++-+-ND
Microorganisms cultivated at 36 °C, CFU/g++++-ND
COLI, CFU/g----ND
E. coli, CFU/g----ND
CLO, CFU/g+++-+++-
Footnote 1: “-”—the worst result of all; “+”, “++”, “+++”—relative estimation in comparison to the worst result (the more “+”, the better results compared to “-”-result); ND—no data. Footnote 2: VS—volatile solids; TS—total solids; TSS—total suspended solids; VFA—volatile fatty acids; COD—chemical oxygen demand; LCV—lower calorific value; CFU—colony-forming units; TC22 °C—total counts of culturable microorganisms at 22 °C; TC36 °C—total counts of culturable microorganisms at 36 °C; COLI—total counts of coliforms; ECOLI—total counts of Escherichia coli; CLO—total counts of Clostridium perfringens; TAD—thermophilic anaerobic digestion; MAD—mesophilic anaerobic digestion; TPAD—temperature-phased anaerobic digestion; TPAD1—the first stage of TPAD; TPAD2—the second stage of TPAD; HRT—hydraulic retention time.* Footnote 3: WWTP-LCA—life cycle assessment of each AD system analysed separately as a part of the whole WWTP with the functional unit of 1 m3 of treated wastewater (performed only for Phase A; HRT—19.0 days) [2]. ** Footnote 4: SL-LCA—life cycle assessment of each AD system analysed separately as an AD system only with the functional unit of 1 m3 of produced methane (performed only for Phase A; HRT—19.0 days) [2].
Table 13. Final comparison of TAD, MAD and TPAD.
PhaseParameterTADMADTPAD
Phases A
and B
Degradation efficiency and methane production231
Process stability (VFA content)211
Digestate quality (dewaterability)132
Final disposal as a fuel (LCV)112
Final disposal as a fertilizer (pathogen safety)132
5-group average value1.402.201.60
Phase AEnvironmental burden132
6-group average value1.332.331.67
Footnote 1: “1”—one point which relates to the best result; “2”—two points mean the middle-point result; “3”—three points mean the worst result. Footnote 2: VS—volatile solids; TS—total solids; TSS—total suspended solids; VFA—volatile fatty acids; COD—chemical oxygen demand; LCV—lower calorific value; CFU—colony-forming units; TC22 °C—total counts of culturable microorganisms at 22 °C; TC36 °C—total counts of culturable microorganisms at 36 °C; COLI—total counts of coliforms; ECOLI—total counts of Escherichia coli; CLO—total counts of Clostridium perfringens; TAD—thermophilic anaerobic digestion; MAD—mesophilic anaerobic digestion; TPAD—temperature-phased anaerobic digestion; TPAD1—the first stage of TPAD; TPAD2—the second stage of TPAD; HRT—hydraulic retention time.
Table 14. Comparison of TAD, MAD and TPAD results with other studies.
PhaseParameter TADMADTPADOther Source
Phases A
and B
Degradation efficiency as VS decrease, %Study22.9–27.226.0–32.828.8–32.4-
Other sources-24–3438–48[40]
Specific methane production, mL/gVSddedStudy168–244 *189–220 *314–413 *-
Other sources-111–185
140
370
360
[40]
[19]
Process stability as VFA content, mgCOD/LStudy3.9–4.80.3–0.50.4–0.5-
Other sources0.87 **0.16 **0.31 **[45]
Energetic value as LCV loss, kJ/kgStudy13.0–15.414.3–15.815.6–19.2-
Other sources16.24 **16.74 **16.59 **[45]
Footnote 1: VS—volatile solids; VFA—volatile fatty acids; COD—chemical oxygen demand; LCV—lower calorific value; TAD—thermophilic anaerobic digestion; MAD—mesophilic anaerobic digestion; TPAD—temperature-phased anaerobic digestion; HRT—hydraulic retention time. * Footnote 2: The average values of specific methane production were recalculated to gVSdded based on data in Table 2. ** Footnote 3: The data presented in the literature source relate to food waste, not sewage sludge.
Publisher’s Note: MDPI stays neutral with regard to jurisdictional claims in published maps and institutional affiliations.

