1. Introduction and Objective
Due to the fact that the nitrate threshold limit value for groundwater of 50 mg NO
3/L is continuously exceeded in some regions of Germany, the EU Commission already determined in 2016 that the Federal Republic of Germany had failed to take stricter and harmonized measures against water pollution by nitrates at the federal level, although Germany would have been obliged to do so according to the EU Nitrates Directive [
1] by 2012 at the latest. Due to these omissions, Germany was sued by the EU Commission in 2016 for excessively high nitrate levels in groundwater [
2], which was ruled by the European Court of Justice (CJEU) in 2018 [
3].
As the latest joint nitrate report of the Federal Ministries for Environment, Nature Conservation and Nuclear Safety and for Food and Agriculture shows, still too much nitrate leaches into groundwater, although N-reduction measures have been implemented in all federal German states [
4]. In June 2020, the Federal Republic of Germany reacted to this situation in accordance to § 13a paragraph 1 of the German Fertilization Ordinance [
5] by drafting a general administrative regulation for standardized designation of nitrate-polluted and eutrophicated areas in Germany [
6]. The Federal Council of Germany passed this administrative regulation on 18 September 2020 [
7]. By doing so, a nationwide uniform methodology for the designation of nitrate polluted areas (“red areas”), where further requirements for groundwater protection are necessary, was introduced.
For designating areas polluted with nitrate, the administrative regulation [
6] provides a three-stage procedure: starting points are the groundwater bodies that are at a poor status due to nitrate according to the Water Framework Directive [
8] or in which groundwater monitoring stations polluted with nitrate occur. In the first step, sub-areas are defined for observed nitrate concentrations in the groundwater above 50 mg NO
3/L or above 37.5 mg NO
3/L with an increasing trend.
In the second step, a site-specific assessment of the nitrate pollution risk has to be carried out for these sub-areas. This may be completed for predefined areal units, for instance, of one hectare in size or field blocks. At this, the decisive indicator is the nitrate concentration in the leachate, which indicates the nitrate concentration occurring when the leachate leaves the soil zone. For agricultural reference parcels, this nitrate concentration in the leachate is the starting point for deriving the “maximum permissible N balance surplus”, which is intended to ensure that the nitrate concentration in the leachate below the root zone does not exceed a value of 50 mg NO3/L or a value of 37.5 mg NO3/L with an increasing trend.
In the third step, the difference between the maximum permissible N-balance surplus and the current N-balance surplus is used to quantify the “agricultural N reduction requirement”, which must be met to ensure that the nitrate concentration in the leachate below the root zone does not exceed 50 mg NO3/L or a value of 37.5 mg NO3/L with an increasing trend.
The three-stage procedure described in the administrative regulation [
6] is not fundamentally new. In Germany, this procedure has already been used since 2008 to forecast and develop scenarios for the long-term achievement of the targets for groundwater and water bodies according to the specific requirements of the EU Water framework directive [
7] and the EU Groundwater Directive [
9], see [
10,
11,
12,
13,
14]. The German Working Group on Water Issues of the Federal States and the Federal Government (LAWA) has taken up this procedure and suggested to use a nitrate concentration in the leachate of 50 mg NO
3/L as a reference value that should not be exceeded [
15]. Similar aspects are considered in the groundwater protection strategies of other countries [
16,
17].
In two recently finalized R&D projects funded independently of each other on behalf of the Ministry for Climate Protection, Environment, Agriculture, Nature and Consumer Protection of North Rhine-Westphalia (NRW) [
14,
18] and the Ministry of Environment, Energy, Food and Forestry Rhineland-Palatinate (RLP), respectively, the mean long-term nitrate concentration in leachate was modelled as a basis for defining the maximum permissible N-balance surplus and deriving agricultural N-reduction requirements.
Against the background of these R&D projects and the recently adopted General Administrative Regulation [
6], which is to be implemented nationwide, this article summarizes on the one hand a procedure for simulating nitrate concentration in the leachate on a state scale. On the other hand, questions making it possible to classify the relevance and the regional plausibility of modelled nitrate concentrations in the leachate are addressed using the federal German states of North Rhine-Westphalia and Rhineland-Palatinate as example regions:
What are the values of the modelled nitrate concentration in leachate? Can “hotspot” areas where the nitrate concentrations on a long-term average are expected to exceed 50 mg NO3/L be identified?
How valid are state-wide modelled nitrate concentrations in the leachate? Are nitrate concentrations observed in groundwater monitoring stations operated by federal German states or water management associations suitable for such plausibility checks? If so, under what premises?
The working hypothesis of this paper is based on the assumption that the influencing factors that determine the nitrate concentration in leachate are adequately represented in the model if the magnitude of the modelled values corresponds spatially to the observed values in both federal states. Accordingly, it can be concluded that the modelled nitrate concentration in the leachate is a reliable indicator for the nitrate pollution of groundwater in a certain region. This again would confirm that the modelled nitrate concentrations in the leachate provide a reliable basis for both the designation of the N reduction requirements to achieve the groundwater protection objective according to LAWA [
15] and for the uniform designation of nitrate-polluted areas [
6].
It will be demonstrated that all these premises are mostly fulfilled for this special case. More generally, this paper addresses the question of whether the generally widely available data on nitrate concentrations in groundwater from official monitoring networks, which are not exploited for checking the validity of modelled nitrate concentrations in leachate so far, can be recommended for this purpose.
2. Methodology
For calculating nitrate concentrations in the leachate, simulation models have been applied worldwide since more than 30 years ago [
19]. Each of these models has been developed against the background of both a specific research question and a certain scale range of application. Physically based models like HYDRUS-1D [
20] or the Daisy model [
21] may be suitable for the simulation of site-specific pore water fluxes of nitrate at field scale [
22]; their applicability on the scale of Federal States or entire countries is, however, limited due to the fact that numerous input datasets are not available on this scale [
11].
Models such as SWAT [
23], HYPE [
24], or MONERIS [
25] are suitable for an application at the level of states. The spatial resolution of these models is limited to the level of sub-catchment areas however, which impedes the identification of site-specific hotspot areas of nitrate leaching below the sub-catchment level. The latter one is a pre-requisite, however, in order to fulfill the requirements of the German-wide administrative regulations [
6,
8].
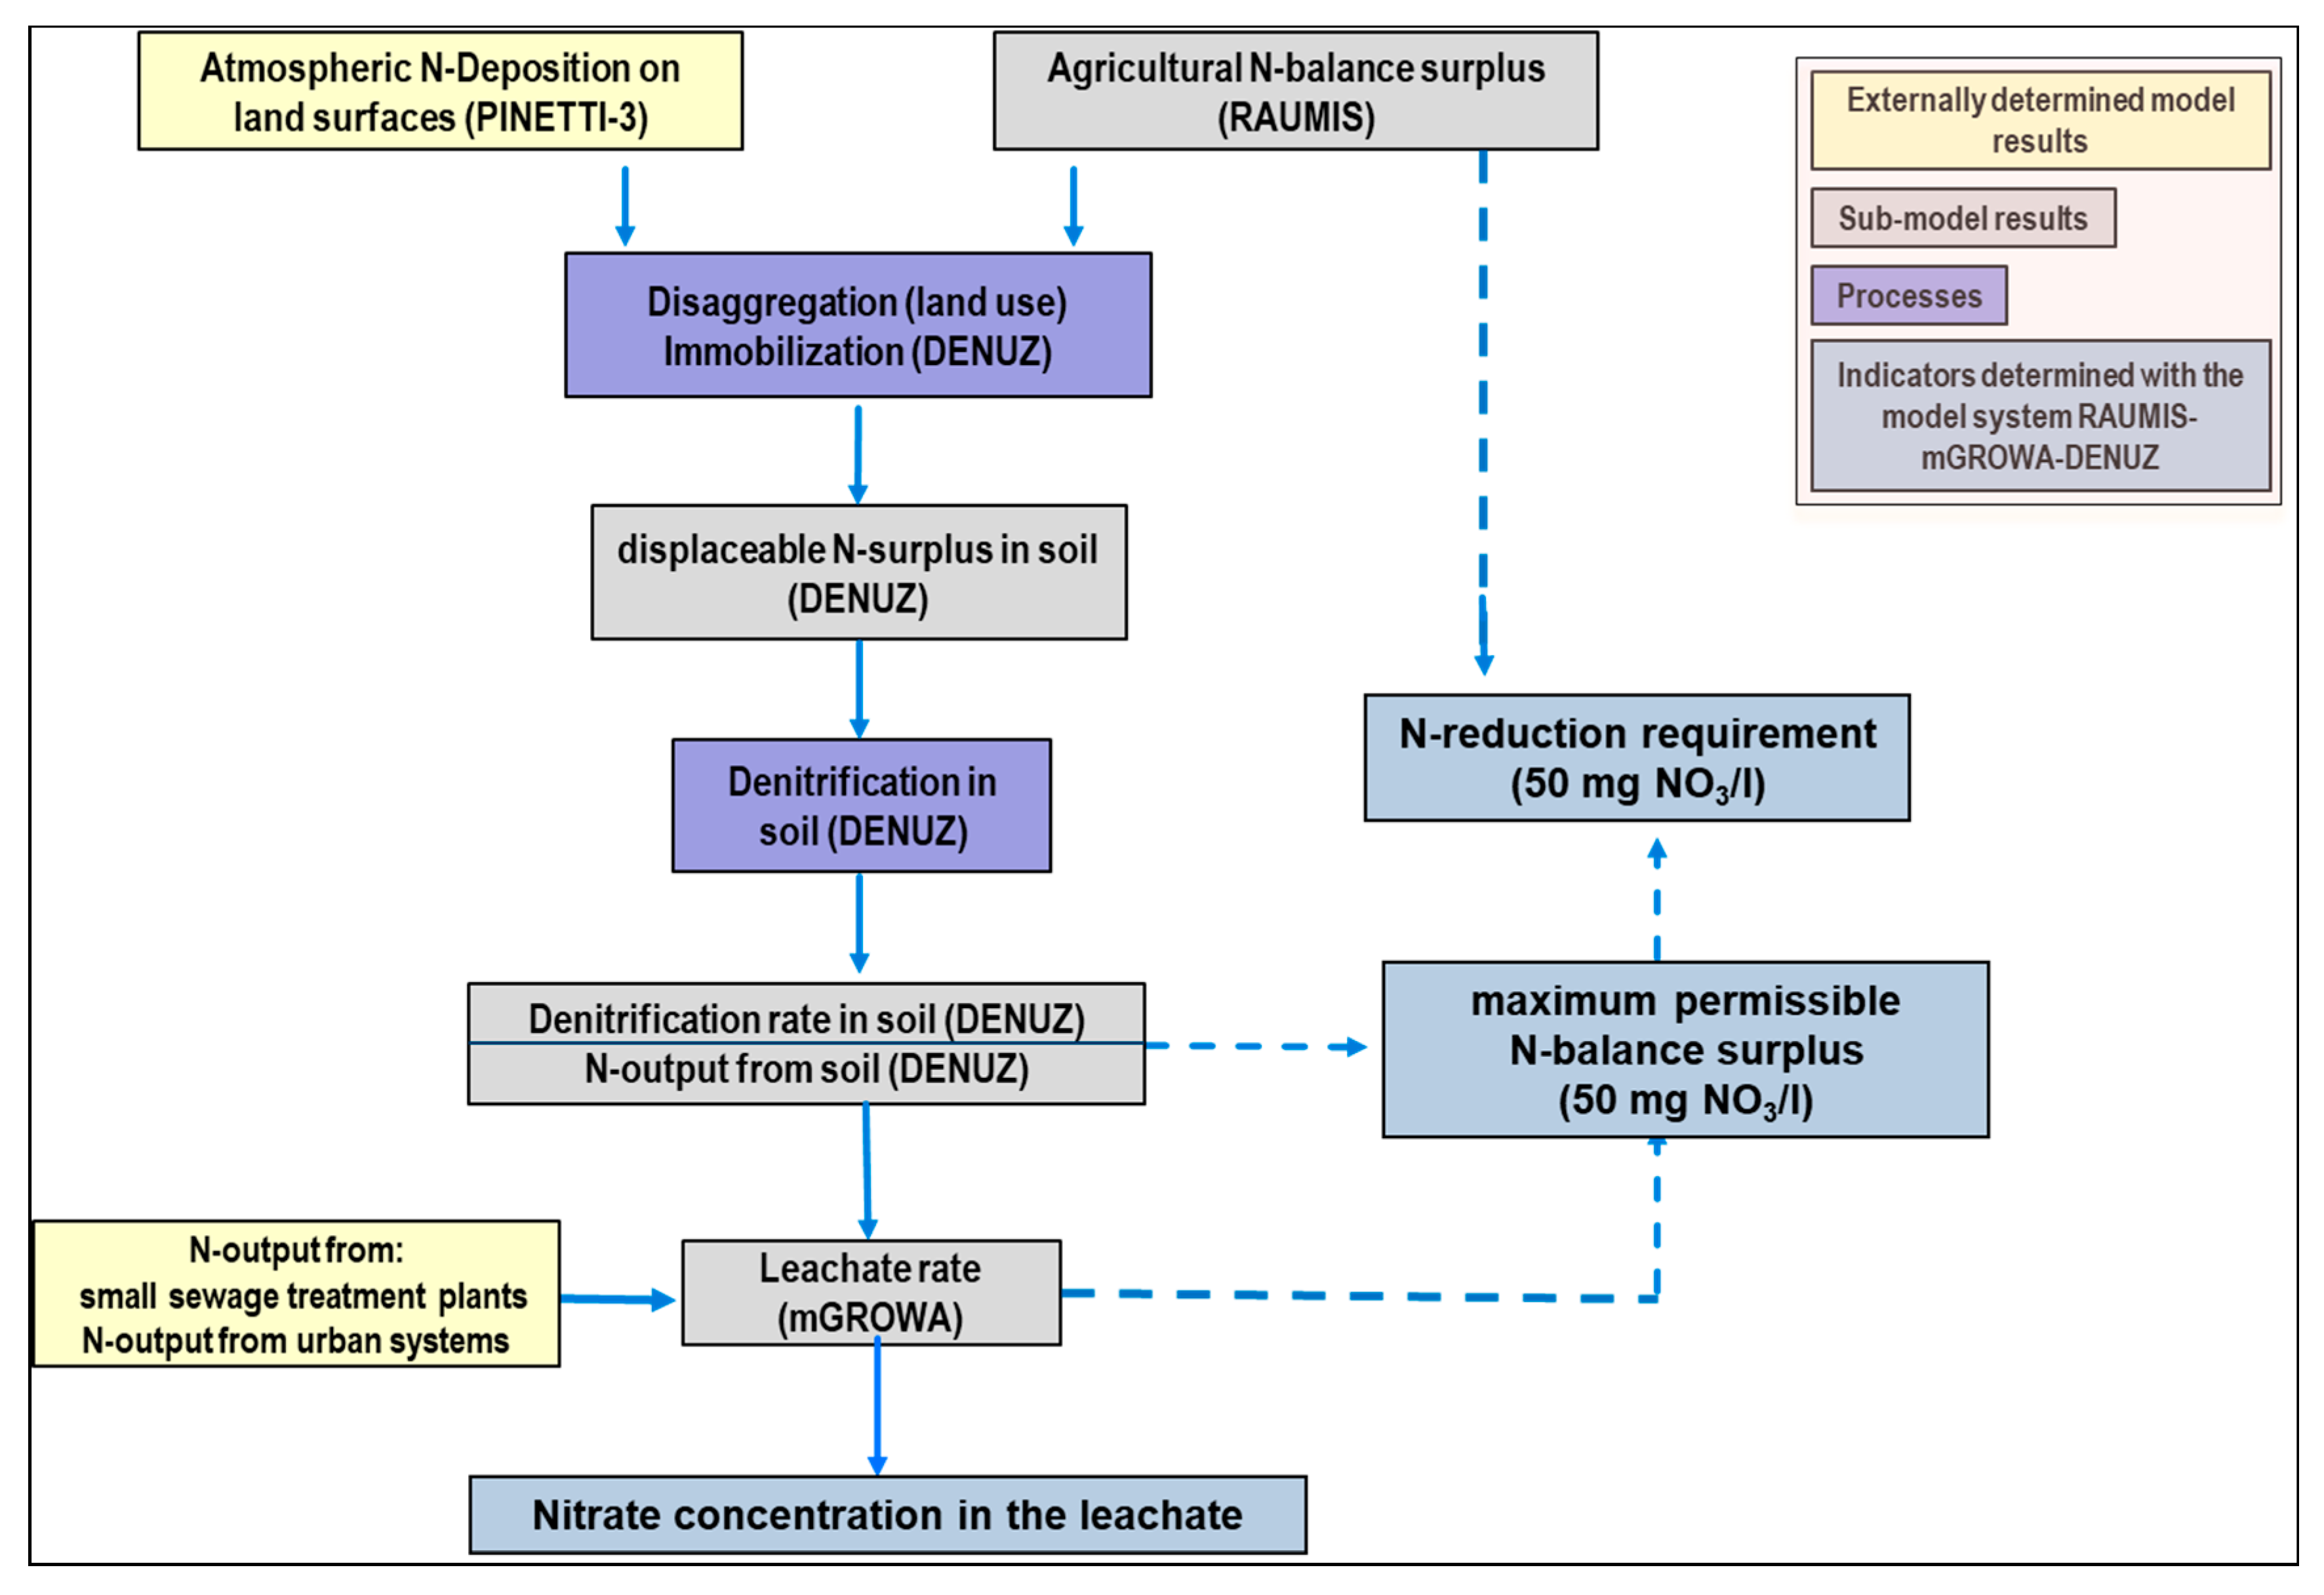
The model system RAUMIS-mGROWA-DENUZ [
10,
12,
26,
27] (see also
Figure 1) is not only suitable for applications on the state-scale; it is also able to determine the nitrate concentration in the leachate in the required high spatial resolution (here, 100 × 100 m grid). For detailed descriptions of individual sub-models, please refer to the relevant literature, e.g., for RAUMIS [
26], for mGROWA [
27], and for DENUZ [
10,
12].
Relevant starting points for simulating the nitrate concentration in the leachate are the agricultural N-balance surplus, the N-deposition from atmosphere, N-emissions from urban systems and small sewage treatment plants, and the leachate rate in Equation (1).
with:
cNO3: Nitrate concentration in the leachate (mg NO3/L);
NNBS: N-inputs into the soil from agricultural N-balance surplus (kg N/ha∙a);
NNHx: N-inputs into the soil from atmospheric NHx deposition (kg N/ha∙a);
NNOx: N-inputs into the soil from atmospheric NOx-deposition (kg N/ha∙a);
NSSP: N-inputs into the unsaturated zone from small sewage treatment plants (kg N/ha∙a);
NUS: N-inputs into the unsaturated zone from urban systems (kg N/ha∙a);
Isoil: N-immobilisation in the soil (kg N/ha∙a);
Dsoil: Denitrification in the soil (kg N/ha∙a);
QL: Mean long-term leachate rate (mm/a).
The leachate rate is derived from the water balance model mGROWA [
27]. Against the background that the model intends to depict a mean long-term-and thus regionally typical hydrological situation, the leachate rates simulated with mGROWA in daily resolution are aggregated to long-term mean values for the 30-year hydrological reference period 1981–2010.
For calculating nitrate concentrations in the leachate, the mGROWA leachate rates are coupled to N-emissions from soil and N-emissions from urban systems and small sewage treatment plants. The most important N source for assessing N emissions from soil are agricultural N balance surpluses. In both projects, these N balance surpluses were determined at the community level by the Thünen Institute in Braunschweig for the reference period 2014–2016 using the model RAUMIS [
26]. Atmospheric NH
X deposition determined in the PINETI3 project [
28] was taken into account as a further diffuse N source, which can be attributed to agriculture. As a non-agricultural share of atmospheric N deposition, the NOx emissions from transport, industry, and households assessed in the PINETI3 project [
28] were considered.
Initially, the displaceable N surplus in soil is calculated under consideration of N immobilization in soils under grassland and forest areas. The displaceable N surplus, however, may be partly denitrified during transport through the soil. This process is accounted for in the DENUZ model [
10,
12,
29] using Michaelis–Menten kinetics, which considers the amount of denitrified N in soils as a function of different influencing factors. Favorable factors for denitrification in soil are, for example, high soil moisture, high organic carbon content, and high soil temperatures. In contrast, inhibited denitrification in soil is likely a result of a lack of microbially readily available carbon sources (low humus content) in well aerated soils with a tendency to acidification [
30,
31].
In addition to the diffuse N emissions from soils, N emissions from urban systems and small sewage treatment plants contributing to the N load of the leachate below the soil zone have been considered. N emissions to groundwater from urban systems under settlement areas were determined in both Federal States on the assumption of a nitrogen release of 4 kg N per capita and year. For NRW, it was assumed that the N release to groundwater from urban systems amounts to 15%, i.e., 0.6 kg N per capita and year [
32]. In Rhineland-Palatinate, losses from urban systems were included as lump sums according to the period the sewer systems were installed following suggestions from LAWA-AH [
33]: 3% exfiltration for sewers installed before 1970, 1% exfiltration for sewers installed between 1971 and 2000, and 0.5% exfiltration for sewers installed since 2000.
In NRW, nitrogen emissions into groundwater from small sewage treatment plants were considered as an additional nitrogen source. Related nitrogen loads were derived from the state discharge register [
34]. In Rhineland-Palatinate, in contrast, small sewage treatment plants were not explicitly considered as nitrogen emission sources discharging into groundwater.
3. Model Results for Nitrate Concentration in the Leachate
In
Table 1, relevant input data sources for determining nitrate concentrations in the leachate are summarized.
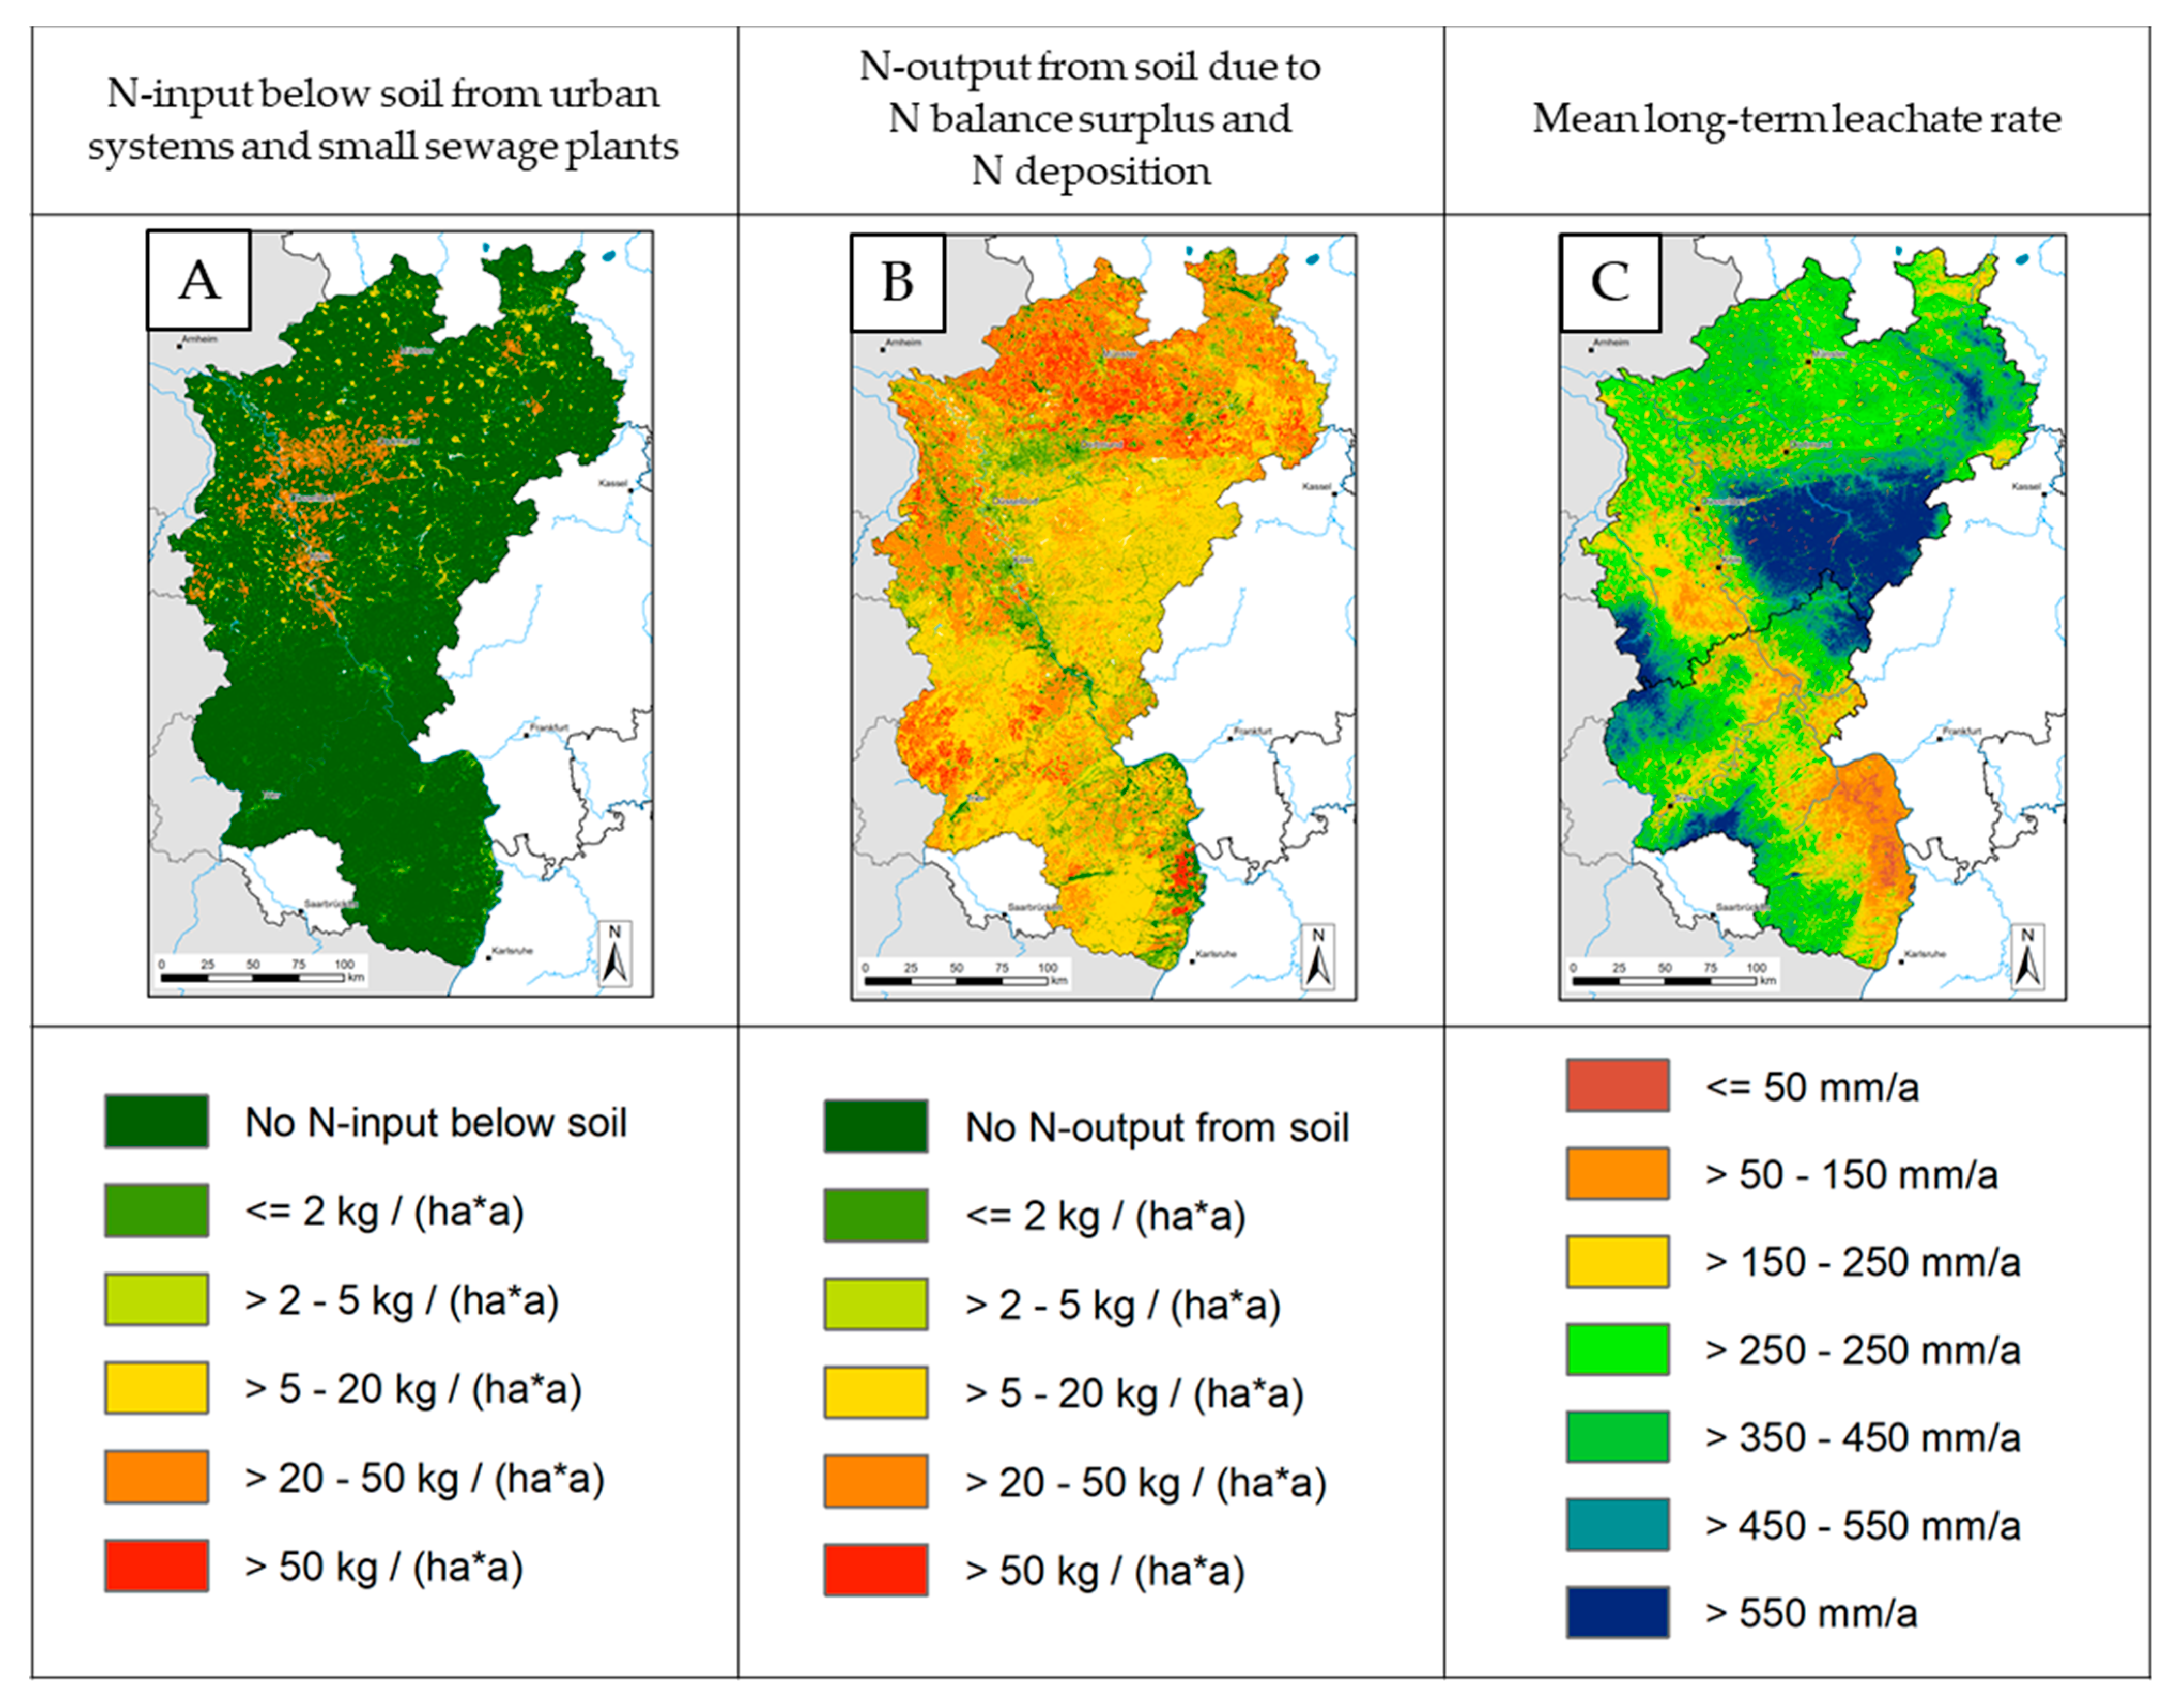
Figure 2 shows its spatial distribution.
As expected, N emissions from urban systems and small sewage treatment plants loading the leachate with N below the soil prevail in the metropolitan areas along the river Rhine and in the Ruhr area (see
Figure 2A). In total, these N emissions sum up to approx. 11,500 t N/a.
Nitrogen output from soil (
Figure 2B) was determined with the DENUZ model on the basis of the N balance surpluses from agriculture as well as the atmospheric NHx and NOx deposition, taking into account N immobilization and nitrate degradation processes in soil. The resulting diffuse N emission from soil adds up to approx. 79,000 t N/a in NRW and 28,400 t N/a in Rhineland-Palatinate.
For the central part of the Münsterland and some regions in the Western Eifel, diffuse N emissions from soil > 50 kg N/(ha·a) occur due to intensive animal husbandry. N-emissions from soil > 50 kg N/(ha·a) can also be found in regions where the cultivation of special crops (e.g., Vorderpfalz, parts of the Upper Rhine Valley and the Lower Rhine Embayment) prevails. In the fertile Börde landscapes (e.g., Cologne-Aachener Bucht, Soester Börde), N emissions from soil of 20 up to 50 kg N/(ha·a) are observed. In low mountain ranges of NRW, N emissions from soil range between 10 and 25 kg N/(ha·a), while in corresponding areas of Rhineland-Palatinate, N emissions from soils of less than 10 kg N/(ha∙a) are common. In urban areas, N emissions from soil are generally low and rarely exceed 5 kg N/(ha a).
Figure 2C shows the mean long-term leachate rate for the reference period 1981–2010. In low land regions consisting of unconsolidated fluviatile sand and gravel deposits, leachate rates between less than 100 and 200 mm/a dominate. While leachate rates up to 200 mm/a occur in the entire Lower Rhine Embayment, leachate rates rarely exceed 100 m/a in the Upper Rhine Valley and the Vorderpfalz. In low mountain ranges consisting of consolidated rocks (sandstones and slated shale stones), leachate rates up to 600 mm/a and more predominate. Consequently, the dilution of N emissions in the entire Rhenish Slate Mountain region is three to six times higher than in lowland regions.
In reality, N emissions from the various (agricultural and non-agricultural) N sources will mix in the leachate. To represent this in the model, N emissions from these individual N sources were added and combined with the mean long-term leachate rates for each individual grid.
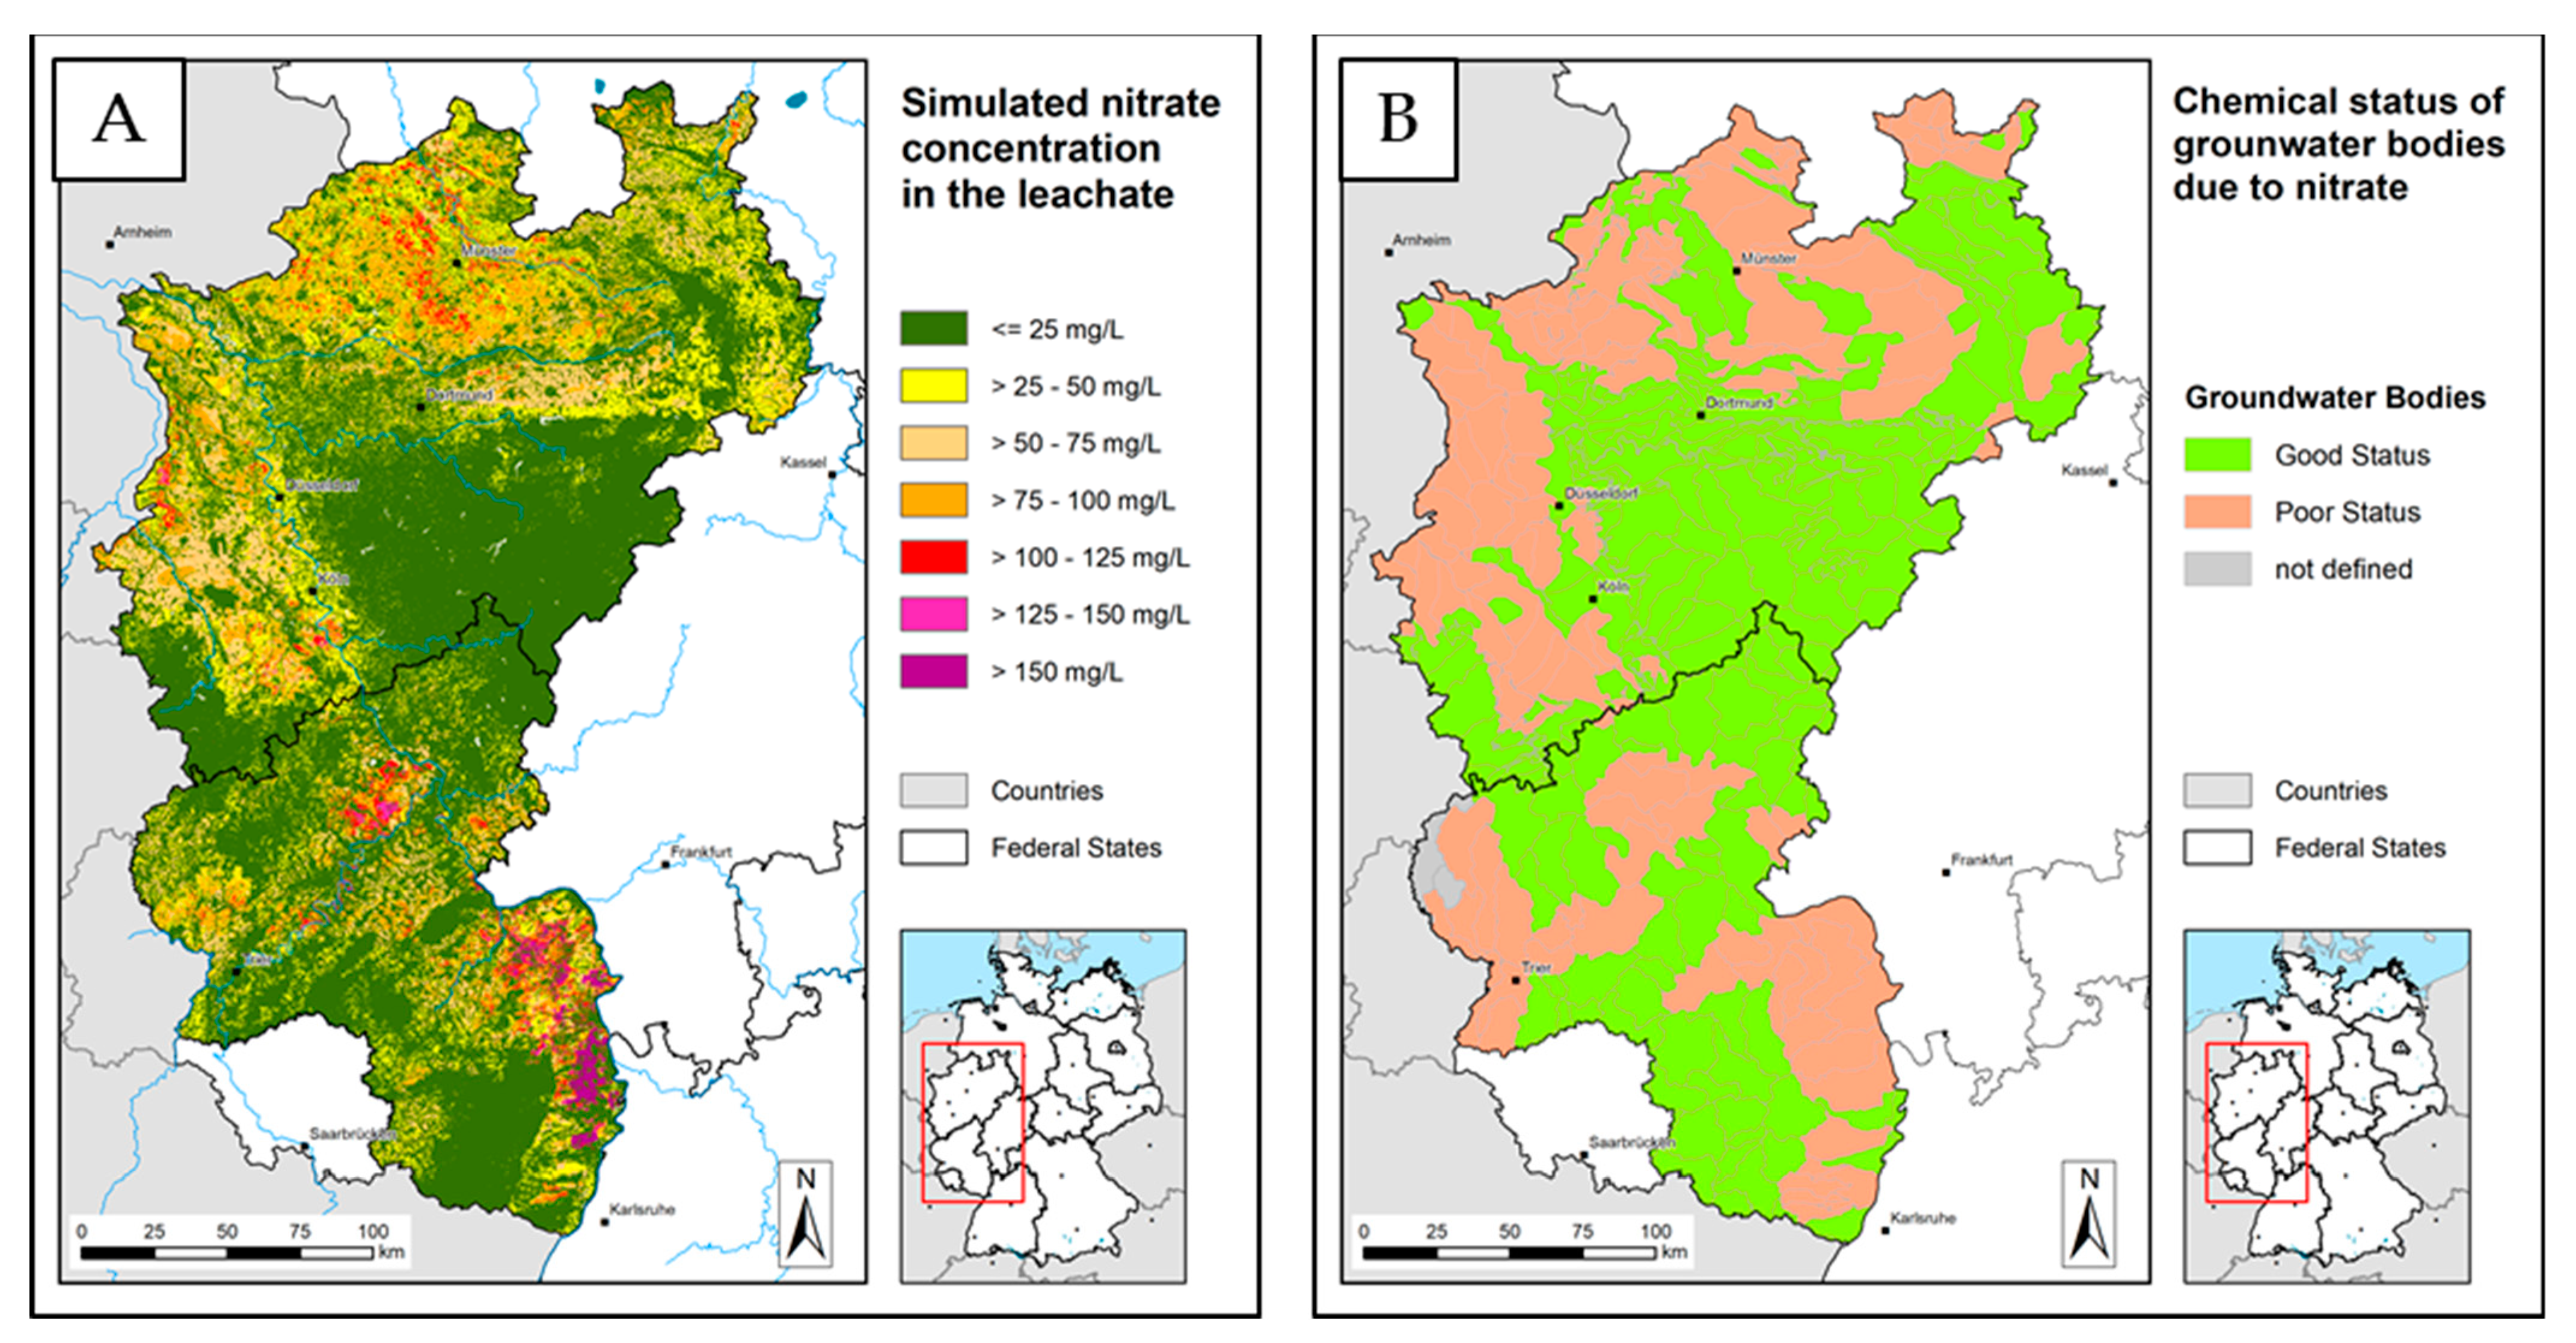
Figure 3A shows the corresponding nitrate concentration in the leachate.
All areas in
Figure 3A showing nitrate concentrations in the leachate of 50 mg NO
3/L and more can be regarded as “hot spot areas” for nitrate pollution. This concerns many regions in the northern and western parts of North Rhine-Westphalia (Münsterland, Lower Rhine Embayment) as well as in the southwest of Rhineland-Palatinate (Upper Rhine Valley) and in the Neuwieder Becken. In the Münsterland, the hotspot areas are exclusively due to high agricultural N balance surpluses originating from livestock farming (see
Figure 2B). In the Lower Rhine Embayment, the Upper Rhine Valley, and the Neuwieder Becken, N emissions from soil are moderate. In these regions, high nitrate concentrations are also caused by low leachate rates. Particular high values of 150 mg NO
3/L and more are found in some areas in the Upper Rhine Valley and in the Vorderpfalz due to the combination of special crops cultivation and low leachate rates. In contrast, extended areas showing nitrate concentrations in the leachate <25 mg NO
3/L occur in both federal states, especially in extensively farmed low mountain regions, where relatively low N-emissions from soil are considerably diluted by high leachate rates.
As
Figure 3B shows, the majority of areas where modelled nitrate concentrations in leachate exceed 50 mg NO
3/L are in groundwater bodies that are in poor chemical status due to nitrate. Qualitatively, this is a first indication of the model’s accuracy. Less good agreement is seen in the Münsterland core area, where groundwater bodies in good status due to nitrate are juxtaposed with extensive areas of modelled nitrate concentrations in leachate exceeding 50 mg NO
3/L. As, however, aquifers with high nitrate degradation potential are located in the groundwater bodies of this region, larger differences are expected and do not challenge the modelled nitrate concentrations in the leachate.
4. Comparison of Modelled Nitrate Concentrations in the Leachate with Observation Data
Measured nitrate concentration values from soil depth profiles, suction probes, and lysimeters are, in general, the most suitable data to validate nitrate concentrations in the leachate. In practice, however, there is a lack of monitoring networks at the Federal State level that systematically record nitrate concentrations in soils at a sufficient, i.e., regionally representative, number of measuring points.
Modelled nitrate concentrations in the leachate can be further directly compared to nitrate concentrations in groundwater if excess N
2 measurements [
35,
36] have been carried out. Excess N
2 measurements allow for the determination of degraded nitrate concentration and thus a backward calculation of the initial nitrate concentration of the recharged groundwater without denitrification influence. With this method, in principle, all groundwater monitoring sites can be used for the estimation of nitrate concentrations in recharged groundwater, and thus for validating modelled nitrate concentrations in leachate [
37]. A preselection of monitoring sites with oxidizing groundwater is not necessary in this case. However, systematic N
2/Ar sampling at a state scale in Germany is still in its early stages [
38] and may be available in some areas, but—again—not at a federal state scale.
Due to these data limitations, a direct plausibility check of modelled nitrate concentrations in the leachate for larger areas, i.e., at the level of Federal States, is therefore often not possible. Measured nitrate concentrations from groundwater monitoring stations are available for most regions in sufficient numbers. However, its usability for checking the plausibility of modelled nitrate concentrations in the leachate has not been assessed so far. We assume that measured nitrate concentrations in groundwater are suitable for testing the reliability of modelled nitrate concentrations in leachate if suitable groundwater monitoring sites have been identified in advance using a number of preselection criteria.
5. Preselection Criteria for Groundwater Monitoring Stations
5.1. Sampling Depth and Type of Measuring Point
The quality of near-surface groundwater reflects the quality of the leachate that has infiltrated into an aquifer. Consequently, only measured nitrate concentrations from upper aquifers or shallow sources should be included in the validity check.
Furthermore, for groundwater monitoring sites, the type of well was considered. Measured values from groundwater extraction wells are, in general, unsuitable for this kind of plausibility check. Due to pumping processes, groundwater abstraction wells display water from different withdrawal depths, so that a reference to the nitrate concentration at the groundwater surface and to the nitrate concentration in the leachate, respectively, is usually missing.
For the remaining groundwater monitoring wells, the depth range of the filter applies as an additional preselection criterion to ensure that only monitoring sites with filter depths of less than 20 m below groundwater level or from the upper third of shallow aquifers are selected for the plausibility check.
5.2. Denitrification Potential in Groundwater
Since denitrification in groundwater is not relevant for the modelled nitrate concentrations in leachate but may be significant for the observed nitrate concentration in near-surface groundwater, observed nitrate concentration in monitoring wells may be significantly lower than nitrate concentration in the leachate [
14]. Consequently, in regions with denitrification in the aquifer, the observed nitrate concentrations may already have been reduced or completely eliminated by denitrification processes during the passage of the groundwater on its way to the monitoring site. Conversely, the measured nitrate concentrations in the groundwater of aquifers displaying oxidative groundwater can be regarded as suitable for checking the plausibility of modelled nitrate concentrations in leachate, since significant nitrate degradation processes in aquifers with oxidative conditions can be excluded.
An assessment of the concentration ranges of essential redox parameters at the monitoring sites is, therefore, an indispensable preselection criterion to exclude that discrepancies between modelled nitrate concentrations in the leachate and measured nitrate concentrations in groundwater are erroneously attributed to model-related causes. Rather simple indicators can be used to identify the redox status of groundwater samples from monitoring stations (see
Table 2).
Basic prerequisites for denitrification in groundwater are low oxygen concentrations and the presence of organic carbon and/or iron sulfide compounds (pyrite) in an aquifer. A typical nitrate-degrading groundwater usually shows high contents of divalent iron, manganese, and/or organic carbon (>0.1 mg Fe(II)/L, >0.05 mg Mn(II)/L, and >0.75 mg DOC/L), while in general, only low nitrate and oxygen contents (<2 mg/L) can be observed [
32]. Non-nitrate-degrading groundwater is usually characterized by high oxygen concentrations and low Iron (II), Manganese (II), and DOC contents.
In order to include only monitoring sites showing oxidizing groundwater conditions in the plausibility check, all monitoring sites indicating reducing groundwater conditions for at least three of the five parameters listed in
Table 2 were excluded from further evaluations.
5.3. Inflow Area of Measuring Point
The entire inflow area of a groundwater monitoring site contributes to the nitrate concentration observed at that site. It can therefore be expected that the nitrate concentration in the leachate modelled for the specific raster cell where a monitoring station is located will deviate from the observed nitrate concentration of that monitoring station.
Therefore, the plausibility check was carried out under consideration of the inflow area of the observation sites using averaged modelled nitrate concentrations. The databases for delineating the inflow area of groundwater measuring points exactly are usually not available in the required resolution at the federal state level. For pragmatic reasons, we used a state-wide available model of the groundwater surface. As long as nitrate degradation potentials in the unsaturated zone below the soil and in the aquifer can be excluded, the median nitrate concentration in the leachate from the inflow area of a monitoring site should correspond to the observed nitrate concentrations in the groundwater of this monitoring site.
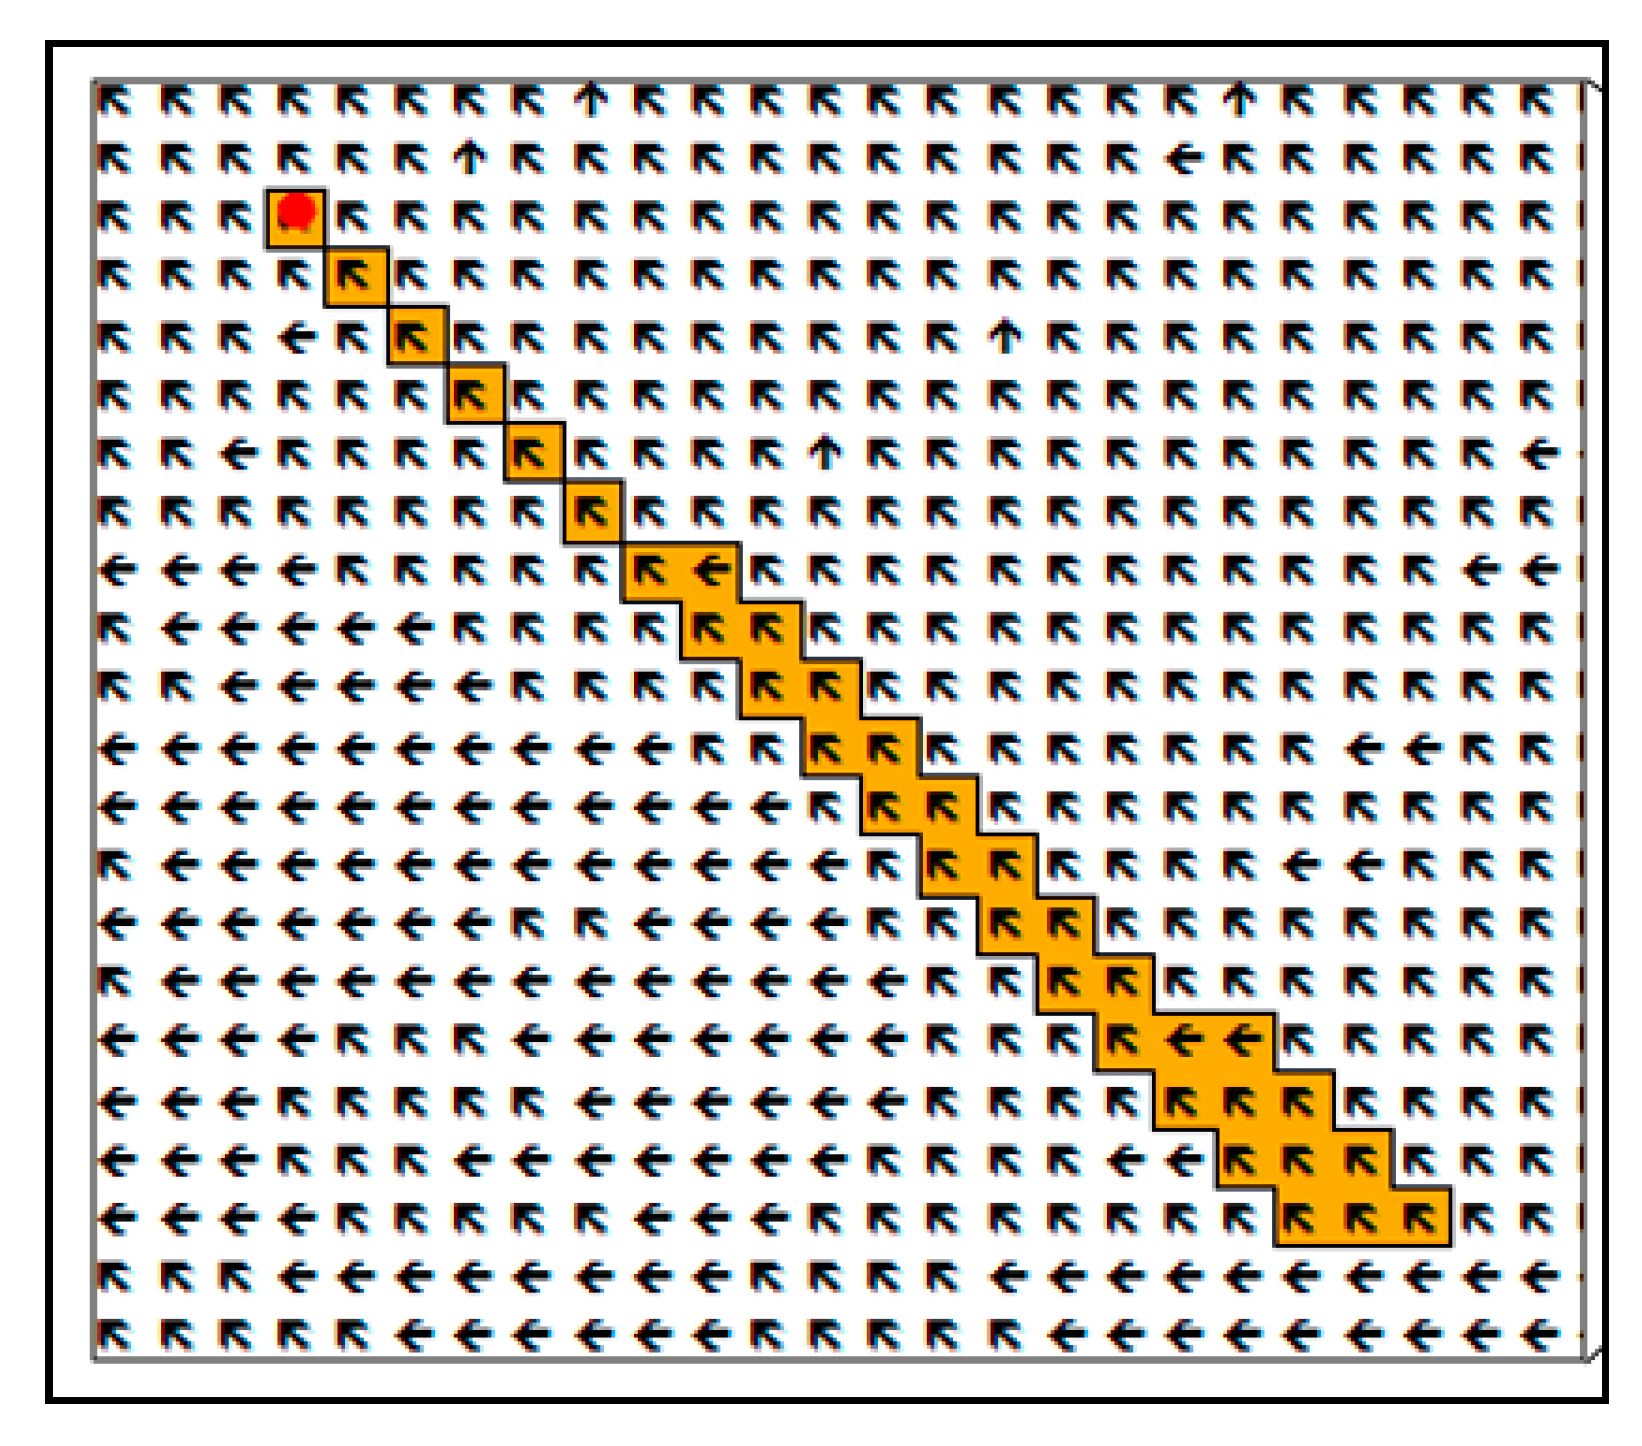
In order to determine the inflow areas of measuring points, groundwater flow directions (calculation of the maximum gradient to one of the eight adjacent cells) and the corresponding catchment areas can be derived from digital groundwater surfaces using a flow accumulation algorithm [
49] implemented in the tool r.watershed of GIS GRASS (see
Figure 4).
Groundwater inflow areas of measuring points derived in this way represent contiguous areas of all grid cells whose water flows into a respective groundwater measuring point. Accordingly, the median of the nitrate concentrations in the leachate from the individual raster cells within the inflow area of an observation point is derived and compared to the observed nitrate concentrations in the groundwater.
The same procedure was applied for the delineation of catchment areas of shallow springs, however, not based on groundwater surfaces but digital elevation models (DGM10 for NRW and DGM25 for Rhineland-Palatinate, respectively) for deriving flow directions and measuring point-specific catchment areas. Occasionally, inflow areas exceeding a distance of 1 km to a measuring point have been identified by the flow accumulation algorithm. In this case, the inflow areas have been buffered accordingly.
6. Preselected Groundwater Monitoring Sites from the Federal State Groundwater Databases
Data collected from two federal states’ groundwater databases were used for checking the magnitude and spatial representability of the modelled nitrate concentration in leachate.
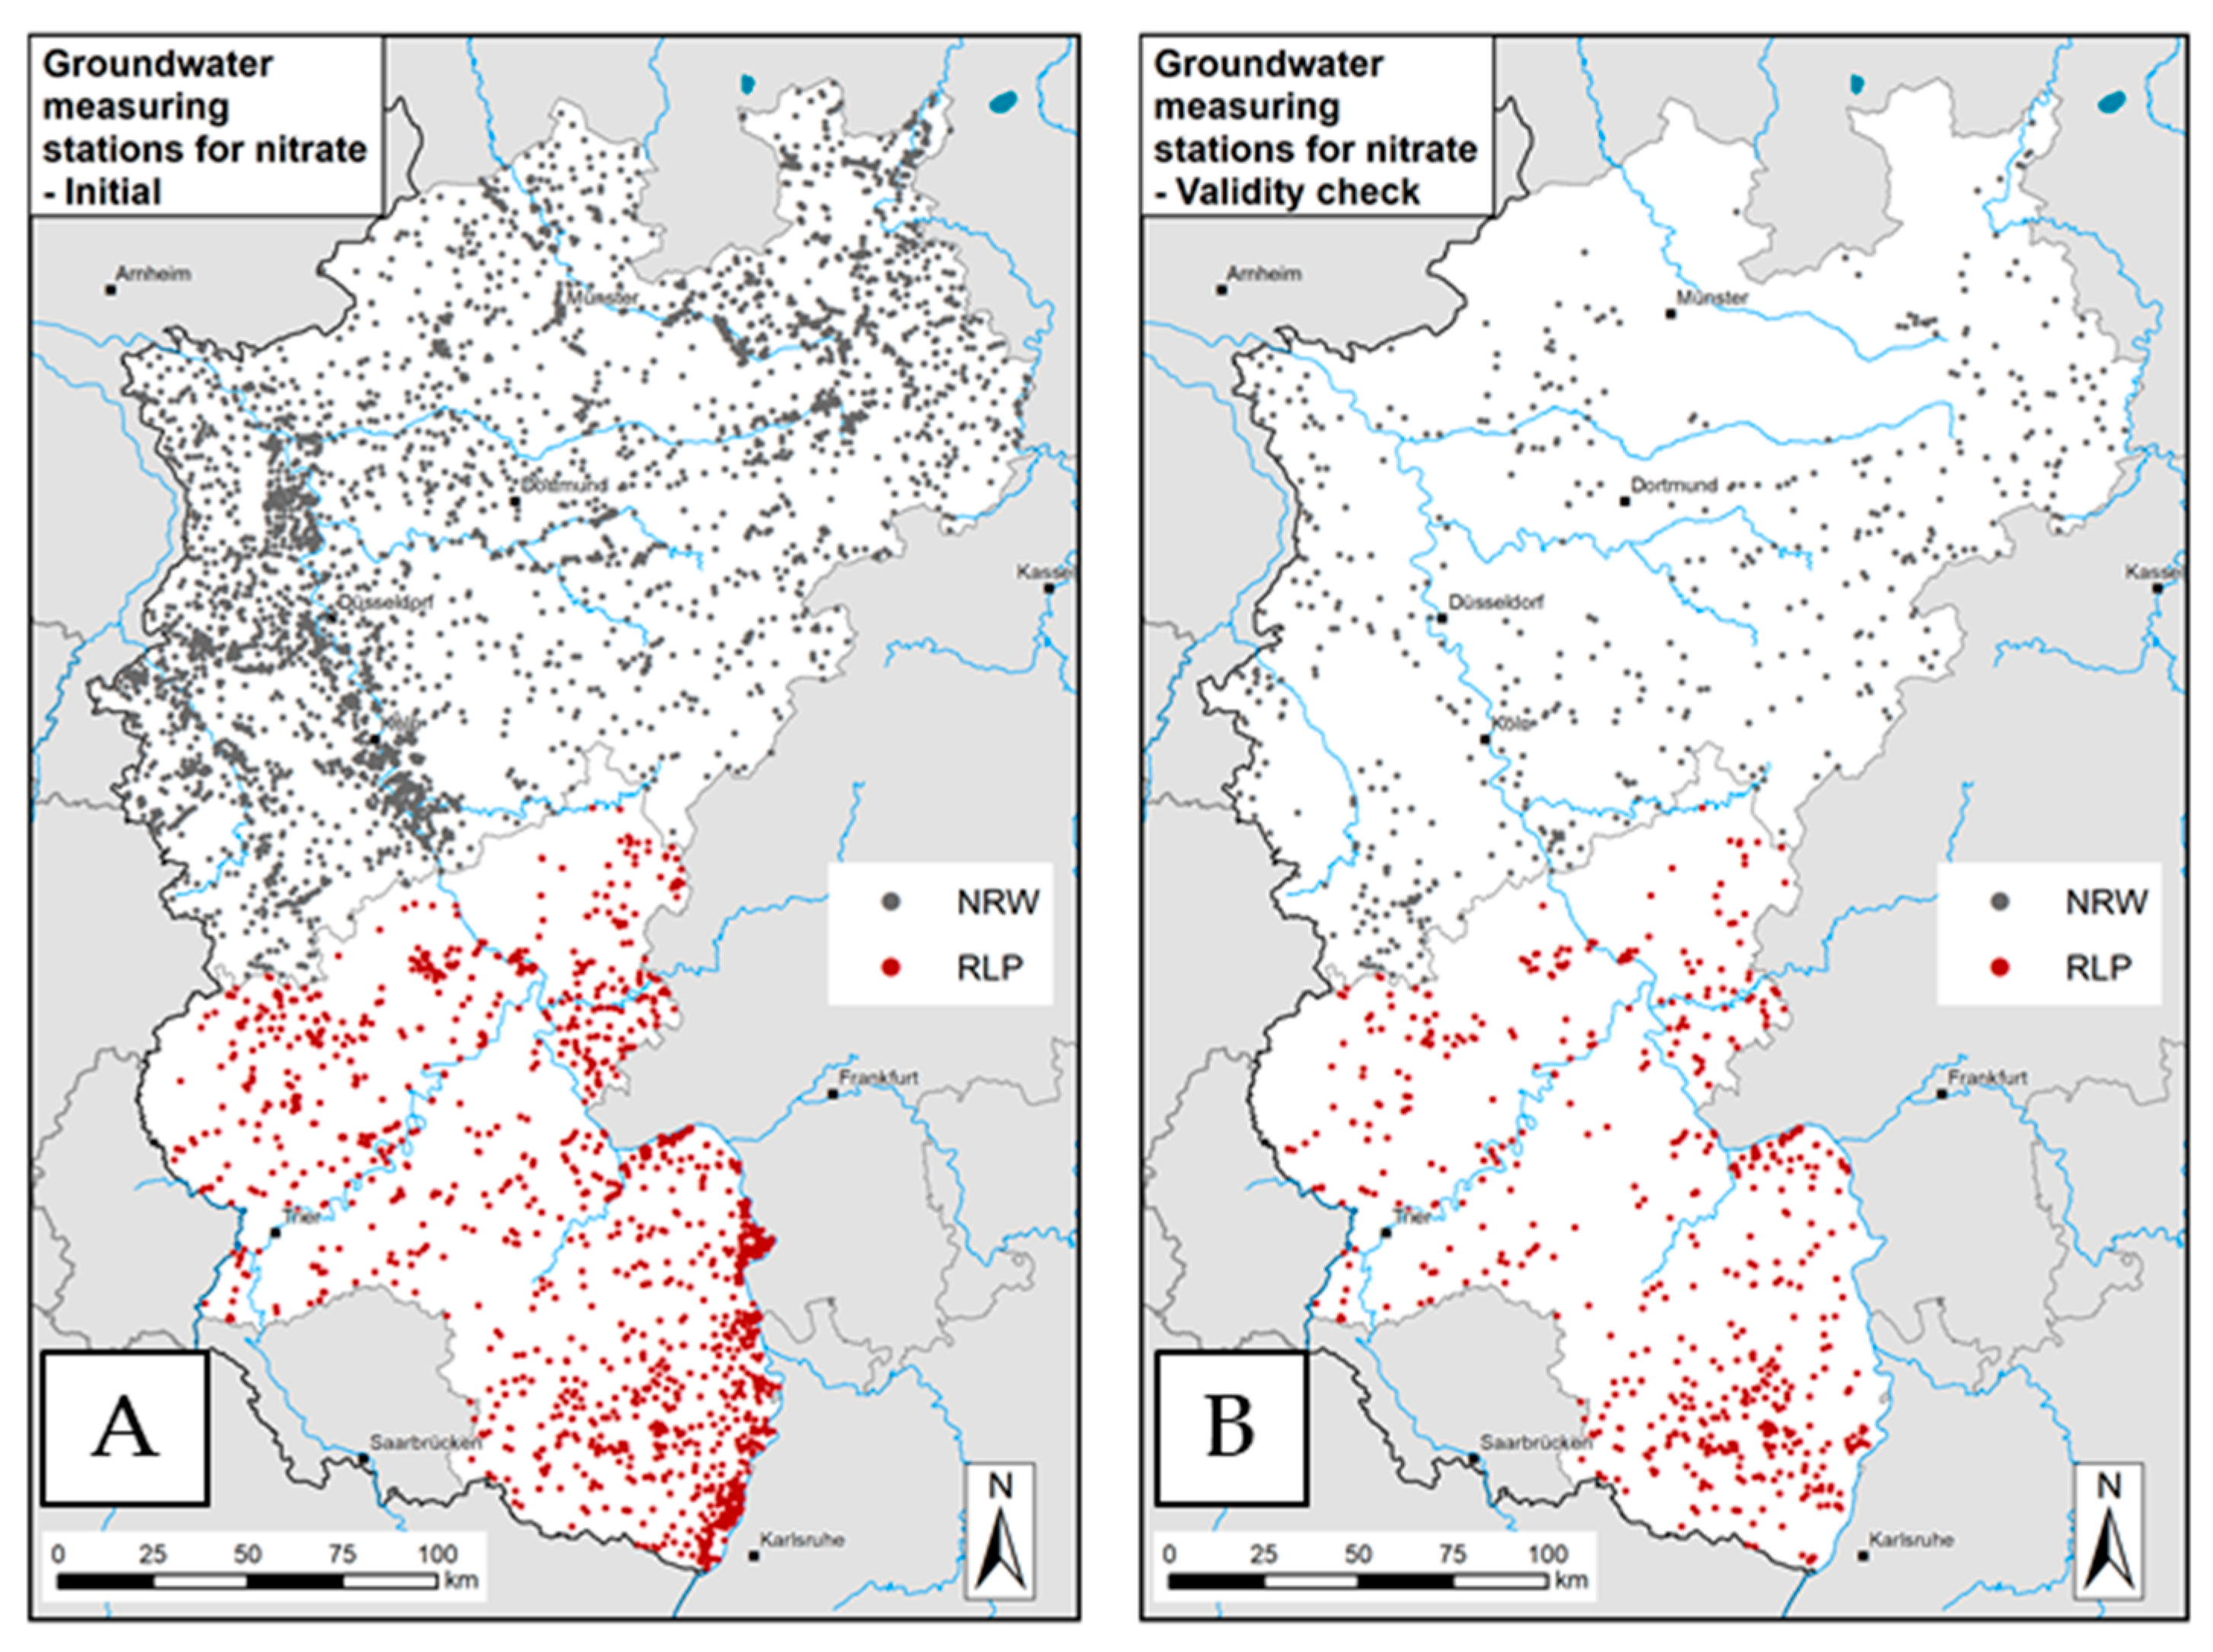
Figure 5A shows locations of measuring points in NRW and RLP. For NRW, nitrate values from 4839 monitoring stations from the period 2006 to 2015 were available from the NRW state groundwater database. For RLP, data from a total of 1428 monitoring sites from the time period 2006–2017 have been provided by the RLP State Agency for the Environment. The spatial distribution of these groundwater measuring points is quite heterogeneous, i.e., in regions with high-yielding groundwater resources (Lower Rhine Bight, Upper Rhine Münsterland), it is significantly higher than in regions with low-yielding groundwater resources (Rhenish Slate Mountains). In accordance with the above-mentioned preselection criteria, only groundwater samples were used for further evaluations when any of the following constraints were met:
Groundwater samples originate from monitoring stations with filter depths of less than 20 m below groundwater level;
Groundwater samples were taken from the upper third of shallow aquifers;
Samples stem from shallow springs;
Samples show oxidative groundwater conditions;
Inflow areas of groundwater measuring points and catchment areas of springs, respectively, could be delineated.
Applying all these preselection criteria, the initially available number of monitoring stations has been reduced from 6267 to 1119, i.e., ca. 515 for NRW and 614 for RLP. The locations of these sites are shown in
Figure 5B. In the vast majority of cases, missing information about the sampling depth or filter depth of measuring points has been the reason for discarding monitoring sites. Still, the spatial distribution of the preselected groundwater monitoring sites in both German federal states is quite homogeneous with the exception of the northern part of NRW. For this area (the Münsterland), a significant number of groundwater monitoring sites are available (see
Figure 5A); most of them, however, were excluded from the plausibility check as the groundwater shows reducing conditions.
Modelled nitrate concentration in the leachate represents a hypothetical value that refers to the leachate rates of a—usually 30-year—hydrological reference period. This is performed with the aim to limit the influence of hydrological dry or wet years on the nitrate concentration in the leachate. The nitrogen sources, above all, the N balance surpluses from agriculture and the atmospheric N deposition, are also considered as moving averages of 3–5-year reference periods with the aim to consider average conditions. Measured nitrate concentrations in groundwater, however, are random samples, which may be strongly influenced by hydrological conditions (e.g., rate of infiltration into groundwater) and N emissions (type of cultivated crops grown, date of fertilizer application) in the vicinity of the monitoring site at or near the time of measurement. Accordingly, for the preselected groundwater monitoring stations and shallow springs, the question arose as to whether monitoring sites for which only a few individual samples are available have to also be excluded from the plausibility checks.
7. Plausibility Checks Based on Preselected Monitoring Data from Federal State Groundwater Observation Data
When modelling nitrate concentrations in the leachate at a state scale, the aim cannot be to reproduce the value measured at a specific point in time at a specific location. This is not to be expected due to the limited site-specific accuracy of the input data at the federal state level described in
Section 3.
Since a comparison of measured point values and modelled raster values is misleading, it must be defined how a “good” or “bad” match can be defined. As a minimum requirement, it can certainly be stated that a large-scale model should primarily reflect the spatial patterns. This means that regions with high nitrate concentrations (“hot-spot” regions) must be represented just as representatively as regions with low concentrations. In terms of absolute values, however, it is acceptable if there are significant differences.
If, for example, in a region with predominantly low concentrations, the measured value is 1 mg NO3/L and the modelled value is 3 mg NO3/L, then the agreement is excellent, although the measured value is overestimated by a factor of 3. In the upper concentration range, even a high absolute deviation can still be considered as a good agreement. If, for example, a measured nitrate concentration is 126 mg NO3/L and the modelled value is 150 mg NO3/L, then the deviation is 24 mg/L, but the local pollution situation is still very well represented in the model.
In order to come to a systematic, comprehensible assessment of the model validity, the observed and measured values were first classified. Subsequently, the compliance of the measured and observed values to the respective classes was assessed. In cases where the modelled and observed values fell in the same class, the agreement was considered to be very good. The more the classes of the modelled and measured values deviate from each other, the worse the agreement is.
The difference between the classes was used as a measure for this purpose. If all measuring points are considered, a distribution of the class differences of measured and calculated values is obtained. In the ideal case of a perfect model, all class differences would be zero; in practice, the class differences are distributed around a mean value and with a certain scatter. From these parameters, conclusions can be drawn about both the validity of the model and possible under- or overestimations.
For this type of evaluation, the class widths must be defined. Basically, the ideal class width of a histogram results from the number of measured values [
50]. Since a very different number of measured values was available for the evaluations, a uniform class width of 25 mg NO
3/L was defined after a series of tests to ensure comparability. The comparison was, therefore, based on seven classes (0–25, 2550, … > 150 mg NO
3/L).
Figure 6 provides a spatial overview of the results of the comparison in both German states. Dots show in ca. 500-fold superelevation the concentration ranges of the measured values at the 1119 preselected measuring points. The same class widths and the same color gradation were used to represent the modelled mean long-term nitrate concentration in the leachate of the individual rater cells.
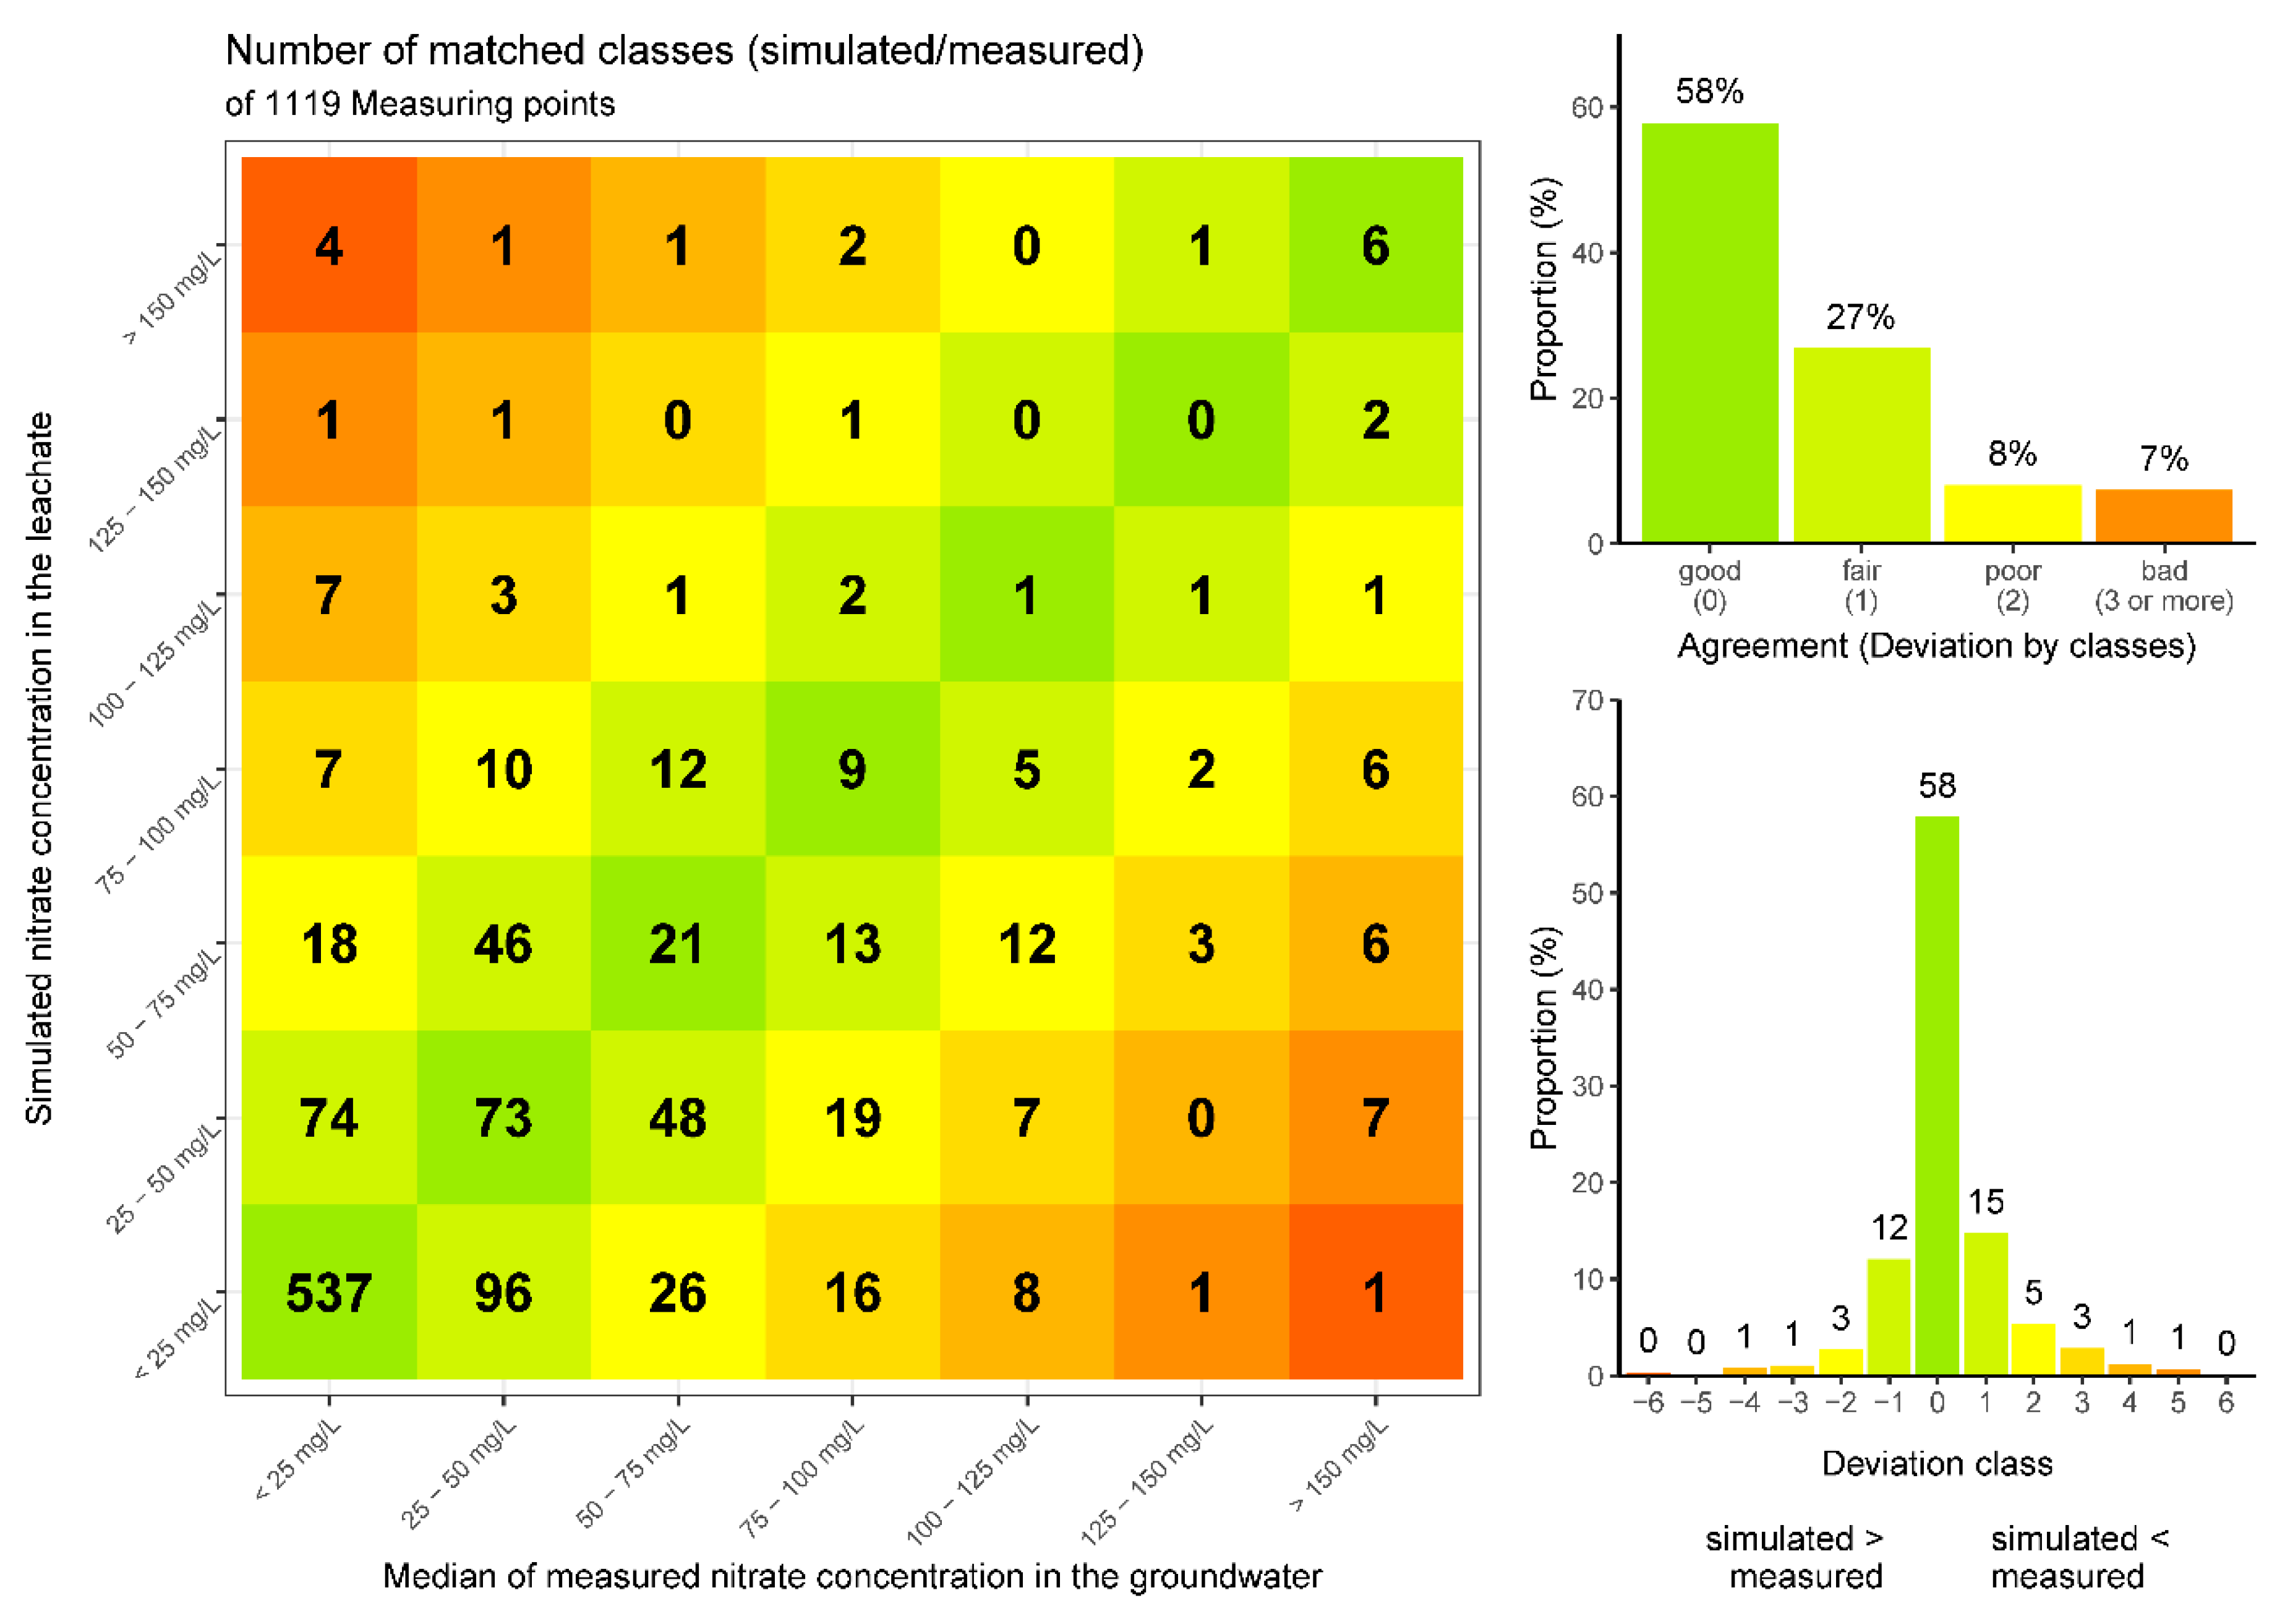
Figure 7 additionally shows the comparison of the class widths of the modelled nitrate concentrations in leachate and the measured nitrate concentrations in groundwater as frequency distributions. In this context, the agreement is denoted as being good, if observed and measured concentrations are in the same category; fair, if there is a deviation of one category; poor if the deviation is of two categories; and bad if there is a deviation of more than two classes.
Figure 6 shows that the compliance between the modelled nitrate concentrations in leachate and the measured nitrate concentrations in groundwater is predominantly good to very good for the selected class widths. The frequency distribution in
Figure 7 shows more precisely that the modelled nitrate concentrations in the leachate are for 58% of the 1119 groundwater monitoring sites in the same concentration class range. For another 27% of the monitoring sites, the modelled values fall in the next higher or next lower class range, which is still acceptable. For about 15% of the monitoring stations, however, significant deviations of more than one class width occur.
7.1. Influence of Number of Individual Samples
Against this background, we analyzed whether values from groundwater monitoring sites for which long-term time series on nitrate concentration are available show a higher agreement with modelled nitrate concentrations in leachate than groundwater monitoring sites with only a few individual samples. For measuring points with long-term time series, an average value has been derived, for which it can be assumed that measuring dates with high nitrate concentrations in groundwater and measuring dates with low nitrate concentrations in groundwater have been approximated. In aquifers without significant denitrification potentials, this mean value may be of the same order of magnitude as the modelled mean long-term nitrate concentration in the leachate. Conversely, as the number of samples decreases, the deviation from the modelled mean long-term nitrate concentrations in leachate may randomly increase.
In order to determine whether the 1119 preselected monitoring sites should also have a minimum number of measured values above which a comparison with modelled nitrate concentrations in leachate is appropriate, frequency distributions with successively decreasing numbers of measured values per monitoring site were established.
Table 3 shows mean values and standard deviations of frequency distributions of successively decreasing numbers of measured values, starting with measuring points with more than 22 measured values and ending with measuring points with more than 2 measured values for time periods of 10 and 12 years, respectively.
Table 3 illustrates that, contrary to expectations, neither the mean value of deviation classes nor the standard deviation of deviation classes show significantly more discrepancies as the number of samples per measuring point decreases. Thus, it seems to be appropriate—at least for the evaluated data collected—to include all measuring points with at least one measurement in the plausibility checks of modelled nitrate concentrations in leachate.
7.2. Influence of Land Use Types
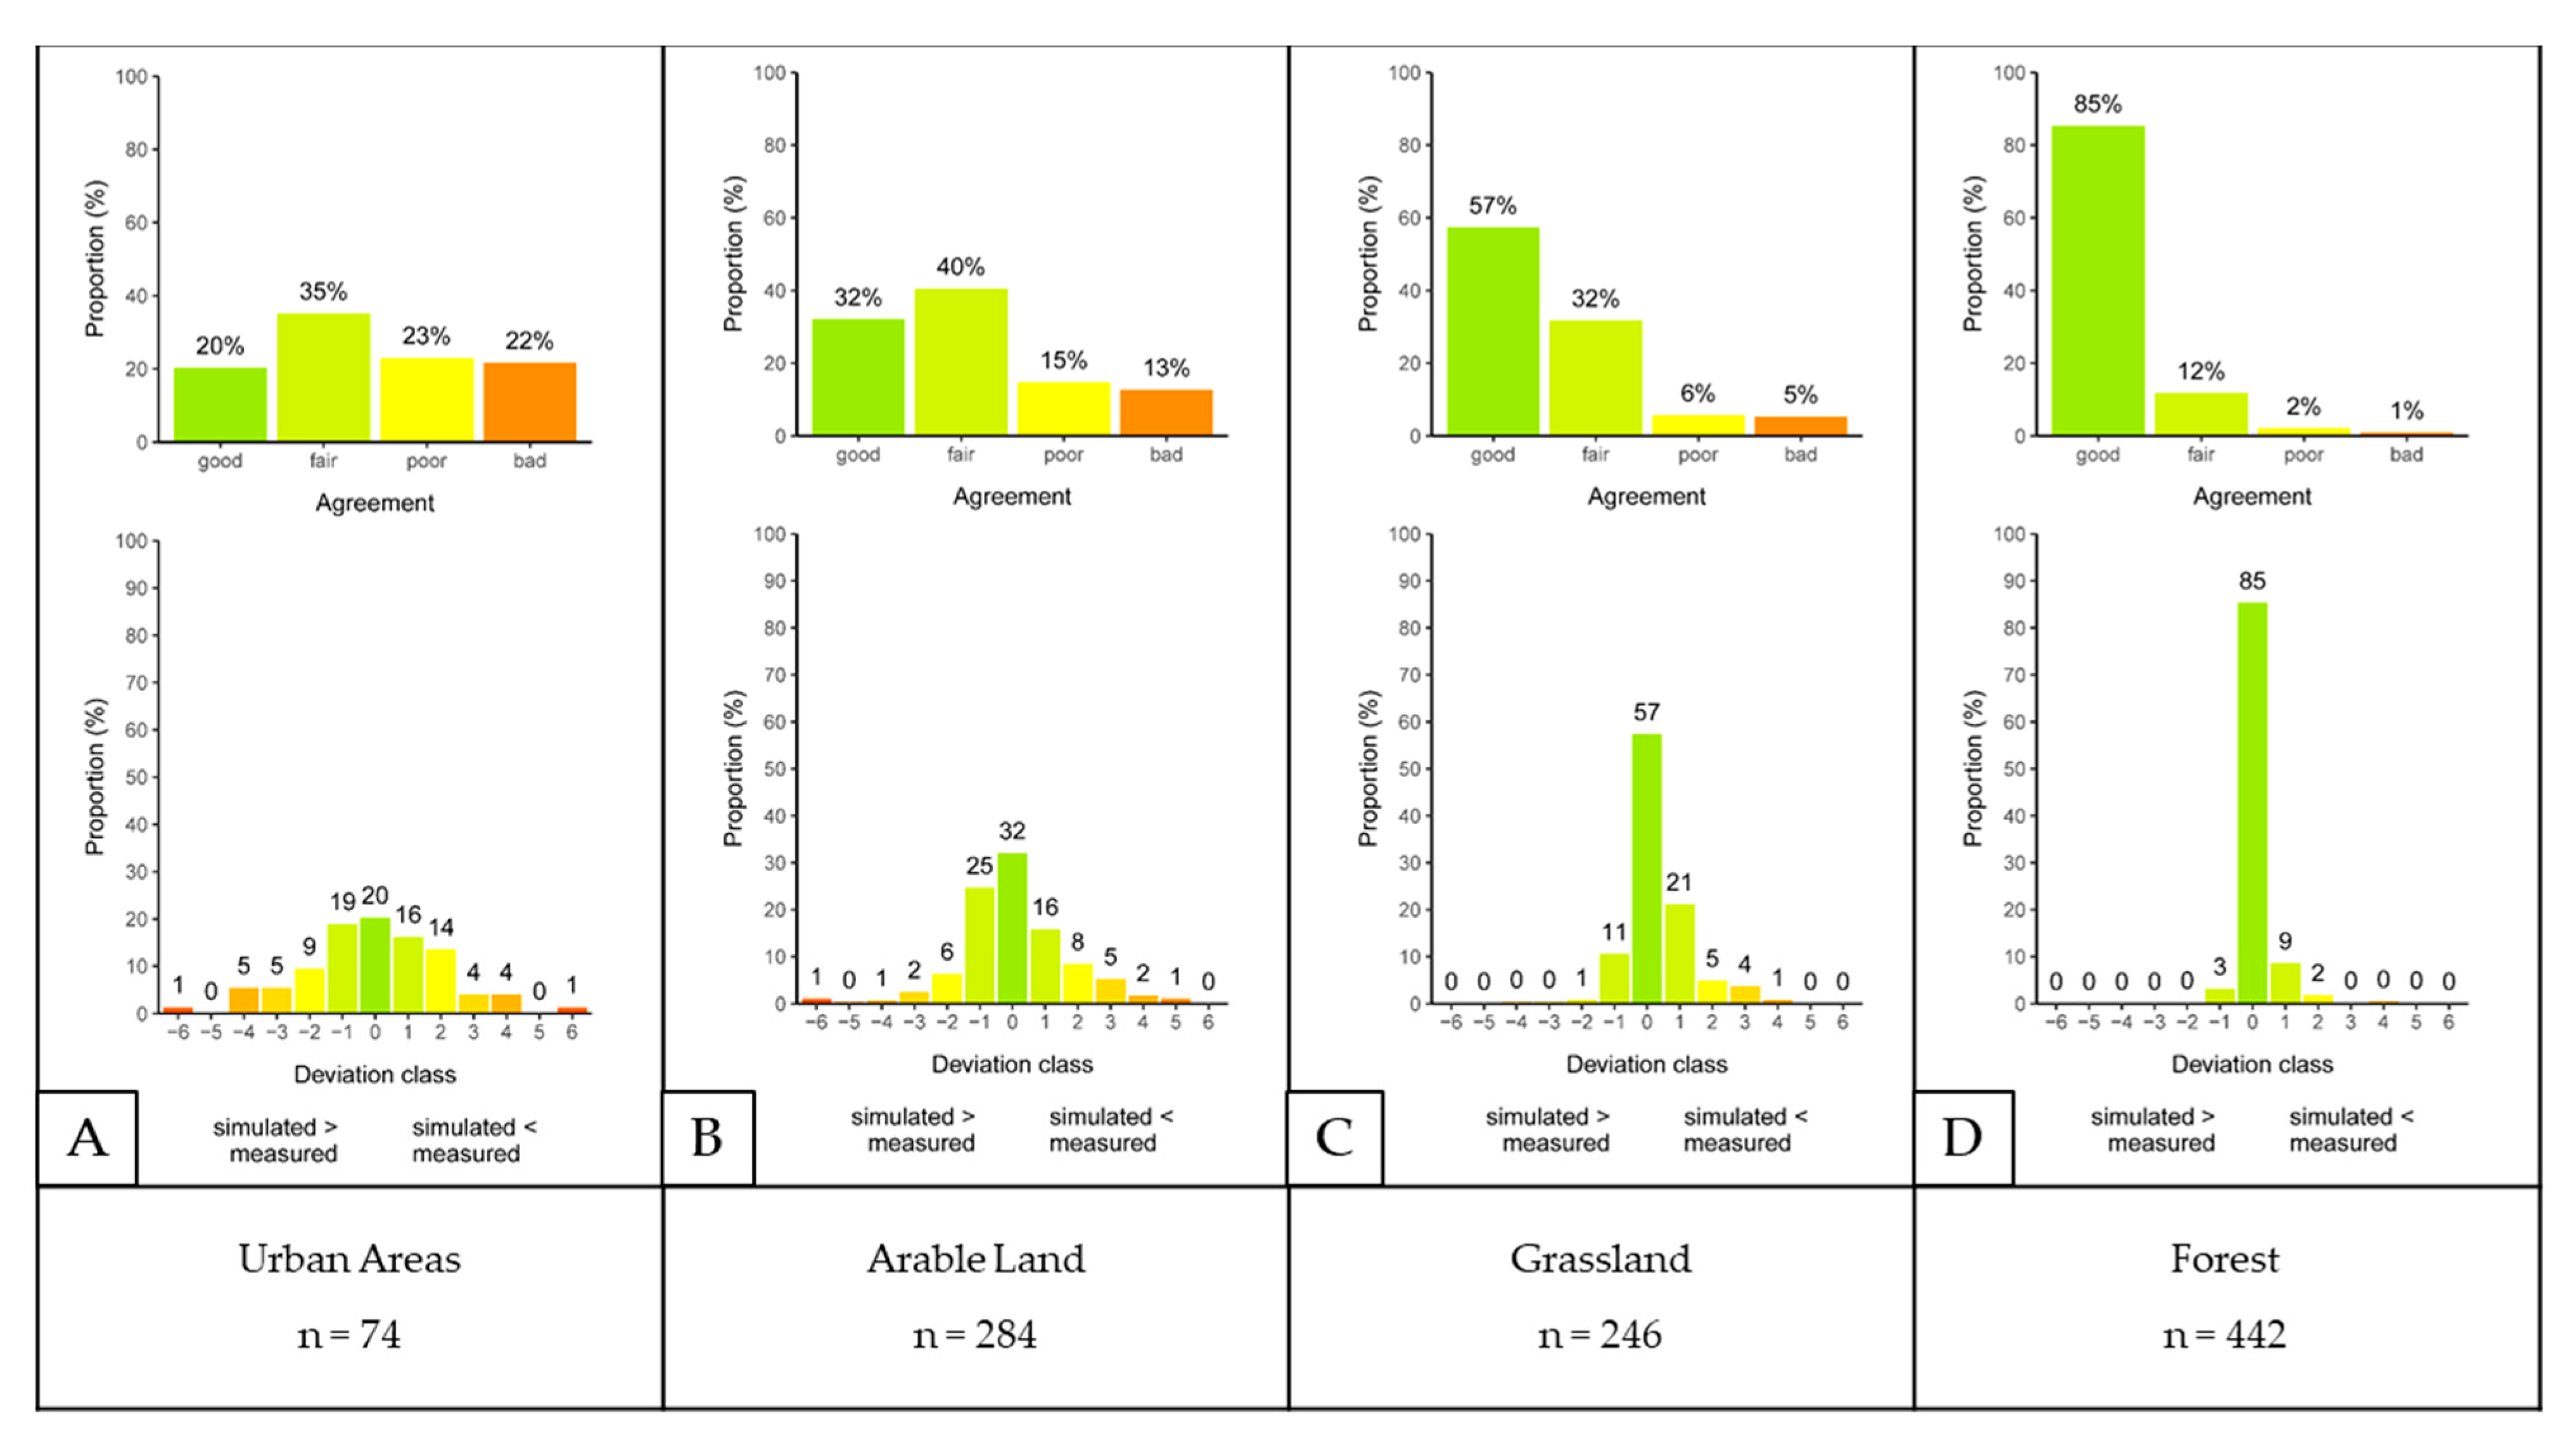
In a next step, modelled and observed concentrations were compared differentiated to four main types of land use, namely arable land, grassland, forest, and urban areas, derived from the digital land cover model LBM-DE2015. Decisive for the assignment of a monitoring station to a specific land use type was the dominant land use in the respective inflow area of a monitoring station and catchment area of a spring, respectively. The comparison of modelled nitrate concentrations in leachate and observed nitrate concentrations in groundwater is presented as frequency distributions in
Figure 8 and on the basis of values of 25-percentile, median, and 75-percentile in
Table 4.
Figure 8A shows the comparison of the modelled nitrate concentrations in the leachate of monitoring sites for the land use category of urban areas. After preselection, only 74 monitoring sites from urban areas remained for the comparison. For about 20% of these monitoring sites, a good agreement between the modelled nitrate concentrations in the leachate and the measured nitrate concentrations in the groundwater was found. While a deviation of one class was found for another 35% of the measuring points, clear over- and underestimations were found for 43% of the measuring points.
High deviation in both ascending and descending direction is probably due the homogeneous distribution of the “N-emissions from leaking urban systems” over the entire urban areas of the respective communities when calculating the nitrate concentration in the leachate, whereas the highest N emission occurs probably along leaking urban systems and decreases with increasing distance from them. Still, the distribution of simulated and measured values represented by median, Q1 and Q3 in
Table 4 shows that there is no sign of a clear systematic over- or underestimation.
Figure 8B shows the agreement of the modelled nitrate concentrations in the leachate of all monitoring sites for the land use category of arable land. A total of 284 monitoring sites from arable land remained for comparison after preselection. While for about 32% of these monitoring sites, a good compliance between the classes of the modelled nitrate concentrations in the leachate and the measured nitrate concentrations in the groundwater was found, 40% of the monitoring sites show a satisfactory fair compliance, i.e., the simulated nitrate concentration in the leachate is one class above or below the class of the observed nitrate concentrations in groundwater. Such deviations can be expected for the land use category arable land and interpreted as an indication of small-scale deviations in the fertilization level and/or in the cultivation of crops that could not be represented in the model.
In this context, it should be taken into account that for modelling at a federal states level, agricultural N-balance surpluses have been determined at the community level [
14]. Model calculations on nitrate concentrations in the leachate for regions where locally collected N-balance surplus data could be used in parallel with data available at the community level have already shown that the discrepancies to measured values in groundwater are indeed smaller when using locally collected fertilization data [
11,
46]. Against this background, a deviation of one class in the plausibility check for the land use category arable land can still be regarded as spatially representative so that it is neither necessary nor purposeful to recalibrate the model. The statistical parameters Q1 (first quartile) and median in
Table 4 show that the modelled values slightly overestimate the observed values. In order to improve the agreement of measured and simulated nitrate concentrations in future model applications, the coefficients used for assessing denitrification in soil may be increased.
Figure 8C compares nitrate concentrations at all monitoring sites where grassland is the main land use category. After applying the above-mentioned preselection criteria, 246 monitoring sites were available for comparison. Of these monitoring sites, 57% show a good agreement in the nitrate concentration classes, while 32% over- or underestimate the concentrations by one class. The frequency distribution shows a higher number of groundwater monitoring sites where the modelled nitrate concentrations in leachate are lower than the measured nitrate concentrations in groundwater. Accordingly, the concentrations at the Q1, median, and Q3 show a slight underestimation of the modelled values. It is likely that the coefficient for considering N immobilization in soil under grassland has been set slightly too low in the model. Nevertheless, the overall agreement of modelled and observed nitrate concentrations for the land use category of grassland can be regarded as very representative.
Figure 8D compares the nitrate concentration classes of simulated and measured monitoring sites where forest is the main land use category. Out of a total 442 monitoring sites in this category, 85% show a good and 12% a fair agreement. Since there is no N source other than atmospheric N deposition, the good agreement between the modelled nitrate concentrations in the leachate and the observed nitrate concentrations in groundwater is an indirect confirmation of the accuracy of the other factors contributing to the nitrate concentration in the leachate, mainly the modelled leachate rates and the coefficients accounting for N immobilization of forest soils.
8. Plausibility Checks Using Monitoring Data from the Area of Responsibility of the Erftverband
Complementary to the monitoring data from the monitoring networks of the federal states, monitoring data from the area of responsibility of an important water board in NRW were used for the plausibility check. More specifically, monitoring data from 1086 groundwater measuring points and wells from the period 2013 to 2018 from the area of responsibility of the Erftverband, i.e., an area of approx. 4200 km
2, were evaluated. This high number of suitable monitoring sites can be explained by the comprehensive documentation of the monitoring stations operated by the Erftverband with regard to hydrogeological conditions, filter positions, land use, and soil conditions.
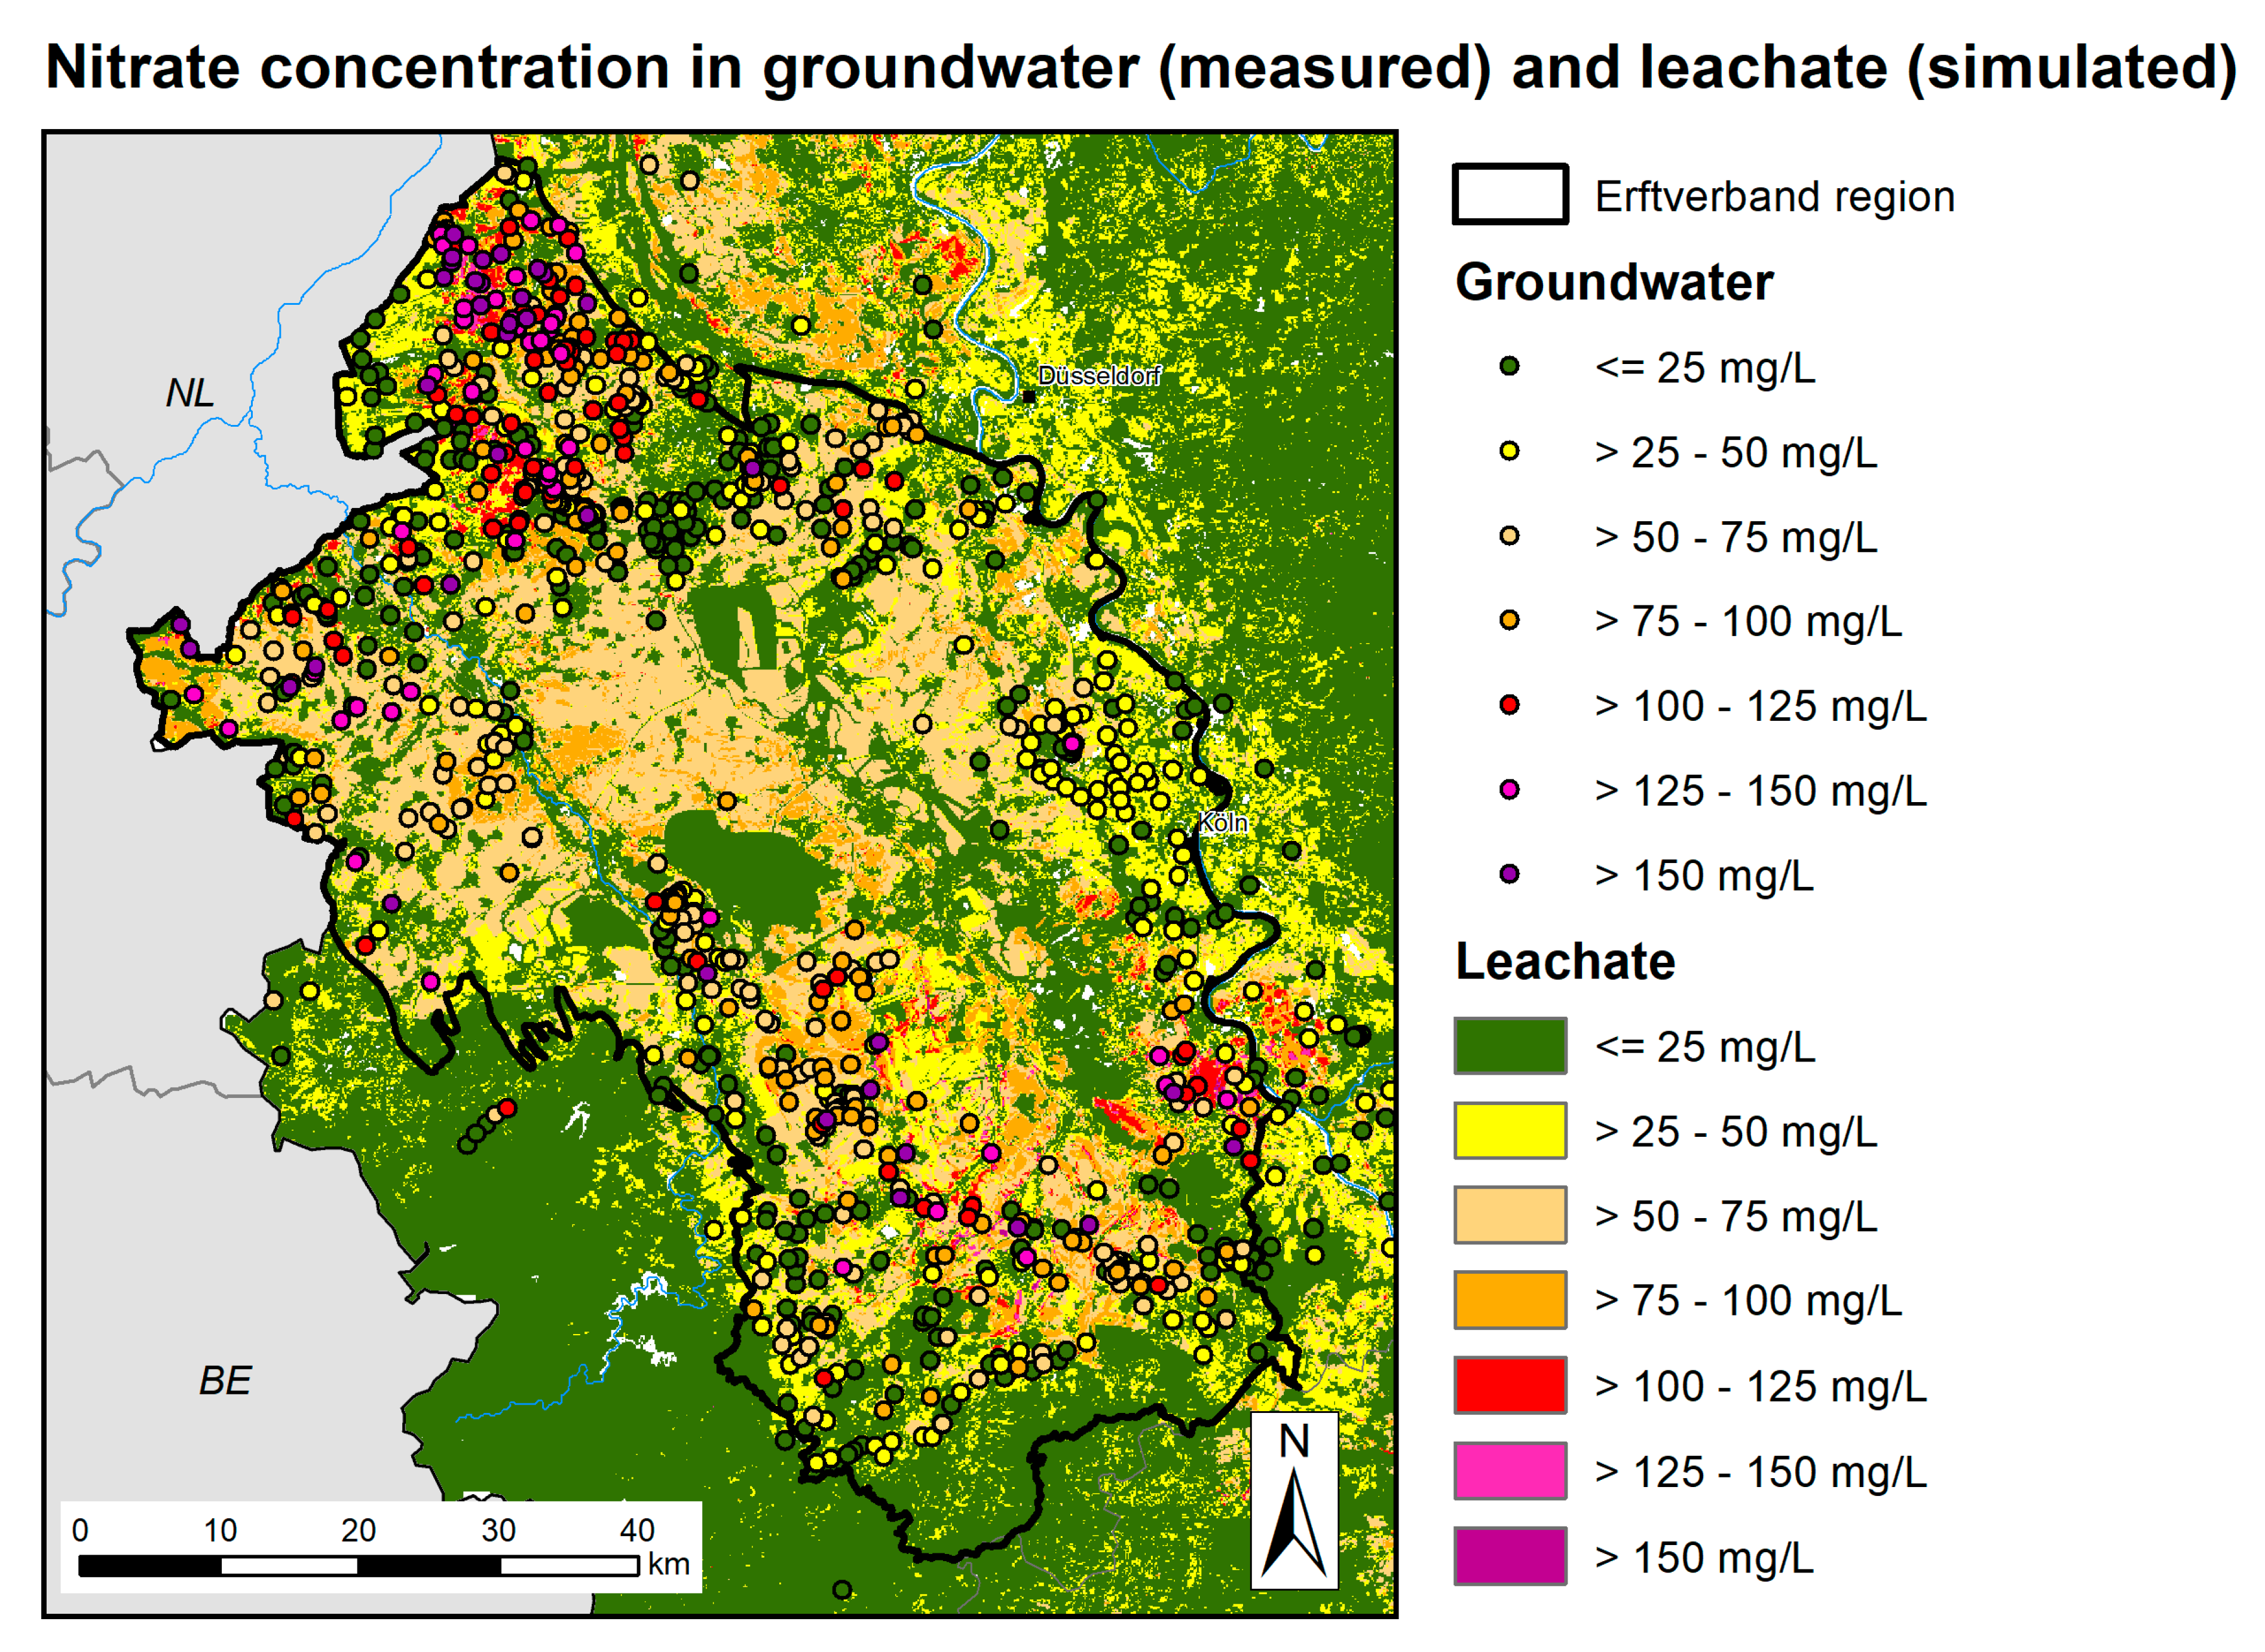
Figure 9 gives an overview of the comparison in the Erftverband region.
Same as in the previous section, the concentration class ranges of the measured nitrate concentrations in groundwater (dots) and the modelled nitrate concentrations in the leachate for the 100 m grids are presented in the same class widths and in the same color gradations. Model results and measured values in groundwater show a very good agreement with regard to both the level of nitrate concentrations and the spatial distribution, although the hydrological and pedological, but also the agricultural, site conditions are different and also change on a small scale.
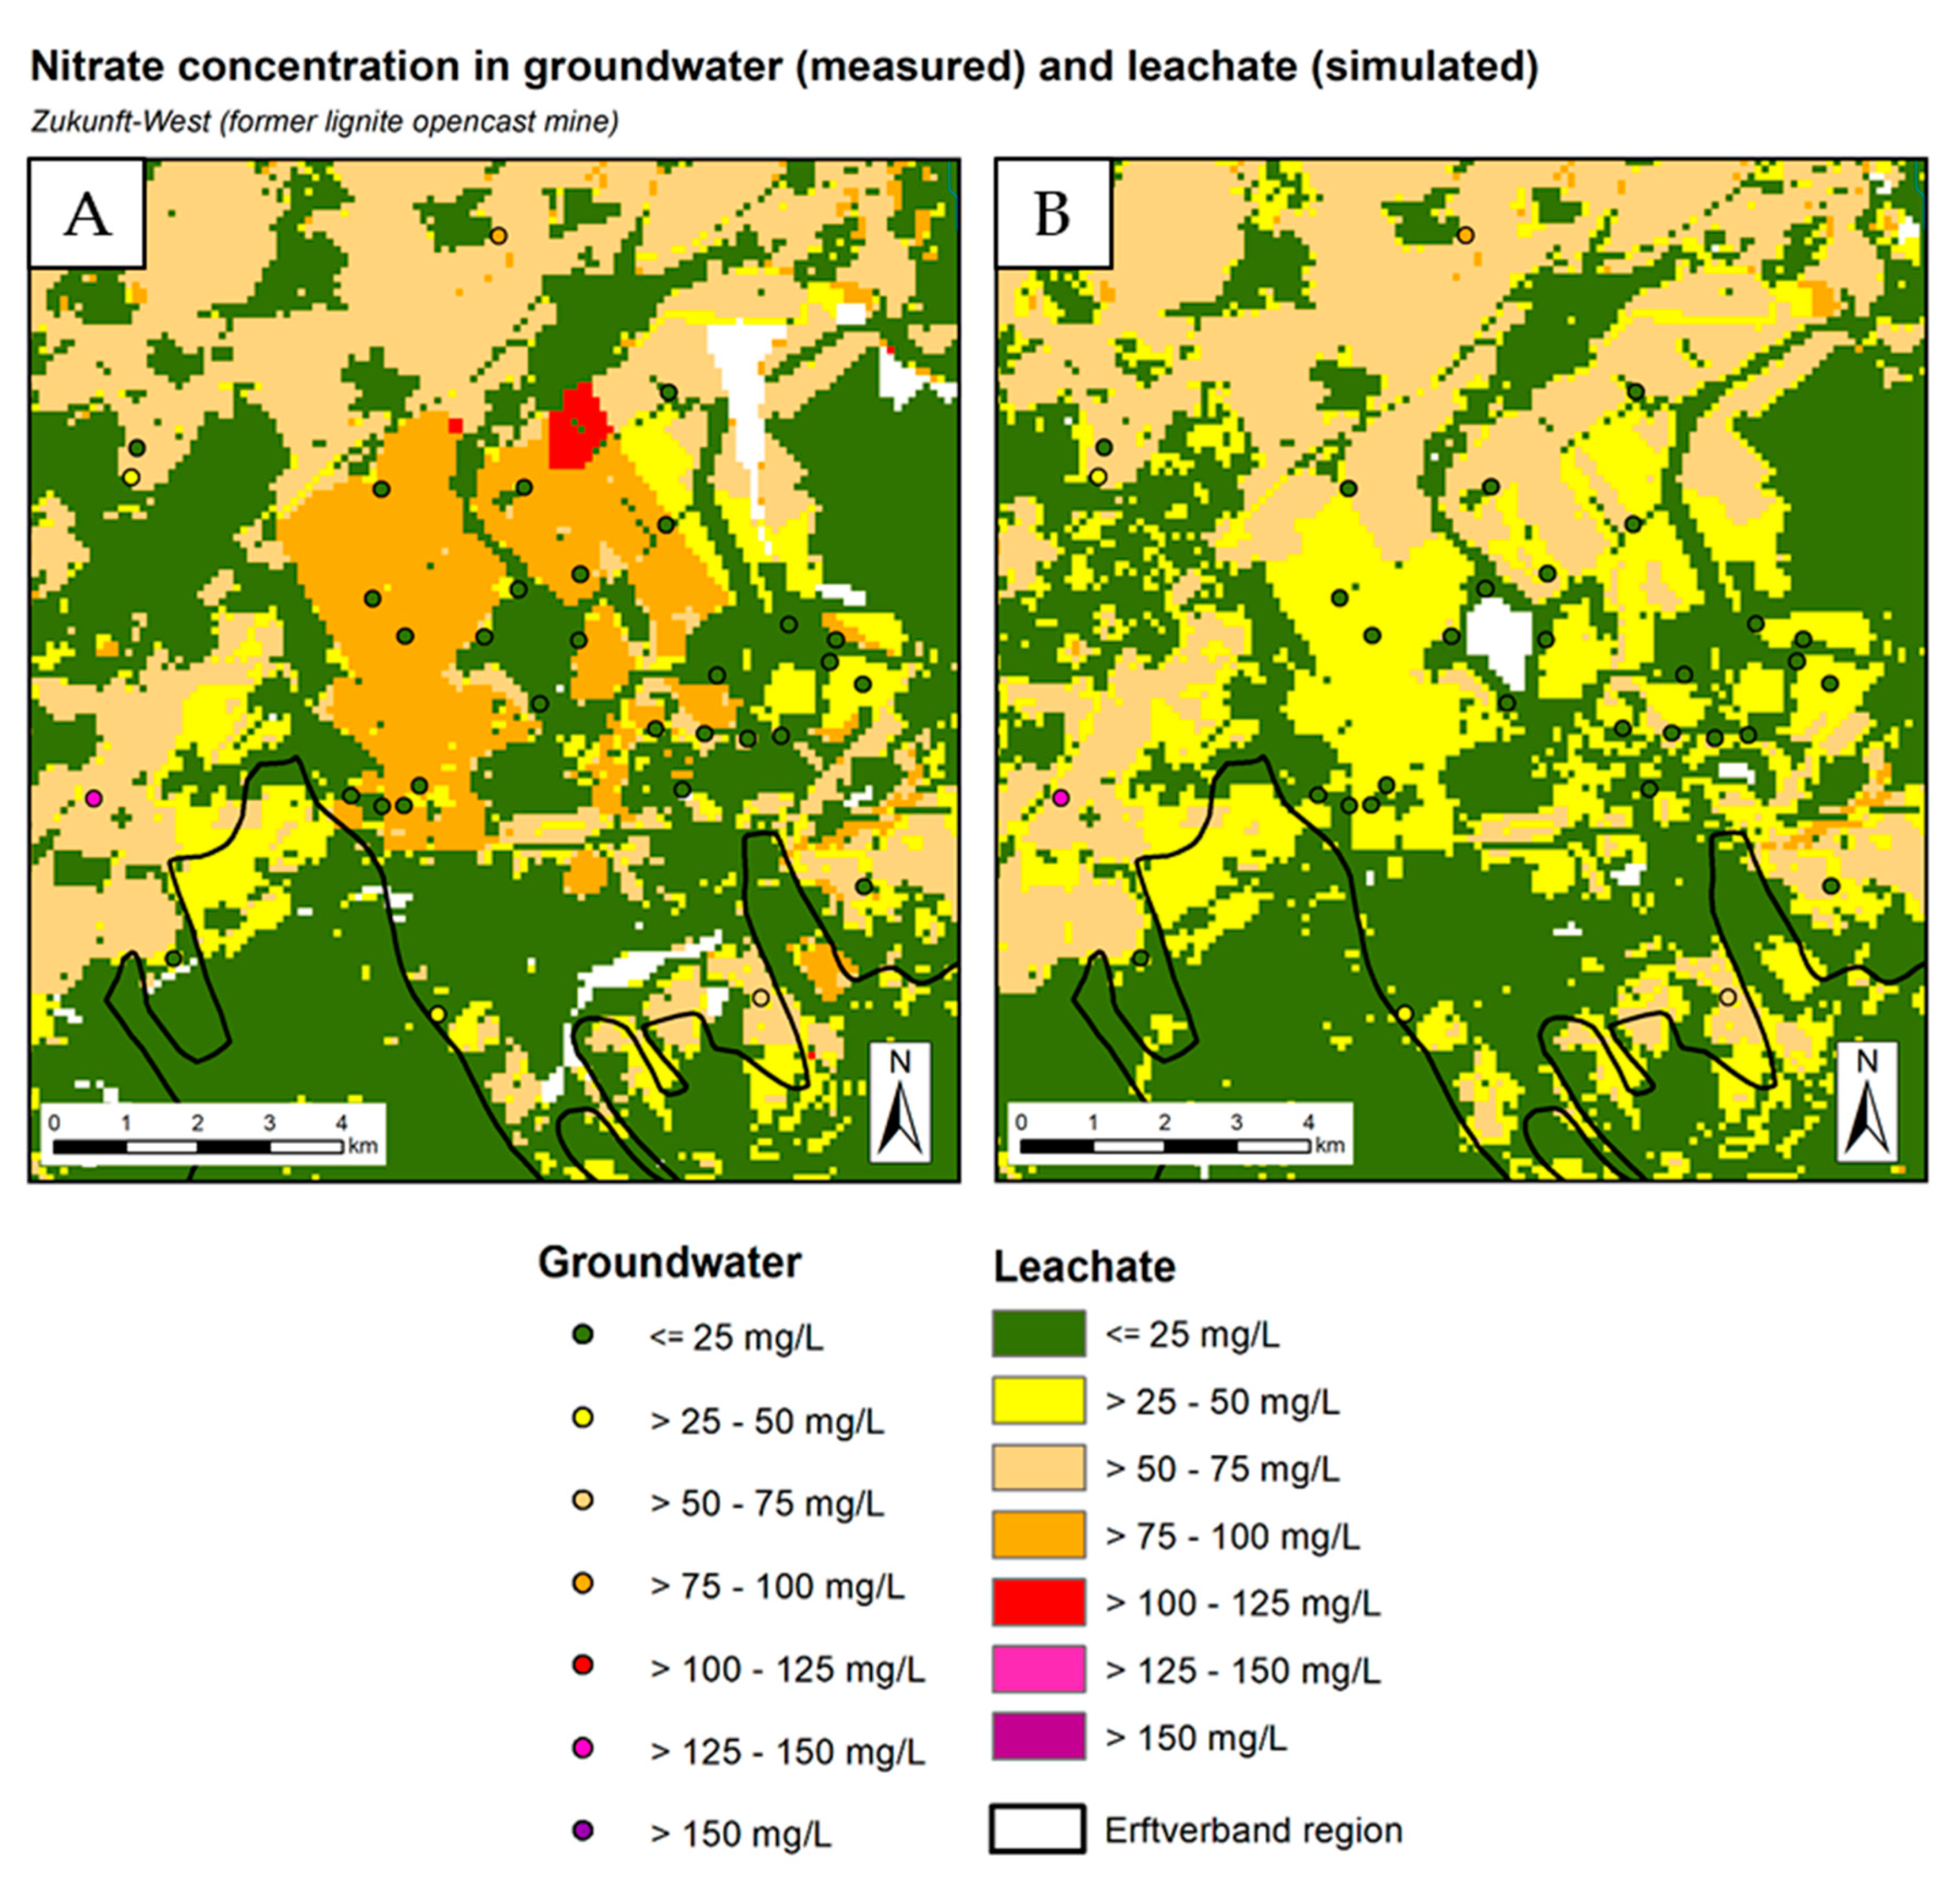
The very profound knowledge of local site conditions (soil, hydrogeology, land use, etc.) in the area of responsibility of the Erftverband offered a unique possibility to carry out selective verifications of modelled nitrate concentrations in the leachate, specifically in the case of larger deviations between modelled and measured values. The following figures show exemplary some sub-regions with significant discrepancies. Using these regions as examples, on the one hand, causes for deviations are pointed out and on the other hand, the implemented solutions in the model are presented.
Figure 10 shows a comparison of modelled nitrate concentration in the leachate (underlying colors) with measured nitrate concentrations in groundwater (spots) in an area of the former lignite opencast mine Zukunft-West. There, measured values in groundwater (<25 mg NO
3/L) were systematically overestimated by modelled nitrate concentrations in leachate (25–75 mg NO
3/L) in the first model run (
Figure 10A). Evaluation of the concentration ranges of the essential redox parameters (
Table 2) at the measuring points showed reduced groundwater conditions. Therefore, the discrepancy between the modelled nitrate concentrations in the leachate and the measured nitrate concentrations in the groundwater can be attributed to the denitrification processes of the groundwater taking place in this area.
A comprehensive analysis of the databases used for modelling has shown that the 1:50,000 NRW soil map indicates the category “soils made of backfill material” for the area in the center of
Figure 10 displaying nitrate concentrations in the leachate between 75 and 100 mg NO
3/L. Due to an assumed low organic carbon content, a low denitrification potential (nitrate degradation of max. 30 kg N/ha a) had been assigned to this soil category in the first model run.
Based on the Erftverband’s profound knowledge of the regional soil conditions, the assumed denitrification potential of this soil was corrected. More specifically, the high organic carbon content that these soils actually have has been taken into account by reclassifying the denitrification conditions of the soil unit “soils made of backfill material” from low to high (nitrate degradation potential of max. 100 kg N/ha a). This adjustment reduced the deviations between the model results and the measured values in a subsequent model run (
Figure 10B). This, again, was the reason to adapt the denitrification conditions of all “soils made of backfill material” in the lignite mining areas in the Lower Rhine Embayment and the Rhenish lignite mining area accordingly. As
Figure 10B shows, the modelled nitrate concentrations in leachate are in the range between 25 and 50 mg NO
3/L, i.e., still one concentration class higher than the observed values in groundwater. The still existing discrepancy between the modelled nitrate concentrations in the leachate and the measured nitrate concentrations in the groundwater can be attributed to the denitrification processes of the groundwater taking place in this area.
The same principle, only in reverse, has been applied in the lignite mining areas to the soil unit pseudogley. The regional knowledge of the Erftverband allowed, in this case, downgrading of the assumed denitrification potential of the pseudogley from high to low. Due to the influence of mining, the pseudogley indicated in the 1:50,000 soil map has not been affected by waterlogging for a long time. Thus, the assumed temporary or seasonal waterlogging due to poor drainage does not occur anymore. In reality, the pseudogley soils occurring in the lignite mining area are well-aerated, i.e., the occurrence of anaerobic conditions promoting denitrification in the soil is very unlikely. By downgrading the denitrification conditions of the pseudogley, the nitrate concentrations in the leachate of these soils showed a good agreement with the measured values in the second model run.
The two examples illustrate that deviations between model results and measured values may be explainable by a regional blurring of the input data (here, the 1:50,000 soil map) available at the federal state scale. Selective improvements of model input parameters are possible, but require profound regional expert knowledge.
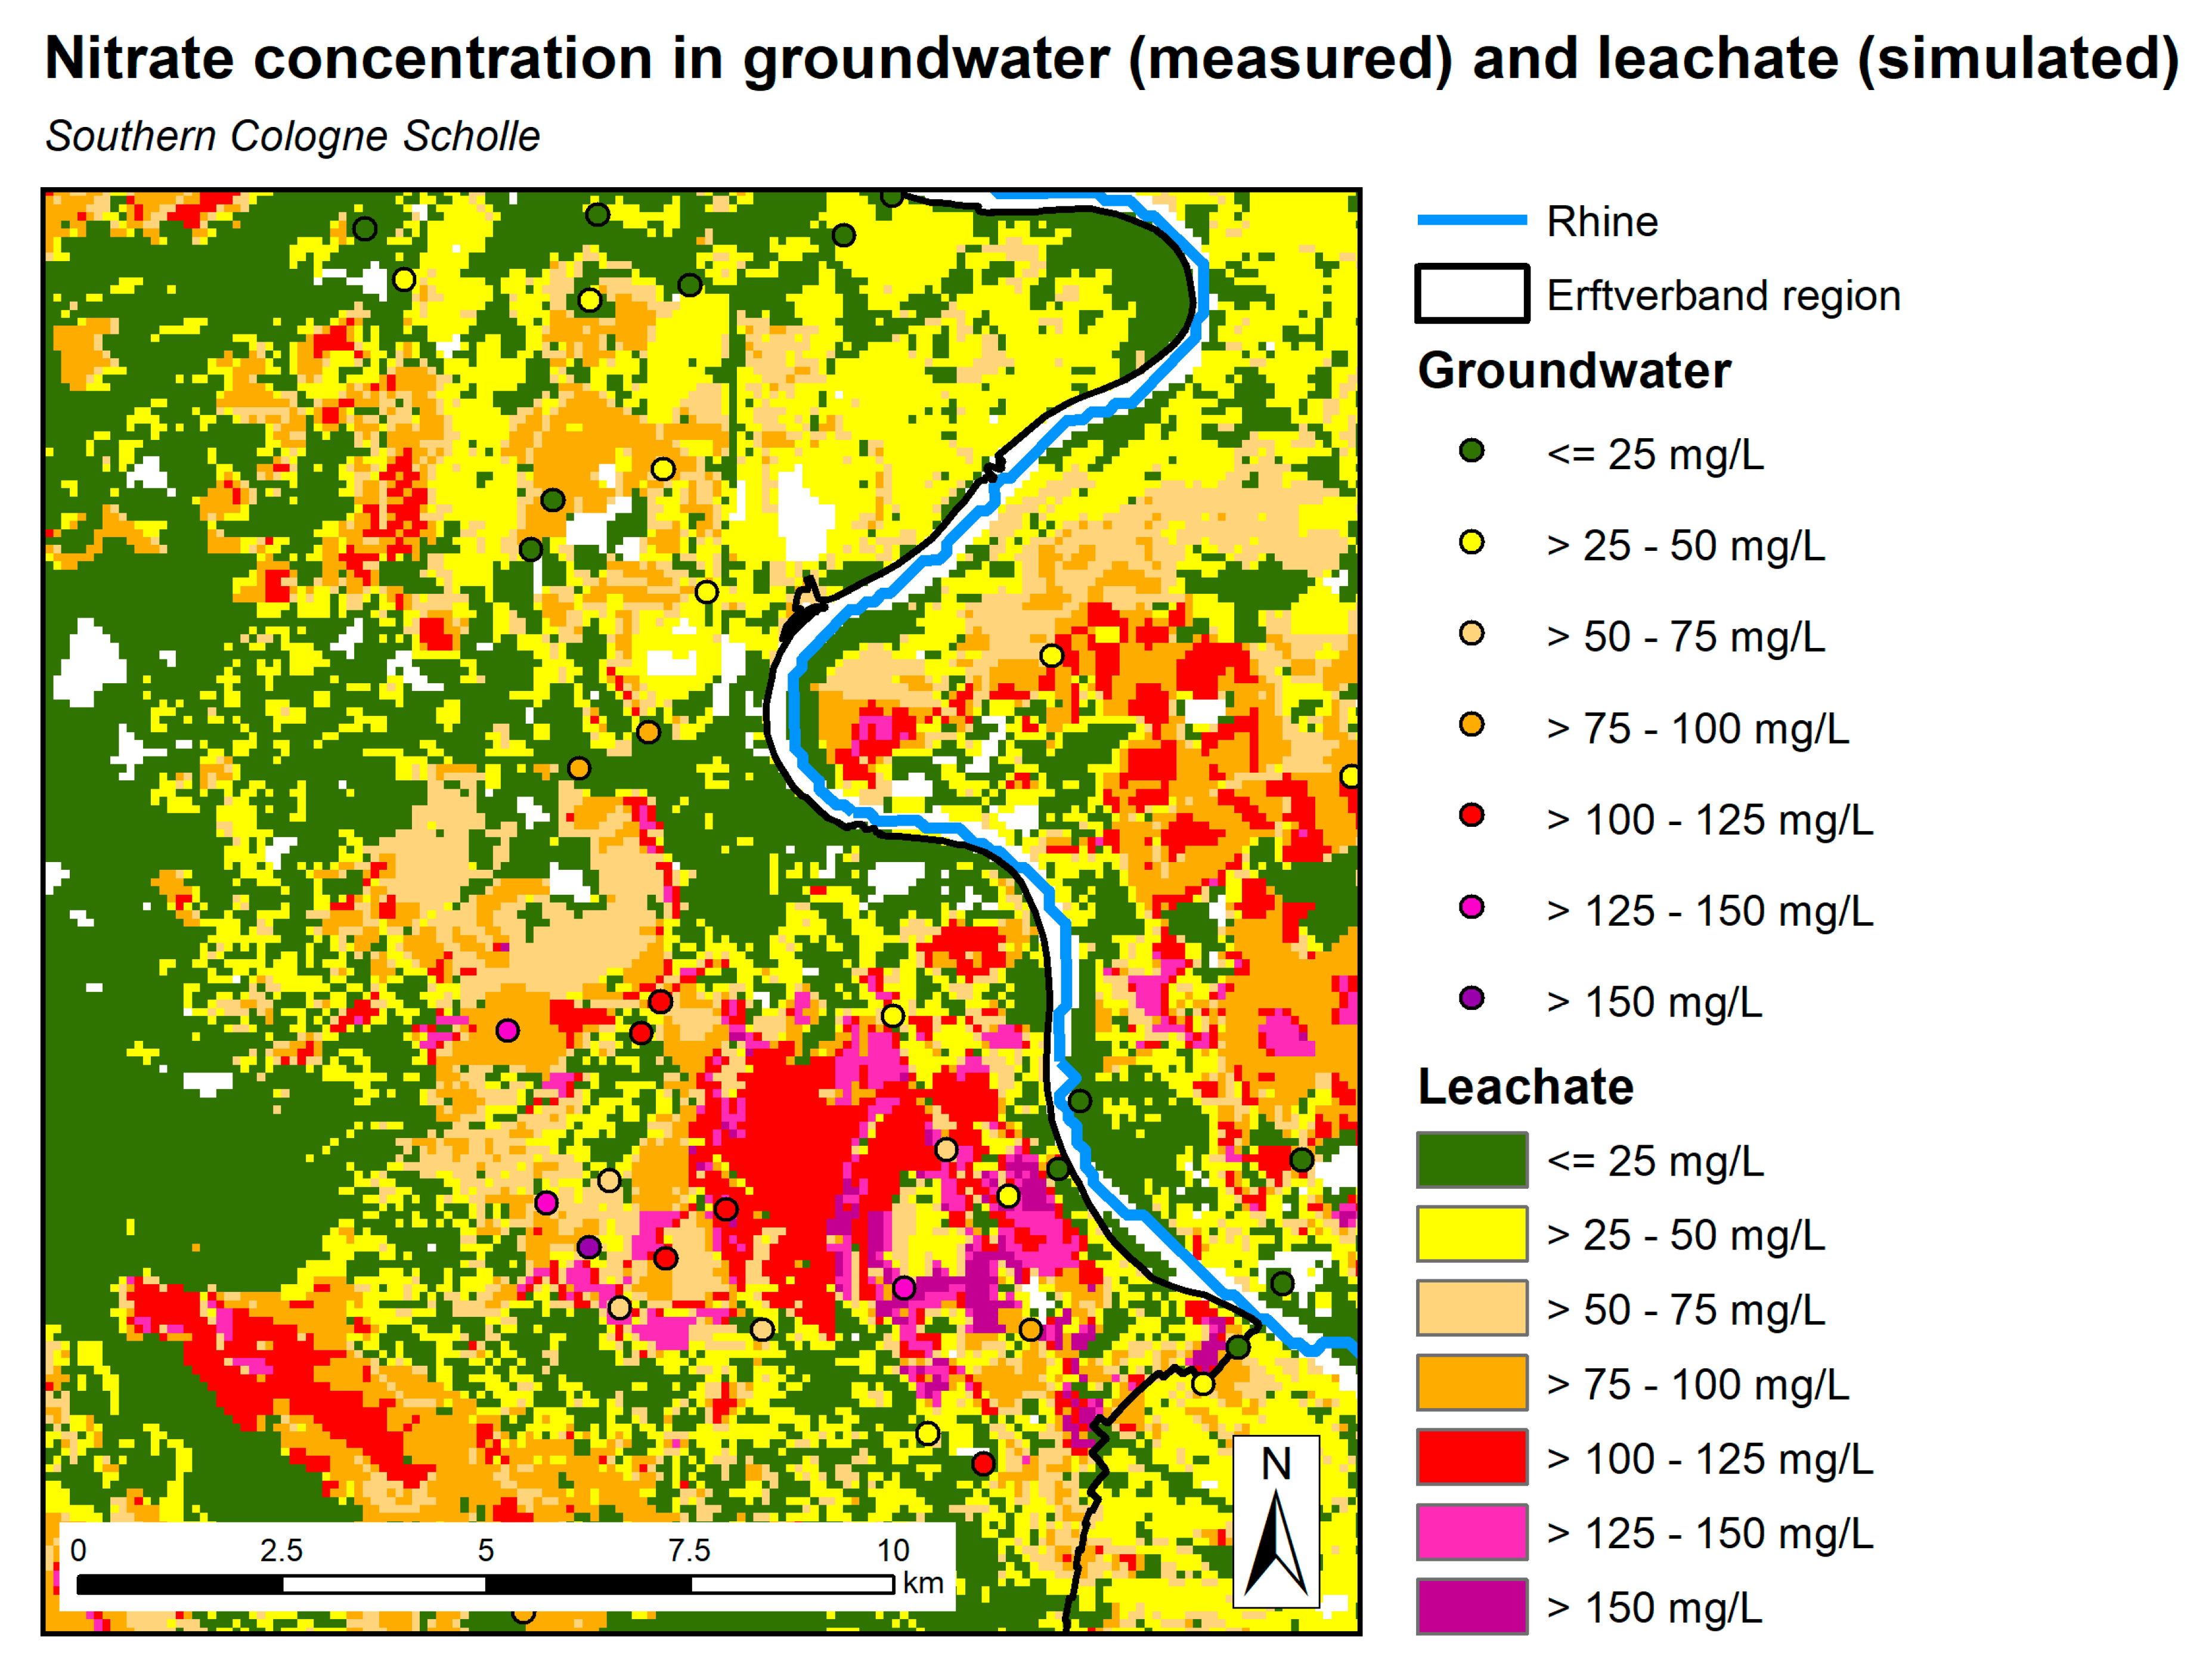
Figure 11 shows a generally good agreement between modelled nitrate concentrations in the leachate and the measured nitrate concentrations in groundwater for an area south of Cologne. However, large deviations occur for the Alfter region (
Figure 11, southeastern part of the map section). There, modelled nitrate concentrations in leachate of <10 mg NO
3/L are contrasted by a few measured values from groundwater at a level of >100 mg NO
3/L.
The detailed analysis of input parameters revealed for this area a regional blurring of the input data of the agricultural N-balance model RAUMIS. Whereas, in general, an extensive form of agriculture dominates in the Alfter region, the groundwater measuring points with the high nitrate concentrations are located in the vicinity of the few field plots where special crops are cultivated. Consequently, the high nitrate concentrations in groundwater mirror the high N-emissions from these plots. The example illustrates again the dependence of the model results from the input data available for the modelling.
For data protection reasons, agricultural N balances in NRW have been calculated with the RAUMIS model as average values at the community level. Thus, the (high) N-balance surplus of the special crop cultivation of the individual field plots in the Alfter region has been averaged out at the community level. The smaller the area of special crop cultivation compared to the total agriculturally used area in a community, the smaller the mean N balance surplus for this community and the bigger the difference to the N balance surplus of the individual field plot obtained. Exactly this situation applies to the municipality of Alfter. Special crop cultivation comprises <5% of the agriculturally used area of this community, whereas >95% of the agriculturally used area displays an extensive land use. Consequently, as the averaged N balance surplus has been used as input for the subsequent modelling of nitrate concentrations in the leachate, the modelled values are significantly lower than the observed high values in groundwater in the vicinity of the field plots with special crops. The only way to avoid misinterpretations and regional blurring in the model results is to increase the spatial resolution of N-balance surplus calculations, e.g., at the field plot level.
The example of the Alfter region also shows how much the regional agreement between the modelled and measured values may be influenced by the location of measuring points. In the Alfter region, measuring points were installed in the vicinity of field plots, where special crops are cultivated. Cultivation of special crops, however, is actually not representative in this region in comparison to the dominant, rather extensive form of agriculture.
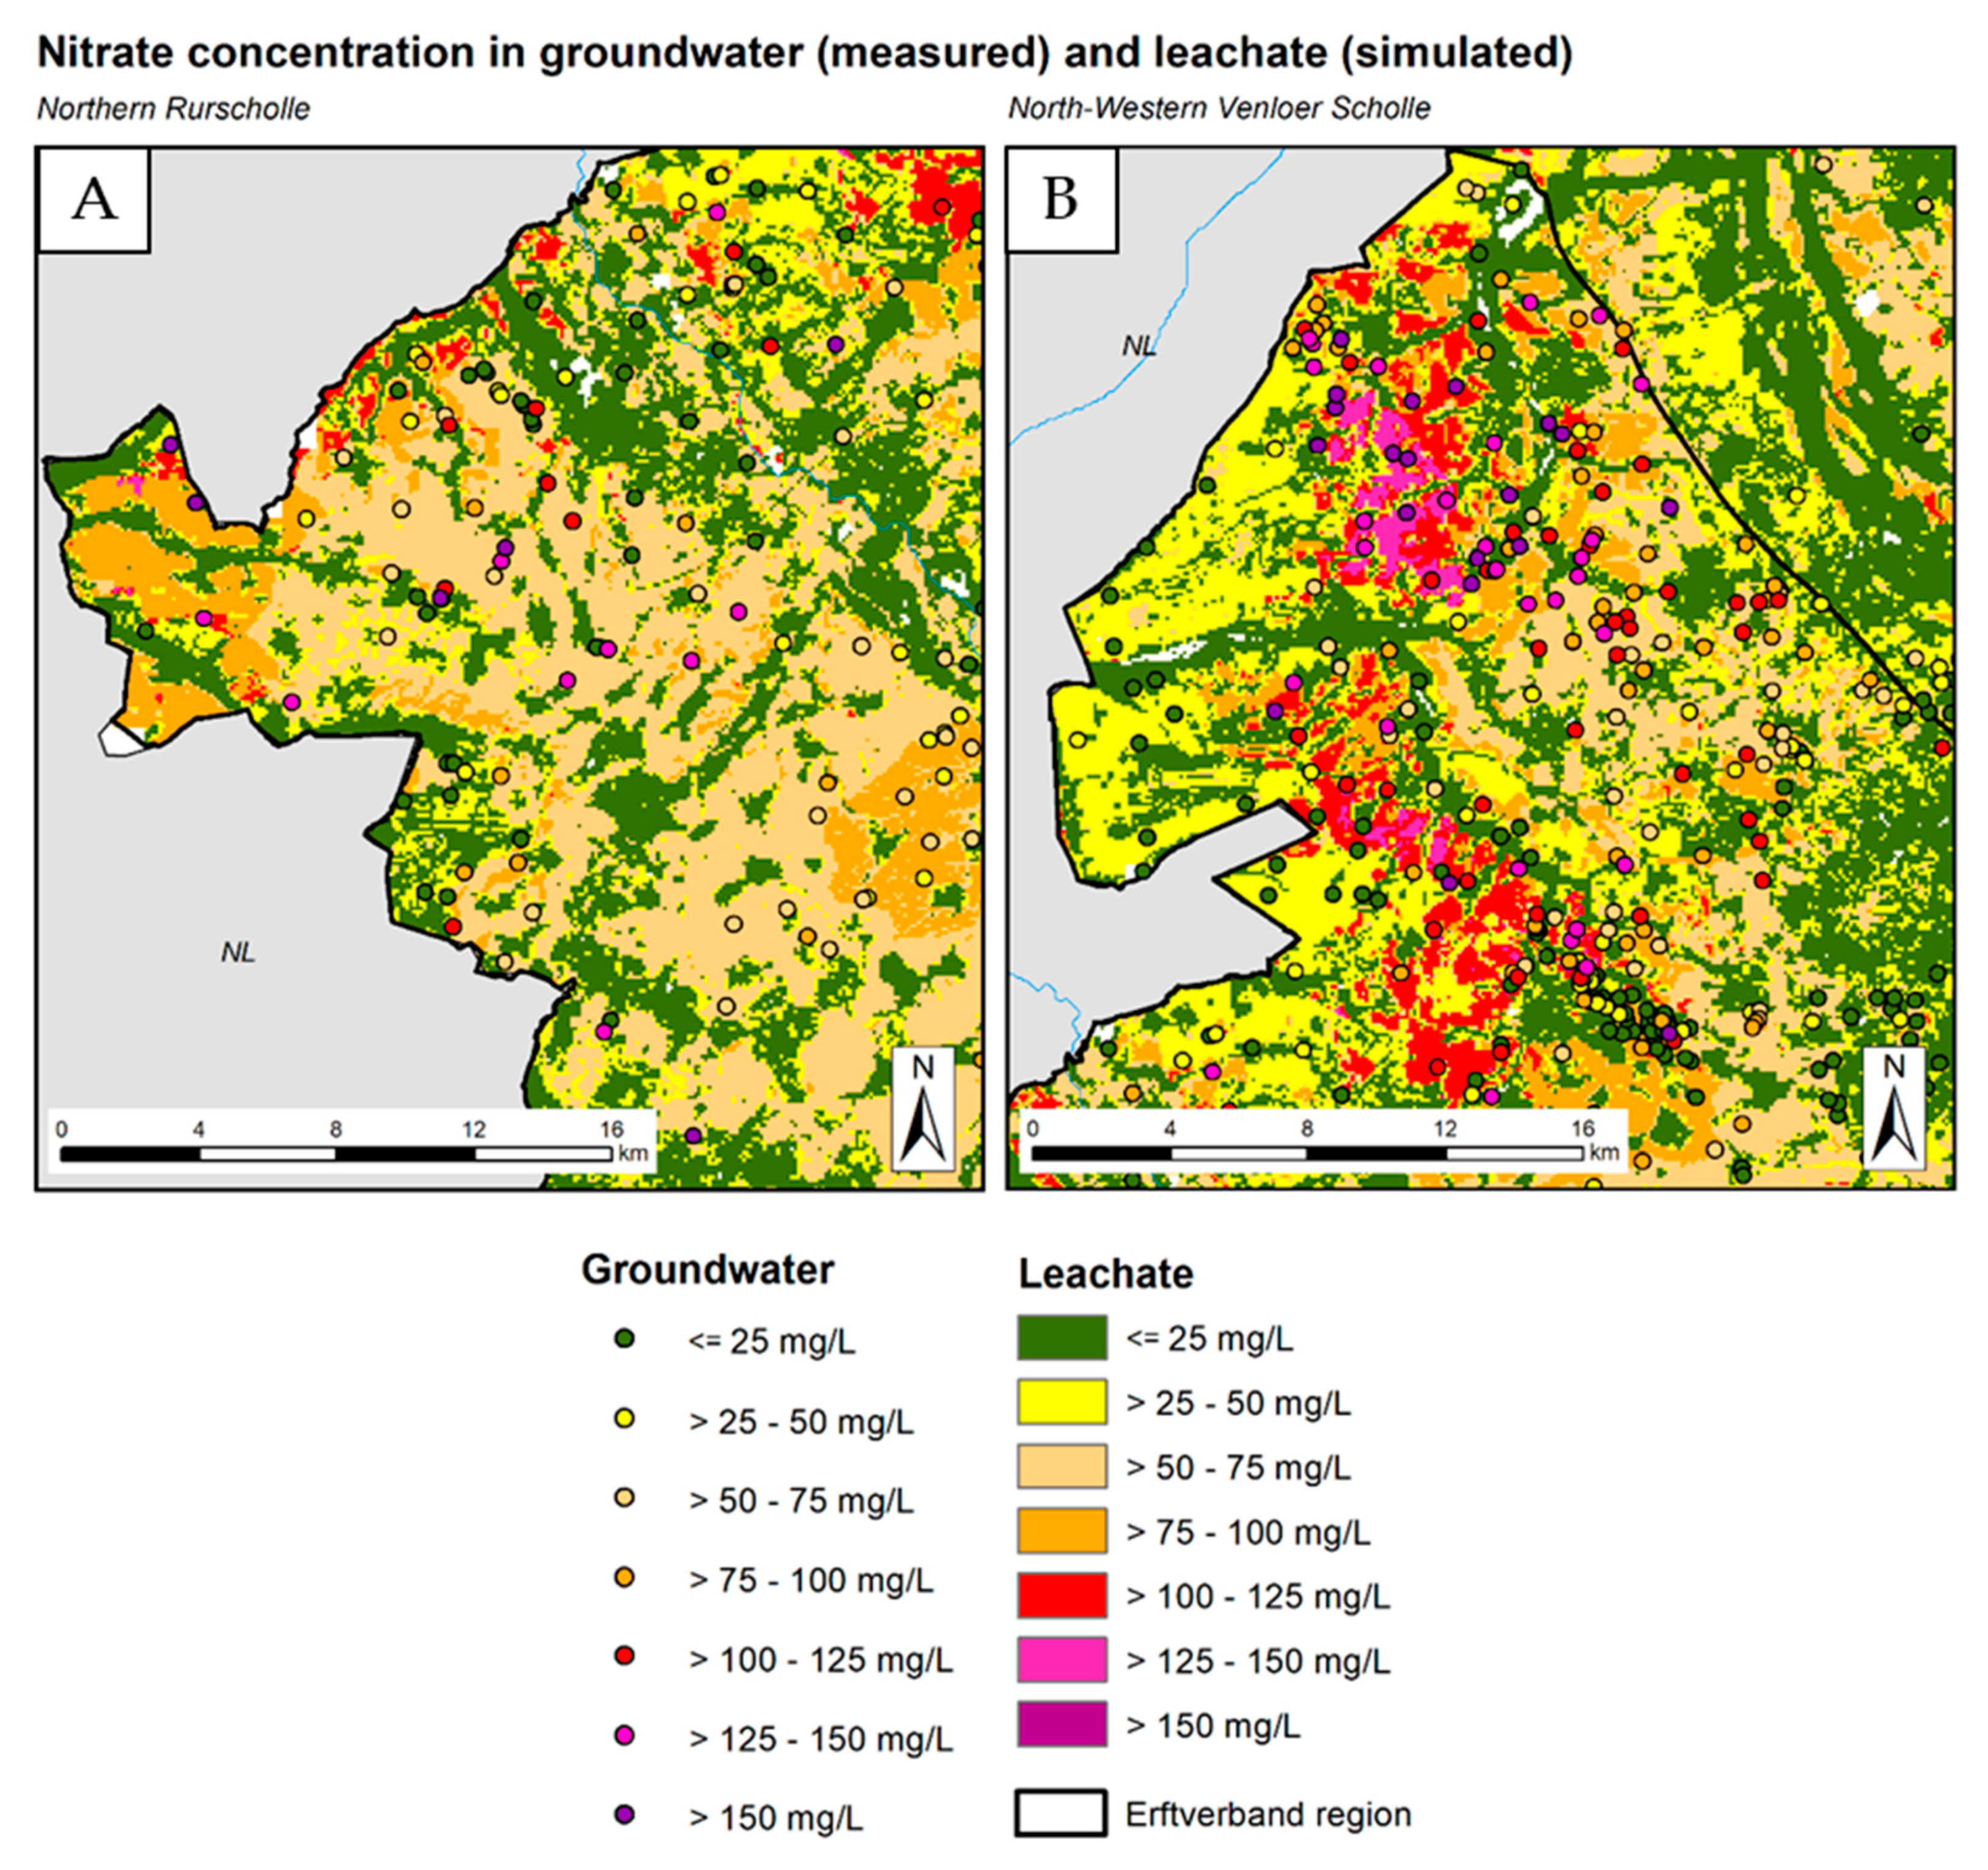
Large deviations between the modelled and the measured values were also found for individual measuring points for the northern Rurscholle (
Figure 12A) and for the northwestern Venloer Scholle (
Figure 12B). There, modelled nitrate concentrations in the leachate in the range of 75–100 mg NO
3//L contrast with nitrate concentrations in groundwater in the range of >150 mg NO
3/L.
A detailed analysis of the model parameters for this region has shown that the agricultural statistics included in the RAUMIS model do not contain any information on the illegal import of liquid manure from the neighboring Netherlands. The lack of this important additional N source in the calculation of the nitrate concentration in the leachate is an explanation for the deviation from the observed higher nitrate concentrations in groundwater. Another reason may be, as already discussed with the example of the Alfter region, the non-consideration of field plot-specific N emissions from special crops in the N balance surpluses at the community level.
9. Discussion and Conclusions
In Germany, the modelled nitrate concentration in leachate plays a central role in the dimensioning of nitrogen mitigation measures to achieve the groundwater quality objective according to the specific requirements of the EU Water Framework Directive [
8] as well as within the context of the recently adopted general administrative regulation for the designation of nitrate-polluted areas [
6]. Against this special practice-related background, the regional representativity and plausibility of modelled nitrate concentrations in the leachate calculated with the model system RAUMIS-mGROWA-DENUZ has been assessed for the federal German states of North Rhine-Westphalia and Rhineland-Palatinate as example regions. Peculiarity and novelty were to use measured nitrate concentrations in groundwater for this purpose.
Results of the plausibility check showed an overall good correspondence in the dimension and the spatial representation of the modelled and the observed nitrate concentrations across the dominant land use categories in both Federal German States. Four general conclusions can be drawn from this finding:
There is a clear indication that modelled nitrate concentrations in the leachate are a useful reference framework for assessing large-scale nitrate contamination of groundwater.
Apparently, the RAUMIS-mGROWA-DENUZ model system used to calculate the nitrate concentrations in the leachate in this study is capable of reliably representing the relationships and influencing factors that determine the nitrate concentration of the leachate on the scale of Federal States or countries. An application of this model system for the assessment of large-scale nitrate contamination of groundwater beyond the case study region can be recommended and has already been realized, e.g., [
46,
51].
Profound knowledge about local hydrological or agricultural site conditions in the area of responsibility of the Erftverband has shown that local particularities in the area surrounding a monitoring site, e.g., caused by a specific land use or by the occurrence of a sub-scale soil type, are often the reasons for deviations between modelled nitrate concentrations in the leachate and observed nitrate concentrations in groundwater. Based on this finding, we conclude that before recalibrating a nitrate leaching model with the goal of achieving a good fit to observed values, the input data to the model should be carefully reviewed.
The measured nitrate concentrations in groundwater from official monitoring networks like the ones used in this study for the plausibility check are available for many regions worldwide [
52]. The results of this study indicate that such observed nitrate concentrations in groundwater can provide a solid data source for checking the plausibility of modelled nitrate concentrations in the leachate, provided that certain preselection criteria are met:
Monitoring data are from the upper aquifer, since only this aquifer experiences direct nitrate inputs with groundwater recharge;
Monitoring data originate from aquifers with oxidative properties as nitrate inputs are usually reduced by denitrification processes in aquifers with reducing properties;
Monitoring data are from groundwater monitoring wells or shallow wells to exclude the effect of active pumping, i.e., the mixing of groundwater from different aquifer depths;
Geographical references for the comparison of modelled and measured values are the inflow areas of the measuring point.
After applying these preselection criteria, nitrate concentrations from groundwater monitoring networks can be recommended for this purpose. This issue is of general practical importance as nitrate concentrations from (official) groundwater monitoring networks are usually not exploited for checking the validity of modelled nitrate concentrations in leachate.

 ,
, 


