Article

From Monitoring and Modeling to Management: How to Improve Water Quality in Brazilian Rivers? A Case Study: Piabanha River Watershed

by
David de Andrade Costa
1,2,3,*,
Luis Carlos Soares da Silva Junior
1,
José Paulo Soares de Azevedo
1,3,
Marco Aurélio dos Santos
1 and
Rafaela dos Santos Facchetti Vinhaes Assumpção
3,4
1
Technology Center, Alberto Luiz Coimbra Institute for Postgraduate Studies and Engineering Research (COPPE), Federal University of Rio de Janeiro (UFRJ), Rio de Janeiro 20211, Brazil
2
Federal Fluminense Institute, Postgraduate Coordination in Water Resources Management and Sustainability, São João da Barra Advanced Campus, São João da Barra, Rio de Janeiro 20211, Brazil
3
Piabanha Watershed Committee, Alto da Serra, Petrópolis 25685, Brazil
4
Oswaldo Cruz Foundation (Fiocruz), Sanitation and Environmental Health Department, National School of Public Health Sergio Arouca, Rio de Janeiro 20211, Brazil
*
Author to whom correspondence should be addressed.
Water 2021, 13(2), 176; https://doi.org/10.3390/w13020176
Submission received: 25 November 2020 / Revised: 5 January 2021 / Accepted: 7 January 2021 / Published: 13 January 2021
(This article belongs to the Section Water Resources Management, Policy and Governance)

Abstract

:
Water quality has been a global concern, as evidenced by UN Sustainable Development Goals. The current paper has focused on the Piabanha River rehabilitation as a case study which can be generalized to other similar watersheds. A monitoring program during a hydrological year was carried out, and different databases were used to calibrate and validate the QUAL-UFMG water quality model. Sanitation is the major problem in the watershed, notably in its headwater catchments, which concentrate the most urbanized regions where water quality is worse in the dry season due to low river flows. Thus, simulations of the river water quality have been performed through computational modeling suggesting organic load reductions in some sub-basins. In conclusion, some strategies to improve water quality have been discussed: (i) The water quality rehabilitation must consider progressive goals of pollution reduction starting with an initial implementation in a reduced area. The monitoring should be based on a few parameters relevant and simple to monitor. (ii) Pollution reduction ought to be carried out strategically with deadlines and intermediate goals that must be agreed upon between the stakeholders in the watershed. (iii) Watershed committees should supervise projects to improve water quality in partnership with the State Prosecutor’s Office.

1. Introduction

The water quality of rivers has been compromised by anthropogenic pressure in watersheds [1,2], especially in developing countries, where the coverage of sewage systems does not keep up with increasing urbanization [3]. Untreated or poorly treated sewage [4], diffuse sources from agriculture with fertilizers [5,6], soil erosion [7], industrial activities [8,9], mining activities [10], and environmental accidents [11] are among the main factors that compromise water quality, besides political and regulatory issues [12]. Among the sustainable development goals (SDG) set by the United Nations, goal 6.3 reads as “By 2030, improve water quality by reducing pollution, eliminating dumping and minimizing release of hazardous chemicals and materials, halving the proportion of untreated wastewater and substantially increasing recycling and safe reuse globally” [13]. In other words, it means that river water quality and pollution control are global concerns.
Reliable water quality assessment through monitoring programs is fundamental to management activities aimed at protecting water resources [14,15,16]. However, traditional water quality monitoring programs undertaken by individual agencies normally relate to specific objectives, such as meeting quality criteria for wastewater discharges and thus generally fail to provide information on the basin-scale [17,18]. In this regard, water quality models can be an important auxiliary tool for effective water management, assisting decision-making by providing water quality simulations from a reduced number of monitoring stations [19]. Besides, modeling allows simulations of water quality scenarios in response to interventions in the watersheds, such as the installation of new wastewater treatment plants, new industries, or any other interference.
In order to face water resources challenges arising from human activities, Agenda 21 of the United Nations Conference on Environment and Development called for “application of integrated approaches to the development, management and use of water resources” [20]. Since then, 80% of countries have implemented reforms towards an integrated approach with significant positive impact on the development of water management practices at country level [21]. Integrated water management can be a powerful planning tool to address society’s water needs, since it considers all water sources and uses in a water system and can be implemented by adopting various approaches, such as Integrated River Basin Plans [22,23,24].
In this way, water governance holds the key to solving water problems in developing countries [24,25,26]. Notwithstanding, several issues still remain as challenges to the success of the management of water as a natural resource [27]. For example, the majority of developing countries manage water services on a subnational level, making the quality of local governance the main ingredient for improvements in the sector [28]. In fact, this decentralization gives sanitation responsibility to municipalities that generally lack the necessary resources to face this challenge [29,30].
According to the World Water Assessment Programme (WWAP) [31], about 80% of all wastewater is discharged with no treatment whatsoever. High-income countries treat up to 70% of their wastewater and upper-middle-income countries near 38%, while lower-middle-income and low-income countries barely reach 28% and 8%, respectively. In Brazil, about 50% of wastewater is treated safely (SDG 6.3.1 indicator), at least with organic load removal, but some of the main Brazilian cities have low rates of wastewater treatment, such as those in State of Rio de Janeiro, which reach only 36% [32]. Despite this, at the national level, Brazil has 69% of water bodies with good water quality (SDG 6.3.2 indicator) [32]. On the other hand, about 80% of Brazilian surface water resources are located in the Amazon region, with very low population density, meaning that pollution is concentrated in other regions [33]. Seeking to reverse this scenario, a new sanitation law was recently approved (Federal law 14026/2020) in Brazil, which aims to ensure that 90% of the population will have sewage collection and treatment by 2033.
Therefore, water governance in Brazil is a key element to achieving this goal. Brazil’s National Water Resources Policy [34] established a decentralized management with representatives of the government, bulk water users, and organized civil society. In addition, it established the watershed as the territorial management unit. It has also created the so-called watershed committees, acting as water parliaments. Their structure is democratic and their elected members, who are volunteers, decide how their funds are applied, while the technical and administrative support are provided by a water agency. The management of Brazilian watersheds is based on five management instruments provided by the Water Act [34,35]: water resources plans; water quality objectives, which are divided into usage classes (named in this article as “Framing” or “framework”); water rights permits; water charges; and the water resources information system.
According to the SDG 6.5 indicator, the degree of implementation of integrated water resources management in Brazil has a score of 53.8 out of 100 [32]. This means that despite some advances since the Water Law was enacted, there is still a gap between the management instruments and their practical application. Among the Brazilian water resources instruments, two are directly related to integrated management planning. The first is the Water Resources Plan, developed at national, state, and watershed levels and the second is the Framing, which basically consists in establishing the water quality target (class) to be achieved or maintained in a water body stretch, according to the intended preponderant uses [36]. In this sense, Framing is the legal instrument for improving the quality of Brazilian rivers, which must work in tune with the river basin plan [12]. However, after two decades of the Water Law, only 50% of Brazilian states own normative acts that fully or partially framed their bodies of water, and even in these states, the number of rivers framed is frighteningly small [33]. Moreover, few studies are found on this subject [12,37,38], evidencing a gap in the Brazilian water resources management.
So, how to improve water quality in Brazilian rivers? To answer this question, we took the Piabanha watershed as a case study. The objectives of this study were (i) to diagnose urban pollution on the Piabanha River, (ii) to model the organic load reductions to achieve the established water quality scenarios, and (iii) to propose the river framework in order to establish strategic implementation guidelines.

2. Materials and Methods

2.1. Study Area

The Piabanha watershed (Figure 1) has a drainage area of 2050 km2 and over 535,000 inhabitants. The region presents a humid tropical climate with mean accumulated annual precipitations ranging from 2000 mm in Petrópolis to 1300 mm in Três Rios. Piabanha River’s headwater is located at an altitiude of 1150 m and it flows about 80 km towards Paraiba do Sul River, at 260 m elevation above mean sea level. The altitudes were obtained from the digital elevation model (DEM) from the Geomorphometric Brazilian Database (TOPODATA) [39] with a spatial resolution of 30 m derived from the Shuttle Radar Topography Mission (SRTM). The altimetry data were used to extract the longitudinal profile of the river.
The region runs a diversified economic sector, including several industries, retailers, services, and agriculture activity. In the industrial segment, there are about 30 companies where beer, food, and textile industries stand out. The preponderant water uses in the watershed include water supply for human consumption, industrial production, preservation of aquatic communities, irrigation, fishery, swimming, landscape harmony (for social and cultural purposes), and preservation of riparian vegetation [40], as well as sewage dilution, recognized as the largest pollution source in the watershed [37,41,42,43].
Petrópolis and Teresópolis are the two largest cities in the watershed and have intense economic and tourist activities. These municipalities exhibit unplanned growth and land degradation, i.e., occupation of both rivers’ riparian strips and hillsides [42,43]. In this context, the Piabanha Watershed Committee (CBH-Piabanha) is responsible for promoting the region’s water resources management under the terms of State Law No. 3239/1999, thus leading the CBH-Piabanha to establish the Framing of the Piabanha River as a priority in its strategic planning for the period 2018–2020.

2.2. Datasets

In order to obtain a water quality diagnosis, calibration, validation, and simulation of a water quality model, some data sources were used.

2.2.1. Hydrological Data

In terms of hydrology, 80 years (1939–2019) of precipitation data from seven rain gauge stations distributed in the watershed, and one flow station at the discharging point of the Piabanha River were analyzed. The database was from the Brazilian National Water Resources Information System (SNIRH) [44]. The quantile technique was applied [45,46] to define wet and dry seasons for comparison. This statistic method describes a dry season as the period in which the accumulated rainfall is less than 30% in relation to the normal rainfall distribution.

2.2.2. Water Quality Time Series: Calibration Dataset

The State Environmental Institute (INEA) provided data from its systematic monitoring, which maintains five stations in the watershed, only two of which are on the Piabanha River, with data from 1980 to the present. In addition, the Geological Survey of Brazil (CPRM) provided water quality monitoring data from the partnership implemented in 2009 by the Integrated Studies of Experimental Basins project (EIBEX) and continued until 2018 by the Ecological Hydrograph project (HIDROECO) [42,47]. We have analyzed the dataset period from 2015 onwards.

2.2.3. Water Quality Monitoring: Validation Dataset

In order to complement and to update the previous dataset in the study area, the Piabanha Watershed Committee designed its own sampling network to monitor a hydrological year from June 2019 to May 2020, in which, monthly samples were analyzed at nine sampling points in the Piabanha watershed (Figure 1). Further details of the monitoring network can be found in Costa et al. [37] and AGEVAP [48]. Several water quality parameters were analyzed—electrical conductivity, water temperature, turbidity, dissolved oxygen, pH, total dissolved solids, suspended solids, alkalinity, biological oxygen demand, chemical oxygen demand, Escherichia coli, soluble reactive phosphorus, total phosphorus, nitrate, ammonia, and total nitrogen. However, we have focused on a few parameters as recommended by the Brazilian National Water Agency (ANA) [49] for river framing purposes. Thus, coliforms, biochemical oxygen demand (BOD5), and dissolved oxygen (DO) were selected.
BOD5 and Escherichia coli were analyzed according the Standard Methods for the Examination of Water and Wastewater [50], namely the 5210B and 9223B methods, respectively. The laboratory responsible for the analyses has accreditation on ISO/IEC 17025: 2017—general requirements for the competence of testing and calibration laboratories. Concerning DO data, the hired company had a problem with the sensor calibration that included the month of August 2019, precisely the period of the least precipitation and flow rate of the year. Thus, to ensure the reliability of this data, we waited until August 2020 to collect and analyze a new sample so as to guarantee similar hydrological and hydraulic conditions. Thus, DO data were measured in August 2020 using the multi-parameter probe YSI Professional Plus (603223) with an accuracy of 0.02 mg/L or ±2%. The probe was previously calibrated and later checked, which resulted in a variation of less than 2%.

2.2.4. Land Cover and Water Uses

Land cover was obtained by using the database produced by Copernicus Land Service [51]. The product has global coverage with 100 m of spatial resolution derived from the Vegetation instrument on board of PROBA satellite (PROBA-V), with images from the year 2019. A detailed description of this product can be found in Buchhorn et al. [51]. The product, available in raster format, was cut out for the study area using the QGIS 3.14 software, and it was later converted into a vector format to calculate the land cover areas.
The database of water uses in the basin, registered and granted, including water abstraction and effluent discharge, was provided by INEA from the Federal System for the Regulation of Uses (REGLA) [52]. In addition, other studies on the basin [40,41,53] were also considered, especially the Sewer Atlas produced by ANA [54].

2.3. Water Quality Modeling

The choice of the most suitable model for a study depends on the user’s objectives and needs, in addition to characteristics of the water body and data availability [19]. However, the more components represented by a model, the greater the number of coefficients to be obtained or adopted and therefore, the greater the difficulty in calibrating the model. On top of that, in most developing countries, such as Brazil, basic problems related to water quality have not yet been solved, and simpler models still have a major contribution to make to studies aiming at managing polluting loads [55].

2.3.1. Model QUAL-UFMG

Considering our objectives of a managerial approach to water quality modeling through different scenarios comparison, we selected the QUAL-UFMG model, an open-source tool implemented in a simple interface spreadsheet. This water quality model has been widely used in Brazil [56,57,58,59,60,61,62,63,64,65], and more specifically, in the Piabanha River [41,53,66,67]. Its mathematical modeling follows the Qual2E model from the United States Environmental Protection Agency (USEPA)—a deterministic, one-dimensional, permanent flow and stationary model. QUAL-UFMG assumes some simplifications—disregarding (1) the algae module and all its interrelationships with the other constituents, such simplification is justified due to its application in lotic environments and (2) the longitudinal dispersion, since advection is the main transport phenomenon in rivers and 3) adopting numerical integration using the Euler method.
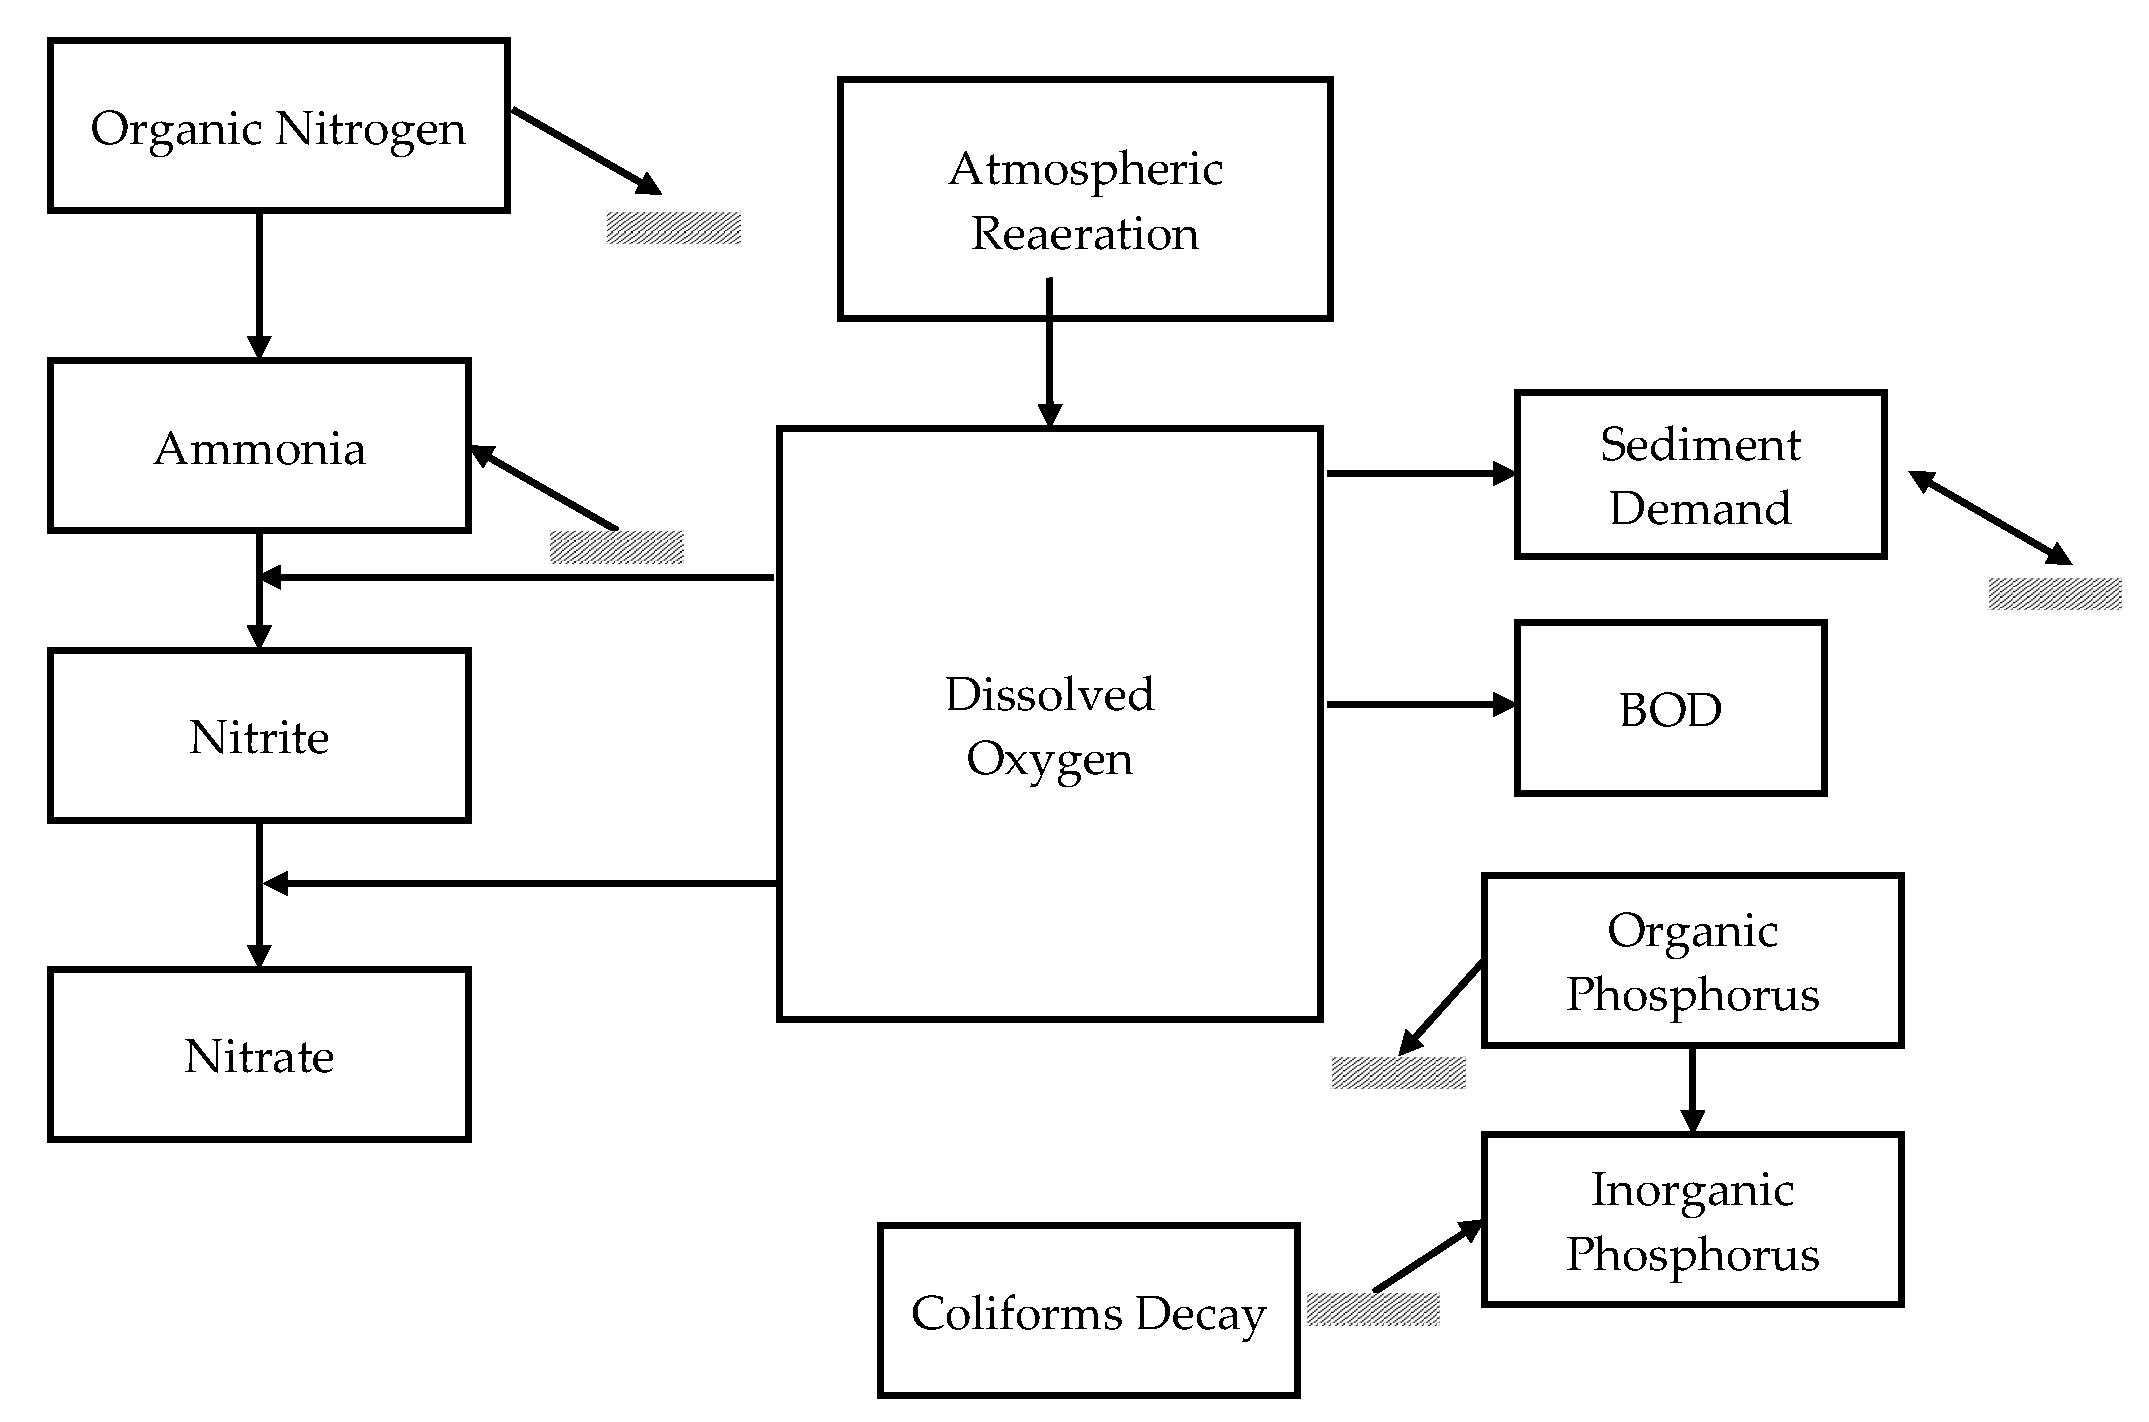
The conceptual model in QUAL-UFMG (Figure 2) represents the inter-relationships between the following constituents: biochemical oxygen demand (BOD), dissolved oxygen (DO), organic nitrogen, ammonia, nitrite, nitrate, organic phosphorus, inorganic phosphorus, and coliforms. The production and consumption reactions of the constituents follow first-order kinetic equations (Equations (1) and (2)), in which the reaction rate is proportional to the initial concentration. Equation (1) presents the differential equations used in the QUAL-UFMG model and their respective analytical solutions (Equation (2)). All processes and equations are described in detail in von Sperling [55].
  d C d t   = K C
C =   C 0 · e K t
where:
K =Reaction constant (day−1);
C=Constituents concentration (mg L−1 for most constituents and MPN 100 mL−1 for coliforms);
C0=Initial constituents’ concentration (mg L−1 for most constituents and MPN 100 mL−1 for coliforms);
t =Time (days).

2.3.2. Model Calibration, Validation, and Scenario Prognosis

Temporal split-sample is the most commonly adopted approach to perform model calibration and validation [55,68]. It is recommended that the calibration period should be long enough to comprise all ranges of conditions expected in the watershed over multiple years [69]. Thus, the dataset was split to calibrate the model using the dataset between 2015 and 2019, and to validate its prediction accuracy the 2019/2020 dataset was used. Both calibration and validation performances were evaluated by the coefficient of determination (R2) between predicted and observed values [55,63] as well as by a visual inspection of the curve fit [64].
The calibration of the QUAL-UFMG model was performed using the mean long-term discharge (Dm) and the arithmetic mean concentrations of DO, BOD5, and coliforms from INEA/CPRM monitoring dataset. The flow rates were derived from regionalization equations established by the Brazilian Geological Survey [70]. The hydrodynamic parameters were derived from Paula [67] through regression equations for depth, velocity, and flow. Water use data, abstractions, and discharges were also inputed. For initial estimations of the reaction coefficients of deoxygenation (K1), decomposition (Kd), sedimentation (Ks), reaeration (K2), and coliform decay (Kn), values proposed by von Sperling [55] were applied according to the physical characteristics of each river stretch. Then, these coefficients were automatically optimized by using the Microsoft Excel Solver package according to an objective function that maximizes the R2 values.
The model validation was performed for the most critical water quality flow condition, corresponding to a 95% permanence discharge (D95). It is, in statistical terms, the base flow rate available at least 95% of the time, defined as the reference discharge for water right permits by INEA [71]. The BOD5 concentration for the initial segment of the river considered the same organic load applied to the mean long-term discharge, Dm, as a consequence of the mass conservation principle (Equation (3)). In the model validation process, the data observed in the field monitoring of August 2019/2020 were used. These data correspond to similar hydrological conditions and are representative of the flow D95. The R2 values [55,63] and the visual curve fit [64] were also used to assess the model performance.
O r g a n i c   l o a d   =   D m   ×   C m   =   D 95   ×   C 95
Where:
D m , C m =Mean long-term discharge and its respective organic concentration.
D 95 , C 95 =Flow with 95% permanence over time and its respective organic concentration.
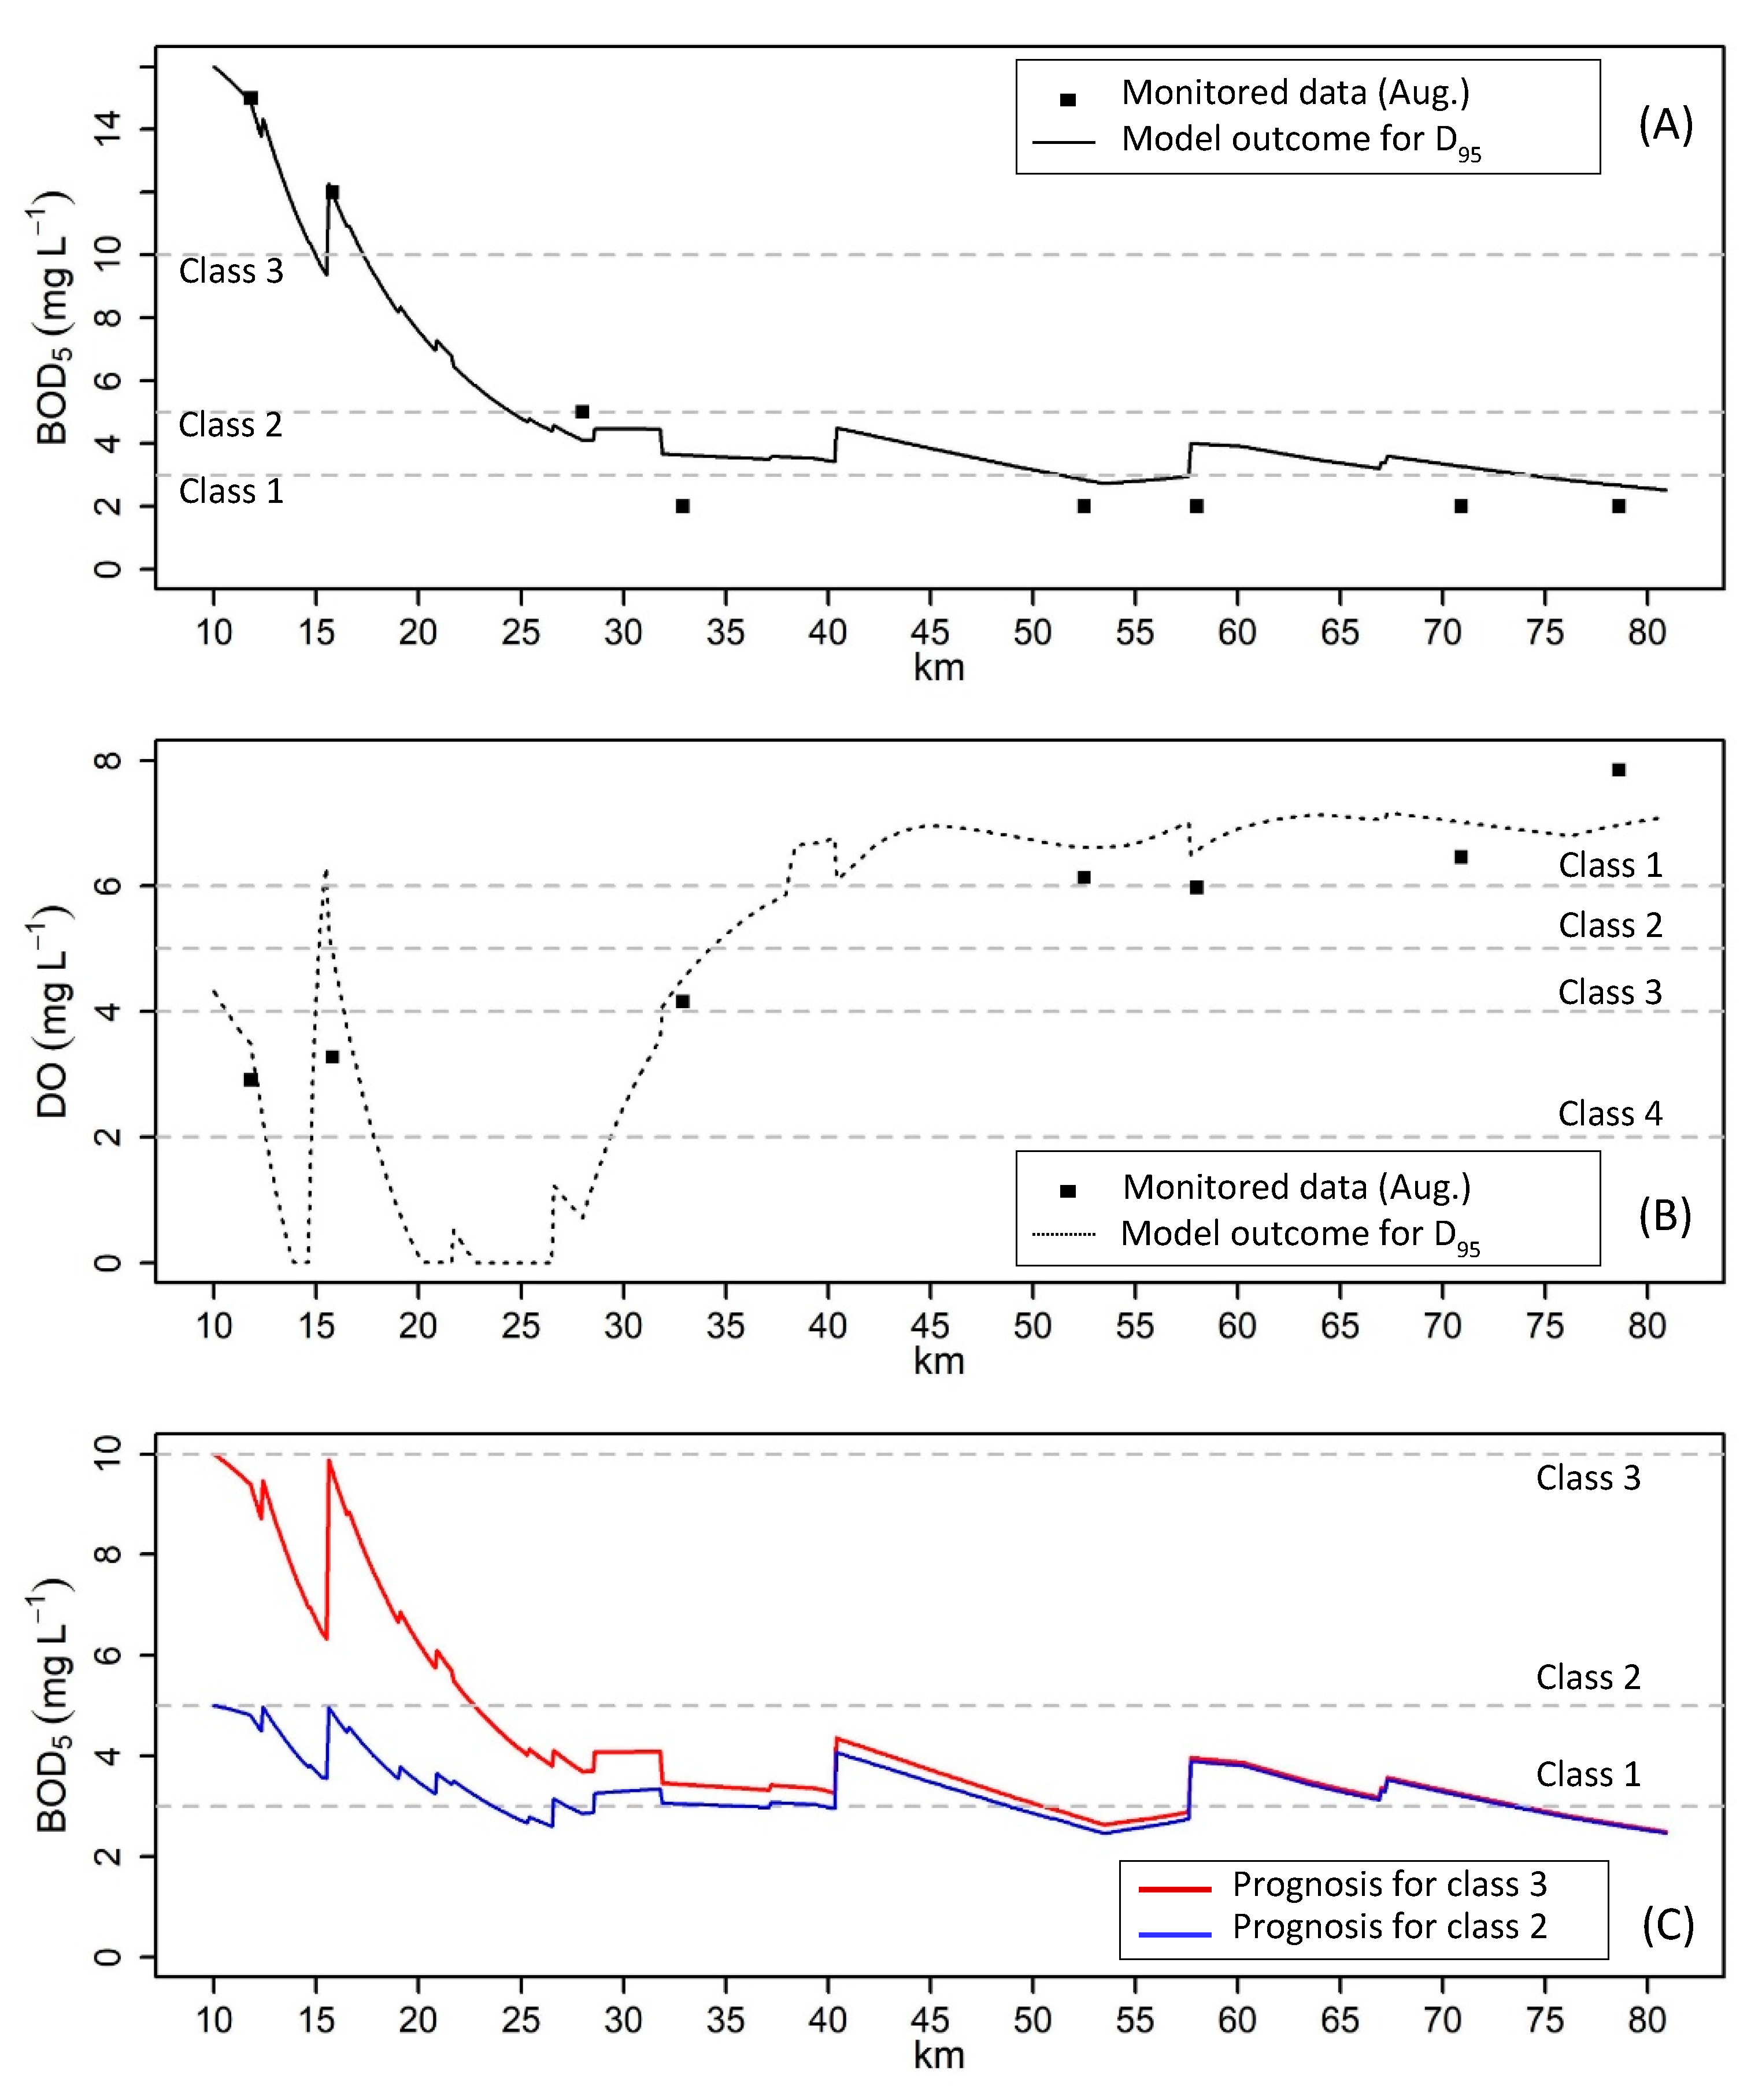
Once the model has been calibrated and validated, two progressive scenarios [49,72,73] of organic load reduction were simulated. The first scenario aimed to reduce BOD5 concentrations in Piabanha River to up to 10 mg L−1, which corresponds to the class 3 framework according to Brazilian legislation [36]. The second scenario aims to frame the Piabanha River as, at least, Class 2 for BOD5 concentrations, that is 5 mg L−1 [36].

3. Results

3.1. Land Cover and Water Uses

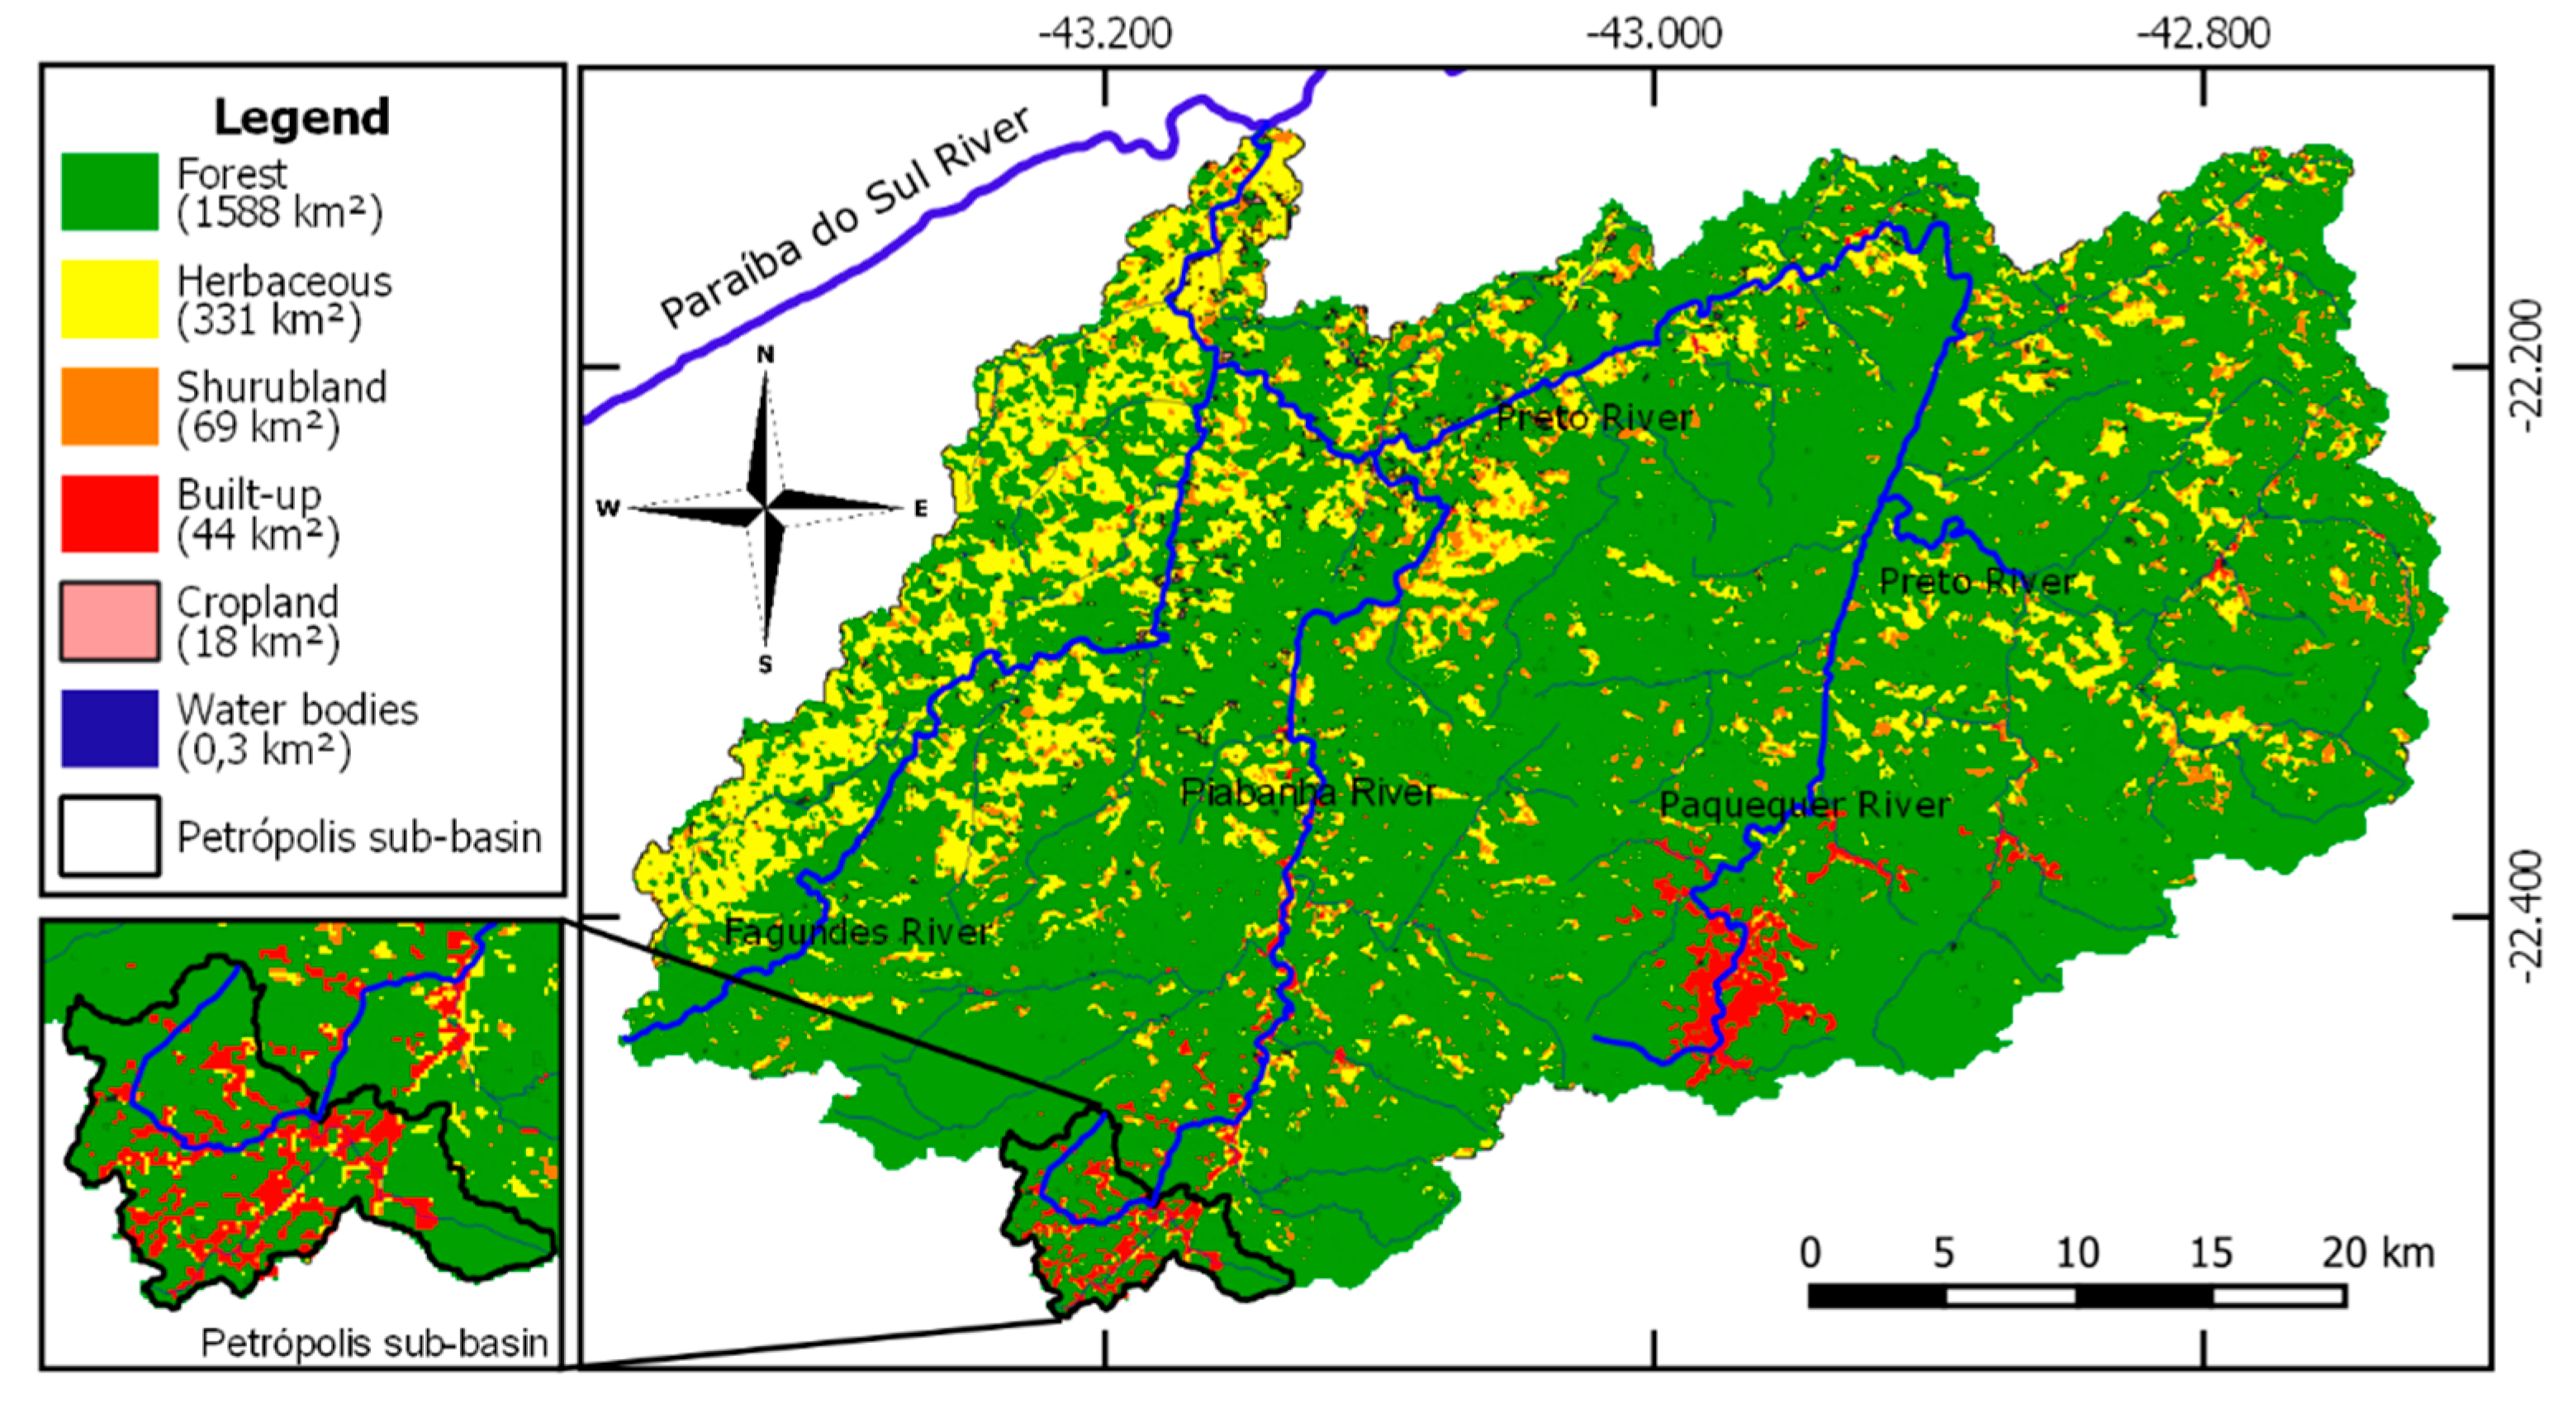
The Piabanha watershed (Figure 3) has a predominance of forests with 77% of the land cover, which together with herbaceous vegetation and shrubland vegetation, correspond to 97% of the watershed. Urban areas correspond to an area of 44 km2 and the Petrópolis sub-basin (Figure 3) is highlighted as the most populous city. Agriculture is carried out on small farms, which altogether correspond to 18 km2, less than 1% of the basin area. Due to spatial resolution, the mapping detects crops with areas greater than 1 hectare.
In relation to water rights permits granted by INEA in the watershed, the sanitation sector has the largest volume granted, reaching 1.40 m3 s−1, followed by the industry sector, with 0.30 m3 s−1, respectively, 80% and 15% of the total. The other uses together represent 5% of the water grants. With regard to effluent discharges, a similar behavior is observed. The agriculture sector has no users granted in the basin. Besides this, there is a significant number of users registered in the database who are still waiting for granting analysis by the environmental agency.

3.2. Seasonality in the Watershed and Water Quality Monitoring

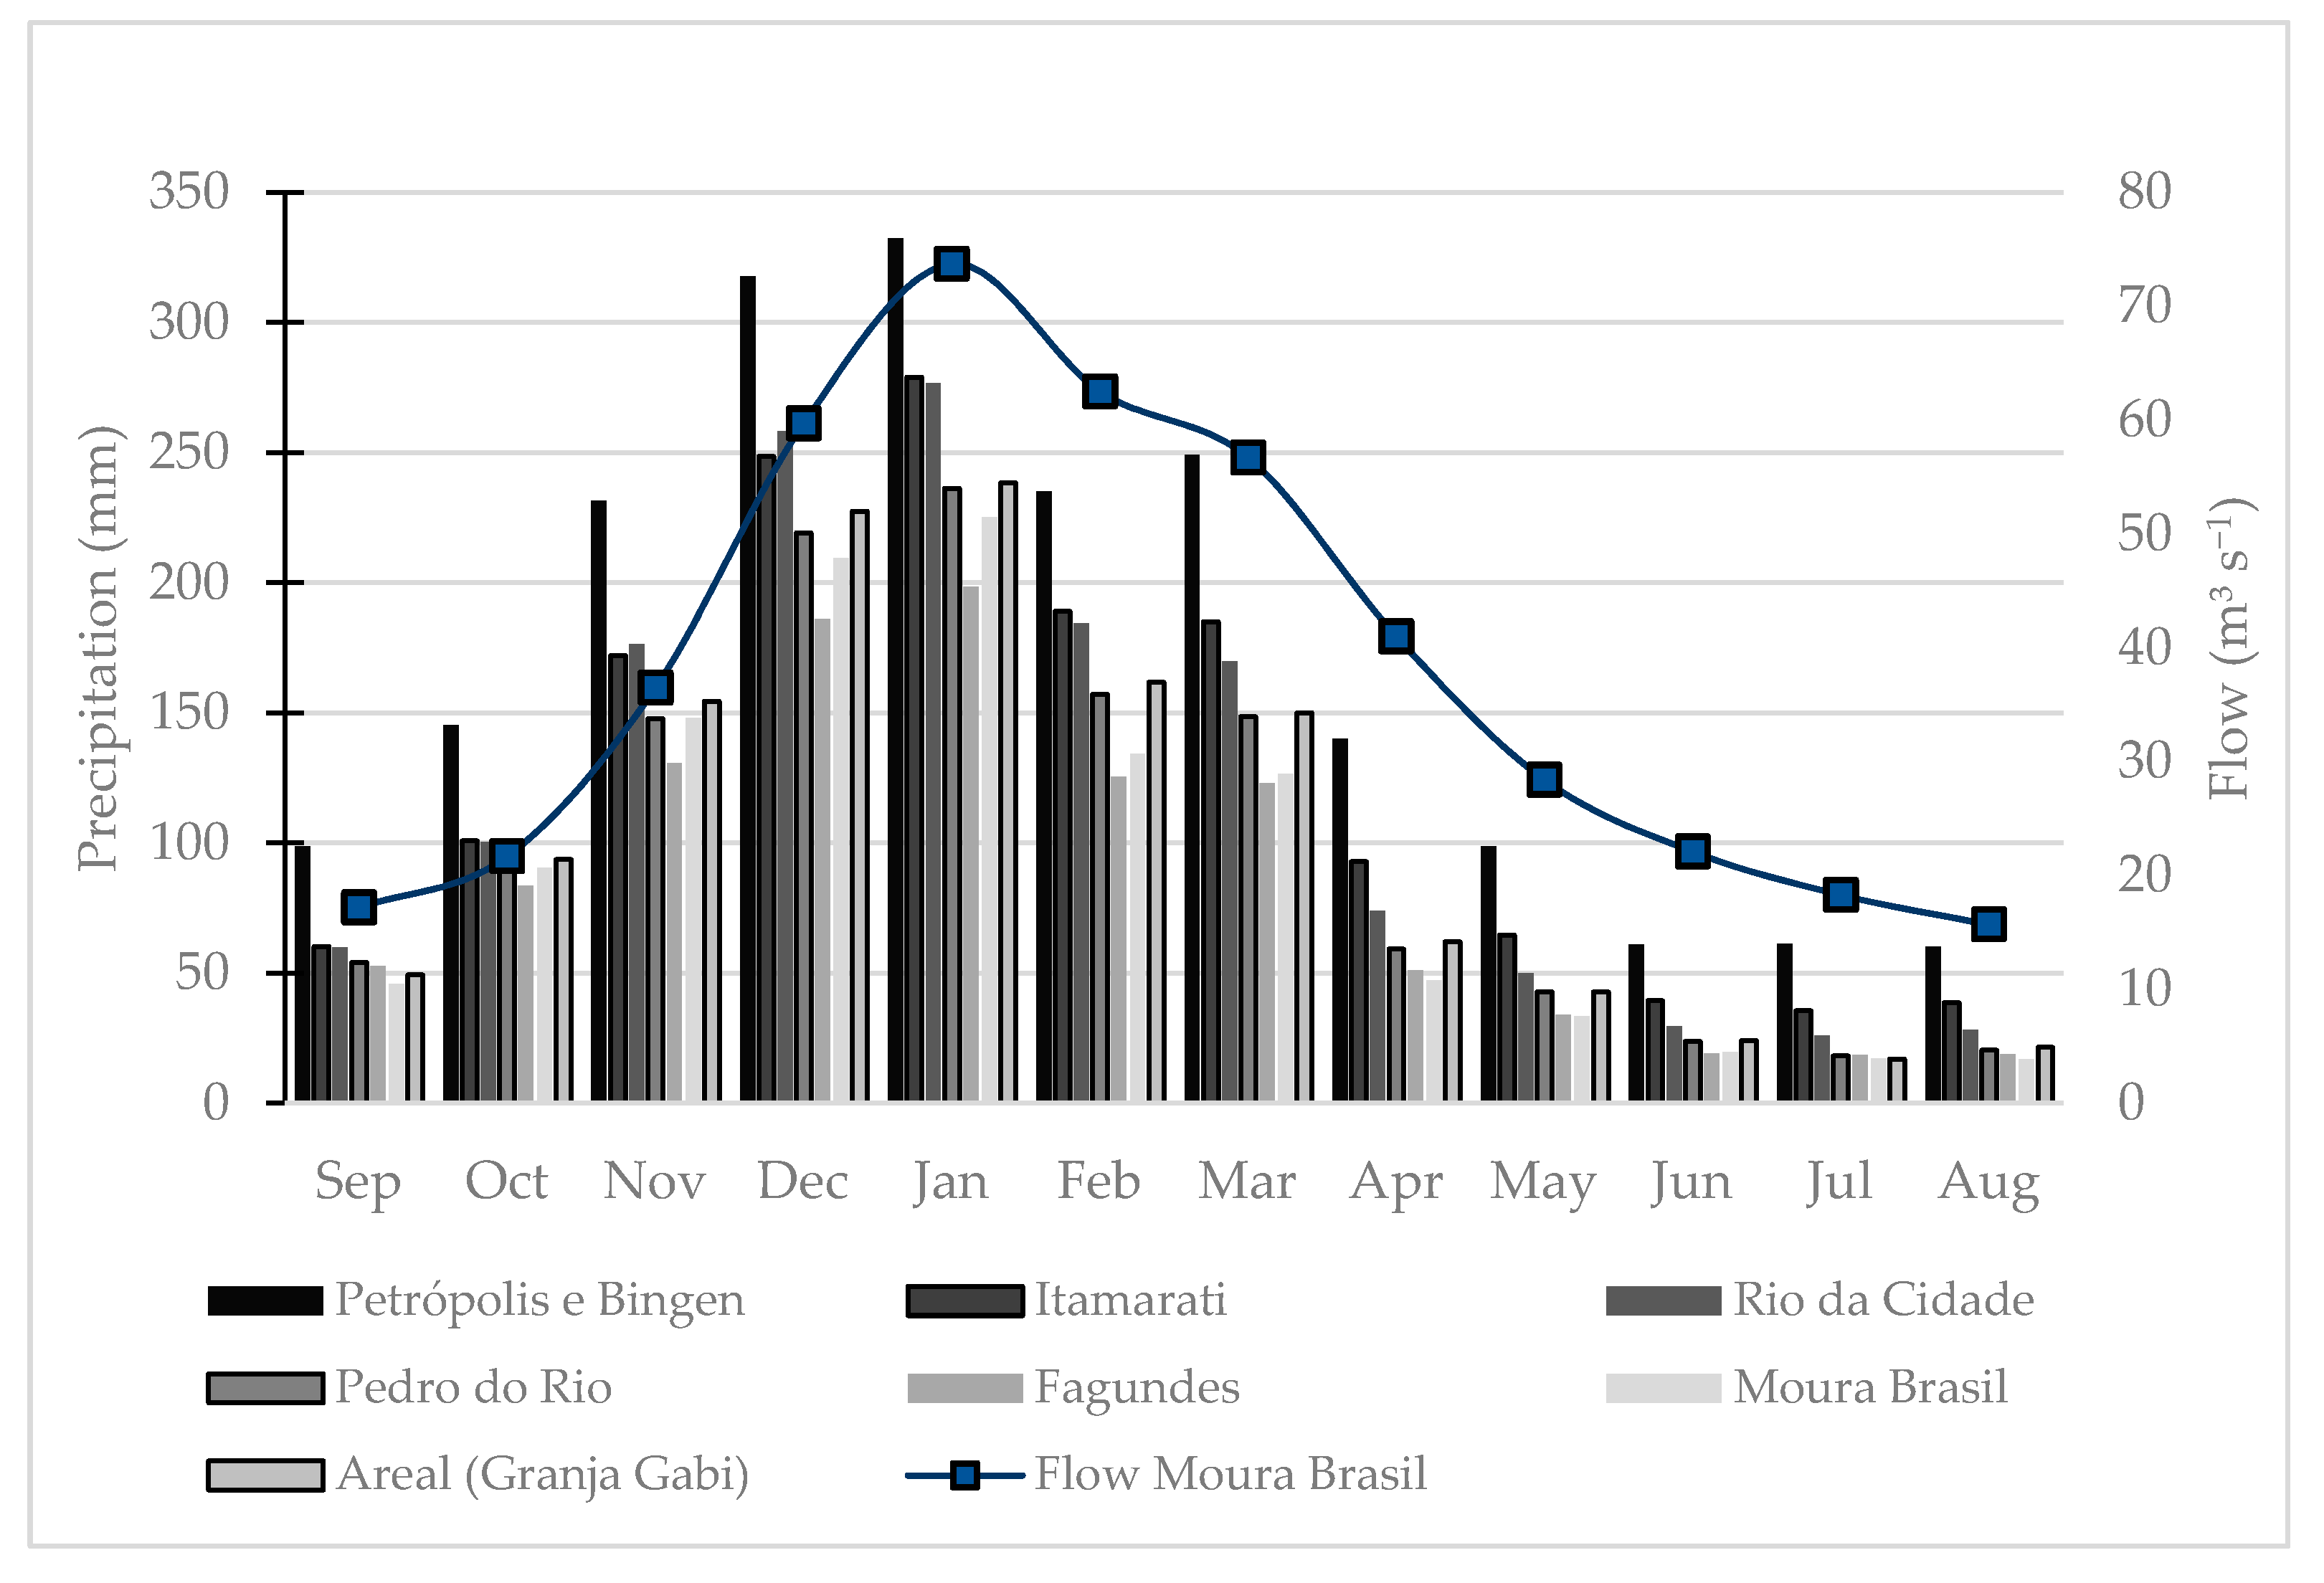
The dry season in the Piabanha River watershed takes place from May to September (Figure 4) for Petrópolis and Bingen stations (1939–2019), according to the quantile technique applied [45,46]. The precipitation time-series exhibits a normal distribution (169.31 ± 132.53 mm) and the dry months are those in which the accumulated rainfall (P) is under 100 mm. Consequently, the wet season comprises the months from October to April. The month of September marks the beginning of the hydrological year; however, statistically, it presents characteristics of the dry period (P < 100 mm), mainly considering the small flow rates differences between August and September (Figure 4).
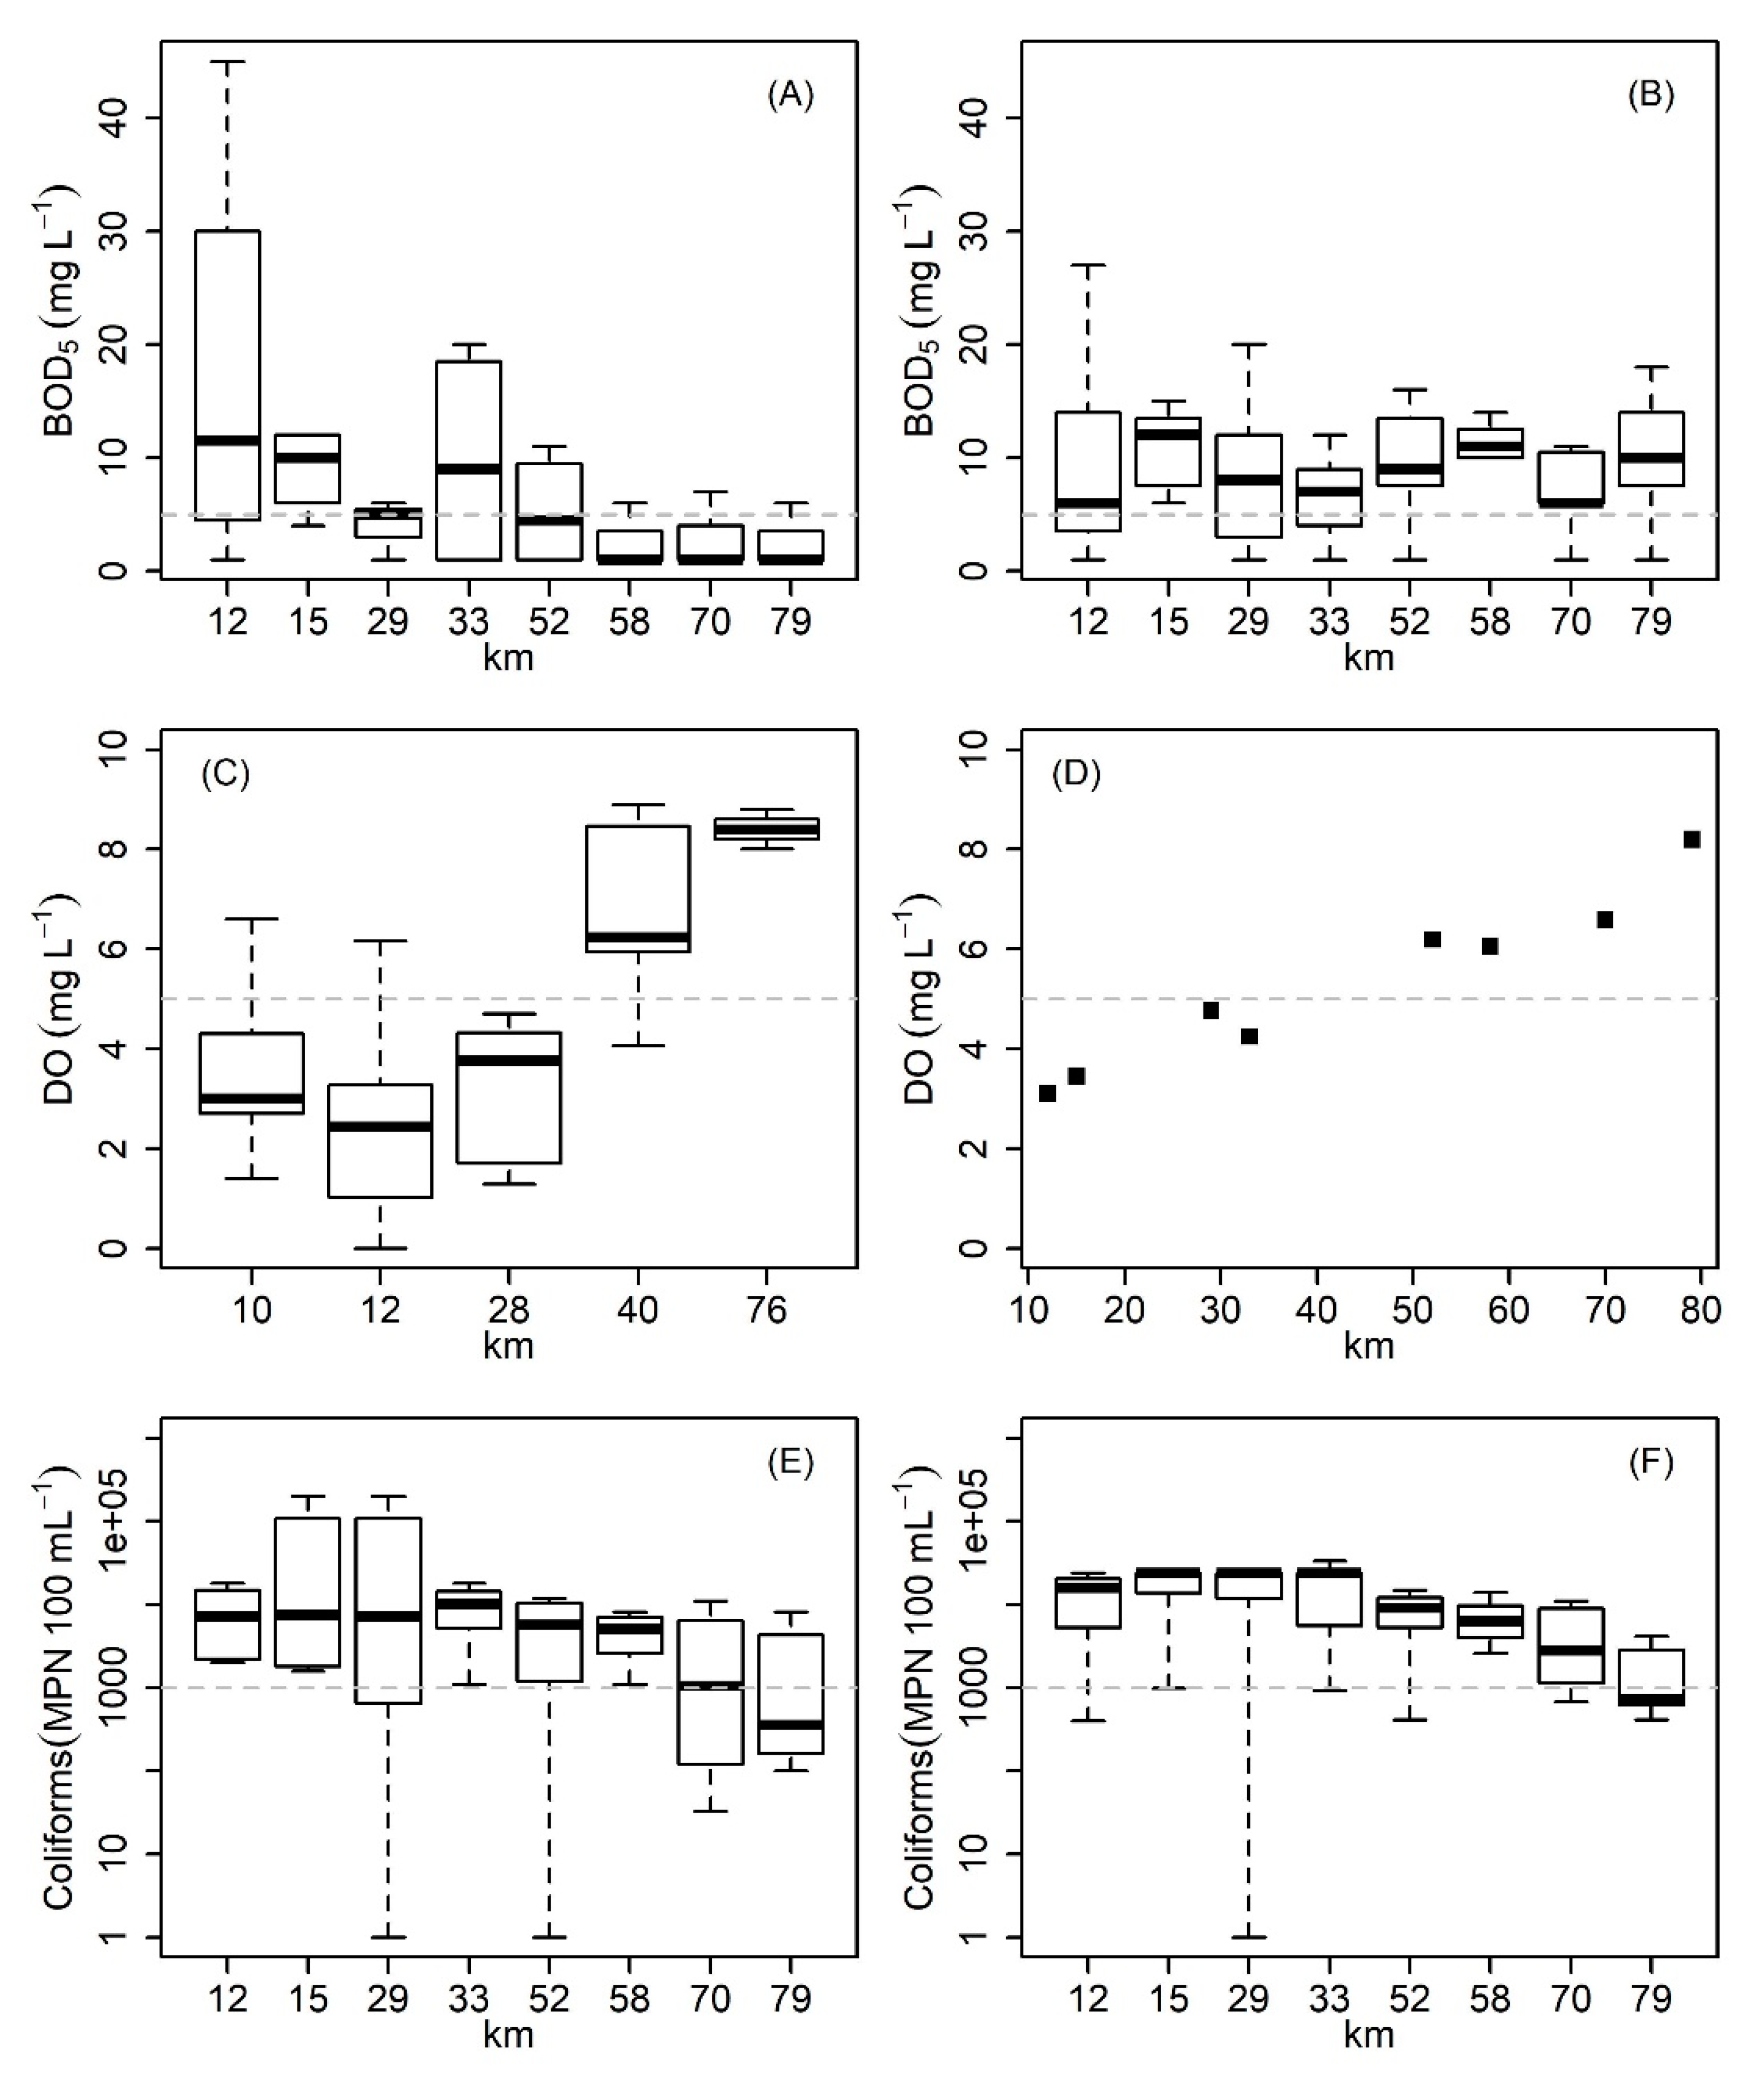
In what follows, we describe only the 2019/2020 water quality dataset, since the dataset from the 2015/2019 period was used just for the model’s calibration, as previously described. For the Piabanha River as a whole, the BOD5 parameter (Figure 5A,B) presented mean concentrations of 10.3 mg L−1 in the wet period and 6.57 mg L−1 in the dry period. The dissolved oxygen (Figure 5B,C) exhibited concentrations lower than 5 mg L−1 in the first 30 km of the river in the dry season. Likewise, the coliform parameter (Figure 5C,D) presented values greater than 1000 MPN 100 mL−1 in practically all samples in both wet and dry seasons, except in the last stretches of the river.
In a more detailed description for each station, it can be noticed that the BOD5 parameter presented greater concentrations on its headwater catchment of the Piabanha River (Figure 5A,B), which corresponds to the most urbanized region and also concentrates most of the industrial activities of the watershed. The first stretch analyzed was 12 km long and comprises Petrópolis’ densely occupied urban area. In this stretch, BOD5 reached greater concentrations in the dry season. Hence, the BOD5 parameter and the dry period are emphasized (Figure 5A).
In the middle reaches, as the river waters get away from the urban areas, the BOD5 concentration decreased as far as km 29 (Figure 5A). However, at km 33, BOD5 concentrations rose again in the dry period (Figure 5A), right after the Itaipava district, a highly touristy and also very urbanized region with intense hotel and services sector activities. After this stretch, there were effluent discharges from some companies, especially one beer industry, in addition to diffuse sewage loads.
In the lower reaches, the Piabanha River receives, at km 58, its main tributary, the Preto/Paquequer River, which drains the second largest city in the watershed, Teresópolis, a city with practically no sewage treatment and also diversified uses of water. Preto River has a water quality similar that of the Piabanha River, being slightly better in the dry season. After this stretch, just before km 70 (Figure 5A), the Piabanha River receives the Fagundes River, its second main tributary, which drains a rural basin and contributes to dilute upstream Piabanha River pollution.

3.3. Water Quality Modeling Scenarios

The model calibration process reached the following R2 values: 0.94 for BOD5; 0.93 for DO; and 0.90 for log transformed coliforms, while the validation process performed the following R2 values: 0.81 for DO; 0.97 BOD5; and 0.48 for log transformed coliforms. The graphical results of the model and the observed monitoring data for August (2019–2020), the driest month of the hydrological year, used in the validation process are displayed in Figure 6A,B.
The first prognostic scenario, which corresponds to the water framework class 3, could be achieved by reducing 37.5% of the organic load being thrown into the first 10 km of the Piabanha River from the Petrópolis sub-basin (Figure 3), which covers only 45 km2. This scenario is displayed in the higher curve (red) in Figure 6C. After the first 25 km of the Piabanha River, the following stretches can be classified as class 2, and even, class 1.
The second prognostic scenario, which corresponds to the water framework class 2, could be achieved after the first scenario is reached by reducing the organic load by 50% in the Petrópolis sub-basin; 40% from both the Waste Water Treatment Plant (WWTP) Quarteirão Brasileiro and the company Xerium; and 57% in the Itamarati sub-basin, which receives an artificial water transfer from the Palatinato River. These reductions would significantly decrease the river BOD5 concentration profile, as shown in the lower curve (blue) in Figure 6C. As a result, the entire length of the Piabanha River matched the water framework class 2 and some sections reached class 1.

4. Discussion

4.1. Water Quality Diagnosis

The main urban areas in the Piabanha watershed are at the headwater catchments (Figure 3), causing pollution at the beginning of the main rivers, thus strongly suggesting that rehabilitation projects should first focus on these areas [53]. There is evidence that the major pollution source in the Piabanha watershed is urban sewage [42,43,74] and the most relevant water quality parameter is coliforms [42]. A previous research [37] using principal components analysis and cluster analysis also pointed out urban sewage as the main water quality problem. Furthermore, the sanitation sector represents the highest water right permits in the basin [52,75], however, there are several registered users waiting for water to be granted by the environmental agency [75].
Other factors such as diffuse pollution from agriculture could be important to be evaluated because they are associated with the supply of nutrients in aquatic systems [76,77], although land cover corresponds to less than 1% of cropland (Figure 3) in the study area. Therefore, studies [43,78] of the Piabanha watershed indicate that sewage pollution contributes to at least 43% of the nitrogen load released to the river, the atmospheric input is around 31%, and agriculture is responsible for less than 15%. Likewise, the highest phosphorus concentrations were observed in the urban stretches [43].
Seasonality of rainfall and flow rates (Figure 4) directly affects the river water quality (Figure 5), which is in line with another study in the region [79], which also shows that the month of August presents the lowest flows. The Piabanha River as a whole presented the highest concentrations of pollutants in the rainy season (Figure 5). This behavior is in accordance with other studies carried out worldwide [80,81,82] and it can be related to the wash load in the watershed [83,84].
The BOD5 parameter presented high concentrations in headwater catchments (Figure 5A,B), compatible with the water class 4 [36], the worst possible. BOD5 is considered the most important parameter for water quality [85,86], since it directly influences dissolved oxygen concentrations and, generally, is related to coliforms, indicating sewage contamination [87,88]. The coliform parameter (Figure 5C,D) violated the maximum permissible value for almost all classes and conditions [36], except for the final stretch near the Piabanha River’s outlet, in agreement with the literature [42,53]. Likewise, the monitoring showed that the dry season (Figure 5A) exhibits the most critical water quality condition in urban areas because of the low capacity to dilute pollution in the river, corroborating with other studies [89,90].
Downstream of the main urban area, the Piabanha River has several small cascades and steeper stretches which increase aeration and contribute to the river depuration [91]. The tributary Preto River has a water quality similar to that of the Piabanha River, being slightly better in the dry season, possibly due to its power generation dam that contributes to pollution retention [92,93] associated to low water flow rates.

4.2. Model Performance and Pollution Load Reduction

The determination coefficients values achieved in the model calibration and validation processes are considered very good in the literature [68] and reached higher values than similar studies in Brazilian rivers [61,65]. The model was validated for the most critical pollution condition, when lowest flow rates are found and, consequently, the river presents a low dilution capacity, in line with other studies [94,95]. This validation was possible because the 2019/2020 monitoring represented hydrological conditions compatible with the D95 flow, observed in August, during the dry period of the basin [79]. The results in the dry season are in line with other studies [66,67,96]. Two scenarios for reducing organic load were simulated, however it is strongly recommended that more intermediate targets [49,72,73] should be established. The simulations in the Petrópolis sub-basin are in agreement with other studies in this region [53], which highly recommends this region as a priority for pollution control.
Organic load reduction can be accomplished in many ways. The most meaningful and important action to be taken is to collect the wastewater and properly treat it in a WWTP [97,98,99]. On the other hand, improving the existing treatment facilities would lead to a lower effluent concentration and, therefore, also reduce the impact on the river’s water quality [100,101]. Nevertheless, there are alternative ways to reduce the organic loads, such as wastewater reuse [41], since reusing wastewater prevents pollution from entering the water body [72,74].
The Petrópolis sub-basin nowadays has water quality compatible with class 4, the worst possible class according to Brazilian legislation [36], as represented in the model validation scenario (Figure 6A). Rivers class 4 is not compatible with human supply, even after treatment [36]. Water quality compatible with class 4 is a reality for many Brazilian rivers, such as the Rio Jundiaí [102] in which pollution control investments, notably in the sanitation sector since 1984 [103], have improved the water quality from class 4 to class 3. The water quality modeling allowed us to simulate the BOD5 load reduction capable of promoting significant water quality improvement in the watershed. The next section discusses some issues of water resource management in Brazil and indicates strategies for implementing the modeled scenarios.

4.3. Brazilian Water Resources Management and Some Recommendations

As mentioned previously, Framing is a legal instrument for improving the water quality of Brazilian rivers [12], although two decades after the enactment of the Water Act, the number of rivers framed is frighteningly small [33]. In what follows, we point out three main reasons.
First, considering the different implementation levels of the water resources policy in Brazilian states, the Framing has not been considered as a priority by most stakeholders, even though the Federal CNRH Resolution 181 [104] established as a goal that river Framing proposals should be a priority by 2020. It is important to highlight that all Brazilian rivers are considered class 2 by default until individual Framing proposals are made, according to CONAMA 357 resolution [36]. Despite this, Brazilian urban rivers, such as the Piabanha River, are far from having quality compatible with Class 2.
Ribeiro and Hora [38] analyzed the Brazilian decision-making stakeholders’ priority and concluded that only 29% of state environmental agencies and 18% of watershed committees pointed to the Framing instrument as a priority. The authors also found that, based on the responses from all the Brazilian state environmental agencies and 130 of the 220 watershed committees consulted, most of these agencies are focused on the water permits operationalization or/and preparing the river basin plans. Among watershed committees, the focus is to develop river basin plans or/and water charges implementation.
Second, there are several technical difficulties. The Framing proposal must include the following phases [105]: diagnosis, prognosis, proposition of progressive water quality goals and, finally, an implementation program. In the diagnosis phase, the initial challenge is to obtain qualitative and quantitative monitoring data, since usually, sample distribution is either insufficient or absent [106]. Likewise, it is crucial to have a reliable database on water uses. The prognosis, based on mathematical modeling of future scenarios, is subject to the uncertainties arising from the diagnosis flaws.
Third, even when the watershed committees overcome the above-mentioned hindrances, the main challenge regarding rivers. Framing is to implement it [33]. In other words, it is hard to implement the planned actions aimed at reaching the water quality goals, bearing in mind that the Framing process requires financial investments to become a reality and it must be cooperatively built and negotiated by the stakeholders. However, in practice, the mobilization and engagement of the stakeholders does not achieve the necessary effectiveness [49].
A possible explanation for this scenario comes from the fact that Brazil has not yet managed to universalize its sanitation services, mainly the sewage collection and treatment, even after great projects and investments for this [107,108]. Moreover, it is hard to inspect, control, and enforce environmental laws, whether due to financial, technical, or operational factors, or even political issues [109,110]. These obstacles diminish efforts to promote water quality improvement in rivers. On top of that, another barrier is that even though the watershed committees have the legal right to approve the Framing, these committees do not have legal attributions to either inspect or apply legal sanctions.
In this sense, the State Public Prosecution Office can work together with various stakeholders in an articulated and preventive way through extrajudicial resources and it tends to contribute, in a significant and non-litigious way, to the integrated management of water resources [111,112]. Thus, our perception is that a close articulation between watershed committees’ leaders and the State Public Prosecution Office is important to identify and engage stakeholders from the first stages of the Framing process to the commitment pact to achieve the water quality goals. This approach has proved to be effective based on the CBH-Piabanha experience along with the State Public Prosecution Office, at the successful implementation of the Continuous Riparian Protected Stripe delimitation project on the Piabanha River, which has engaged several stakeholders [113]. This articulation led by a watershed committee was a novelty in the Rio de Janeiro State and strengthened the territorial management [113].
This successful experience of CBH-Piabanha can inspire the Framing of rivers. In short, we understand that framing can be achieved when it is proposed by the watershed committees and mediated by the State Public Prosecution Office as the two important players. Framing of the entire length of the Piabanha River is needed, however, it should focus the action plans on reduced areas, implemented in an adaptative and collaborative way, by reducing the size and complexity of stakeholders’ involvement. Thus, we proposed to focus efforts on the first stretch of the Piabanha River, a 10 km long stretch from its headwater to the urban area of Petrópolis. This 45 km2 sub-basin is a highly touristry and urbanized region that has 74% of sewage treatment [54]. In this region, are located the CBH-Piabanha, INEA regional superintendence, Petrópolis sanitation company, and the State Prosecutor’s Office headquarters, as well as Petrópolis City Hall. Moreover, abstractions and discharges data from all registered water resources users and one of the water quality monitoring station in the Piabanha River operated by INEA since 1980, are available.
There are also two other major factors that are crucial to the success of a Framing program in the Piabanha River basin. First, the ongoing update of the Watershed Plan, that represents an opportunity to integrate this planning instrument with the Framing. In this sense, CBH-Piabanha has financial resources from water resources charges that can, and should, be invested towards an effective Framing. The second factor is the recent sanitation act (Law No. 14,026/2020), which aims to universalize sewage treatment by 2033 and enforce sanitation as the main investment for improving water quality in the watersheds.

5. Conclusions

To improve water quality in Brazilian rivers, we advocate that Framing is an important tool towards river rehabilitation. To achieve this goal, watershed committees must consider progressive goals to reduce pollution which, in turn, will improve water quality. Also, these actions should rely on a few parameters to be monitored and focus on reduced areas, since it is easier to monitor and evaluate water quality improvement. Considering that there very few framed rivers in Brazil, our working methodology can be a reference for other surface water quality rehabilitation projects. We propose an approach coordinated by the watershed committee and mediated by the State Prosecutor’s Office.
Following these considerations, the water quality model predictions suggest that, in order to frame the first 25 km of the Piabanha River as at least class 3 and the following stretches as class 2, the CBH-Piabanha should aim to reduce by 37.5% the organic load entering the river along its first 10 km, the Petrópolis sub-basin with 45 km2. This reduction must strategically plan specific and time-based milestones that must be discussed between water users, civil society and government in this sub-basin and agreed upon.
For Brazilian water resources management, Framing rivers according to their preponderant uses is the instrument that can effectively restore the quality of river waters. For this, water quality monitoring and water usage data are underlying elements to produce a reliable watershed diagnosis. In this way, the monitoring carried out in the Piabanha basin by INEA and EIBEX/HIDROECO projects provided enough data to calibrate the water quality model in a satisfactory manner and allowed the identification of the most polluted stretches. Likewise, the monitoring network implemented by the CBH-Piabanha and analyzed in this paper allowed a better understanding of some sub-basin conditions, a more realistic and precise diagnosis of Piabanha River’s water quality, and, most importantly, allowed us to validate the modeling outcomes, in order to simulate more accurate prognostics.
Finally, we recommend expanding the water quality monitoring network to other sub-basins, specifically those in which we have suggested to reduce organic loads. For this purpose, partnerships with universities and governmental agencies should be taken into consideration. Future studies could validate water uses declared in the REGLA system, considering what is actually discharged into the river, especially by the sanitation sector. Knowledge of the seasonality of water quality can also be deepened in order to better understand the effect of the wash load of the basin during rainy periods. Diffuse pollution from agriculture due to small properties can be studied in more detail since our study focused on urban areas.

Author Contributions

Conceptualization, D.d.A.C., J.P.S.d.A., M.A.d.S. and R.d.S.F.V.A.; formal analysis, D.d.A.C., L.C.S.d.S.J. and R.d.S.F.V.A.; methodology, D.d.A.C. and L.C.S.d.S.J.; project administration, D.d.A.C.; software, L.C.S.d.S.J.; supervision, J.P.S.d.A., M.A.d.S. and R.d.S.F.V.A.; validation, D.d.A.C. and L.C.S.d.S.J.; visualization, D.d.A.C.; writing—original draft, D.d.A.C. and L.C.S.d.S.J.; writing—review and editing, D.d.A.C., J.P.S.d.A., M.A.d.S. and R.d.S.F.V.A. All authors have read and agreed to the published version of the manuscript.

Funding

This research received no external funding.

Institutional Review Board Statement

Not applicable.

Informed Consent Statement

Not applicable.

Data Availability Statement

Restrictions apply to the availability of these data. Data was obtained from the Piabanha Watershed Committee and are available from the authors with the permission of them.

Acknowledgments

To the Piabanha Watershed Committee for the data provided. To the State Environment Institute (INEA) for the data provided. To the Brazilian Geological Survey of Brazil (CPRM) and COPPE/UFRJ for the monitoring data which are the result of field campaigns conducted in the EIBEX projects (Integrated Studies of Experimental Basins) and continued in the HIDROECO/Piabanha project funded by FINEP (Brazilian Innovation Agency). For the equipment used in data collection, we would like to thank the Labfoz Laboratory of the Federal Fluminense Institute and the Computational Hydraulics Laboratory of the Alberto Luiz Coimbra Institute for Graduate Studies and Research in Engineering (COPPE) of the Federal University of Rio de Janeiro (UFRJ). To Renata Demori Costa for revising the text. This work was carried out with the support of the Coordination for the Improvement of Higher Education Personnel (CAPES) and CNPq, National Council for Scientific and Technological Development—Brazil. The fourth author of this paper is Researcher 2 of National Council of Research—CNPp and receives a scholarship from this institution.

Conflicts of Interest

The authors declare no conflict of interest.

References

  1. Oliver, S.L.; Corburn, J.; Ribeiro, H. Challenges Regarding Water Quality of Eutrophic Reservoirs in Urban Landscapes: A Mapping Literature Review. Int. J. Environ. Res. Public Heal. 2018, 16, 40. [Google Scholar] [CrossRef] [Green Version]
  2. De Mello, K.; Taniwaki, R.H.; De Paula, F.R.; Valente, R.A.; Randhir, T.O.; Macedo, D.R.; Leal, C.G.; Rodrigues, C.B.; Hughes, R.M. Multiscale land use impacts on water quality: Assessment, planning, and future perspectives in Brazil. J. Environ. Manag. 2020, 270, 110879. [Google Scholar] [CrossRef]
  3. Xu, Z.; Xu, J.; Yin, H.; Jin, W.; Li, H.; He, Z. Urban river pollution control in developing countries. Nat. Sustain. 2019, 2, 158–160. [Google Scholar] [CrossRef]
  4. Li, M.; Chen, J.; Finlayson, B.L.; Chen, Z.; Webber, M.; Barnett, J.; Wang, M. Freshwater Supply to Metropolitan Shanghai: Issues of Quality from Source to Consumers. Water 2019, 11, 2176. [Google Scholar] [CrossRef] [Green Version]
  5. Górski, J.; Dragon, K.; Kaczmarek, P.M.J. Nitrate pollution in the Warta River (Poland) between 1958 and 2016: Trends and causes. Environ. Sci. Pollut. Res. 2017, 26, 2038–2046. [Google Scholar] [CrossRef] [PubMed] [Green Version]
  6. Wang, H.; He, P.; Shen, C.; Wu, Z. Effect of irrigation amount and fertilization on agriculture non-point source pollution in the paddy field. Environ. Sci. Pollut. Res. 2019, 26, 10363–10373. [Google Scholar] [CrossRef]
  7. Issaka, S.; Ashraf, M.A. Impact of soil erosion and degradation on water quality: A review. Geol. Ecol. Landsc. 2017, 1, 1–11. [Google Scholar] [CrossRef] [Green Version]
  8. Deng, H.; Wei, R.; Luo, W.; Hu, L.; Li, B.; Di, Y.; Shi, H. Microplastic pollution in water and sediment in a textile industrial area. Environ. Pollut. 2020, 258, 113658. [Google Scholar] [CrossRef]
  9. Wang, Q.; Yang, Z. Industrial water pollution, water environment treatment, and health risks in China. Environ. Pollut. 2016, 218, 358–365. [Google Scholar] [CrossRef]
  10. Northey, S.; Mudd, G.M.; Saarivuori, E.; Wessman-Jääskeläinen, H.; Haque, N. Water footprinting and mining: Where are the limitations and opportunities? J. Clean. Prod. 2016, 135, 1098–1116. [Google Scholar] [CrossRef]
  11. Fernandes, G.W.; Goulart, F.F.; Ranieri, B.D.; Coelho, M.S.; Dales, K.; Boesche, N.; Bustamante, M.; Carvalho, F.A.; Carvalho, D.C.; Dirzo, R.; et al. Deep into the mud: Ecological and socio-economic impacts of the dam breach in Mariana, Brazil. Natureza & Conservação 2016, 14, 35–45. [Google Scholar] [CrossRef]
  12. Costa, D.D.A.; Assumpção, R.D.S.F.V.; De Azevedo, J.P.S.; Dos Santos, M.A. Dos instrumentos de gestão de recursos hídricos—O Enquadramento—Como ferramenta para reabilitação de rios. Saúde em Debate 2019, 43, 35–50. [Google Scholar] [CrossRef] [Green Version]
  13. UN Water. Sustainable Development Goal 6: Synthesis Report 2018 on Water and Sanitation; United Nations publications; United Nations: New York, NY, USA, 2018; ISBN 978-92-1-101370-2. [Google Scholar]
  14. Behmel, S.; Damour, M.; Ludwig, R.; Rodriguez, M. Water quality monitoring strategies—A review and future perspectives. Sci. Total. Environ. 2016, 571, 1312–1329. [Google Scholar] [CrossRef] [PubMed]
  15. Brack, W.; Dulio, V.; Ågerstrand, M.; Allan, I.; Altenburger, R.; Brinkmann, M.; Bunke, D.; Burgess, R.M.; Cousins, I.; Escher, B.I.; et al. Towards the review of the European Union Water Framework Directive: Recommendations for more efficient assessment and management of chemical contamination in European surface water resources. Sci. Total. Environ. 2017, 576, 720–737. [Google Scholar] [CrossRef]
  16. Altenburger, R.; Brack, W.; Burgess, R.M.; Busch, W.; Escher, B.I.; Focks, A.; Mark Hewitt, L.; Jacobsen, B.N.; De Alda, M.L.; Ait-Aissa, S.; et al. Future water quality monitoring: Improving the balance between exposure and toxicity assessments of real-world pollutant mixtures. Environ. Sci. Eur. 2019, 31, 12. [Google Scholar] [CrossRef] [Green Version]
  17. Chapman, D.V.; Bradley, C.; Gettel, G.M.; Hatvani, I.G.; Hein, T.; Kovács, J.; Liska, I.; Oliver, D.M.; Tanos, P.; Trásy, B.; et al. Developments in water quality monitoring and management in large river catchments using the Danube River as an example. Environ. Sci. Policy 2016, 64, 141–154. [Google Scholar] [CrossRef] [Green Version]
  18. Fu, B.; Merritt, W.S.; Croke, B.F.W.; Weber, T.R.; Jakeman, A.J. A review of catchment-scale water quality and erosion models and a synthesis of future prospects. Environ. Model. Softw. 2019, 114, 75–97. [Google Scholar] [CrossRef]
  19. Costa, C.M.D.S.B.; Marques, L.D.S.; Almeida, A.K.; Leite, I.R.; De Almeida, I.K. Applicability of water quality models around the world—a review. Environ. Sci. Pollut. Res. 2019, 26, 36141–36162. [Google Scholar] [CrossRef]
  20. UN Agenda 21. In Proceedings of the United Nations Conference on Environment & Development, Rio de Janeiro, Brazil, 3–14 June 1992.
  21. United Nations; Environment Programme; United Nations; Development Programme. Status Report on the Application of Integrated Approaches To Water Resources Management; United Nations Environment Programme: Nairobi, Kenya, 2012; ISBN 978-92-807-3264-1. [Google Scholar]
  22. Boelee, E.; Geerling, G.; Van Der Zaan, B.; Blauw, A.; Vethaak, A.D. Water and health: From environmental pressures to integrated responses. Acta Trop. 2019, 193, 217–226. [Google Scholar] [CrossRef]
  23. Badham, J.; ElSawah, S.; Guillaume, J.H.A.; Hamilton, S.H.; Hunt, R.J.; Jakeman, A.J.; Pierce, S.A.; Snow, V.; Babbar-Sebens, M.; Fu, B.; et al. Effective modeling for Integrated Water Resource Management: A guide to contextual practices by phases and steps and future opportunities. Environ. Model. Softw. 2019, 116, 40–56. [Google Scholar] [CrossRef] [Green Version]
  24. Berger, L.; Henry, A.D.; Pivo, G. Integrated water management recommendations in practice: Coexistence of old and new ways in Arizona. Hydrol. Res. 2020, 22, 501–518. [Google Scholar] [CrossRef]
  25. Araral, E.; Wang, Y. Water Governance 2.0: A Review and Second Generation Research Agenda. Water Resour. Manag. 2013, 27, 3945–3957. [Google Scholar] [CrossRef] [Green Version]
  26. Woodhouse, P.; Muller, M. Water Governance—An Historical Perspective on Current Debates. World Dev. 2017, 92, 225–241. [Google Scholar] [CrossRef] [Green Version]
  27. Potts, R. Disconnected dots?: A systematic review of governance challenges for natural resource management. J. Environ. Plan. Manag. 2019, 63, 1356–1374. [Google Scholar] [CrossRef]
  28. Herrera, V. Reconciling global aspirations and local realities: Challenges facing the Sustainable Development Goals for water and sanitation. World Dev. 2019, 118, 106–117. [Google Scholar] [CrossRef]
  29. Flores, C.C.; Vikolainen, V.; Bressers, H. Water Governance Decentralisation and River Basin Management Reforms in Hierarchical Systems: Do They Work for Water Treatment Policy in Mexico’s Tlaxcala Atoyac Sub-Basin? Water 2016, 8, 210. [Google Scholar] [CrossRef] [Green Version]
  30. WWAP. Leaving No One Behind; The United Nations World Water Development Report UNESCO World Water Assessment Programme: Paris, France, March 2019. [Google Scholar]
  31. WWAP. Wastewater, the Untapped Resource, The United Nations World Water Development Report; UNESCO World Water Assessment Programme: Paris, France, March 2017. [Google Scholar]
  32. ANA. SDG 6 in Brazil: ANA’s Vision of the Indicators; Brazilian National Water Agency: Brasília, Brazil, 2019.
  33. ANA. Brazilian Water Resources Report; National Water Agency: Brasília, Brazil, 2019.
  34. Brazilian National Congress. Brazilian National Water Resources Policy. Federal Law no. 9433. Brasília, Brazil, 1997. [Google Scholar]
  35. ANA. Brazilian Water Resources Report Full Report; National Water Agency: Brasília, Brazil, 2018.
  36. Brazilian National Environment Council (CONAMA). Resolution no. 357. Provides the classification of water bodies and environmental guidelines for their framework, as well as stablishes the conditions and standards for effluents discharge. Brasília, Brazil, 2005; pp. 1–27. [Google Scholar]
  37. Costa, D.D.A.; De Azevedo, J.P.S.; Dos Santos, M.A.; Assumpção, R.D.S.F.V. Water quality assessment based on multivariate statistics and water quality index of a strategic river in the Brazilian Atlantic Forest. Sci. Rep. 2020, 10, 1–13. [Google Scholar] [CrossRef]
  38. Ribeiro, P.E.A.M.; Da Hora, M. 20 Anos Da Lei No9.433/97: Percepções Dos Comitês De Bacia Hidrográfica E Dos Órgãos Gestores Acerca Do Enquadramento De Corpos D’água. Rev. Gestão Água da América Lat. 2019, 16, 1. [Google Scholar] [CrossRef] [Green Version]
  39. Valeriano, M.D.M.; Rossetti, D.D.F. Topodata: Brazilian full coverage refinement of SRTM data. Appl. Geogr. 2012, 32, 300–309. [Google Scholar] [CrossRef]
  40. Lima, C.H.P. Development of an Environmental Flow Approach Applied to the Piabanha River Watershed; Federal University of Rio de Janeiro (UFRJ/COPPE): Rio de Janeiro, Brazil, 2019. [Google Scholar]
  41. Silva Junior, L.C.S. Analysis of Wastewater Impact on River Water Quality through Computational Modeling—Study Case in Piabanha River/RJ.; Federal University of Rio de Janeiro (COPPE/UFRJ): Rio de Janeiro, Brazil, 2020. [Google Scholar]
  42. Villas-Boas, M.D.; Olivera, F.; De Azevedo, J.P.S. Assessment of the water quality monitoring network of the Piabanha River experimental watersheds in Rio de Janeiro, Brazil, using autoassociative neural networks. Environ. Monit. Assess. 2017, 189, 439. [Google Scholar] [CrossRef]
  43. Alvim, B.R. Dinâmica do Nitrogênio e Fósforo em Águas Fluviais de Uma Bacia Hidrográfica com Diferentes Usos do Solo no Sudeste do Brasil; Universida de Federal Fluminense: Rio de Janeiro, Brazil, 2016. [Google Scholar]
  44. National Water Agency (Brazil). Portal HidroWeb. Brazilian National Water Resources Information System. Available online: http://www.snirh.gov.br/hidroweb/ (accessed on 22 April 2020).
  45. de Almeida, H.A.; Freitas, R.C.; da Silva, L. Determinação de períodos secos e chuvosos em duas microregiões da Paraíba através da técnica dos quantis. Rev. Geogr. 2013, 30, 217–232. [Google Scholar]
  46. Cárdenas, O.L.; Peinado-Guevara, H.J.; Montoya, J.M.; Campos, M.N.; Ocampo, H.G.; León, S.C. Seasonal Trend Indicators and Return Periods of Meteorological Drought in the Northern States of Mexico. Pol. J. Environ. Stud. 2017, 26, 1471–1484. [Google Scholar] [CrossRef]
  47. Azevedo, J.P.S. Relatório Final do Projeto HIDROECO/Piabanha: Metodologia para Determinação de Vazões Ambientais Na Região Serrana Do RJ Integrando Aspectos Hidrometeorológicos, Ecológicos E Socioeconômico. Volume 1: Informações Quali-Quantitativas.; UFRJ: Rio de Janeiro, Brazil, 2017. [Google Scholar]
  48. Associação Pró-Gestão das Águas da Bacia Hidrográfica do Rio Paraíba do Sul (AGEVAP). Termo de Referência para contratação de empresa especializada para o monitoramento de rios na Região Hidrográfica Piabanha (RH-IV) [Term of Reference for hiring a specialized company to monitor rivers in the Piabanha Hydrographic Region (RH-IV)]. Available online: http://www.agevap.org.br/atos_view.php?id=597 (accessed on 22 April 2020).
  49. ANA. Enquadramento Dos Corpos D’água em Classes. Encarte Especial da Conjuntura Dos Recursos Hídricos no Brasil de 2019; National Water Agency: Brasília, Brazil, 2020.
  50. APHA. Standard Method for Examination of Water and Wastewater, 22nd ed.; American Public Health Association: Washington, DC, USA, 2012; ISBN 9780875530130. [Google Scholar]
  51. Buchhorn, M.; Smets, B.; Bertels, L.; Lesiv, M.; Tsendbazar, N.-E.; Masiliunas, D.; Linlin, L.; Herold, M.; Fritz, S. Copernicus Global Land Service: Land Cover 100m: Collection 3: Epoch 2019: Globe. (Version V3.0.1) [Data set]. 2020. [Google Scholar] [CrossRef]
  52. National Water Agency (Brazil). Sistema Federal de Regulação de Uso—REGLA (Federal System for the Regulation of Uses). Available online: http://www.snirh.gov.br/cnarh/identificar.jsf (accessed on 22 April 2020).
  53. Weinberg, Á. Water Quality Control and Monitoring Prioritization Methodology as a Tool for Water Resourse Management; Federal University of Rio de Janeiro (COPPE/UFR): Rio de Janeiro, Brazil, 2018. [Google Scholar]
  54. ANA. Atlas Esgotos—Despoluição de Bacias Hidrográficas; Brazilian National Water Agency: Brasília, Brazil, 2017; ISBN 978-85-8210-050-9.
  55. von Sperling, M. Estudos E Modelagem Da Qualidade da Água em Rios, 2nd ed.; UFMG: Belo Horizonte, Brazil, 2014; ISBN 978-85-423-0080-2. [Google Scholar]
  56. Costa, D.J.L.; Teixeira, D. Análise de incerteza em um modelo matemático de qualidade da água aplicado ao Ribeirão do Ouro, Araraquara, SP, Brasil. Ambient. e Agua—Interdiscip. J. Appl. Sci. 2011, 6, 232–245. [Google Scholar] [CrossRef]
  57. Salla, M.R.; Pereira, C.E.; Filho, J.E.A.; De Paula, L.M.; Pinheiro, A.M. Estudo da autodepuração do rio Jordão, localizado na bacia hidrográfica do rio Dourados. Eng. Sanit. Ambient. 2013, 18, 105–114. [Google Scholar] [CrossRef] [Green Version]
  58. Teodoro, A.; Ide, C.N.; Ribeiro, M.L.; Broch, S.A.O.; Da Silva, J.B. Implementação do conceito Capacidade de Diluiçãode Efluentes no modelo de qualidade da água QUAL-UFMG: Estudo de caso no Rio Taquarizinho (MS). Eng. Sanit. Ambient. 2013, 18, 275–288. [Google Scholar] [CrossRef] [Green Version]
  59. Calmon, A.; Souza, J.; Reis, J.; Mendonça, A. Uso combinado de curvas de permanência de qualidade e modelagem da autodepuração como ferramenta para suporte ao processo de enquadramento de cursos d-água superficiais. RBRH 2016, 21, 118–133. [Google Scholar] [CrossRef]
  60. Gomes, S.H.R.; Guedes, H.A.S.; Siqueira, T.M.; Corrêa, L.B.; Andreazza, R.; Hüffner, A.N. Modelagem sazonal da qualidade da água do Rio dos Sinos/RS utilizando o modelo QUAL-UFMG. Eng. Sanit. e Ambient. 2018, 23, 275–285. [Google Scholar] [CrossRef] [Green Version]
  61. Lima, B.P.; Mamede, G.L.; Neto, I.E.L. Monitoramento e modelagem da qualidade de água em uma bacia hidrográfica semiárida. Eng. Sanit. e Ambient. 2018, 23, 125–135. [Google Scholar] [CrossRef] [Green Version]
  62. Bringer, L.M.; Dos Reis, J.A.T.; Mendonça, A.S.F. Wastewater treatment systems selection inside watersheds by using multiobjective analysis. RBRH 2018, 23, 23. [Google Scholar] [CrossRef] [Green Version]
  63. Da Silva, S.R.; Junior, M.A.B.D.S.; De Lima, E.E.S. Analysis and modeling of water quality as a contribution to the preliminary framework proposal for the Una River (Pernambuco/Brazil). Ambient. Agua Interdiscip. J. Appl. Sci. 2018, 13, 1–13. [Google Scholar] [CrossRef]
  64. Von Sperling, M.; Von Sperling, E. Challenges for bathing in rivers in terms of compliance with coliform standards. Case study in a large urbanized basin (das Velhas River, Brazil). Water Sci. Technol. 2013, 67, 2534–2542. [Google Scholar] [CrossRef] [PubMed]
  65. Filho, A.A.D.O.; Neto, I.E.L. Modelagem da qualidade da água do rio Poti em Teresina (PI). Eng. Sanit. e Ambient. 2017, 23, 3–14. [Google Scholar] [CrossRef] [Green Version]
  66. Nunes, M.L.A. Subsidies For Piabanha River Framing Supported by Mathematical Modelling of Water Quality; Federal University of Rio de Janeiro (COPPE/UFRJ): Rio de Janeiro, Brzil, 2014. [Google Scholar]
  67. de Paula, T.P. Analysis and Mathematical Modeling of the Water Quality in Strech of the River Piabanha/RJ; Federal University of Rio de Janeiro (COPPE/UFRJ): Rio de Janeiro, Brazil, 2011. [Google Scholar]
  68. Moriasi, D.N.; Gitau, M.W.; Pai, N.; Daggupati, P. Hydrologic and Water Quality Models: Performance Measures and Evaluation Criteria. Trans. ASABE 2015, 58, 1763–1785. [Google Scholar] [CrossRef] [Green Version]
  69. Arnold, J.G.; Moriasi, D.N.; Gassman, P.W.; Abbaspour, K.C.; White, M.J.; Srinivasan, R.; Santhi, C.; Harmel, R.D.; Van Griensven, A.; Van Liew, M.W.; et al. SWAT: Model Use, Calibration, and Validation. Trans. ASABE 2012, 55, 1491–1508. [Google Scholar] [CrossRef]
  70. CPRM. Relatório-Síntese do Trabalho de Regionalização de Vazões da Sub-Bacia 58; Geological Survey of Brazil: Rio de Janeiro, Brazil, 2003.
  71. INEA Resolution No. 162 of December 26, 2018 - Establishes criteria for determining the reference flow for purposes of calculating water availability for granting the right to use water resources and uses considered insignificant in the domain of the State of Rio de Janeiro. In (Resolução INEA No 162 De 26 De Dezembro De 2018 —Estabelece Critério Para A Determinação da Vazão De Referência Para Fins Do Cálculo De Disponibilidade Hídrica Para Outorga De Direito De Uso De Recursos Hídricos E Usos Considerados Insignificantes De Domínio do Estado do Rio de Janeiro); State Environmental Institute (INEA): Rio de Janeiro, Brazil, 2018; p. 3.
  72. Fries, A.S.; Coimbra, J.P.; Nemazie, D.A.; Summers, R.M.; De Azevedo, J.P.S.; Filoso, S.; Newton, M.; Gelli, G.; De Oliveira, R.C.N.; Pessoa, M.A.R.; et al. Guanabara Bay ecosystem health report card: Science, management, and governance implications. Reg. Stud. Mar. Sci. 2019, 25, 100474. [Google Scholar] [CrossRef]
  73. Porto, M.; Porto, R.L.L. Gestão de bacias hidrográficas. Estud. Avançados 2008, 22, 43–60. [Google Scholar] [CrossRef] [Green Version]
  74. da Silva Junior, L.C.S.; Obraczka, M. Reúso de Efluentes de Estações de Tratamento de Esgoto no Beneficiamento de Concreto. Mix Sustentável 2020, 6, 85–92. [Google Scholar] [CrossRef]
  75. Santos, C.L.; Gelelete, D.S.; de Andrade Costa, D.; Barbosa, L.G.; Assis, M.M.C.; Guedes, R.B. Usos Múltiplos E Proposta De Revisão De Metodologia De Cobrança Pelo Uso Da Água (Multiple Water Uses and Methodological Proposal for Water Use Charging); AGEVAP: Resende, Brazil, 2018; ISBN 978-65-800-71-00-5. [Google Scholar]
  76. Royer, T.V.; David, M.B.; Gentry, L.E. Timing of Riverine Export of Nitrate and Phosphorus from Agricultural Watersheds in Illinois: Implications for Reducing Nutrient Loading to the Mississippi River. Environ. Sci. Technol. 2006, 40, 4126–4131. [Google Scholar] [CrossRef]
  77. Dalu, T.; Wasserman, R.J.; Magoro, M.L.; Froneman, P.W.; Weyl, O.L. River nutrient water and sediment measurements inform on nutrient retention, with implications for eutrophication. Sci. Total. Environ. 2019, 684, 296–302. [Google Scholar] [CrossRef]
  78. Alvim, R.B.; De Mello, W.Z.; Silveira, C.S.; Kligerman, D.C.; Ribeiro, R.P. Emissões de óxido nitroso em águas fluviais não poluídas e poluídas da Bacia do Rio Paquequer (Teresópolis, Rio de Janeiro). Eng. Sanit. Ambient. 2014, 19, 471–478. [Google Scholar] [CrossRef] [Green Version]
  79. Araújo, L.M.N. Identification of Precipitation and Soil Moisture Hydrological Patterns at Piabanha River Basin. Ph.D. Thesis, Federal University of Rio de Janiero, Rio de Janiero, Brazil, November 2016. [Google Scholar]
  80. Gaur, V.K.; Gupta, S.K.; Pandey, S.D.; Gopal, K.; Misra, V. Distribution of heavy metals in sediment and water of river Gomti. Environ. Monit. Assess. 2005, 102, 419–433. [Google Scholar] [CrossRef] [PubMed]
  81. Ngoye, E.; Machiwa, J.F. The influence of land-use patterns in the Ruvu river watershed on water quality in the river system. Phys. Chem. Earth, Parts A/B/C 2004, 29, 1161–1166. [Google Scholar] [CrossRef]
  82. Zhao, M.M.; Chen, Y.; Xue, L.-G.; Fan, T.T.; Emaneghemi, B. Greater health risk in wet season than in dry season in the Yellow River of the Lanzhou region. Sci. Total. Environ. 2018, 644, 873–883. [Google Scholar] [CrossRef]
  83. Church, M. BED MATERIAL TRANSPORT AND THE MORPHOLOGY OF ALLUVIAL RIVER CHANNELS. Annu. Rev. Earth Planet. Sci. 2006, 34, 325–354. [Google Scholar] [CrossRef]
  84. Yuill, B.T.; Gasparini, N. Hydrologic controls on wash load sediment concentrations within a low-ordered, ephemeral watershed. J. Hydrol. 2011, 410, 73–83. [Google Scholar] [CrossRef]
  85. Vigiak, O.; Grizzetti, B.; Udias-Moinelo, A.; Zanni, M.; Dorati, C.; Bouraoui, F.; Pistocchi, A. Predicting biochemical oxygen demand in European freshwater bodies. Sci. Total. Environ. 2019, 666, 1089–1105. [Google Scholar] [CrossRef] [PubMed]
  86. Jouanneau, S.; Recoules, L.; Durand, M.; Boukabache, A.; Picot, V.; Primault, Y.; Lakel, A.; Sengelin, M.; Barillon, B.; Thouand, G. Methods for assessing biochemical oxygen demand (BOD): A review. Water Res. 2014, 49, 62–82. [Google Scholar] [CrossRef] [PubMed]
  87. Sauvé, S.; Aboulfadl, K.; Dorner, S.; Payment, P.; Deschamps, G.; Prévost, M. Fecal coliforms, caffeine and carbamazepine in stormwater collection systems in a large urban area. Chemosphere 2012, 86, 118–123. [Google Scholar] [CrossRef]
  88. Zhang, X.; Zhi, X.; Chen, L.; Shen, Z. Spatiotemporal variability and key influencing factors of river fecal coliform within a typical complex watershed. Water Res. 2020, 178, 115835. [Google Scholar] [CrossRef]
  89. Monfared, S.A.H.; Darmian, M.D.; Snyder, S.A.; Azizyan, G.; Pirzadeh, B.; Moghaddam, M.A. Water Quality Planning in Rivers: Assimilative Capacity and Dilution Flow. Bull. Environ. Contam. Toxicol. 2017, 99, 531–541. [Google Scholar] [CrossRef]
  90. Ma, T.; Sun, S.; Fu, G.; Hall, J.W.; Ni, Y.; He, L.; Yi, J.; Zhao, N.; Du, Y.; Pei, T.; et al. Pollution exacerbates China’s water scarcity and its regional inequality. Nat. Commun. 2020, 11, 1–9. [Google Scholar] [CrossRef] [Green Version]
  91. Khdhiri, H.; Potier, O.; Leclerc, J.-P. Aeration efficiency over stepped cascades: Better predictions from flow regimes. Water Res. 2014, 55, 194–202. [Google Scholar] [CrossRef]
  92. Li, W.; Yang, S.; Xiao, Y.; Fu, X.; Hu, J.; Wang, T. Rate and Distribution of Sedimentation in the Three Gorges Reservoir, Upper Yangtze River. J. Hydraul. Eng. 2018, 144, 05018006. [Google Scholar] [CrossRef]
  93. Maavara, T.; Chen, Q.; Van Meter, K.; Brown, L.E.; Zhang, J.; Ni, J.; Zarfl, C. River dam impacts on biogeochemical cycling. Nat. Rev. Earth Environ. 2020, 1, 103–116. [Google Scholar] [CrossRef]
  94. Ahipathy, M.V.; Puttaiah, E.T. Ecological characteristics of Vrishabhavathy River in Bangalore (India). Environ. Earth Sci. 2006, 49, 1217–1222. [Google Scholar] [CrossRef]
  95. Kumar, A.Y.; Reddy, M.V. Assessment of seasonal effects of municipal sewage pollution on the water quality of an urban canal—A case study of the Buckingham canal at Kalpakkam (India): NO3, PO4, SO4, BOD, COD and DO. Environ. Monit. Assess. 2008, 157, 223–234. [Google Scholar] [CrossRef] [PubMed]
  96. Jerves-Cobo, R.; Benedetti, L.; Amerlinck, Y.; Lock, K.; De Mulder, C.; Van Butsel, J.; Cisneros, F.; Goethals, P.; Nopens, I. Integrated ecological modelling for evidence-based determination of water management interventions in urbanized river basins: Case study in the Cuenca River basin (Ecuador). Sci. Total. Environ. 2020, 709, 136067. [Google Scholar] [CrossRef]
  97. Clavijo, A.; Iribarnegaray, M.A.; Rodriguez-Alvarez, M.S.; Seghezzo, L. Closing the cycle? Potential and limitations of Water and Sanitation Safety Plans (WSSPs) for Latin American metropolitan areas. J. Water Sanit. Hyg. Dev. 2020, 10, 490–501. [Google Scholar] [CrossRef]
  98. Stip, C.; Mao, Z.; Bonzanigo, L.; Browder, G.; Tracy, J. Water Infrastructure Resilience; World Bank: Washington, DC, USA, 2019. [Google Scholar]
  99. Devesa, F.; Matas, J.C.; Turon, C.; Freixó, A.; Carrasco, F.; Poch, M. Scenario analysis for the role of sanitation infrastructures in integrated urban wastewater management. Environ. Model. Softw. 2009, 24, 371–380. [Google Scholar] [CrossRef]
  100. Noyola, A.; Padilla-Rivera, A.; Morgan-Sagastume, J.M.; Güereca, L.P.; Padilla, F.H. Typology of Municipal Wastewater Treatment Technologies in Latin America. CLEAN—Soil Air Water 2012, 40, 926–932. [Google Scholar] [CrossRef]
  101. Foresti, E.; Zaiat, M.; Vallero, M. Anaerobic Processes as the Core Technology for Sustainable Domestic Wastewater Treatment: Consolidated Applications, New Trends, Perspectives, and Challenges. Rev. Environ. Sci. Bio/Technology 2006, 5, 3–19. [Google Scholar] [CrossRef]
  102. Puga, B.P.; Junior, R.G.; Alexandre, G.M. Governança dos recursos hídricos na bacia do rio Jundiaí (São Paulo). Revibec Rev. Iberoam. Econ. Ecológica 2020, 32, 93–101. [Google Scholar]
  103. Braga, L.M.M. Sistemas Hídrico E Territorial Integrados A Partir Do Eixo Do Rio Jundiaí (Water and Territorial Systems Integrated from The Aixs of the Jundiaí River); Universida de Estadual de Campinas: Campinas, Brazil, 2017. [Google Scholar]
  104. CNRH Resolution 181. In Approves the Priorities, Actions and Goals of the National Water Resources Plan for 2016–2020; Brazilian National Water Resources Council (CNRH): Brasil, Brazil, 2016; p. 15.
  105. CNRH Resolution n˚91. In Provides for General Procedures for Framing Surface and Underground Water Bodies; Brazilian National Water Resources Council (CNRH): Brasília, Brazil, 2008; pp. 1–5.
  106. Melo, D.D.C.D.; Anache, J.A.A.; Almeida, C.D.N.; Coutinho, J.V.; Filho, G.M.R.; Rosalem, L.M.P.; Pelinson, N.D.S.; Ferreira, G.L.R.A.; Schwamback, D.; Calixto, K.G.; et al. The big picture of field hydrology studies in Brazil. Hydrol. Sci. J. 2020, 65, 1262–1280. [Google Scholar] [CrossRef]
  107. Narzetti, D.A.; Marques, R.C. Models of Subsidies for Water and Sanitation Services for Vulnerable People in South American Countries: Lessons for Brazil. Water 2020, 12, 1976. [Google Scholar] [CrossRef]
  108. Da Motta, R.S.; Moreira, A. Efficiency and regulation in the sanitation sector in Brazil. Util. Policy 2006, 14, 185–195. [Google Scholar] [CrossRef] [Green Version]
  109. Kresch, E.P.; Schneider, R. Political determinants of investment in water and sanitation: Evidence from Brazilian elections. Econ. Lett. 2020, 189, 109041. [Google Scholar] [CrossRef]
  110. Andersson, K.; Dickin, S.; Rosemarin, A. Towards “Sustainable” Sanitation: Challenges and Opportunities in Urban Areas. Sustainability 2016, 8, 1289. [Google Scholar] [CrossRef] [Green Version]
  111. Kishi, S.A.S.; Martins, A.F.; Salvador, A.V.A.; de Azevedo Camargo, E.M.; Vianna, M.D.B. Ministério público resolutivo: Projeto Qualidade da Água e Projeto Conexão Água. Ministério Público e Sustentabilidade O Direito das Present. e Futur. Gerações 2017, 87–107. Available online: http://conexaoagua.mpf.mp.br/arquivos/artigos-cientificos/2017/03-ministerio-publico-resolutivo-projeto-qualidade-da-agua-e-projeto-conexao-agua.pdf (accessed on 22 April 2020).
  112. MPF. Efetivação das Metas de Qualidade das Águas no Brasil; Ministério Público Federal: Brasília, Brazil, 2018. [Google Scholar]
  113. Costa, D.d.A.; Assumpção, R.d.S.F.V.; de Azevedo, J.P.S.; Leite, P.S.O.d.S.; Rosario, L.; Nunes, G.; Cinelli, W.S.; Montes, V.M.; Gouvêa, L.H.d.A. Delimitation Project of the Continues Riparian Protected Stripe to Piabanha River at the Rio de Janeiro State, Brazil. In Proceedings of the II International Conference on Research for Sustainable Development in Mountain Regions, Instituto Politécnico de Bragança, Nova Friburgo, Brazil, 10–14 December 2018; p. 298. [Google Scholar]
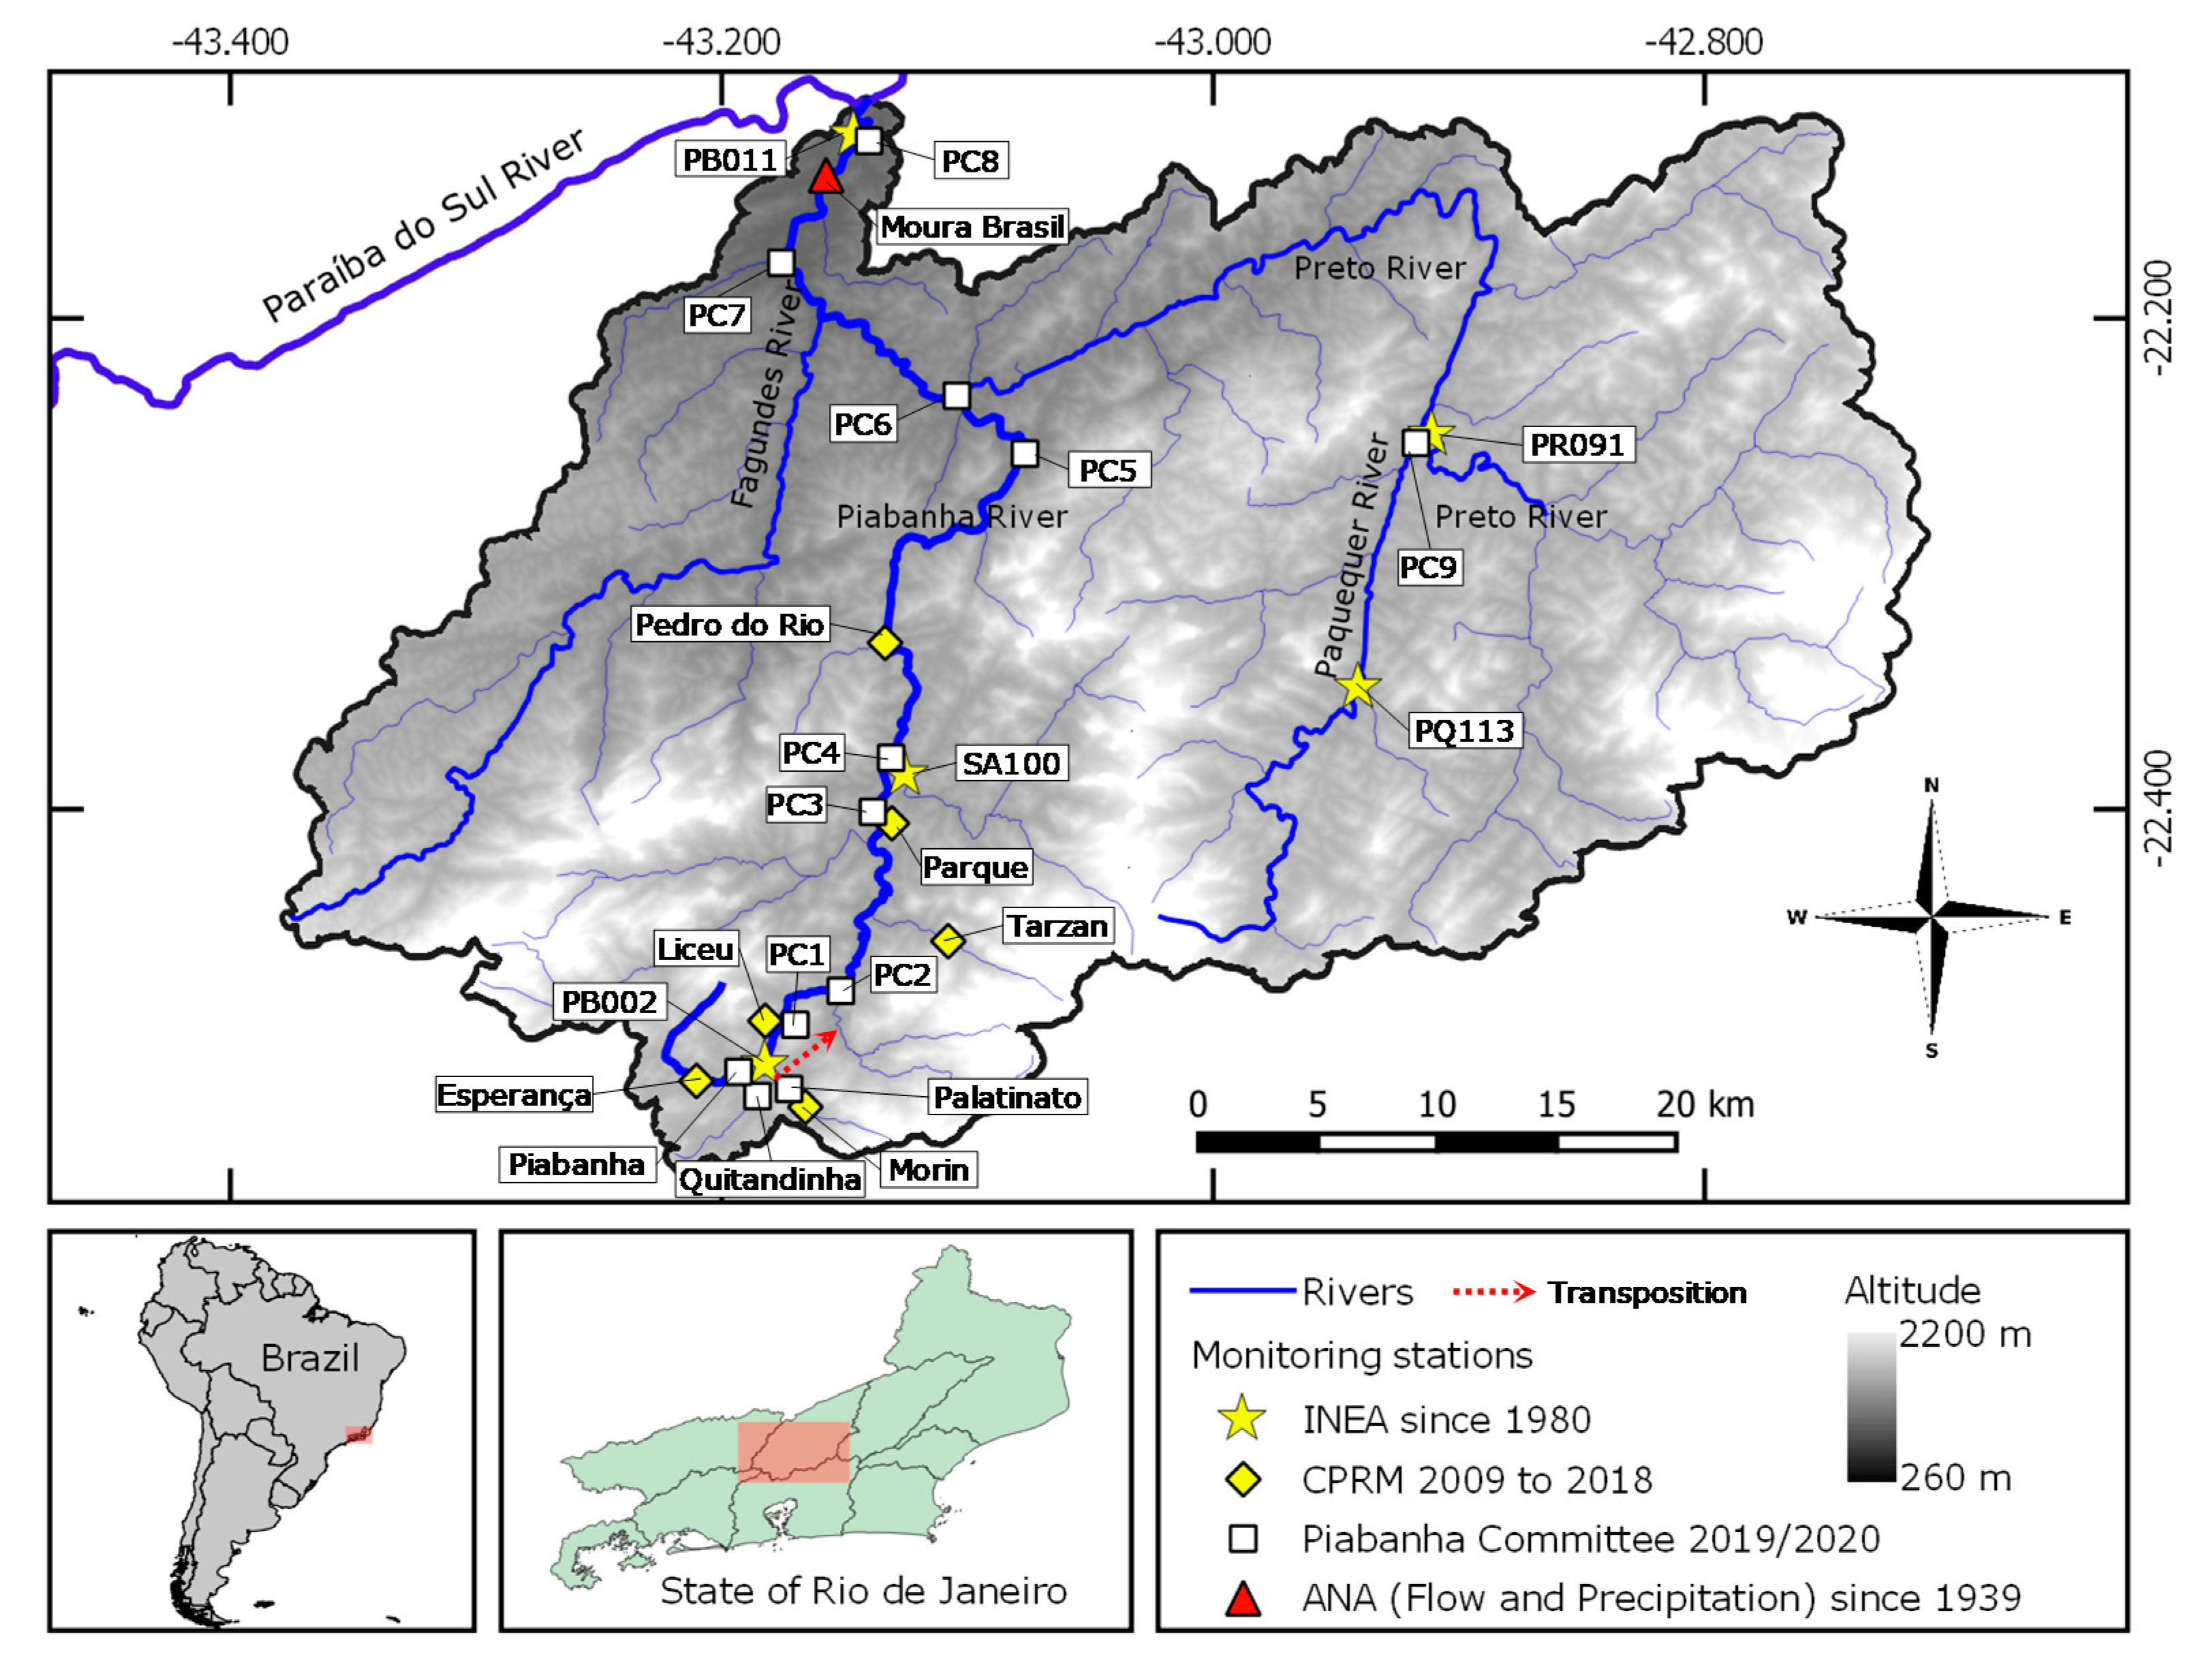
Figure 1. Study area and monitoring stations.
Water 13 00176 g001
Figure 2. QUAL-UFMG conceptual model for constituents’ inter-relationships. The relationship with the sediment is indicated by the hatched rectangles. Adapted from von Sperling [55].
Water 13 00176 g002
Figure 3. Land cover map obtained from the database produced by Copernicus Land Service [51].
Water 13 00176 g003
Figure 4. Average monthly (1939–2019) rainfall in the watershed and flow rate at the Piabanha River’s outlet. The dry period corresponds to the months from May to September. The rainy period corresponds to the months from October to April. Each graphical element corresponds to a station from the Brazilian hydrometric network.
Water 13 00176 g004
Figure 5. Longitudinal and seasonal water quality variability in Piabanha River. (A) Biochemical oxygen demand (BOD5) for the dry season (May to September); (B) BOD5 for the wet season (October to April); (C) dissolved oxygen (DO) for the dry season (2015–2019 data); (D) DO measured in August 2020 at the lowest hydrological discharge, comparable to D95; (E) Escherichia coli for the dry season (May to September); and (F) Escherichia coli for the wet season (October to April). Dashed lines represent the water class 2 threshold, established by the Brazilian Environment Council CONAMA 357 resolution [36].
Water 13 00176 g005
Figure 6. Results of the model for the 95% permanence discharge (D95) discharge in the dry season, points represent measured samples. (A) BOD5 model validation. (B) DO model validation. (C) BOD5 prognosis, upper curve (red) with initial concentration of 10 mg L−1 and lower curve (blue) with initial concentration of 5 mg L−1 corresponding to the class 3 and class 2 scenarios, respectively. Dashed lines represent the thresholds for each quality class established by the Brazilian Environment Council CONAMA 357 resolution [36].
Water 13 00176 g006
Publisher’s Note: MDPI stays neutral with regard to jurisdictional claims in published maps and institutional affiliations.