Article

Natural Organic Matter Removal from Raw Surface Water: Benchmarking Performance of Chemical Coagulants through Excitation-Emission Fluorescence Matrix Spectroscopy Analysis

by
Raymond John C. Go
1,
Hui-Ling Yang
2,
Chi-Chuan Kan
3,*,
Dennis C. Ong
4,
Sergi Garcia-Segura
5 and
Mark Daniel G. de Luna
1,6,*
1
Environmental Engineering Program, National Graduate School of Engineering, University of the Philippines Diliman, Quezon City 1101, Philippines
2
Department of Environmental Engineering and Science, Feng Chia University, Taichung 407, Taiwan
3
Institute of Hot Spring Industry, Chia Nan University of Pharmacy and Science, Tainan 71710, Taiwan
4
School of Technology, University of the Philippines Visayas, Miagao, Iloilo 5023, Philippines
5
Nanosystems Engineering Research Center for Nanotechnology-Enabled Water Treatment, School of Sustainable Engineering and the Built Environment, Arizona State University, Tempe, AZ 85287-3005, USA
6
Department of Chemical Engineering, University of the Philippines Diliman, Quezon City 1101, Philippines
*
Authors to whom correspondence should be addressed.
Water 2021, 13(2), 146; https://doi.org/10.3390/w13020146
Submission received: 2 December 2020 / Revised: 30 December 2020 / Accepted: 5 January 2021 / Published: 10 January 2021
(This article belongs to the Section Wastewater Treatment and Reuse)

Abstract

:
Chemical disinfection of surface waters has been proven effective in minimizing the risk of contamination by water-borne pathogens. However, surface waters contain natural organic matter (NOM) which, upon chemical disinfection, is readily converted into hazardous disinfection-by-products. Hence, NOM removal from these waters is critical. Chemical coagulation is a readily implementable technology to minimize these undesired side-effects by NOM removal. Herein, capabilities of ferric chloride (FeCl3) and polyaluminum chloride (PACl) as pre-treatment for NOM abatement from natural raw surface water have been benchmarked. Excitation-emission fluorescence matrix (EEM) spectroscopy characterization of NOM fractions demonstrated high removal efficiency. A two-level full factorial design was employed to analyze the effects of coagulant dosage and initial pH on the removal of turbidity, humic acid-like substances and fulvic acid-like substances from the raw water. Higher removal of ~77% NOM was attained with PACl than with FeCl3 (~72%). Optimization through response surface methodology showed that the initial pH—coagulant dosage interaction was significant in removing NOM and turbidity for both PACl and FeCl3. These results identify the opportunity for coagulation technologies to prevent and minimize disinfection-by-products formation through NOM removal.

1. Introduction

Natural organic matter (NOM) is a complex mixture of organic compounds consisting of aromatic, aliphatic, phenolic, and quinolic functional groups [1]. In surface water, NOM accounts for 50–80% of humic substances [2]. Disinfection by-products (DBPs) can be formed when NOM reacts with active chlorine species during the drinking water treatment process [3,4,5]. Trihalomethanes and haloacetic acids are two popular groups of halogenated DBPs currently regulated by various drinking water standards [6]. Thus, minimizing NOM content prior to disinfection treatment can be identified as an urgent need to avoid DBP yield [7]. Different technologies such as photocatalysis [8], electrochemical treatments [9], the Fenton process [10], adsorption [11], ionic exchange [12] or coagulation [13] have been explored to remove NOM from drinking water sources prior to disinfection. However, coagulation treatment presents the most techno-economically viable option, and it is therefore the most widely used in drinking water treatment plants worldwide.
Coagulation–flocculation is a process in drinking water treatment which aims to remove turbidity, color, and pathogens from raw water [14,15]. Coagulation is a physical-chemical process that involves the destabilization of repulsive forces between negatively charged organic matter by positively charged metals (aluminum or iron), resulting in the subsequent agglomeration and settling of organic pollutants [16]. Iron and aluminum salts in monomeric or polymeric forms are the typical coagulants used in large-scale drinking water treatment [17,18]. Iron-based coagulants, typically ferric chloride (FeCl3), have been found to reduce dissolved organic carbon by about 29–70% [19]. Aluminum-based coagulants, on the other hand, are the most common coagulants in the drinking water industry [20]. Polyaluminum chloride (PACl) can address the drawbacks of the traditional alum, (Al2(SO4)3), since it is less sensitive to pH and temperature variation [21]. Moreover, PACl has high amounts of positively charged polycations which are very effective in neutralizing the negatively charged colloidal particles, thus increasing colloidal destabilization [22,23].
Previous research articles demonstrated excellent performance on NOM abatement by coagulation treatment. Aluminum salts have been the most employed coagulant source [19,24,25]. Recent reports suggest that residual aluminum (III) concentrations may be associated with neurodegenerative diseases such as Alzheimer’s [26]. In this work, we benchmark the performance of iron (III) and aluminum (III) regarding their capabilities to remove NOM due to the relevance of transitioning to the use of alternative coagulants non-containing aluminum. Furthermore, the interaction between different variables is not discussed in the literature that evaluates the effect of discrete aspects one at a time. In the present study, a two-level full factorial design was utilized to benchmark the removal of NOM fractions by chemical coagulation with FeCl3 and PACl coagulants. This study enables understanding of the principles of different variables’ interaction and their synergies on the enhancement of NOM abatement by coagulation. An excitation-emission fluorescence matrix (EEM) was used to characterize the NOM fractions before and after coagulant application. The contributions of initial pH and coagulant dosage in NOM removal were evaluated. The effects of each factor, as well as the interaction effects, the adequacy of the model to describe the experimental data, and the optimum values of the parameters were also examined.

2. Materials and Methods

2.1. Chemicals and Raw Surface Water

Ferric chloride (FeCl3, 99.99%), which is a yellowish solid with a hexagonal crystalline structure that is used as iron (III) coagulant source, was provided by Sigma-Aldrich. Polyaluminum chloride (PACl, 30%), an inorganic polymer difficult to structurally characterize with a suggested Keggin ion structure and is used as an aluminum (III) coagulant source, was supplied by Nanning Chemical Engineering Co. Ltd., Guangxi, China). Both salts were dissolved in water, yielding iron hydroxides and aluminum hydroxides commonly used in coagulation treatments for drinking water. Hydrochloric acid (HCl, 37%, ENSURE) and sodium hydroxide (NaOH, 98%, Shimakyu’s Pure Chemicals) were used as received. Stock solutions were prepared by dissolving known amounts of reagents in deionized water (18.2 MΩ cm, Millipore). The raw surface water used in all experiments was obtained from a water treatment plant in Taiwan which had an initial water quality summarized in Table 1.

2.2. Coagulation Experiments

Coagulation tests were conducted in a jar test apparatus (PB-700, Phipps & Bird). The initial pH of the water sample was adjusted according to the experimental design using 0.50 M NaOH and 0.50 M HCl. The water sample was subjected to 1 min rapid mixing at 100 rpm to ensure homogeneous distribution of the NOM particles in solution. Coagulant was added to the water sample and the solution was subjected to rapid mixing at 100 rpm for 1 min, followed by a flocculation process through slow mixing at 30 rpm for 15 min, and sedimentation for 30 min. Aliquots of 10 mL samples were collected during treatment for further analysis and characterization.
A full factorial design was used to understand the influence of operational variables and the interaction between factors during the coagulation process. The response surfaces generated were employed to identify optimum operational parameters [27]. The effect of each factor on the response was determined by the design along with the interaction, which is the effect of a factor that varies with the change in the level of other factors [28]. The two-level full factorial experimental design considered two levels per factor coded as ‘high’ and a ‘low’ level of ‘+1’ and ‘−1’, respectively. The experimental matrix consisted of 2 k runs where k is the number of factors/variables evaluated. However, a potential concern in the use of two-level full factorial design (FFD) is the assumption of linearity in the effect of the factors: (A) initial pH and (B) coagulant dosage. The variables and levels of the experimental design are presented in Table 2, where A and B are the equivalent values in coded forms. Protection against curvature is done by adding center points, whereby the design also obtains an independent estimate of error [29]. In addition, the method can easily be upgraded to response surface designs for optimization of process parameters [30]. The FFD was carried out using Design-Expert 6.0.8.

2.3. Analytical Methods

Initial pH was determined using a pH meter (PC-310, Suntex, Hong Kong, China). Turbidity was measured by a turbidity meter (2100 Q, Hach, Loveland, CO, USA). A zeta potential analyzer (ZetaPlus, Brookhaven, NY, USA) was utilized to determine the zeta potential of the water samples. An excitation emission fluorescence matrix (EEM) was employed to evaluate the NOM fractions (F-4500FL spectrophotometer, Hitachi, Tokyo, Japan). EEM spectroscopy is a sensitive and selective technique that can rapidly process data on NOM fractions without sample preparation [31]. EEM can analyze the structure and functional groups in a molecule, and determine the difference between sources of chromophoric dissolved organic material that has similar wavelengths [32]. Excitation emission matrix peaks are divided into five regions—aromatic proteins such as tyrosine and tryptophan are located in region I and region II, fulvic acid-like substances (FLS) can be found in region III, microbial by-product-like materials in region IV, and humic acid-like substances (HLS) in region V [33]. Fluorescence intensity decreases with increasing macromolecular size. The presence of fluorescence peaks is associated with linearly condensed aromatic rings and other unsaturated bond systems and has a high degree of conjugation with macromolecules. The difference between the initial and final EEM peak intensities can be linked to NOM removal efficiency of emerging water treatment solutions [34]. Although pH adjustment may alter the fluorescence intensities, it does not affect the removal efficiency of the coagulation/flocculation process, as reported by earlier studies [35]. EEM plots were created by scanning excitation wavelength from 200 to 400 nm and emitting fluorescence from 280 to 550 nm with 10 nm steps. The steps for excitation and emission were set at 10 nm and the scan speed at 500 nm s−1. A fluorometer’s response to a blank solution was subtracted from the fluorescence spectra recorded for each sample to account for the Raleigh scattering.
The decrease in the fluorescence intensity peaks in the excitation-emission matrix was used as an indicator of NOM removal efficiency in the experiment. In previous studies, peak intensities were also used as an indication of NOM fraction removal [32,34]. Equation (1) was utilized to determine the NOM fraction removal (%):
NOM fraction removal (%) = ((F0max − FSmax)/F0max) × 100
where F0max is the maximum intensity of each fluorescence component of raw water NOM, and FSmax is the maximum intensity of each fluorescence component of water NOM of the sample after sedimentation [35].

3. Results and Discussion

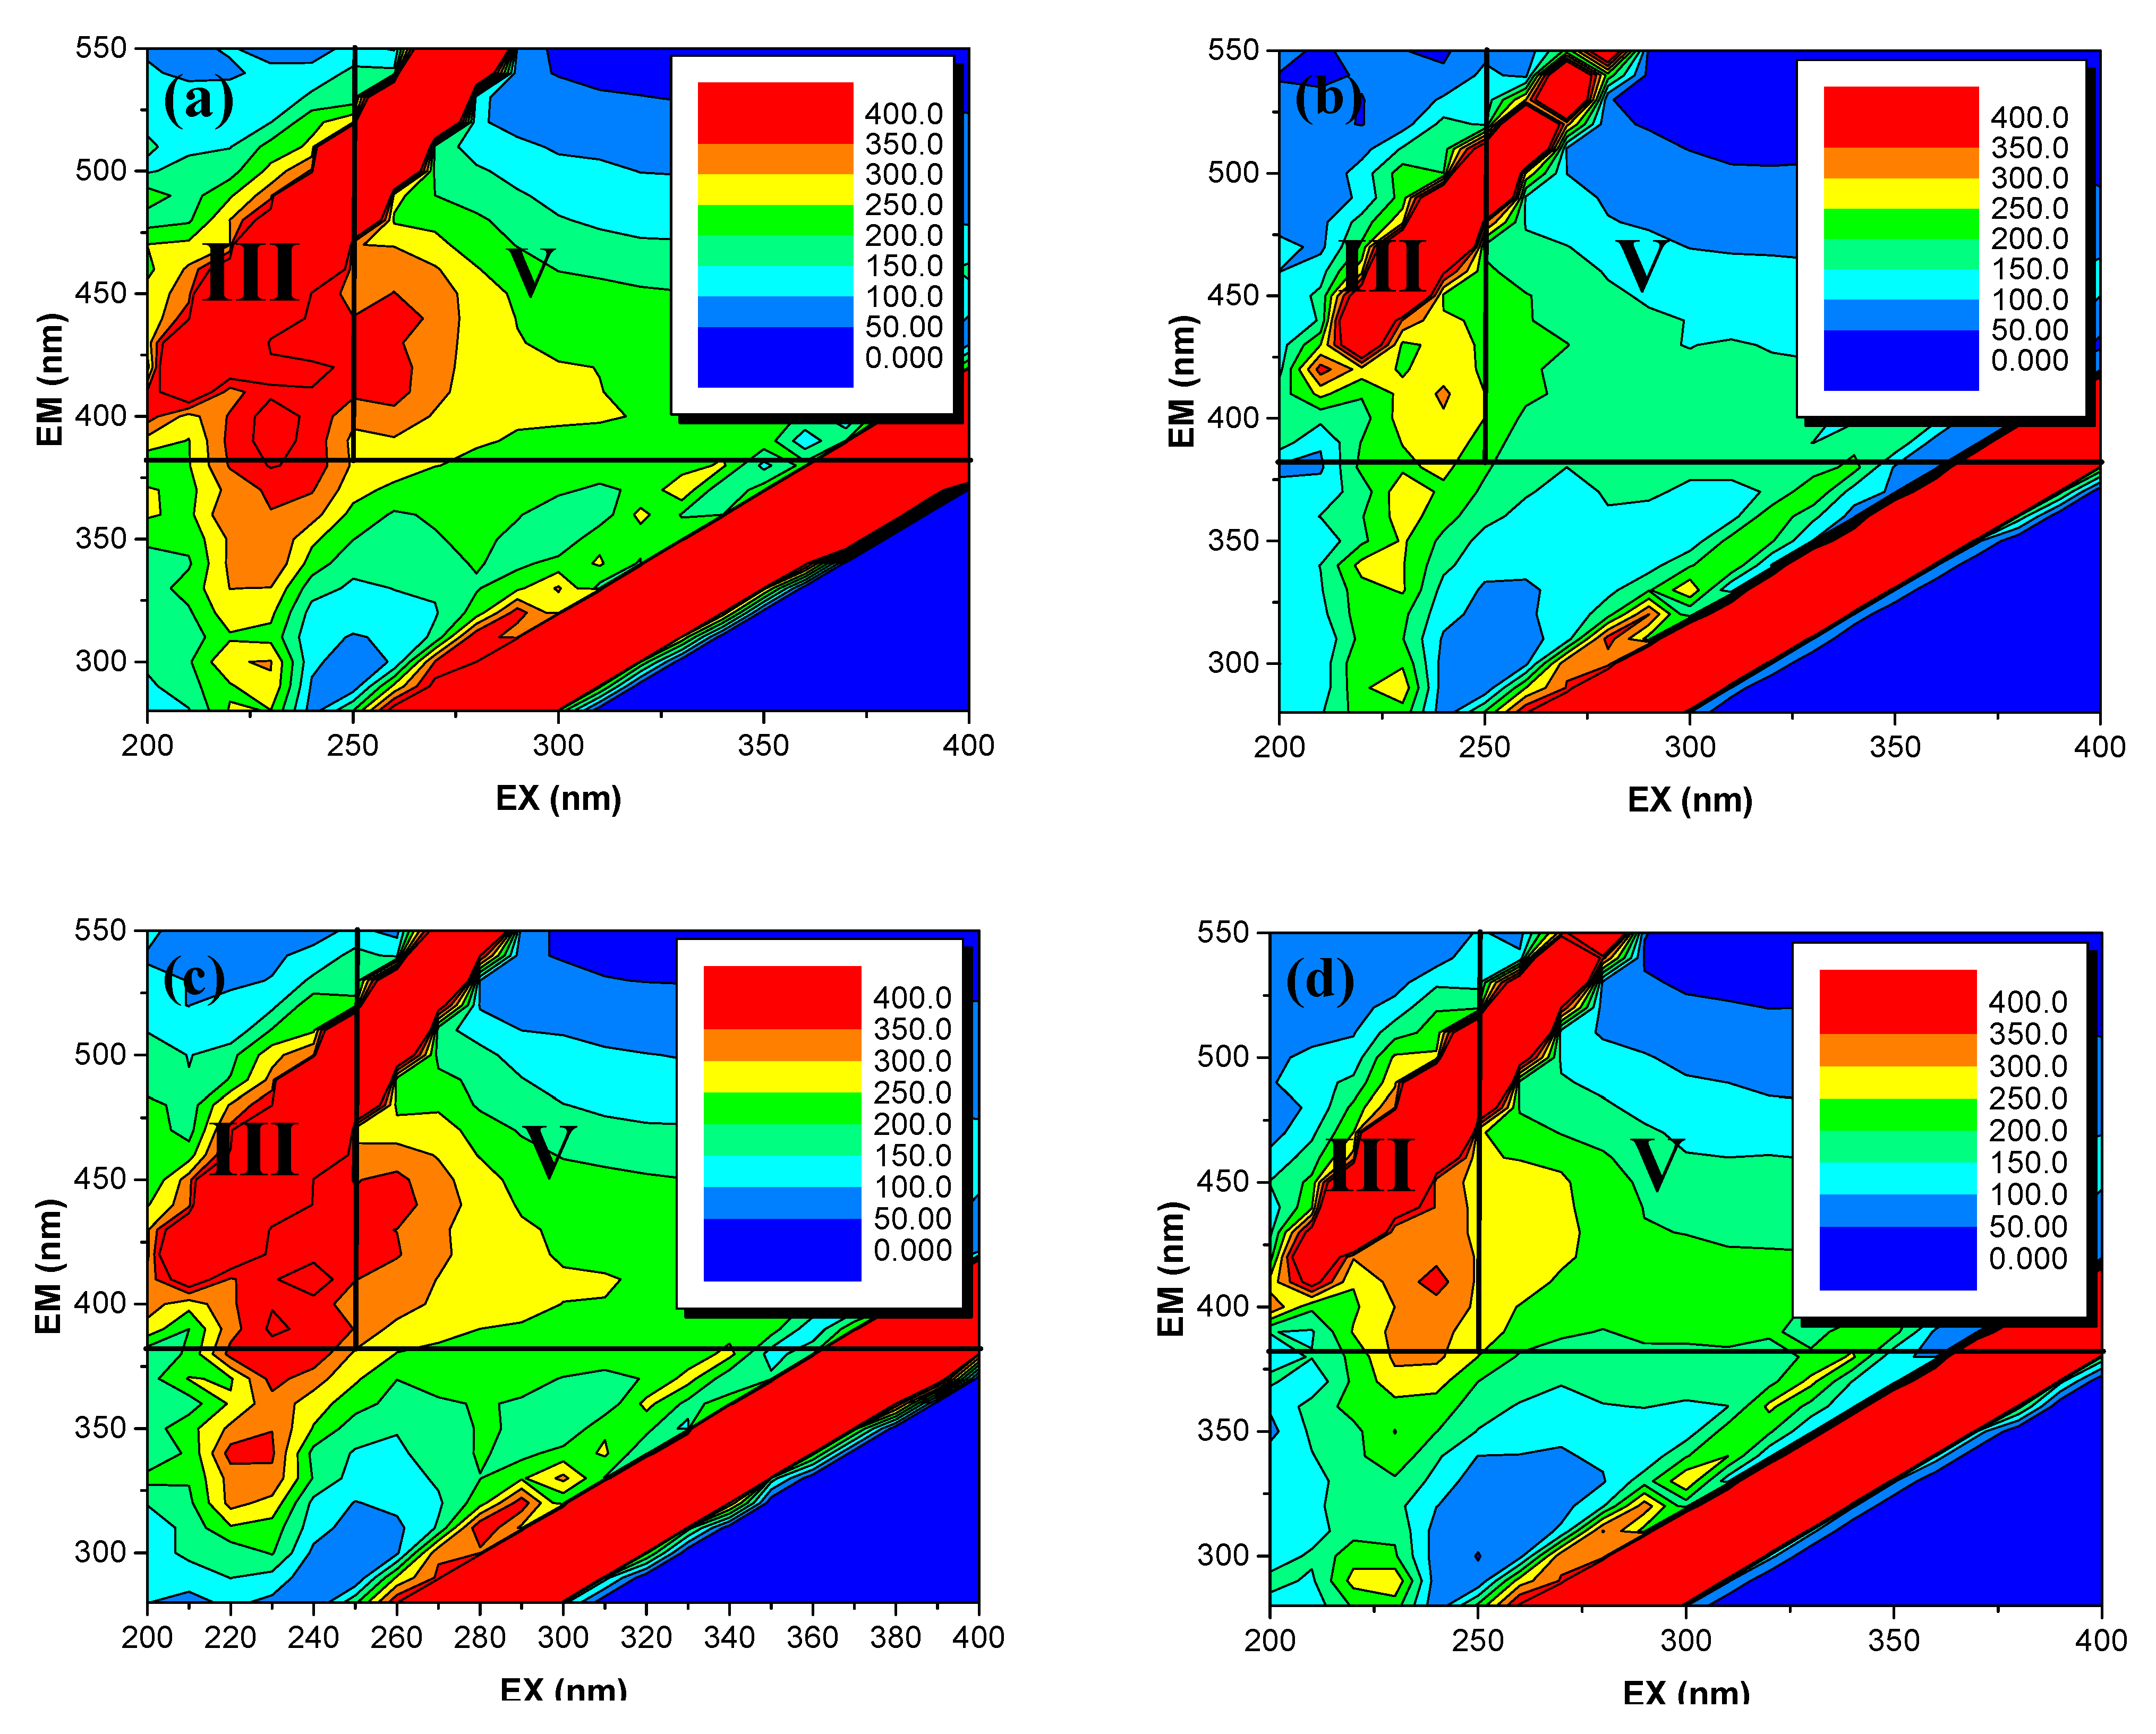
3.1. Natural Organic Matter Fractions Removal by Coagulation Treatment

Figure 1 shows the EEM contour plots before and after treatment using FeCl3 and PACl. The red-colored regions in sections III and V correspond to fulvic and humic acid-like species, respectively [33]. Transition to lighter colors (i.e., yellow and green) is associated with a notorious decrease in the concentration of these species. The high intensity in region III prior to treatment denotes a large presence of fulvic-like species in raw water samples (cf. Figure 1a,c). Likewise, in region V, the red spot located at the lower left side near region III denotes significant amounts of humic-like species. Intensity reduction of EEM signals was evident after the coagulation process where the peaks identified in the regions III and V which correspond to fulvic and humic acid-like disappeared after coagulation treatment independently of the coagulant species employed. The significant reduction in intensity after treatment, depicted by the EEM contours after coagulation treatment, allows us to infer effective NOM abatement with a better performance associated to iron (III) salts [18,35].

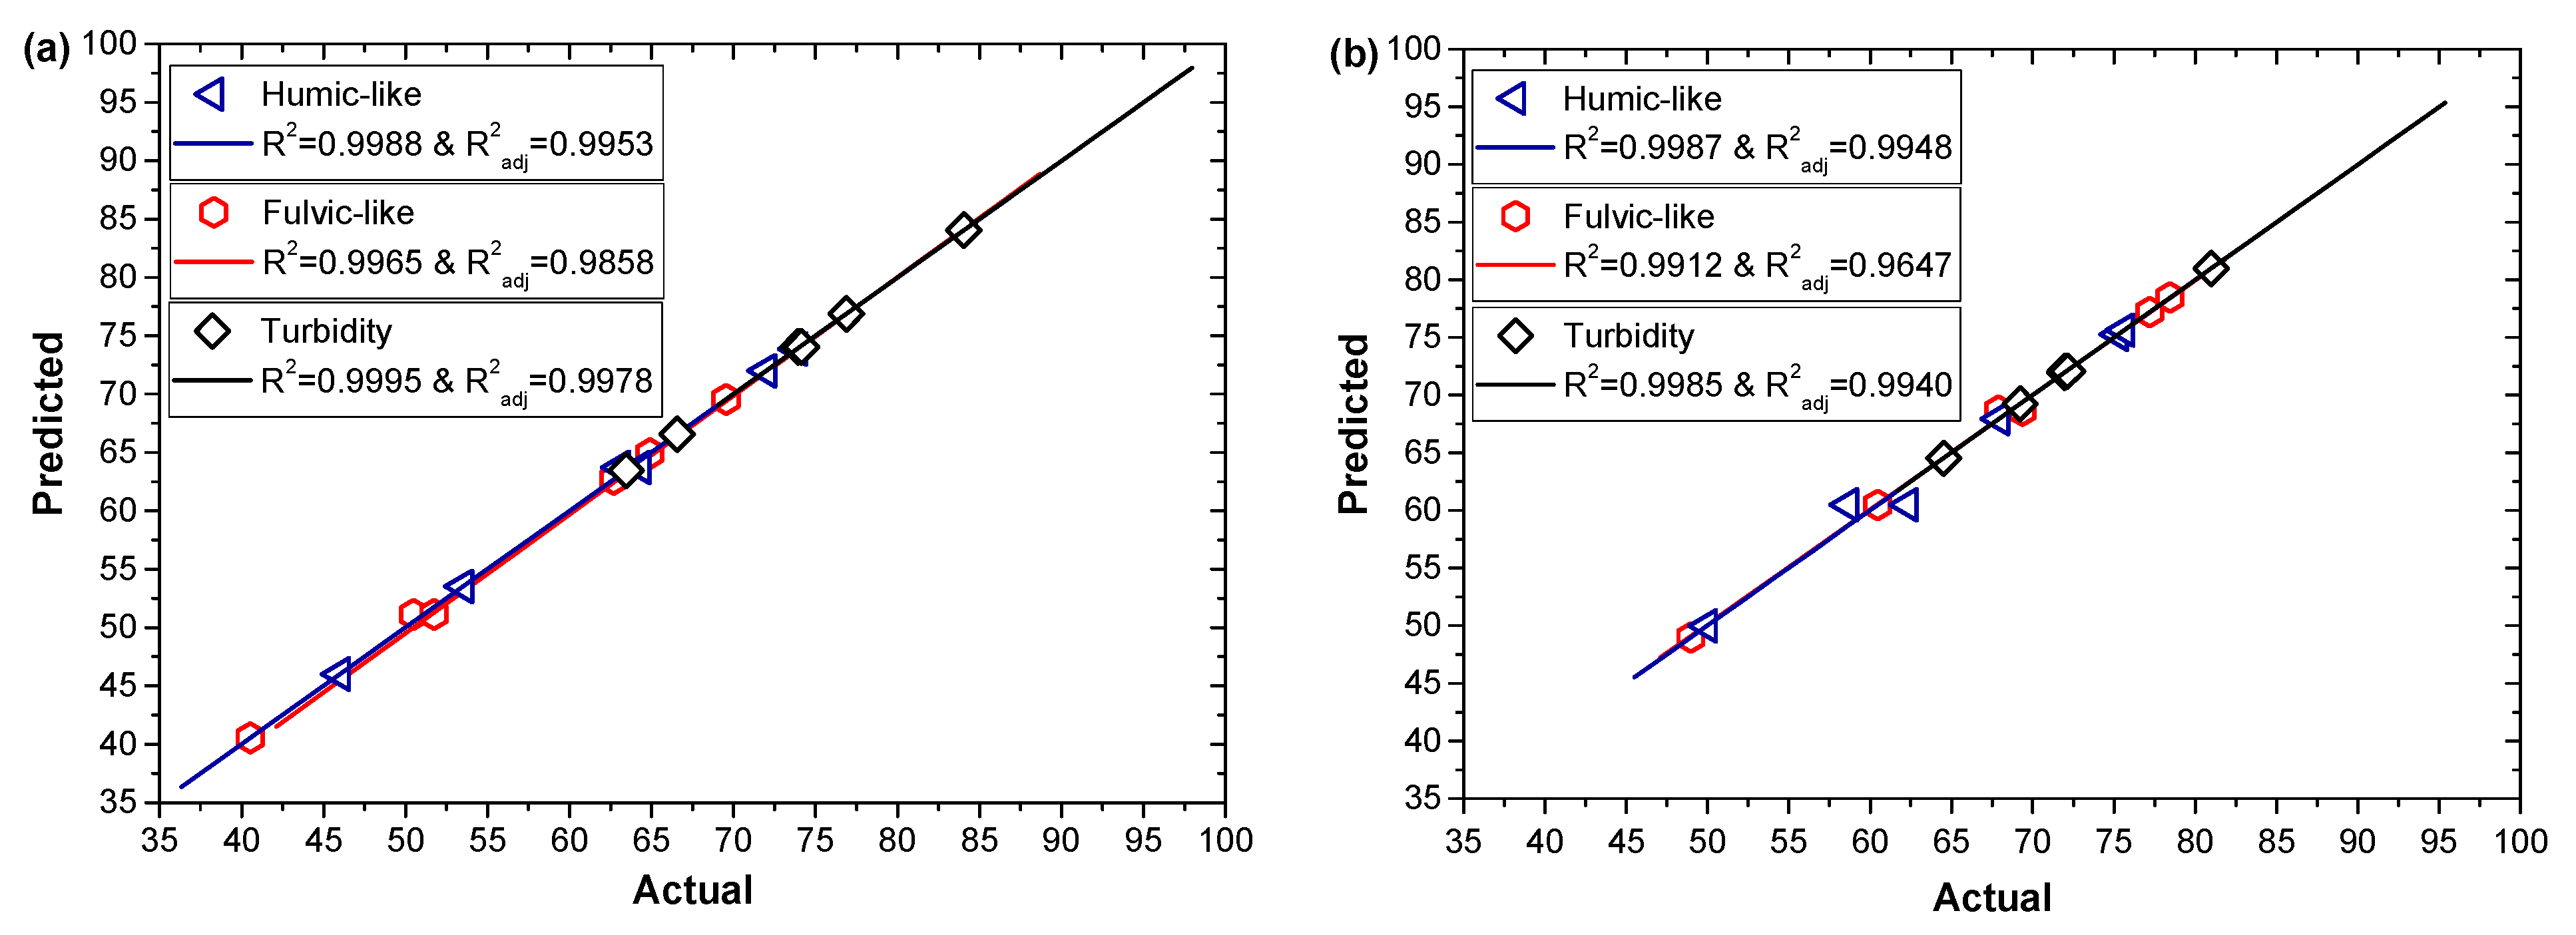
3.2. Model Fitting and Statistical Analyses

Table 3 summarizes the experimental results of the 2 k full factorial design obtained for the removal of turbidity, humic, and fulvic acid-like species at the different coded levels. Similar results were observed for the duplicate of the central point at pH 7 and coagulant dose of 25 mg L−1 with less than 2% error (runs 3 and 6), which corroborates that the pure error of coagulation experiments is negligible. The data for the experimental matrix were then modeled and statistically validated.
Analysis of variance (ANOVA) was utilized to determine the statistical significance of the factors and their corresponding goodness of fit. Table 4 presents the values for the regression coefficients (RC), sum of squares (SS), standard error (SE), F-value (F), and p-value (p). The p-value is the probability value that determines the significance of the effect of each factor in the model [36]. Fisher’s test was used to determine the significance of the variables where the degree of significance was ranked based on the value of the F-ratio—the larger the value of F, the smaller the value of “Prob > F”. This translates to the greater significance of the corresponding model and the individual coefficient [36]. The confidence level used to determine the statistical significance of the factors is 95%, which means that the p-value should be less than or equal to 0.05 for the effect to be statistically significant [37]. Upon elimination of the insignificant terms, the final empirical models based on statistical analyses were defined.
The response surface equation defined for the use of FeCl3 as coagulant for each response is defined by Equations (2)–(4):
Humic acids removal (%) = 9.42 + 6.70B + 7.80AB
Fulvic acids removal (%) = 61.35 + 2.34AB
Turbidity removal (%) = 72.73 + 7.73B
Meanwhile, identical modelling approaches were employed to define the model equation for the coagulation treatment using PACl. Equations (5)–(7) describe the response surfaces for the removal of humic-like species, fulvic-like species, and turbidity.
Humic acids removal (%) = 66.27 + 8.25AB
Fulvic acids removal (%) = 67.20 + 4.58A + 4.40B + 8.25AB
Turbidity removal (%) = 71.67 + 4.79A + 1.08B + 3.43AB
It can be seen in Table 5 that the values of adj- R2 are greater than 0.98, which indicates that the variability of new data is expected to be about 98%. At 95% confidence level, the coefficients of determination (R2) for all responses obtained from coagulants FeCl3 and PACl were more than 0.99. The value of R2 is a measure of the proportion of total variability by the model, where values close to 1 and at least 0.80 mean that the model is a good fit [38]. This implies that the generated model was sufficient in closely estimating the experimental HLS, FLS, and Turbidity removal efficiency [39]. Previous studies suggested the use of adj-R2, a statistic that is adjusted for the size of the model, i.e., the number of factors, to evaluate the adequacy of the model in order to prevent the potential problem wherein the value of R2 tends to increase as factors are added to the model [36]. Adequate precision, included in Table 5, pertains to the signal to noise ratio and typically has a value greater than 4, which implies that the signal is desirable. On the other hand, the coefficient of variation (CV) is the standard deviation calculated as a percentage of the mean, with values no greater than 10% [36]. It was observed that all statistical results presented in Table 5 demonstrate the good adequacy of the estimated model to fit all the responses. This was also further revealed by the predicted–observed plots in Figure 2, which enables inferring the fair agreement of predicted responses to the experimental data for both coagulants, FeCl3 and PACl.

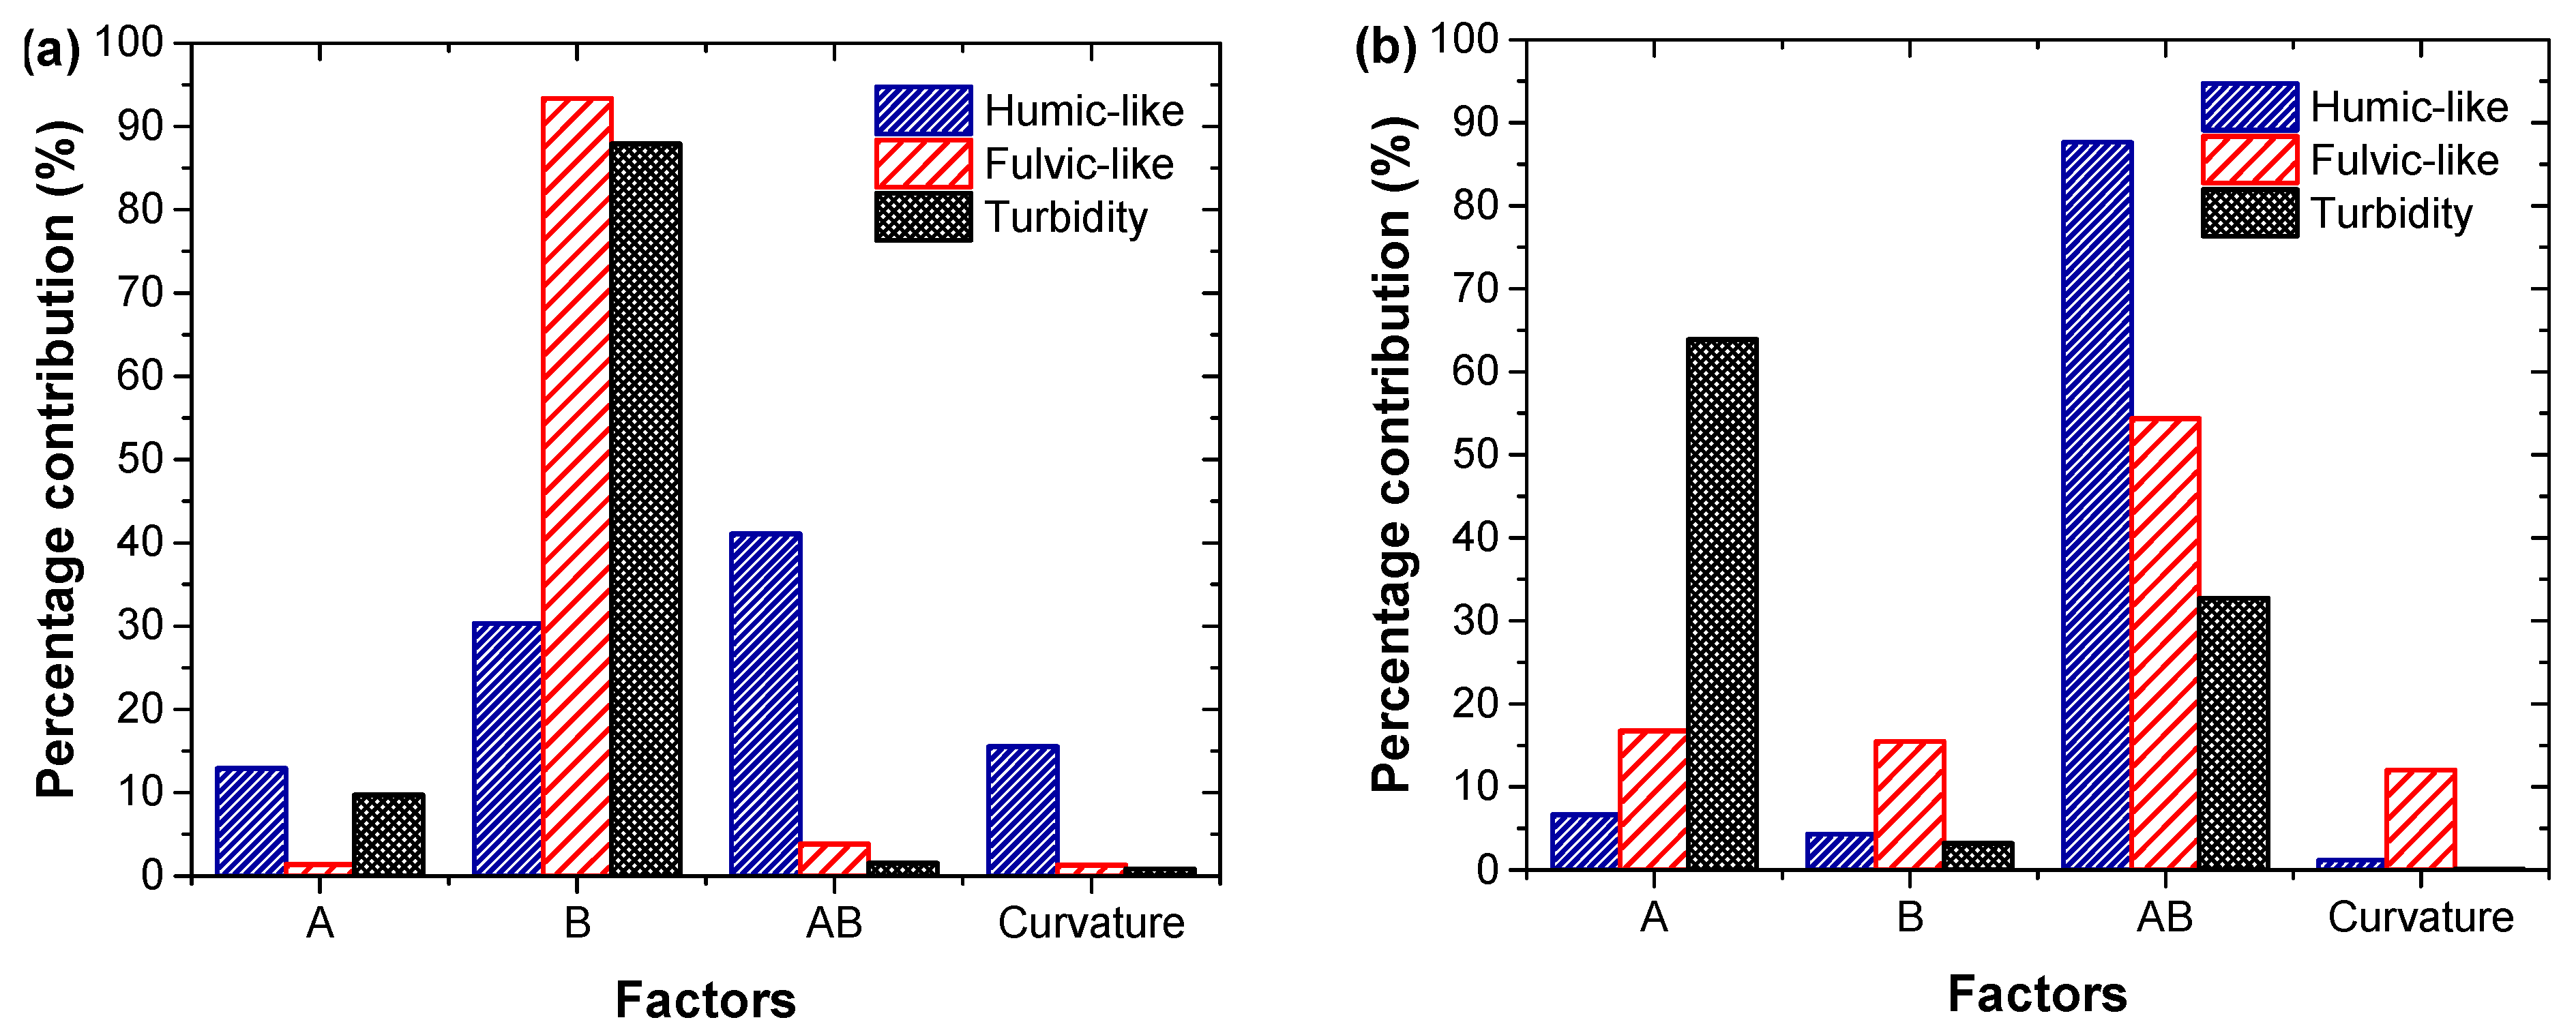
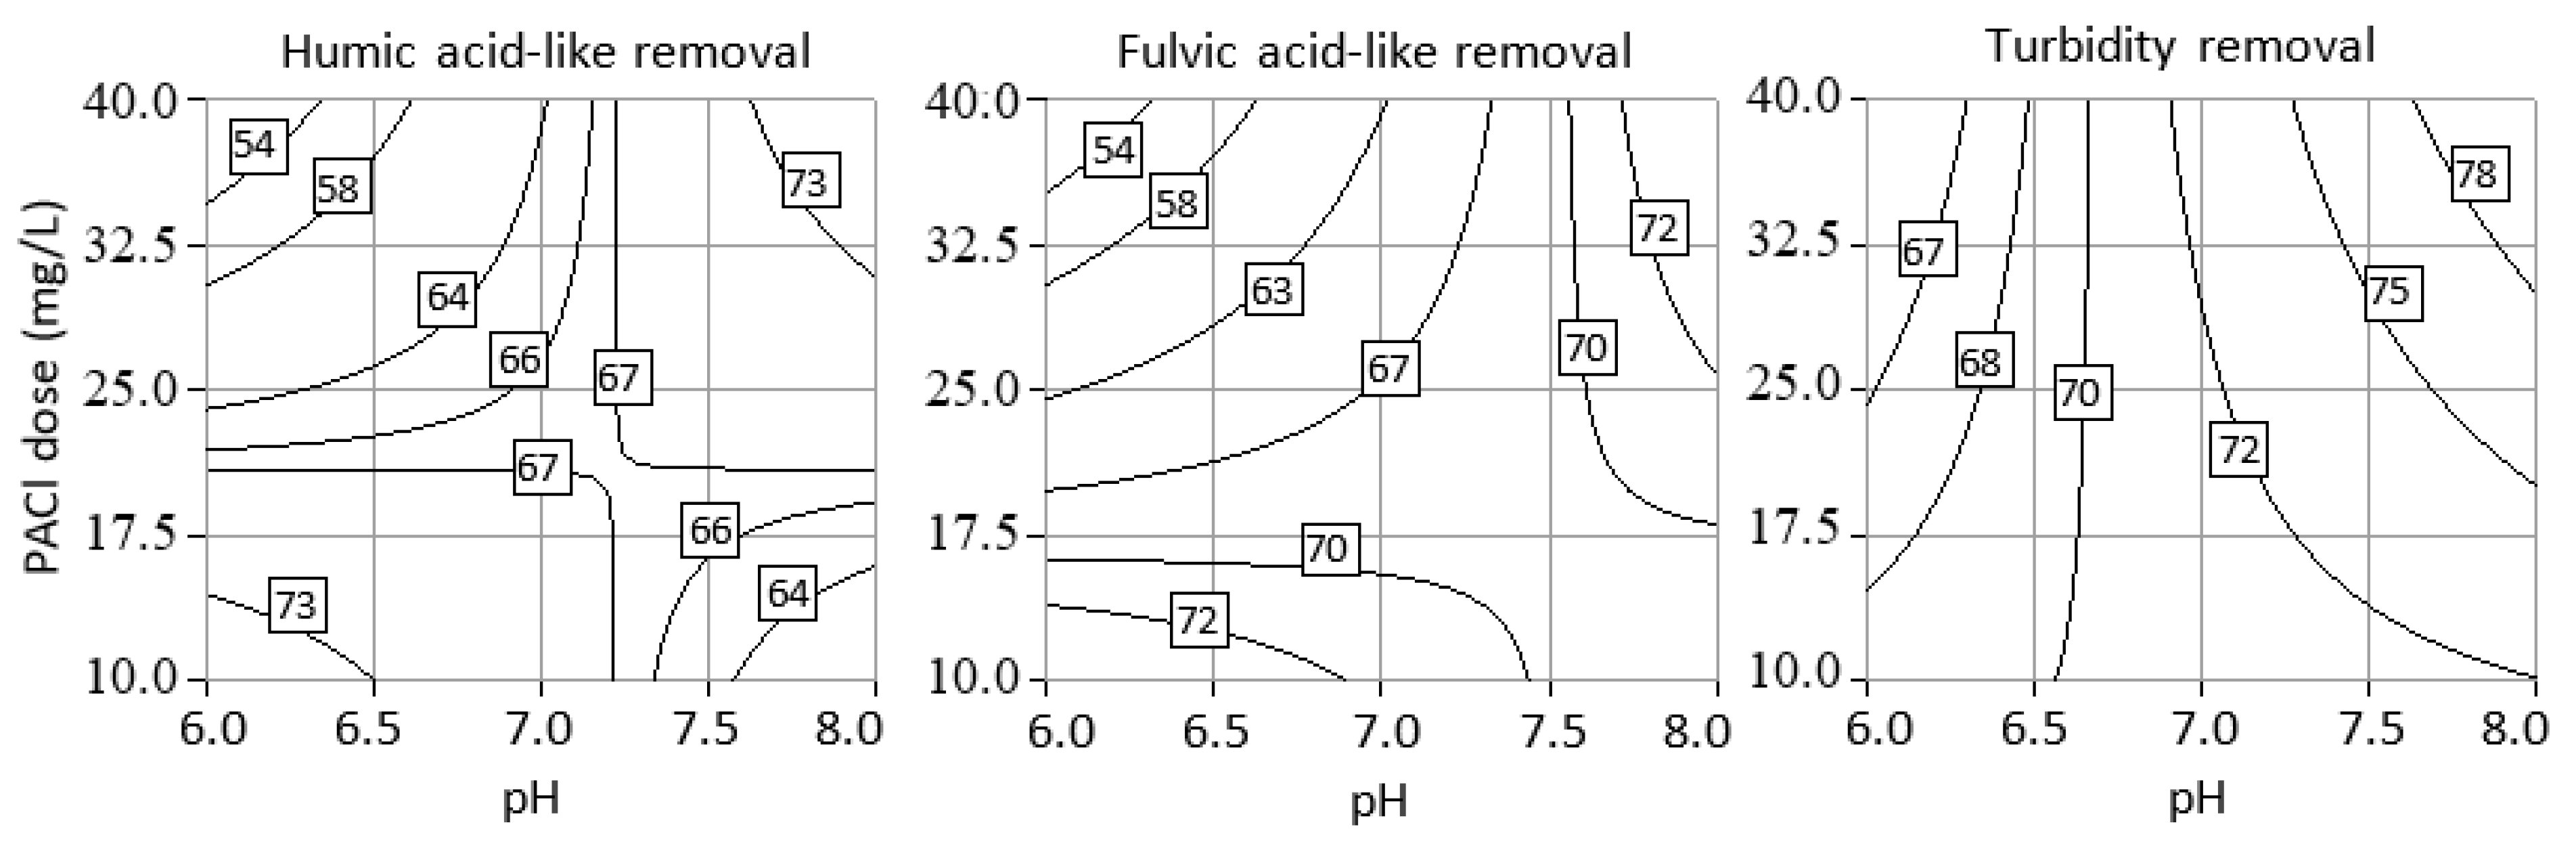
3.3. Effect of Initial pH, Coagulant Dosage, and Their Interaction

Figure 3 illustrates the percentage of contribution of each term defined by Equations (2)–(7) on the NOM removal performance using different coagulants (i.e., FeCl3 or PACl). Note that the results refer to the effects of initial water pH (A) and coagulant dosage (B) on the coagulation process.
Figure 4 and Figure 5 show the contour plots of the main factors, initial water pH and coagulant dosage, and interaction effects on the NOM removal percentage after using FeCl3 and PACl coagulants, respectively. As shown in Figure 3a, high percentage contributions of coagulant dosage were obtained for FLS and turbidity removals (93.36% and 87.90%, respectively) when FeCl3 was used as the coagulant. This trend is attributed to the initial pH being set at near neutral levels, where charge neutralization occurs. This implies that, for all pH values considered, all runs were expected to yield high removal efficiencies. It was observed in Figure 4 that the removal efficiency improved as the coagulant dosage was increased. This is attributed to the increase in the amount of FeCl3 that hydrolyzed to positive ferric species and subsequently interacted with the negatively charged NOM fractions to form larger complexes [2]. NOM fraction removal efficiency was reported to be constant at a coagulant dosage greater than 40 mg L−1 [25]. At a high coagulant dosage, FeCl3 could not effectively remove NOM because only a portion of Fe could interact with NOM to form Fe–NOM complexes. Meanwhile, the excess of iron dosed will form negatively charged Fe(OH)3 flocs and Fe(OH)4 instead of desired Fe-NOM complex [40].
On the other hand, when using PACl, the NOM removal was mainly due to the interaction of initial pH and coagulant dosage (AB) as deduced from Figure 2b. Note that Figure 5 also shows high interaction effects on the parameters considered when PACl coagulant was used. It is evident in the contour plots that pH affected the removal efficiencies. The highest removal percentages were recorded at 40 mg L−1 coagulant dosage and an initial pH of 8, with values of 76% and 81% for fulvic acids and turbidity, respectively. It can be noted that the removal of fulvic at pH 6 and 8 are almost the same, which may be due to the solubility of fulvic acids in both alkali and acidic regions, while humic acids are only soluble in the alkali region [41]. High PACl dosage is not effective in removing turbidity and NOM fractions because only a portion of Al reacts with NOM fraction to form an Al–NOM fraction complex. This is due to the formation of polymer bridges between particles that caused the destabilization of Al-NOM complex, resulting in the repulsion between particles at excessive dosage [42].
Analysis of turbidity evolution shows interesting trends in the function of coagulant species employed and operational conditions of coagulation treatment, as can be seen in Figure 6. The turbidity spiked up upon addition of FeCl3 coagulant and 1 min rapid mixing, gradually reduced during the flocculation process of 30 min slow mixing, and dropped to near zero at the end of the 30 min sedimentation. Increase in turbidity can be explained by the formation of iron hydroxide flocs after coagulant addition, which removes suspended solids during its settlement [43,44]. Analysis of zeta potential changes during treatment shows a gradual change from initial negative values of −17.09 ± 1.03 to zero. These results that show a gradual increase in zeta potential towards zero can be attributed to charge neutralization.
Interestingly, a spike in zeta-potential at high doses of FeCl3 of 40 mg L−1 can be observed, which can be explained by the positive zeta potential of iron hydroxide flocs [40]. The iron coagulation process is controlled by charge neutralization mechanism, which is said to occur at pH 6 and >7 where NOM is most negative [28]. This trend demonstrates the dual role of pH not only on the coagula formation but also on the natural speciation of NOM in function of the pH. NOM is composed by a complex mixture of fulvic and humic acids of different molecular weights and different functional groups that are susceptible to be deprotonated (i.e., carboxylic groups) [19,45,46]. The ratio of the different charged and non-charged species is determined by the respective pKa value of each organic acid. A higher density of negatively charged species will require higher doses to induce removal mechanisms ruled by charge destabilization and adsorption/complexation. The addition of positive coagulant disrupts the negatively charged NOM fractions and produces coagulant-NOM flocs [19,46], which also assists in the removal of solids from the suspension. The removal is therefore dependent not only on the formation of metal hydroxides as coagulants but also on the charge distribution of organic species in as a function of pH. Identical mechanisms are associated for PACl coagulant agent [47,48]. Generally, charge neutralization occurs at around neutral pH when aluminum salts are used. At neutral pH, the cationic hydrolysis products are only a small portion of the total soluble Al, while aluminate ions are the dominant form. Colloidal hydroxide particles are suggested to be effective charge-neutralizing species and may be positively charged up to pH 8, which explains the high removal up to pH 8 [29]. At neutral pH, coagulants are said to be prone to further hydrolysis and polymerization into medium polymer species. A quick comparison between turbidity abatement can be conducted between the results described in Figure 6a,b. Note that independent of experimental conditions, FeCl3 outperforms PACl in turbidity reduction. However, PACl presents better performance on the abatement of NOM (i.e., humic and fulvic acid-like species), which highlights the use of PACl as an efficient approach to minimize the risk of disinfection by-products formation through NOM oxidation during disinfection steps. Therefore, these results encourage the use of PACl to remove NOM from raw waters.

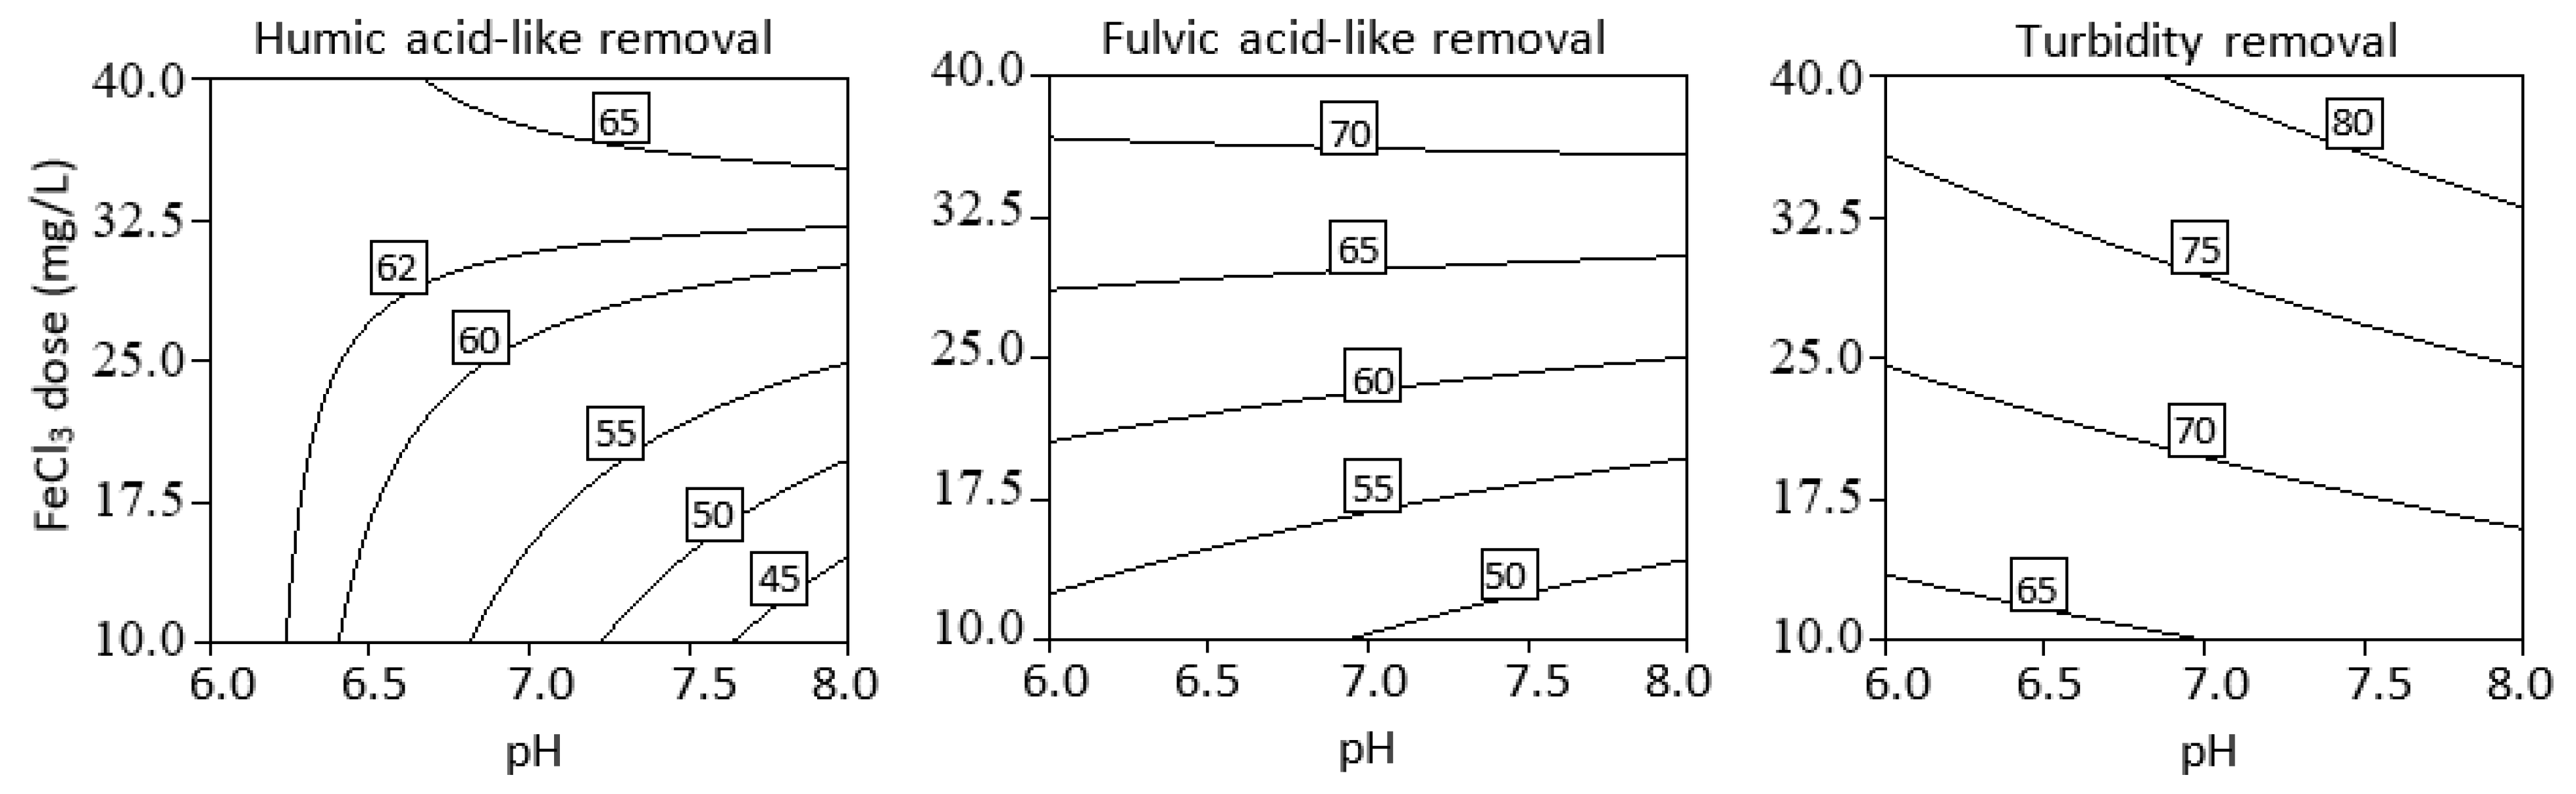
3.4. Optimization of Process Parameters

In order to improve the coagulation process, optimization of parameters was defined from the contour surfaces. The desirability function method was used to determine the most desirable condition in the responses [28]. This method can combine multiple responses to generate a response called desirability function. Desirability function ranges from 0 to 1, with the desired value closest to 1 [36].
The initial pH and coagulant dosage were set within a range, whereas the removal responses were set to maximum levels. Figure 7 shows the desirability plot for all the responses, with an overall desirability of 1 at an initial pH of 8 and a coagulant dosage of 40 mg L−1. Optimized experiments allowed for attaining a maximum removal of 69.6% of humic acids, 73.9% of fulvic acids, and 84.0% of turbidity when using FeCl3 as the coagulant. On the other hand, for PACl slightly higher removals of NOM, with percentage removals of 78.5% for humic acids, and 75.6% for fulvic acids, and lower turbidity reduction of 80.9% were attained. These results suggest superior performance of PACl as the coagulant to trap and precipitate NOM during coagulation treatment.

4. Conclusions

Factorial design was used to evaluate FeCl3 and PACl coagulants in removing NOM fractions from raw surface water by chemical coagulation. Humic and fulvic acid-like species were successfully characterized by an excitation-emission fluorescence matrix (EEM), both qualitatively and quantitatively. The effects of coagulant dosage and initial pH were also determined. The FeCl3 coagulant dosage had the highest contribution to NOM and turbidity removal. This was explained by the hydrolyzation of FeCl3 to positive ferric ion and the interaction with the negatively charged NOM fractions at a pH range between 6 and 8. For PACl, initial pH had the highest contribution on the removal of turbidity, while coagulant dosage and initial pH had the highest contribution for HLS and FLS treatment. This trend correlation was attributed to the solubility of humic-acid like species in alkaline media and the solubility of fulvic acid-like species at acidic and alkali conditions. The optimum operational condition was determined to be at an initial pH of 8.0 and coagulant dosage of 40 mg L−1. The optimum removals when FeCl3 was used were 69.55, 73.87, and 84.05% for humic acids, fulvic acids, and turbidity, respectively. On the other hand, optimum removals of 78.46, 75.63, and 80.98% for HLS, FLS, and turbidity, respectively, were obtained for PACl. These results identify PACl as the desired coagulant species to minimize NOM content in raw water prior to disinfection treatments.

Author Contributions

Conceptualization: M.D.G.d.L., C.-C.K., S.G.-S.; methodology: C.-C.K., M.D.G.d.L., R.J.C.G.; investigation: R.J.C.G., H.-L.Y., D.C.O.; validation: H.-L.Y., S.G.-S., D.C.O.; formal analysis: M.D.G.d.L., S.G.-S., C.-C.K.; resources: C.-C.K., M.D.G.d.L.; data curation: R.J.C.G., H.-L.Y., D.C.O.; writing original draft: M.D.G.d.L., R.J.C.G., S.G.-S.; writing—review and editing: S.G.-S., M.D.G.d.L.; visualization: H.-L.Y., R.J.C.G., D.C.O., S.G.-S.; supervision: C.-C.K., M.D.G.d.L.; project administration: C.-C.K.; funding: C.-C.K., M.D.G.d.L. All authors have read and agreed to the published version of the manuscript.

Funding

The authors are grateful to the financial support from the Ministry of Science and Technology, Taiwan under Contract Number MOST-102-2221-E-041-005 and the Department of Science and Technology, Philippines.

Institutional Review Board Statement

Ethical review and approval were waived for this study since is not applicable (study not involving humans or animals).

Informed Consent Statement

Not applicable.

Data Availability Statement

Data is contained within the article.

Conflicts of Interest

The authors declare no conflict of interest.

References

  1. Chen, J.; LeBoeuf, E.J.; Dai, S.; Gu, B. Fluorescence spectroscopic studies of natural organic matter fractions. Chemosphere 2003, 50, 639–647. [Google Scholar] [CrossRef]
  2. Kan, C.C.; Genuino, D.A.D.; Rivera, K.K.P.; de Luna, M.D.G. Ultrasonic cleaning of polytetrafluoroethylene membrane fouled by natural organic matter. J. Memb. Sci. 2016, 497, 450–457. [Google Scholar] [CrossRef]
  3. Wongcharee, S.; Aravinthan, V.; Erdei, L. Removal of natural organic matter and ammonia from dam water by enhanced coagulation combined with adsorption on powdered composite nano-adsorbent. Environ. Technol. Innov. 2020, 17, 100557. [Google Scholar] [CrossRef]
  4. Westerhoff, P.; Chao, P.; Mash, H. Reactivity of natural organic matter with aqueous chlorine and bromine. Water Res. 2004, 38, 1502–1513. [Google Scholar] [CrossRef] [PubMed]
  5. Garcia-Segura, S.; Mostafa, E.; Baltruschat, H. Electrogeneration of inorganic chloramines on boron-doped diamond anodes during electrochemical oxidation of ammonium chloride, urea and synthetic urine matrix. Water Res. 2019, 160, 107–117. [Google Scholar] [CrossRef]
  6. Yan, M.; Wang, D.; Ni, J.; Qu, J.; Ni, W.; Van Leeuwen, J. Natural organic matter (NOM) removal in a typical North-China water plant by enhanced coagulation: Targets and techniques. Sep. Purif. Technol. 2009, 68, 320–327. [Google Scholar] [CrossRef]
  7. Ensano, B.M.B.; Borea, L.; Naddeo, V.; Belgiorno, V.; de Luna, M.D.G.; Ballesteros, F.C. Removal of pharmaceuticals from wastewater by intermittent electrocoagulation. Water 2017, 9, 85. [Google Scholar] [CrossRef] [Green Version]
  8. Truong, H.B.; Huy, B.T.; Ray, S.K.; Lee, Y.I.; Cho, J.; Hur, J. H2O2-assisted photocatalysis for removal of natural organic matter using nanosheet C3N4-WO3 composite under visible light and the hybrid system with ultrafiltration. Chem. Eng. J. 2020, 399, 125733. [Google Scholar] [CrossRef]
  9. Garcia-Segura, S.; Ocon, J.D.; Chong, M.N. Electrochemical oxidation remediation of real wastewater effluents—A review. Process. Saf. Environ. Prot. 2018, 113, 48–67. [Google Scholar] [CrossRef]
  10. Murray, C.A.; Parsons, S.A. Removal of NOM from drinking water: Fenton’s and photo-Fenton’s processes. Chemosphere 2004, 54, 1017–1023. [Google Scholar] [CrossRef] [PubMed]
  11. Bhatnagar, A.; Sillanpää, M. Removal of natural organic matter (NOM) and its constituents from water by adsorption—A review. Chemosphere 2017, 166, 497–510. [Google Scholar] [CrossRef] [PubMed]
  12. Levchuk, I.; Rueda Márquez, J.J.; Sillanpää, M. Removal of natural organic matter (NOM) from water by ion exchange—A review. Chemosphere 2018, 192, 90–104. [Google Scholar] [CrossRef] [PubMed]
  13. Dayarathne, H.N.P.; Angove, M.J.; Aryal, R.; Abuel-Naga, H.; Mainali, B. Removal of natural organic matter from source water: Review on coagulants, dual coagulation, alternative coagulants, and mechanisms. J. Water Process. Eng. 2020. [Google Scholar] [CrossRef]
  14. Volk, C.; Bell, K.; Ibrahim, E.; Verges, D.; Amy, G.; Lechevallier, M. Impact of enhanced and optimized coagulation on removal of organic matter and its biodegradable fraction in drinking water. Water Res. 2000, 34, 3247–3257. [Google Scholar] [CrossRef]
  15. Garcia-Segura, S.; Eiband, M.M.S.G.; de Melo, J.V.; Martínez-Huitle, C.A. Electrocoagulation and advanced electrocoagulation processes: A general review about the fundamentals, emerging applications and its association with other technologies. J. Electroanal. Chem. 2017, 801, 267–299. [Google Scholar] [CrossRef] [Green Version]
  16. Bruno, P.; Campo, R.; Giustra, M.G.; De Marchis, M.; Di Bella, G. Bench scale continuous coagulation-flocculation of saline industrial wastewater contaminated by hydrocarbons. J. Water Process. Eng. 2020, 34, 101156. [Google Scholar] [CrossRef]
  17. Ge, J.; Guha, B.; Lippincott, L.; Cach, S.; Wei, J.; Su, T.L.; Meng, X. Challenges of arsenic removal from municipal wastewater by coagulation with ferric chloride and alum. Sci. Total Environ. 2020, 725, 138351. [Google Scholar] [CrossRef]
  18. Zhu, G.; Bian, Y.; Hursthouse, A.S.; Xu, S.; Xiong, N.; Wan, P. The role of magnetic MOFs nanoparticles in enhanced iron coagulation of aquatic dissolved organic matter. Chemosphere 2020, 247, 125921. [Google Scholar] [CrossRef]
  19. Matilainen, A.; Vepsäläinen, M.; Sillanpää, M. Natural organic matter removal by coagulation during drinking water treatment: A review. Adv. Colloid Interface Sci. 2010, 159, 189–197. [Google Scholar] [CrossRef]
  20. Chen, F.; Liu, W.; Pan, Z.; Wang, Y.; Guo, X.; Sun, S.; Jia, R. Characteristics and mechanism of chitosan in flocculation for water coagulation in the Yellow River diversion reservoir. J. Water Process. Eng. 2020, 34, 101191. [Google Scholar] [CrossRef]
  21. Shi, B.; Wei, Q.; Wang, D.; Zhu, Z.; Tang, H. Coagulation of humic acid: The performance of preformed and non-preformed Al species. Colloids Surf. A Physicochem. Eng. Asp. 2007, 296, 141–148. [Google Scholar] [CrossRef]
  22. Ng, M.; Liu, S.; Chow, C.W.K.; Drikas, M.; Amal, R.; Lim, M. Understanding effects of water characteristics on natural organic matter treatability by PACl and a novel PACl-chitosan coagulants. J. Hazard. Mater. 2013, 263, 718–725. [Google Scholar] [CrossRef] [PubMed]
  23. de Luna, M.D.G.; Warmadewanthi; Liu, J.C. Combined treatment of polishing wastewater and fluoride-containing wastewater from a semiconductor manufacturer. Colloids Surf. A Physicochem. Eng. Asp. 2009, 347, 64–68. [Google Scholar] [CrossRef]
  24. Setareh, P.; Khezri, S.M.; Hossaini, H.; Pirsaheb, M. Coupling effect of ozone/ultrasound with coagulation for improving NOM and turbidity removal from surface water. J. Water Process. Eng. 2020, 37, 101340. [Google Scholar] [CrossRef]
  25. Joseph, L.; Flora, J.R.V.; Park, Y.G.; Badawy, M.; Saleh, H.; Yoon, Y. Removal of natural organic matter from potential drinking water sources by combined coagulation and adsorption using carbon nanomaterials. Sep. Purif. Technol. 2012, 95, 64–72. [Google Scholar] [CrossRef]
  26. Van Dyke, N.; Yenugadhati, N.; Birkett, N.J.; Lindsay, J.; Turner, M.C.; Willhite, C.C.; Krewski, D. Association between aluminum in drinking water and incident Alzheimer’s disease in the Canadian Study of Health and Aging cohort. Neurotoxicology 2020. [Google Scholar] [CrossRef]
  27. De Luna, M.D.G.; Sablas, M.M.; Hung, C.M.; Chen, C.W.; Garcia-Segura, S.; Dong, C. Di Modeling and optimization of imidacloprid degradation by catalytic percarbonate oxidation using artificial neural network and Box-Behnken experimental design. Chemosphere 2020, 251, 126254. [Google Scholar] [CrossRef]
  28. Arenas, L.T.; Lima, E.C.; dos Santos, A.A.; Vaghetti, J.C.P.; Costa, T.M.H.; Benvenutti, E.V. Use of statistical design of experiments to evaluate the sorption capacity of 1,4-diazoniabicycle[2.2.2]octane/silica chloride for Cr(VI) adsorption. Colloids Surf. A Physicochem. Eng. Asp. 2007, 297, 240–248. [Google Scholar] [CrossRef]
  29. Seki, Y.; Seyhan, S.; Yurdakoc, M. Removal of boron from aqueous solution by adsorption on Al2O3based materials using full factorial design. J. Hazard. Mater. 2006, 138, 60–66. [Google Scholar] [CrossRef]
  30. Gottipati, R.; Mishra, S. Process optimization of adsorption of Cr(VI) on activated carbons prepared from plant precursors by a two-level full factorial design. Chem. Eng. J. 2010, 160, 99–107. [Google Scholar] [CrossRef]
  31. Chen, W.; Westerhoff, P.; Leenher, J.A.; Booksh, K. Fluorescence excitation-emission matrix regional integration to quantify spectra for dissolved organic matter. Environ. Sci. Technol. 2003, 37, 5701–5710. [Google Scholar] [CrossRef] [PubMed]
  32. Valencia, S.; Marín, J.M.; Restrepo, G.; Frimmel, F.H. Application of excitation-emission fluorescence matrices and UV/Vis absorption to monitoring the photocatalytic degradation of commercial humic acid. Sci. Total Environ. 2013, 442, 207–214. [Google Scholar] [CrossRef]
  33. Guo, L.; Lu, M.; Li, Q.; Zhang, J.; Zong, Y.; She, Z. Three-dimensional fluorescence excitation-emission matrix (EEM) spectroscopy with regional integration analysis for assessing waste sludge hydrolysis treated with multi-enzyme and thermophilic bacteria. Bioresour. Technol. 2014, 171, 22–28. [Google Scholar] [CrossRef] [PubMed]
  34. Bieroza, M.; Baker, A.; Bridgeman, J. Relating freshwater organic matter fluorescence to organic carbon removal efficiency in drinking water treatment. Sci. Total Environ. 2009, 407, 1765–1774. [Google Scholar] [CrossRef] [PubMed]
  35. Zhu, G.; Yin, J.; Zhang, P.; Wang, X.; Fan, G.; Hua, B.; Ren, B.; Zheng, H.; Deng, B. DOM removal by flocculation process: Fluorescence excitation-emission matrix spectroscopy (EEMs) characterization. Desalination 2014, 346, 38–45. [Google Scholar] [CrossRef]
  36. Seyed Shahabadi, S.M.; Reyhani, A. Optimization of operating conditions in ultrafiltration process for produced water treatment via the full factorial design methodology. Sep. Purif. Technol. 2014, 132, 50–61. [Google Scholar] [CrossRef]
  37. de Luna, M.D.G.; Murniati; Budianta, W.; Rivera, K.K.P.; Arazo, R.O. Removal of sodium diclofenac from aqueous solution by adsorbents derived from cocoa pod husks. J. Environ. Chem. Eng. 2017, 5, 1465–1474. [Google Scholar] [CrossRef]
  38. Xiangli, F.; Wei, W.; Chen, Y.; Jin, W.; Xu, N. Optimization of preparation conditions for polydimethylsiloxane (PDMS)/ceramic composite pervaporation membranes using response surface methodology. J. Memb. Sci. 2008, 311, 23–33. [Google Scholar] [CrossRef]
  39. Genuino, D.A.D.; de Luna, M.D.G.; Capareda, S.C. Improving the surface properties of municipal solid waste-derived pyrolysis biochar by chemical and thermal activation: Optimization of process parameters and environmental application. Waste Manag. 2018, 72, 255–264. [Google Scholar] [CrossRef]
  40. Zhan, X.; Gao, B.; Yue, Q.; Wang, Y.; Cao, B. Coagulation behavior of polyferric chloride for removing NOM from surface water with low concentration of organic matter and its effect on chlorine decay model. Sep. Purif. Technol. 2010, 75, 61–68. [Google Scholar] [CrossRef]
  41. Rigobello, E.S.; Dantas, A.D.B.; Di Bernardo, L.; Vieira, E.M. Influence of the apparent molecular size of aquatic humic substances on colour removal by coagulation and filtration. Environ. Technol. 2011, 32, 1767–1777. [Google Scholar] [CrossRef] [PubMed]
  42. Zhan, X.; Gao, B.; Yue, Q.; Wang, Y.; Wang, Q. Coagulation efficiency of polyaluminum chloride for natural organic matter removal from low specific UV absorbance surface water and the subsequent effects on chlorine decay. Chem. Eng. J. 2010, 161, 60–67. [Google Scholar] [CrossRef]
  43. Suquet, J.; Godo-Pla, L.; Valentí, M.; Verdaguer, M.; Martin, M.J.; Poch, M.; Monclús, H. Development of an environmental decision support system for enhanced coagulation in drinking water production. Water 2020, 12, 2115. [Google Scholar] [CrossRef]
  44. Keucken, A.; Heinicke, G.; Persson, K.M.; Köhler, S.J. Combined coagulation and ultrafiltration process to counteract increasing NOM in brown surface water. Water 2017, 9, 697. [Google Scholar] [CrossRef] [Green Version]
  45. Serrà, A.; Philippe, L.; Perreault, F.; Garcia-Segura, S. Photocatalytic treatment of natural waters. Reality or hype? The case of cyanotoxins remediation. Water Res. 2021, 188, 116543. [Google Scholar] [CrossRef]
  46. Zhang, Y.; Chen, Y.; Westerhoff, P.; Crittenden, J. Impact of natural organic matter and divalent cations on the stability of aqueous nanoparticles. Water Res. 2009, 43, 4249–4257. [Google Scholar] [CrossRef]
  47. Xu, Y.; Chen, T.; Liu, Z.; Zhu, S.; Cui, F.; Shi, W. The impact of recycling alum-humic-floc (AHF) on the removal of natural organic materials (NOM): Behavior of coagulation and adsorption. Chem. Eng. J. 2016, 284, 1049–1057. [Google Scholar] [CrossRef]
  48. Kong, Y.; Ma, Y.; Ding, L.; Ma, J.; Zhang, H.; Chen, Z.; Shen, J. Coagulation behaviors of aluminum salts towards humic acid: Detailed analysis of aluminum speciation and transformation. Sep. Purif. Technol. 2020, 118137. [Google Scholar]
Figure 1. Excitation emission fluorescence matrix (EEM) contour plots of raw water before and after coagulation treatment: (a) natural raw water prior FeCl3 treatment, (b) after FeCl3 treatment, (c) natural raw water prior PACl treatment, (d) after PACl treatment.
Water 13 00146 g001
Figure 2. EEM predicted vs. actual plots of the experiment with coagulant (a) FeCl3 and (b) PACl for each response: (◁) humic acid-like species, (⎔) fulvic acid-like species, and (◇) turbidity.
Water 13 00146 g002
Figure 3. Percent contribution of each equation model term on the overall NOM removal by coagulation using (a) FeCl3 or (b) PACl. Factors: A refers to initial pH, B corresponds to coagulant dose, AB is the term that represents the synergistic interaction between both variables, and curvature of the model.
Water 13 00146 g003
Figure 4. Contour plots showing the percent removal attained during coagulation treatment in function of FeCl3 coagulant dose and pH.
Water 13 00146 g004
Figure 5. Contour plots showing the percent removal attained during coagulation treatment in function of PACl coagulant dose and pH.
Water 13 00146 g005
Figure 6. Turbidity vs. time during coagulation by (a) FeCl3 and (b) PACl, and zeta potential vs. time during coagulation by (c) FeCl3 and (d) PACl.
Water 13 00146 g006aWater 13 00146 g006b
Figure 7. Contour plot for desirability in coagulation using coagulant (a) FeCl3 and (b) PACl.
Water 13 00146 g007
Table 1. Characteristics of raw surface water.
ParameterValue
pH4.8 ± 0.1
Turbidity (NTU)9.5 ± 0.2
Zeta potential (mV)−17.6 ± 0.6
Fulvic acid-like substances: Ex/Em = 200 − 250/380 − 550 (au)2830 ± 60
Humic acid-like substances: Ex/Em = 250 − 400/380 − 550 (au)2260 ± 50
Table 2. Experimental ranges and level of the factors in the factorial design.
VariablesCoded SymbolsCoded Levels
−11
Initial pHA68
Coagulant dose (mg L−1 Al or Fe)B1040
Table 3. Experimental design table for the factors and responses.
Removal%
RunCoded ValuesHLSFLSTurbidity
pHCoagulant Dose (mg L−1)FeCl3PAClFeCl3PaClFeCl3PACl
161064.9077.0253.5175.2763.4569.23
264062.7048.9772.0049.9776.8764.52
372551.7467.9164.3458.6473.9472.12
481040.5460.4746.0067.9466.5671.96
584069.5578.4673.8775.6384.0580.98
672550.4969.3763.0860.1474.1371.98
Table 4. Statistical analysis of the results of the factorial experimentation.
ResponseFactorRCSSSEF-Valuep-Value
FeCl3PAClFeCl3PAClFeCl3PAClFeCl3PAClFeCl3PACl
A−4.383.1976.6540.700.440.5298.1138.190.0640.102
HLSB6.70−2.56179.6826.210.440.52230.0124.690.0420.127
RemovalAB7.8011.56243.52534.070.440.52311.70504.100.0360.028
Curvature 92.027.460.770.89117.787.000.0590.230
A−1.414.587.9584.000.450.5310.0274.660.1950.070
FLSB11.59−4.40537.3177.530.450.53676.8968.910.0250.070
RemovalAB2.348.2522.00272.090.450.5327.71241.850.1200.041
Curvature 7.4661.380.770.929.3972.340.2010.075
A2.574.7926.4791.450.0670.0571466.547183.510.0170.008
TurbidityB7.731.08238.364.650.0670.05713233.08363.490.0050.033
RemovalAB1.023.434.1447.100.0670.057229.433679.750.0420.011
Curvature 2.260.200.120.098125.3215.720.0570.157
Table 5. Statistical validation from analysis of variance for the surface response models.
Responses
StatisticsHLS RemovalFLS RemovalTurbidity Removal
FeCl3PAClFeCl3PAClFeCl3PACl
R20.99880.99870.99650.99120.99950.9985
R2adj0.99530.99480.98580.96470.99780.9940
Adeq. Precision59.0642.3029.1415.36119.0954.21
CV (%)1.151.231.421.640.270.69
Publisher’s Note: MDPI stays neutral with regard to jurisdictional claims in published maps and institutional affiliations.

