Article

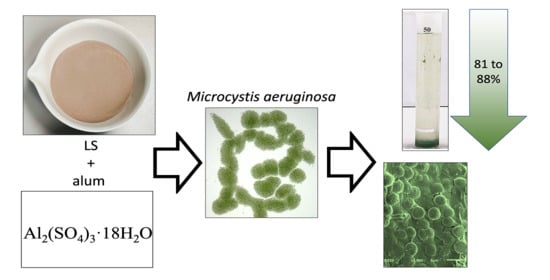
Low Dose Coagulant and Local Soil Ballast Effectively Remove Cyanobacteria (Microcystis) from Tropical Lake Water without Cell Damage

by
Somjate Thongdam
1,
Anthony C. Kuster
1,
Brian J. Huser
2 and
Anootnara T. Kuster
1,*
1
Faculty of Public Health, Khon Kaen University, Khon Kaen 40002, Thailand
2
Department of Aquatic Sciences and Assessment, Swedish University of Agricultural Sciences, 75007 Uppsala, Sweden
*
Author to whom correspondence should be addressed.
Water 2021, 13(2), 111; https://doi.org/10.3390/w13020111
Submission received: 17 December 2020 / Revised: 30 December 2020 / Accepted: 31 December 2020 / Published: 6 January 2021
(This article belongs to the Special Issue Lake Ecology and Restoration)

Abstract

:
The combination of a low dose of coagulant with a ballast, also known as “flock and sink,” has been proposed as a lake restoration and cyanobacteria bloom management strategy. The effectiveness of this technique using aluminum sulfate (alum) as a coagulant and a local soil (LS) from Thailand as a ballast in eutrophic water dominated by positively buoyant Microcystis colonies collected from a tropical lake was investigated by measuring changes in chlorophyll-a (chl-a), pH, and zeta potential. Cell integrity was also evaluated using scanning electron microscopy. Results showed that alum alone could reduce chl-a (up to 60% to 83%) at doses (higher than 3 to 6 mg Al/L) dependent on the initial pH (7.6 to 8.2) and initial chl-a concentration (138 to 615 µg/L) of the lake water but resulted in morphological changes to cellular structure and generally required a dose that reduced pH to <7. LS ballast alone was able to reduce chl-a concentrations (up to 26% at highest dose of 400 mg/L) and caused no significant changes to pH or zeta potential. Combining a low dose of alum (2 mg Al/L) with some amount of LS ballast (50 to 400 mg/L) created an interaction effect that resulted in 81 to 88% reduction in chl-a without changes to zeta potential or morphological changes to cellular structure. Flock and sink may serve a niche role in lake restoration when positively buoyant cyanobacteria are present in the water column during time of treatment. This research showed that an 800% increase in ballast dose resulted in about an 8% reduction in chl-a when combined with 2 mg Al/L of alum. Therefore, it is recommended that ballast dose should be determined by considering its phosphorus sorption capacity and the potentially releasable phosphorus in the lake sediment in order to realize long-term reductions in sediment nutrient release.

Graphical Abstract

1. Introduction

Eutrophication is a global threat to the water quality of inland freshwater lakes [1]. Eutrophication is driven by nutrient loading to lakes and is greatly accelerated by anthropological activities of intensified agriculture and urban development, which result in soil erosion, stormwater runoff, and agricultural runoff [2,3]. Climate change is exacerbating these effects [4,5,6,7]. Cyanobacteria blooms, which are a symptom of enhanced eutrophication, have also proliferated globally [8].
Cyanobacteria blooms have several detrimental effects on the limnological ecosystem, local economy, and human health. Cyanobacteria blooms limit light, which inhibits the growth of macrophytes [9]; they cause anoxia after death and mineralization, which disrupts fisheries and results in fish kills [10]; they decrease property values around the affected lake [11]. Many cyanobacteria species produce intra- and extracellular toxins [12,13], and cyanobacteria blooms or their toxins have been associated with many human health disorders [14,15]. Reduction of phosphorus (P) loading is recognized as a key strategy to long-term mitigation of eutrophication and resulting cyanobacteria blooms [16,17,18,19]. However, delayed response, economic or political infeasibility, or ineffectiveness of external P reduction to improve water quality often necessitates in-lake measures [20,21,22].
Common in-lake measures effective at mitigating cyanobacteria blooms [22] include P inactivation agents [23,24], algicides [25], and dredging [26]. However, the need to minimize cost and reduce health risk from cyanobacteria cell lysis or metals has driven the development of a strategy known as “flock and sink” [10,27,28]. In this strategy, a low dose of coagulant is applied to flocculate positively-buoyant cyanobacteria to the water surface, which is then followed by application of a ballast material to sink the flocculated cyanobacteria [29,30].
Several studies have shown that a low dose of coagulant (typically aluminum sulfate or polyaluminum chloride) followed by a ballast effectively removed cyanobacteria from the water column and resulted in long-term improvements to lake water quality [27,31,32,33]. The ballast can be a P inactivating agent, such as lanthanum modified clay, in which case it is referred to as “flock and lock,” or a natural soil or modified clay, in which case it is referred to as “flock and sink” [34]. The nature of the ballast is of little importance relative to its ability to sink [30]. Thus, readily available ballasts include local soils (LSs). The advantages of a LS is that it is accessible, has low transport and production costs, and likely does not induce cell lysis [35,36]. However, these results should be confirmed, because it has been shown that some compounds may cause cell lysis [29,37] and LSs vary regionally, requiring testing and confirmation before application [34]. Furthermore, the mechanisms involved in flock and sink, such as charge neutralization, bridging, enmeshment, sweeping, and adsorption should be explored and discussed further [34,38,39].
Therefore, the purpose of this study was to provide insight into the mechanisms involved in the “flock and sink” approach to cyanobacterial bloom management and provide guidance on how to use LSs as a ballast for the first time in Thailand. To those ends, the objectives of this study were to determine the removal effectiveness, as measured by changes in chlorophyll-a, of a LS used as a ballast in conjunction with a low dose coagulant and to assess morphological changes to the cyanobacteria cellular walls under various experimental conditions.

2. Materials and Methods

2.1. Study Area and Water Sampling

Beung Nong Khot Lake (16°25′50″ N, 102°47′55″ E) is located in Khon Kaen Province, Thailand. The lake has an area of 1.05 km2 (105 hectares) and an average depth of 4.9 m (maximum 10.5 m). The watershed is approximately 10 km2, primarily consisting of peri-urban and agricultural land within a tropical savanna climate (Köppen climate classification Aw). Rapid urban development has occurred around the lake from 2005 to 2020, resulting in increased nutrient loading and substantial disruption of the natural filtering capacity of the watershed. Resultingly, Beung Nong Khot has regularly experienced cyanobacterial blooms, typically dominated by Microcystis and Cylindrospermopsis genera. Occasional sampling over the two years prior to this investigation indicated the lake is hypereutrophic with total P concentrations generally greater than 0.1 mg/L and chlorophyll-a concentrations generally between 100–800 µg/L.
Our study used cyanobacteria collected from lake water already in colonial form, because laboratory-derived Microcystis can differ morphologically from those found in the field [40]. For use in the experiments, four water samples (30–50 L) were collected during bloom events between May and August 2020, immediately before each experimental round. The littoral zone of Beung Nong Khot Lake was sampled from the shoreline. The lake water samples were collected by grab sampling the top 50 cm of the water column, then placed into polyethylene bottles, transported approximately 4 h in coolers to the laboratory, homogenized, and used immediately in experiments.

2.2. Coagulant and Ballast

As coagulant, we used aluminum sulfate (Al2(SO4)3·18H2O, alum) obtained from a water supply retailer, commonly used by the Provincial Waterworks Authority (PWA) for drinking water treatment. For ballast, a sandy loam LS was obtained from Ubon Ratchatani province (15°7′21″ N, 104°55′29″ E). Prior to the experiments, the LS was washed with deionized water, dried at 110 °C for 48 h, ground, and sieved through 180 mesh (<90 µm).

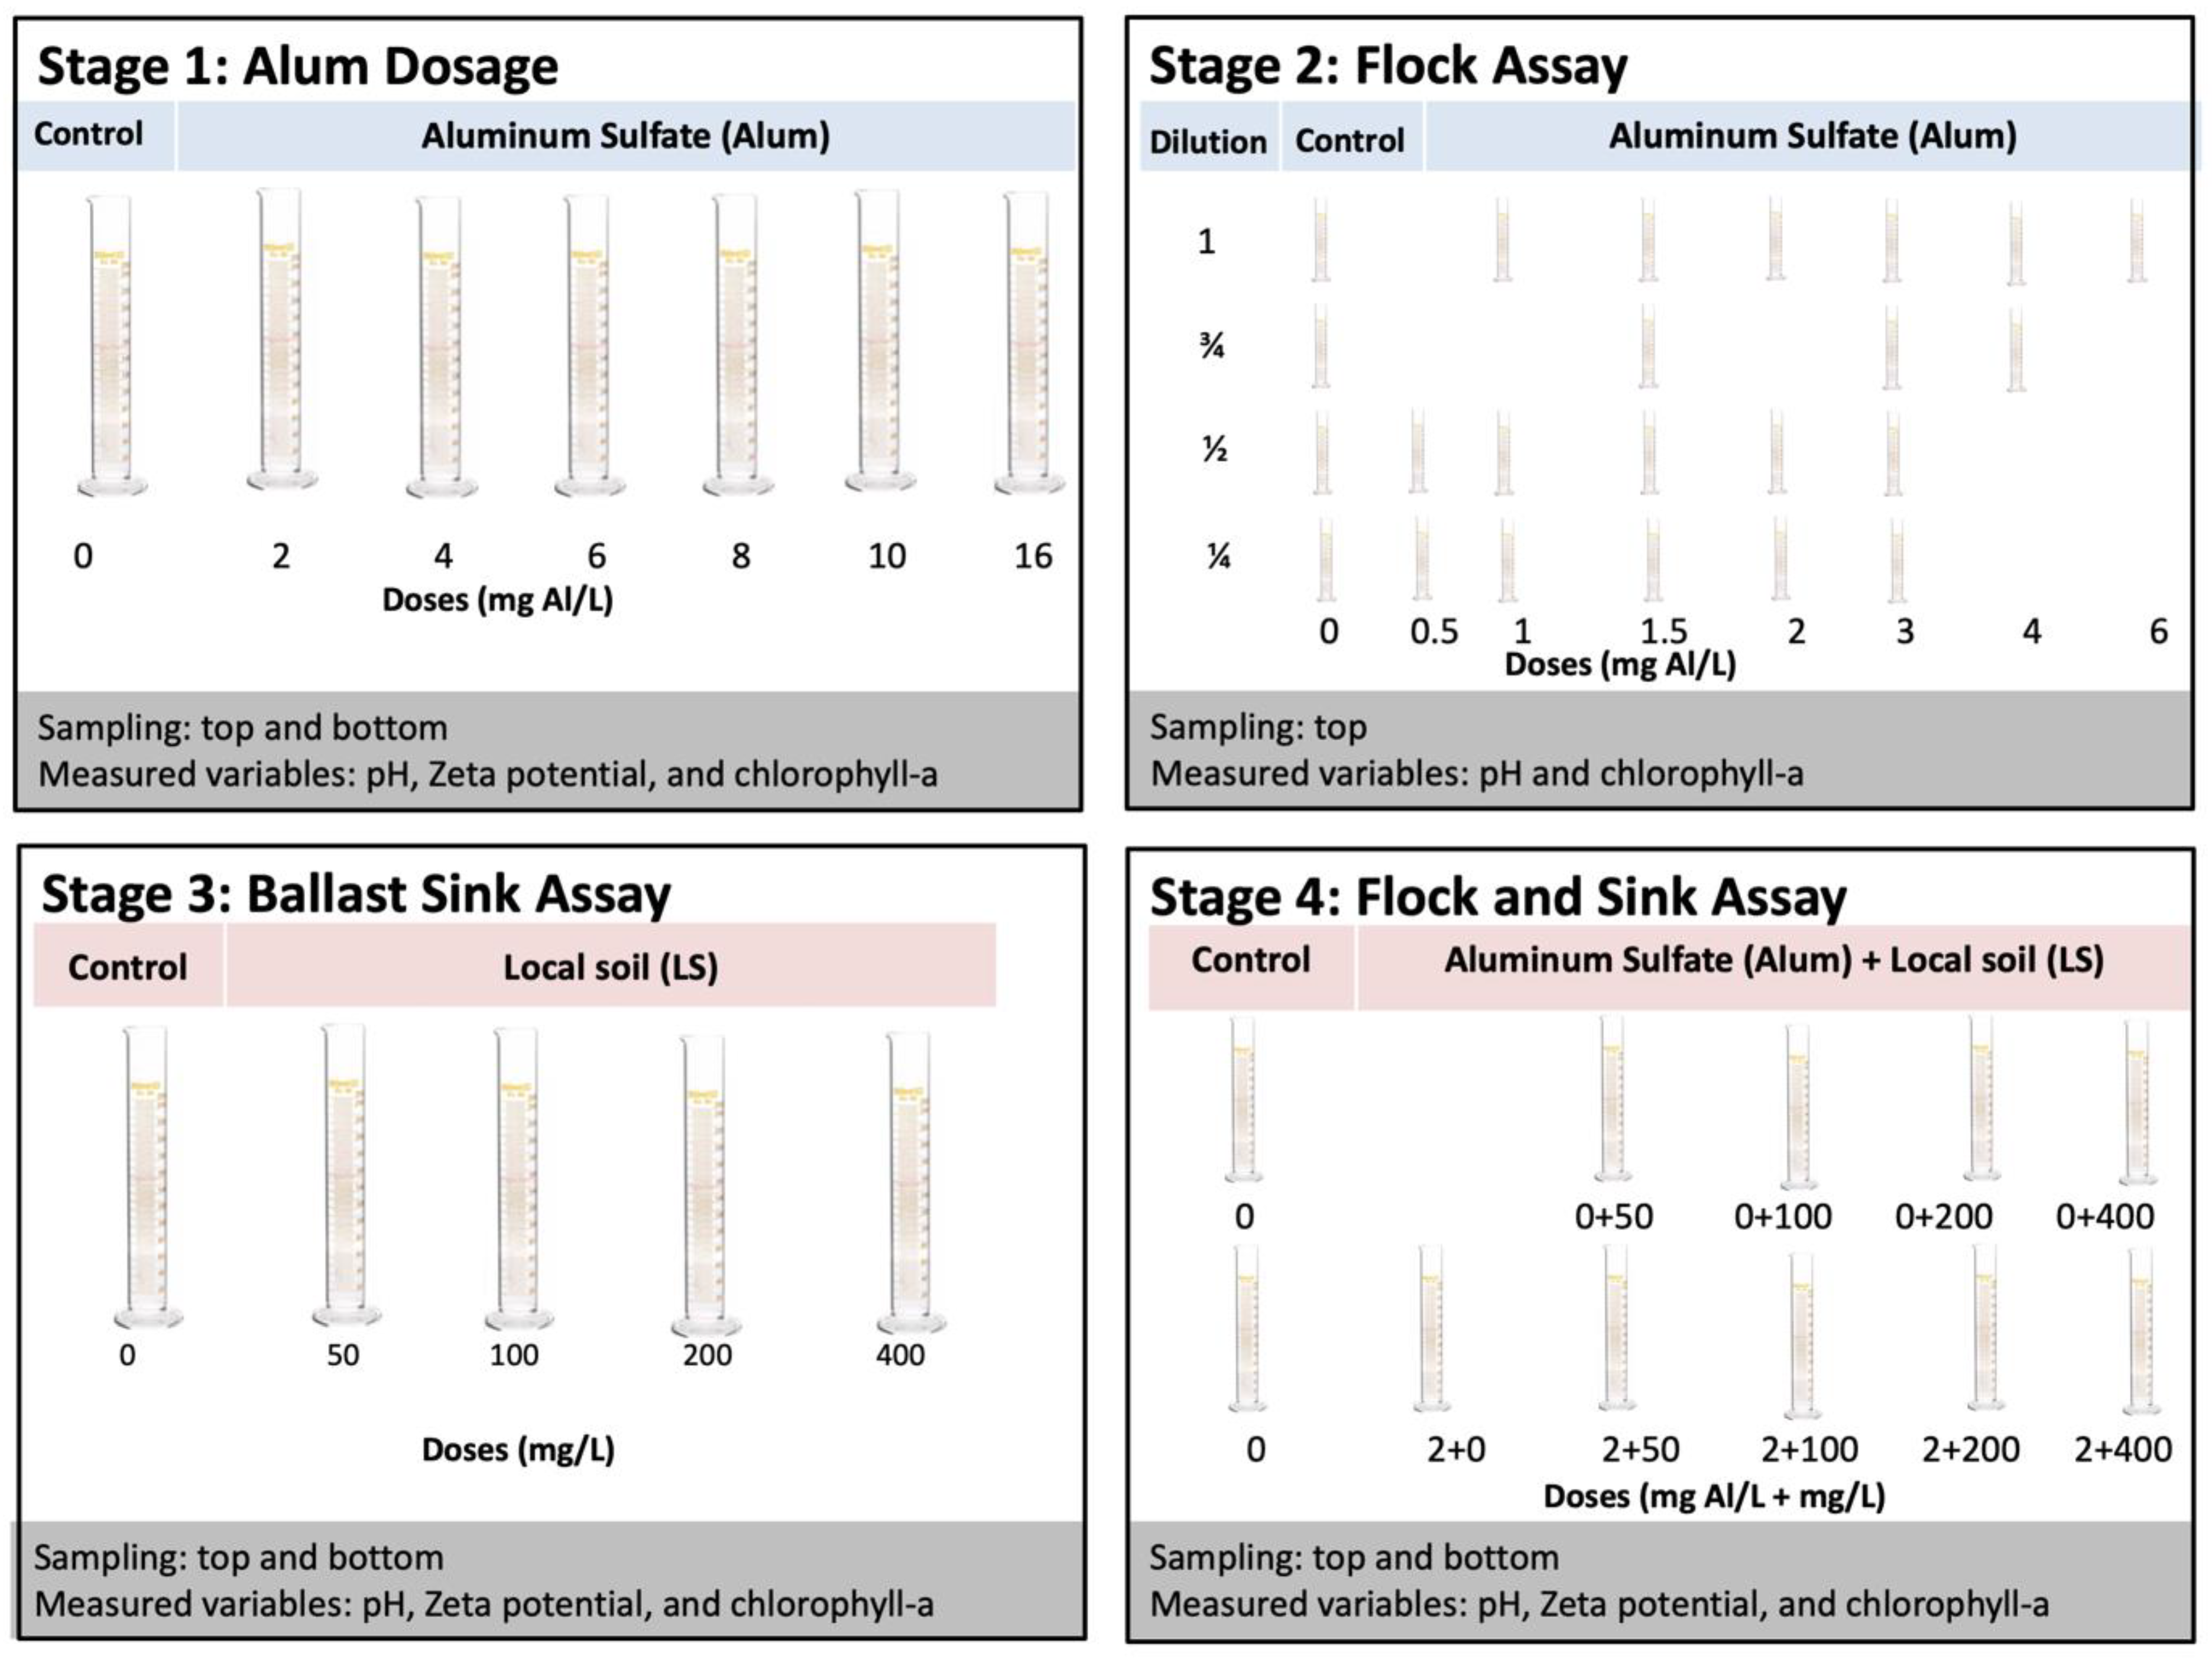
2.3. Experimental Procedures

The experiment consisted of four experimental stages (Figure 1). Stage 1 assessed the effect of coagulant dose on flocculation and cell integrity of cyanobacteria. Stage 2 assessed how the concentration of cyanobacteria biomass modulated this relationship. Stage 3 assessed the effect of ballast dosage on cyanobacteria removal efficiency from the water column, as well as cell integrity. Stage 4 assessed the effect of ballast dosage on cyanobacteria removal following a fixed dosage of coagulant optimized to flocculate the cyanobacteria. All experiments used methods consistent with previous flock and sink studies [28,41].
For stage 1, several alum doses were tested on a single chlorophyll-a concentration. Homogenized aliquots of 250 mL of the lake water were placed into plastic graduated cylinders (31.5 cm height). The coagulant was prepared by dissolving alum pellets in deionized water to obtain a solution of 125 mg Al/L solution. The appropriate volume of coagulant solution was then added to 250 mL aliquots to obtain the desired aluminum (Al) concentrations (0, 2, 4, 6, 8, 10, and 16 mg Al/L). The doses were applied to the suspensions, mixed for 10 seconds using a glass rod, and placed in the laboratory at 25 °C under stagnant conditions. After one hour, water samples (~40 mL) were taken from the top and bottom of the cylinders. Each test was performed in triplicate.
For Stage 2, several low doses of alum were tested on four different chlorophyll-a concentrations. Chlorophyll-a concentration was modulated by dilution with filtered lake water to create dilutions approximating 3/4, 1/2, and 1/4 of the initial concentration, along with the undiluted lake water. Aliquots (250 mL) of each suspension were added to 250 mL plastic graduated cylinders (31.5 cm height). Low doses of the coagulant (0, 0.5, 1, 1.5, 2, 3, 4, and 6 mg Al/L) were then applied to the suspensions, mixed for 10 s using a glass rod, and placed in the laboratory at 25 °C under stagnant conditions. After one hour, water samples (~40 mL) were taken from the top of the cylinders. Each test was performed in duplicate.
For stage 3, we varied the ballast dosage and computed percentage of cyanobacteria removed (measured as chlorophyll-a) from the top of the water column with a fixed initial chlorophyll-a concentration. The different concentrations of ballast (0, 50, 100, 200, and 400 mg/L) were added by making a slurry using the water from the targeted cylinder, adding it back to the surface of the cylinders, and gently mixing with a glass rod [30]. The cylinders remained in the laboratory at 25 °C under stagnant conditions. After one hour, water samples (~40 mL) were taken from the top and bottom of the cylinders. Each test was performed in triplicate.
For stage 4, ballast combined with a low dose of coagulant was tested for its effect on the percentage of cyanobacteria (measured as chlorophyll-a concentration) removed from the top of the water column. A fixed dose of 2 mg Al/L was chosen based on preliminary jar tests with the experimental lake water. The different concentrations of ballast (0, 50, 100, 200, and 400 mg/L) were added to the water surface in the tubes and gently mixing with a glass rod. An untreated control, an Al-only control, and ballast-only controls were also tested in order to isolate contributions of each factor to the combined effect. In combination treatments, alum was added immediately after addition of the ballasts and the tubes were mixed using a glass rod [30]. Following treatment, the cylinders were placed in the laboratory at 25 °C under stagnant conditions. After one hour, water samples (~40 mL) were taken from the top and bottom of the cylinders. Each series was run in triplicate.

2.4. Sample Processing and Laboratory Analysis

Lake water samples were analyzed for chlorophyll-a using spectrophotometry (Standard Method 10200-H), and cell counts were conducted using a hemocytometer with compound microscope to identify predominant species. The processed LS was assessed for Langmuir specific surface area (SSA), total pore volume, and average pore radius using the Brunauer-Emmett-Teller (BET) adsorption/desorption method using nitrogen (N2) at 77 K with a relative pressure range (P/Po) from 0 to 1 (QUADRASORB evo Gas Sorption Surface Area and Pore Size Analyzer, Anton Paar, Graz, Austria). Particle size distribution was determined by measuring diameters of particles that were randomly selected from images generated by scanning electron microscopy (SEM) (JEOL JSM-6010LA, Tokyo, Japan).
From the ~40 mL experimental sample, 5 mL was analyzed for zeta potential (Malvern Zetasizer nano, Malvern, UK); 5 mL were used to extract cells which were fixed with osmium tetroxide 1% aqueous solution, sputter-coated with gold, and imaged using SEM to identify morphological changes indicative of compromised cell integrity or cell lysis; and the remaining 30 mL were analyzed for chlorophyll-a using spectrophotometry. pH was measured directly in the sample cylinder after the samples were taken. Zeta potential measures the electrical potential near the particle surface, which is important to understanding the effect of coagulants on charge neutralization. pH was measured since it is important to determining the ionic speciation of alum solution.

2.5. Statistical Analysis

A one-way MANOVA was run to examine whether LS dose (factor) was associated with any significant changes in pH or overall zeta potential (two dependent variables) from samples collected in Stage 3. Three two-way ANOVAs were run to examine the effect of LS dose and its combined application with coagulant (two factors) on three outcomes (one outcome per ANOVA), namely top chlorophyll-a concentration, overall zeta potential, and pH, from samples collected during Stage 4. A significance level (⍺) of 0.01 was chosen to minimize the probability of Type I error.

3. Results

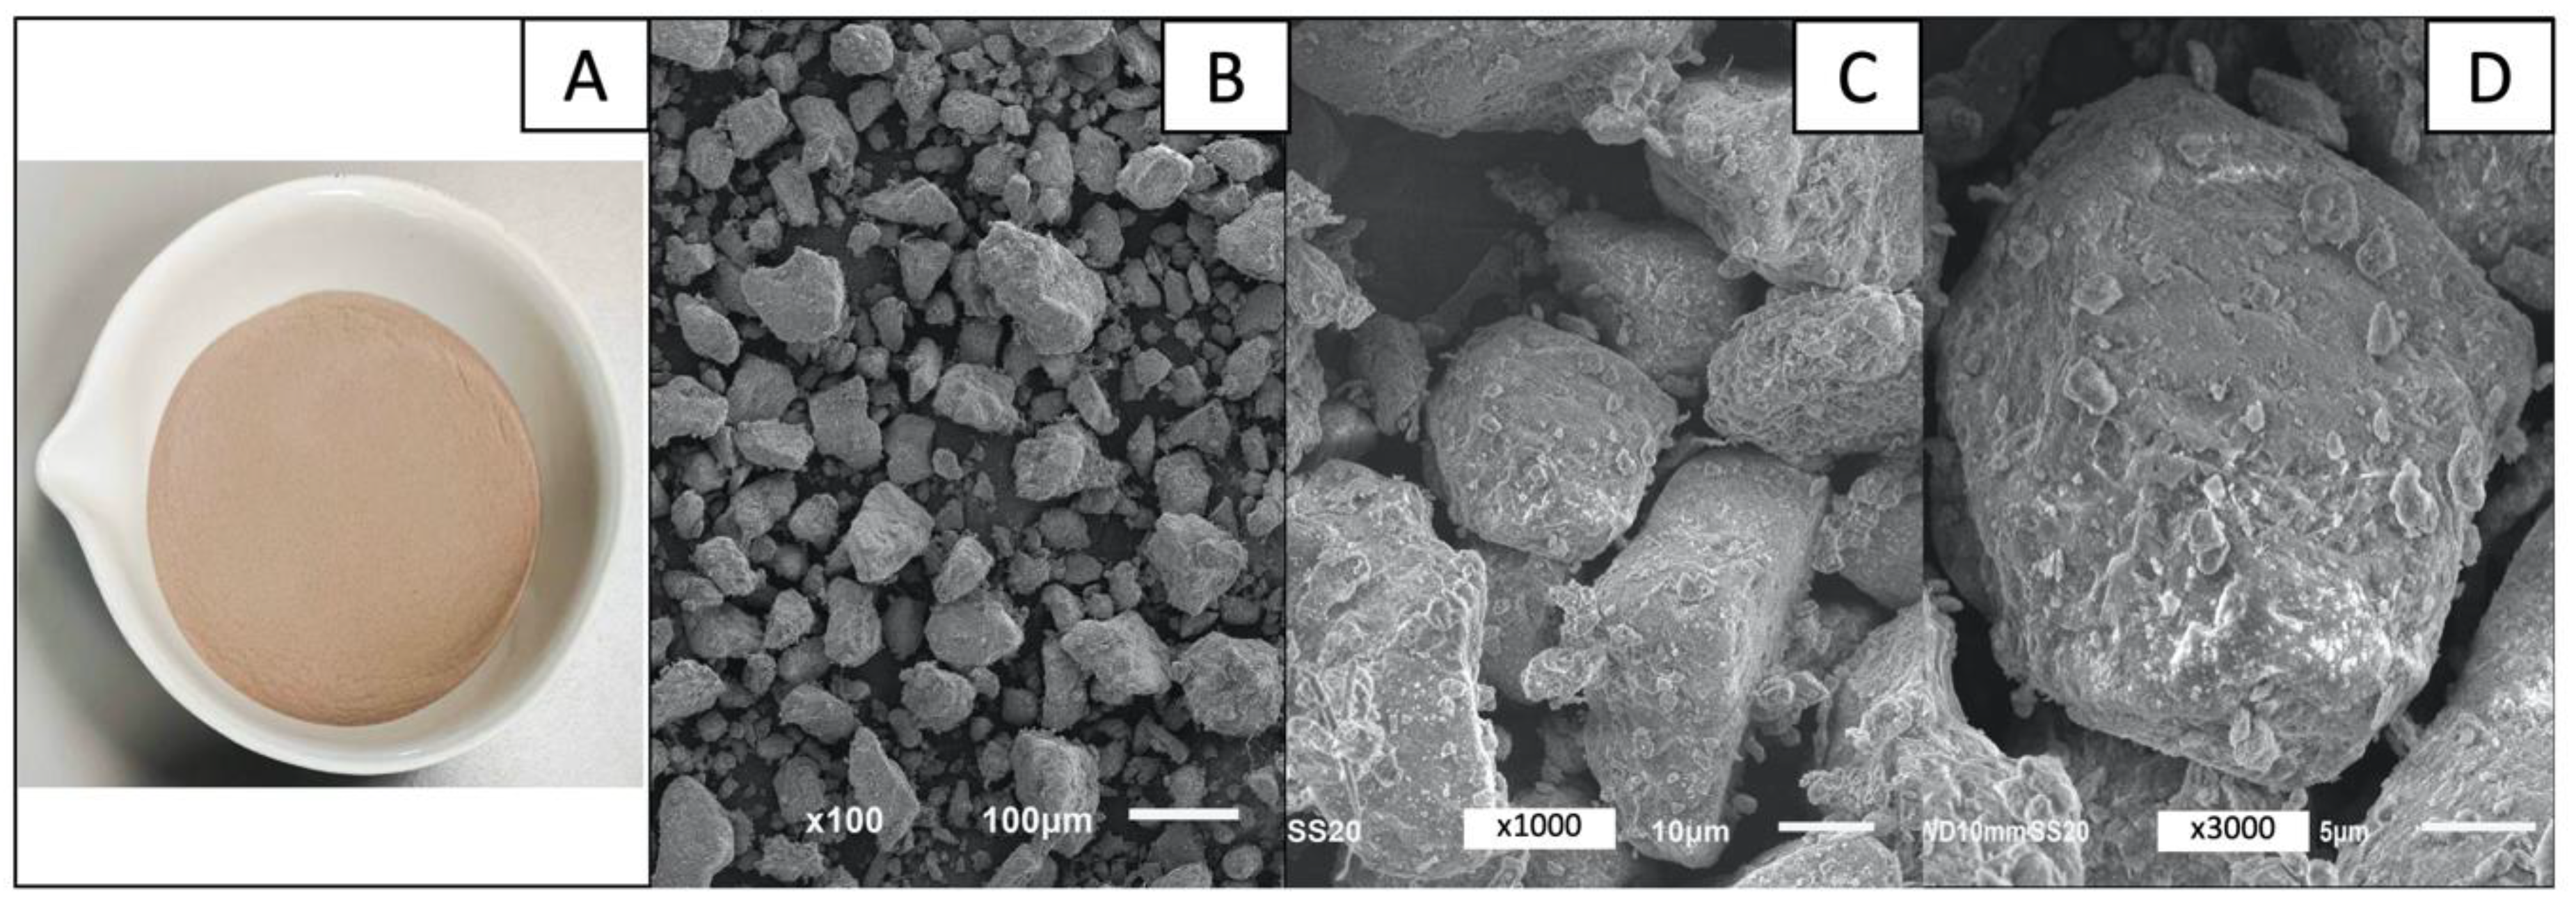
3.1. Characterization of Lake Water and Ballast

Analysis of the raw lake water showed that the experimental stages (Table 1) used water that was consistently hypereutrophic (Carlson Trophic State Index = 84–93) [42]. The dominant genus of cyanobacteria was Microcystis, accounting for greater than 99% of cyanobacterial population based on cell counts. Two species were identified as Microcystis aeruginosa (Kütz.) Kützing and Cylindrospermopsis raciborskii (Wolosz.) Seenayya & Subba Raju [43], alternatively named Raphidiopsis raciborskii (Wolosz.) Aguilera et al. [44]. No other organisms were present in quantities substantial enough to be identified.
The LS ballast had a light brown color after processing (Figure 2). Little evidence of micropores could be observed on the surface of the particles in SEM images. Adsorption/desorption isotherms (Supplementary Material Figure S1) indicated that adsorption was occurring at the highest relative pressure, which is associated with macropores, and that few micropores were present. SEM images and particle size distribution showed well-graded particles distributed over a narrow band of diameters (7.5 to 35 µm) with a 60th percentile particle size diameter (D60) of 22 µm and coefficient of uniformity (Cu) of 2.9 (Supplementary Material Table S1).

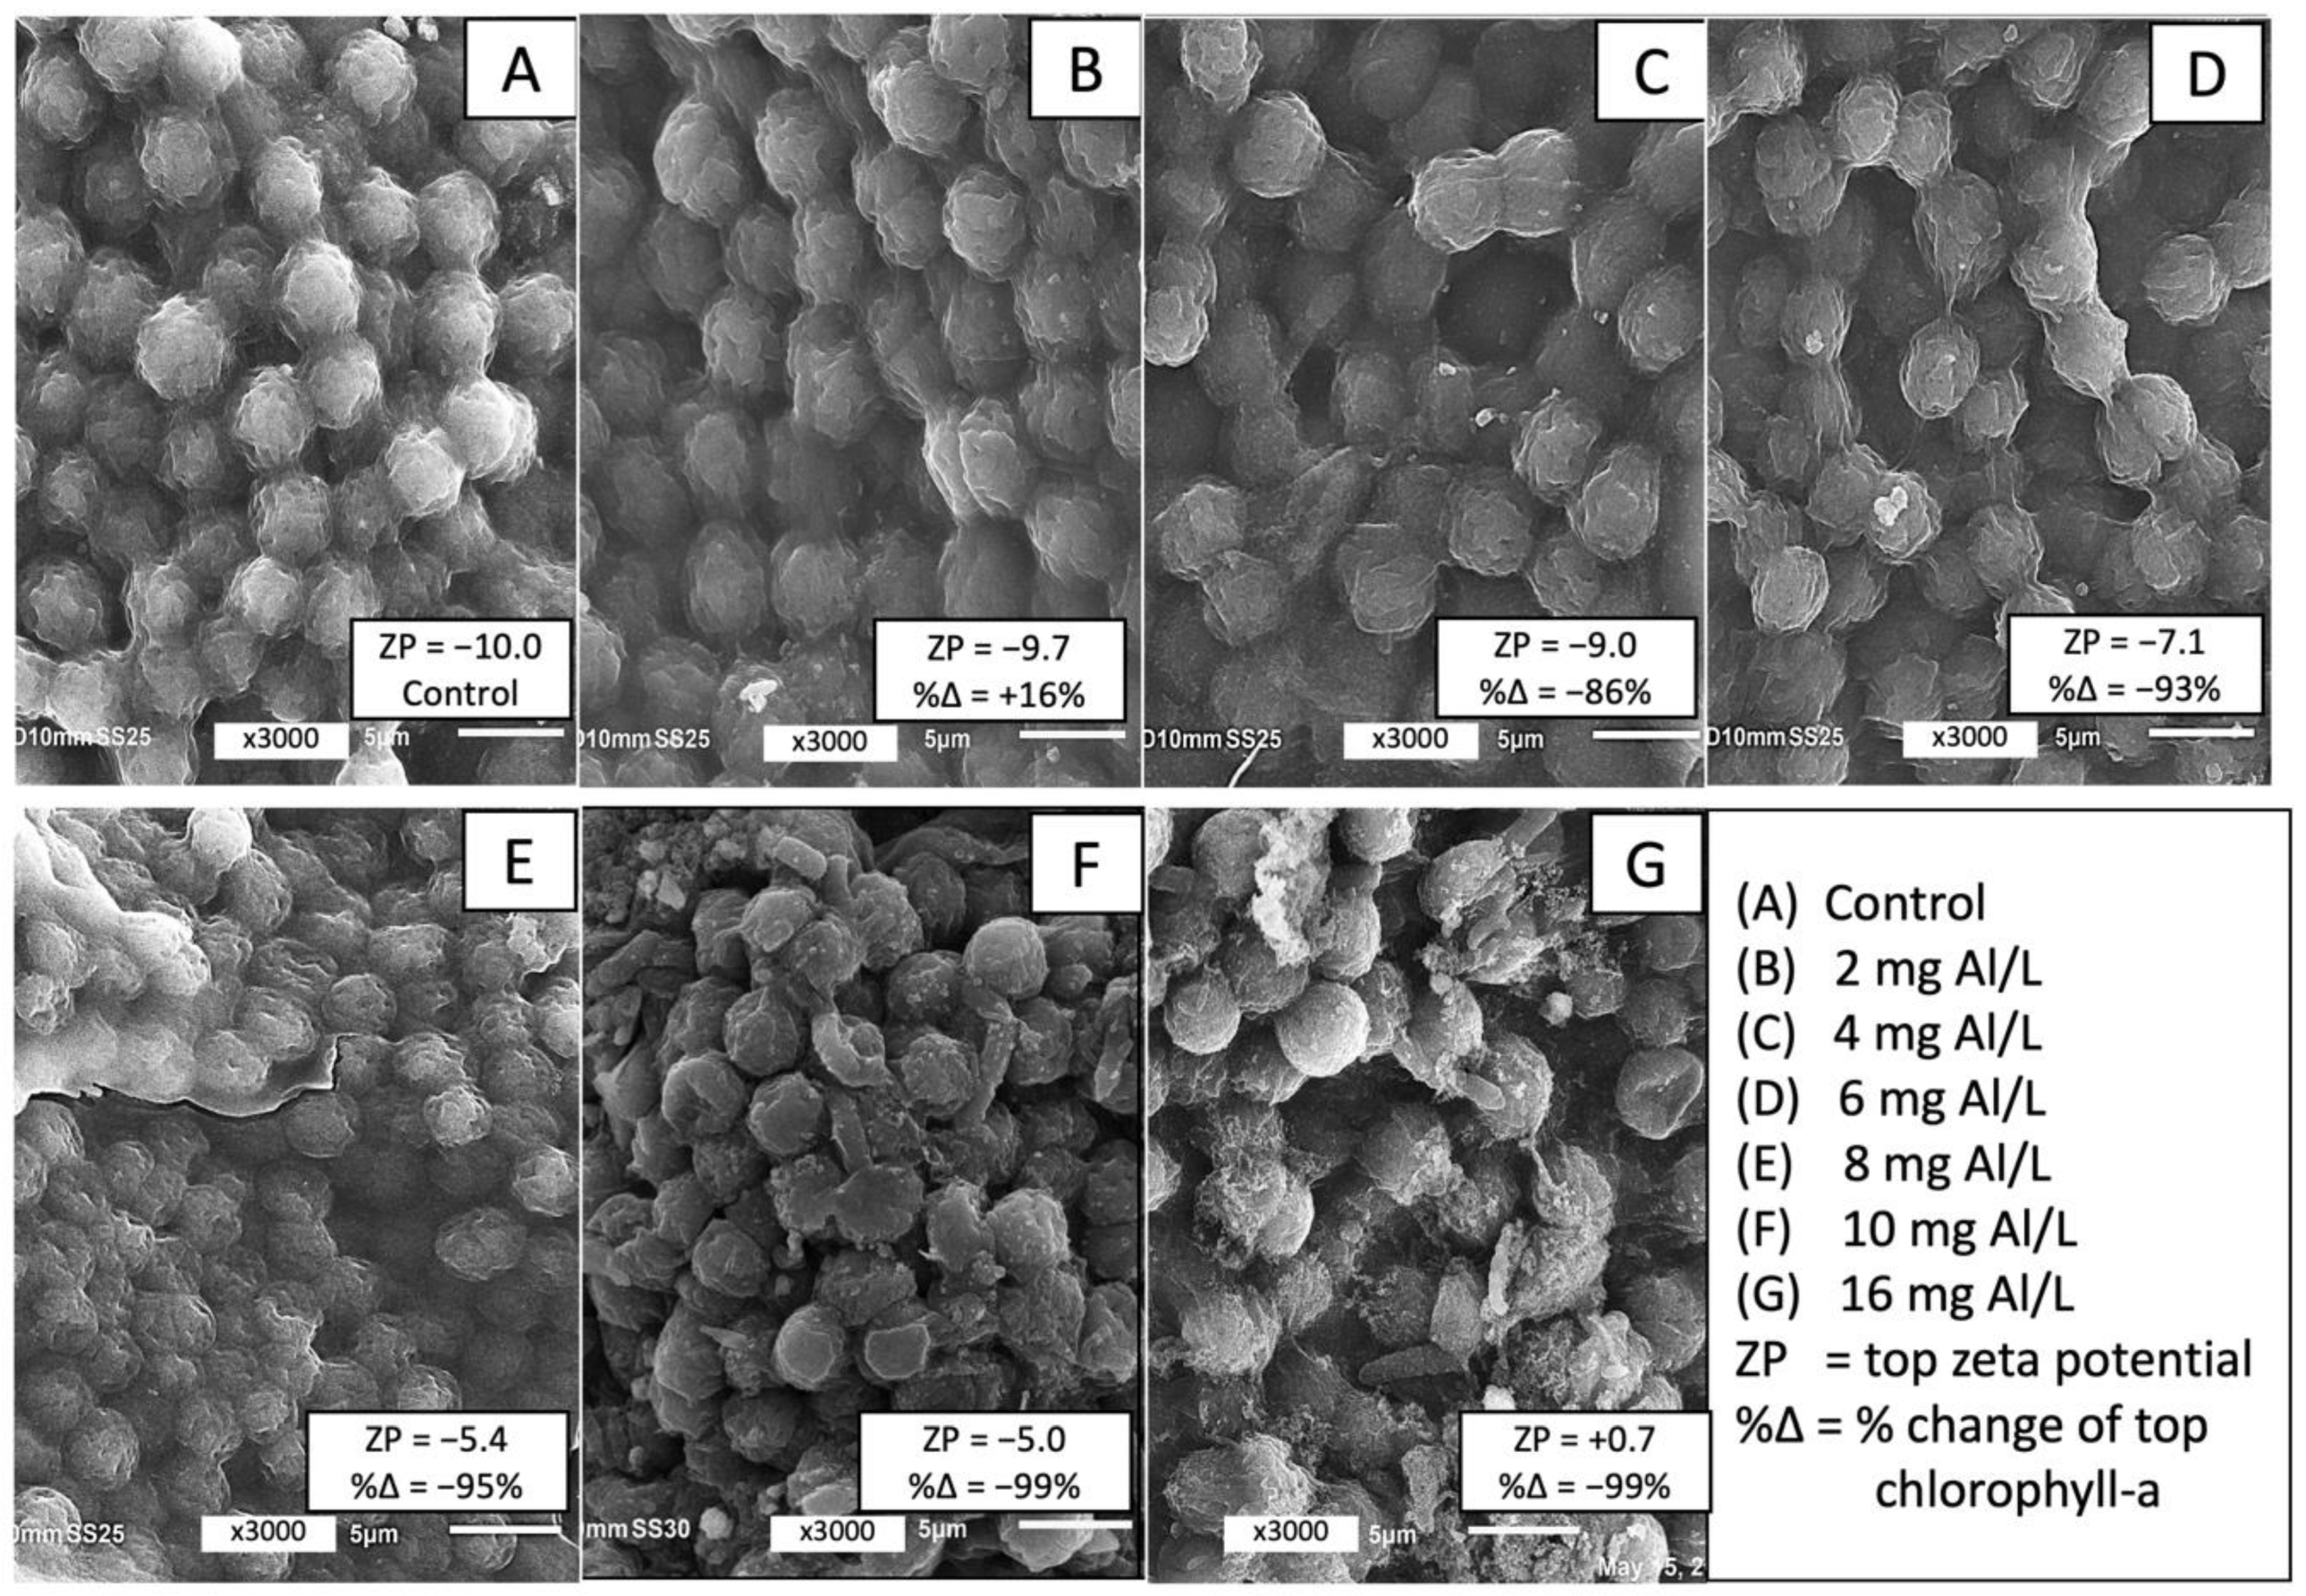
3.2. Effect of Coagulant Dose on Microcystis Floc Buoyancy and Cell Structure

By dosing the Microcystis dominated lake water with increasingly higher doses of alum, it was observed that at a relatively low dose of 2 mg Al/L the cyanobacteria flocculated at the surface, demonstrating their positive buoyancy. With 2 mg Al/L of alum, the mean concentration of chlorophyll-a in the top of the experimental cylinders increased by 16%, going from 1488 µg/L in the untreated control to 1720 µg/L (Table 2). At this low dose of coagulant, pH remained above neutral (7.34) and the weighted average of the zeta potential was −9.72, which was higher than that of the control (−9.96). However, as the lake water was treated with higher concentrations of alum, algal flocs formed and settled to the bottom of the cylinders removing 86% to 99% of cyanobacteria from the top of the cylinders, increasing according to Al dose. The pH declined below neutral at alum doses higher than 4 mg Al/L (Table 2).
Increasing the dose of alum resulted in less negative (i.e., increased) zeta potentials and even resulted in positive values (mean of +0.7 mV) at the highest dose of alum (16 mg Al/L). The changes in pH and zeta potential corresponded with morphological changes to the cellular surfaces of cyanobacteria observed in SEM images (Figure 3). The shape of the cyanobacterial cell surfaces was well rounded in the control, but at a dose of 16 mg Al/L, the cells were substantially misshapen. These morphological changes are indicative of cell lysis and release of cyanotoxins [45].
Overall, the positively buoyant Microcystis colonies flocculated and floated at the surface, increasing concentrations of chlorophyll-a in the top samples, below some Al concentration threshold. Above that threshold, however, the Microcystis primarily sank to the bottom. It was hypothesized that the threshold above which algal floc settling occurred was a function of the cyanobacteria biomass, as indicated by the initial concentration of chlorophyll-a in the lake water. Therefore, in Stage 2 the initial concentration of cyanobacteria was varied and dosed with lower doses of coagulant with finer dose differentiation.

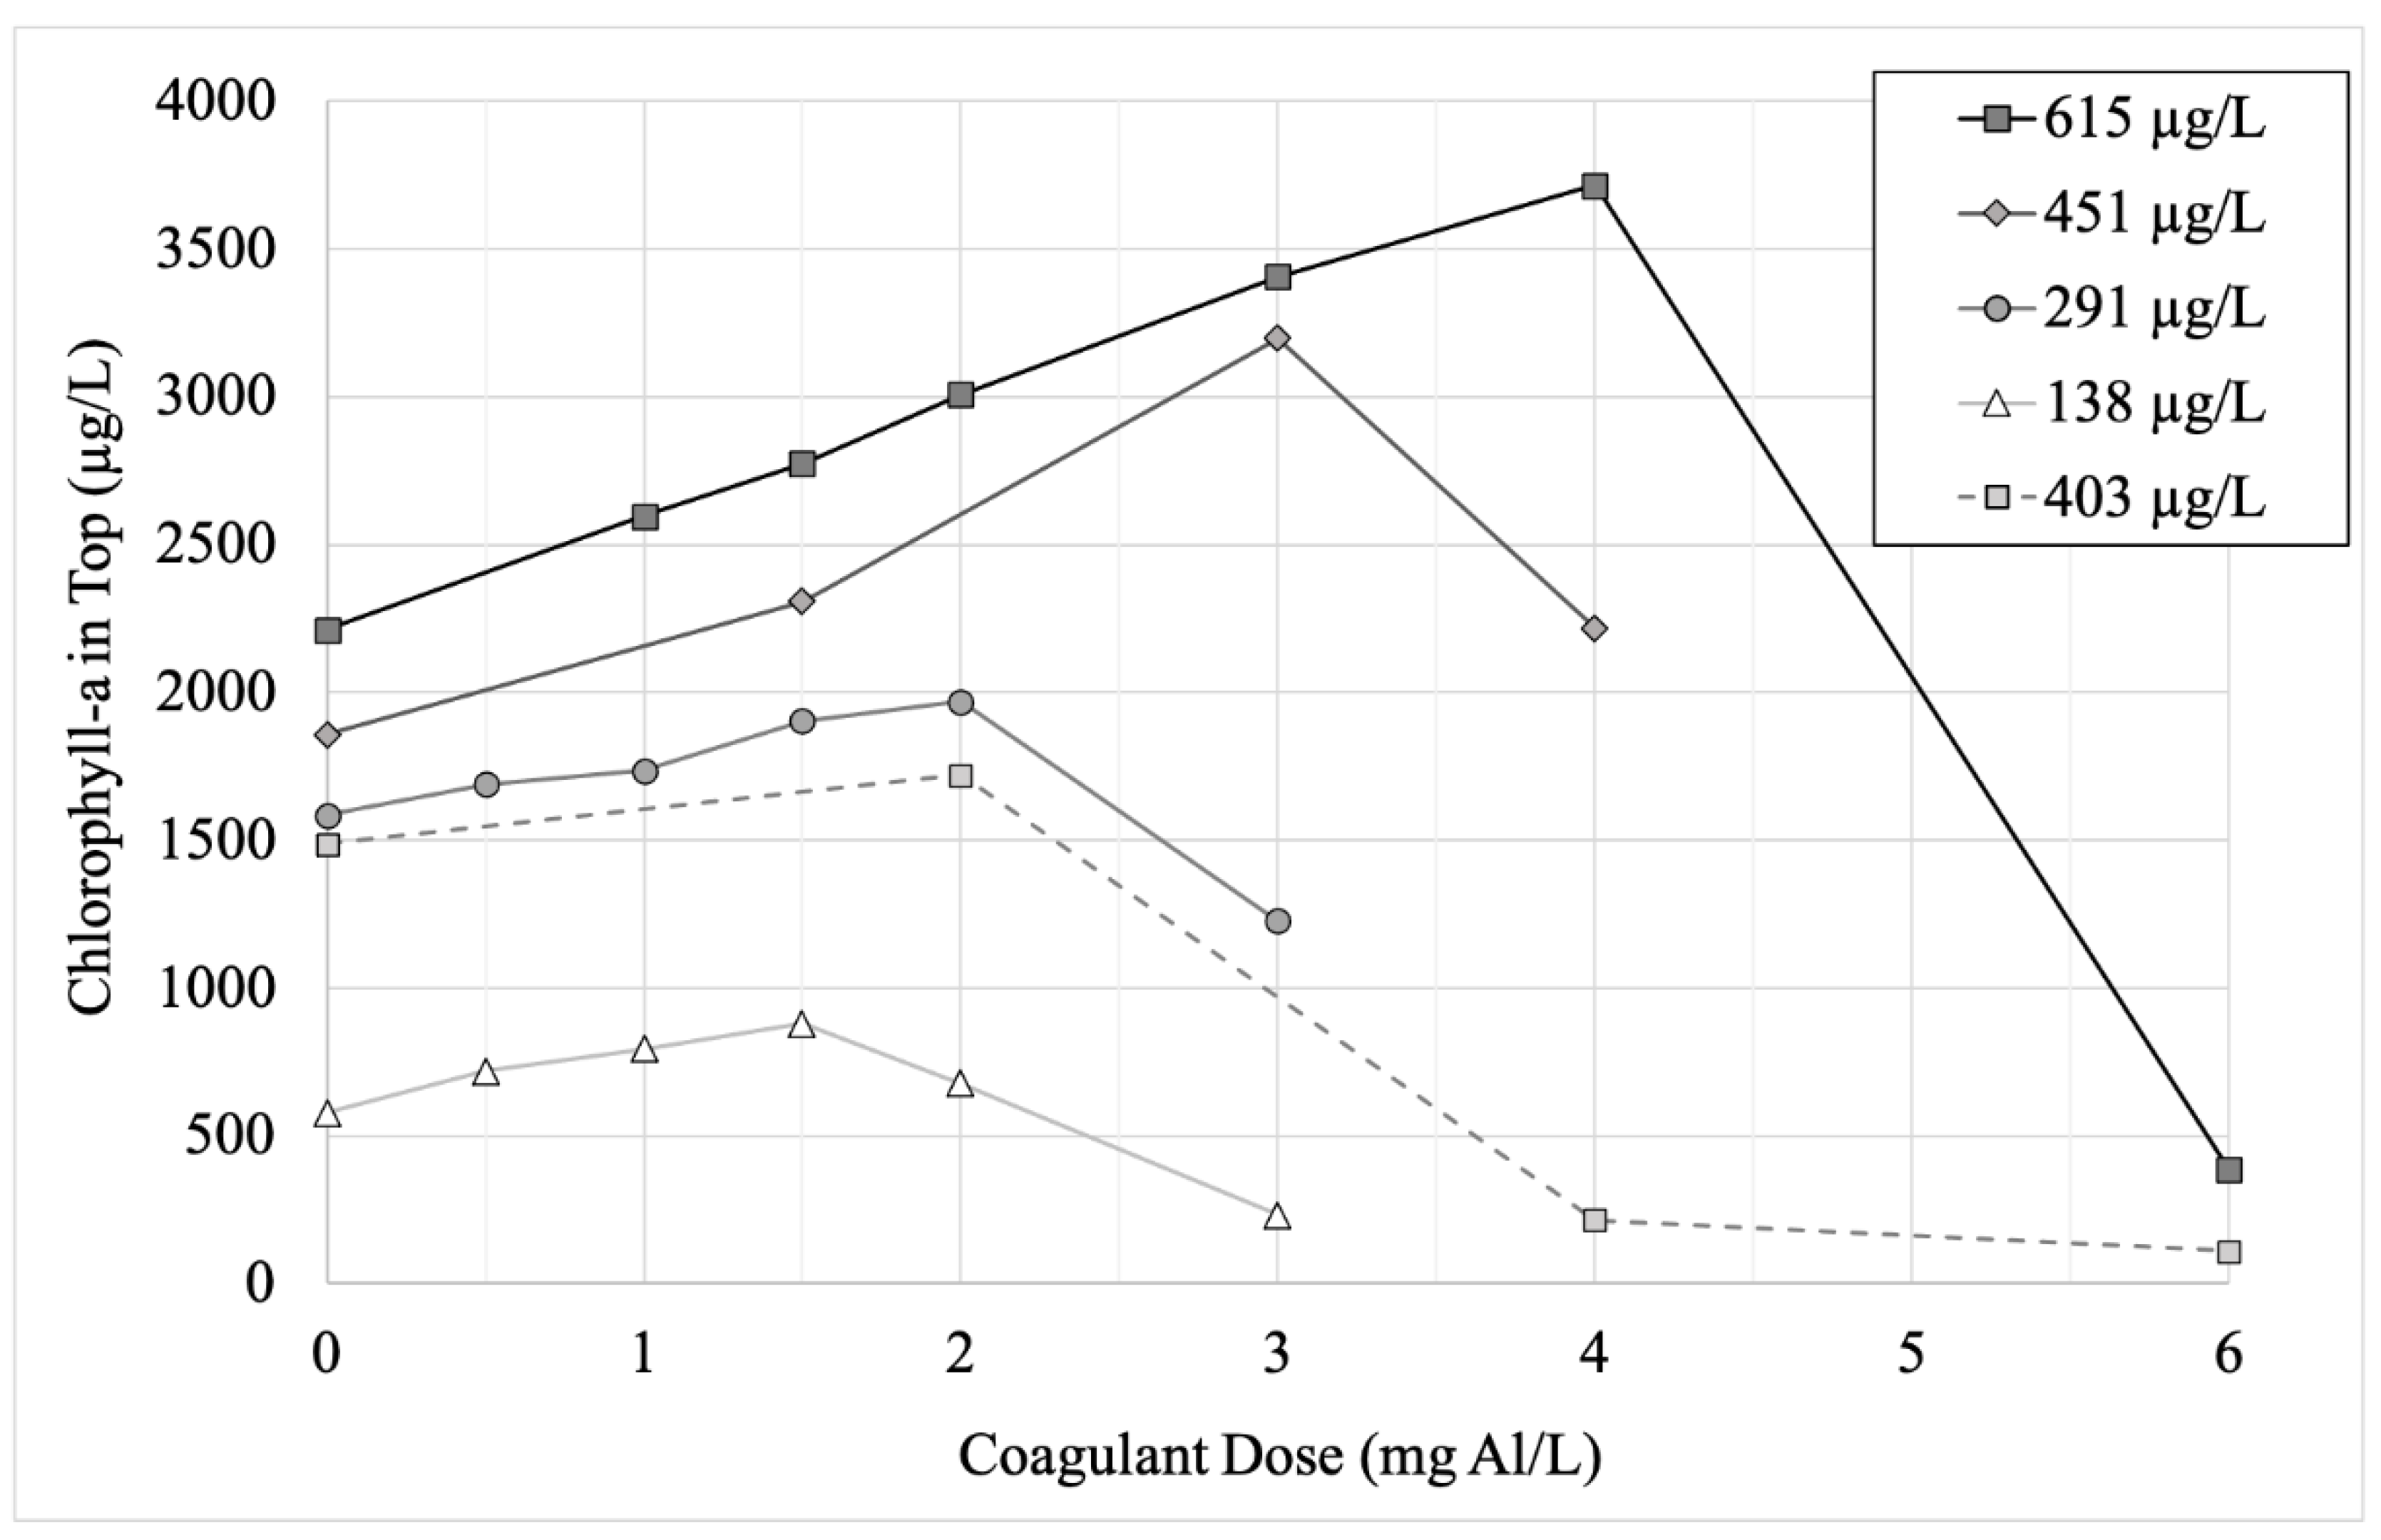
3.3. Effect of Initial Cyanobacteria Concentration on Flocculation

In the undiluted eutrophic lake water (initial mean chlorophyll-a concentration 615 µg/L), adding higher doses of alum caused positively buoyant Microcystis to flocculate at the top of the water column, as observed by the increasing concentrations of chlorophyll-a in the top of the cylinders (Figure 4). This trend continued until a maximum, which was observed at 4 mg Al/L (pH 7.17) in the undiluted lake water. At doses higher than that maximum, algae settled to the bottom. The pH was >7 for alum doses ≤ 4 mg Al/L in the undiluted water, while pH was 6.68 when dosed with 6 mg Al/L (Supplemental Material Table S2).
When Al doses were applied to cylinders with lower initial concentrations of chlorophyll-a, the threshold between floating and sinking could be seen to vary with cyanobacteria concentration (Figure 4). For example, in the half-diluted lake water (initial chlorophyll-a concentration 291 µg/L), the threshold occurred at 2 mg Al/L (pH 7.31). Notably, the pH in all experiments in which the cyanobacteria floc remained positively buoyant (top chlorophyll-a concentration greater than undosed control) was >7, while the pH in all experiments in which the floc sank was <7 (Supplemental Material Table S2).

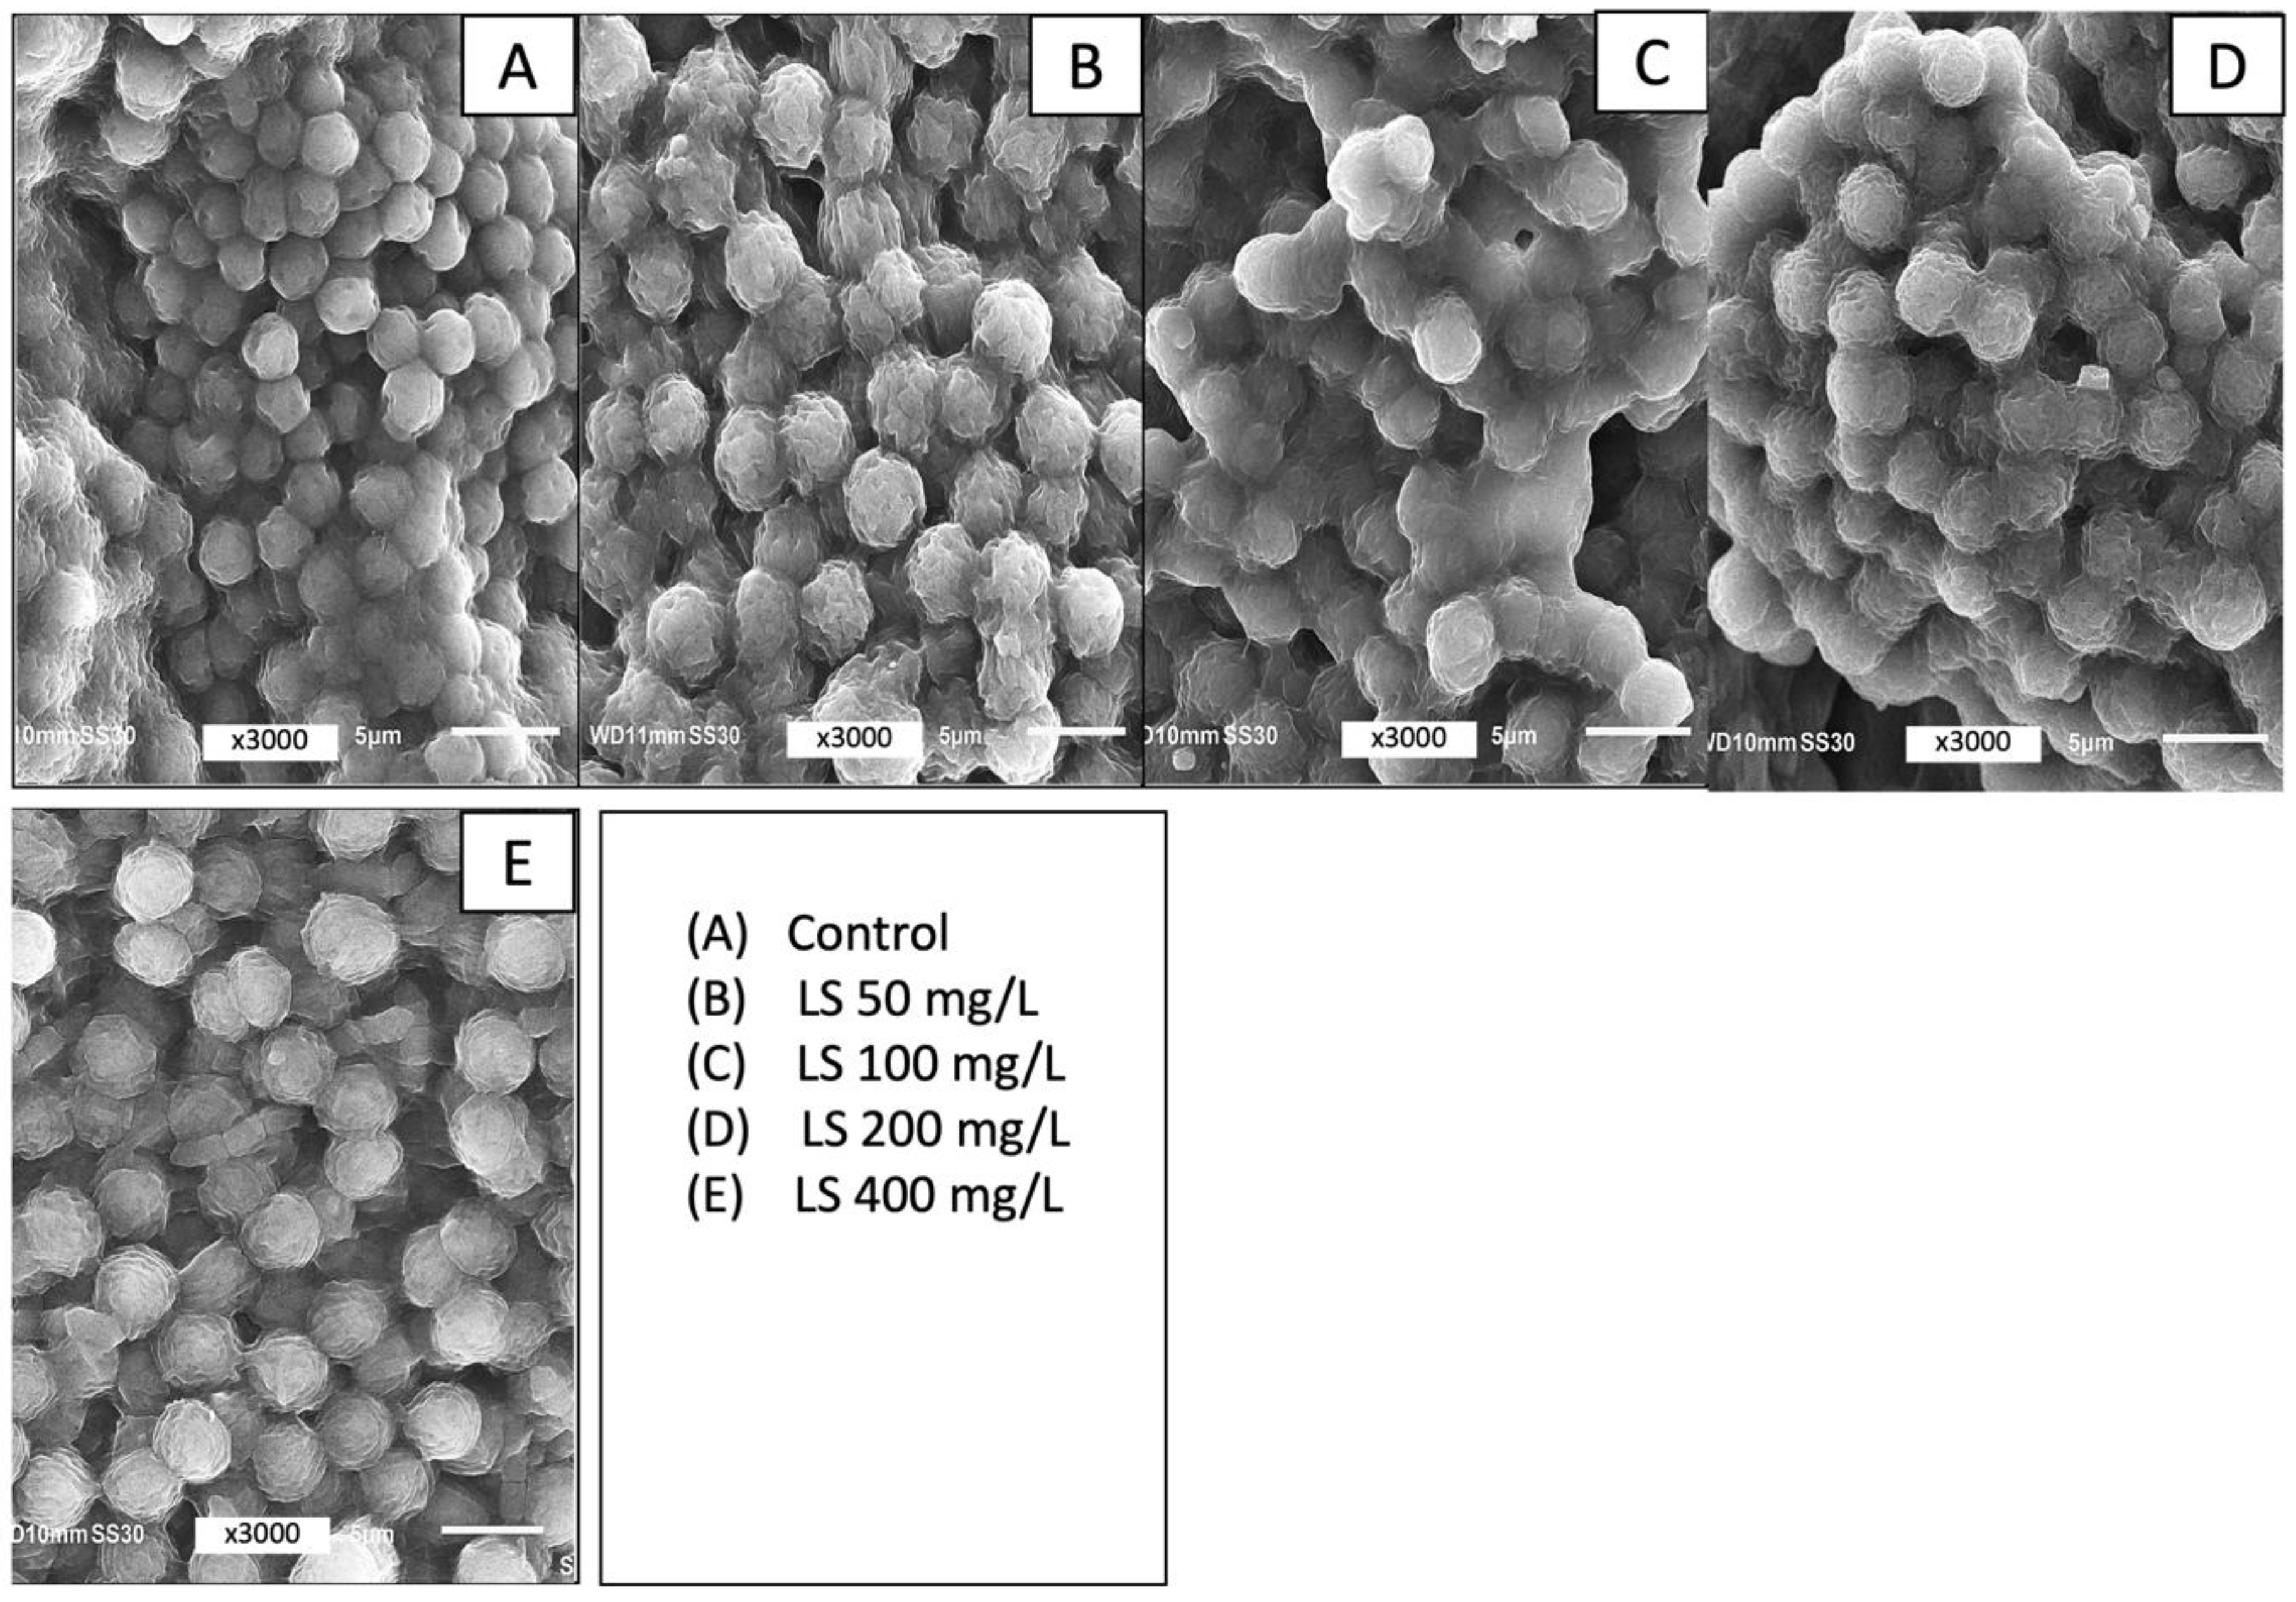
3.4. Effect of LS Ballast on Microcystsis

Eutrophic lake water with an initial chlorophyll-a concentration of 243 µg/L (Stage 3) was dosed with four different concentrations of LS ballast (50 mg/L, 100 mg/L, 200 mg/L, 400 mg/L) and compared to a control. The results of the one-way MANOVA showed that there were no statistically significant differences in pH and overall weighted zeta potential among the LS doses (F4,5 = 0.90, p = 0.55) (Table 3). The addition of the LS ballast caused some of the Microcystis to settle to the bottom, with 50 mg/L reducing the top chlorophyll-a concentration by 1% and the highest LS dose of 400 mg/L reducing the top chlorophyll-a concentration by 21%. The addition of LS ballast caused little noticeable morphological changes to the cyanobacteria cell surface (Figure 5).

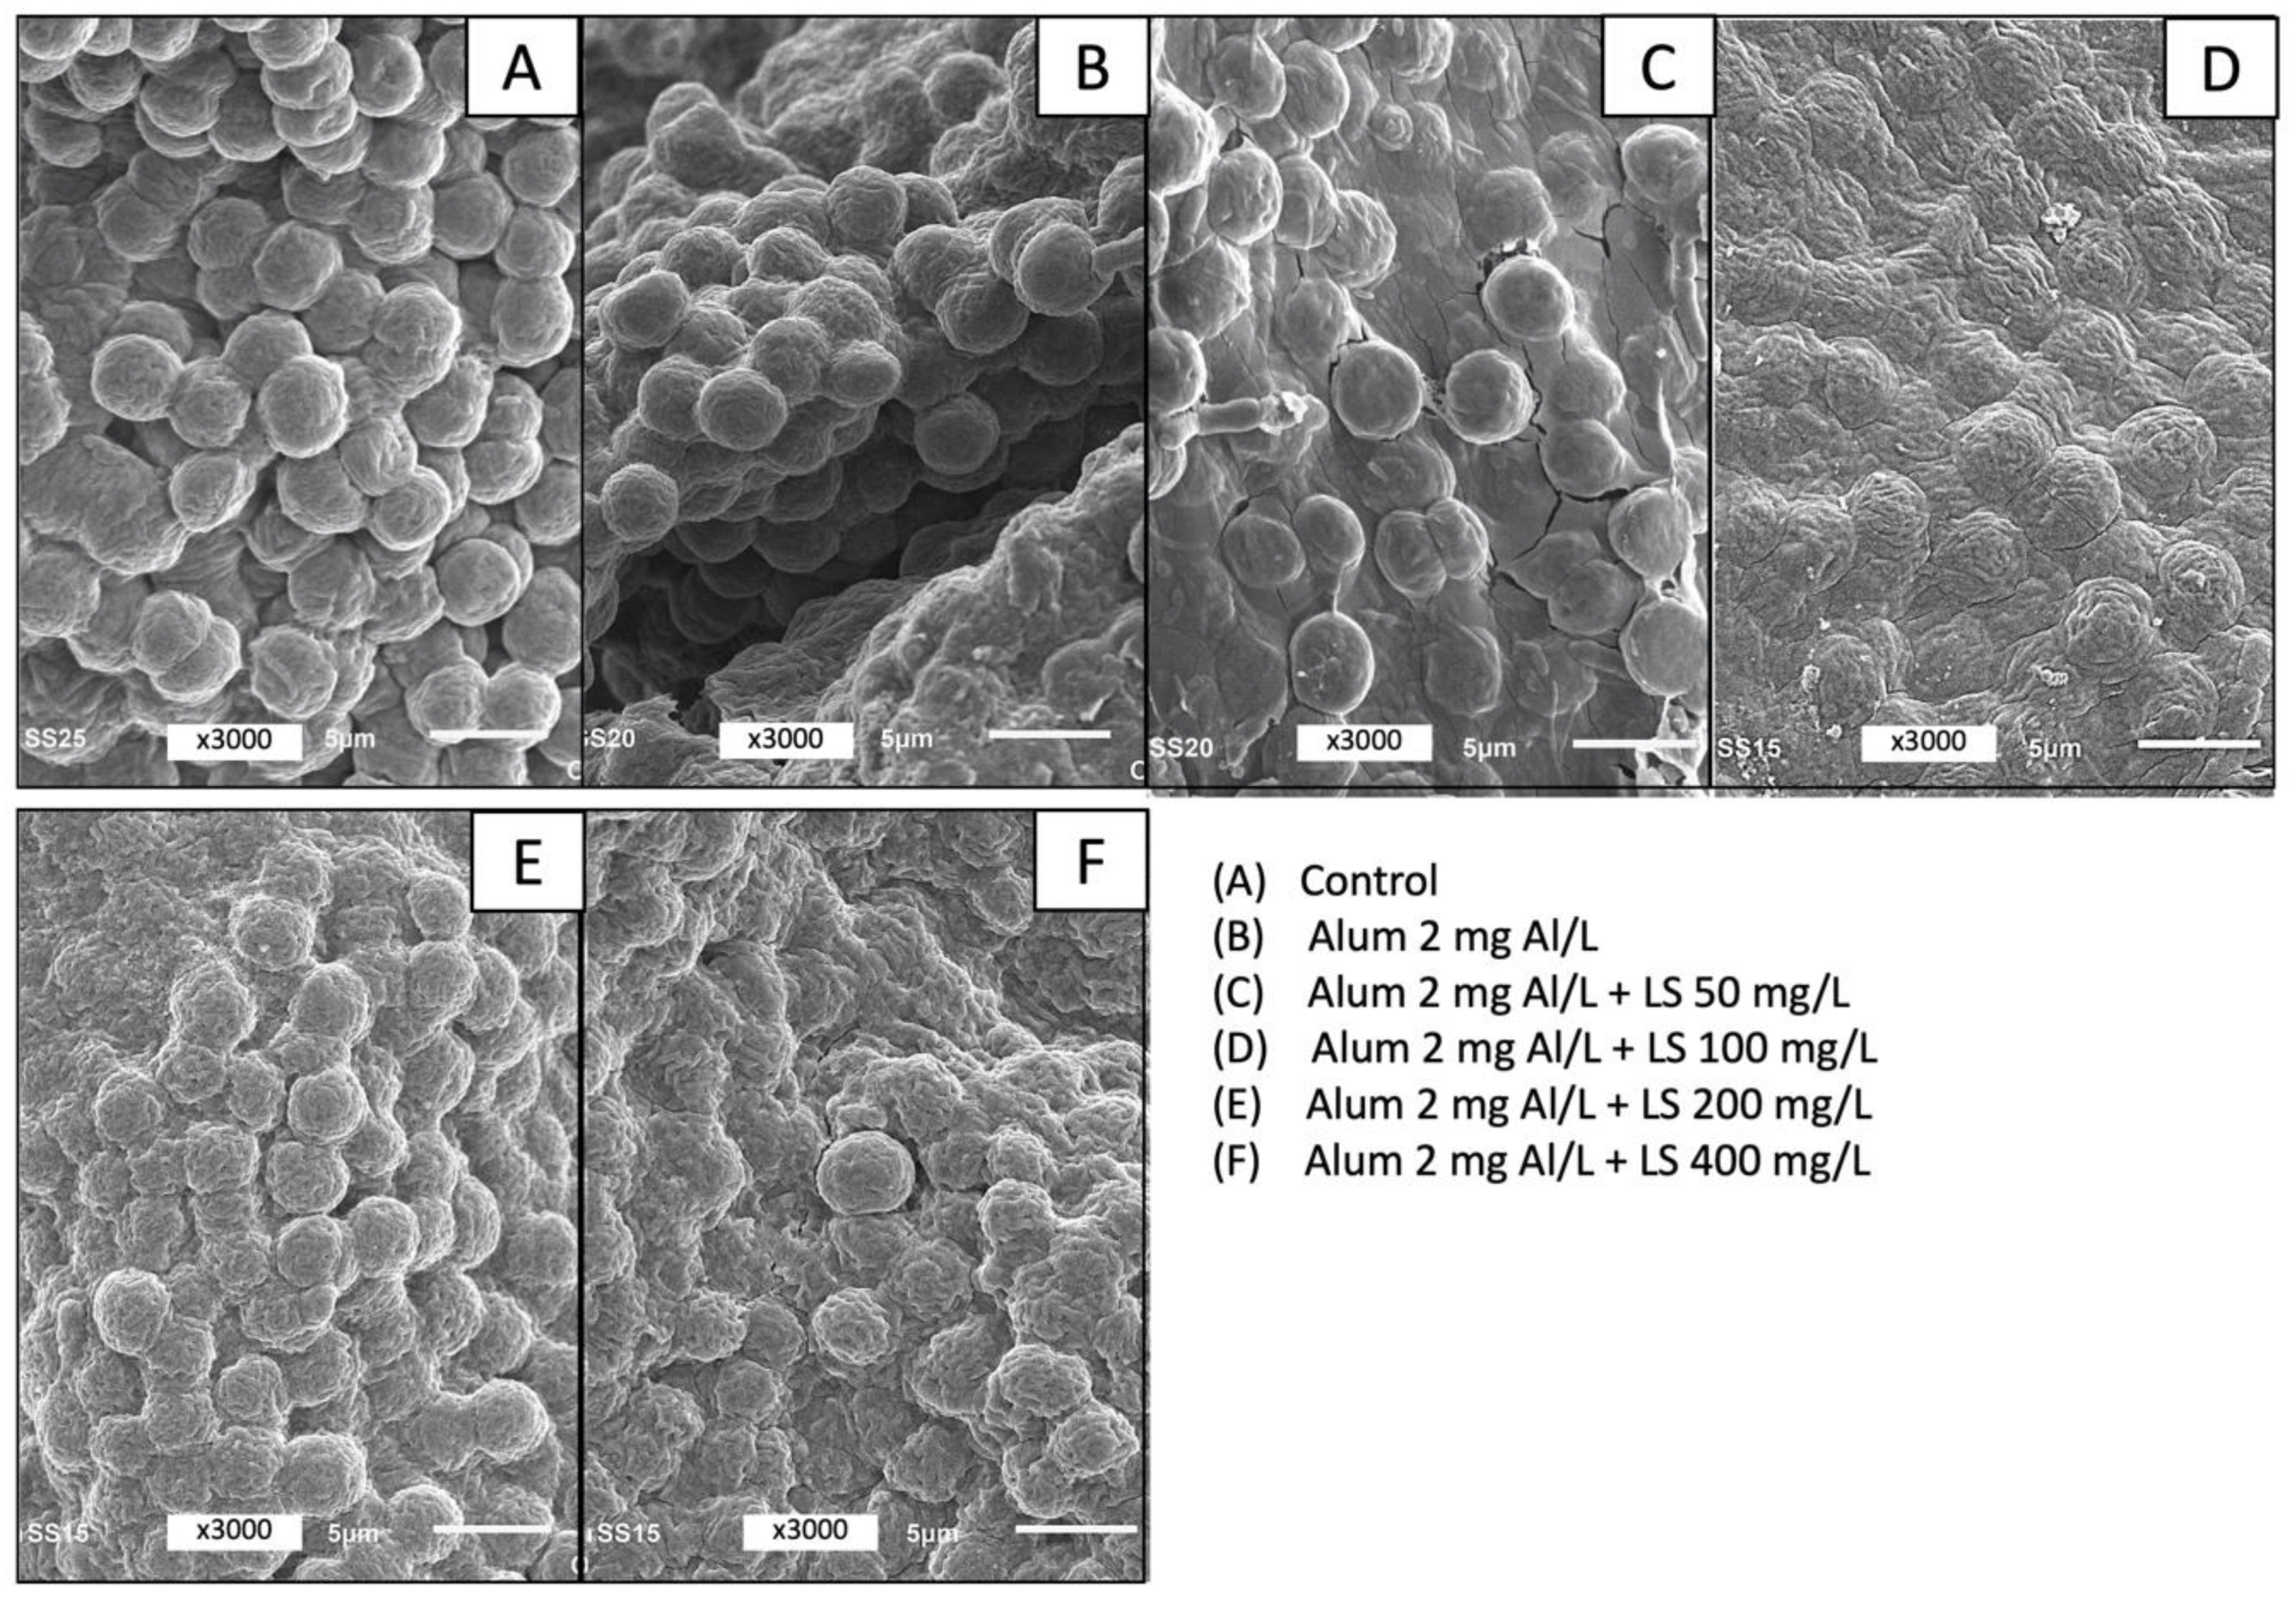
3.5. Removal Efficacy of LS Ballast Combined with Low-Dose Coagulant

Eutrophic lake water with an initial chlorophyll-a concentration of 485 µg/L (Stage 4) was dosed with a combination of a fixed dose of coagulant (2 mg Al/L, based on preliminary jar tests) and four different combinations of LS ballast (50 mg/L, 100 mg/L, 200 mg/L, 400 mg/L), with a comparison arm that did not receive any coagulant. Similar to Stage 1 and 2 findings, the addition of 2 mg Al/L of alum caused the top chlorophyll-a to increase 46% (Figure 6, Supplementary Material Table S3). Similar to Stage 3 findings, the addition of LS ballast alone caused some reduction in top chlorophyll-a compared to the control (1 to 26%). However, when the low-dose coagulant and LS ballast were combined, Microcystis flock was formed and sedimented, resulting in effective removal (81% to 88%), with removal efficacy increasing with higher LS dose. The combination of alum (2 mg/L) and LS caused the pH to decrease slightly and no changes to zeta potential (Supplementary Material Table S3), which was also consistent with findings in the previous stages. No morphological changes were observed in SEM images (Figure 7).
The two-way ANOVA assessing top chlorophyll-a showed highly significant effects associated with LS dose (F4,18 = 7954; p < 0.0001) and the presence of the low-dose of coagulant (F1,18 = 18199; p < 0.0001), as well as a significant LS dose x coagulant interaction effect (F4,18 = 5752; p < 0.0001). The two-way ANOVA assessing pH showed a statistically significant effect from the presence of the low-dose coagulant only (F1,18 = 421, p < 0.0001) but non-significant effects from LS dose (F4,18 = 3.8; p = 0.02) and LS dose x coagulant interaction (F4,18 = 3.1; p = 0.04). However, the two-way ANOVA assessing the overall zeta potential showed no effect from LS dose (F4,18 = 1.6; p = 0.21), coagulant (F1,18 = 0.36; p = 0.56), or interaction (F4,18 = 0.91; p = 0.48).
In summary, LS dose was significantly associated with reduction in top chlorophyll-a but not changes in pH or zeta potential; the presence of a low dose of alum was significantly associated with reductions in top chlorophyll-a and pH but not changes in zeta potential. There was a significant interaction effect between LS dose and coagulant on top chlorophyll-a concentration.

4. Discussion

In this study, we observed colonies of positively buoyant cyanobacterium Microcystis aeruginosa accumulating at the surface of the water column in the presence of a low dose of coagulant, aluminum sulfate, in which the pH remained above 7. We also observed these colonies sediment to the bottom at higher coagulant doses with visible deformation in the cell morphology. The addition of a local soil ballast in isolation removed some cyanobacteria from the water column; however, the combination of a low dose of coagulant plus a ballast was effective at removing Microcystis from the water column and demonstrated an interaction effect from LS dose and presence of alum.
The addition of unbuffered alum to water changed the pH. The addition of LS ballast did not cause changes to pH or zeta potential. By combining alum with LS ballast, the changes to pH, zeta potential, and cell structure were minimized or prevented, while chlorophyll-a in the water column was reduced by more than 80%. These results were consistent with previous studies that showed the combination of a low dose of coagulant plus ballast could effectively sink positively buoyant Microcystis in fresh waters [27,28,29,30,32,35,36]. This study adds to this body of knowledge by imaging changes in cell morphology and discussing the underlying mechanisms involved in flock and sink.

4.1. Mechanisms of Flock and Sink Technique for Microcystis

Cyanobacteria have developed a number of adaptations that allow them to dominate aquatic systems, including the ability to regulate buoyancy using gas vesicles and high tolerance for light intensity, which has greatly improved their ability to access the near surface layer of lakes in order to photosynthesize [9,46]. In general, buoyancy can be regulated by three mechanisms: gas vesicle production [47], collapsing the vesicles under turgor (intracellular) pressure [48], or increasing cell density through accumulation of carbohydrates, which act as intracellular ballast [49]. Different genera of cyanobacteria experience loss in buoyancy by exploiting at least one of these three mechanisms [46,48]. Relative to other cyanobacteria genera, Microcystis has a relatively narrow range of density (985–1005 g/L) and the ability to form larger colonies up to 120–3200 µm [46].
For the Microcystis genus, colony formation is an important adaptation to facilitate buoyancy regulation despite the narrow density range, allowing it to propagate across the world [50]. Microcystis species are unicellular but excrete a mucilaginous sheath consisting primarily of polysaccharides [46]. These extracellular polysaccharides, which adhere to the cellular membranes, bind cells together in colonies [51,52]. Environmental factors, including predation [53,54,55], changes in temperature and light [40,56], and metals [57,58] can trigger colony formation. Without these triggers, it is possible for Microcystis to remain unicellular, especially in laboratory settings [59,60]. The colonies can even create microenvironments that alter pH and oversaturate the water with oxygen, which can promote additional buoyancy [61] and provide some protection [62].
Given these advantages and characteristics that facilitate strong positive buoyancy of Microcystis colonies, what mechanisms contributed to the sedimentation of the cyanobacteria under combined dosage of coagulant and ballast? In conventional flocculation with colloidal particles, charge neutralization is the key [63]. However, colonial Microcystis had already formed into large flocks and sedimentation occurred in this study without substantial changes to the zeta potential, similar to previous studies [30]. A key observation in this study was that Microcystis sank at pH less than 7 when only coagulant was added. In the pH range of 5–7, Al speciation generally shifts to cationic forms of Al, which can reduce electrostatic repulsion [64]. Thus, charge neutralization becomes a key sedimentation mechanism in this pH range. In fact, a low dose of Al has been shown to effectively remove Microcystis as long as the pH is between 5 and 7 [65]. In this study, the high alkalinity and pH of the water prior to treatment meant that a low dose of Al was not enough to reduce pH below 7 and amorphous hydroxide precipitates were likely predominantly formed [64,65]. Tropical lake water with a high pH has been shown to play an important role in the behavior of coagulants [29,36].
Sweeping has been proposed in previous studies as a possible mechanism contributing to sedimentation of flocculated cyanobacteria [30]; however, results from this study suggest that bridging was the dominant mechanism. The addition of a coagulating metal salt to a colloidal LS solution has been shown to increase the electro-static interaction, bridging, and enmeshment, which enhanced the effective collision between algal cells and clay particles [38].
Changes in the inherent buoyancy regulation mechanisms of the cells were unlikely to contribute to the observed phenomenon, since those changes take place on the order of hours to days to weeks [46]. Colony formation as a result of exposure to coagulant, on the other hand, has been shown to occur within 5 min [66]. Cell lysis was also likely not the cause of sedimentation. When compared to previous studies using SEM to analyze morphological changes in Microcystis cellular structure associated with cell lysis, the images from low-dose treatments in this study were consistent with images from cells that did not undergo lysis [45,67]. Cell lysis has generally been shown not to occur at low coagulant doses [27,68,69]. At alum doses of 10 or 16 mg Al/L, however, the integrity of cells was damaged, exhibiting pocks, deformation, and rupturing, consistent with images of cells that had torn membranes due to alum treatment [70]. In-lake use of aluminum-based coagulants has also been shown to release toxic microcystins [71]. However, the conclusions inferred from SEM imagery in this study should be further validated through measurement of microcystins in the water, PSII efficiency of the cyanobacteria [29], or staining cells to identify damage.

4.2. Considerations for Flock and Sink Applications in Fresh Waters

The use of flock and sink as a lake restoration technique has several advantages and limitations that should be carefully considered before use [34]. First, the type of cyanobacteria present must be considered. In this study, lake water was dominated by the Microcystis genus, which form large colonies and have relatively neutral buoyancies. Previous research has shown that flocculation and sedimentation behave differently among cyanobacteria genera [29]. This study suggested that flock and sink techniques that use aluminum-based coagulants and ballast may be applicable for colonial cyanobacteria (e.g., Microcystis) genera, while previous research suggests it may also be applicable to filamentous cyanobacteria (e.g., Cylindrospermopsis) [29,36]. The applicability of the technique to genera of cyanobacteria that have not yet been studied is unknown.
While controlling non-point sources of nutrients and enhancing natural attenuation processes in nutrient transport pathways must and be given attention [72], in-lake measures are becoming inevitable as a way to bide time until proper external nutrient control measures take effect and to bring about more rapid changes to lake water quality [22,73]. Flock and sink serves as a bloom management technique, similar to algicides. However, one key advantage of properly administered flock and sink is that cellular damage is not caused, as demonstrated in this study. On the other hand, algicides can cause the release of toxins [25,74]. Once sedimented to the lake sediment, cyanotoxin-degrading bacteria and other mechanisms can break down the cyanotoxins [75,76]. However, the possibility that intracellular microcystins can be released from sedimented cyanobacteria must be considered [77]. In addition, bioturbation or wind-driven resuspension needs to be considered [78,79], since Microcystis cells themselves remain positively buoyant [80].
Flock and sink, as opposed to flock and lock, may only serve as a short-term mitigation of bloom conditions. The flock and sink approach has been shown to only address P in the water column [36]. For long-term lake restoration, internal P loading must also be considered. Inadequately addressing internal P loading is cited as a common cause for failed lake restoration [81,82,83]. Therefore, a ballast that has P binding capacity, such as in flock and lock, is preferable for long-term water quality improvement [31]. Drinking water treatment residuals (DWTR) have been shown to be excellent P sorbents and have been used in lake restoration [84,85]. More research is needed to determine whether DWTR can be effectively applied as a ballast in a flock and lock approach.
This study showed that the amount of ballast added did not substantially change the amount of Microcystis sedimented. That is, a small dose of 50 mg/L removed 81% while a high dose of 400 mg/L sedimented 88% of the chlorophyll-a. Therefore, it would be preferable to base the amount of ballast added on its ability to inactivate P in sediment and address internal P loading. The benefit of LS ballast is that if one is chosen that has a relatively high P sorption capacity, it can inactivate P in the lake sediment without affecting the pH, as demonstrated in this study. However, as variation in soils is substantial, tests must be performed to verify the effect of the LS on pH and whether the LS has any P sorption capacity, as determined through P adsorption experiments.

5. Conclusions

This research demonstrated that flock and sink using a local soil as a ballast and a low dose of aluminum sulfate as a coagulant was an effective technique to remove Microcystis from eutrophic tropical lake water without observable morphological changes to the cyanobacteria colonies. The water pH was shown to be an important factor in determining the flocculation and positive buoyancy of the Microcystis. The local soil was shown not to affect the zeta potential of the cyanobacteria flock or the pH of the water. Flock and sink can be an effective tool in lake restoration; however, lake alkalinity, pH, ionic strength, amount of P inactivation needed for sediment P release control, and species and population of phytoplankton should all be considered before application.

Supplementary Materials

The following are available online at https://www.mdpi.com/2073-4441/13/2/111/s1, Figure S1: adsorption isotherms for local soil ballast derived from Brunauer-Emmett-Teller (BET) adsorption/desorption method, Table S1: physical characteristics of local soil ballast, Table S2: pH, chlorophyll-a (micrograms per liter), and zeta potential (mV) in the samples collected from the top and bottom of the experimental units following treatment with only aluminum sulfate (in mg Al/L) while varying initial concentrations of chlorophyll-a (Stage 2), Table S3: pH, chlorophyll-a (micrograms per liter), and zeta potential (mV) in the samples collected from the top and bottom of the experimental units following combined treatment of aluminum sulfate (in mg Al/L) and local soil ballast (in mg/L) (Stage 4).

Author Contributions

Conceptualization, A.C.K. and A.T.K.; methodology, A.T.K. and S.T.; software, A.C.K. and S.T.; formal analysis, A.C.K., A.T.K. and B.J.H.; investigation, S.T.; resources, A.T.K.; data curation, A.C.K., A.T.K., and S.T.; writing—original draft preparation, A.T.K., A.C.K. and B.J.H.; writing—review and editing, A.T.K., A.C.K. and B.J.H.; visualization, S.T., A.T.K. and A.C.K.; supervision, A.T.K.; project administration, A.T.K.; funding acquisition, A.C.K. and A.T.K. All authors have read and agreed to the published version of the manuscript.

Funding

This research was supported by a grant provided by Research and Graduate Studies, Khon Kaen University, grant number RP64.

Institutional Review Board Statement

Not applicable.

Informed Consent Statement

Not applicable.

Data Availability Statement

The data presented in this study are available in the current manuscript and its Supplementary Material; raw data is available on request from the corresponding author.

Acknowledgments

Permission was obtained from the local municipality under an agreement between the Faculty of Public Health at Khon Kaen University and Ban Ped Municipality of Khon Kean Province. We gratefully acknowledge Ban Pet Municipality for providing access for water sampling and Miss Phairo Saenwang for providing laboratory assistance.

Conflicts of Interest

The authors declare no conflict of interest.

References

  1. Delkash, M.; Al-Faraj, F.A.M.; Scholz, M. Impacts of Anthropogenic Land Use Changes on Nutrient Concentrations in Surface Waterbodies: A Review. Clean Soil Air Water 2018, 46, 1–10. [Google Scholar] [CrossRef] [Green Version]
  2. Hobbie, S.E.; Finlay, J.C.; Janke, B.D.; Nidzgorski, D.A.; Millet, D.B.; Baker, L.A. Contrasting nitrogen and phosphorus budgets in urban watersheds and implications for managing urban water pollution. Proc. Natl. Acad. Sci. USA 2017, 114, 4177–4182. [Google Scholar] [CrossRef] [PubMed] [Green Version]
  3. Schwarzenbach, R.P.; Egli, T.; Hofstetter, T.B.; von Gunten, U.; Wehrli, B. Global Water Pollution and Human Health. Annu. Rev. Environ. Resour. 2010, 35, 109–136. [Google Scholar] [CrossRef]
  4. Paerl, H.W. Mitigating Toxic Planktonic Cyanobacterial Blooms in Aquatic Ecosystems Facing Increasing Anthropogenic and Climatic Pressures. Toxins 2018, 10, 76. [Google Scholar] [CrossRef] [Green Version]
  5. Paerl, H.W.; Barnard, M.A. Mitigating the global expansion of harmful cyanobacterial blooms: Moving targets in a human- and climatically-altered world. Harmful Algae 2020, 96. [Google Scholar] [CrossRef]
  6. Jeppesen, E.; Kronvang, B.; Meerhoff, M.; Søndergaard, M.; Hansen, K.M.; Andersen, H.E.; Lauridsen, T.L.; Liboriussen, L.; Beklioglu, M.; Özen, A.; et al. Climate Change Effects on Runoff, Catchment Phosphorus Loading and Lake Ecological State, and Potential Adaptations. J. Environ. Qual. 2009, 38, 1930–1941. [Google Scholar] [CrossRef]
  7. Sinha, E.; Michalak, A.M.; Balaji, V. Eutrophication will increase during the 21st century as a result of precipitation changes. Science 2017, 357, 405–408. [Google Scholar] [CrossRef] [Green Version]
  8. Huisman, J.; Codd, G.A.; Paerl, H.W.; Ibelings, B.W.; Verspagen, J.M.H.; Visser, P.M. Cyanobacterial blooms. Nat. Rev. Microbiol. 2018, 16, 471–483. [Google Scholar] [CrossRef]
  9. Muhetaer, G.; Asaeda, T.; Jayasanka, S.M.D.H.; Baniya, M.B.; Abeynayaka, H.D.L.; Rashid, M.H.; Yan, H. Effects of Light Intensity and Exposure Period on the Growth and Stress Responses of Two Cyanobacteria Species: Pseudanabaena galeata and Microcystis aeruginosa. Water 2020, 12, 407. [Google Scholar] [CrossRef] [Green Version]
  10. Pan, G.; Yang, B.; Wang, D.; Chen, H.; Tian, B.; Zhang, M.; Yuan, X.; Chen, J. In-lake algal bloom removal and submerged vegetation restoration using modified local soils. Ecol. Eng. 2011, 37, 302–308. [Google Scholar] [CrossRef]
  11. Dodds, W.K.; Bouska, W.W.; Eitzmann, J.L.; Pilger, T.J.; Pitts, K.L.; Riley, A.J.; Schloesser, J.T.; Thornbrugh, D.J. Eutrophication of U.S. Freshwaters: Analysis of Potential Economic Damages. Environ. Sci. Technol. 2009, 43, 12–19. [Google Scholar] [CrossRef] [PubMed] [Green Version]
  12. Díez-Quijada, L.; Prieto, A.I.; Guzmán-Guillén, R.; Jos, A.; Cameán, A.M. Occurrence and toxicity of microcystin congeners other than MC-LR and MC-RR: A review. Food Chem. Toxicol. 2019, 125, 106–132. [Google Scholar] [CrossRef] [PubMed]
  13. Pearson, L.; Mihali, T.; Moffitt, M.; Kellmann, R.; Neilan, B. On the chemistry, toxicology and genetics of the cyanobacterial toxins, microcystin, nodularin, saxitoxin and cylindrospermopsin. Mar. Drugs 2010, 8, 1650–1680. [Google Scholar] [CrossRef] [PubMed] [Green Version]
  14. Svirčev, Z.; Drobac, D.; Tokodi, N.; Mijović, B.; Codd, G.A.; Meriluoto, J. Toxicology of microcystins with reference to cases of human intoxications and epidemiological investigations of exposures to cyanobacteria and cyanotoxins. Arch. Toxicol. 2017, 91, 621–650. [Google Scholar] [CrossRef]
  15. Buratti, F.M.; Manganelli, M.; Vichi, S.; Stefanelli, M.; Scardala, S.; Testai, E.; Funari, E. Cyanotoxins: Producing organisms, occurrence, toxicity, mechanism of action and human health toxicological risk evaluation. Arch. Toxicol. 2017, 91, 1049–1130. [Google Scholar] [CrossRef]
  16. Carpenter, S.R. Phosphorus control is critical to mitigating eutrophication. Proc. Natl. Acad. Sci. USA 2008, 105, 11039–11040. [Google Scholar] [CrossRef] [Green Version]
  17. Schindler, D.W.; Kling, H.; Schmidt, R.V.; Prokopowich, J.; Frost, V.E.; Reid, R.A.; Capel, M. Eutrophication of Lake 227 by Addition of Phosphate and Nitrate: The Second, Third, and Fourth Years of Enrichment, 1970, 1971, and 1972. J. Fish. Res. Board Can. 1973, 30, 1415–1440. [Google Scholar] [CrossRef]
  18. Li, J.; Hansson, L.-A.; Persson, K. Nutrient Control to Prevent the Occurrence of Cyanobacterial Blooms in a Eutrophic Lake in Southern Sweden, Used for Drinking Water Supply. Water 2018, 10, 919. [Google Scholar] [CrossRef] [Green Version]
  19. Welch, E.B.; Cooke, G.D. Internal phosphorus loading in shallow lakes: Importance and control. Lake Reserv. Manag. 2005, 21, 209–217. [Google Scholar] [CrossRef] [Green Version]
  20. Huser, B.J.; Futter, M.; Lee, J.T.; Perniel, M. In-lake measures for phosphorus control: The most feasible and cost-effective solution for long-term management of water quality in urban lakes. Water Res. 2016, 97, 142–152. [Google Scholar] [CrossRef]
  21. Osgood, R.A. Inadequacy of best management practices for restoring eutrophic lakes in the United States: Guidance for policy and practice. Inland Waters 2017, 7, 401–407. [Google Scholar] [CrossRef]
  22. Lürling, M.; Mucci, M. Mitigating eutrophication nuisance: In-lake measures are becoming inevitable in eutrophic waters in the Netherlands. Hydrobiologia 2020. [Google Scholar] [CrossRef]
  23. Douglas, G.B.; Hamilton, D.P.; Robb, M.S.; Pan, G.; Spears, B.M.; Lurling, M. Guiding principles for the development and application of solid-phase phosphorus adsorbents for freshwater ecosystems. Aquat. Ecol. 2016, 50, 385–405. [Google Scholar] [CrossRef] [Green Version]
  24. Kelly Vargas, K.G.; Qi, Z. P immobilizing materials for lake internal loading control: A review towards future developments. Crit. Rev. Environ. Sci. Technol. 2019, 49, 518–552. [Google Scholar] [CrossRef]
  25. Dziga, D.; Maksylewicz, A.; Maroszek, M.; Marek, S. Combined treatment of toxic cyanobacteria Microcystis aeruginosa with hydrogen peroxide and microcystin biodegradation agents results in quick toxin elimination. Acta Biochim. Pol. 2018, 65, 133–140. [Google Scholar] [CrossRef] [Green Version]
  26. Peterson, S.A. Lake Restoration by Sediment Removal. JAWRA J. Am. Water Resour. Assoc. 1982, 18, 423–436. [Google Scholar] [CrossRef]
  27. Lürling, M.; van Oosterhout, F. Controlling eutrophication by combined bloom precipitation and sediment phosphorus inactivation. Water Res. 2013, 47, 6527–6537. [Google Scholar] [CrossRef]
  28. Noyma, N.P.; de Magalhaes, L.; Furtado, L.L.; Mucci, M.; van Oosterhout, F.; Huszar, V.L.M.; Marinho, M.M.; Lürling, M. Controlling cyanobacterial blooms through effective flocculation and sedimentation with combined use of flocculants and phosphorus adsorbing natural soil and modified clay. Water Res. 2016, 97, 26–38. [Google Scholar] [CrossRef]
  29. Miranda, M.; Noyma, N.P.; Pacheco, F.S.; de Magalhães, L.; Pinto, E.; Santos, S.; Soares, M.F.A.; Huszar, V.L.; Lürling, M.; Marinho, M.M. The efficiency of combined coagulant and ballast to remove harmful cyanobacterial blooms in a tropical shallow system. Harmful Algae 2017, 65, 27–39. [Google Scholar] [CrossRef]
  30. Noyma, N.P.; De Magalhães, L.; Miranda, M.; Mucci, M.; van Oosterhout, F.; Huszar, V.L.M.; Marinho, M.M.; Lima, E.R.A.; Lürling, M. Coagulant plus ballast technique provides a rapid mitigation of cyanobacterial nuisance. PLoS ONE 2017, 12. [Google Scholar] [CrossRef]
  31. Waajen, G.; van Oosterhout, F.; Douglas, G.; Lürling, M. Management of eutrophication in Lake De Kuil (The Netherlands) using combined flocculant—Lanthanum modified bentonite treatment. Water Res. 2016, 97, 83–95. [Google Scholar] [CrossRef] [PubMed]
  32. Pan, G.; Miao, X.; Bi, L.; Zhang, H.; Wang, L.; Wang, L.; Wang, Z.; Chen, J.; Ali, J.; Pan, M.; et al. Modified Local Soil (MLS) technology for harmful algal bloom control, sediment remediation, and ecological restoration. Water 2019, 11, 1123. [Google Scholar] [CrossRef] [Green Version]
  33. van Oosterhout, F.; Waajen, G.; Yasseri, S.; Manzi Marinho, M.; Pessoa Noyma, N.; Mucci, M.; Douglas, G.; Lürling, M. Lanthanum in Water, Sediment, Macrophytes and chironomid larvae following application of Lanthanum modified bentonite to lake Rauwbraken (The Netherlands). Sci. Total Environ. 2020, 706, 135188. [Google Scholar] [CrossRef]
  34. Lürling, M.; Kang, L.; Mucci, M.; van Oosterhout, F.; Noyma, N.P.; Miranda, M.; Huszar, V.L.M.; Waajen, G.; Marinho, M.M. Coagulation and precipitation of cyanobacterial blooms. Ecol. Eng. 2020, 158, 106032. [Google Scholar] [CrossRef]
  35. de Magalhães, L.; Noyma, N.P.; Furtado, L.L.; Mucci, M.; van Oosterhout, F.; Huszar, V.L.M.; Marinho, M.M.; Lürling, M. Efficacy of Coagulants and Ballast Compounds in Removal of Cyanobacteria (Microcystis) from Water of the Tropical Lagoon Jacarepaguá (Rio de Janeiro, Brazil). Estuar. Coast 2017, 40, 121–133. [Google Scholar] [CrossRef]
  36. de Lucena-Silva, D.; Molozzi, J.; Severiano, J.d.S.; Becker, V.; de Lucena Barbosa, J.E. Removal efficiency of phosphorus, cyanobacteria and cyanotoxins by the “flock & sink” mitigation technique in semi-arid eutrophic waters. Water Res. 2019, 159, 262–273. [Google Scholar] [CrossRef]
  37. Mucci, M.; Noyma, N.P.; de Magalhaes, L.; Miranda, M.; van Oosterhout, F.; Guedes, I.A.; Huszar, V.L.M.; Marinho, M.M.; Lurling, M. Chitosan as coagulant on cyanobacteria in lake restoration management may cause rapid cell lysis. Water Res. 2017, 118, 121–130. [Google Scholar] [CrossRef]
  38. Yu, Z.; Song, X.; Cao, X.; Liu, Y. Mitigation of harmful algal blooms using modified clays: Theory, mechanisms, and applications. Harmful Algae 2017, 69, 48–64. [Google Scholar] [CrossRef]
  39. Li, H.; Pan, G. Simultaneous Removal of Harmful Algal Blooms and Microcystins Using Microorganism- and Chitosan-Modified Local Soil. Environ. Sci. Technol. 2015, 49, 6249–6256. [Google Scholar] [CrossRef] [Green Version]
  40. Xu, F.; Zhu, W.; Xiao, M.; Li, M. Interspecific variation in extracellular polysaccharide content and colony formation of Microcystis spp. cultured under different light intensities and temperatures. J. Appl. Phycol. 2016, 28, 1533–1541. [Google Scholar] [CrossRef]
  41. Lürling, M.; Noyma, N.P.; de Magalhães, L.; Miranda, M.; Mucci, M.; van Oosterhout, F.; Huszar, V.L.M.; Marinho, M.M. Critical assessment of chitosan as coagulant to remove cyanobacteria. Harmful Algae 2017, 66, 1–12. [Google Scholar] [CrossRef] [PubMed]
  42. Carlson, R.E. A trophic state index for lakes. Limnol. Oceanogr. 1977, 22, 361–369. [Google Scholar] [CrossRef] [Green Version]
  43. Komárek, J.; Kaštovský, J.; Mareš, J.; Johansen, J. Taxonomic classification of cyanoprokaryotes (cyanobacterial genera) 2014, using a polyphasic approach. Preslia 2014, 86, 295–335. [Google Scholar]
  44. Aguilera, A.; Gómez, E.B.; Kaštovský, J.; Echenique, R.O.; Salerno, G.L. The polyphasic analysis of two native Raphidiopsis isolates supports the unification of the genera Raphidiopsis and Cylindrospermopsis (Nostocales, Cyanobacteria). Phycologia 2018, 57, 130–146. [Google Scholar] [CrossRef]
  45. Ozaki, K.; Ito, E.; Tanabe, S.; Natsume, K.; Tsuji, K.; Harada, K. Electron Microscopic Study on Lysis of a Cyanobacterium Microcystis. J. Health Sci. 2009, 55, 578–585. [Google Scholar] [CrossRef] [Green Version]
  46. Reynolds, C.S.; Oliver, R.L.; Walsby, A.E. Cyanobacterial dominance: The role of buoyancy regulation in dynamic lake environments. N. Z. J. Mar. Freshw. Res. 1987, 21, 379–390. [Google Scholar] [CrossRef]
  47. Deacon, C.; Walsby, A.E. Gas vesicle formation in the dark, and in light of different irradiances, by the cyanobacterium Microcystis sp. Br. Phycol. J. 1990, 25, 133–139. [Google Scholar] [CrossRef]
  48. Oliver, R.L.; Walsby, A.E. Direct evidence for the role of light-mediated gas vesicle collapse in the buoyancy regulation of Anabaena flos-aquae (cyanobacteria)1. Limnol. Oceanogr. 1984, 29, 879–886. [Google Scholar] [CrossRef]
  49. Wallace, B.B.; Hamilton, D.P. The effect of variations in irradiance on buoyancy regulation in Microcystis aeruginosa. Limnol. Oceanogr. 1999, 44, 273–281. [Google Scholar] [CrossRef] [Green Version]
  50. Harke, M.J.; Steffen, M.M.; Gobler, C.J.; Otten, T.G.; Wilhelm, S.W.; Wood, S.A.; Paerl, H.W. A review of the global ecology, genomics, and biogeography of the toxic cyanobacterium, Microcystis spp. Harmful Algae 2016, 54, 4–20. [Google Scholar] [CrossRef] [Green Version]
  51. Li, M.; Nkrumah, P.N.; Xiao, M. Biochemical composition of Microcystis aeruginosa related to specific growth rate: Insight into the effects of abiotic factors. Inland Waters 2014, 4, 357–362. [Google Scholar] [CrossRef] [Green Version]
  52. Yang, Z.; Kong, F.; Shi, X.; Zhang, M.; Xing, P.; Cao, H. Changes in the morphology and polysaccharide content of microcystis aeruginosa (cyanobacteria) during flagellate grazing. J. Phycol. 2008, 44, 716–720. [Google Scholar] [CrossRef] [PubMed]
  53. Burkert, U.; Hyenstrand, P.; Drakare, S.; Blomqvist, P. Effects of the mixotrophic flagellate Ochromonas sp. on colony formation in Microcystis aeruginosa. Aquat. Ecol. 2001, 35, 11–17. [Google Scholar] [CrossRef]
  54. Yang, Zhen; Kong, Fanxiang; Yang, Zhou; Zhang, Min; Yu, Yang; Qian, Shanqin Benefits and costs of the grazer-induced colony formation in Microcystis aeruginosa. Ann. Limnol. Int. J. Lim. 2009, 45, 203–208. [CrossRef] [Green Version]
  55. Wang, X.; Qin, B.; Gao, G.; Paerl, H.W. Nutrient enrichment and selective predation by zooplankton promote Microcystis (Cyanobacteria) bloom formation. J. Plankton Res. 2010, 32, 457–470. [Google Scholar] [CrossRef]
  56. Duan, Z.; Tan, X.; Parajuli, K.; Upadhyay, S.; Zhang, D.; Shu, X.; Liu, Q. Colony formation in two Microcystis morphotypes: Effects of temperature and nutrient availability. Harmful Algae 2018, 72, 14–24. [Google Scholar] [CrossRef]
  57. Sato, M.; Omori, K.; Datta, T.; Amano, Y.; Machida, M. Influence of Extracellular Polysaccharides and Calcium Ion on Colony Formation of Unicellular Microcystis aeruginosa. Environ. Eng. Sci. 2016, 34, 149–157. [Google Scholar] [CrossRef]
  58. Bi, X.; Zhang, S.; Dai, W.; Xing, K.; Yang, F. Effects of lead(II) on the extracellular polysaccharide (EPS) production and colony formation of cultured Microcystis aeruginosa. Water Sci. Technol. 2013, 67, 803–809. [Google Scholar] [CrossRef]
  59. Reynolds, C.S.; Jaworski, G.H.M.; Cmiech, H.A.; Leedale, G.F.; Lund, J.W.G. On the annual cycle of the blue-green alga Microcystis Aeruginosa Kütz. Emend. Elenkin. Philos. Trans. R. Soc. Lond. B Biol. Sci. 1981, 293, 419–477. [Google Scholar] [CrossRef]
  60. Xiao, M.; Li, M.; Reynolds, C.S. Colony formation in the cyanobacterium Microcystis. Biol. Rev. 2018, 93, 1399–1420. [Google Scholar] [CrossRef] [PubMed] [Green Version]
  61. Fang, F.; Yang, L.; Gan, L.; Guo, L.; Hu, Z.; Yuan, S.; Chen, Q.; Jiang, L. DO, pH, and Eh microprofiles in cyanobacterial granules from Lake Taihu under different environmental conditions. J. Appl. Phycol. 2014, 26, 1689–1699. [Google Scholar] [CrossRef]
  62. Spoof, L.; Jaakkola, S.; Važić, T.; Häggqvist, K.; Kirkkala, T.; Ventelä, A.-M.; Kirkkala, T.; Svirčev, Z.; Meriluoto, J. Elimination of cyanobacteria and microcystins in irrigation water—effects of hydrogen peroxide treatment. Environ. Sci. Pollut. Res. 2020, 27, 8638–8652. [Google Scholar] [CrossRef] [PubMed] [Green Version]
  63. Gregory, J.; Duan, J. Hydrolyzing metal salts as coagulants. Pure Appl. Chem. 2001, 73, 2017–2026. [Google Scholar] [CrossRef] [Green Version]
  64. Duan, J.; Gregory, J. Coagulation by hydrolysing metal salts. Adv. Colloid Interface Sci. 2003, 100–102, 475–502. [Google Scholar] [CrossRef]
  65. Gonzalez-Torres, A.; Putnam, J.; Jefferson, B.; Stuetz, R.M.; Henderson, R.K. Examination of the physical properties of Microcystis aeruginosa flocs produced on coagulation with metal salts. Water Res. 2014, 60, 197–209. [Google Scholar] [CrossRef]
  66. Xu, H.; Pei, H.; Xiao, H.; Jin, Y.; Li, X.; Hu, W.; Ma, C.; Sun, J.; Li, H. Behaviors of Microcystis aeruginosa cells during floc storage in drinking water treatment process. Sci. Rep. 2016, 6, 34943. [Google Scholar] [CrossRef] [Green Version]
  67. Yang, J.; Qiao, K.; Lv, J.; Liu, Q.; Nan, F.; Xie, S.; Feng, J. Isolation and Identification of Two Algae-Lysing Bacteria against Microcystis aeruginosa. Water 2020, 12, 2485. [Google Scholar] [CrossRef]
  68. Chow, C.W.K.; Drikas, M.; House, J.; Burch, M.D.; Velzeboer, R.M.A. The impact of conventional water treatment processes on cells of the cyanobacterium Microcystis aeruginosa. Water Res. 1999, 33, 3253–3262. [Google Scholar] [CrossRef]
  69. Drikas, M.; Chow, C.W.K.; House, J.; Burch, M.D. Using coagulation, flocculation, and settling to remove toxic cyanobacteria. J. Am. Water Works Assoc. 2001, 93, 100–111. [Google Scholar] [CrossRef]
  70. Han, J.; Jeon, B.-S.; Park, H.-D. Microcystin release and Microcystis cell damage mechanism by alum treatment with long-term and large dose as in-lake treatment. J. Environ. Sci. Health Part A Toxic/Hazard. Subst. Environ. Eng. 2016, 51, 455–462. [Google Scholar] [CrossRef]
  71. Han, J.; Jeon, B.-S.; Futatsugi, N.; Park, H.-D. The effect of alum coagulation for in-lake treatment of toxic Microcystis and other cyanobacteria related organisms in microcosm experiments. Ecotoxicol. Environ. Saf. 2013, 96, 17–23. [Google Scholar] [CrossRef] [PubMed]
  72. Hamilton, D.P.; Salmaso, N.; Paerl, H.W. Mitigating harmful cyanobacterial blooms: Strategies for control of nitrogen and phosphorus loads. Aquat. Ecol. 2016, 50, 351–366. [Google Scholar] [CrossRef]
  73. Jilbert, T.; Couture, R.-M.; Huser, B.J.; Salonen, K. Preface: Restoration of eutrophic lakes: Current practices and future challenges. Hydrobiologia 2020. [Google Scholar] [CrossRef]
  74. Zamyadi, A.; Greenstein, K.E.; Glover, C.M.; Adams, C.; Rosenfeldt, E.; Wert, E.C. Impact of Hydrogen Peroxide and Copper Sulfate on the Delayed Release of Microcystin. Water 2020, 12, 1105. [Google Scholar] [CrossRef]
  75. Chen, X.; Yang, X.; Yang, L.; Xiao, B.; Wu, X.; Wang, J.; Wan, H. An effective pathway for the removal of microcystin LR via anoxic biodegradation in lake sediments. Water Res. 2010, 44, 1884–1892. [Google Scholar] [CrossRef]
  76. Grützmacher, G.; Wessel, G.; Klitzke, S.; Chorus, I. Microcystin Elimination during Sediment Contact. Environ. Sci. Technol. 2010, 44, 657–662. [Google Scholar] [CrossRef]
  77. Pei, H.-Y.; Ma, C.-X.; Hu, W.-R.; Sun, F. The behaviors of Microcystis aeruginosa cells and extracellular microcystins during chitosan flocculation and flocs storage processes. Bioresour. Technol. 2014, 151, 314–322. [Google Scholar] [CrossRef]
  78. Shen, X.; Yuan, N.; Wang, C. The bioturbation effect of the snail Bellamya aeruginosa on phosphorus immobilisation by drinking water treatment residue in sediment: A long-term continuous flow test. J. Environ. Manag. 2020, 266, 110579. [Google Scholar] [CrossRef]
  79. Huser, B.J.; Bajer, P.G.; Chizinski, C.; Sorensen, P.W. Effects of common carp (Cyprinus carpio) on sediment mixing depth and mobile phosphorus mass in the active sediment layer of a shallow lake. Hydrobiologia 2016, 763, 23–33. [Google Scholar] [CrossRef]
  80. Oliver, R.L.; Thomas, R.H.; Reynolds, C.S.; Walsby, A.E. The Sedimentation of Buoyant Microcystis Colonies Caused by Precipitation with an Iron-Containing Colloid. Proc. R. Soc. Lond. Ser. B Biol. Sci. 1985, 223, 511–528. [Google Scholar]
  81. Gulati, R.D.; Dionisio Pires, L.M.; Van Donk, E. Lake restoration studies: Failures, bottlenecks and prospects of new ecotechnological measures. Limnologica 2008, 38, 233–247. [Google Scholar] [CrossRef] [Green Version]
  82. Huser, B.J.; Egemose, S.; Harper, H.; Hupfer, M.; Jensen, H.; Pilgrim, K.M.; Reitzel, K.; Rydin, E.; Futter, M. Longevity and effectiveness of aluminum addition to reduce sediment phosphorus release and restore lake water quality. Water Res. 2016, 97, 122–132. [Google Scholar] [CrossRef] [PubMed] [Green Version]
  83. Kuster, A.C.; Kuster, A.T.; Huser, B.J. A comparison of aluminum dosing methods for reducing sediment phosphorus release in lakes. J. Environ. Manag. 2020, 261, 110195. [Google Scholar] [CrossRef]
  84. Wang, C.; Gao, S.; Pei, Y.; Zhao, Y. Use of drinking water treatment residuals to control the internal phosphorus loading from lake sediments: Laboratory scale investigation. Chem. Eng. J. 2013, 225, 93–99. [Google Scholar] [CrossRef] [Green Version]
  85. Makris, K.C.; Harris, W.G.; O’Conno, G.A.; Obreza, T.A. Phosphorus Immobilization in Micropores of Drinking-Water Treatment Residuals: Implications for Long-Term Stability. Environ. Sci. Technol. 2004, 38, 6590–6596. [Google Scholar] [CrossRef]
Figure 1. Diagram of experimental stages. In Stage 1, alum doses ranging from 0 to 16 mg Al/L were applied to eutrophic lake water; in Stage 2, the chlorophyll-a concentration was modulated by dilution and alum was dosed from 0 to 6 mg Al/L; in Stage 3, LS ballast was applied at doses from 0 to 400 mg/L; in Stage 4, the combination of low dose of alum (2 mg Al/L) and LS ballast was compared to ballast alone with doses of LS ballast from 0 to 400 mg/L.
Water 13 00111 g001
Figure 2. (A) Local soil ballast after grinding and sieving and SEM images at (B) 100× (C) 1000× and (D) 3000× magnification.
Water 13 00111 g002
Figure 3. Scanning electron microscope images of Microcystis aeruginosa at 3000× magnification following treatment with aluminum sulfate at (A) 0 mg Al/L, (B) 2 mg Al/L, (C) 4 mg Al/L, (D) 6 mg Al/L, (E) 8 mg Al/L, (F) 10 mg Al/L, and (G) 16 mg Al/L.
Water 13 00111 g003
Figure 4. Mean (n = 2) chlorophyll-a concentration (in micrograms per liter) in sample collected from top of experimental unit following treatment of varying doses of coagulant (aluminum sulfate, in mg Al/L) at five different initial concentrations of cyanobacteria. Three of the chlorophyll-a concentrations (451 µg/L, 291 µg/L and 138 µg/L) were created by diluting the raw sample collected for Stage 2 (615 µg/L), while the fifth concentration (403 µg/L) is the data from the raw sample for Stage 1.
Water 13 00111 g004
Figure 5. Scanning electron microscope images of Microcystis aeruginosa at 3000× magnification following addition of LS ballast at (A) 0 mg/L, (B) 50 mg/L, (C) 100 mg/L, (D) 200 mg/L, and (E) 400 mg/L.
Water 13 00111 g005
Figure 6. Mean (n = 3) chlorophyll-a concentrations (in micrograms per liter) in the top 40 mL (light gray bars, positive scale) and bottom 40 mL (dark gray bars, negative scale) sampled from 250-mL cyanobacteria suspensions (mean initial chlorophyll-a concentration = 485 µg/L) and left stagnant for 1h following treatment. Treatment indicated in x-axis label as control (no treatment), Alum (application of 2 mg Al/L of alum), LS (dose of local soil with concentration noted), and Alum + LS (2 mg Al/L of alum combined with local soil at concentration noted). Each dose of LS combined with alum (indicated using diagonal stripe pattern) was compared against equivalent LS dose without alum (indicated using solid pattern).
Water 13 00111 g006
Figure 7. Scanning electron microscope images of Microcystis aeruginosa at 3000× magnification following addition of LS ballast at (A,B) 0 mg/L, (C) 50 mg/L, (D) 100 mg/L, (E) 200 mg/L, and (F) 400 mg/L.
Water 13 00111 g007
Table 1. Initial chlorophyll-a concentrations and cell counts for four experimental stages.
Experimental StageWater Sampling DateMean Chlorophyll-a (Standard Deviation) in µg/L (n = 3)Cell Count (Percentage of Total) in Cells/mL by Genus
MicrocystisCylindrospermopsis
Stage 1May 2020403 (26.7)2.62 × 10⁶ (99.7%)9.16 × 10⁴ (0.3%)
Stage 2June 2020615 (14.2)4.21 × 10⁶ (99.9%)8.33 × 10² (0.1%)
Stage 3July 2020243 (5.4)2.66 × 10⁶ (99.9%)3.33 × 10³ (0.1%)
Stage 4August 2020485 (21.5)2.92 × 10⁶ (99.8%)5.83 × 10³ (0.2%)
Table 2. pH, chlorophyll-a (micrograms per liter), and zeta potential (mV) in the samples collected from the top and bottom of the experimental units following dosing with coagulant (aluminum sulfate, alum, in mg Al/L) only. The mean (n = 3) and standard deviation (SD) of the initial chlorophyll-a concentration and pH of the lake water were 403 (26) µg/L and 8.32 (0.05), respectively. The mean (n = 3) and SD (in parentheses) for the parameters measured from experimentation are reported below. The weighted average zeta potential was computed using chlorophyll-a for weighting.
Alum Dose (mg Al/L)pHChlorophyll-a (µg/L)Zeta Potential (mV)
TopBottom% Change in Top 1TopBottomWeighted Average
08.32 (0.05)1488 (81)117 (5.6)n/a −10.07 (1.3)−8.59 (0.9)−9.96
27.34 (0.04)1720 (88)140 (18.8)16%−9.85 (2.1)−8.03 (1.2)−9.72
46.97 (0.01)214 (26)1186 (21.4)−86%−9.08 (1.4)−8.94 (1.3)−8.96
66.72 (0.01)110 (16)1950 (42.1)−93%−8.16 (0.5)−7.04 (1.0)−7.10
86.49 (0.03)73 (11)2023 (52.1)−95%−8.82 (0.9−5.29 (2.7)−5.41
106.30 (0.01)22 (4)2143 (84.4)−99%−7.92 (0.9)−4.96 (0.9)−4.99
165.23 (0.23)10 (3)2214 (86.6)−99%−1.86 (0.8) 0.71 (0.2)0.70
Note: 1 = percentage change computed relative to control (alum dose = 0).
Table 3. pH, chlorophyll-a (micrograms per liter), and zeta potential (mV) in the samples collected from the top and bottom of the experimental units following treatment with LS ballast (in mg/L) only. The mean (n = 3) and standard deviation (SD) of the initial chlorophyll-a concentration and pH of the lake water were 243 (5.4) µg/L and 8.54 (0.04), respectively. The mean (n = 3) and SD (in parentheses) of the parameters measured from experimentation are reported below. The weighted average zeta potential was computed using chlorophyll-a for weighting.
LS Dose (mg/L)pHChlorophyll-a (µg/L)Zeta Potential (mV)
TopBottom% Change in Top 1TopBottomWeighted Average
08.54 (0.04)769 (30)114 (0) −10.4 (1.0)−10.6 (1.8)−10.4
508.59 (0.01)765 (30)139 (21)−1%−11.4 (1.7)−10.3 (1.0)−11.2
1008.61 (0.00)748 (17)173 (10)−3%−12.6 (1.3)−10.5 (0.6)−12.2
2008.6 (0.02)654 (10)222 (21)−15%−11.7 (1.2)−10.2 (1.5)−11.3
4008.54 (0.06)611 (51)279 (2)−21%−12.3 (0.8)−10.4 (1.3)−11.7
Note: 1 = percentage change computed relative to control (alum dose = 0).
Publisher’s Note: MDPI stays neutral with regard to jurisdictional claims in published maps and institutional affiliations.

