Article

Effects of Artificial Reefs on Phytoplankton Community Structure in Baiyangdian Lake, China

1
Fishery Machinery and Instrument Research Institute, Chinese Academy of Fishery Sciences, No. 63 Chifeng Road, Yangpu District, Shanghai 200092, China
2
Key Laboratory of Yangtze River Water Environment, Ministry of Education, College of Environmental Science and Engineering, Tongji University, 1239, Siping Road, Shanghai 200092, China
*
Author to whom correspondence should be addressed.
Water 2021, 13(13), 1802; https://doi.org/10.3390/w13131802
Submission received: 15 May 2021 / Revised: 23 June 2021 / Accepted: 27 June 2021 / Published: 29 June 2021
(This article belongs to the Special Issue Lake Ecology and Restoration)

Abstract

:
The habitat and feeding environment of freshwater fish in freshwater lakes have been destroyed, with the problem of miniaturization and simplification of catches being serious. An artificial reef is an effective technical measure to protect and proliferate offshore fishery resources, but little research has been conducted on its application in freshwater lakes. A small artificial reef for freshwater lakes was designed according to the water depth of the lake and the habits of benthic fish. The artificial reef is composed of biomass modules, each of which is 900 × 120 mm. The community structure of phytoplankton around the artificial reef and its adjacent waters was studied. The results showed that 77 species from seven phyla were identified, with a high number of species from the Chlorophyceae. In terms of density composition, the density of cyanobacteria decreased month by month, while the phylum Chlorophyta and Cryptophyta increased first and then decreased. As for biomass composition, Chlorophyta and Cryptophyta increased first and then decreased. RDA analysis showed that water temperature, dissolved oxygen, and total phosphorus were the main influencing factors. To sum up, the artificial reef can improve the algae phase in the surrounding water column, inhibit the growth and reproduction of cyanobacteria to a certain extent, and have a significant enrichment and promotion effect on diatoms. Artificial fish reef affects the phytoplankton community structure of the surrounding water bodies mainly through the absorption of phosphorus nutrients. Artificial reefs can be popularized and applied in freshwater lakes to provide foraging and shelter for benthic fish in the lake.

1. Introduction

Baiyangdian Lake is located in the planning area of Xiong’an New District (XND) in Hebei Province, China. It is situated in the middle of the North China Plain and the middle reaches of the Daqing River in the Haihe River Basin, as the largest freshwater lake in North China [1]. It has ecological functions such as regional water resource storage and regulation, water purification, local climate regulation, flood prevention and mitigation, and conservation of species diversity; thus, it is known as the “Kidney of North China” [2,3]. In recent decades, the Baiyangdian Lake Basin has experienced an arid climate and frequent drying periods [4]. The longest drying period lasted for 5 years and resulted in the destruction of fish stocks, especially those with high economic value. In addition, the number of humans living around Baiyangdian Lake has been increasing year by year, and fishers’ acquisition of aquatic products has also gradually increased [5]. Fishery in Baiyangdian Lake faces declines catches and low species diversity, with catches often being small and juvenile fish of undesirable species and migratory fishes have largely disappeared [6,7]. Protecting fish resources and restoring species diversity in Baiyangdian Lake have become a top priority.
An artificial reef is an important measure to create fish habitats in shallow waters and protect important fish resources [8,9]. The placement of fish reefs changes the abiotic environment of the surrounding waters, thereby causing changes in the biological environment. A fish reef attracts fish and macroinvertebrates to rest, feed, grow, and breed, thus gradually forming a reef ecosystem [10]. Since 2000, artificial reefs have multiplied rapidly in China’s coastal provinces and cities [11]. However, there is relatively little data on the research and application of freshwater artificial reefs in temperate lakes. With the deepening of research on fisheries ecological restoration techniques, the role of freshwater artificial reefs in the restoration of fish resources in lakes has also received increasing attention [12].
In this study, artificial fish reefs suitable for freshwater bodies were designed with Baiyangdian Lake as the research object. The seasonal changes of phytoplankton in the area of artificial reefs were monitored, and phytoplankton in the reef attachments was analyzed in order to provide baseline data and reference for evaluating the restoration effect of the artificial reef and achieving the restoration of the aquatic ecology of Baiyangdian Lake.

2. Materials and Methods

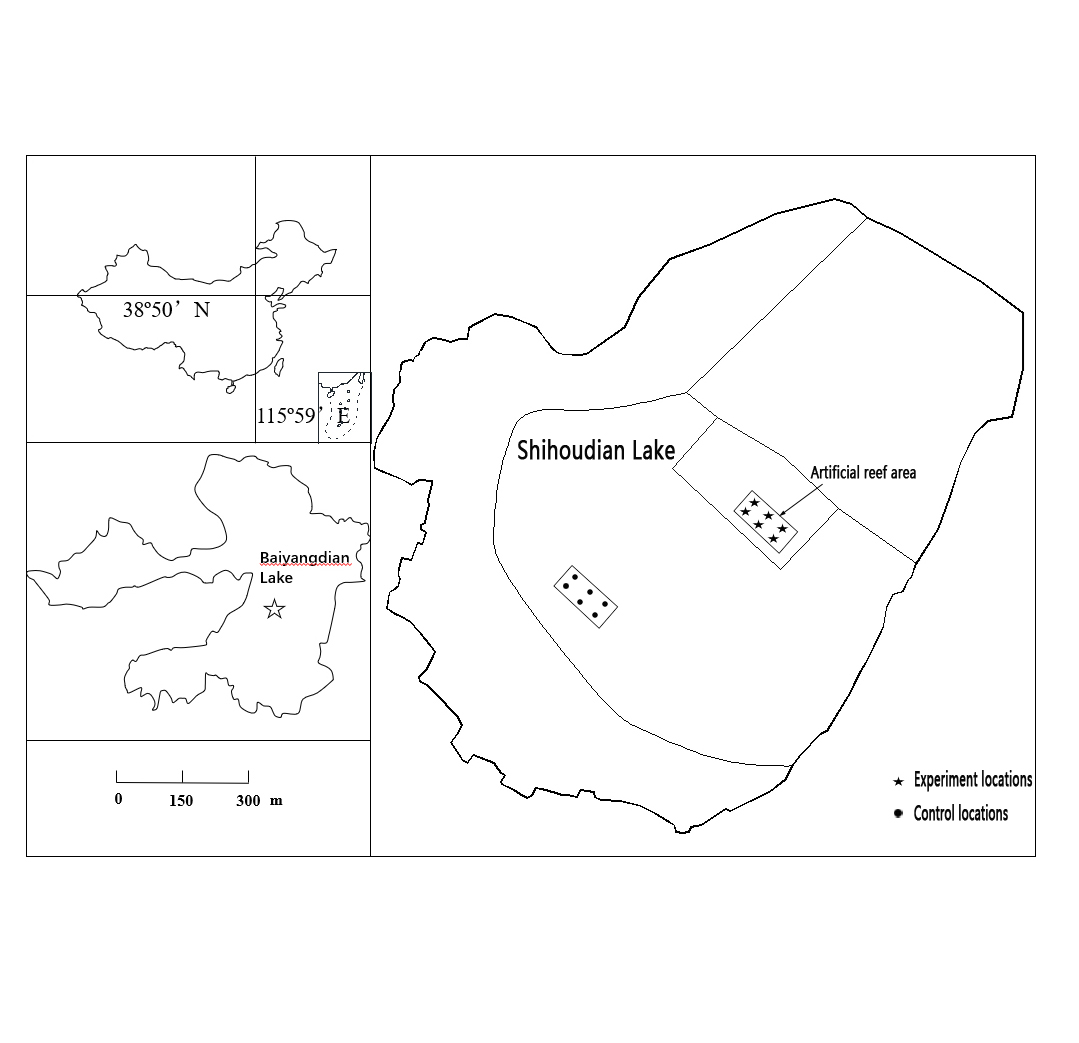
2.1. Study Area and Station Locations

From July 2019 to November 2019, this study was conducted in Shihoudian Lake in the Baiyangdian Lake Basin, located in XND, Baoding City, Hebei Province (38°50′39.39″ N, 115°59′30.04″ E, Figure 1). This lake is one of the five major ecological restoration demonstration areas of the Baiyangdian Hydrobiological Resources Survey and Aquatic Ecological Restoration Demonstration Project conducted by the Ministry of Agriculture and Rural Affairs. Shihoudian Lake is located in the middle of Baiyangdian Lake Basin, surrounded by three villages, with more than 8000 residents, 19 trenches, and 33.3 hm2 reed fields. In this study, 800 artificial reefs were evenly deployed in a 20,000 m2 water area of Shihoudian Lake. This water area was previously a crab farming pond but was abandoned in 2016 due to aquaculture being banned by governments. The depth of water in the area is 3–4 m. After the pond’s dike collapse, this water area has become relatively isolated from the outside water but still connects with it. Six stations were set up in the experimental area in Shihoudian Lake, where the artificial reefs were placed, and six control stations were set up in the water at a distance of 800 m away from the artificial reefs, as shown in Figure 1.

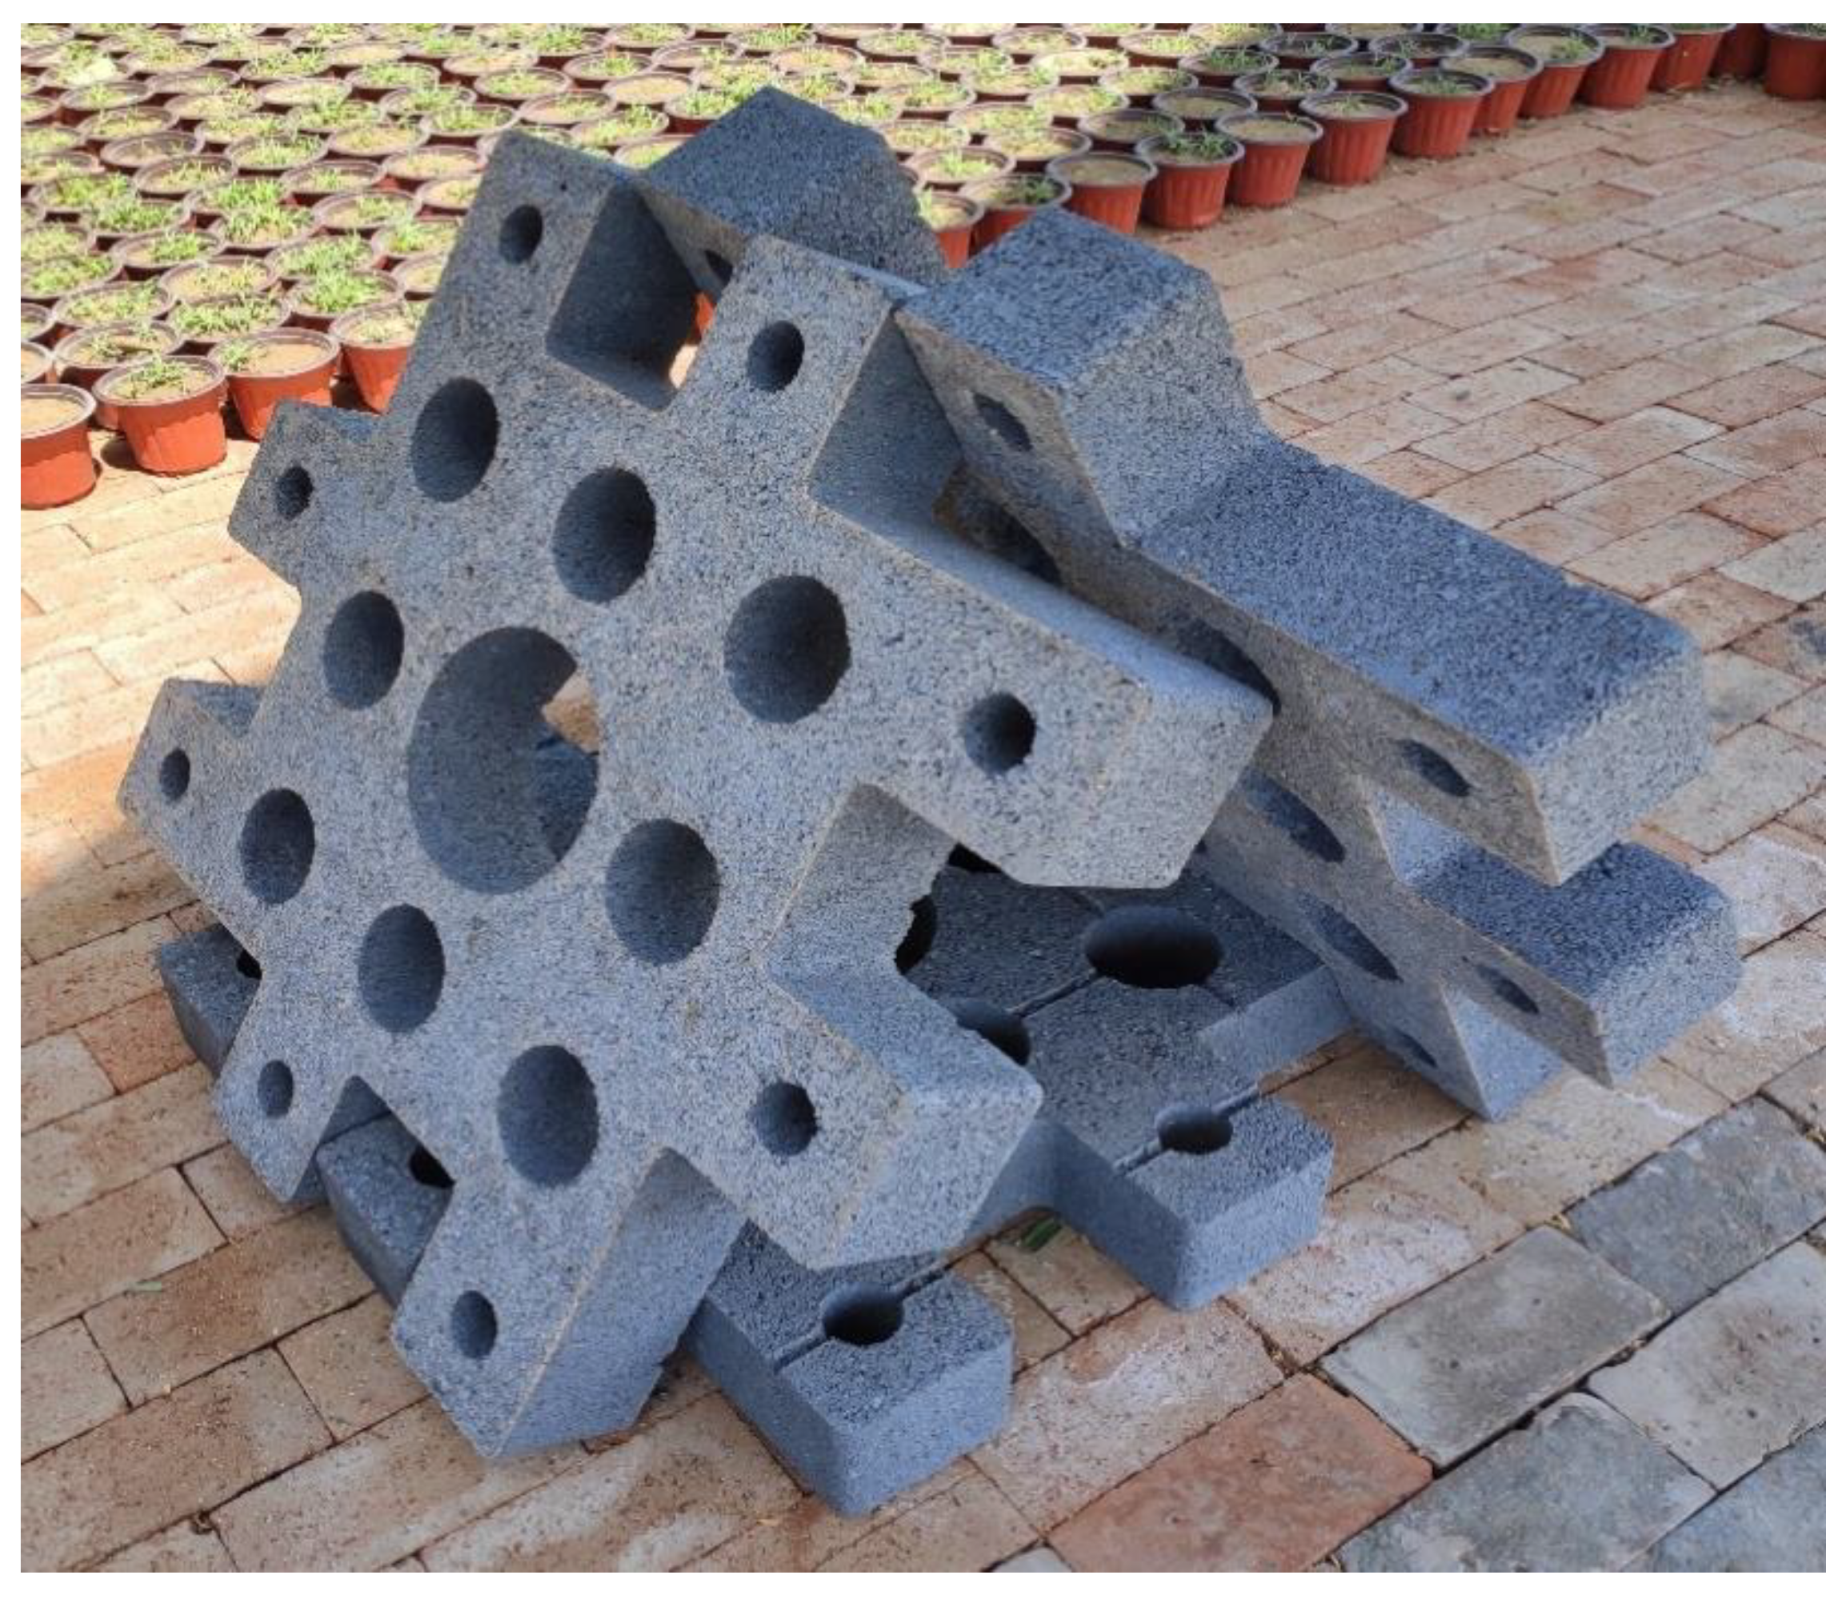
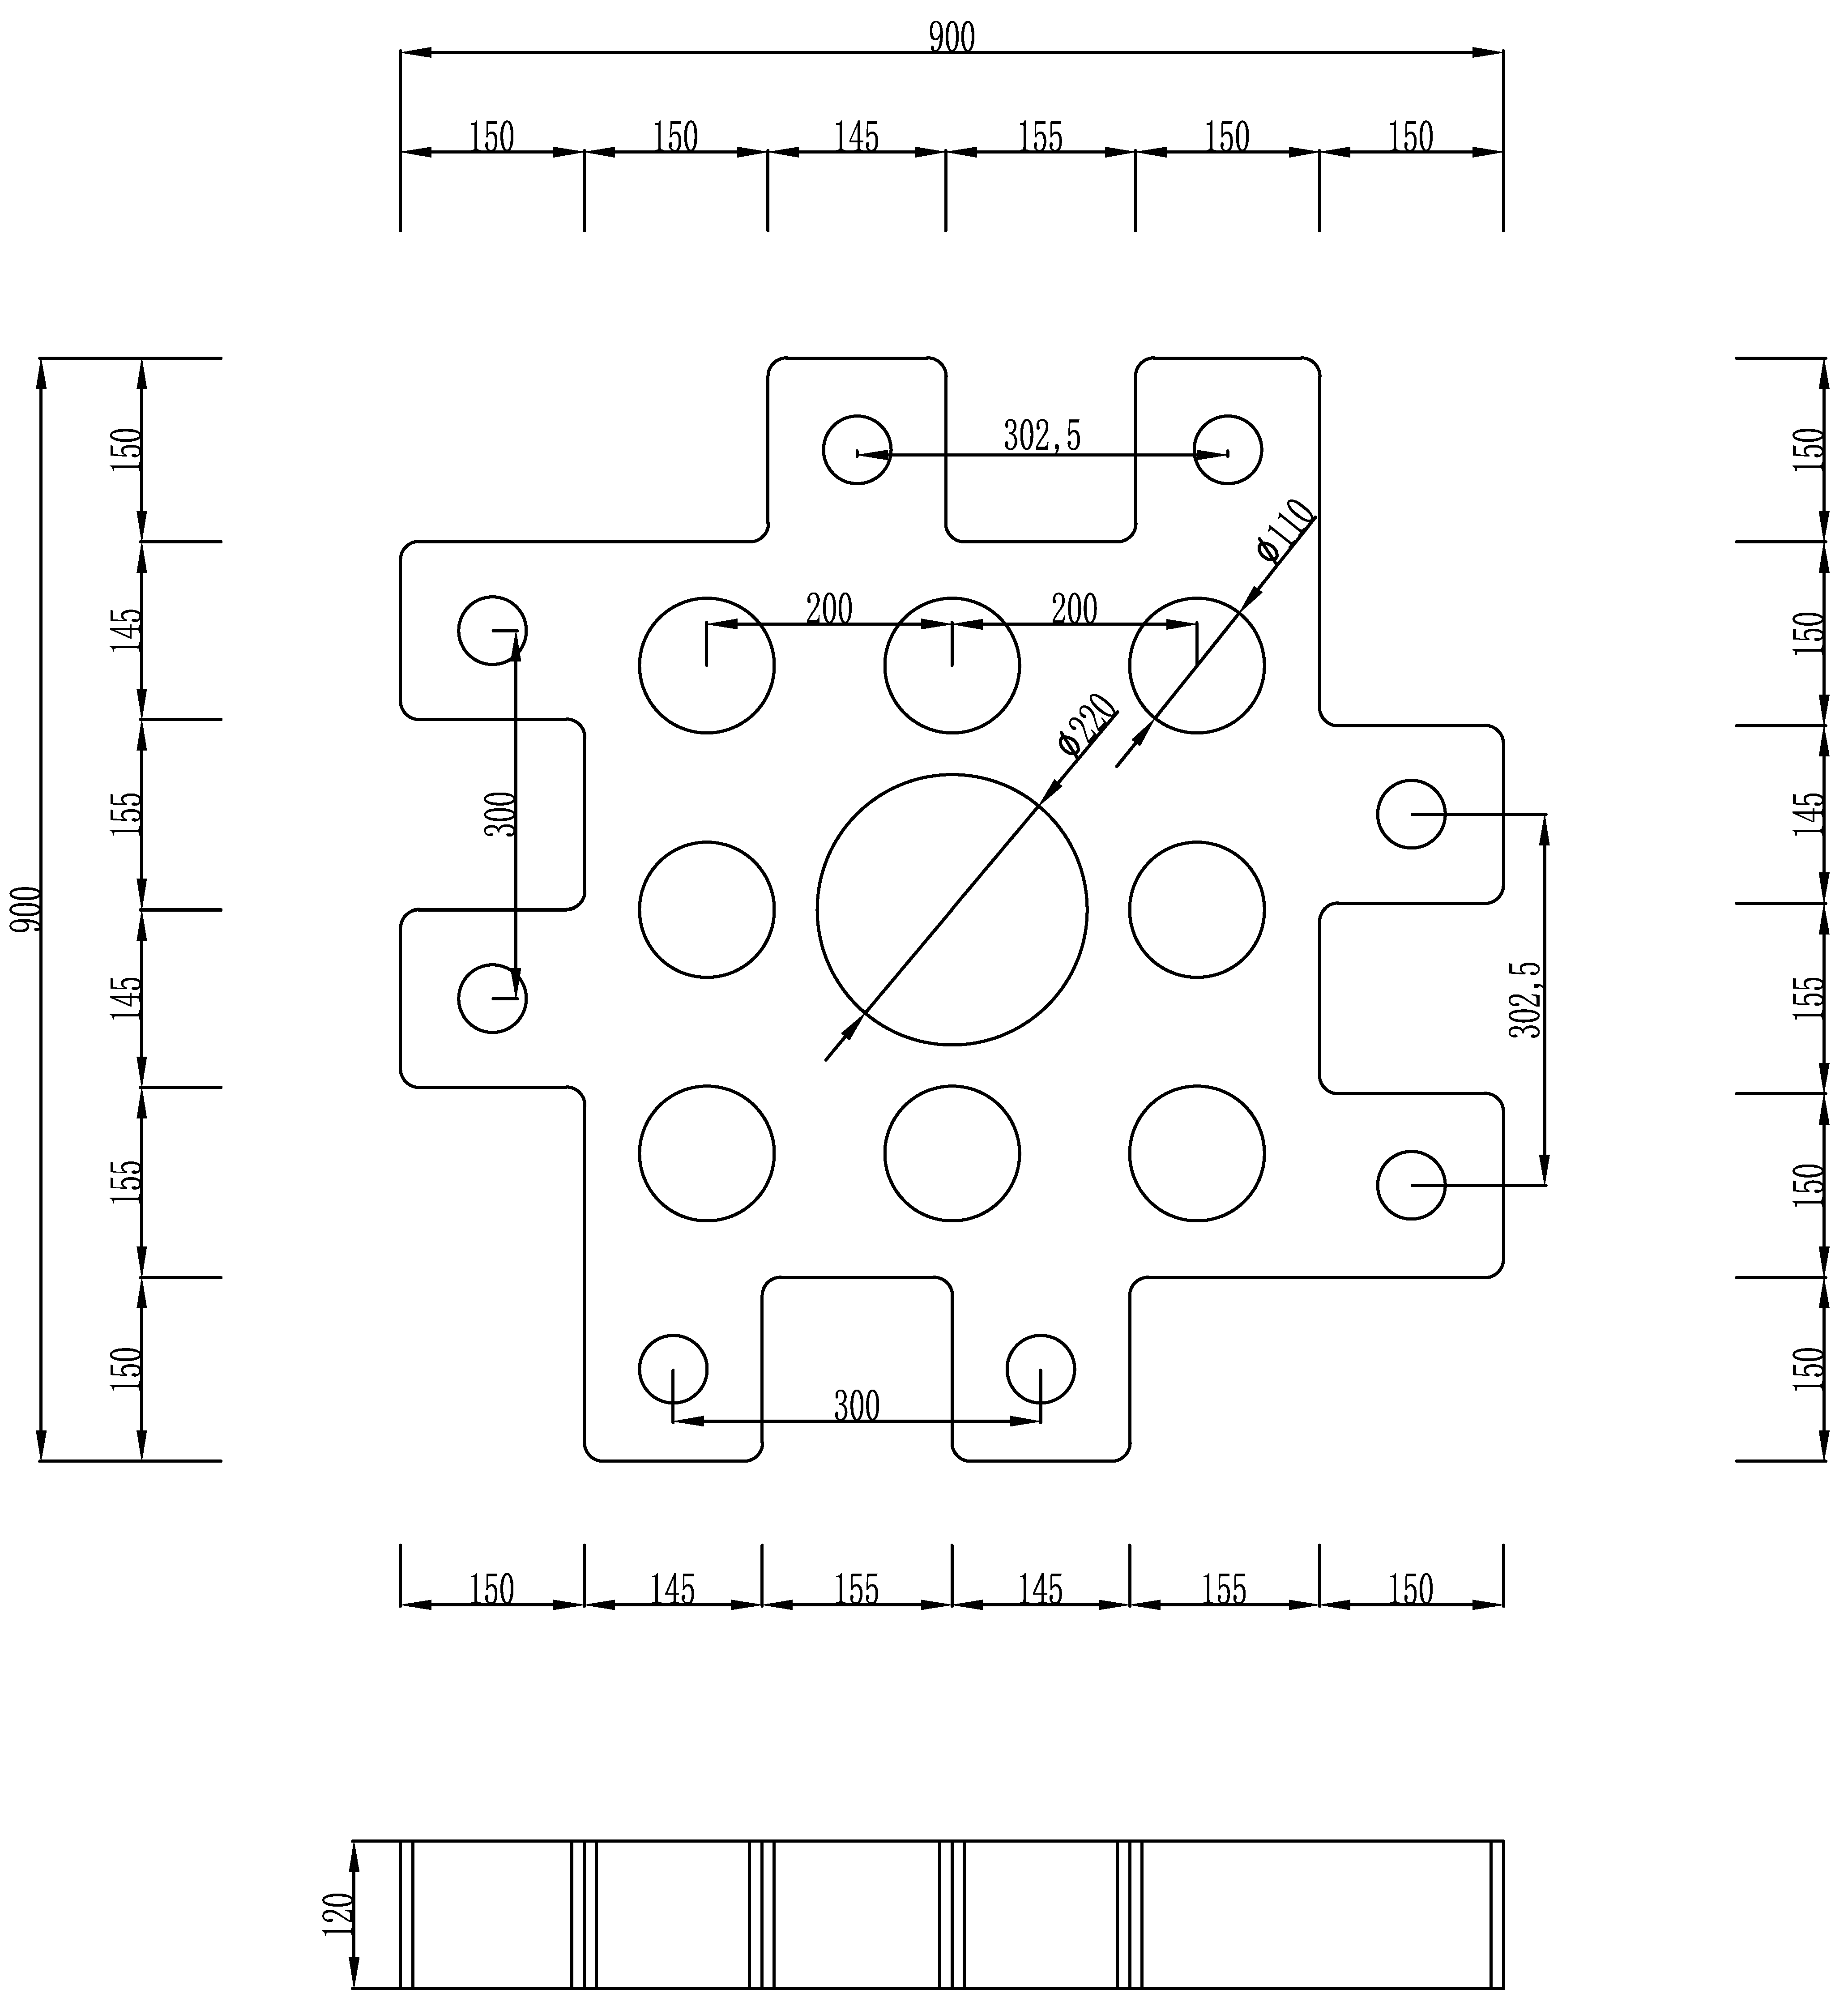
2.2. Design and Layout of Artificial Reefs

The artificial reefs were made of biomass fillers, and the raw materials were mainly from the byproducts of biomass power generation from crop stover and forestry debris. The reefs were made by processing the raw materials, including calcinating at high temperatures (700–1000 °C), crushing, sieving, and molding. The product had irregular particles, and the color was greyish black. The specific surface area of the material was 9.7 m2/g, and the size of a single module was 900 × 900 × 120 mm (Figure 2, Table 1). A round main opening of ø220 mm was set in the center of the module, and eight round auxiliary openings of ø110 mm were evenly distributed around the main opening (Figure 3). Connector slots were set on modules to facilitate assembly and installation. Each artificial reef consisted of three to six modules and was placed at the bottom of the lake.

2.3. Sample Collection and Analysis

Samples were collected once a month from July to November 2019. In total, 12 water samples of 1 L were collected for the phytoplankton analyses by mixing water from the surface, from a depth of 0.5 m, from a depth of 1 m, and from a depth of 0.5 m above the bottom in open waters. Samples were preserved with 1% Lugol’s iodine solution and concentrated to 30 mL after sedimentation for 48 h. An Olympus CX31 optical microscope (Olympus, Tokyo, Japan) was used for plankton species identification. For each taxon, a minimum of 20 cells were detected, and the geometric shape most similar to the cell shape was used to calculate the mean biovolume, which was then transformed into the biomass (expressed as mg/L wet weight) based on an assumed density of 1 g/cm3 [13,14]. Algal cells were identified to the lowest possible taxonomic category (genus or species), then were assigned to the following groups: Cyanophyceae, Chlorophyceae (Chlorococcales), Cryptophyceae + flagellated Chrysophyceae (<20 µm), and others (mainly Bacillariophyceae, Chlorophyceae Zygnematales, and Euglenophyceae). Phytoplankton species identification was referred to as “freshwater algae in China-systematics, taxonomy, and ecology” [15].
The data for six physicochemical environmental factors in the water were also measured and collected at the 12 sampling sites. Water temperature, salinity, dissolved oxygen (DO), and pH were determined by using a portable multimeter (YSI Pro Plus; YSI Incorporated, Ohio, USA) in the field. Water samples were collected in 5 L polypropylene buckets and preserved in the field and in the laboratory until analysis. Total nitrogen (TN) and total phosphorus (TP) in water samples were measured in the laboratory, TP and TN levels were determined by using the alkaline potassium persulfate digestion–UV spectrophotometric method and the ammonium molybdate tetrahydrate spectrophotometry method, respectively [16,17].
The artificial reefs were sampled three times from July to September 2019. The artificial reefs were lifted from the bottom of the water, and a sample of 10 × 10 × 10 cm was brought back to the laboratory. After soaking in 1 L of distilled water for 1 h, a brush was used to wash the attachments off the reef sample. The attachments were fixed with 15 mL of Lugol’s solution for quantitative analysis of their phytoplankton.

2.4. Data Processing

The dominant species of phytoplankton were identified by calculating the dominance index (Y) for each species.
Y = Ni/N × fi
where Ni is the abundance of the i-th species, N is the abundance of all of the species, and fi is the frequency of occurrence of the i-th species.
The dominant species had a value of Y > 0.02 [18].
The indices of the diversity of plankton and fish included the following [19,20].
The Margalef abundance index (D) was calculated according to the following equation:
D = (S−)/ln N
The Shannon–Weaver diversity index was calculated with the following equation:
H′ = − ∑ (Ni/N) ln (Ni/N)
The Pielou’s evenness index was calculated with the following equation:
J = H′/ln S
where Ni is the abundance of the i-th species, N is the abundance of all of the species, and S is the species.

2.5. Data Analysis

The statistical analysis and data plotting were conducted via Excel and SPSS 13.0.
A redundancy analysis (RDA) was performed to analyze the relationship between phytoplankton and environmental factors by using Canoco 5.0 software. The length of the first axis was used to identify the analysis category (>4: canonical correspondence analysis [CCA]; <3: RDA; and 3–4: either of the two [21,22].

3. Results

3.1. Physicochemical Factors of the Water

Table 2 provides values of physicochemical indicators for the reef area at six sampling sites and five sampling dates. The following values were observed: water temperature of the artificial reef area varied from 13.8 to 30.7 °C, salinity from 0.68 to 0.76‰, pH, 8.4–8.97; DO, 7.03–14.54 mg/L; The differences in water temperature, salinity, pH, and dissolved oxygen between the reef area and the control area were minimal. The total nitrogen in July, October, November was higher than that in the control group, lower in August and September than in the control group. Total phosphorus was higher in September, October, and November than that in the control group, and lower in July and August than that in the control group. The effect of reefs on the concentration of nitrogen and phosphorus is month dependent.

3.2. Phytoplankton Composition

A total of 77 species of phytoplankton were identified in the water near the artificial reefs. Prochlorophyta were the most abundant with 39 species (50.6%), followed by Bacillariophyta and Cyanophyta, with 15 species (19.5%) and 11 species (14.3%), respectively. October had the highest number of phytoplankton species (68 species), and December had the lowest (23 species, Table 3).
The dominance index value for dominance species was Y > 0.02. In terms of phytoplankton density and distribution, there were eight dominant species of phytoplankton in this survey, belonging to five phyla, with Cyanophyta having the most dominant species. The dominance of Pyrrophyta was higher in the later stage of the experiment (December, Table 4).

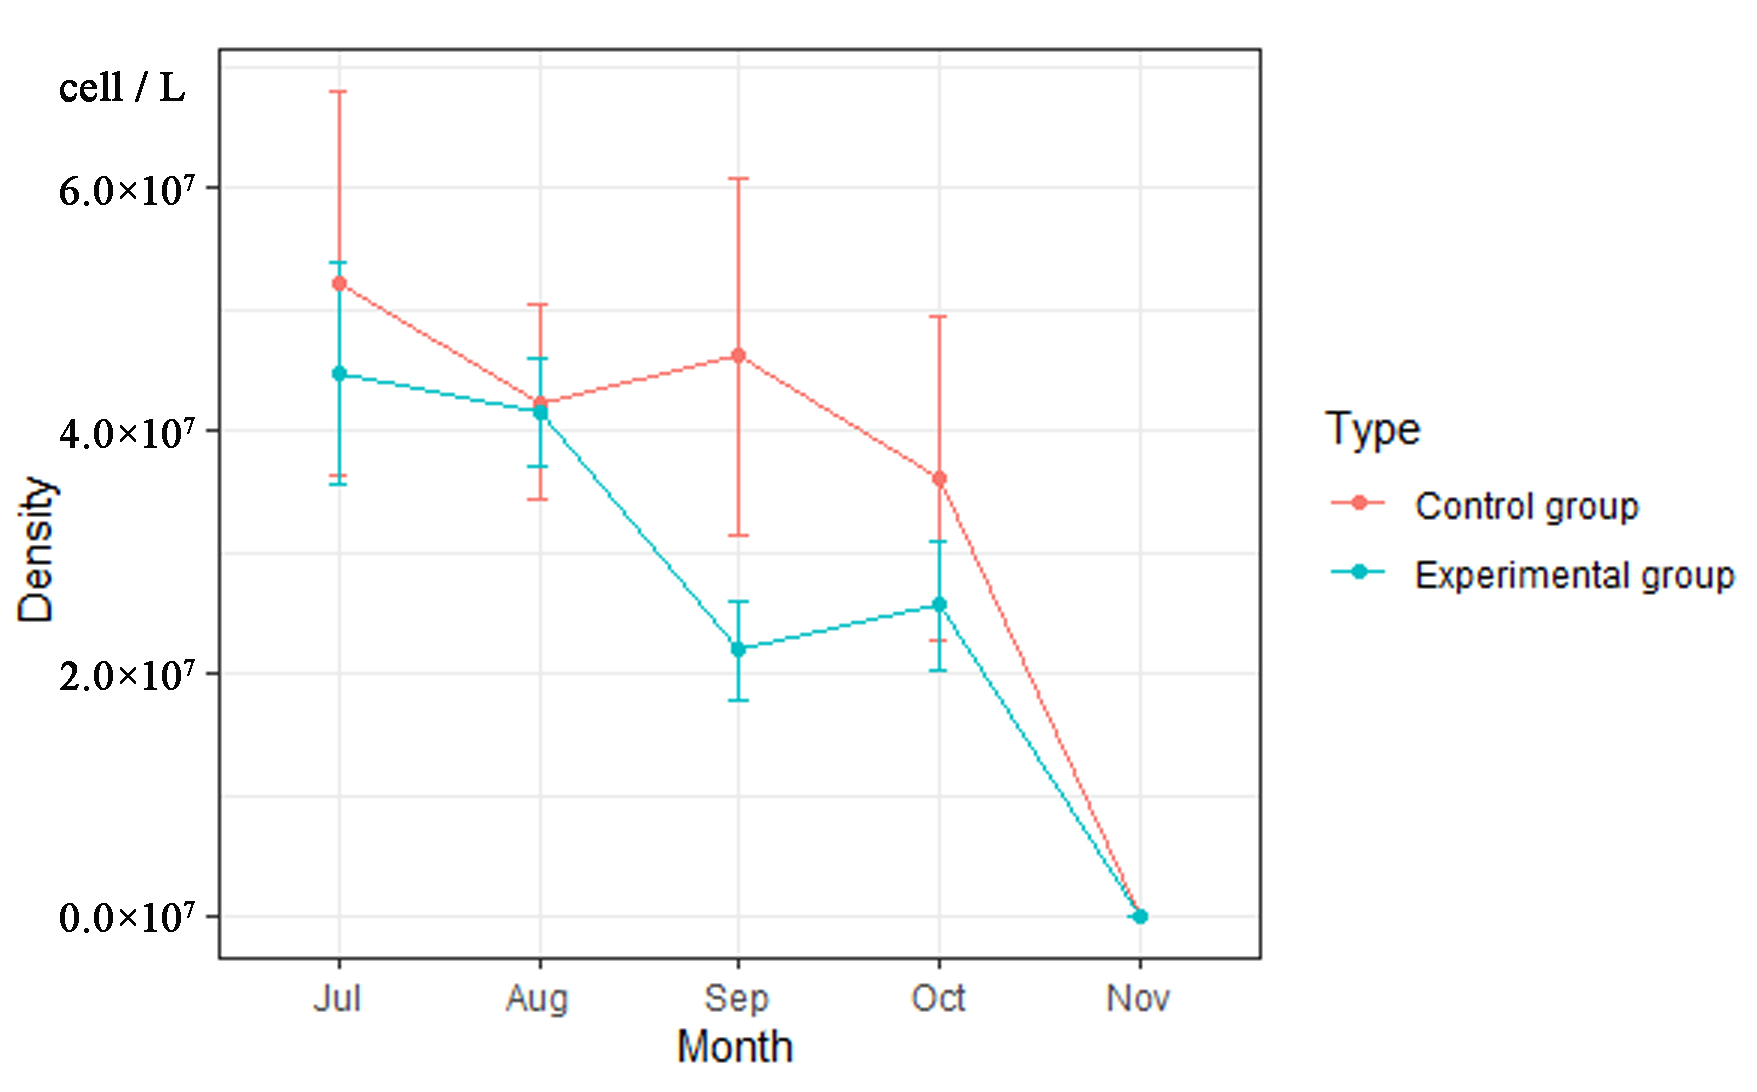
3.3. The Density of Phytoplankton

Table 5 shows the total density of phytoplankton in the water column around the artificial reef. The density of phytoplankton gradually declined over the months, with the highest total density in July and the lowest in November. Cyanophyta had the highest density, followed by Prochlorophyta and Bacillariophyta. The density of Cyanophyta decreased month by month. The density of Prochlorophyta, Bacillariophyta, and Cryptophyta increased first and then decreased. The density of Prochlorophyta peaked in August, and the density of Bacillariophyta and Cryptophyta peaked in September. The proportion of Cyanophyta in the phytoplankton density declined, while the proportions of Prochlorophyta and Bacillariophyta increased. Total phytoplankton density decreased to varying degrees in the experimental group, compared to the control group, but the differences were not significant. In November, the phytoplankton densities of the experimental group and the control group were similar (Figure 4).

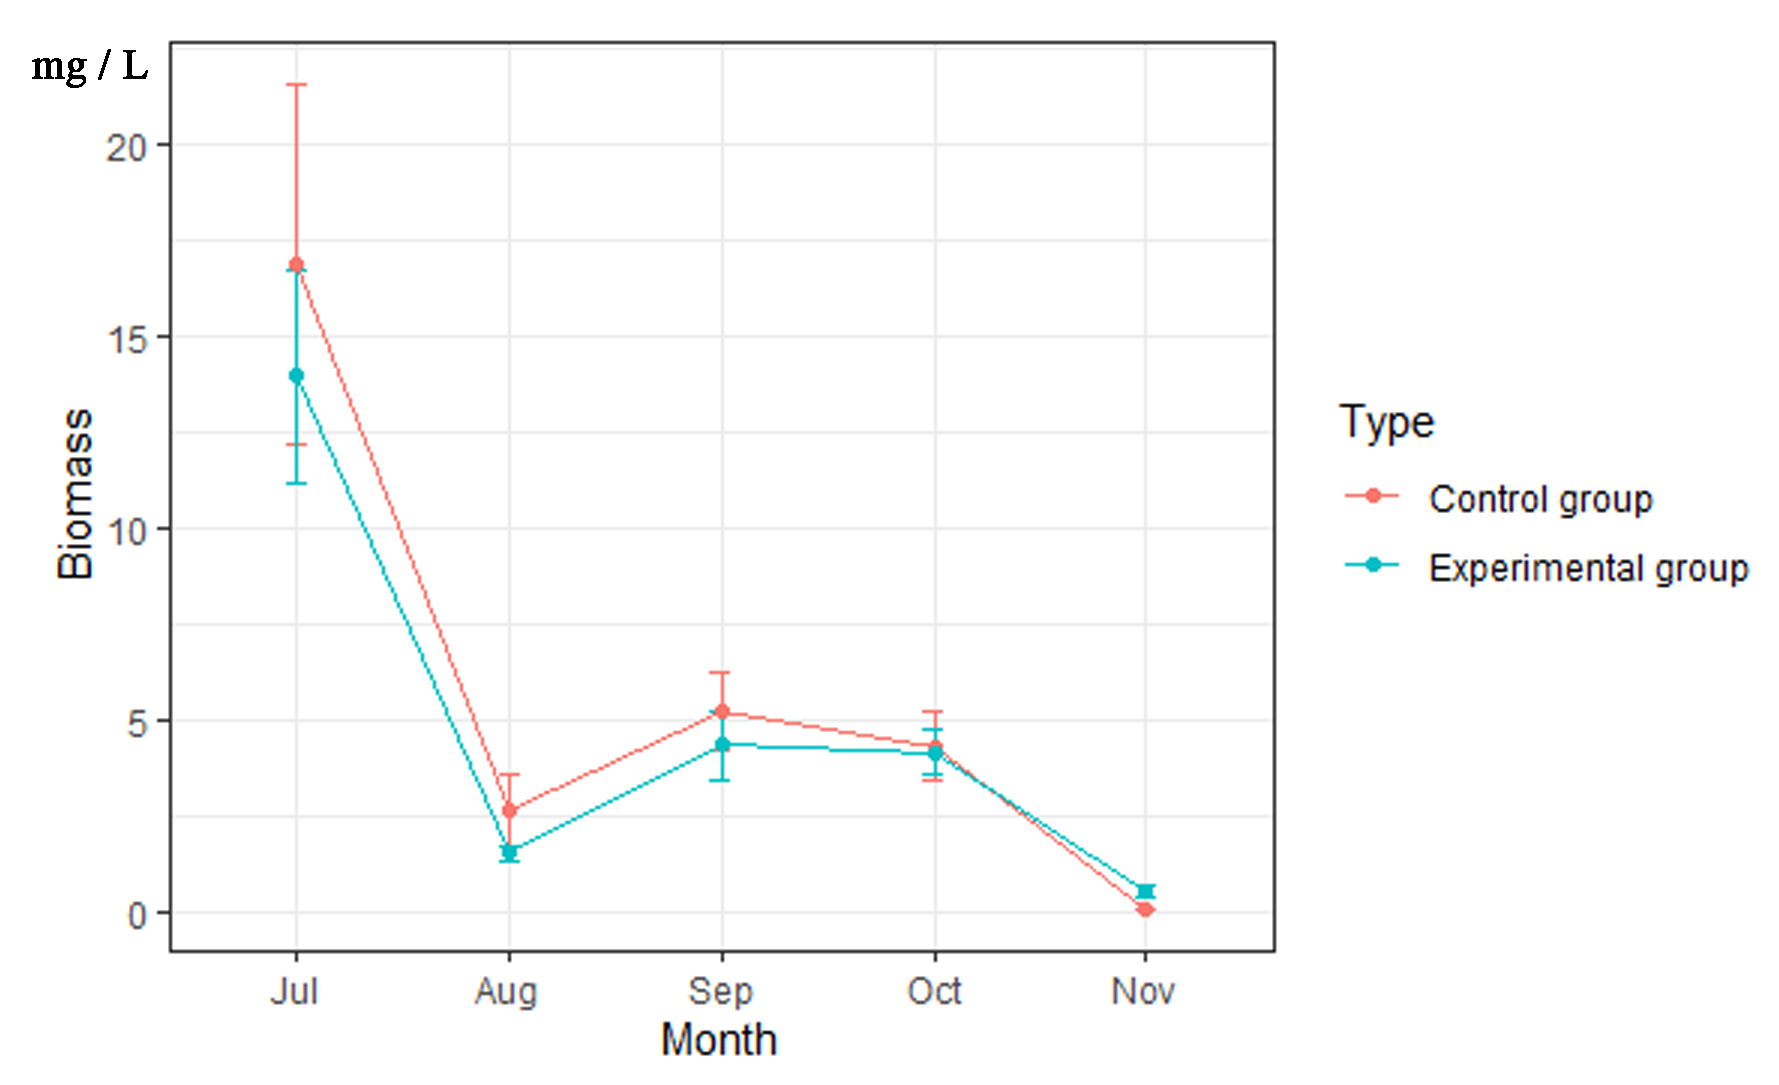
3.4. Phytoplankton Biomass

The total biomass of phytoplankton in the water surrounding the artificial reefs is shown in Table 6. The phytoplankton biomass gradually declined gradually over the months. The highest biomass was recorded in July and the lowest in November. Cyanophyta had the highest biomass, followed by Prochlorophyta and Bacillariophyta. The biomass of Prochlorophyta, Bacillariophyta, and Cryptophyta increased first and then decreased. The biomass of Prochlorophyta peaked in August and that of Bacillariophyta and Cryptophyta peaked in September. The proportion of Cyanophyta in the phytoplankton biomass decreased, while the proportions of Prochlorophyta and Bacillariophyta increased. The changing patterns of phytoplankton biomass and density were inconsistent, as the proportion of large individuals of Pyrrophyta and Euglenophyta increased from September to November. Compared with that in the control group, the phytoplankton biomass in the experimental group decreased to varying degrees, but the difference was not significant. In November, the phytoplankton biomass of the experimental and control groups was close (Figure 5).

3.5. Phytoplankton Diversity Indices

The seasonal variation in the phytoplankton biodiversity indices is shown in Table 7. The Shannon–Wiener diversity index ranged from 0.16–1.26, with an annual mean of 0.71. The highest and lowest values occurred in November and July, respectively. Pielou’s evenness index varied between 0.06 and 0.31, and the annual average was 0.12. Its highest and lowest values were in November and August, respectively. Margalef’s richness index varied from 0.88 to 2.11, with an annual average of 1.35. Its highest and lowest values were in November and July, respectively. Putting these together, the Shannon–Wiener diversity index and Pielou’s evenness index increased month by month, and Margalef’s richness index first increased and then decreased, which may be related to the decrease of phytoplankton cell density and biomass.

3.6. The Density and Biomass of Attached Phytoplankton

A total of 45 phytoplankton species of 7 phyla were identified in the attachments of artificial reefs, i.e., 32 species fewer than that of the surrounding water. Among them, there were 5 species of Cyanophyta, 14 species of Prochlorophyta, and 19 species of Bacillariophyta. The phytoplankton densities for the three rounds of sampling were 1.63 × 10⁶ cells/L, 2.62 × 10⁶ cells/L, and 3.07 × 10⁶ cells/L, respectively. The phytoplankton densities in the adhesions were relatively low, compared to the waters around the artificial reef. However, the densities of Prochlorophyta and Bacillariophyta were relatively high at 16.62% and 55.68%, respectively (Table 8). The density of phytoplankton attached to the artificial reef varied considerably between sampling times. Three rounds of sampling revealed a gradual increase in the density of Bacillariophyta cells. At the first sampling round, Cyanophyta had the highest densities, followed by Bacillariophyta and Prochlorophyta. In the second and third rounds of sampling, the highest densities of Bacillariophyta were found.
The biomasses of phytoplankton attached to artificial reefs are shown in Table 9. The biomass of phytoplankton attached to artificial reefs in the three samplings was 1.18 mg/L, 2.90 mg/L, and 3.18 mg/L, respectively. The biomass of Bacillariophyta was the greatest, with its biomass proportions at the three sampling sites being 73.36%, 53.45%, and 71.03%, respectively. The proportions of Cyanophyta and Prochlorophyta were small, and the proportions of Cryptophyta, Euglenophyta, and Pyrrophyta increased gradually over time.

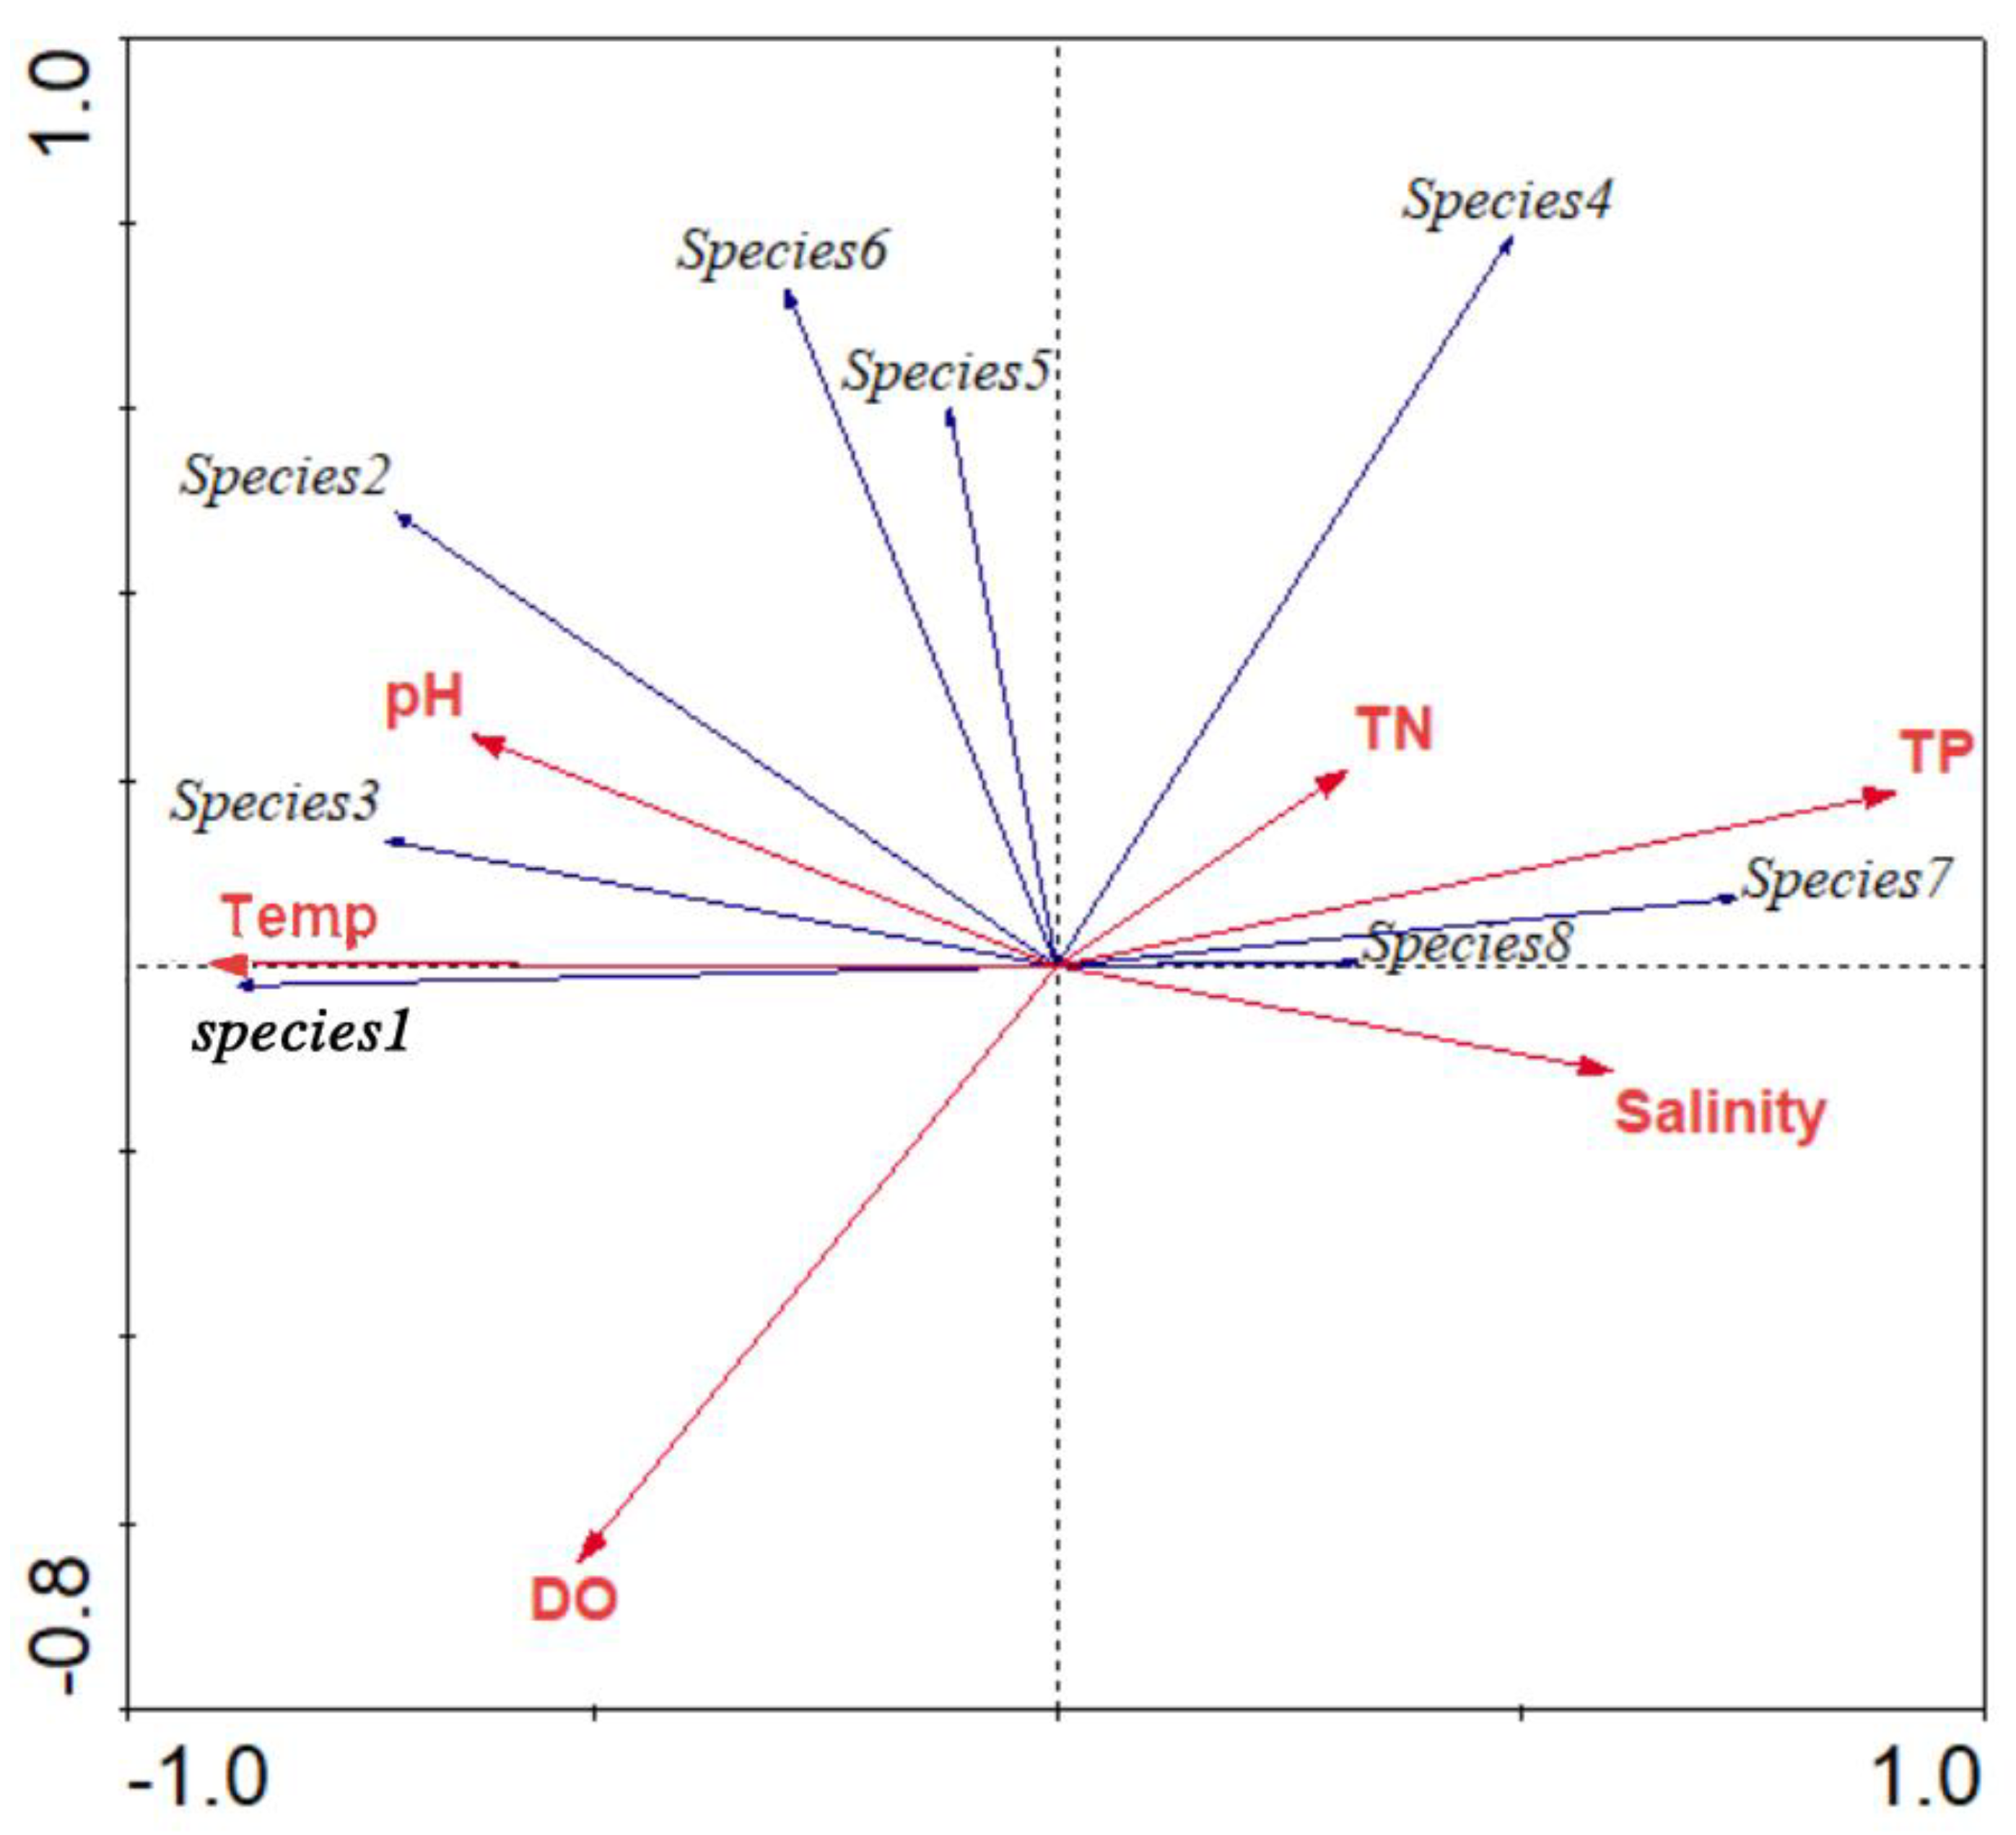
3.7. The Relationship between the Phytoplankton Community and Environmental Factors

The RDA provided preliminary evidence of the correlation between phytoplankton in the ecological remediation area and the main environmental factors (Table 2 and Table 4). The length of the first axis was 2.0 (<4). It was therefore appropriate to choose the linear model of RDA, which showed that the former two axes of RDA1 and RDA2 were significantly different (p < 0.01). The characteristic values of the axes RDA1 and RDA2 were 0.351 and 0.291, respectively. The explanation degree reached 94.30%, thus indicating that the two sequencing axes could efficiently demonstrate the interrelationship between phytoplankton in the reef area and different environmental factors. Figure 6 shows that water temperature, dissolved oxygen, and total phosphorus levels were the main influencing factors. Additionally, Merismopedia elegans was positively correlated with TP, Anabaena sp. had a positive correlation with WT, and Phormidium sp. was negatively correlated with DO, which indicates that the increase of dissolved oxygen has an inhibitory effect on the growth of some cyanobacteria.

4. Discussion

4.1. Effects of Artificial Reefs on the Surrounding Water

Following the placement of artificial reefs, the density of phytoplankton is likely to be higher than it would have been in the absence of artificial reefs [23,24]. This is because, after the placement of artificial reefs, variability and intersecting flow fields (upwelling current, eddy current, accelerated current, stagnant current, etc.) will inevitably occur in the artificial reef fisheries composed of numerous fish reefs, which enables sufficient exchange between water bodies, thus creating an ideal environment for nutrient transport and promoting the massive reproduction and growth of plankton in reef fisheries [25]. The artificial reefs designed in this study were relatively small and had no effect on the velocity or flow pattern of the water around the reefs [24]. In addition, lakes are different from coastal areas. They have little variation in flow due to the absence of tides or strong winds or waves. Artificial reefs on the lake bottom serve to reduce the exchange of sediment and overlying water, allowing for a more gradual release of nutrients. The nitrogen and phosphorus nutrient levels in the artificial reef water were lower than those in the control area in August. Therefore, the density and biomass of phytoplankton in the water surrounding the artificial reefs did not increase in this study.
The monthly decline in phytoplankton density and biomass were somewhat related to water temperature [26], and the proportion of Cyanophyta (out of all of the phytoplankton species) decreased. Additionally, water temperature and dissolved oxygen were the main factors affecting the density of the dominant species of cyanobacteria, whereas the proportions of Prochlorophyta and Bacillariophyta rose instead. These findings indicate that the structure of the phytoplankton in the water surrounding the artificial reef has improved. The artificial reefs were made of biomass fillers and were processed with modules. The modular material had a rough surface with many micropores, high porosity, and weak alkalinity. The reef material has a strong physical adsorption capacity and chemical cooperation with a low concentration of phosphate, thus facilitating the attachment and growth of microorganisms. As a result, the concentration of phosphate in the surrounding water was reduced. Cyanophyta needs phosphorus to grow [27]. The adsorption and cooperation of phosphorus by artificial reefs inhibits the growth and reproduction of Cyanophyta to a certain extent, thereby increasing the proportions of other phytoplankton phyla [28]. The Shannon–Wiener diversity index and Pielou’s evenness index both increased month by month. The increases in the proportions of Euglenophyta and Pyrrophyta also coincided with the increase in biodiversity. Therefore, the placement of artificial reefs has played a certain role in improving the aquatic ecosystem of the surrounding water.

4.2. Changes in Artificial Reef Attachments

The organisms on the reefs can reproduce and attach year-round, and they provide more abundant food sources for fish and shrimp [29]. Different artificial reefs have different attachment times. Li et al. [30] showed that the differences in abundance and biological composition between the natural islands and artificial reefs in the ocean became less prominent by 12 months of placement. In this study, the species of phytoplankton attached to the artificial reefs did not differ significantly from those in the surrounding water 1 year after placement. The lower density of attached phytoplankton, compared to the surrounding water, was mainly due to the sampling method. The water around the reefs was collected by a quantitative sampling method. The reef attachment samples were obtained by soaking and brushing the reef; thus, the phytoplankton concentration was diluted to a certain extent. The proportion of Bacillariophyta in artificial reef attachments was much higher than that in the surrounding water, indicating that the artificial reefs had a positive effect on the adsorption of diatoms. On the one hand, the material of the artificial reefs had a specific surface area as high as 9.7 m2/g, which is conducive to adsorb small particles. On the other hand, water depth and temperature are the most important external environmental factors that determine the distribution of attached organisms [31], and temperature is also closely related to the growth, development, and attachment season of organisms [32]. The artificial reefs were placed at the bottom of the water, where the water temperature and light conditions were suitable for the growth of diatoms [33]; thus, diatoms were adsorbed by the artificial reefs. Diatoms are important food sources for zooplankton, benthic animals, fish, and shrimp [34], which indirectly indicates that the artificial reefs provided a good feeding ground for fish and can act as an attraction for fish [35].

4.3. Application Prospects of Artificial Reefs

Artificial reefs have been used for many years as an important means of protecting and restoring marine ecological resources [36,37]. Previous studies have focused on the impact of reefs on the surrounding water, the types and biomass of reef attachments, and comparative analyses of artificial reefs with different materials. [38,39]. Huang et al. [40] showed that artificial reefs attached plankton and benthos, as well as some shellfish and snails. Furthermore, Einbinder et al. [41] showed that the biomass of phytoplankton in the artificial reef area was significantly higher than the level before the reef was placed into operation. Relatively few studies have been conducted on freshwater artificial reefs. In this study, a freshwater artificial reef was designed using biomass fillers and preliminary observations of the phytoplankton on the reefs and in the surrounding water. The results showed that the reefs improved the biodiversity of phytoplankton and provided a feeding ground for fish. As China pays more attention to the importance of lake ecological restoration and fish habitat formation, more in-depth research on freshwater artificial reefs and more extensive applications of them could be seen. We will also conduct further research on fish attraction, ecological impact evaluation, and the community structures of benthic animals and zooplankton attached to freshwater artificial reefs.

5. Conclusions

The average density and biomass of phytoplankton in the water around the artificial reef gradually decreased, with the proportion of Cyanophyta in phytoplankton density decreasing and the proportion of Chlorophyta and Bacillariophyta increasing. Additionally, the Shannon–Wiener diversity index and Pielou evenness index of the phytoplankton around the artificial reef increased month by month. When compared with that of the water around the artificial reef, the algal cell density of the attachment was relatively lower, but the proportions of green algae density and diatom density were larger, with diatoms being the dominant biomass of the attachments. Artificial reefs affect phytoplankton community structure mainly by affecting phosphorus nutrients in the water.

Author Contributions

Conceptualization, H.Z.; data curation, H.Z.; formal analysis, S.C.; funding acquisition, X.L.; investigation, H.Z.; software, S.C.; supervision, X.L.; visualization, J.W.; writing—original draft preparation, H.Z.; writing—review and editing, H.Z. and S.C. All authors have read and agreed to the published version of the manuscript.

Funding

This study was supported by the National Key R&D Program of China (2019YFD0900604) project, the Shanghai Sailing Program (No. 18YF1407500), and the Baiyangdian aquatic biological resources investigation and water ecological restoration demonstration project (2018 LKY007).

Institutional Review Board Statement

Not applicable.

Informed Consent Statement

Not applicable.

Acknowledgments

The authors are grateful to Shaowen Ye and Lei Shi, who work at the Institute of Hydrobiology, Chinese Academy of Sciences, for their help with the fish community investigation.

Conflicts of Interest

The authors declare no conflict of interest.

References

  1. Wang, S.; Tang, C.; Song, X.; Wang, Q.; Zhang, Y.; Yuan, R. The impacts of a linear wastewater reservoir on groundwater recharge and geochemical evolution in a semiarid area of the Lake Baiyangdian watershed. North China Plain. Sci. Total Environ. 2014, 482–483, 325–335. [Google Scholar] [CrossRef]
  2. Zhu, H.; Liu, X.G.; Cheng, S.P. Phytoplankton community structure and water quality assessment in an ecological restoration area of Baiyangdian Lake, China. Int. J. Environ. Sci. Technol. 2020, 18, 1529–1536. [Google Scholar] [CrossRef]
  3. Zhu, H.; Cao, K.; Chen, X.L.; Ye, S.W. Effect of ecological suspended bed measures on water environment restoration in Baiyangdian Lake. Fish. Mod. 2020, 47, 42–48. [Google Scholar]
  4. Tang, C.; Yi, Y.; Yang, Z.; Zhou, Y.; Zerizghi, T.; Wang, X.; Cui, X.; Duan, P. Planktonic indicators of trophic states for a shallow lake (Baiyangdian Lake, China). Limnologica 2019, 78, 125712. [Google Scholar] [CrossRef]
  5. Yang, W.; Yang, Z. Integrating ecosystem-service tradeoffs into environmental flows decisions for Baiyangdian Lake. Ecol. Eng. 2014, 71, 539–550. [Google Scholar] [CrossRef]
  6. Han, X.F.; Wang, S.A. Ecological analysis of fish species composition in Baiyangdian Lake after the restoration of its water level. Hebei Fish. 1991, 6, 8–11. (In Chinese) [Google Scholar]
  7. Zhao, C.L.; Xiao, G.H.; Luo, N.T.; Yuan, Q.Y.; Deng, P.C. Analysis of the current fish species composition in Baiyangdian Lake. Hebei Fish. 2007, 11, 49–50. [Google Scholar]
  8. Walker, B.K.; Enderson, B.; Spieler, R.E. Fish assemblages associated with artificial reefs of concrete aggregates or quarry stone offshore Miami Beach, Florida, USA. Aquat. Living Resour. 2002, 15, 95–105. [Google Scholar] [CrossRef]
  9. Mark, B. Artificial reefs: A review of their design, application, management and performance. Ocean. Coast. Manag. 2001, 44, 241–259. [Google Scholar]
  10. Yin, Z.Q.; Zhang, S.Y.; Wang, Z.H.; Wang, K.; Liang, J. Growth variation and rational utilization of small yellow croaker (Larimichthys polyactis) in artificial reef areas of Shengsi, Zhejiang Province. Chin. J. Eco-Agric. 2010, 18, 588–594. [Google Scholar] [CrossRef]
  11. Yu, H.; Yang, W.; Liu, C.; Tang, Y.; Song, X.; Fang, G. Relationships between Community Structure and Environmental Factors in Xixiakou Artificial Reef Area. Ocean. Coast. Sea Res. 2020, 19, 883–894. [Google Scholar] [CrossRef]
  12. Creque, S.M.; Raffenberg, M.J.; Brofka, W.A.; Dettmers, J.M. If You Build It, Will They Come? Fish and Angler Use at a Freshwater Artificial Reef. N. Am. J. Fish. Manag. 2006, 26, 702–713. [Google Scholar] [CrossRef]
  13. Zhang, Z.S.; Huang, X.F. Research Methods of Freshwater Plankton; Science Press: Beijing, China, 1991. [Google Scholar]
  14. Hillebrand, H.; Dürselen, C.D.; Kirschtel, D.; Pollingher, U.; Zohary, T. Biovolume calculation for pelagic and benthic microalgae. J. Phycol. 1999, 35, 403–424. [Google Scholar] [CrossRef]
  15. Hu, H.; Wei, Y. The Freshwater Algae of China: Systematics, Taxonomy and Ecology; Science Press: Beijing, China, 2006. [Google Scholar]
  16. Jiang, Y.J.; He, W.; Liu, W.X.; Qin, N.; Ouyang, H.L.; Wang, Q.M.; Kong, X.Z.; He, Q.S.; Yang, C.; Yang, B.; et al. The seasonal and spatial variations of phytoplankton community and their correlation with environmental factors in a large eutrophic Chinese lake (Lake Chaohu). Ecol. Indic. 2014, 40, 58–67. [Google Scholar] [CrossRef]
  17. Amri, S.; Samar, M.F.; Sellem, F.; Ouali, K. Seasonal antioxidant responses in the sea urchin Paracentrotus lividus (Lamarck 1816) used as a bioindicator of the environmental contamination in the South-East Mediterranean. Mar. Pollut. Bull. 2017, 122, 392–402. [Google Scholar] [CrossRef] [PubMed]
  18. Lin, D.; Li, X.; Fang, H.; Dong, Y.; Huang, Z.; Chen, J. Calanoid copepods assemblages in Pearl River Estuary of China in summer: Relationships between species distribution and environmental variables. Estuar. Coast Shelf Sci. 2011, 93, 259–267. [Google Scholar] [CrossRef]
  19. Shannon, C.E. A mathematical theory of communication. Bell Syst. Tech. J. 1948, 27, 379–423. [Google Scholar] [CrossRef] [Green Version]
  20. Margalef, R. Information theory in ecology. Int. J. Gen. Syst. 1958, 2, 36–71. [Google Scholar]
  21. Muylaert, K.; Sabbe, K.; Vyverman, W. Spatial and temporal dynamics of phytoplankton communities in a freshwater tidal estuary (Schelde, Belgium). Estuar. Coast. Shelf Sci. 2000, 50, 673–687. [Google Scholar] [CrossRef]
  22. Beyene, A.; Addis, T.; Kifle, D.; Legesse, W.; Kloos, H.; Triest, L. Comparative study of diatoms and macroinvertebrates as indicators of severe water pollution: Case study of the Kebena and Akaki rivers in Addis Ababa, Ethiopia. Ecol. Indic. 2009, 9, 381–392. [Google Scholar] [CrossRef]
  23. Wang, W.D.; Liang, J.; Zhang, S.Y. Influence of artificial reef construction on nutrition and water quality in off-shore area of Shengsi, Zhejiang. Acta Hydrobiol. Sin. 2010, 34, 78–87. (In Chinese) [Google Scholar] [CrossRef]
  24. Falcao, M.; Santos, M.N.; Drago, T.; Serpa, D.; Monteiro, C. Effect of artificial reefs (southern Portugal) on sediment-water transport of nutrients: Importance of the hydrodynamic regime. Estuar. Coast. Shelf Sci. 2009, 83, 451–459. [Google Scholar] [CrossRef]
  25. Zhang, S.; Zhu, K.W.; Sun, M.C. Species composition and biomass variation in phytoplankton in artificial reef area in Haizhou Bay. J. Dalian Fish. Univ. 2006, 21, 134–140. [Google Scholar]
  26. Zhang, W.; Li, C.H.; Jia, X.P.; Chen, P.M.; Fang, L. Effects of environmental factors on the distribution of attached organisms on artificial reef in Daya Bay. Acta Ecol. Sin. 2009, 8, 4053–4060. [Google Scholar]
  27. Zhang, S.H.; Chang, J.J.; Sun, P.S. Phosphorus cycle of algae during its growth and death process: Phosphorus uptake and release. Ecol. Environ. Sci. 2013, 22, 1250–1254. [Google Scholar]
  28. Littler, M.M.; Littler, D.S.; Brooks, B.L. The effects of nitrogen and phosphorus enrichment on algal community development: Artificial mini-reefs on the Belize Barrier Reef sedimentary lagoon. Harmful Algae 2010, 9, 255–263. [Google Scholar] [CrossRef]
  29. Li, C.Y.; Huang, Z.G.; Zheng, C.X. A preliminary study of attached organisms on artificial reef in Daya Bay. Chin. J. Appl. Ecol. 1991, 2, 63–69. [Google Scholar]
  30. Li, Y.; Hong, J.Z.; Li, H.Q. Fouling communities on neighboring artificial and natural reefs in Zhu Island, Pearl River estuary. South China Fish. Sci. 2013, 2, 22–28. [Google Scholar]
  31. Moura, A.; Boaventura, D.; Curdia, J.; Carvalho, S.; Monteiro, C.C. Effect of depth and reef structure on early macrobenthic communities of the Algarve artificial reefs (southern Portugal). Hydrobiologia 2007, 580, 173–180. [Google Scholar] [CrossRef]
  32. Cristina, F.G.; Emilio, M. Effect of temperature on the unimodal size scaling of phytoplankton growth. Sci. Rep. 2021, 11, 1–9. [Google Scholar]
  33. Liu, X.; Lu, X.H.; Chen, Y.W. Long-term evolution of planktonic diatoms and their relationships with environmental factors in Lake Taihu. Acta Sci. Circumstantiae 2012, 32, 821–827. [Google Scholar]
  34. Li, X.S.; Yan, G.L. The impact of microalgae in industrial river-crab seeding. Freshw. Fish. 2001, 31, 34–35. [Google Scholar]
  35. Neely, K.L.; Ziegler, T.A.; Peloso, M.; Hooper, M.; O’Briant, C.; Wise, M.; Rittschof, D. Enhancing artificial reef fish populations by providing invertebrate prey refugia. Fish. Res. 2021, 241, 106003. [Google Scholar] [CrossRef]
  36. Jayanthi, M.; Patterson, E.J.K.; Malleshappa, H.; Gladwin, G.A.N.; Mathews, G.; Diraviya, R.K.; Deepak, S.B.; Ashok, K.T.K.; Sannasiraj, S.A. Perforated trapezoidal artificial reefs can augment the benefits of restoration of an island and its marine ecosystem. Restor. Ecol. 2020, 28, 233–243. [Google Scholar] [CrossRef]
  37. Campos, L.; Ortizc, M.; Rodríguez-Zaragozad, F. Evaluating the macroscopic system properties of kelp species planted on two artificial reefs: Implications for the restoration of perturbed subtidal areas. Estuar. Coast. Shelf Sci. 2021, 252, 107266. [Google Scholar] [CrossRef]
  38. Whitmarsh, D.; Santos, M.N.; Ramos, J.; Monterio, C.C. Marine habitat modification through artificial reefs off the Algarve (southern Portugal): An economic analysis of the fisheries and the prospects for management. Ocean. Coast. Manag. 2008, 51, 463–468. [Google Scholar] [CrossRef]
  39. Sutton, S.G.; Bushnell, S.L. Socio-economic aspects of artificial reefs: Considerations for the Great Barrier Reef Marine Park. Ocean. Coast. Manag. 2007, 50, 829–846. [Google Scholar] [CrossRef]
  40. Huang, Z.R.; Liang, X.Y.; Zeng, J. Preliminary study on the effects of attached organisms on artificial reef material. South China Fish. Sci. 2006, 2, 34–38. [Google Scholar]
  41. Einbinder, S.; Perelberg, A.; Ben-Shaprut, O.; Foucart, M.; Shashar, N. Effects of artificial reefs on fish grazing in their vicinity: Evidence from algae presentation experiments. Mar. Environ. Res. 2006, 61, 110–119. [Google Scholar] [CrossRef] [PubMed]
Figure 1. The layout of the experimental area.
Water 13 01802 g001
Figure 2. Dimensions of the artificial reef.
Water 13 01802 g002
Figure 3. Real view of the artificial reef.
Water 13 01802 g003
Figure 4. Monthly changes in phytoplankton density in the experimental and control groups. The values and error bars represent means ± SE (n = 6).
Water 13 01802 g004
Figure 5. Monthly changes in phytoplankton biomass in the experimental and control groups. The values and error bars represent means ± SE (n = 6).
Water 13 01802 g005
Figure 6. RDA between phytoplankton and environmental factors.
Water 13 01802 g006
Table 1. Technical parameters of the biomass module fillers.
NameTechnical Parameter
MaterialBiomass filler
Structural requirementsSpecific surface area 9.7 m2/g
Porosity50–81%
Dissolution rate in hydrochloric acid<1.0%
Compressive strength>3.0 MPa
Impurity content<3.0%
Time of biofilm formation3–7 days
Chemical oxygen demand loading rate<60 g/(m2·d)
Hydraulic loading0.3–0.6 m3/(m2·d)
Table 2. Physical and chemical characteristics in Shihoudian Lake.
JulyAugustSeptemberOctoberNovember
Control AreaReef AreaControl AreaReef AreaControl AreaReef AreaControl AreaReef AreaControl AreaReef Area
Water temperature °C29.28 ± 0.3529.85 ± 0.5331.0 ± 0.7530.7 ± 0.4328.4 ± 0.2527.6 ± 0.0519.6 ± 0.0419.2 ± 0.0513.5 ± 0.0713.8 ± 0.27
Salinity ‰0.73 ± 0.000.748 ± 0.000.69 ± 0.000.68 ± 0.000.73 ± 0.000.72 ± 0.000.76 ± 0.000.75 ± 0.000.77 ± 0.000.76 ± 0.00
pH8.63 ± 0.018.71 ± 0.018.68 ± 0.088.94 ± 0.038.62 ± 0.038.97 ± 0.068.72 ± 0.028.46 ± 0.168.09 ± 0.058.4 ± 0.03
Dissolved oxygen mg/L10.73 ± 0.2010.67 ± 0.3713.73 ± 0.6014.54 ± 0.456.91 ± 0.927.8 ± 0.5310.69 ± 0.527.03 ± 0.687.24 ± 0.288.84 ± 0.54
Total nitrogen mg/L1.77 ± 0.212.23 ± 0.112.03 ± 0.491.43 ± 0.092.09 ± 0.301.95 ± 0.191.53 ± 0.162.77 ± 0.391.94 ± 0.332.25 ± 0.21
Total phosphorus mg/L0.09 ± 0.000.03 ± 0.000.08 ± 0.000.01 ± 0.000.09 ± 0.030.37 ± 0.010.10 ± 0.030.11 ± 0.040.04 ± 0.060.53 ± 0.01
Table 3. Changes in phytoplankton phyla in the water around the artificial reefs.
JulyAugustSeptemberOctoberNovember
Prochlorophyta2232351912
Bacillariophyta741153
Cyanophyta421076
Cryptophyta22310
Euglenophyta30510
Pyrrophyta11111
Xanthophyta00321
Total3941683623
Table 4. Dominant species and their dominance in the water surrounding the artificial reefs.
JulyAugustSeptemberOctoberNovemberCode
Anabaena sp.0.98----Species1
Merismopedia sp.-0.930.780.28-Species2
Chlorella sp.-0.02---Species3
Phormidium sp.--0.080.640.11Species4
Phacus sp.--0.02--Species5
Cryptomonas erosa--0.03--Species6
Merismopedia elegans----0.06Species7
Peridinium sp.----0.72Species8
Table 5. Phytoplankton densities (×104) and proportions in the water around the artificial reefs.
JulyAugustSeptemberOctoberNovember
Cyanophyta26,452.3619,033.1611,681.877296.737.41
Proportion %98.5494.8188.7295.1619.84
Prochlorophyta307.57940.59590.22267.662.84
Proportion %1.154.694.483.497.60
Bacillariophyta30.5152.72130.3643.660.28
Proportion %0.110.260.990.570.75
Cryptophyta10.5634.75427.7633.670
Proportion %0.040.173.250.440
Euglenophyta24.360298.573.490
Proportion %0.0902.270.050
Pyrrophyta18.1413.9913.622.5426.77
Proportion %0.070.070.100.0371.67
Xanthophyta0024.0519.860.05
Proportion %000.180.260.13
Total26,843.520,075.2113,166.457667.6137.35
Table 6. Phytoplankton biomasses (mg/L) and proportions in the water around the artificial reefs.
JulyAugustSeptemberOctoberNovember
Cyanophyta39.6164.8744.82210.6270.0088
Proportion %93.5366.6318.5685.410.54
Prochlorophyta0.370.9490.8120.3320.0028
Proportion %0.8712.973.122.670.17
Bacillariophyta0.2770.5311.2960.6130.0048
Proportion %0.657.264.994.930.30
Cryptophyta0.0570.1217.7270.6730
Proportion %0.131.6529.745.410
Euglenophyta0.949010.340.0350
Proportion %2.24039.800.280
Pyrrophyta1.0880.83980.8170.1521.6064
Proportion %2.5711.483.141.2298.99
Xanthophyta000.1680.00990.000023
Proportion %000.650.080
Total42.3577.314825.98212.44191.622823
Table 7. Changes in phytoplankton biodiversity in the water surrounding the artificial reefs.
JulyAugustSeptemberOctoberNovemberMean
Shannon–Weaver diversity index (H′)0.160.441.090.631.260.71
Pielou’s evenness index (J)0.060.130.300.210.510.24
Margalef’s richness index (D)0.881.562.111.200.981.35
Table 8. The densities (×104) and proportions of phytoplankton attached to artificial reefs.
First SamplingSecond SamplingThird SamplingMean
Cyanophyta63.1255.9712.0343.70
Proportion %38.5421.363.9321.28
Prochlorophyta44.1630.6234.3336.37
Proportion %26.9611.6911.2016.62
Bacillariophyta49.53154.7238.35147.53
Proportion %30.2459.0577.7655.68
Cryptophyta4.458.020.164.21
Proportion %2.723.060.051.94
Euglenophyta01.374.862.08
Proportion %00.521.590.70
Pyrrophyta2.5211.31.85.21
Proportion %1.544.310.592.15
Xanthophyta0014.995.00
Proportion %004.891.63
Total163.77261.99306.53
Table 9. Biomasses (mg/L) and proportions of phytoplankton attached to artificial reefs.
AugustSeptemberOctober
Cyanophyta0.090.060.01
Proportion %7.231.910.17
Prochlorophyta0.040.030.08
Proportion %3.651.052.51
Bacillariophyta0.861.552.26
Proportion %73.3653.4571.03
Cryptophyta0.030.090
Proportion %2.953.180
Euglenophyta00.490.72
Proportion %017.0322.66
Pyrrophyta0.150.680.11
Proportion %12.8123.373.40
Xanthophyta000.01
Proportion %000.24
Total1.182.903.18
Publisher’s Note: MDPI stays neutral with regard to jurisdictional claims in published maps and institutional affiliations.

