
Ecological Importance of Alkaline Phosphatase Activity in Changing Marine Environmental Conditions

1
Center for Marine Research, Ruđer Bošković Institute, G. Paliaga 5, HR-52210 Rovinj, Croatia
2
CNR-ISMAR, Marine Sciences Institute, Area Science Park-Basovizza, Strada Statale 14, 34149 Trieste, Italy
*
Authors to whom correspondence should be addressed.
Water 2021, 13(19), 2750; https://doi.org/10.3390/w13192750
Submission received: 4 August 2021
/
Revised: 24 September 2021
/
Accepted: 30 September 2021
/
Published: 4 October 2021
(This article belongs to the Special Issue Anthropogenic and Climatic Disturbances in Freshwater and Coastal Ecosystems: Interactive Impacts and Expected Threats)
Abstract
:The effects of changing hydrological and climatic conditions on the dynamics of phosphorus (P) were studied in the Northern Adriatic Sea (NA), a coastal system currently affected by these changes. P limitation is one of the key stresses in the NA and it is a globally important phenomenon in aquatic ecosystems. Therefore, the response to P stress by inducing alkaline phosphatase activity (APA) was studied in characteristic water types in the NA, formed by the changing freshwater input in different thermic conditions. APA was important in providing P for microbial growth in upper waters dominated by assimilation during the warmer part of the year in stratified conditions. Contrarily, APA was not important during mixing in the colder part of the year, as well as in waters dominated by regeneration. In waters influenced by freshwater, temperature had no effect on APA, while in high-salinity waters, temperature was an important factor for APA increase. The highest APA occurred during riverine nutrients supply, indicating that the alteration of anthropogenic nutrient loads might strongly change P status in this coastal system. Furthermore, predicted increases in winter sea temperature and summer Po River discharge could delay the water column mixing, prolonging periods of P limitation.
1. Introduction
Phosphorus (P) is an essential nutrient for marine microbes. Growing evidence suggests that P is the limiting nutrient in aquatic environments, such as coastal systems [1,2,3,4], the Mediterranean Sea [5,6], and oligotrophic oceans [7,8,9,10]. Furthermore, it is believed that the open ocean, far from the continental inputs of nutrients, would evolve toward P-limited conditions due to N2 fixation not balanced by external P inputs [11]. The rise in N2 fixation and simultaneous disappearance of P stocks observed in the subtropical North Pacific Ocean between 1989 and 2004 is an illustration of this phenomenon [12]. Many species of marine phytoplankton and bacteria react to this limitation by accessing organic P using the enzyme alkaline phosphatase (AP) [13]. Therefore, the importance of alkaline phosphatase activity (APA) in marine environments has been investigated with a growing attention (see reviews [13,14,15,16]).
On the other hand, most of the coastal zones and continental shelves surrounding developed countries are subjected to large discharges of anthropogenic nutrients, which primarily originate from the continental waters runoff [17,18]. These inputs have significantly changed the biogeochemistry of these shallow marine environments, often causing an exponential increase in frequency of coastal hypoxia, at least since the 1960s, as well as dystrophic phenomena and altered post-eutrophic conditions during the most recent decades [19,20].
The Northern Adriatic (NA) is an excellent example of such marine ecosystems. It is a continental shelf impacted by a large freshwater discharge. On annual scale, freshwater input accounts for about one third of the total seawater volume of this marine region, whereas the discharge of riverine nutrients far exceeds their marine budget in the area [21,22,23]. Consequently, parts of this region are among the most productive areas in the Mediterranean [24,25].
The most prominent characteristic of nutrient discharges in the NA is the extreme overload of nitrogen (N) compared to P, which makes it a clear example of a marine ecosystem affected by a persistent nutrient imbalance [26,27]. In the Po River waters, the main freshwater source in the region, total nitrogen and total phosphorus concentrations are 249 µmol L−1 and 4.8 µmol L−1, respectively [27]. Consequently, in riverine waters, a marked nitrogen surplus creates high N/P ratios (70–100) [27]. In productive upper NA waters influenced by freshwater, inorganic N/P ratios further increase up to 100–600 [28], reaching values significantly higher than the critical values that mark the transition between N and P limitation (20–50) [29]. Bioassays based on selective nutrient additions and nutrient molar ratios have shown P limitation in the NA ([30] and citations therein). In the area, organic phosphorus concentration markedly exceeds orthophosphate (PO4) concentration, representing an important source of P for microbial communities [31,32]. Enzyme assays showed that alkaline phosphatase activity (APA) is important in providing P for microbial growth in this area ([33] and citations therein). The importance of dissolved organic phosphorus (DOP) in this area during periods of P limitation was evidenced also by a mesocosm experiment [34]. However, the authors pointed out that not all DOP was directly hydrolysable by AP, and that multiple hydrolase activities were necessary to transform various organic matter pools into molecules accessible to AP.
The NA exhibits marked spatial and temporal variations in environmental conditions due to alternating influence of the eutrophic freshwater from the western coast and advection of the oligotrophic waters from the middle Adriatic Sea along the eastern coast. These two water bodies, characterized by different thermohaline properties and nutrient contents, influence the geostrophic circulation and the biological cycle in the region [35,36,37]. Strong oscillations of the runoff and a long-term decrease in phosphate concentrations in the Po River water (−1.34% yr−1) and seawater (in summer −2.56% yr−1) coupled with a significant increase in nitrate concentration in seawater (+3.80% yr−1) were observed in the last decades [27,28]. Moreover, an intense warming induced by climatic forcing is currently impacting the NA [38,39]. These observations strongly suggest that, in the future, anthropogenic and climatic drivers might have important cumulative effects on the biogeochemistry of this shallow marine system.
For these reasons, the analysis of the dynamics of P utilization and recycling is a key point for the assessment of the ecological status of this marine environment. Due to a complex hydrodynamic and freshwater influence, it is expected that this region undergoes different spatial and temporal P stress conditions, consequently inducing different APA response. Therefore, multiannual datasets of hydrological parameters, nutrients, organic phosphorus, and microbial biomass were analyzed to establish their influence on APA (849 datasets collected in 2004–2013). Analyses were performed separately for waters oversaturated with oxygen, where assimilation processes prevail, and undersaturated waters, where regeneration processes dominate. The stratification period was compared to the mixing period, since nutrient sources in these two periods greatly differ. Furthermore, the situation when the freshwater supply of nutrients triggered new primary production was compared with the situation in which microbial growth was based on a constant recycling of once-produced organic matter.
Due to steep gradients of environmental parameters over the year, the NA is a favorable basin for conducting studies of environmental change scenarios and their influence on P stress. The results of this study can improve the understanding of the potential effects induced by changing hydrological and climatic conditions on the biogeochemistry of coastal systems.
2. Materials and Methods
2.1. Area Description and Main Case Study
The NA is a shallow continental shelf (up to 50 m of depth) with strong trophic gradients and a high temporal variability of the oceanographic properties. The circulation in the region is complex, exhibiting large- and small-scale patterns of thermohaline origin [28,38,40,41]. The productivity and the cycling of the nutrients are highly variable [26,38], but they can be summarized in the following main case studies.
Mixing period without freshwater inputs: In winter, a prevalent cyclonic circulation pushes high-salinity waters, characterized by low nutrient contents and low phytoplankton abundances, from the middle Adriatic Sea in the northern shelf [42,43,44]. The outflow of more eutrophic low-salinity waters is restricted to a narrow belt along the western coast [45]. The water column is completely mixed, and the main source of nutrients for microbes is the remineralization of organic matter in the entire water column [38].
Mixing period with recent freshwater inputs: Episodic events of high runoff at the same time as ENE wind can induce a “double gyre” circulation, characterized by a cyclonic gyre in the northern area of the basin, which is able to push the Po River plume up to the eastern coast [46]. This process causes the spreading of new freshwater over a rather homogeneous water column and a large dispersion of riverine nutrients in the NA, resulting in high production over the entire NA [38,47,48].
Stratified period with recent freshwater inputs: In late spring and early summer, the formation of gyres causes a large retention of riverine waters in the upper layer over most of the NA, reducing considerably the inflow of middle Adriatic waters [49,50]. The stratification of the water column strongly increases, with the displacement of thermoclines and haloclines at depths of 5–15 m [26]. Po River discharges generate low-salinity, nutrient-rich waters in the upper layer, triggering and sustaining phytoplankton blooms, particularly frequent during late spring [51].
Stratified period with the presence of aged freshwater: In summer and early autumn, a high retention of riverine waters in the NA, supported by a reduced water exchange and stable meteorological conditions, is often coupled with periods of scarce runoff. Optimal light and temperature favor phytoplankton growth, causing the depletion of nutrients in upper waters. Since stable pycnoclines do not permit the upward flux of nutrients from deeper waters, nutrient availability in upper waters mainly depends on the recycling of organic matter. However, these waters are characterized with high levels of organic matter produced during freshwater inputs [52]. Persistent high concentrations of dissolved organic carbon (DOC) are constituted mainly of compounds, transformed by bacteria, microzooplankton, and viruses [53].
Stratified period without freshwater inputs: Presence of pronounced thermoclines in the NA stabilize the water column even in the absence of a significant freshwater input. The absence of riverine inputs causes the depletion of inorganic nutrient pools in the upper waters, thus creating oligotrophic conditions [26,38].
Early autumn conditions: In October, summer stratification is usually broken out and the cyclonic circulation is re-established, determining rather complex nutrient dynamics. The enrichment of upper waters by the nutrients regenerated in deeper waters co-occurs with the inflow of oligotrophic waters from the middle Adriatic Sea. Furthermore, substantial inputs of riverine nutrients, characteristic for this period, can trigger intensive phytoplankton blooms [54]. With the onset of vertical mixing, the resuspension of nutrients and organic matter from the sediments can occur due to the shallowness of this continental shelf [55].
2.2. Sampling Strategy
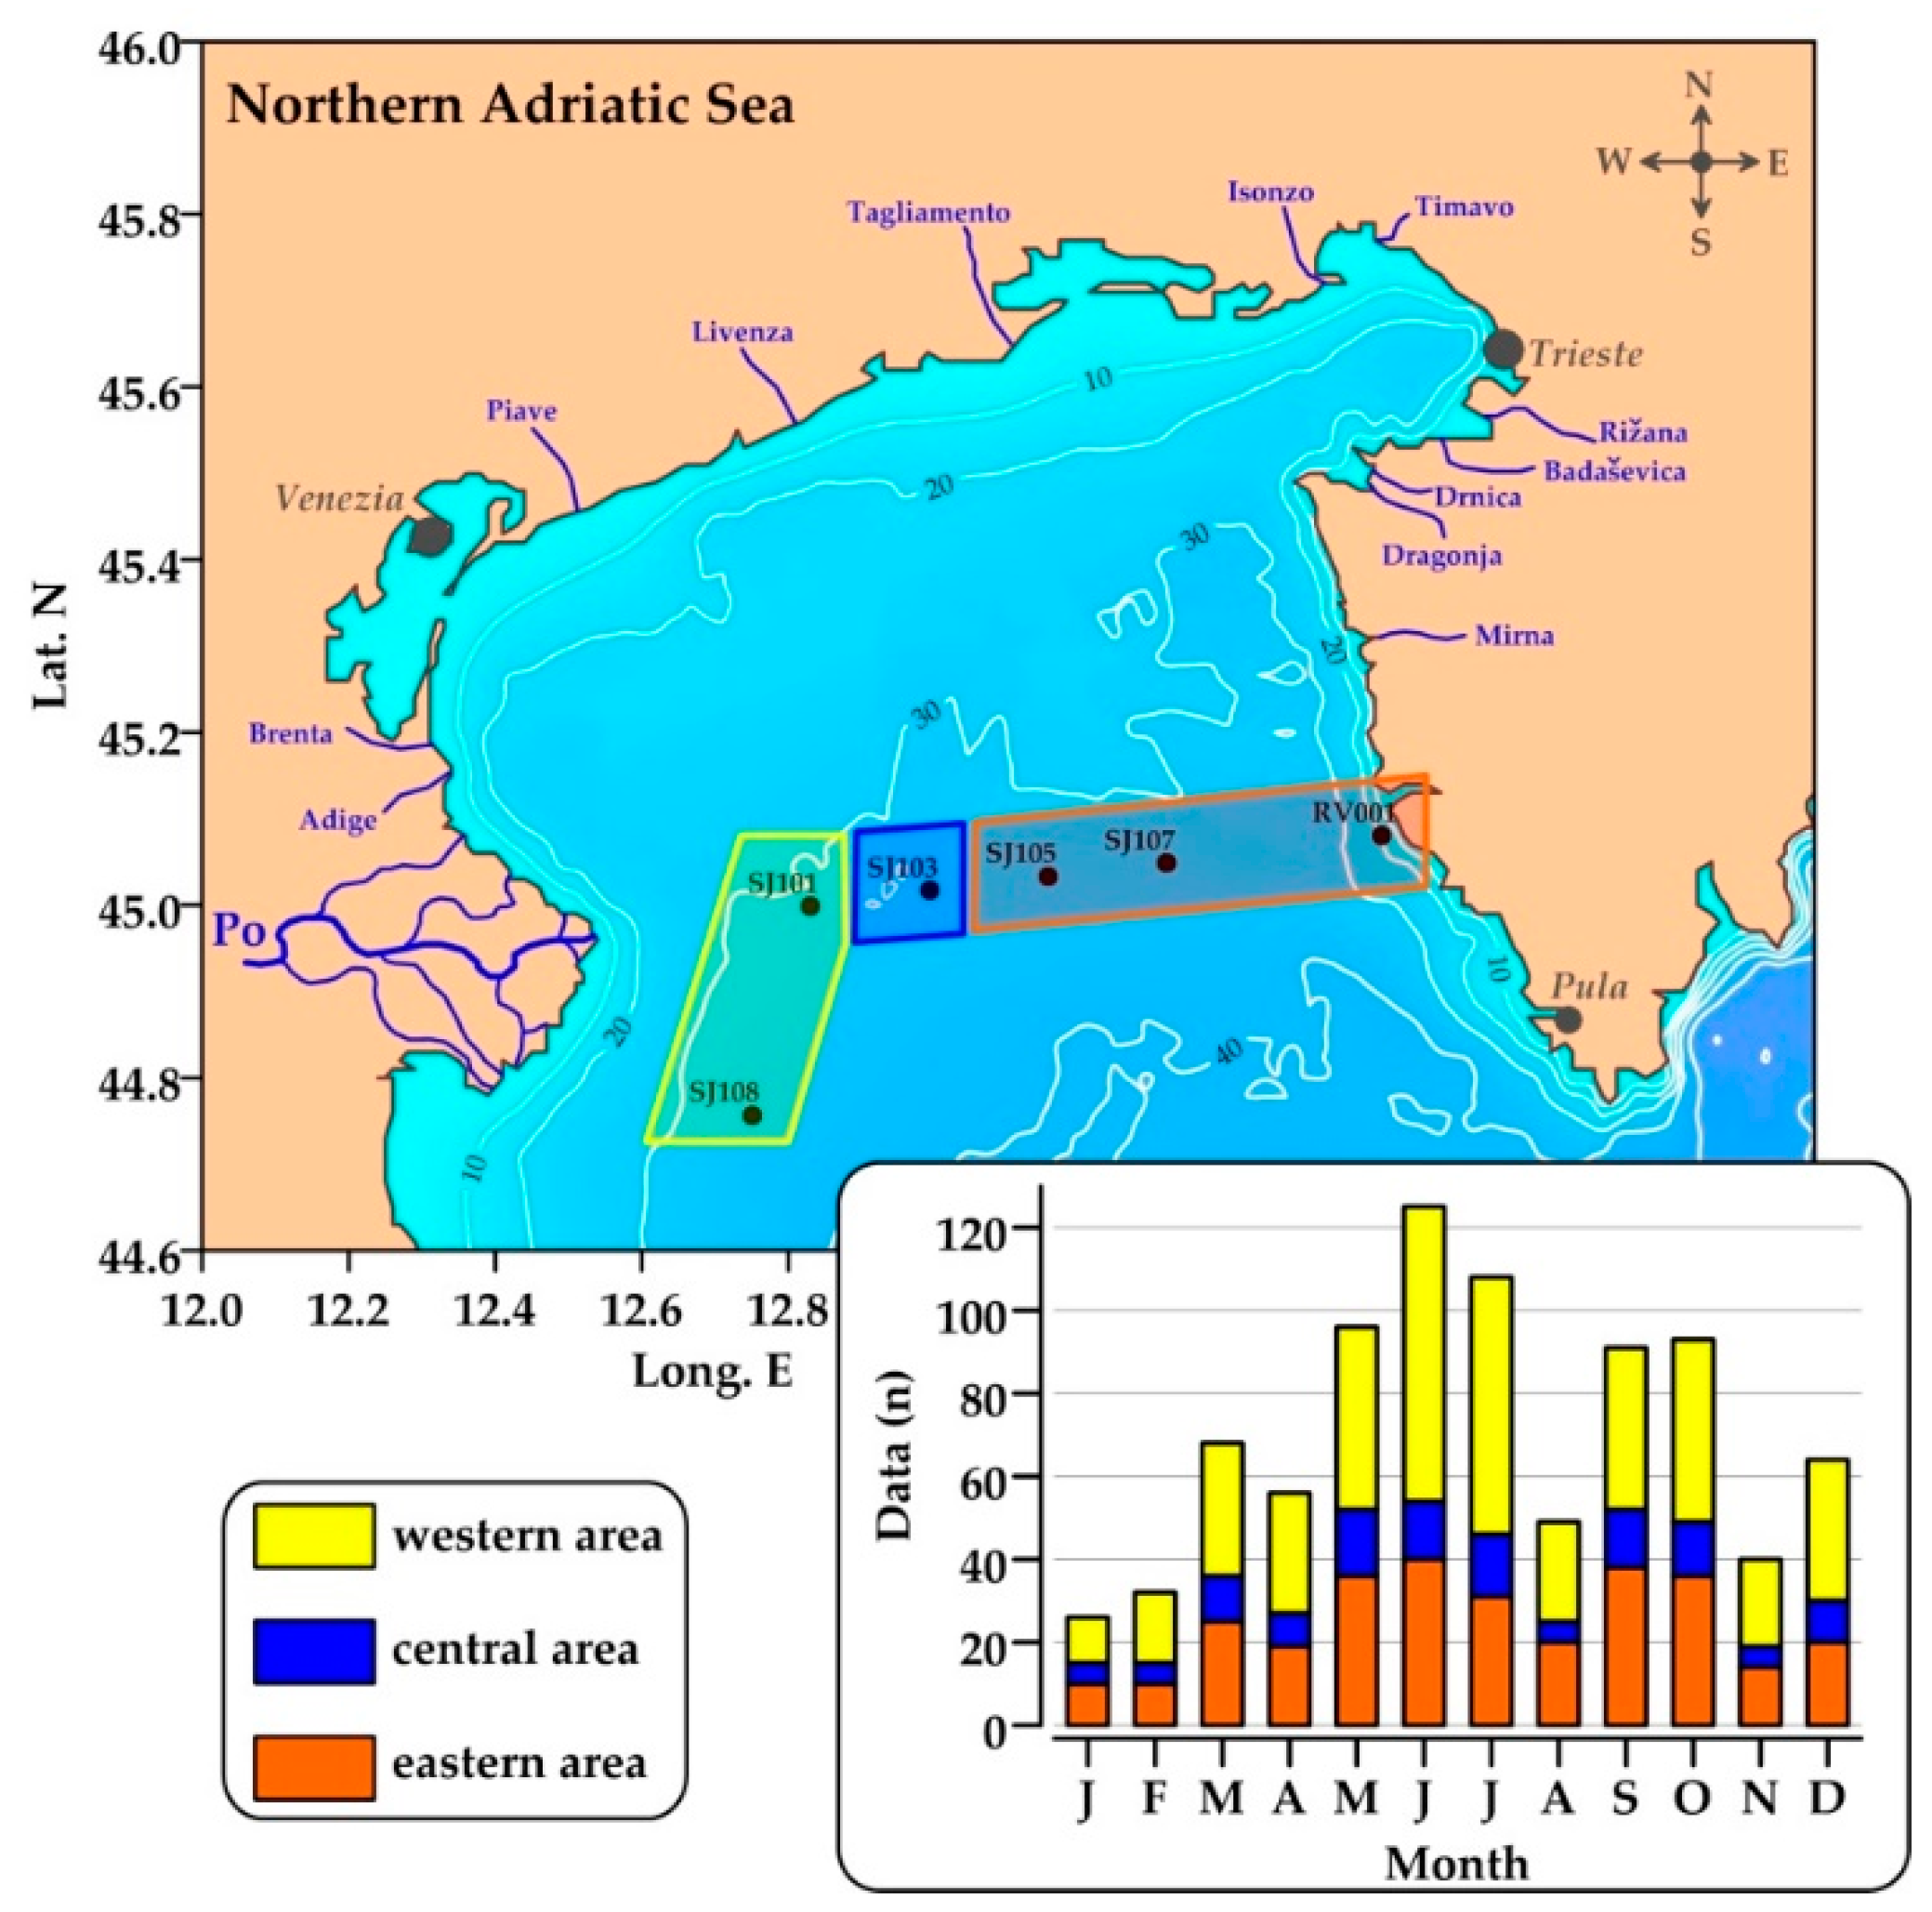
Six stations were sampled during 45 oceanographic surveys carried out in the NA from May 2004 to November 2013 (Figure 1). Sampling stations cover a west to east gradient of oceanographic conditions representative of the major processes in this area. During these surveys, a dataset (n = 849) of hydrological parameters, inorganic nutrients, dissolved organic phosphorus (DOP), APA, chlorophyll a (chl a), and heterotrophic bacteria (HB) was collected. Today, it represents the largest dataset of APA data available in the NA, with robust spatial and temporal coverage.
Sea temperature and salinity were determined with an Sea-Bird Electronics, Washington, USA (SBE25) conductivity–temperature–depth probe. Samples for analysis of dissolved oxygen, nutrients, APA, chl a, and HB were collected with 5 L Niskin bottles. Surface, intermediate (10 m), and near bottom waters (2 m above the bottom) were always sampled (maximum bottom depth 37 m), while additional depths (5, 20, and 30 m) were taken often.
2.3. Analytical Protocol
Dissolved oxygen saturation (O2 sat) and inorganic nutrients (nitrate, NO3; nitrite, NO2; ammonium, NH4; orthophosphate, PO4) analyses were performed aboard the research vessel immediately after sample collection, using, respectively, Winkler titration and spectrophotometric methods [56,57]. PO4 was determined as blue molybdate complex reduced with ascorbic acid. NO2 and NO3 were determined as a pink azo compound, before and after reduction of the samples on columns filled with metallic cadmium filings coated with copper. NH4 was determined using the indophenol blue method. Precision and limit of detection were as follows: PO4 0.03 and 0.03 μmol L−1; NO3 0.05 and 0.025 μmol L−1; NO2 0.01 and 0.01 μmol L−1; ammonia 0.1 and 0.098 μmol L−1. Samples for total dissolved phosphorus (TDP) were filtered (Whatman GF/F, precombusted at 500 °C) and stored in autoclavable polypropylene tubes at −30 °C. In the laboratory, ashore analyses were performed using a wet oxidation method with persulphate [58], and obtained PO4 was measured as described above. Dissolved organic phosphorus (DOP) was calculated as TDP – PO4. Dissolved inorganic nitrogen (DIN) was calculated as the sum of NO3, NO2, and NH4.
For the determination of chlorophyll a (chl a) concentration, 500 mL of seawater was filtered on Whatman GF/C filters. Filters were frozen (−18 °C) and analyzed within a few days by the fluorometric procedure [57].
Seawater samples for heterotrophic bacteria (bacteria; HB) counting were preserved with formaldehyde (2% final concentration) and stored at 4 °C until ashore analysis. The samples were stained with 4′,6-diamidino-2-phenylindole (DAPI, 1 µg mL−1 final concentration) for 10 min [59] and filtered onto black 0.2 μm Nuclepore polycarbonate filters (Whatman, UK). An epifluorescence microscope (Leitz Laborlux D and Nikon Microphot-SA) was used at a magnification of 1000x. At least 500 cells per sample were counted.
The determination of alkaline phosphatase activity (APA) was performed aboard the research vessel immediately after sample collection. Seawater was filtered through a 200 µm mesh to remove mesozooplankton. Measurements were performed in duplicate or triplicate, using the fluorogenic substrate analog methyllumbelliferyl–phosphate (MUF–P), dissolved in methyl cellosolve and diluted with water immediately before addition, following the procedure of Hoppe [60]. Aliquots of 5 mL were used and the final concentration of the substrate in samples was 50 µmol L−1 (saturation concentration [61]). Incubation was performed in dark, at in situ temperature and pH. Fluorescence was measured immediately after substrate addition and after about 1 h of incubation using a Turner Designs 700 fluorometer with excitation at 365 nm and emission at 460 nm. APA (nmol L−1 h−1) was calculated as the difference between those measurements divided by the incubation time after calibration of the fluorometer with methyllumbelliferone, the product of MUF–P degradation.
2.4. Definition of Water Types
Considering the main case study described in Section 2.1, data were divided into waters saturated (O2 ≥ 100%) or undersaturated (O2 < 100%) in dissolved oxygen and affected (S < 37.5; FW) or not affected (S ≥ 37.5; no-FW) by the input of freshwater. On the basis of nutrients and chl a concentrations in low-salinity waters, it was distinguished between “new” freshwater inputs (DIN > 1 µmol l−1 or chl a > 1; new-FW) and “aged” freshwater (aged-FW) circulating in the region, in which nutrients are exhausted and chl a values are low. The stratification (STRAT) and mixing (MIX) periods were differentiated on the basis of temperature profiles in the water column (MIX ΔTsurface-bottom < 1 °C). The analysis of October was presented separately, since in this transient month, hydrodynamic pattern and nutrient sources are rather complex. Only the main case studies were described (Table A1). Marginal waters, rarely found, were not considered. During the mixing period, aged-FW waters were not found. In October, only two cases of saturated no-FW waters were found. In oxygen-undersaturated waters during STRAT and MIX, no-FW waters strongly predominated (95%), with few cases of new- or aged-FW waters (3.5 and 1%, respectively); consequently, these waters were not differentiated. In October, two types of undersaturated waters were found: new-FW and no-FW waters (Table A1).
The differences among water types were discussed only if statistically significant; otherwise, it was evidenced in the text.
2.5. Data Processing
Results are presented in box-and-whisker statistical plots showing median, interquartile, range of 95% of the data, and outliers. The significance of the differences among the medians of each parameter in distinct water types (FW, aged-FW, no-FW) and periods (MIX, STRAT, October) in saturated and undersaturated conditions was assessed by nonparametric Kruskal–Wallis test [64]. The results of this analysis (H values and probability) are shown in Appendix A (Table A1). If only two water types are compared, the routine returns the U value of the Mann–Whitney test. The relationships among the parameters in different water types were constructed by principal component analysis (PCA) on log-transformed data.
3. Results
In the following sections, values reported in brackets are medians, unless stated otherwise. Due to the large variability of presented parameters, medians are more realistic than average values.
3.1. Annual Cycles of the Po River Flow, Environmental Conditions, Microbial Biomass, and APA
The regime of the Po River shows a clear seasonal cycle with two wet seasons (spring and autumn) and two dry seasons (winter and summer), although high peaks of discharge can be observed in every month (Figure 2). In 2004–2013, median flow rate of the Po River was 1060 m3s−1, with values ranging from 168 to 7090 m3s−1.
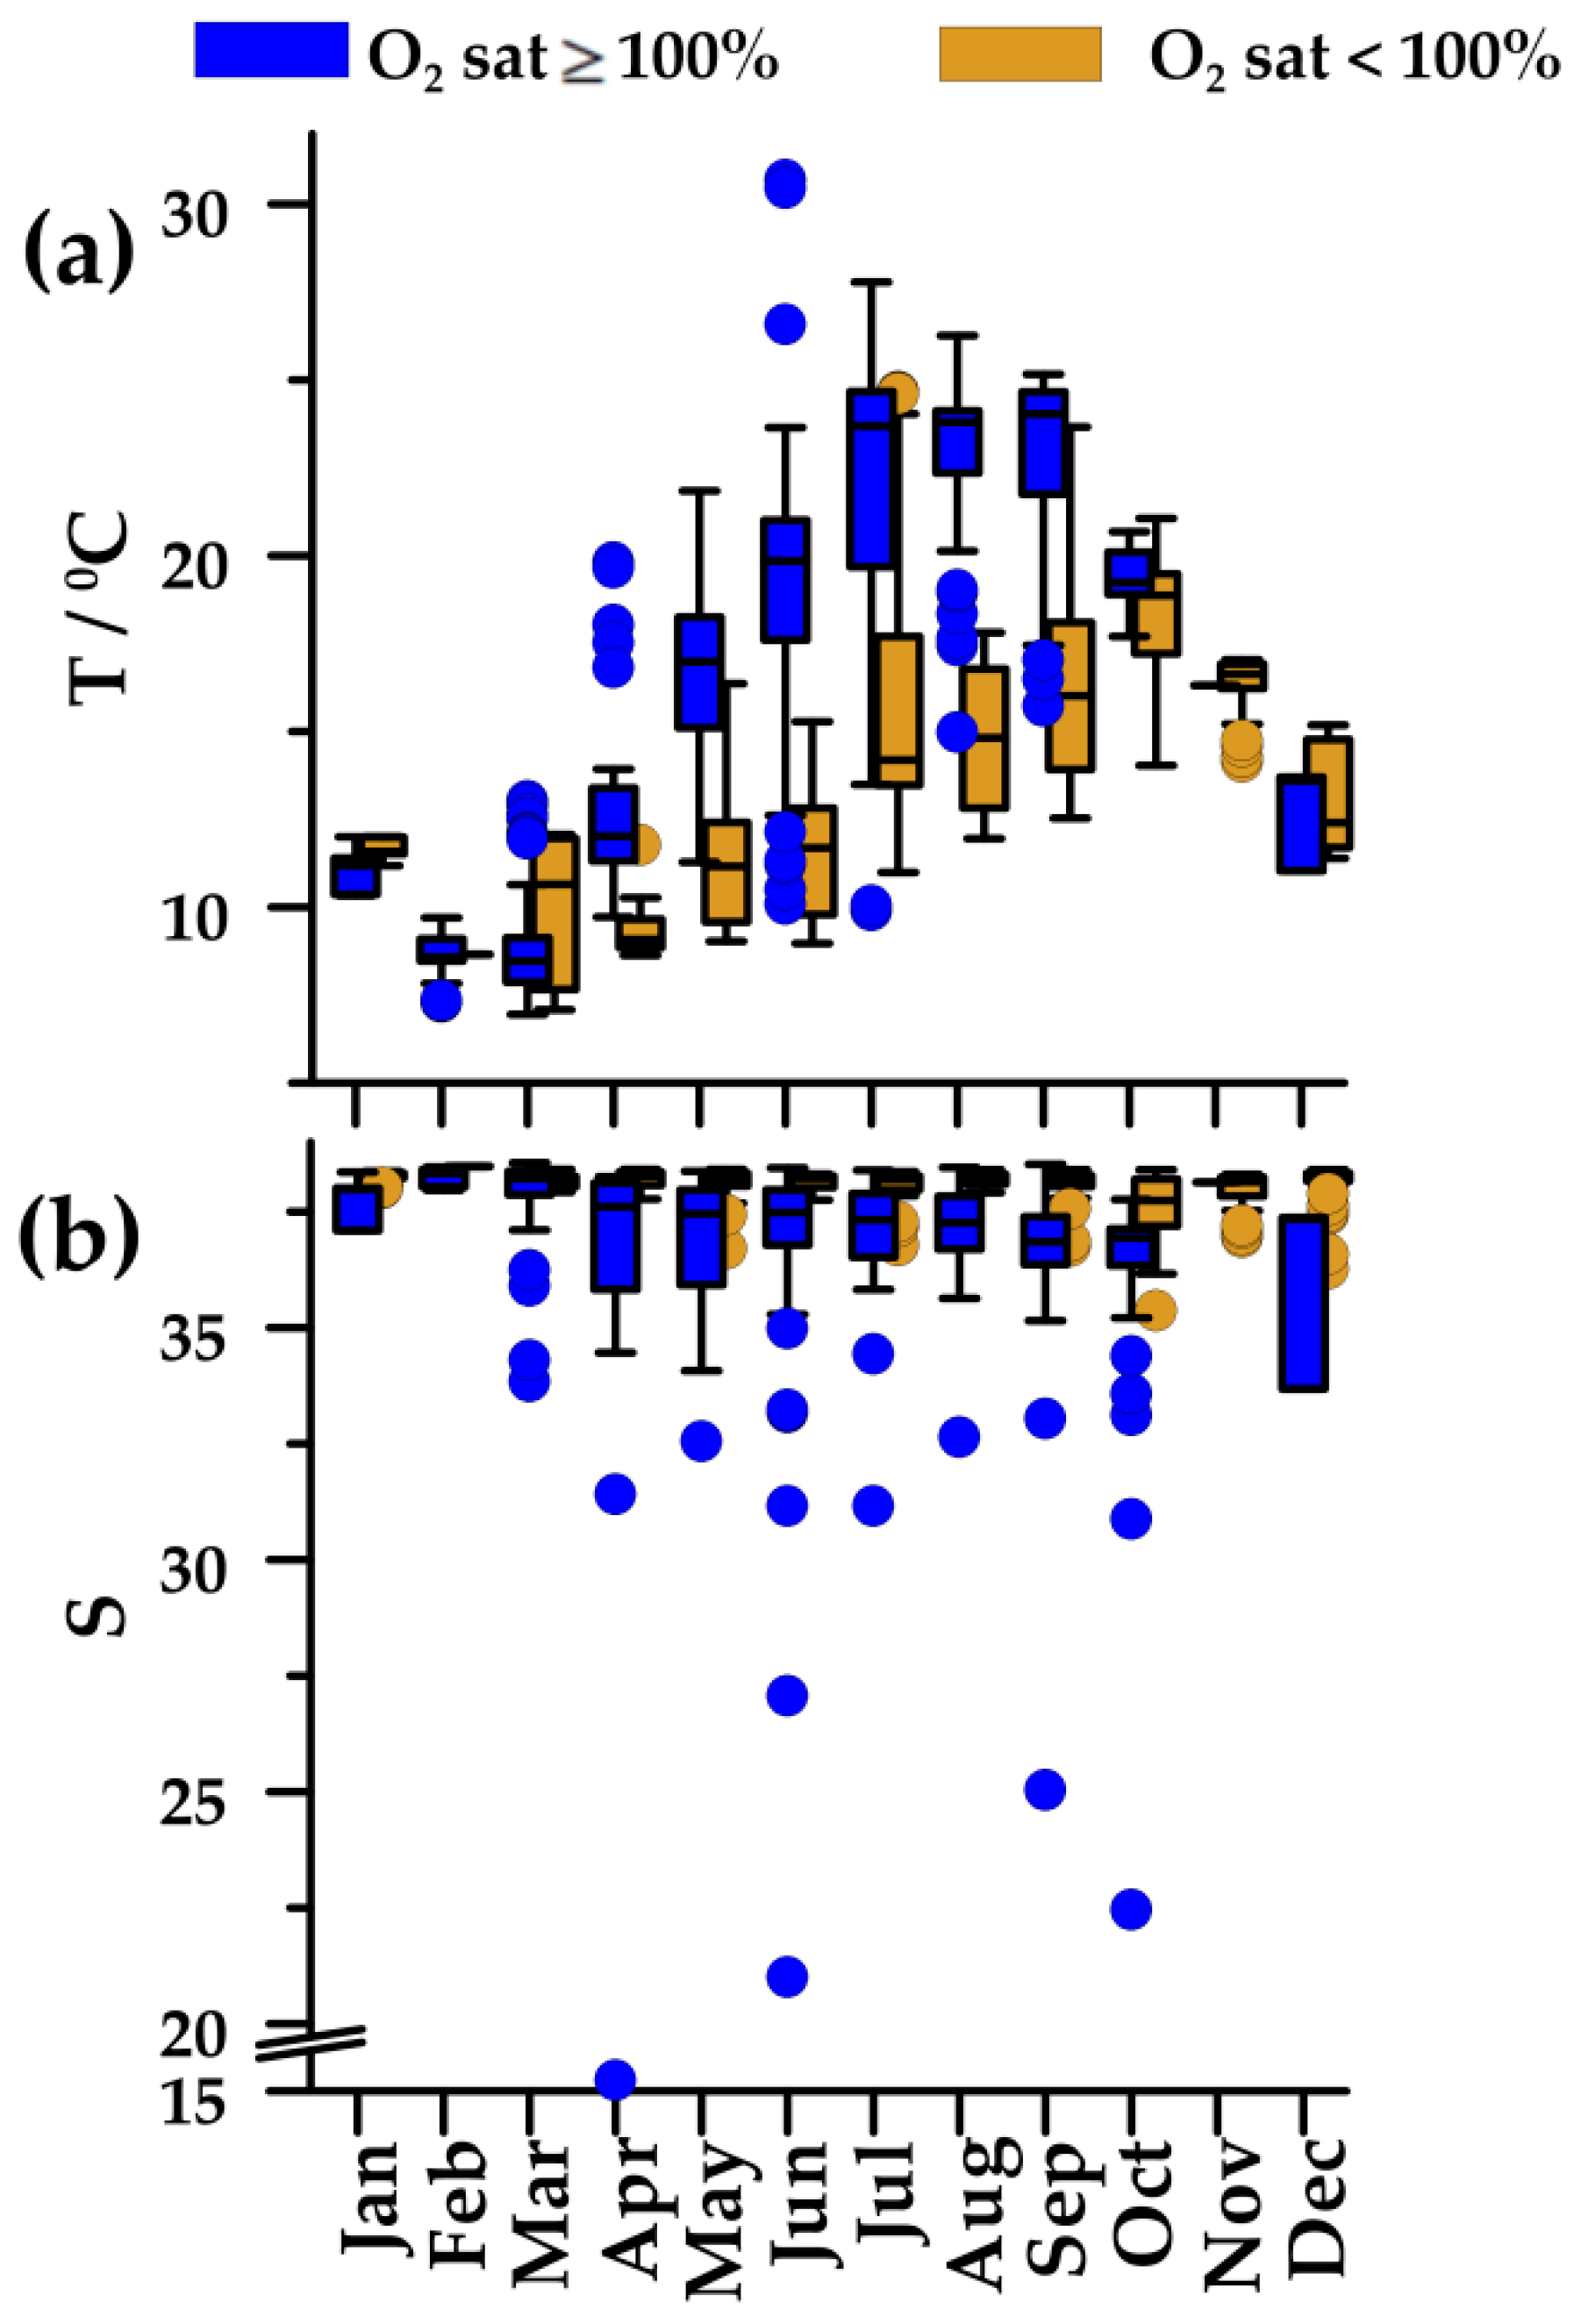
In 2004–2013, seawater temperature displayed an annual cycle typical of temperate regions, with winter minimum (February 8.6 °C) and summer maximum in oxygen-saturated, upper waters (July–August, 23.8 °C; Figure 3a). In undersaturated, deeper waters, changes were less pronounced, and maximal values occurred with the onset of mixing in the water column (October). In these deeper waters, salinity was almost constant (38.2–38.4), except for a somewhat lower value (37.7) at the beginning of mixing in the water column (Figure 3b). The upper waters were characterized with markedly lower salinity in April–October (36.9–37.6).
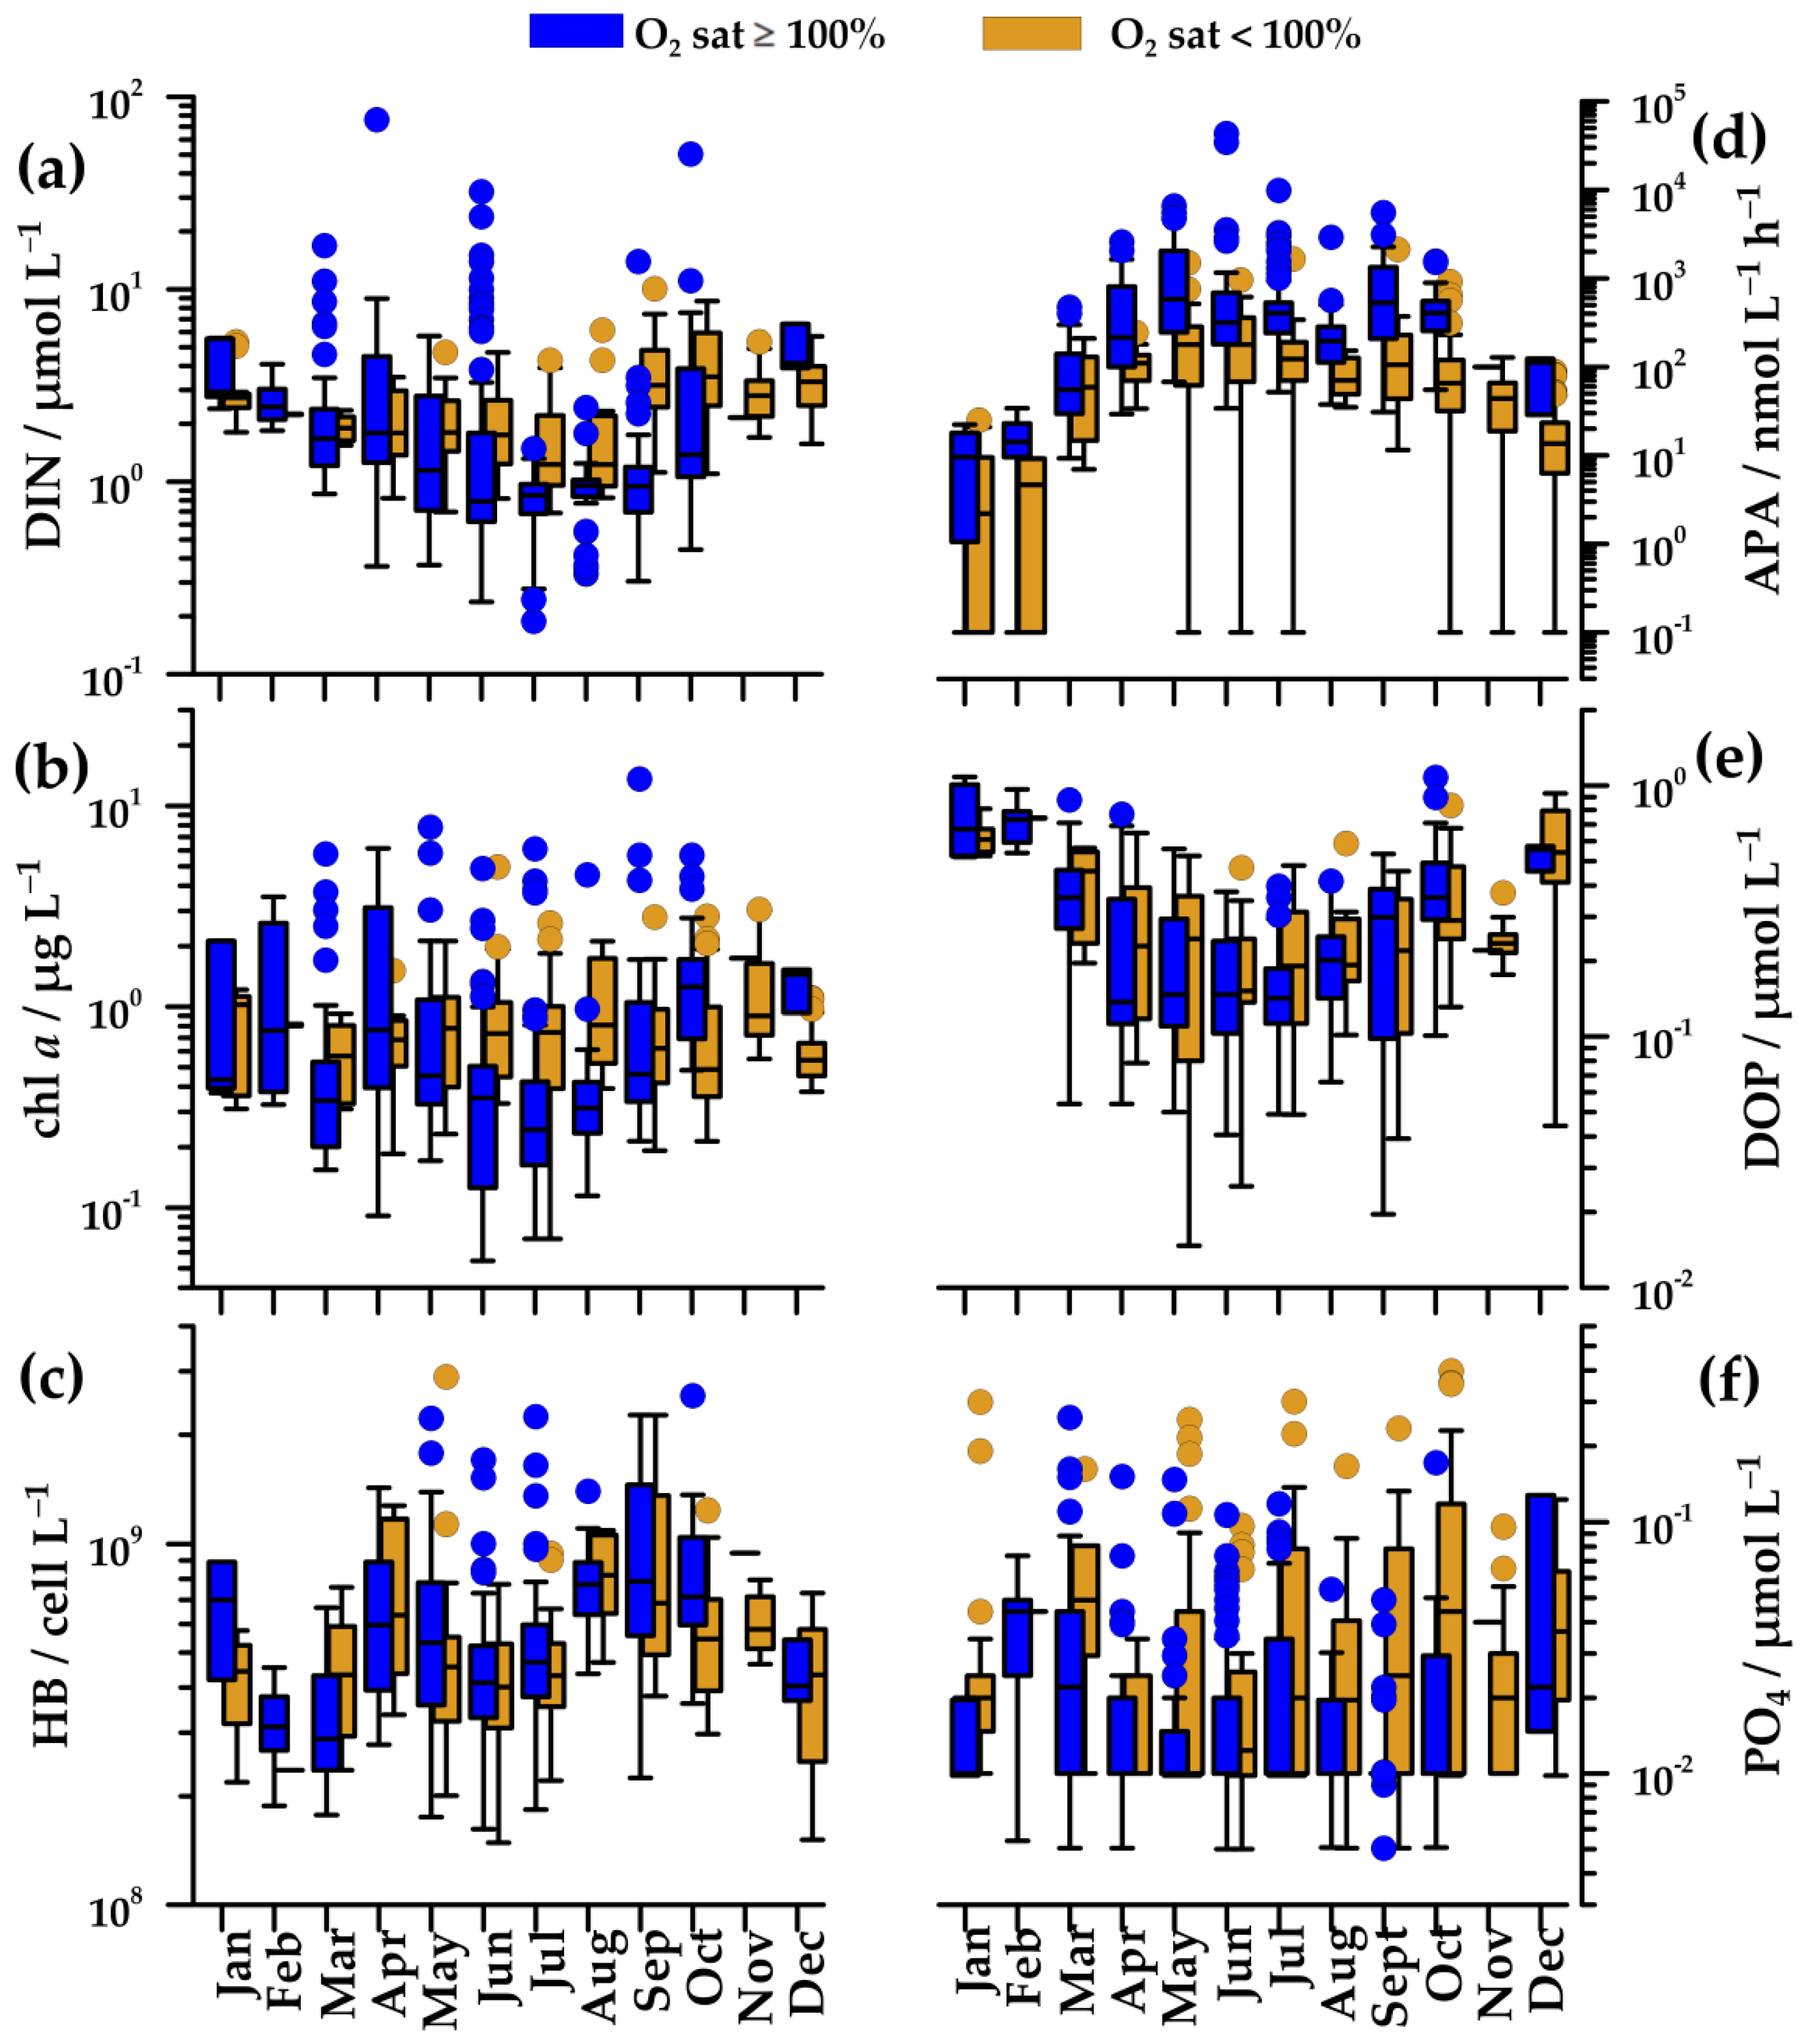
In oxygen-saturated waters, DIN concentration gradually decreased from April/May (1.8 µmol L−1) to the minimum in July–August (0.9 µmol L−1, down to 0.2 µmol L−1). In these months, very high values (up to 76 µmol L−1) were found in concomitance to new freshwater input. Values increased again toward autumn and winter (2.2–4.1 µmol L−1; Figure 4a). In winter, peaks in DIN concentration were less frequent than in other seasons (Figure 4a). In deeper, undersaturated waters, changes of DIN concentrations were alike, although they were less marked (1.2–1.8 µmol L−1), except during the autumn when maximal values (median 3.5 µmol L−1) were observed.
PO4 concentration did not show a clear seasonal cycle (Figure 4f). In upper, oxygen-saturated waters, it was usually below the detection limit of the method. In undersaturated waters, it was somewhat higher, but rarely exceeding 0.1 µmol L−1.
Chl a concentration paralleled changes in nutrient concentration. In oxygen-saturated waters, it decreased from April (0.8 µg L−1), reaching minimal values in July (0.2 µg L−1), and afterwards, it gradually increased until October (1.7 µg L−1; Figure 4b). In spite of generally low values during the summer, high values (up to 13.6 µg L−1) were found, related to the freshwater nutrients supply (Figure 4a,b). In winter, chl a concentration was similar to early spring values (0.6–1.0 µg L−1). Similar to DIN concentration, peaks of chl a concentration were sporadic in winter months (Figure 4b). In undersaturated waters, the seasonal cycle of chl a was not clear (Figure 4b), but summer values (0.7–0.8 µg L−1) were markedly higher than those in oxygen-saturated waters.
Changes of HB abundance were similar in saturated and undersaturated waters (Figure 4c). Minimal values were found in cold waters in February (31 × 107 cell L−1), whereas maximal values were found in April (60–63 × 107 cell L−1) and September (70–80 × 107 cell L−1).
The annual APA cycle was inverse to those of nutrients (Figure 4a,d). In oxygen-saturated waters, APA increased from March (91 nmol L−1h−1) to May (580 nmol L−1h−1) and remained high during the summer and early autumn (Figure 4d). In contrast, APA was low during the winter, with a minimum in January (4 nmol L−1h−1). In undersaturated waters, the seasonal cycle of APA was similar to that in saturated waters, although the values were several times lower (59–180 nmol L−1 h−1).
The seasonal cycle of DOP concentration was characterized by the highest values in mixed waters in December–February (0.6–0–0.8 µmol L−1), by the lowest values in summer (0.1 µmol L−1), and by similar concentrations in saturated and undersaturated waters (Figure 4e). The changes of DOP concentration were clearly inverse to the changes of APA (Figure 4d,e).
3.2. Spatial and Temporal Patterns of Water Types
The frequency of occurrence (%) of main water types defined in Section 2.4 (new-FW, aged-FW, and no-FW waters, saturated or undersaturated in oxygen) showed distinct patterns along this section (Figure 5).
Water bodies characterized by the presence of a recent advection of riverine waters (new-FW) were mainly located in the upper layer, with a higher frequency in the western and central areas (up to 72 and 46% of the data, respectively) compared to the eastern area (Figure 5a). They were almost always characterized by oxygen oversaturation; undersaturated conditions were rarely observed in the subsurface layer (5–10 m of depth; not shown).
Aged-FW waters were present along the whole section, with the highest frequency in upper layers of central (SJ103) and eastern (SJ107) stations (up to 44%; Figure 5b). The pattern of aged-FW waters confirmed that low-salinity water can spread in the central and eastern areas, if vertical density gradients are persistent [26]. Aged-FW waters were almost always oversaturated in oxygen.
Oxygen-saturated no-FW waters were mainly located in the intermediate layer of the water column in the western and central areas (10–25 m of depth), as well as in the whole water column in the easternmost station RV001 (up to 65%; Figure 5c). By contrast, the frequency of oxygen-undersaturated no-FW waters was higher than 50% below 20 m of depth, and it was almost equal to 100% at the bottom of most of the stations (Figure 5d).
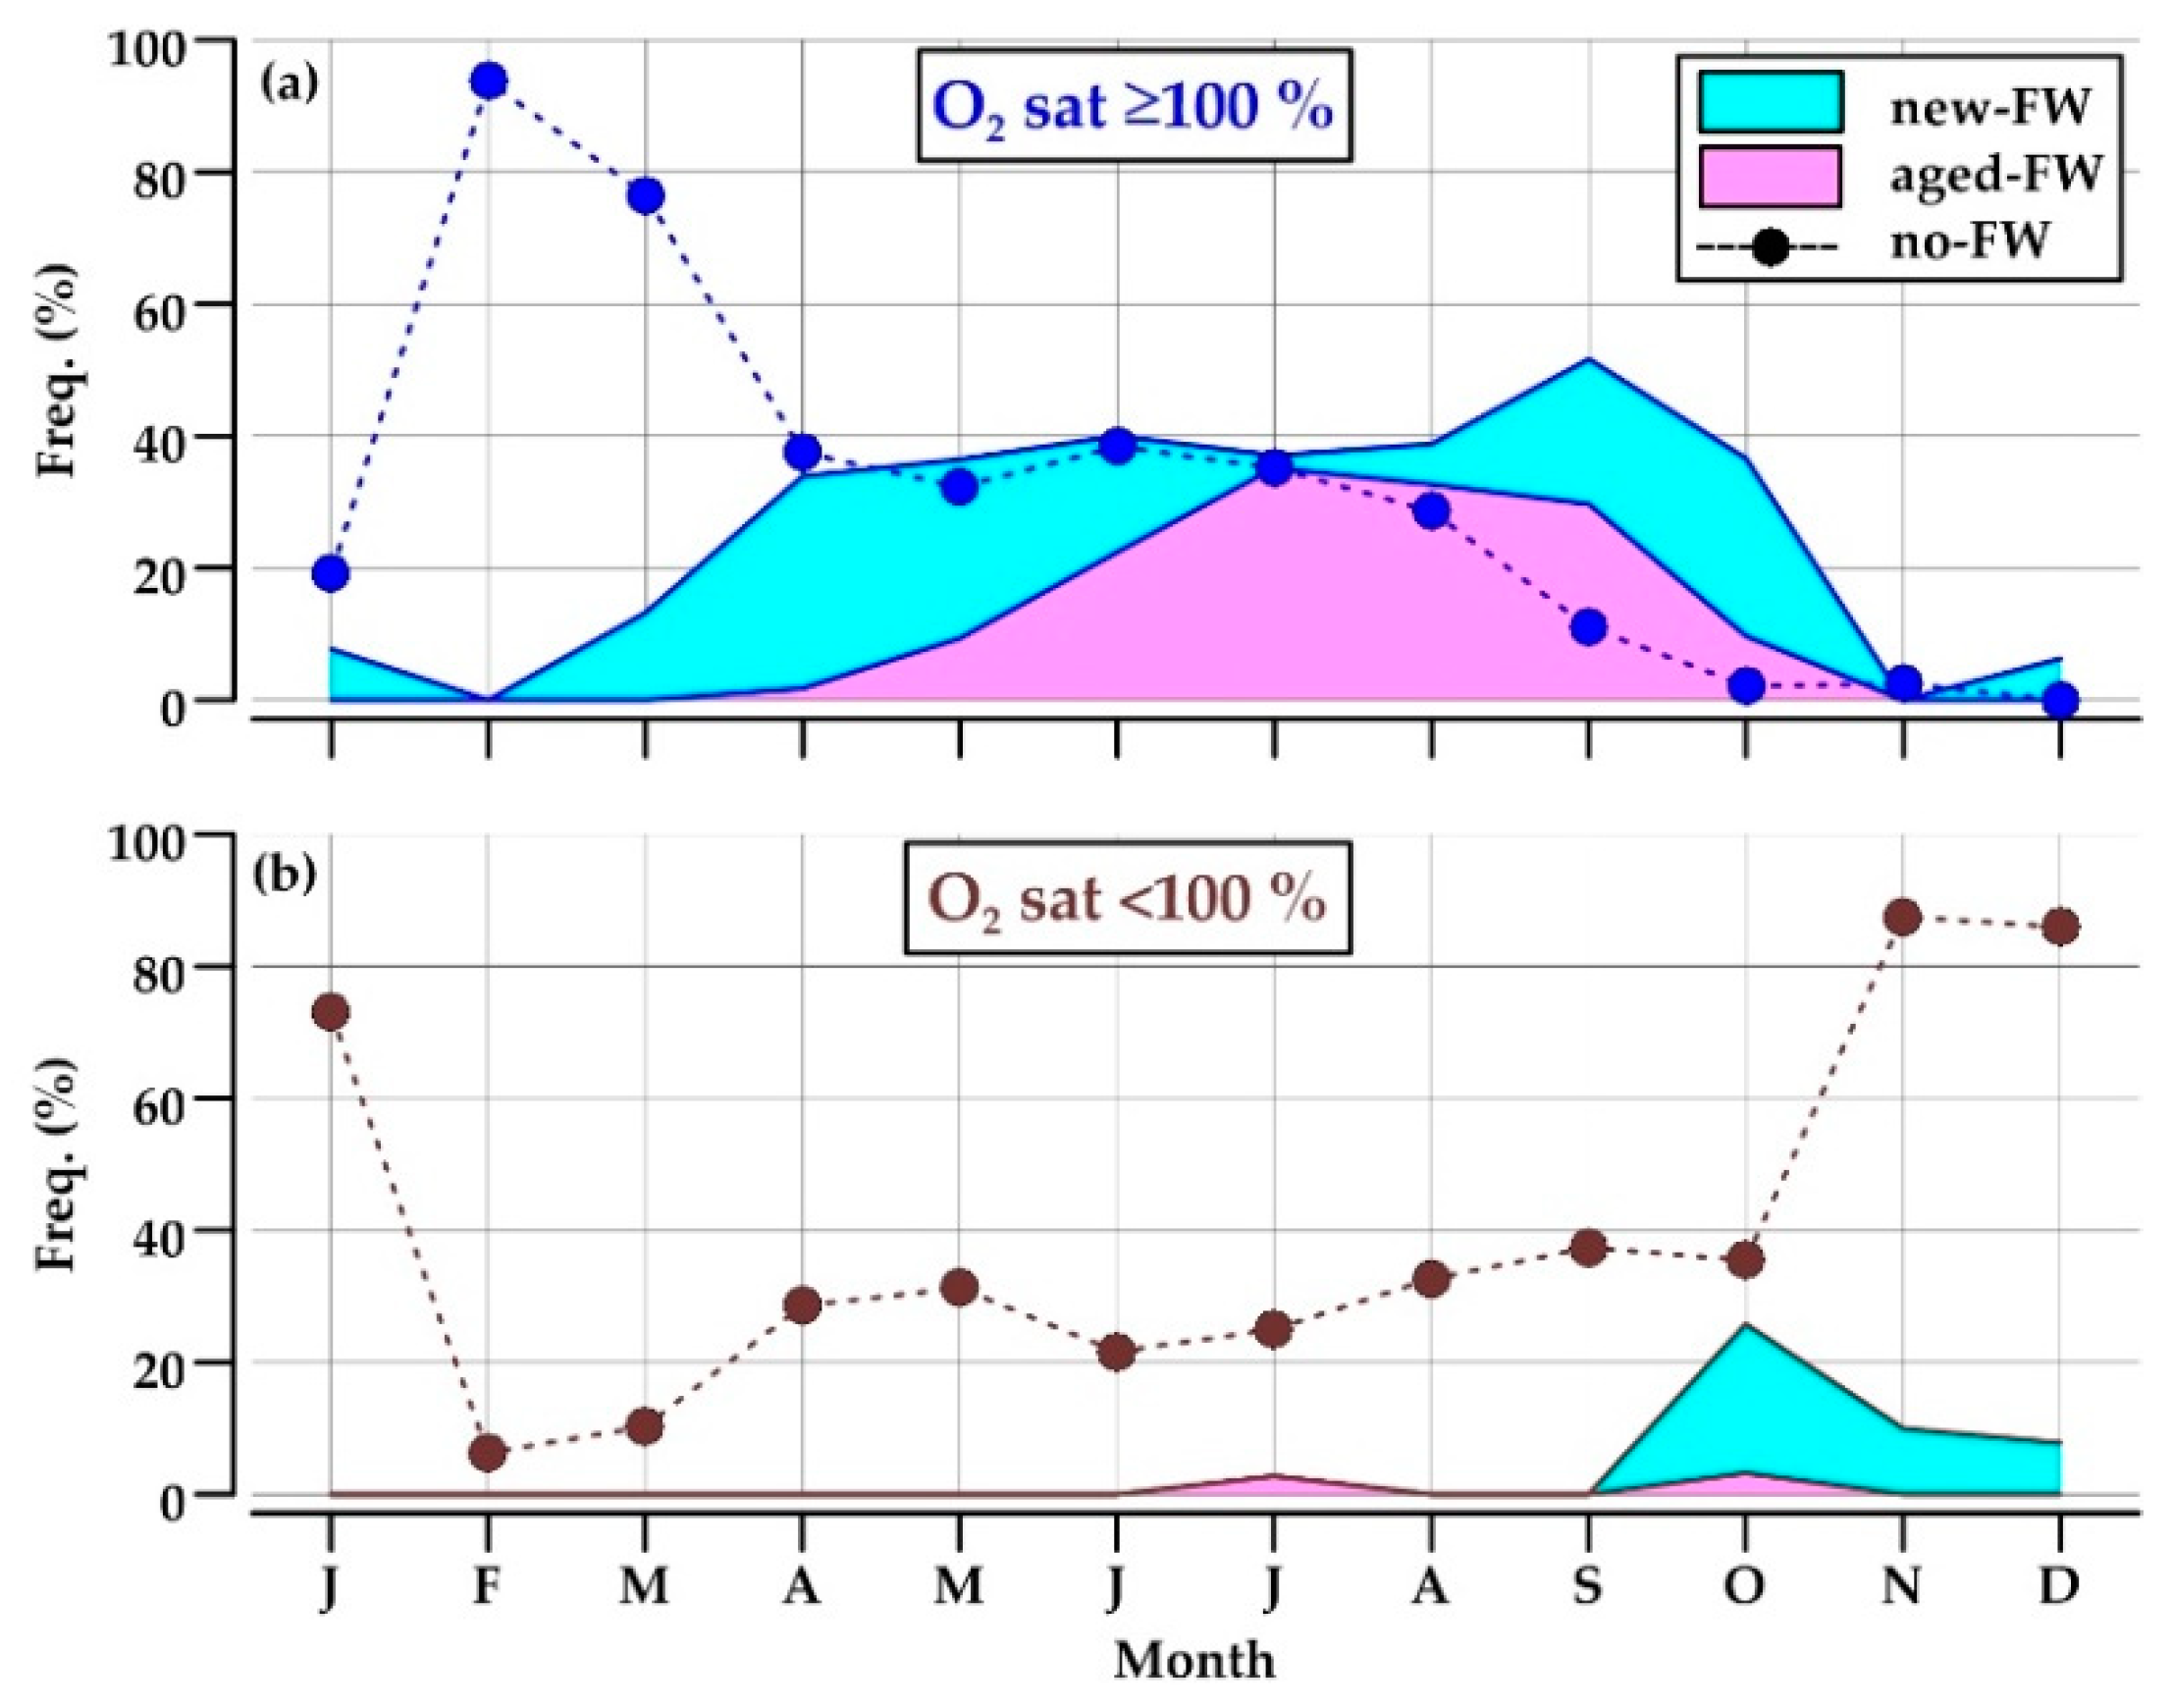
Reported water types showed a pronounced seasonal cycle (Figure 6). New-FW waters were observed mainly in April–May and September–October, with a frequency up to 32% of the data, whereas the retention of aged-FW waters was high in July–September (up to 35%) (Figure 6a). Together, these two low-salinity water types constituted from 34 to 52% of the data in the period from April to October.
Low-salinity waters were almost always oversaturated by dissolved oxygen, becoming undersaturated only in October–December (8–26%; Figure 6b).
Oxygen-saturated no-FW waters occupied most of the section in February and March (76–94%), when the respiration is not a predominant process in the water column and the coastal front scarcely affects the considered area (Figure 6a). This water type became progressively less frequent through the year, and disappeared in November–January, a period of the year in which no-FW waters are almost always undersaturated in oxygen (87%; Figure 6b).
3.3. Environmental and Trophic Characteristics of Water Types
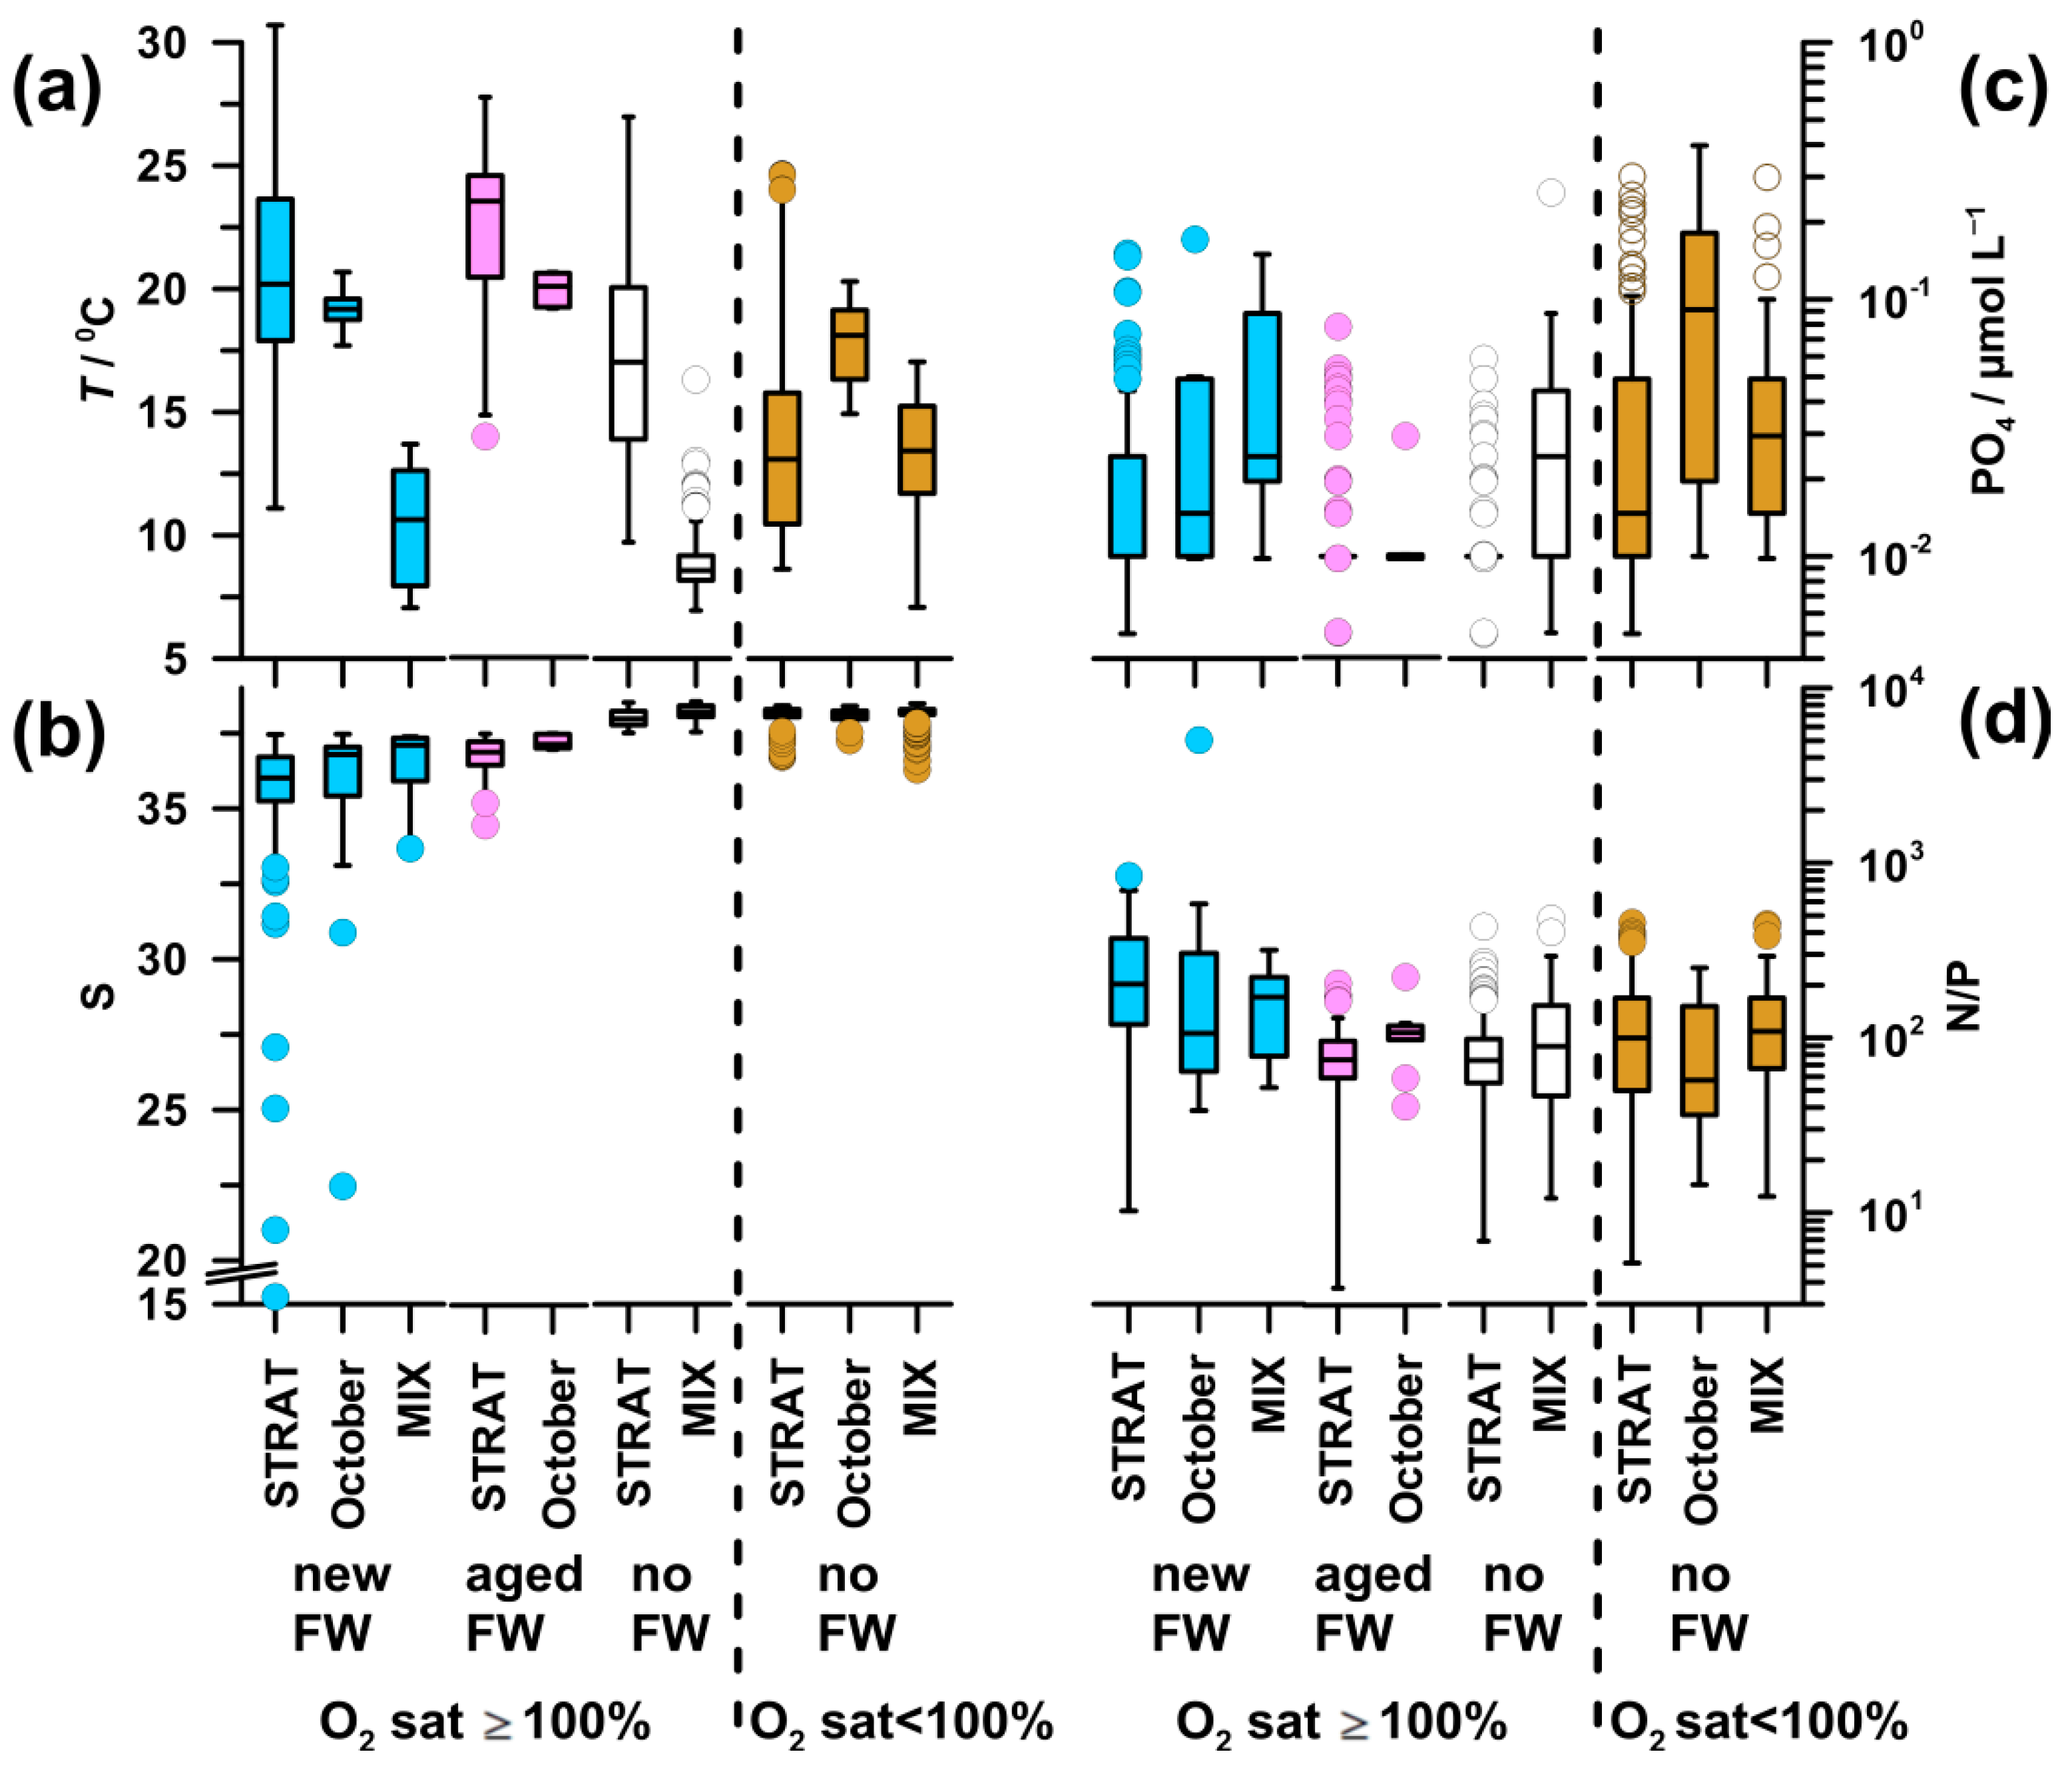
High temperature was characteristic of saturated waters during STRAT and in October (17.1–23.5 °C), with the maximum in aged-FW waters and the minimum in no-FW waters (Figure A1a,b). MIX periods, as well as deeper undersaturated layers during STRAT, were characterized by colder waters (8.6–14.2 °C). In undersaturated waters, markedly higher values of temperature were found only in October (18.9 °C).
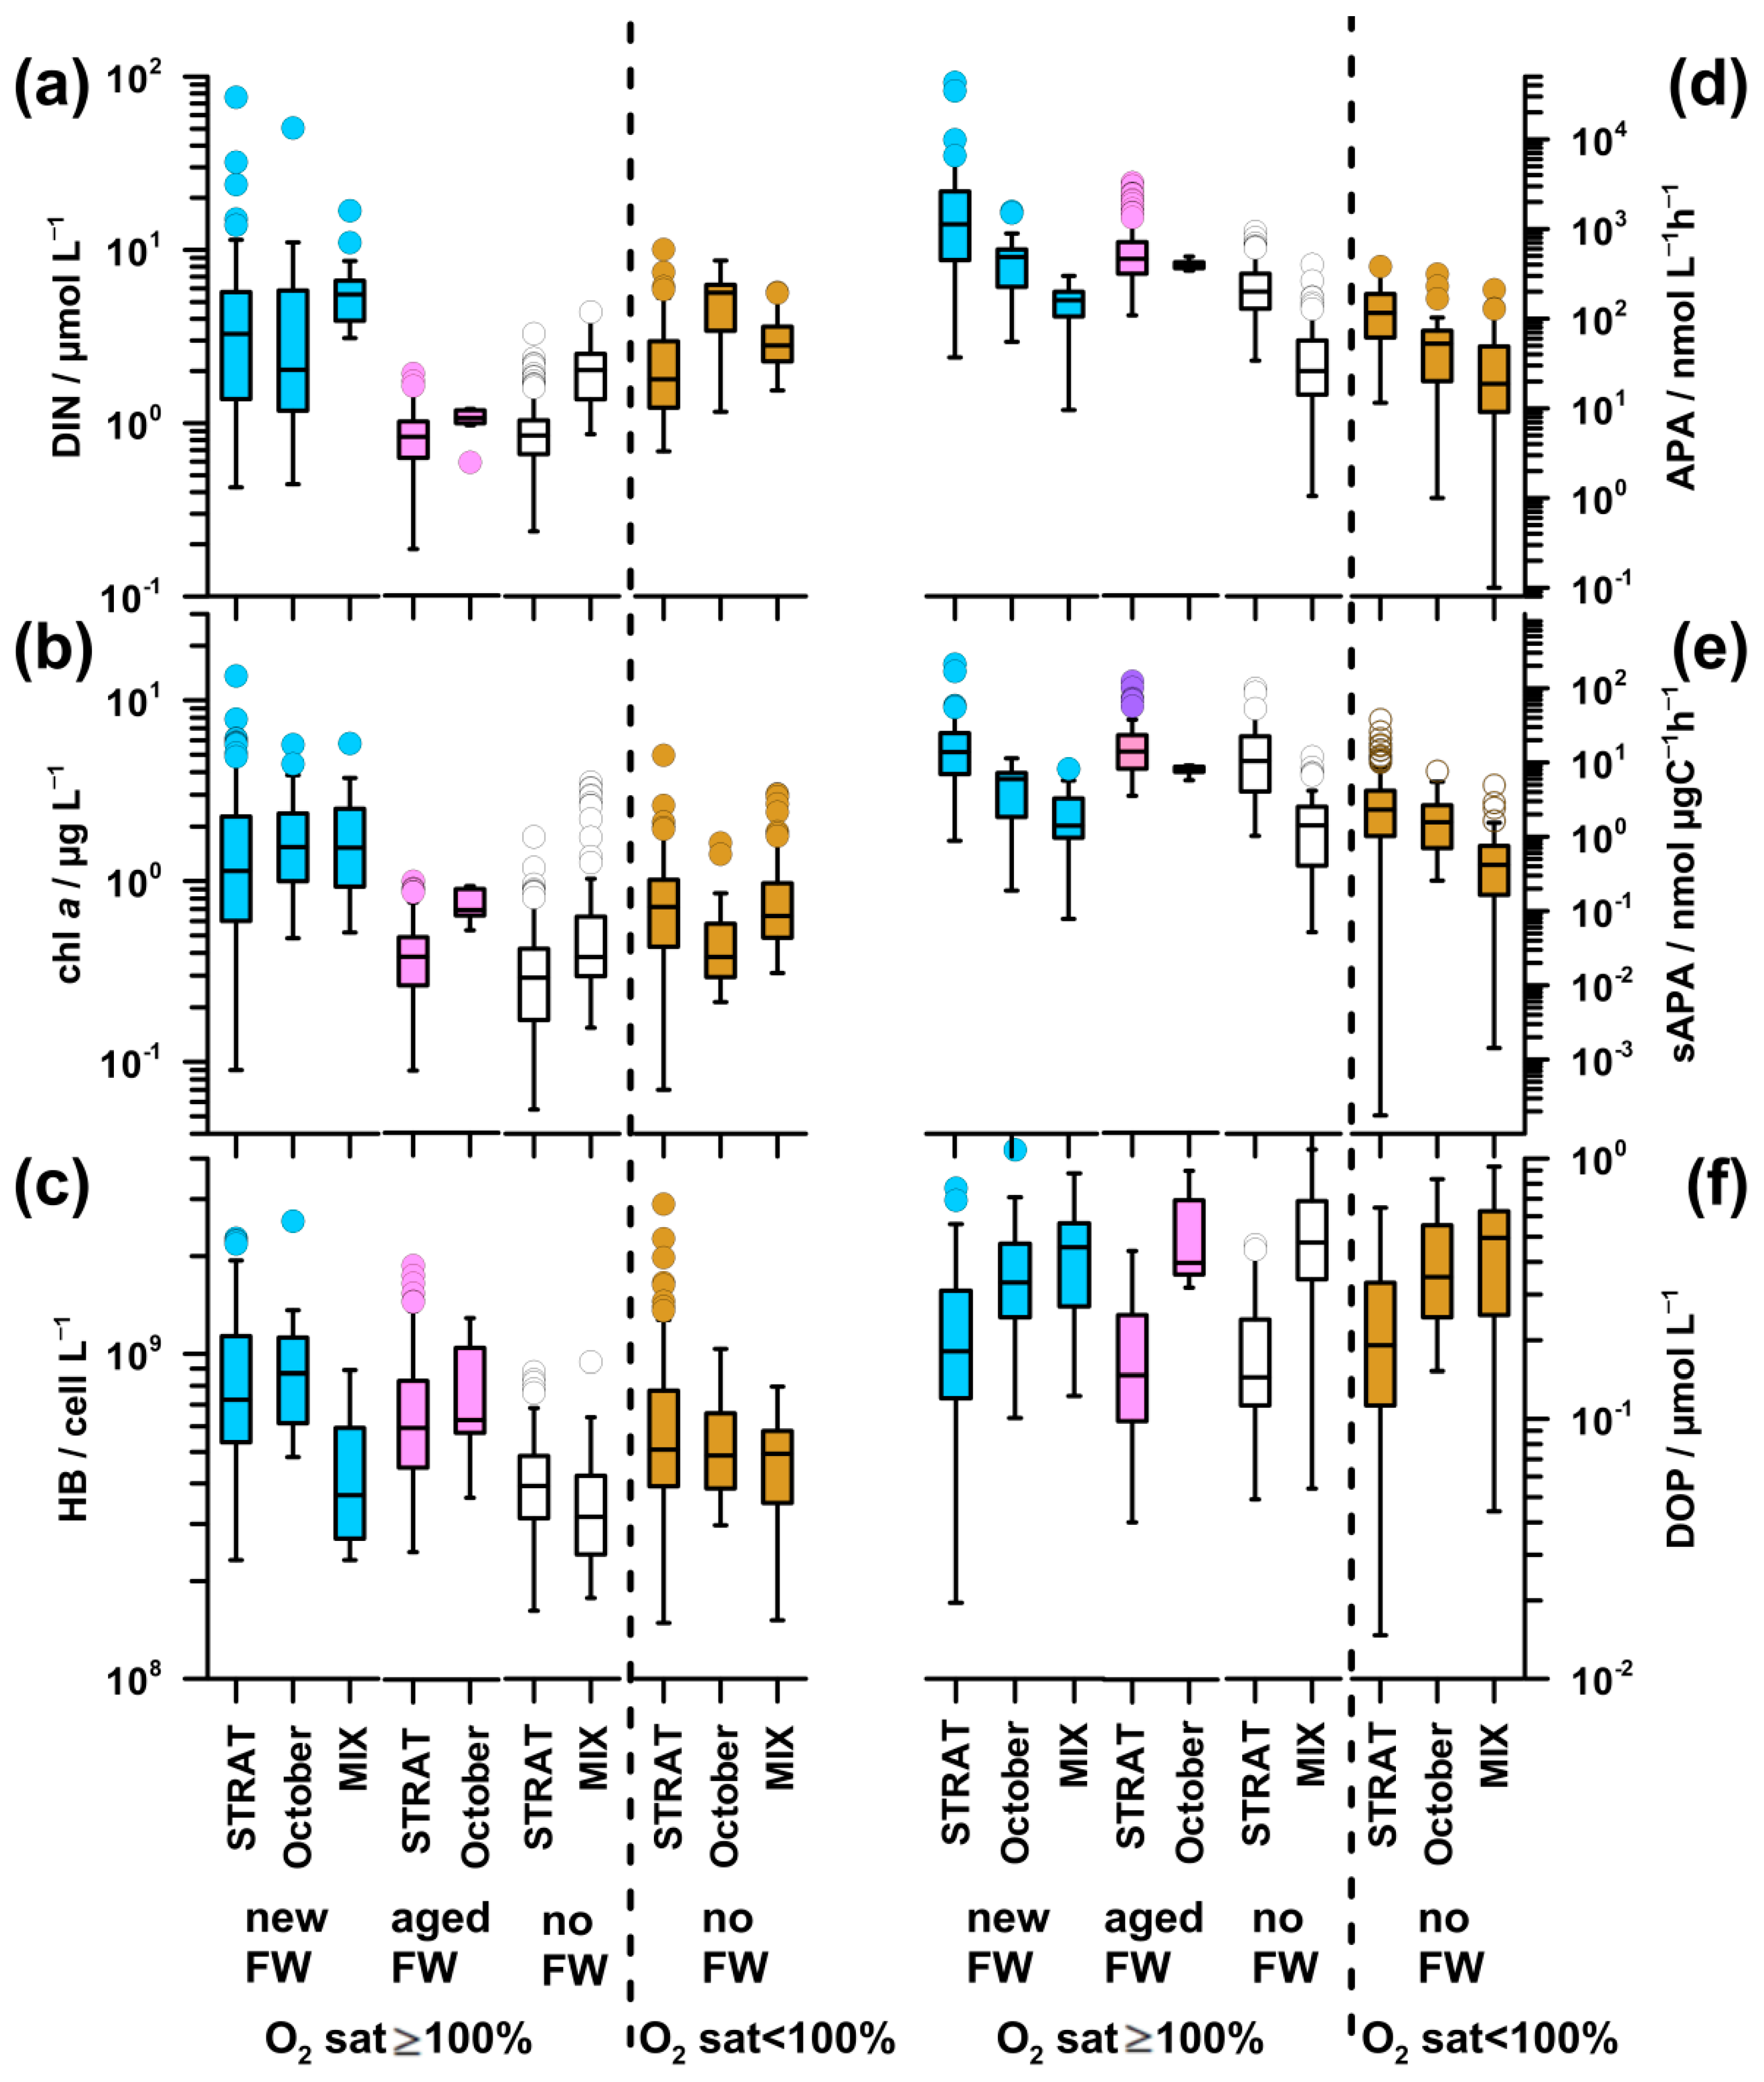
The highest DIN concentration was found in new-FW waters during STRAT and MIX, as well as in October in undersaturated waters (3.2–5.7 µmol L−1; Figure 7a). It was particularly low in aged-FW waters, and in saturated no-FW waters during STRAT (0.8–1.1 µmol L−1). Intermediate values were found in saturated no-FW waters during MIX and undersaturated waters during STRAT and MIX (2.0–2.9 µmol L−1).
The pattern of PO4 (Figure A1c) was similar to that of DIN, although differences were less pronounced. The highest values (0.04 µmol L−1) were found in undersaturated waters in October, whereas the lowest values (0.01 µmol L−1) were found in saturated waters during STRAT.
Inorganic N/P ratio (57–202; Figure A1d) was significantly higher than the critical for P limitation in all water types. The highest N/P ratio was characteristic for new-FW waters during STRAT and MIX. The lowest ratio was found in undersaturated waters in October, followed by that in aged-FW and no-FW saturated waters during STRAT (75).
The highest chl a concentration (1.2–1.5 µg L−1) was found in new-FW waters saturated by oxygen and rich in nutrients, in all periods (Figure 7b). The lowest values were characteristic for nutrient-depleted aged-FW and saturated no-FW waters during STRAT (0.3 and 0.4 µg L−1, respectively), as well as for nutrient-replete cold saturated waters during MIX (0.4 µg L−1). In aged-FW waters during October, and in undersaturated waters, intermediate values were found (0.7 µg L−1): higher than in nutrient-depleted and lower than in nutrient-rich saturated waters.
HB abundance was high in new-FW waters during STRAT and October (73–87 × 107 cell L−1; Figure 7c). A decrease was observed in aged-FW waters of both periods (59–63 × 107 cell L−1), although much less marked than the decrease in chl a concentration (Figure 7b,c). Low abundance was found in saturated no-FW waters during STRAT (39 × 107 cell L−1), as well as in MIX (32–37 × 107 cell L−1), irrespective of freshwater influence. In undersaturated waters, bacterial abundance was at intermediate levels (50-51 × 107 cell L−1).
In new-FW waters, a clear decrease of APA was observed from high values in STRAT (1129 nmol L−1 h−1; up to 43,000 nmol L−1 h−1), to intermediate in October (484 nmol L−1 h−1) and to relatively low during MIX (163 nmol L−1 h−1 Figure 7d). Intermediate values were observed in aged-FW waters (387–462 nmol L−1 h−1). Low APA was found in no-FW saturated and undersaturated waters, particularly during MIX (20-26 nmol L−1 h−1).
Since fluctuations in microbial biomass influence APA, specific APA was calculated to eliminate this effect. In saturated waters, specific APA (Figure 7e) was for an order of magnitude higher during STRAT (10.5–14.9 nmol µg C−1 h−1) than during MIX (1.4 nmol µg C−1 h−1). Intermediate values were found in October (5.9–8.0 nmol µg C−1 h−1), with higher values in aged-FW than in new-FW. During STRAT, the highest values were characteristic for new-FW waters, and the lowest values for no-FW. During MIX, specific APA was similar in waters influenced or not by freshwater. The lowest values were found in undersaturated waters during MIX (0.5 nmol µg C−1 h−1).
DOP concentration was low in waters with high APA and vice versa (Figure 7d,f). Consequently, in saturated waters, DOP concentration was markedly lower during STRAT (0.15–0.18 µmol L−1) than during MIX (0.46–0.47 µmol L−1). However, in October, relatively high APA was coupled with relatively high DOP (0.33–0.40 µmol L−1). In undersaturated waters, DOP values increased from STRAT (0.19 µmol L−1) toward MIX (0.41 µmol L−1).
Unlike in STRAT and MIX, in October, undersaturated new-FW waters constituted an important part of the water body. These waters had similar temperature, but lower DIN concentration (3.0 µmol L−1), higher N/P ratio (246), chl a concentration (1.0 µg L−1), and bacterial abundance (6 × 10⁷ cell L−1) (data not shown) than the respective undersaturated no-FW waters. Although APA was twice higher in new-FW waters, specific APA was similarly low in both water types.
3.4. Relationships between APA and Relevant Parameters
The influence of microbial biomasses, phosphorus availability, and temperature on APA was further analyzed by means of principal component analysis (PCA).
In oxygen-saturated new-FW waters, PC1 explained 38.04–43.17% and PC2 21.74–31.52% of the variability (Figure 8). In all periods, chl a and HB were positively correlated. Positive correlation of APA with HB and chl a was found only in STRAT (Figure 8a). In this period, APA was not correlated with PO4, although PO4 and DOP were inversely correlated. In October, APA was inversely correlated with DOP and PO4, and only loosely correlated with chl a and HB (Figure 8b). In MIX, APA was not correlated with chl a and HB, but it was inversely correlated with DOP (Figure 8c). APA and temperature were not correlated in STRAT, while in October and MIX, they were inverse.
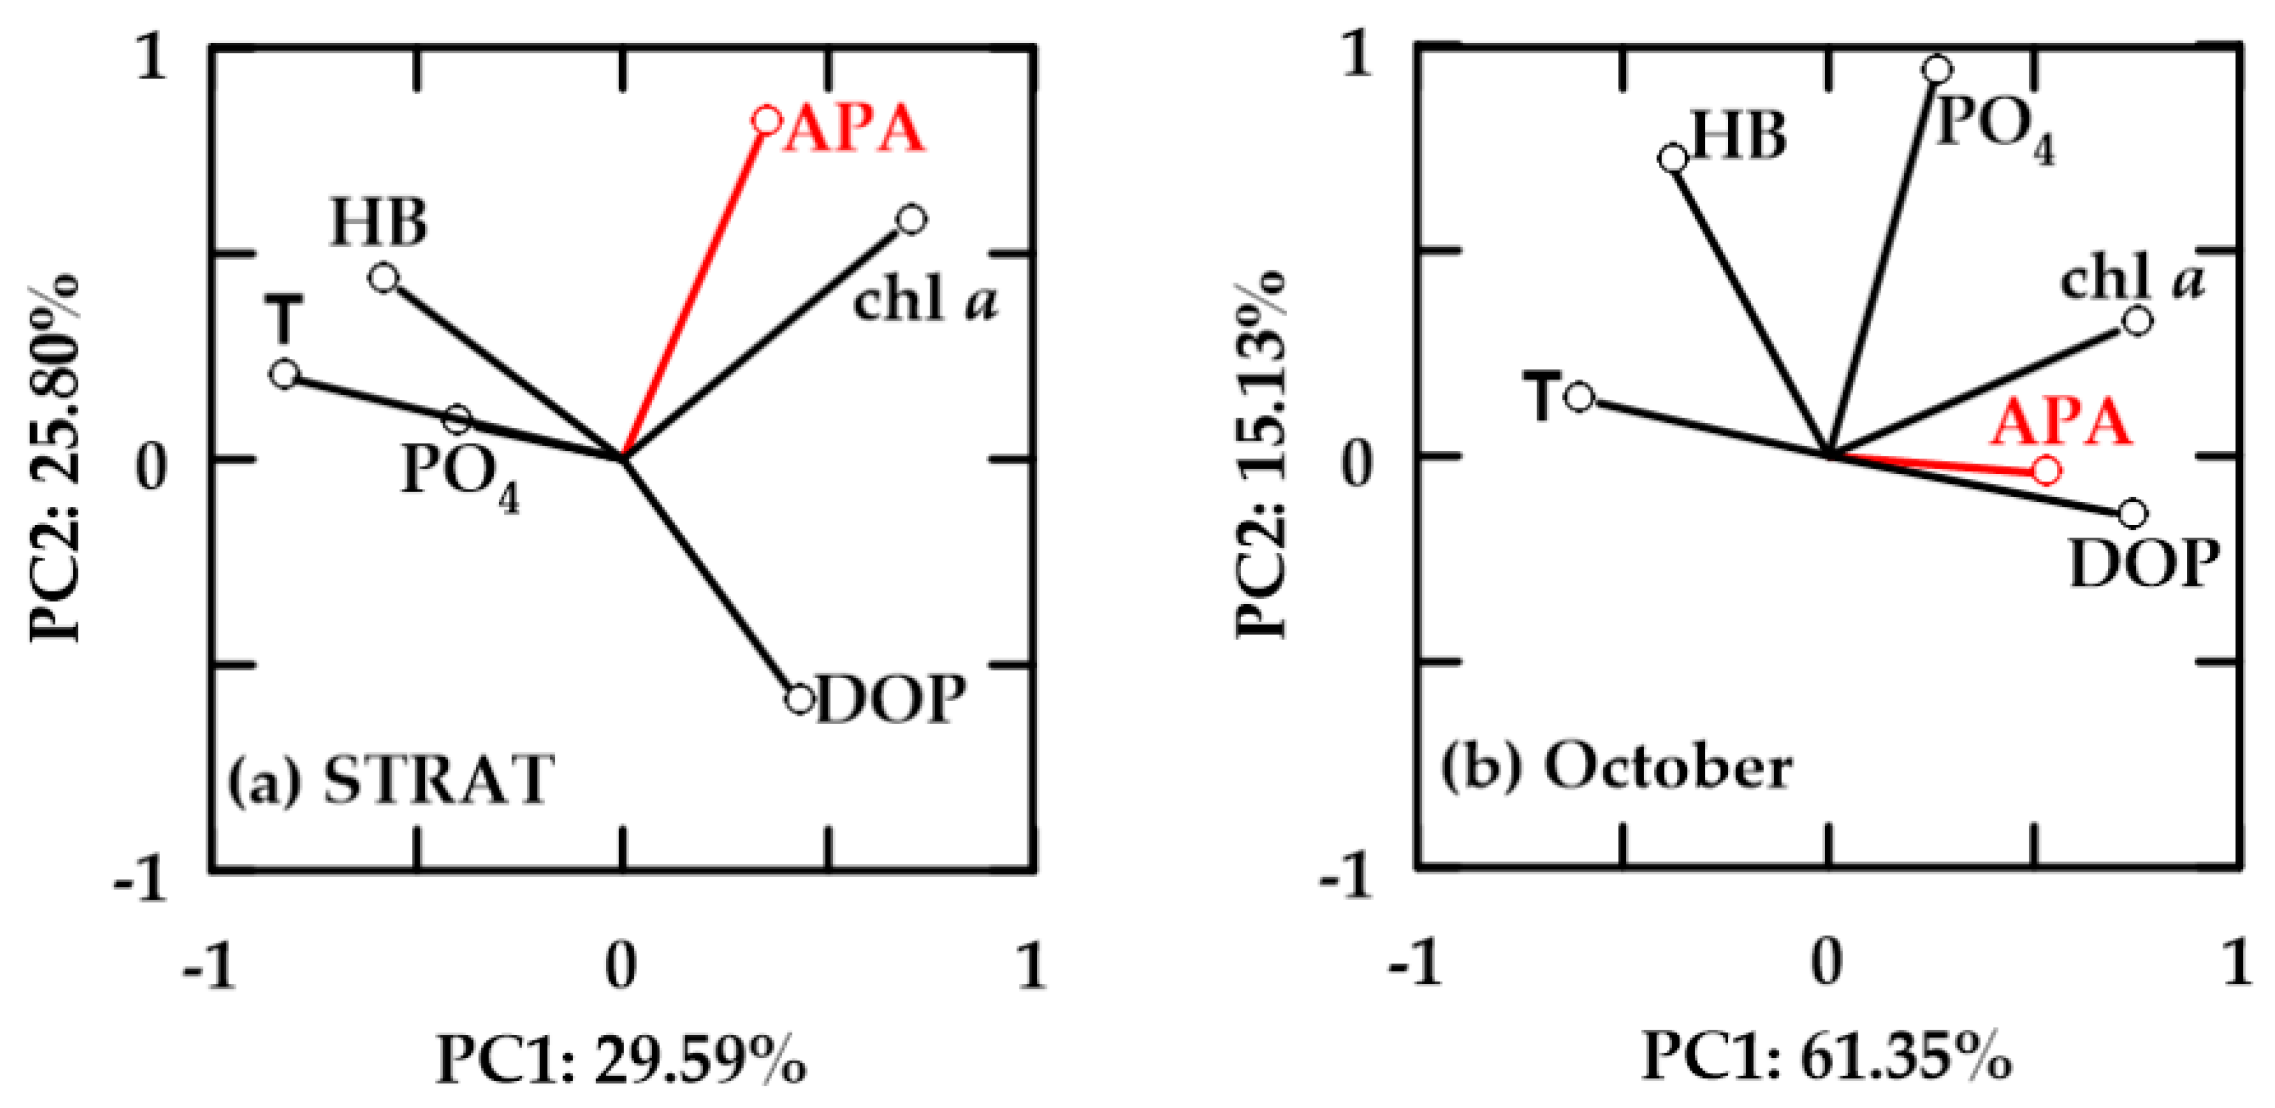
In oxygen-saturated aged-FW waters, PC1 explained 29.59–61.35% and PC2 15.13–25.80% of the variability (Figure 9). In these waters, HB and chl a were not correlated. APA was positively correlated with chl a, but not with HB. In October, influence of APA was weak, while chl a was also positively correlated with PO4. HB was negatively correlated with DOP, and positively correlated with temperature and PO4 (Figure 9). However, in both periods, HB correlation with temperature was more important than with PO4. APA was not correlated (STRAT), or it was inverse (October) to temperature.
In oxygen-saturated no-FW waters, PC1 explained 33.22–34.77% and PC2 24.05–26.86% of the variability (Figure 10). In these waters, chl a and HB were positively correlated. APA was not correlated with chl a and HB, but it was positively correlated with temperature, negatively with DOP, and also with PO4 in MIX. In STRAT, chl a and HB were inverse to PO4, while they were positively correlated in MIX.
In oxygen-undersaturated no-FW waters, PC1 explained 30.48–43.19% and PC2 19.71–23.93% of the variability (Figure 11). APA, chl a, and HB were positively correlated in STRAT and MIX (Figure 11a,c). APA was also negatively correlated with DOP, but in STRAT, negative correlation with PO4 was more important than with DOP. Temperature and APA were not correlated.
In October, undersaturated no-FW (Figure 11b) and new-FW (not shown) waters showed similar PCA. Chl a and HB were not correlated. APA was positively correlated with chl a and temperature, negatively correlated with PO4, and not correlated with HB. The only difference between these two water types in October was that in no-FW waters, HB was inversely correlated with DOP (Figure 11b), while in new-FW waters, HB was positively correlated with PO4.
4. Discussion
During 2004–2013, environmental conditions and changes of microbial biomass were affected by the seasonal heating/cooling processes, changes in light intensity, and freshwater inputs, as already reported for the area [28,38,65,66]. Temperature followed an annual cycle common at these latitudes with minimal values in February and maximal values in upper waters in July–August. The cold months, November–March, were characterized with homogenous water column and high-salinity waters. From April, a progressive stratification of the water column occurred, reaching the maximum in summer.
Phytoplankton biomass followed changes in nutrients availability, displaying high values in late winter–spring and low values in summer. Bacterial abundance was minimal in cold waters during November–March, while maximal values were observed during phytoplankton blooms in April–May and in September–October. High Po River discharges during the stratification period bring a high quantity of freshwater nutrients, triggering massive phytoplankton blooms (chl a up to 13.6 µg L−1). Very fast PO4 uptake caused low PO4 concentrations (maximal 0.15 µmol L−1), even in riverine plumes enriched in DIN (up to 76 µmol L−1). This is consistent with the capacity of phytoplankton to store large quantity of P into intracellular pools when growing in P-limiting conditions and in changing nutrient availability [67,68].
APA followed a clear seasonal cycle with markedly higher values in waters with predominating assimilation than in waters predominated by regeneration. During cold months, low APA and high DOP concentration indicated that organic pool was not important as P source for microbes, suggesting a weak P stress. In waters where the assimilation prevailed, APA increased toward spring and remained high during summer. In these months, microbial growth, particularly of phytoplankton, was limited by low nutrient concentration, especially by PO4 which was practically exhausted in upper oxygen-saturated waters. High APA and low DOP concentration indicated a significant utilization of organic pool. Pulses of riverine nutrients even boosted APA due to the marked DIN surplus in respect to PO4 in riverine waters [23,27]. While the low winter APA was similar to elsewhere, high spring–summer values during freshets (often >1000 nmol L−1 h−1) far exceeded values reported for the Mediterranean Sea [69] and coastal areas influenced by freshwater [3,4,13,70,71], as well as for the productive Baltic Sea [72]. This high APA could be explained by the combined effects of a high quantity of freshwater nutrients which stimulate microbial growth, and a strongly unbalanced inorganic N/P ratio in riverine waters which exacerbates P-limiting conditions. In productive eutrophic waters, low PO4 concentrations (0.01 µmol L−1) were similar to oligotrophic Mediterranean waters [6]. In contrast, DIN concentrations often reach values typical for more eutrophic areas, such as the Baltic Sea [73]. The high availability of DIN depletes PO4 and stimulates APA.
In waters predominated by regeneration, APA was markedly lower than in waters where the assimilation prevailed. In these waters, regenerated PO4 was generally higher than in oxygen-saturated waters, and APA could have a different function. Some authors supposed that APA is not regulated only by PO4 concentration, but it could be expressed in C-limited conditions, contributing to both C and P cycles [13,74,75].
4.1. Eutrophic Events
In upper waters, freshets increased nutrients availability and sustained high phytoplankton biomass in all periods. In these waters, where classic food web predominates [51], bacteria and phytoplankton were related, suggesting a coupling between primary production and bacterial carbon demand. However, microbial ecology in specific periods differs greatly. During eutrophic events, APA was not influenced by temperature.
During the stratification, bacterial abundance and phytoplankton biomass were high. Both phytoplankton and bacteria were not related to PO4, but correlated with APA, indicating that both relied on DOP. The ability of phytoplankton and bacteria to use DOP as a source of P was already confirmed in the NA [76,77]. In conditions of high inorganic nutrients, phytoplankton outcompeted bacteria [78,79] that remained P-limited. However, due to the marked riverine overload of N compared to P, phytoplankton also remained P-limited. These eutrophic waters were characterized with the highest N/P ratio and the highest degree of P stress. High APA (median 1129 nmol L−1 h−1, up to 43,000 nmol L−1 h−1) exceed values reported for other coastal areas influenced by freshwater, as mentioned above. While the high APA in eutrophic waters could be due to high microbial biomass, the highest specific APA gives a good insight into P limitation of microbial growth [80]. Indeed, during the stratification in eutrophic NA waters all dominant diatom species expressed APA and P turnover time mediated by APA was shorter than 5 h [33], indicating P limitation [81]. Consequently, the lowest DOP concentration was found, in spite of the enhanced production of dissolved organic matter in these low-salinity waters [52].
During the mixing period, bacterial growth in eutrophic waters was slowed down by unfavorable low temperature, causing their low abundance. Phytoplankton and bacteria were not related to APA but to PO4, suggesting that they thrived on it. Low APA and high DOP concentration indicated that DOP was not a significant source of P for microbes. Specific APA was for one order of magnitude lower than in the respective waters during the stratification period, pointing to the low level of P stress. In these waters, long P turnover time was found (62–257 h), and phytoplankton did not express APA [33]. These findings indicate the mitigation of P limitation during the mixing period.
The observed differences of nutrient acquisition mechanisms during freshets in stratified and mixed conditions are due to different nutrient sources. While during freshets in stratified conditions the main source was N/P unbalanced riverine supply, during the mixing, N/P-balanced nutrient flux from bottom waters was superimposed to the riverine supply. In bottom waters, N/P ratio is almost balanced for microbial requirements [33,82]. However, during the mixing period, N/P ratio was still high and apparently unbalanced for microbial requirements in waters where the assimilation prevailed. This is due to the very fast uptake of imported PO4 [83]. Furthermore, in this period, microbial growth is also limited by low temperature (bacteria) and low light intensity (phytoplankton).
During freshets in October, the nutrient flux from the bottom and their riverine import triggered phytoplankton blooms. Water temperature was still favorable for bacterial growth, and in these waters their maximal abundance was found. Bacteria and phytoplankton were not completely independent of APA, although their relation was looser than during the stratification, particularly for phytoplankton. Specific APA was between the low winter and high summer values. DOP concentration was twice the summer value, although significantly lower than during the mixing period. This is in agreement with an intermediate P turnover time found in this month (17–24 h) [33]. Onset of mixing alleviates P limitation, but unlike during the winter, microbes are still experiencing P deficit.
Productive low-salinity waters constituted an important part of waters in the NA, particularly in upper layers of western and central areas (up to 72% of waters). Their maximal incidence was observed in April–May and September–October, when the increased Po River discharge and formation of anticyclonic gyres retained freshwater in the area and transported it towards the east [40,84]. During the mixing period, contribution of eutrophic low-salinity waters was only intermittent, due to a cyclonic circulation and outflow of riverine waters along the western coast [45].
4.2. Post-Eutrophic Conditions
In oxygen-saturated, aged low-salinity waters circulating in the area during the stratification, nutrients were exhausted and phytoplankton biomass minimal. Low phytoplankton biomass was not caused only by low nutrient concentration, since in summer a peak of photosynthetic activity with no corresponding peak in phytoplankton biomass is often found in the NA [85]. This discrepancy could be explained by grazing, since the summer is characterized by high microzooplankton abundance [86]. In aged waters, phytoplankton and bacteria were not related, suggesting a decoupling between primary production and bacterial carbon demand [87,88]. Bacterial growth was probably supported by the excess of organic matter retained after eutrophic events. Rich pools of transformed dissolved organic matter were most probably produced by microheterotrophs [53], due to distinct predominance of heterotrophs over autotrophs in these waters [51]. Consequently, the decrease of bacterial abundance in post-eutrophic conditions was mild compared to the drastic decrease in phytoplankton biomass. Besides the substrate availability, bacterial growth was favored by seawater warming, as these waters were characterized with the highest temperature. The thermic increase in the Central Mediterranean was reflected in the increase of bacterial abundance and activities [89].
In post-eutrophic conditions during the stratification, APA was lower than during freshets, following the decrease in microbial (particularly phytoplankton) biomass, and still independent of temperature. However, specific APA was similarly high as during freshets, suggesting persistence of P limitation. This is supported by short APA-mediated P turnover time in these waters (1 min to 5 h [33]). APA was associated with phytoplankton, while bacteria were related to PO4. In conditions of low inorganic nutrient availability, bacteria are superior competitors in their uptake [78,79], thus depriving phytoplankton of nutrients. Therefore, bacteria thrived on low concentration of regenerated PO4, while phytoplankton used DOP. During post-eutrophic conditions, an increased abundance of protozoans was found in the NA [51], which are important in regenerating P [90,91]. In other mid-latitude coastal areas influenced by river effluent, phytoplankton also used DOP to alleviate P limitation [71]. The inverse correlation of bacteria and DOP may indicate bacterial consumption of DOP, although bacteria were apparently not related to APA. Although bacteria can express other enzymes to hydrolyze DOP, much higher phytoplankton than bacterial APA can cause observed discrepancy between APA and bacteria, even if they express this activity. In post-eutrophic conditions during the stratification, bacterial and phytoplankton biomasses were almost equal, while phytoplankton APA contributed on average 67%, and bacterial only 23%, in total activity [92]. Bacteria can express APA even if not P-limited, since it could also serve to provide C [13,75]. An increased utilization and recycling of dissolved organic matter by bacteria in warm periods has also been observed in the Central Mediterranean [89].
In post-eutrophic conditions during October, nutrient concentration and phytoplankton biomass were about two times higher than during the stratification. The decoupling between primary production and bacterial carbon demand still persisted. Unlike the stratification, phytoplankton was more associated with PO4 than with APA, implying that their growth was more stimulated by PO4 supply from the deeper layer than sustained by organic P. Even though APA was similar to respective waters during the stratification, specific APA was half, and DOP concentration more than two times higher. This is consistent with the alleviation of P deficit by the onset of vertical mixing.
Post-eutrophic conditions were found in upper layers of the entire area, with a maximal incidence at the central and eastern areas (up to 44% of waters). Aged low-salinity waters were retained in the area during the stratification and in October, with maximal occurrence from July to September. These waters were not found during winter due to the intensive water exchange with the middle Adriatic.
4.3. Oligotrophic Conditions
In high-salinity waters dominated by assimilation, nutrient concentration and microbial biomass were markedly lower than during freshets. Bacteria and phytoplankton were coupled, and both were independent of APA. In these waters originating from the middle Adriatic, APA increased with temperature, as already observed in the Ionian Sea and in the Otranto Strait [89], waters entering in the Adriatic Sea.
In oligotrophic waters during the stratification, microbial food web became very important in nutrient recycling [51,93]. Phytoplankton and bacteria were inversely related to PO4, indicating its intensive removal, probably by bacteria which are better competitors in these conditions. APA was for one order of magnitude lower than in eutrophic waters, and similar to coastal areas in the Mediterranean Sea [3,70,89]. Specific APA was also lower than in eutrophic waters, although it was still high, suggesting persistence of P limitation. Furthermore, APA and low DOP concentration were opposite, suggesting considerable hydrolysis of organic P. Disconnection between APA and microbes could not be attributed to free enzymes, since in oxygen-saturated NA waters, their activity is always low, less than 10% of total activity [33,77]. Most likely, this discrepancy is due to the fact that many phytoplankton species expressing APA are not abundant, while more abundant species do not express APA. In oligotrophic conditions during the stratification, the study area is generally dominated by pico- and nanophytoplankton [51,94]. Smaller phytoplankton exhibit higher APA than larger phytoplankton due to the higher surface/volume ratio, since AP is bound to the cell surface [95]. However, smaller phytoplankton contribute less to total biomass than the larger ones. Furthermore, diatom species with low contribution to total biomass express APA during oligotrophic conditions in summer, while those contributing more to total biomass did not express APA [33].
In oxygen-saturated high-salinity waters during the mixing period, nutrient concentration was higher than during the stratification, and probably not limiting for microbial growth. Their growth was slowed down by unfavorable conditions, particularly for bacteria. Low APA was similar to winter values in the Mediterranean Sea [89]. Although APA and DOP concentration were opposite, low activity and high DOP concentration showed that hydrolysis was not significant. Low specific APA, characteristic for all water types during the mixing, indicated low level of P stress. During the mixing period, long APA-mediated P turnover (80–257 h) [33] confirms the mitigation of P stress.
Saturated oligotrophic waters are mainly located in intermediate layers of the water column at the western and central areas, and they often occupy the whole water column at the easternmost area. Their maximal incidence was found during February and March (80–94% of waters) when a prevalent cyclonic circulation advected oligotrophic waters from the middle Adriatic, and the increasing light intensity favored assimilation processes. During May–September, these waters were less frequent than saturated low-salinity waters, and practically disappeared from October to January, being replaced with undersaturated high-salinity waters.
4.4. Undersaturated Waters
In deeper waters of all periods, regenerative processes generate high nutrient concentration, predominating over the input of Southern Adriatic waters, which are oligotrophic [38,96]. In these waters, the highest nutrient concentration was found in October, due to the progressive accumulation during the stratification period. Phytoplankton biomass was also higher than in oligotrophic upper waters. This is partially due to the increased chlorophyll a content per cell in these cold, nutrient-replete waters with low light intensity [97,98]. On the other hand, during oligotrophic conditions in upper waters, production in these nutrient-rich waters could be enhanced [99]. The NA is a shallow sea, and the euphotic zone can extend to the bottom in clear oligotrophic waters. However, during extensive phytoplankton blooms in upper waters, light may be limiting for phytoplankton growth in these deeper waters. Bacterial abundance was relatively high, and during the mixing period, it was higher than in upper, oxygen-saturated waters due to higher temperature in these deeper waters. During the stratification and mixing periods, bacterial abundance was coupled with phytoplankton biomass. Although in these periods APA was associated with microbes, low specific APA suggested that they probably were not P-limited. This is in agreement with long APA-mediated P turnover time in undersaturated waters, generally far above 5 h (up to 135 h [33]). In these waters, APA could be suppressed by PO4 [100], as shown by their inverse correlation during the stratification.
During October, two types of undersaturated waters were found: high-salinity and new low-salinity waters, formed by cooling and sinking of currently present surface waters. Although in low-salinity waters phytoplankton biomass and bacterial abundance were higher than in high-salinity waters, the relationships between microbial biomass, P sources, and APA were similar. Bacteria and phytoplankton were uncoupled, and APA was associated with phytoplankton. However, specific APA was low, implying that it was not important in providing P to phytoplankton. The only difference was that in high-salinity waters, bacteria probably used DOP, while in fresher waters, thrived on PO4.
Oxygen-undersaturated waters were important below 20 m of depth, contributing more than 50% of waters in these layers along the entire area. Their maximal incidence, often 100%, was found at the bottom. From November to January, their contribution was important also in the upper part of the water column. In October/November, the mixing in the water column raised up undersaturated bottom waters and the reduced assimilation during cold winter months could not compensate consumed oxygen. Slightly undersaturated water column during winter months is characteristic for eutrophic areas [38]. In October, eutrophic waters also constituted an important fraction (~20%) in undersaturated waters. This is due to the combined effect of intensive vertical mixing and conspicuous input of new freshwater.
5. Conclusions
This study showed the microbial response to different trophic conditions created by changing freshwater inputs in different hydrodynamic conditions. This is an essential forcing in the NA ecosystem, since low-salinity waters constitute an important part of waters in the area during most of the year (April–October), shaping the environmental and trophic conditions. In low-salinity waters, specific APA was markedly higher than in high-salinity waters, indicating that freshwater exerts an important influence on P status in the area. The P-limited conditions in the Po discharge are largely due to a direct anthropogenic alteration of the nutrient fluxes in its drainage basin [21,23,27]. A future increase in the frequency of extremely high Po River discharges in spring and early summer [28] would not only influence the productivity of the area, but could push the system toward more expressed P-limiting conditions.
In low-salinity waters, effect of temperature on APA was not observed, as P stress exerted markedly higher influence on the activity. However, in waters not influenced by freshwater, temperature was important in regulating APA. The NA is currently affected by a long-term warming, more pronounced in winter (+2.98% year−1) than in summer (0.14% year−1) [28]. Consequently, in the future, a potential APA increase could be expected during the winter. Since in winter APA is not an important prerequisite to sustain microbial growth, the possible future increase in winter activity should not have a great ecological importance on P availability. However, it remains to establish the effect of sea water warming and changes in Po River regime on the circulation in the area and on the water column stability. A delay of the water column mixing and of water exchange with the middle Adriatic could prolong periods of P limitation.
Results of this study are important in the light of the growing evidence that P is the limiting nutrient in coastal systems affected by continental nutrients loads worldwide. In these systems, APA is reported to be important to supply P for the microbial growth. Consequently, results of this study can improve the understanding of the importance of organic P pools for the microbial growth in coastal systems influenced by changing hydrological and climatic conditions.
Author Contributions
Conceptualization, I.I., S.C., R.K., and M.N.; methodology, I.I.; validation, I.I., S.C., M.N., and R.K.; investigation, I.I., R.K., M.N., and S.C.; resources, I.I. and S.C.; data curation, I.I. and S.C.; writing—original draft preparation, I.I. and S.C.; writing—review and editing, I.I., S.C., M.N., and R.K.; visualization, I.I. and S.C.; funding acquisition, S.C. and M.N. All authors have read and agreed to the published version of the manuscript.
Funding
This research was funded by the Ministry of Science and Education of the Republic of Croatia, grant number 098-0982705-2729; 098-0982705-2731. Data publication was performed in collaboration to DANUBIUS RI project (H2020—INFRA DEV 2).
Institutional Review Board Statement
Not applicable.
Informed Consent Statement
Not applicable.
Data Availability Statement
The original contributions presented in the study are included in the article/Appendix A. Further inquiries can be directed to the corresponding authors.
Acknowledgments
We thank P. Paliaga, T. Đakovac, J. Jakovčević, M. Buterer, K. Matošović, and P. Krelja for help during sampling and analyses. D.M. Lyons is thanked for English corrections. We also thank the crew of R/V Vila Velebita for helping during sampling. Po River flow data were provided by Regional Environmental Protection Agency of Emilia Romagna Region (ARPA; URL: http://www.arpa.emr.it/, accessed on 21 September 2020). We thank the three anonymous reviewers for constructive comments.
Conflicts of Interest
The authors declare no conflict of interest.
Appendix A

Table A1.
Comparison of parameters in (a) different water types * by period ** and (b) in different periods by water type using nonparametric Kruskal–Wallis H test. Reported H values are bolded when significant at p < 0.01, in italic when significant at p < 0.05, and in grey when not significant.
Table A1.
Comparison of parameters in (a) different water types * by period ** and (b) in different periods by water type using nonparametric Kruskal–Wallis H test. Reported H values are bolded when significant at p < 0.01, in italic when significant at p < 0.05, and in grey when not significant.
| (a) | New-FW | Aged-FW | No-FW | No-FW | |
| O2 Sat ≥ 100% | ≥100% | ≥100% | <100% | ||
| Parameter *** | Strat, Oct, Mix | Strat, Oct | Strat, Mix | Strat, Oct, Mix | Fig. |
| T °C | 37.2 | 154.5 | 8.7 | 61.3 | Figure A1a |
| S | 10.3 | 36.4 | 5.9 | 7.0 | Figure A1b |
| DIN µmol L−1 | 9.4 | 114.2 | 6.9 | 56.1 | Figure 7a |
| PO4 µmol L−1 | 6.3 | 26.5 | 1.8 | 30.0 | Figure A1c |
| N/P | 6.4 | 4.7 | 5.1 | 8.9 | Figure A1d |
| Chl a µg L−1 | 2.0 | 21.3 | 16.9 | 21.2 | Figure 7b |
| HB cell L−1 | 18.1 | 8.0 | 0.4 | 4.1 | Figure 7c |
| APA nmol L−1h−1 | 40.2 | 130.5 | 0.9 | 122.4 | Figure 7d |
| sAPA nmol µC−1h−1 | 45.1 | 72.8 | 8.4 | 80.7 | Figure 7e |
| DOP µmol L−1 | 26.0 | 115.7 | 20.9 | 92.0 | Figure 7f |
| n **** | 15, 92, 35 | 119, 9 | 93, 158 | 118, 144, 33 | |
| Mix | Strat | Oct | Oct | ||
| (b) | O2 Sat ≥ 100% | ≥100% | ≥100% | <100% | |
| New-, No-FW | New-, Aged-, No-FW | New-, Aged-FW | New-, No-FW | Fig. | |
| T °C | 6.4 | 92.9 | 6.7 | 8.4 | Figure A1a |
| S | 38.1 | 284.8 | 9.6 | 36.7 | Figure A1b |
| DIN µmol L−1 | 34.2 | 135.9 | 7.4 | 6.4 | Figure 7a |
| PO4 µmol L−1 | 2.4 | 14.1 | 5.3 | 16.3 | Figure A1c |
| N/P | 7.8 | 96.7 | 0.3 | 18.5 | Figure A1d |
| Chl a µmol L−1 | 19.8 | 105.1 | 7.2 | 17.3 | Figure 7b |
| HB cell L−1 | 1.5 | 84.5 | 2.1 | 1.7 | Figure 7c |
| APA nmol L−1 h−1 | 17.1 | 132.2 | 0.3 | 5.6 | Figure 7d |
| sAPA nmol µgC−1 h−1 | 0.9 | 8.2 | 4.4 | 0.0 | Figure 7e |
| DOP µmol L−1 | 0.9 | 4.7 | 4.0 | 0.6 | Figure 7f |
| n ***** | 15, 93 | 92, 119, 158 | 35, 9 | 21, 33 |
* Waters oversaturated in oxygen (O2 sat ≥ 100%): new freshwater (new-FW), aged freshwater (aged-FW), and without freshwater (no-FW); undersaturated waters (O2 sat < 100%): no-FW. ** Mixing period (MIX), stratification period (STRAT), and October (OCT). *** Temperature (T), salinity (S), dissolved inorganic nitrogen (DIN), orthophosphate (PO4), inorganic N/P ratio (N/P), chlorophyll a (chl a), heterotrophic bacteria (HB), alkaline phosphatase activity (APA), specific APA (sAPA), dissolved organic phosphorus (DOP). **** Number of data for the respective period, except for HB and sAPA (O2 sat ≥ 100% new-FW: 15, 81, 19; aged-FW: 97, 9; no-FW: 59, 107; O2 sat < 100% no-FW: 76, 113, 23). ***** Number of data for the water type, except for HB and sAPA (O2 sat ≥ 100% MIX: 15, 59; STRAT: 81, 97, 107; OCT: 19, 9; O2 sat < 100% OCT: 17, 23).

References
- Elser, J.J.; Bracken, M.E.S.; Cleland, E.E.; Gruner, D.S.; Harpole, W.S.; Hillebrand, H.; Ngai, J.T.; Seabloom, E.W.; Shurin, J.B.; Smith, J.E. Global analysis of nitrogen and phosphorus limitation of primary producers in freshwater, marine and terrestrial ecosystems. Ecol. Lett. 2007, 10, 1135–1142. [Google Scholar] [CrossRef] [Green Version]
- Ly, J.; Philippart, C.J.M.; Kromkampa, J.C. Phosphorus limitation during a phytoplankton spring bloom in the western Dutch Wadden Sea. J. Sea Res. 2014, 88, 109–120. [Google Scholar] [CrossRef] [Green Version]
- Boge, G.; Lespilette, M.; Jamet, D.; Jamet, J.-L. Role of DOP on the alkaline phosphatase activity of size fractionated plankton in coastal waters in the NW Mediterranean Sea (Toulon Bay, France). Mar. Pollut. Bull. 2017, 117, 264–273. [Google Scholar] [CrossRef]
- Decembrini, F.; Caroppo, C.; Caruso, G.; Bergamasco, A. Linking Microbial Functioning and Trophic Pathways to Ecological Status in a Coastal Mediterranean Ecosystem. Water 2021, 13, 1325. [Google Scholar] [CrossRef]
- Krom, M.D.; Emeis, K.-C.; Van Cappellen, P. Why is the eastern Mediterranean phosphorus limited? Prog. Oceanogr. 2010, 85, 236–244. [Google Scholar] [CrossRef]
- Powley, H.R.; Krom, M.D.; Van Cappellen, P. Understanding the unique biogeochemistry of the Mediterranean Sea: Insights from a coupled phosphorus and nitrogen model, Glob. Biogeochem. Cycles 2017, 31, 1010–1031. [Google Scholar] [CrossRef]
- Lomas, M.W.; Burke, A.L.; Lomas, D.A.; Bell, D.W.; Shen, C.; Dyhrman, S.T.; Ammerman, J.W. Sargasso Sea phosphorus biogeochemistry: An important role for dissolved organic phosphorus (DOP). Biogeosciences 2010, 7, 695–710. [Google Scholar] [CrossRef] [Green Version]
- Girault, M.; Arakawa, H.; Hashihama, F. Phosphorus stress of microphytoplankton community in the western subtropical North Pacific. J. Plankton Res. 2012, 35, 146–157. [Google Scholar] [CrossRef] [Green Version]
- Moore, C.M.; Mills, M.M.; Arrigo, K.R.; Berman-Frank, I.; Bopp, L.; Boyd, P.W.; Galbraith, E.D.; Geider, R.J.; Guieu, C.; Jaccard, S.L.; et al. Processes and patterns of oceanic nutrient limitation. Nat. Geosci. 2013, 6, 701–710. [Google Scholar] [CrossRef] [Green Version]
- Ramos, J.B.E.; Schulz, K.G.; Voss, M.; Narciso, Á.; Müller, M.N.; Reis, F.V.; Cachão, M.; Azevedo, E.B. Nutrient-specific responses of a phytoplankton community: A case study of the North Atlantic Gyre, Azores. J. Plankton Res. 2017, 39, 744–761. [Google Scholar] [CrossRef] [Green Version]
- Tyrrell, T. The relative influences of nitrogen and phosphorus on oceanic primary production. Nature 1999, 400, 525–531. [Google Scholar] [CrossRef]
- Karl, D.M. The marine phosphorus cycle. In Manual of Environmental Microbiology, 3rd ed.; Hurst, C.J., Ed.; ASM Press: Washington, DC, USA, 2007; pp. 523–539. [Google Scholar]
- Hoppe, H.-G. Phosphatase activity in the sea. Hydrobiologia 2003, 493, 187–200. [Google Scholar] [CrossRef]
- Yamaguchi, H.; Adachi, M. The utilization of organic phosphorus by eukaryotic phytoplankton in marine environments (review). Bull. Plankton Soc. Jpn. 2010, 57, 1–12. [Google Scholar]
- Lin, S.; Litaker, R.W.; Sunda, W.G. Phosphorus physiological ecology and molecular mechanisms in marine phytoplankton. J. Phycol. 2016, 52, 10–36. [Google Scholar] [CrossRef]
- Dell’Aquila, G.; Maier, U.G. Specific acclimations to phosphorus limitation in the marine diatom Phaeodactylum tricornutum. Biol. Chem. 2020, 401, 1495–1501. [Google Scholar] [CrossRef]
- Doney, S.C. The Growing Human Footprint on Coastal and Open-Ocean Biogeochemistry. Science 2010, 328, 1512–1516. [Google Scholar] [CrossRef] [Green Version]
- Peñuelas, J.; Poulter, B.; Sardans, J.; Ciais, P.; van der Velde, M.; Bopp, L.; Boucher, O.; Godderis, Y.; Hinsinger, P.; Llusia, J.; et al. Human-induced nitrogen–phosphorus imbalances alter natural and managed ecosystems across the globe. Nat. Commun. 2013, 4, 2934. [Google Scholar] [CrossRef] [Green Version]
- Smith, V.H. Eutrophication of freshwater and coastal marine ecosystems. A global problem. Environ. Sci. Pollut. Res. 2003, 10, 126–139. [Google Scholar] [CrossRef] [PubMed]
- Howarth, R.; Chan, F.; Conley, D.J.; Garnier, J.; Doney, S.; Marino, R.; Billen, G. Coupled biogeochemical cycles: Eutrophication and hypoxia in temperate estuaries and coastal marine ecosystems. Front. Ecol. Environ. 2011, 9, 18–26. [Google Scholar] [CrossRef] [Green Version]
- Cozzi, S.; Giani, M. River water and nutrient discharges in the Northern Adriatic Sea: Current importance and long term changes. Cont. Shelf Res. 2011, 31, 1881–1893. [Google Scholar] [CrossRef]
- Volf, G.; Atanasova, N.; Kompare, B.; Ožanić, N. Modeling nutrient loads to the northern Adriatic. J. Hydrol. 2013, 504, 182–193. [Google Scholar] [CrossRef]
- Viaroli, P.; Soana, E.; Pecora, S.; Laini, A.; Naldi, M.; Fano, E.A.; Nizzoli, D. Space and time variations of watershed N and P budgets and their relationships with reactive N and P loadings in a heavily impacted river basin (Po river, Northern Italy). Sci. Total Environ. 2018, 639, 1574–1587. [Google Scholar] [CrossRef]
- Bastari, A.; Micheli, F.; Ferretti, F.; Pusceddu, A.; Cerrano, C. Large marine protected areas (LMPAs) in the Mediterranean Sea: The opportunity of the Adriatic Sea. Mar. Policy 2016, 68, 165–177. [Google Scholar] [CrossRef]
- Furlan, E.; Torresan, S.; Critto, A.; Lovato, T.; Solidoro, C.; Lazzari, P.; Marcomini, A. Cumulative Impact Index for the Adriatic Sea: Accounting for interactions among climate and anthropogenic pressures. Sci. Total Environ. 2019, 670, 379–397. [Google Scholar] [CrossRef]
- Giani, M.; Djakovac, T.; Degobbis, D.; Cozzi, S.; Solidoro, C.; Umani, S.F. Recent changes in the marine ecosystems of the northern Adriatic Sea. Estuar. Coast. Shelf Sci. 2012, 115, 1–13. [Google Scholar] [CrossRef]
- Cozzi, S.; Ibáñez, C.; Lazar, L.; Raimbault, P.; Giani, M. Flow Regime and Nutrient-Loading Trends from the Largest South European Watersheds: Implications for the Productivity of Mediterranean and Black Sea’s Coastal Areas. Water 2019, 11, 1. [Google Scholar] [CrossRef] [Green Version]
- Grilli, F.; Accoroni, S.; Acri, F.; Aubry Bernardi, F.; Bergami, C.; Cabrini, M.; Campanelli, A.; Giani, M.; Guicciardi, S.; Marini, M.; et al. Seasonal and Interannual Trends of Oceanographic Parameters over 40 Years in the Northern Adriatic Sea in Relation to Nutrient Loadings Using the EMODnet Chemistry Data Portal. Water 2020, 12, 2280. [Google Scholar] [CrossRef]
- Geider, R.J.; La Roche, J. Redfield revisited: Variability of C:N:P in marine microalgae and its biochemical basis. Eur. J. Phycol. 2002, 37, 1–17. [Google Scholar] [CrossRef] [Green Version]
- Maestrini, S.Y.; Berland, B.R.; Bréret, M.; Béchemin, C.; Poletti, R.; Rinaldi, A. Nutrients Limiting the Algal Growth Potential (AGP) in the Po River Plume and an Adjacent Area, Northwest Adriatic Sea: Enrichment Bioassays with the Test Algae Nitzschia closterium and Thalassiosira pseudonana. Estuaries 1997, 20, 416–429. [Google Scholar] [CrossRef]
- Ivančić, I.; Degobbis, D. Mechanisms of production and fate of organic phosphorus in the northern Adriatic Sea. Mar. Biol. 1987, 94, 117–125. [Google Scholar] [CrossRef]
- Cozzi, S.; Lipizer, M.; Cantoni, C.; Catalano, G. Nutrient balance in the ecosystem of the North Western Adriatic Sea. Chem. Ecol. 2002, 18, 1–12. [Google Scholar] [CrossRef]
- Ivančić, I.; Pfannkuchen, M.; Godrijan, J.; Djakovac, T.; Pfannkuchen, D.M.; Korlević, M.; Gašparović, B.; Najdek, M. Alkaline phosphatase activity related to phosphorus stress of microphytoplankton in different trophic conditions. Progr. Oceanogr. 2016, 146, 175–186. [Google Scholar] [CrossRef] [Green Version]
- Malfatti, F.; Turk, V.; Tinta, T.; Mozetič, P.; Manganelli, M.; Samo, T.J.; Ugalde, J.A.; Kovač, N.; Stefanelli, M.; Antonioli, M.; et al. Microbial mechanisms coupling carbon and phosphorus cycles in phosphorus-limited northern Adriatic Sea. Sci. Total Environ. 2014, 470–471, 1173–1183. [Google Scholar] [CrossRef] [PubMed]
- Socal, G.; Acri, F.; Bastianini, M.; Bernardi Aubry, F.; Bianchi, F.; Cassin, D.; Coppola, J.; De Lazzari, A.; Bandelj, V.; Cossarini, G.; et al. Hydrological and biogeochemical features of the Northern Adriatic Sea in the period 2003–2006. Mar. Ecol. 2008, 29, 449–468. [Google Scholar] [CrossRef]
- Kraus, R.; Supić, N. Sea dynamics impacts on the macroaggregates: A case study of the 1997 mucilage event in the northern Adriatic. Prog. Oceanogr. 2015, 138, 249–267. [Google Scholar] [CrossRef] [Green Version]
- Ciglenečki, I.; Paliaga, P.; Budiša, A.; Čanković, M.; Dautović, J.; Djakovac, T.; Dutour-Sikirić, M.; Kraus, R.; Kužat, N.; Lučić, D.; et al. Dissolved organic carbon accumulation during a bloom of invasive gelatinous zooplankton Mnemiopsis leidyi in the northern Adriatic Sea; case of the anomalous summer in 2017. J. Mar. Syst. 2021, 222, 103599. [Google Scholar] [CrossRef]
- Solidoro, C.; Bastianini, M.; Bandelj, V.; Codermatz, R.; Cossarini, G.; Melakucanu, D.; Ravagnan, E.; Salon, S.; Trevisani, S. Current state, scales of variability, and trends of biogeochemical properties in the northern Adriatic Sea. J. Geophys. Res. 2009, 114, C07S91. [Google Scholar] [CrossRef]
- Raicich, F.; Colucci, R.R. A near-surface sea temperature time series from Trieste, northern Adriatic Sea (1899–2015). Earth Syst. Sci. Data 2019, 11, 761–768. [Google Scholar] [CrossRef] [Green Version]
- Supić, N.; Orlić, M.; Degobbis, D. Istrian coastal counter current and its year-to year variability. Estuar. Coast. Shelf Sci. 2000, 51, 385–397. [Google Scholar] [CrossRef]
- Zavatarelli, M.; Baretta, J.W.; Baretta-Bekker, J.G.; Pinardi, N. The dynamics of the Adriatic Sea ecosystem: An idealized model study. Deep Sea Res. Part I Oceanogr. Res. Pap. 2000, 47, 937–970. [Google Scholar] [CrossRef] [Green Version]
- Zavatarelli, M.; Raicich, F.; Bregant, D.; Russo, A.; Artegiani, A. Climatological biogeochemical characteristics of the Adriatic Sea. J. Mar. Syst. 1998, 18, 227–263. [Google Scholar] [CrossRef]
- Viličić, D.; Kuzmić, M.; Bosak, S.; Šilović, T.; Hrustić, E.; Burić, Z. Distribution of phytoplankton along the thermohaline gradient in the northeastern Adriatic channel; winter aspect. Oceanologia 2009, 51, 495–513. [Google Scholar] [CrossRef] [Green Version]
- Kraus, R.; Supić, N.; Precali, R. Factors favoring phytoplankton blooms in the northern Adriatic: Towards the northern Adriatic empirical ecological model. Ocean Sci. 2016, 12, 19–37. [Google Scholar] [CrossRef] [Green Version]
- Artegiani, A.; Paschini, E.; Russo, A.; Bregant, D.; Raicich, F.; Pinardi, N. The Adriatic Sea general circulation. Part II: Baroclinic circulation structure. J. Phys. Oceanogr. 1997, 27, 1515–1532. [Google Scholar] [CrossRef]
- Kuzmić, M.; Janeković, I.; Book, J.W.; Martin, P.J.; Doyle, J.D. Modeling the northern Adriatic double-gyre response to intense bora wind: A revisit. J. Geophys. Res. 2006, 111, C03S13. [Google Scholar] [CrossRef] [Green Version]
- Supić, N.; Kraus, R.; Kuzmić, M.; Paschini, E.; Precali, R.; Russo, A.; Vilibić, I. Predictability of northern Adriatic winter conditions. J. Mar. Syst. 2012, 90, 42–57. [Google Scholar] [CrossRef]
- Kraus, R.; Supić, N.; Lučić, D.; Njire, J. Impact of winter oceanographic conditions on zooplankton abundance in northern Adriatic with implications on Adriatic anchovy stock prognosis. Estuar. Coast. Shelf Sci. 2015, 167, 56–66. [Google Scholar] [CrossRef]
- Russo, A.; Maccaferri, S.; Djakovac, T.; Precali, R.; Degobbis, D.; Deserti, M.; Paschini, E.; Lyons, D.M. Meteorological and oceanographic conditions in the northern Adriatic Sea during the period June 1999–July 2002: Influence on the mucilage phenomenon. Sci. Total Environ. 2005, 353, 24–38. [Google Scholar] [CrossRef]
- Lyons, D.M.; Supić, N.; Smodlaka, N. Geostrophic circulation patterns in the Northeastern Adriatic Sea and the effects of air-sea coupling: May–September 2003. J. Geophys. Res. 2007, 112, 1–17. [Google Scholar] [CrossRef] [Green Version]
- Fuks, D.; Ivančić, I.; Najdek, M.; Lučić, D.; Njire, J.; Godrijan, J.; Marić, D.; Šilović, T.; Paliaga, P.; Blažina, M.; et al. Changes in the planktonic community structure related to trophic conditions: The case study of the northern Adriatic Sea. J. Mar. Syst. 2012, 96–97, 95–102. [Google Scholar] [CrossRef] [Green Version]
- Ciglenečki, I.; Vilibić, I.; Dautović, J.; Vojvodić, V.; Ćosović, B.; Zemunik, P.; Dunić, N.; Mihanović, H. Dissolved organic carbon and surface active substances in the northern Adriatic Sea: Long-term trends, variability and drivers. Sci. Total Environ. 2020, 730, 139104. [Google Scholar] [CrossRef]
- Marić, D.; Frka, S.; Godrijan, J.; Tomažić, I.; Penezić, A.; Djakovac, T.; Vojvodić, V.; Precali, R.; Gašparović, B. Organic matter production during late summer–winter period in a temperate sea. Cont. Shelf Res. 2013, 55, 52–65. [Google Scholar] [CrossRef]
- Kraus, R.; Supić, N. Impact of circulation on high phytoplankton blooms and fish catch in the northern Adriatic (1990–2004). Estuar. Coast. Shelf Sci. 2011, 91, 198–210. [Google Scholar] [CrossRef]
- Celussi, M.; Del Negro, P. Microbial degradation at a shallow coastal site: Long- term spectra and rates of exoenzymatic activities in the NE Adriatic Sea. Estuar. Coast Shelf Sci. 2012, 115, 75–86. [Google Scholar] [CrossRef]
- Ivančić, I.; Degobbis, D. An optimal manual procedure for ammonia analysis in natural waters by the indophenol blue method. Water Res. 1984, 18, 1143–1147. [Google Scholar] [CrossRef]
- Parsons, T.R.; Maita, Y.; Lalli, C.M. A Manual of Chemical and Biological Methods for Seawater Analysis; Pergamon Press: Oxford, UK; New York, NY, USA; Toronto, ON, Canada; Sydney, Australia; Frankfurt, Germany, 1984. [Google Scholar] [CrossRef]
- Menzel, D.W.; Corwin, N. The measurement of total phosphorus in seawater based on the liberation of organically bound fractions by persulfate oxidation. Limnol. Oceanogr. 1965, 10, 280–282. [Google Scholar] [CrossRef]
- Porter, K.G.; Feig, Y.S. The use of DAPI for identifying and counting aquatic microflora. Limnol. Oceanogr. 1980, 25, 943–948. [Google Scholar] [CrossRef]
- Hoppe, H.-G. Significance of exoenzymatic activities in the ecology of brackish water: Measurements by means of methylumbelliferyl-substrates. Mar. Ecol. Progr. Ser. 1983, 11, 299–308. [Google Scholar] [CrossRef]
- Ivančić, I.; Radić, T.; Lyons, D.M.; Fuks, D.; Precali, R.; Kraus, R. Alkaline phosphatase activity in relation to nutrient status in the northern Adriatic Sea. Mar. Ecol. Progr. Ser. 2009, 378, 27–35. [Google Scholar] [CrossRef] [Green Version]
- Lee, S.; Fuhrman, J.A. Relationships between biovolume and biomass of naturally derived marine bacterioplankton. Appl. Environ. Microbiol. 1987, 53, 1298–1303. [Google Scholar] [CrossRef] [Green Version]
- Antia, N.J.; McAllister, C.D.; Parsons, T.R.; Stephens, K.; Strickland, J.D.H. Further measurements of primary production using a large-volume plastic sphere. Limnol. Oceanogr. 1963, 8, 166–183. [Google Scholar] [CrossRef]
- Conover, W.J. Practical Nonparametric Statistics, 3rd ed.; John Wiley and Sons: New York, NY, USA, 1999; p. 608. ISBN 9780471160687. [Google Scholar]
- Gilmartin, M.; Degobbis, D.; Revelante, N.; Smodlaka, N. The mechanism controlling plant nutrient concentrations in the northern Adriatic Sea. Int. Rev. Hydrobiol. Hydrogr. 1990, 75, 425–445. [Google Scholar] [CrossRef]
- Brush, M.J.; Giani, M.; Totti, C.; Testa, J.M.; Faganeli, J.; Ogrinc, N.; Kemp, W.M.; Umani, S.F. Eutrophication, Harmful Algae, Oxygen Depletion, and Acidification. In Coastal Ecosystems in Transition: A Comparative Analysis of the Northern Adriatic and Chesapeake Bay, 1st ed.; Malone, T.C., Malej, A., Faganeli, J., Eds.; (Geophysical Monograph Series 256); American Geophysical Union. John Wiley and Sons, Inc.: Hoboken, NJ, USA, 2021; pp. 75–104. [Google Scholar] [CrossRef]
- Silkin, V.A.; Pautova, L.A.; Lifanchuk, A.V. Physiological regulatory mechanisms of the marine phytoplankton community structure. Russ. J. Plant Physiol. 2013, 60, 541–548. [Google Scholar] [CrossRef]
- Wasmund, N.; Nausch, G.; Hansen, A. Phytoplankton succession in an isolated upwelled Benguela water body in relation to different initial nutrient conditions. J. Mar. Syst. 2014, 140, 163–174. [Google Scholar] [CrossRef]
- Zaccone, R.; Caruso, G. Microbial enzymes in the Mediterranean Sea: Relationship with climate changes. AIMS Microbiol. 2019, 5, 251–271. [Google Scholar] [CrossRef] [PubMed]
- Labry, C.; Delmas, D.; Herbland, A. Phytoplankton and bacterial alkaline phosphatase activities in relation to phosphate and DOP availability within the Gironde plume waters (Bay of Biscay). J. Exp. Mar. Biol. Ecol. 2005, 318, 213–225. [Google Scholar] [CrossRef] [Green Version]
- Quigg, A.; Sylvan, J.B.; Gustafson, A.B.; Fisher, T.R.; Oliver, R.L.; Tozzi, S.; Ammerman, J.W. Going West: Nutrient Limitation of Primary Production in the Northern Gulf of Mexico and the Importance of the Atchafalaya River. Aquat. Geochem. 2011, 17, 519–544. [Google Scholar] [CrossRef]
- Nausch, M. Alkaline phosphatase activities and the relationship to inorganic phosphate in the Pomeranian Bight (Southern Baltic Sea). Aquat. Microb. Ecol. 1998, 16, 87–94. [Google Scholar] [CrossRef]
- Kuss, J.; Nausch, G.; Engelke, C.; von Weber, M.; Lutterbeck, H.; Naumann, M.; Waniek, J.J.; Schulz-Bull, D.E. Changes of Nutrient Concentrations in the Western Baltic Sea in the Transition Between Inner Coastal Waters and the Central Basins: Time Series from 1995 to 2016 with source analysis. Front. Earth Sci. 2020, 8, 1–13. [Google Scholar] [CrossRef]
- Wambeke, F.; Christaki, U.; Giannakourou, A.; Moutin, T.; Souvemerzoglou, K. Longitudinal and Vertical Trends of Bacterial Limitation by Phosphorus and Carbon in the Mediterranean Sea. Microb. Ecol. 2002, 43, 119–133. [Google Scholar] [CrossRef] [Green Version]
- Cao, X.; Song, C.; Zhou, Y. Limitations of using extracellular alkaline phosphatase activities as a general indicator for describing P deficiency of phytoplankton in Chinese shallow lakes. J. Appl. Phycol. 2010, 22, 33–41. [Google Scholar] [CrossRef]
- Zaccone, R.; Caruso, G.; Calì, C. Heterotrophic bacteria in the northern Adriatic Sea: Seasonal changes and ectoenzyme profile. Mar. Environ. Res. 2002, 54, 1–19. [Google Scholar] [CrossRef]
- Ivančić, I.; Fuks, D.; Radić, T.; Lyons, D.M.; Šilović, T.; Kraus, R.; Precali, R. Phytoplankton and bacterial alkaline phosphatase activity in the northern Adriatic Sea. Mar. Environ. Res. 2010, 69, 85–94. [Google Scholar] [CrossRef] [PubMed] [Green Version]
- Thingstad, T.F.; Skjoldal, E.F.; Bohne, R.A. Phosphorus cycling and algal-bacterial competition in Sandsfjord, western Norway. Mar. Ecol. Progr. Ser. 1993, 99, 239–259. [Google Scholar] [CrossRef]
- Joint, I.; Henriksen, P.; Fonnes, G.A.; Bourne, D.; Thingstad, T.F.; Riemann, B. Competition for inorganic nutrients between phytoplankton and bacterioplankton in nutrient manipulated mesocosms. Aquat. Microb. Ecol. 2002, 29, 145–159. [Google Scholar] [CrossRef]
- Tanaka, T.; Henriksen, P.; Lignell, R.; Olli, K.; Seppälä, J.; Tamminen, T.; Thingstad, T.F. Specific affinity for phosphate uptake and specific alkaline phosphatase activity as diagnostic tools for detecting phosphorus-limited phytoplankton and bacteria. Estuar. Coast. 2006, 29, 1226–1241. [Google Scholar] [CrossRef]
- Xu, J.; Yin, K.; He, L.; Yuan, X.; Ho, A.Y.T.; Harrison, P.J. Phosphorus limitation in the northern South China Sea during late summer: Influence of the Pearl River. Deep Sea Res. Part I Oceanogr. Res. Pap. 2008, 55, 1330–1342. [Google Scholar] [CrossRef]
- Degobbis, D. A stoichiometric model of nutrient cycling in the northern Adriatic Sea and its relation to regeneration processes. Mar. Chem. 1990, 29, 235–253. [Google Scholar] [CrossRef]
- Ivančić, I.; Degobbis, D.; Pečar, O.; Fuks, D.; Manganelli, M.; Kraus, R.; Djakovac, T.; Precali, R.; Scenati, R. Northern Adriatic mesocosm experiment Rovinj 2003: Nutrient dynamics. Period. Biolog. 2004, 106, 17–22. [Google Scholar]
- Orlić, S.; Najdek, M.; Supić, N.; Ivančić, I.; Fuks, D.; Blažina, M.; Šilović, T.; Paliaga, P.; Godrijan, J.; Marić, D. Structure and variability of a microbial community at a transect crossing a double gyre structure in the northeastern Adriatic Sea. Aquat. Microb. Ecol. 2013, 69, 193–203. [Google Scholar] [CrossRef] [Green Version]
- Smodlaka, N. Primary production of the organic matter as an indicator of the eutrophication in the northern Adriatic Sea. Sci. Total Environ. 1986, 56, 211–220. [Google Scholar] [CrossRef]
- Kršinić, F.; Bojanić, D.; Precali, R.; Kraus, R. Quantitative variability of the copepod assemblages in the northern Adriatic Sea from 1993 to 1997. Estuar. Coast. Shelf Sci. 2007, 74, 528–538. [Google Scholar] [CrossRef]
- Pugnetti, A.; Armeni, M.; Camatti, E.; Crevatin, E.; Dell’Anno, A.; Del Negro, P.; Milandri, A.; Socal, G.; Umani, S.F.; Danovaro, R. Imbalance between phytoplankton production and bacterial carbon demand in relation with mucilage formation in the Northern Adriatic Sea. Sci. Total Environ. 2005, 353, 162–177. [Google Scholar] [CrossRef] [PubMed]
- Umani, S.F.; Del Negro, P.; Larato, C.; De Vittor, C.; Cabrini, M.; Celio, M.; Falconi, C.; Tamberlich, F.; Azam, F. Major inter-annual variations in microbial dynamics in the Gulf of Trieste (northern Adriatic Sea) and their ecosystem implications. Aquat. Microb. Ecol. 2007, 46, 163–175. [Google Scholar] [CrossRef]
- Zaccone, R.; Azzaro, M.; Caruso, G.; Crisafi, E.; Decembrini, F.; Leonardi, M.; Maimone, G.; Monticelli, L.; La Ferla, R. Effects of climate changes on the microbial activities and prokaryotic abundances in the euphotic layer of the Central Mediterranean Sea. Hydrobiologia 2019, 842, 5–30. [Google Scholar] [CrossRef]
- Gotschalk, C.C.; Alldredge, A.L. Enhanced primary production and nutrient regeneration within aggregated marine diatoms. Mar. Biol. 1989, 103, 119–129. [Google Scholar] [CrossRef]
- Grossart, H.-P.; Ploug, H. Microbial degradation of organic carbon and nitrogen on diatom aggregates. Limnol. Oceanogr. 2001, 46, 267–277. [Google Scholar] [CrossRef]
- Ivančić, I.; Najdek, M.; Kraus, R. Importance of Phytoplankton and Bacterial Alkaline Phosphatase Activity in Different Trophic Conditions: The Case Study of the Northern Adriatic Sea; Institute Ruđer Bošković: Rovinj, Croatia, 2022; manuscript in preparation. [Google Scholar]
- Siokou-Frangou, I.; Christaki, U.; Mazzochi, M.G.; Montresor, M.; Ribera d’Alcala, M.; Vaqué, D.; Zingone, A. Plankton in the open Mediterranean Sea: A review. Biogeosciences 2010, 7, 1543–1586. [Google Scholar] [CrossRef] [Green Version]
- Spillman, C.M.; Imberger, J.; Hamilton, D.P.; Hipsey, M.R.; Romero, J.R. Modeling the effects of Po River discharge, internal nutrient cycling and hydrodynamics on biogeochemistry of the northern Adriatic Sea. J. Mar. Syst. 2007, 68, 167–200. [Google Scholar] [CrossRef]
- Ivančić, I.; Godrijan, J.; Pfannkuchen, M.; Marić, D.; Gašparović, B.; Ðakovac, T.; Najdek, M. Survival mechanisms of phytoplankton in conditions of stratification induced deprivation of orthophosphate: Northern Adriatic case study. Limnol. Oceanogr. 2012, 57, 1721–1731. [Google Scholar] [CrossRef] [Green Version]
- Najdek, M.; Paliaga, P.; Šilović, T.; Batistić, M.; Garić, R.; Supić, N.; Ivančić, I.; Ljubimir, S.; Korlević, M.; Jasprica, N.; et al. Picoplankton community structure before, during and after convection event in the offshore waters of the Southern Adriatic Sea. Biogeosciences 2014, 11, 2645–2659. [Google Scholar] [CrossRef] [Green Version]
- Riemann, B.; Simonsen, P.; Stensgaard, L. The carbon and chlorophyll content of phytoplankton from various nutrient regimes. J. Plankton Res. 1989, 11, 1037–1045. [Google Scholar] [CrossRef] [Green Version]
- Felip, M.; Catalan, J. The relationship between phytoplankton biovolume and chlorophyll in a deep oligotrophic lake: Decoupling in their spatial and temporal maxima. J. Plankton Res. 2000, 22, 91–105. [Google Scholar] [CrossRef]
- Pugnetti, A.; Camatti, E.; Mangoni, O.; Morabito, G.; Oggioni, A.; Saggiomo, V. Phytoplankton production in Italian freshwater and marine ecosystems: State of the art and perspectives. Chem. Ecol. 2006, 22, S49–S69. [Google Scholar] [CrossRef]
- Celussi, M.; Zoccarato, L.; Bernardi Aubry, F.; Bastianini, M.; Casotti, R.; Balestra, C.; Giani, M.; Del Negro, P. Links between microbial processing of organic matter and the thermohaline and productivity features of a temperate river-influenced Mediterranean coastal area. Estuar. Coast. Shelf Sci. 2019, 228, 106378. [Google Scholar] [CrossRef]
Figure 1.
Sampling stations in the Northern Adriatic and definition of the three sub-areas with distinct oceanographic characteristics. Major rivers in the region [21] and monthly distribution of APA data in the dataset are also shown.
Figure 1.
Sampling stations in the Northern Adriatic and definition of the three sub-areas with distinct oceanographic characteristics. Major rivers in the region [21] and monthly distribution of APA data in the dataset are also shown.

Figure 2.
Annual cycle of the Po River flow during 2004–2013. In box–whisker plots are presented: median, interquartile, range of 95% of the data, and outliers (filled circles).
Figure 2.
Annual cycle of the Po River flow during 2004–2013. In box–whisker plots are presented: median, interquartile, range of 95% of the data, and outliers (filled circles).
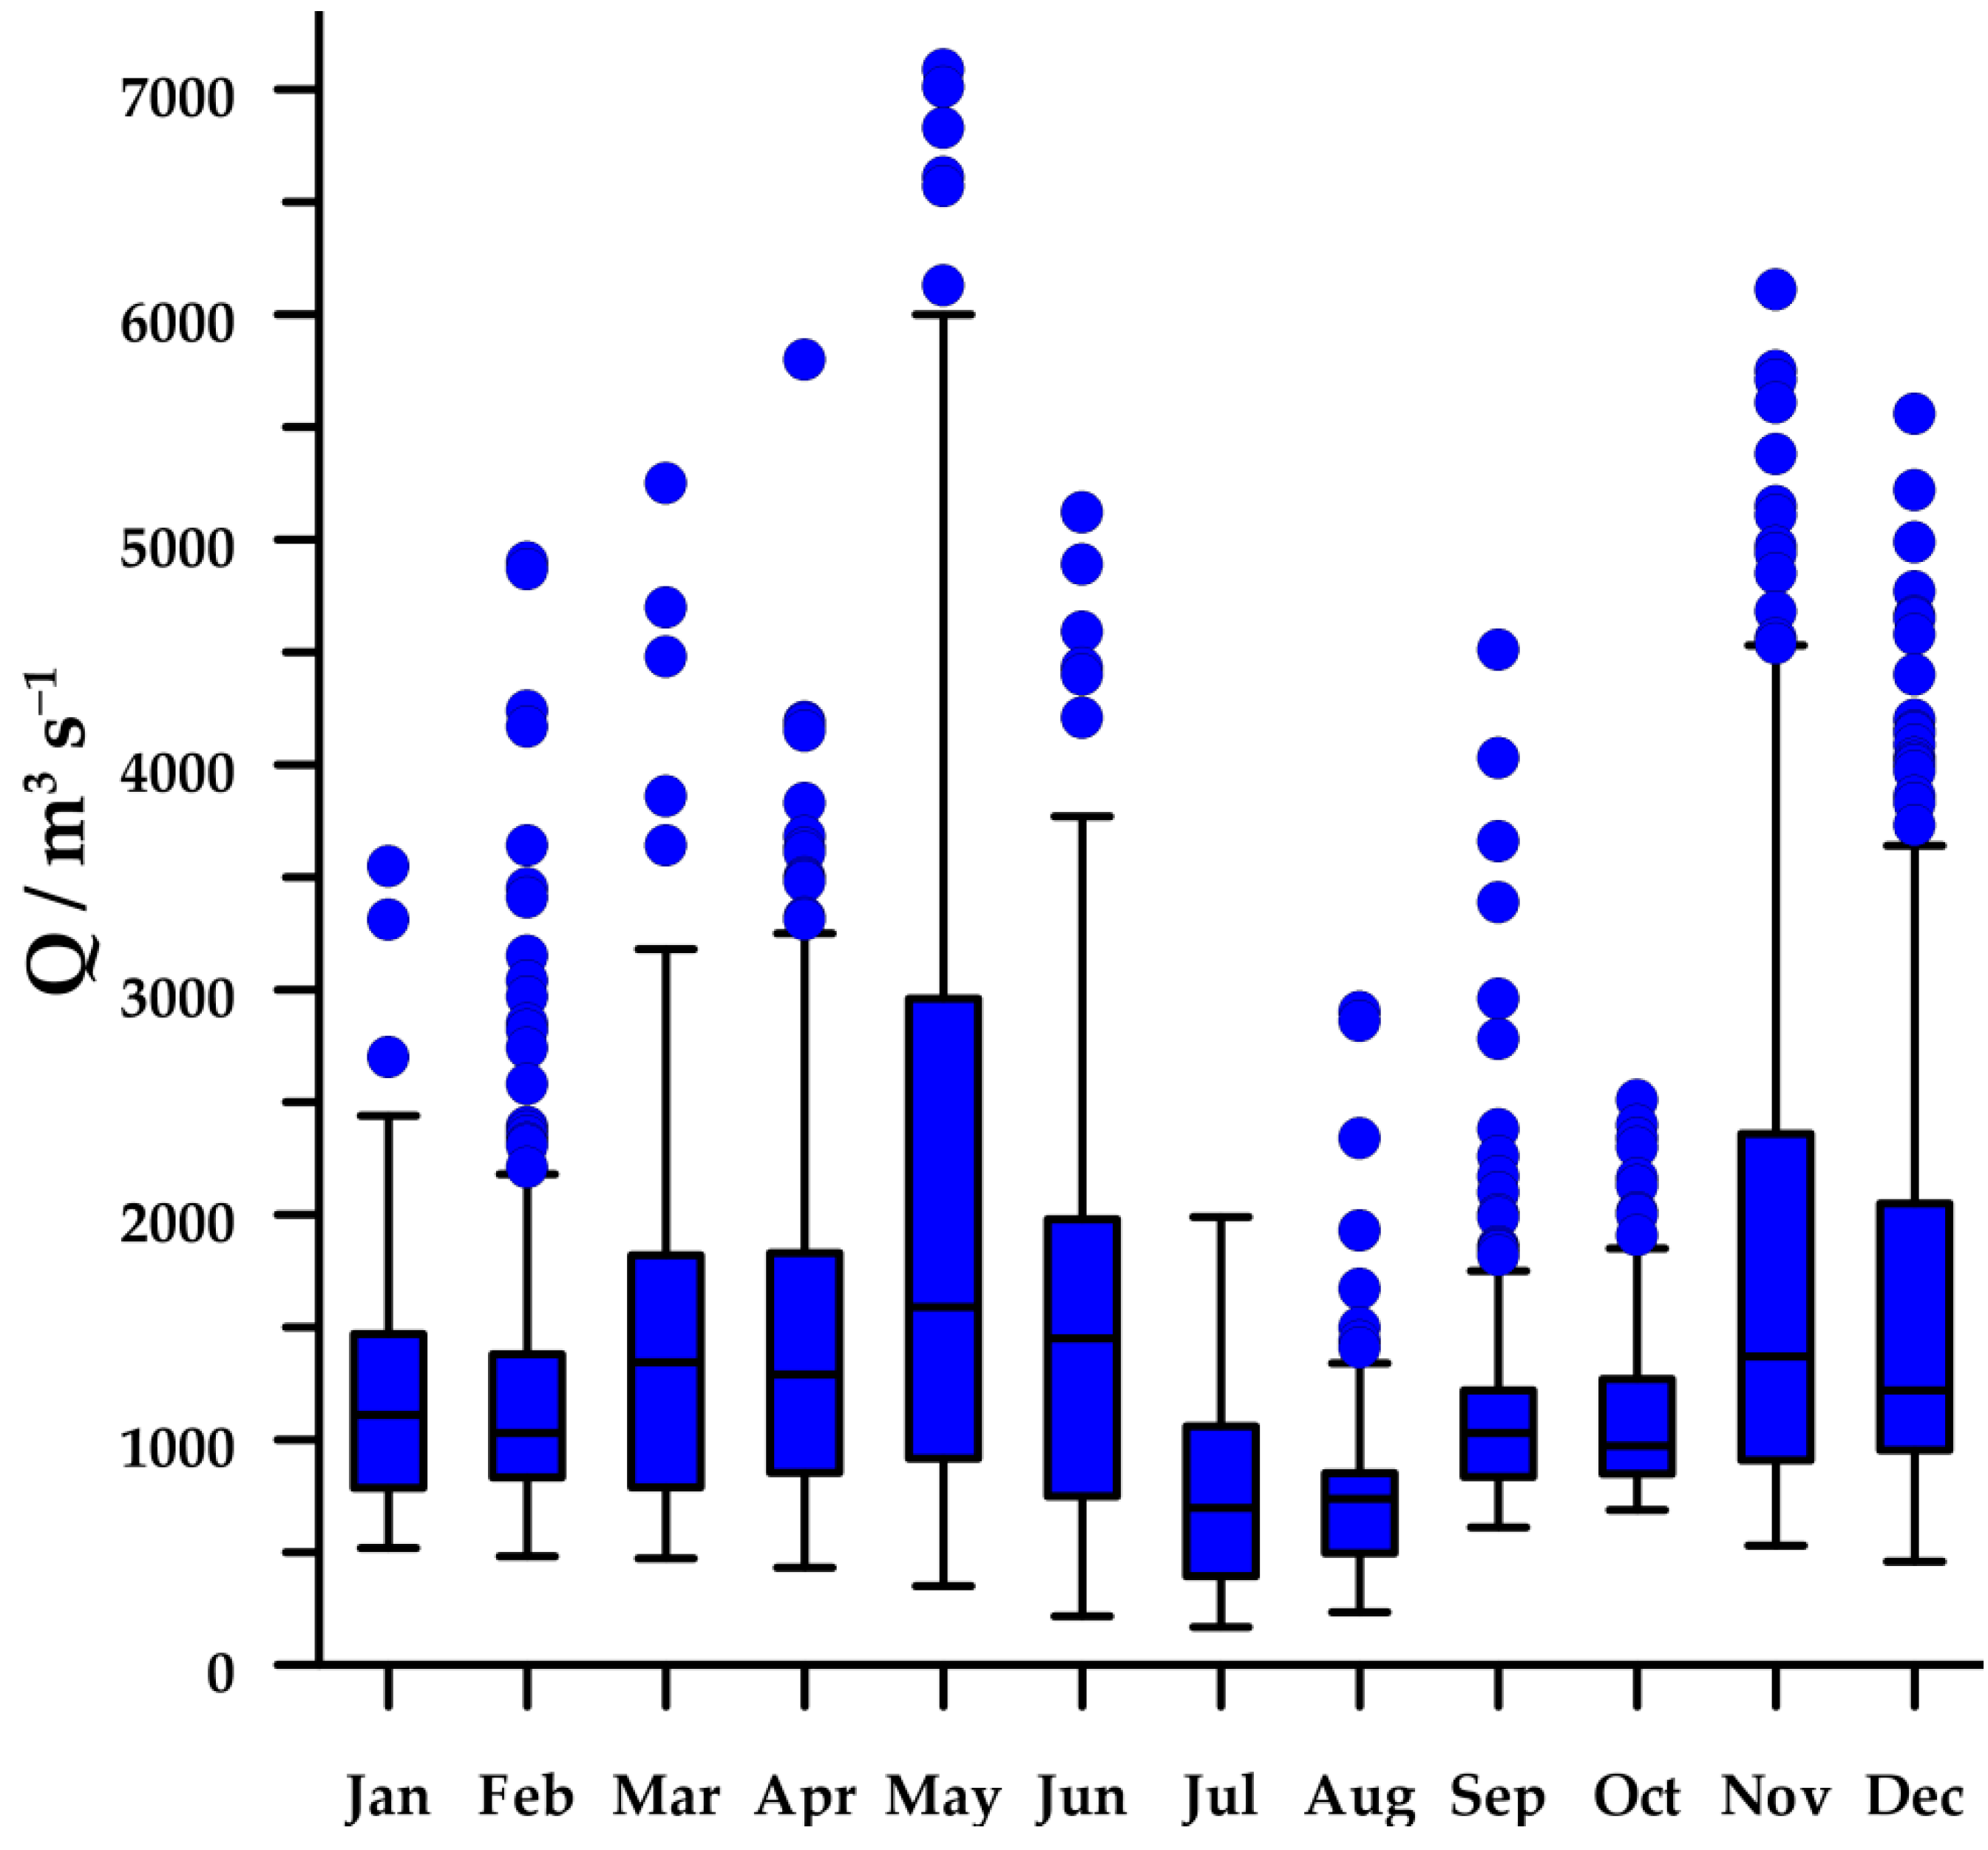
Figure 3.
Annual cycles of (a) temperature (T), and (b) salinity (S) in oxygen-saturated (blue squares) and oxygen-undersaturated waters (golden squares) in the Northern Adriatic during 2004–2013. Plot characteristics are reported in Figure 2.
Figure 3.
Annual cycles of (a) temperature (T), and (b) salinity (S) in oxygen-saturated (blue squares) and oxygen-undersaturated waters (golden squares) in the Northern Adriatic during 2004–2013. Plot characteristics are reported in Figure 2.

Figure 4.
Annual cycles of (a) dissolved inorganic nitrogen (DIN), (b) chlorophyll a (chl a), (c) heterotrophic bacteria (HB), (d) alkaline phosphatase activity (APA), (e) dissolved organic phosphorus (DOP), and (f) orthophosphate (PO4) in oxygen-saturated (blue squares) and oxygen-undersaturated waters (golden squares) in the Northern Adriatic during 2004–2013. Plot characteristics are reported in Figure 2.

Figure 5.
Frequency of occurrence (%) of water types (new-FW, aged-FW, and no-FW waters) in oxygen-saturated (a–c) and -undersaturated (d) conditions in the Northern Adriatic during 2004–2013.
Figure 5.
Frequency of occurrence (%) of water types (new-FW, aged-FW, and no-FW waters) in oxygen-saturated (a–c) and -undersaturated (d) conditions in the Northern Adriatic during 2004–2013.
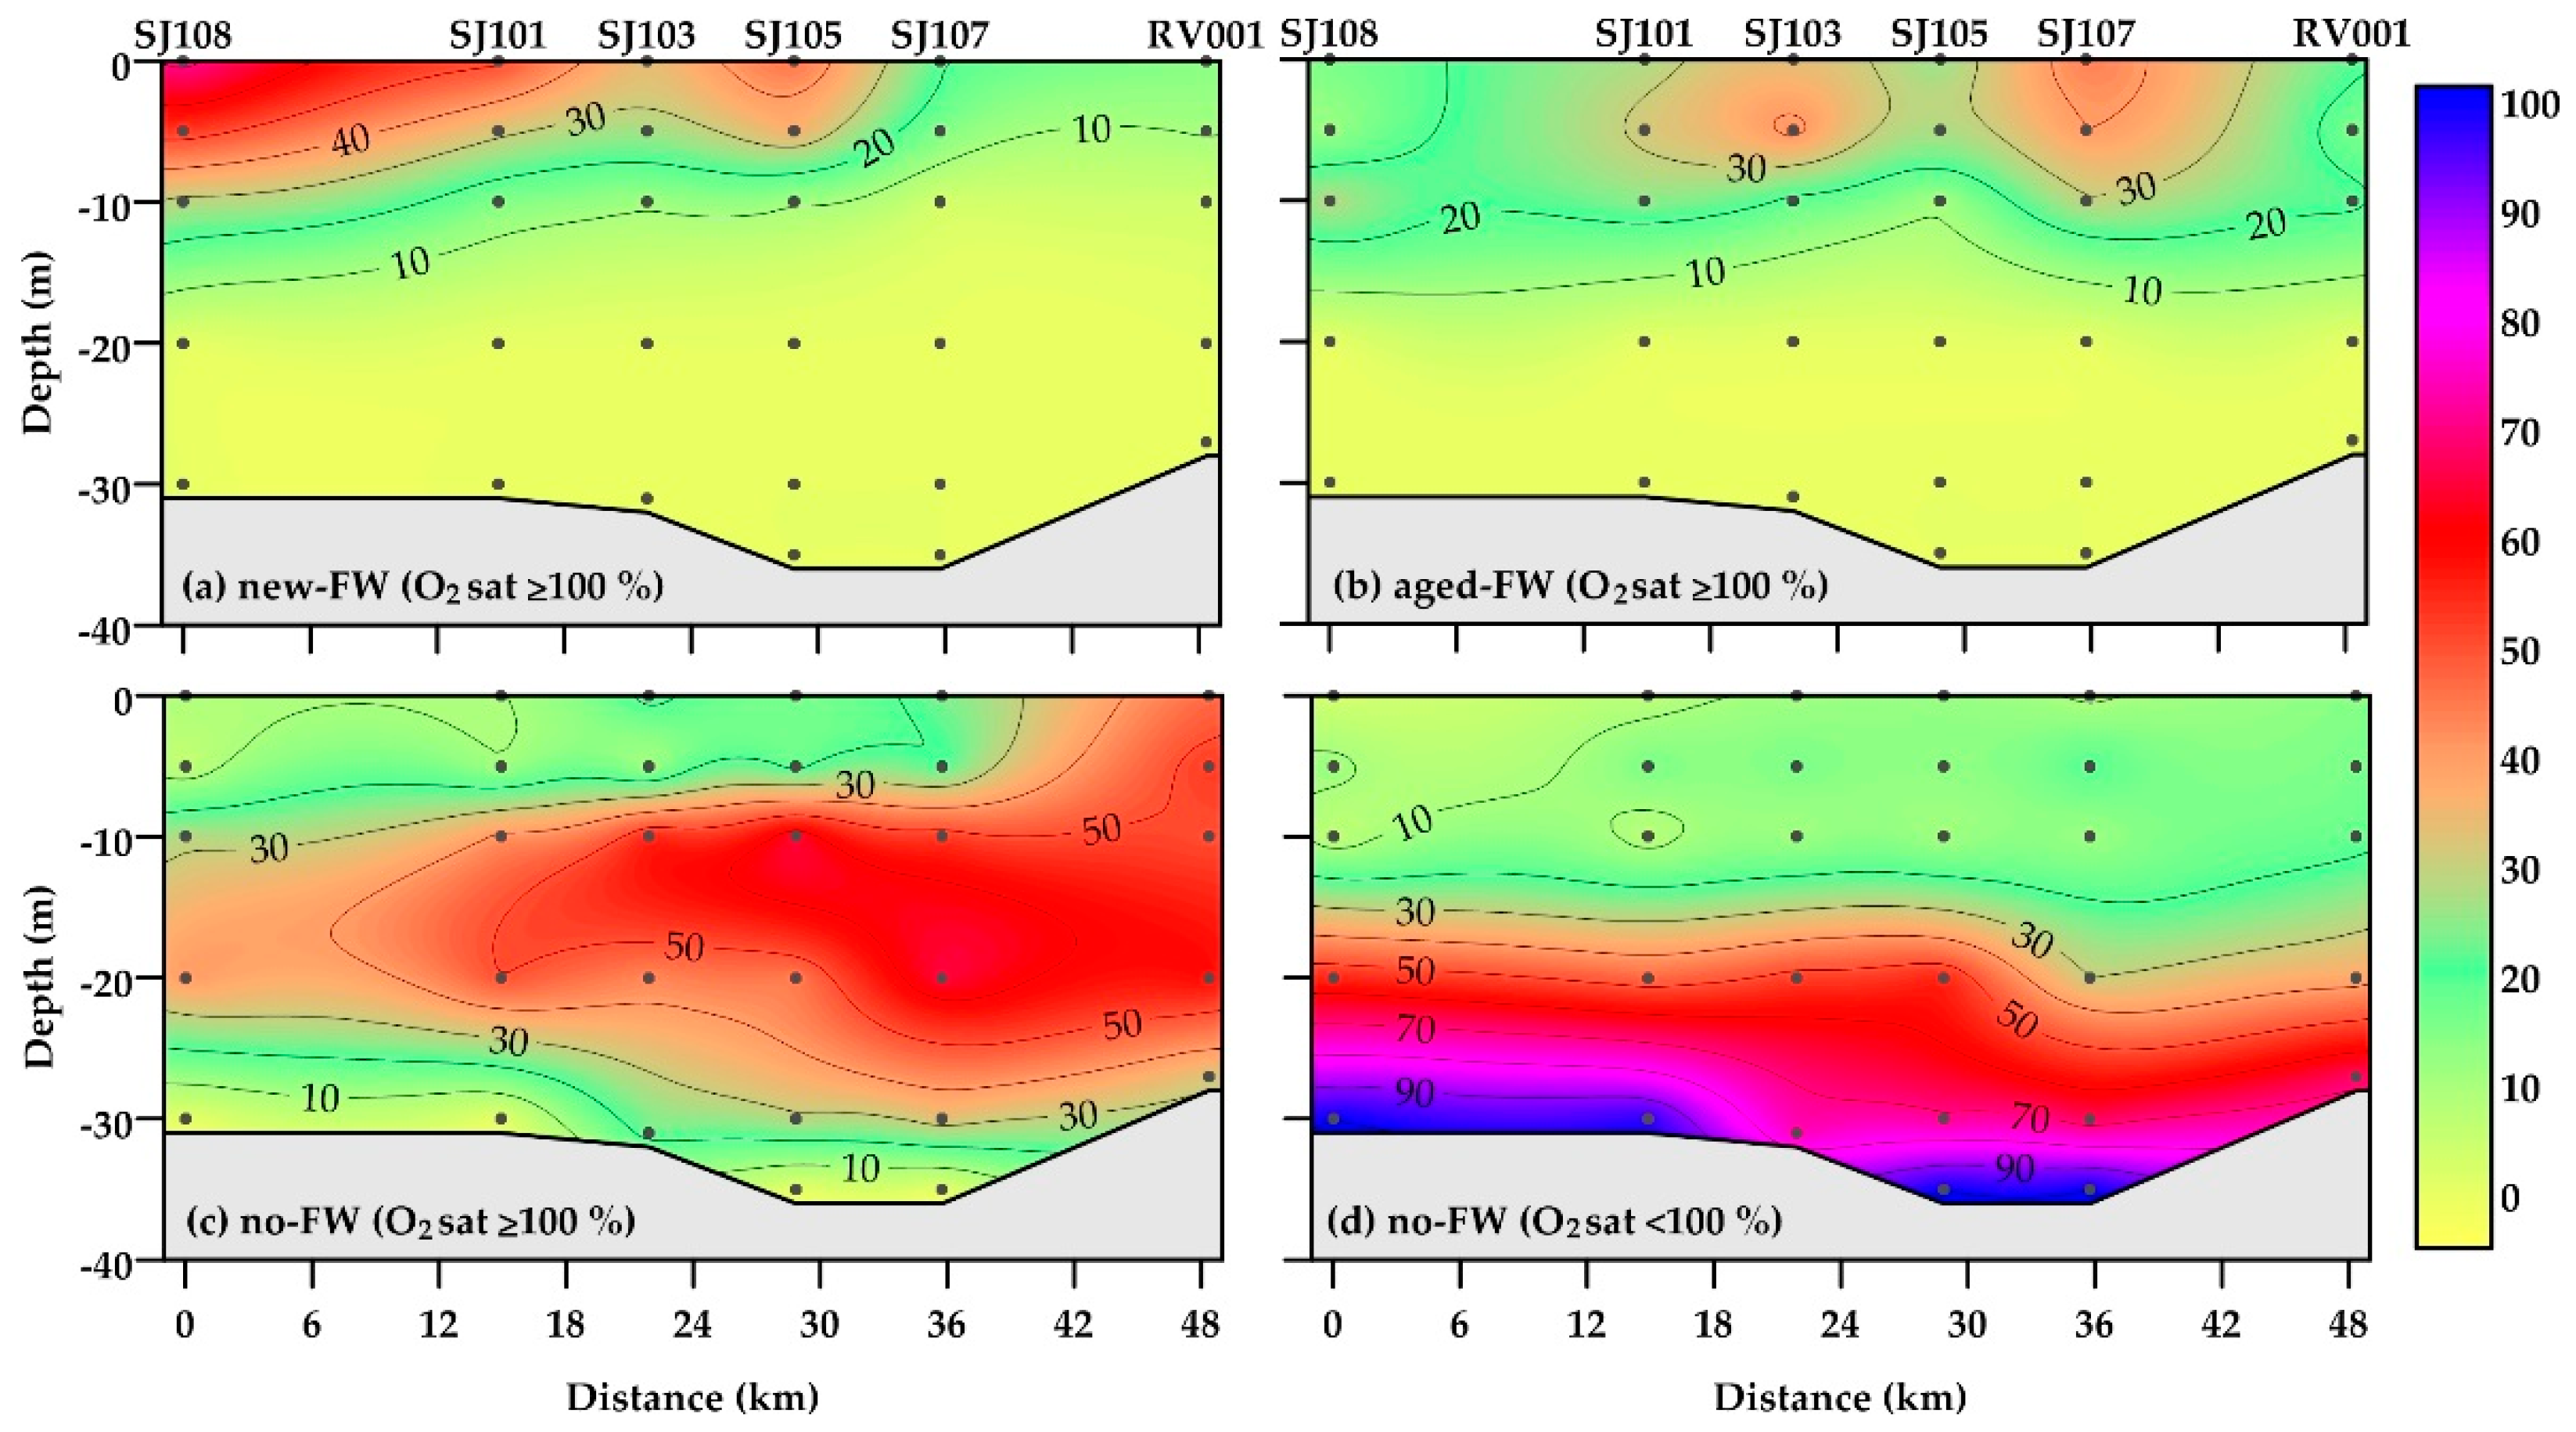
Figure 6.
Monthly frequency of occurrence (%) of water types (new-FW, aged-FW, and no-FW waters) in oxygen (a) oversaturated and (b) undersaturated waters in the Northern Adriatic during 2004–2013.
Figure 6.
Monthly frequency of occurrence (%) of water types (new-FW, aged-FW, and no-FW waters) in oxygen (a) oversaturated and (b) undersaturated waters in the Northern Adriatic during 2004–2013.

Figure 7.
Distribution of (a) DIN, (b) chl a, (c) HB, (d) APA, (e) specific APA (sAPA), and (f) DOP in water types in the Northern Adriatic during 2004–2013. Abbreviations and plot characteristics are reported in Figure 2 and Figure 4. The significance of the differences among the water types (Kruskal–Wallis test) is reported in Appendix A (Table A1).

Figure 8.
Principal component analysis (PCA) for relevant variables in oxygen-saturated new-FW waters during (a) STRAT, (b) October, and (c) MIX. Variables: alkaline phosphatase activity (APA), dissolved organic phosphorus (DOP), orthophosphate (PO4), chlorophyll a (chl a), and heterotrophic bacteria (HB). PCA was constructed with log-transformed values of respective parameters.

Figure 9.
Principal component analysis (PCA) for relevant variables in oxygen-saturated aged-FW waters during (a) STRAT and (b) October. Abbreviations are reported in Figure 8.
Figure 9.
Principal component analysis (PCA) for relevant variables in oxygen-saturated aged-FW waters during (a) STRAT and (b) October. Abbreviations are reported in Figure 8.

Figure 10.
Principal component analysis (PCA) for relevant variables in oxygen-saturated no-FW waters during (a) STRAT and (b) MIX. Abbreviations are reported in Figure 8.
Figure 10.
Principal component analysis (PCA) for relevant variables in oxygen-saturated no-FW waters during (a) STRAT and (b) MIX. Abbreviations are reported in Figure 8.
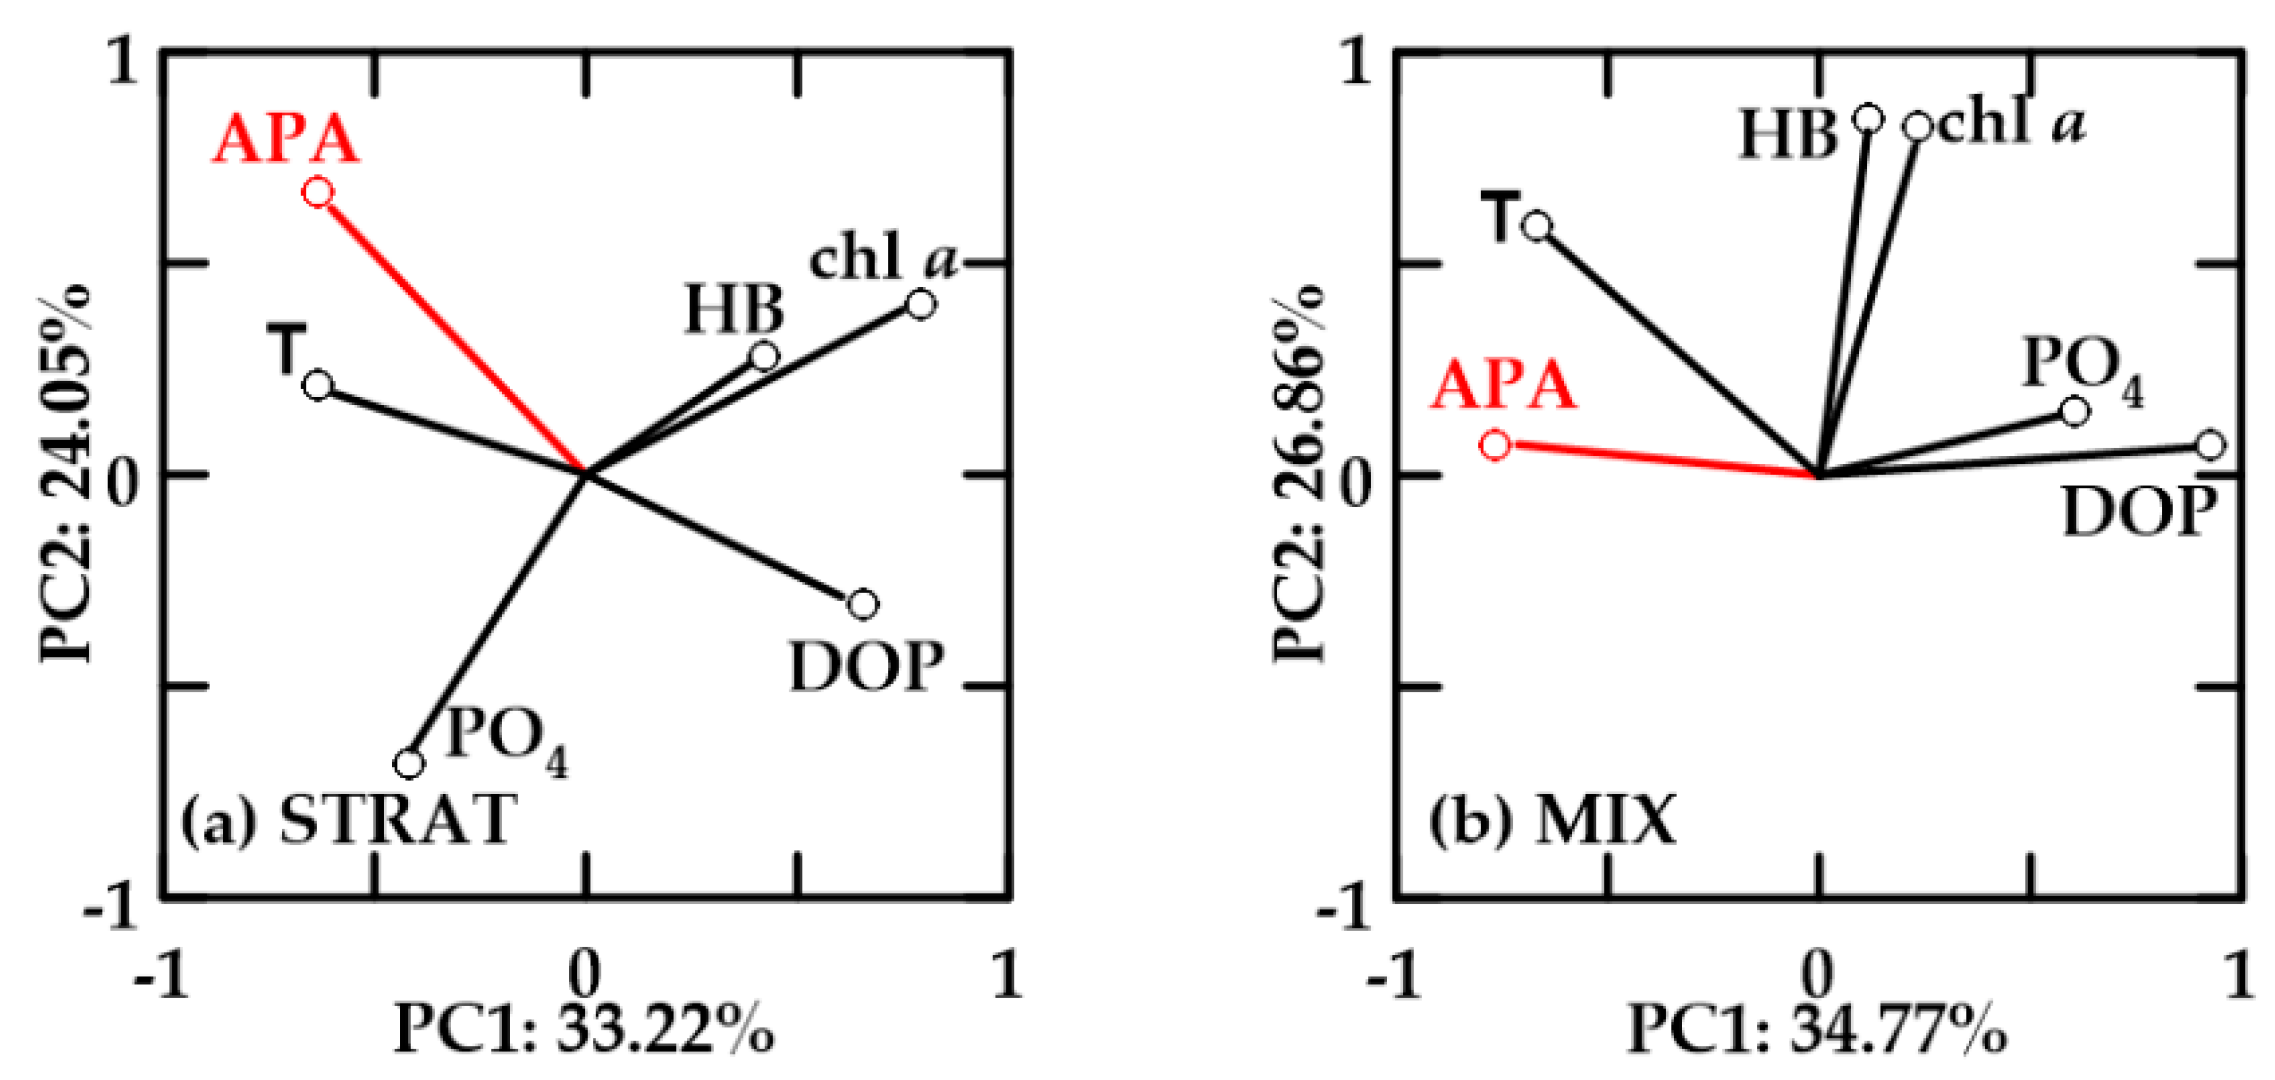
Figure 11.
Principal component analysis (PCA) for relevant variables in oxygen-undersaturated waters in (a) STRAT, (b) October, and (c) MIX. Abbreviations are reported in Figure 8.
Figure 11.
Principal component analysis (PCA) for relevant variables in oxygen-undersaturated waters in (a) STRAT, (b) October, and (c) MIX. Abbreviations are reported in Figure 8.
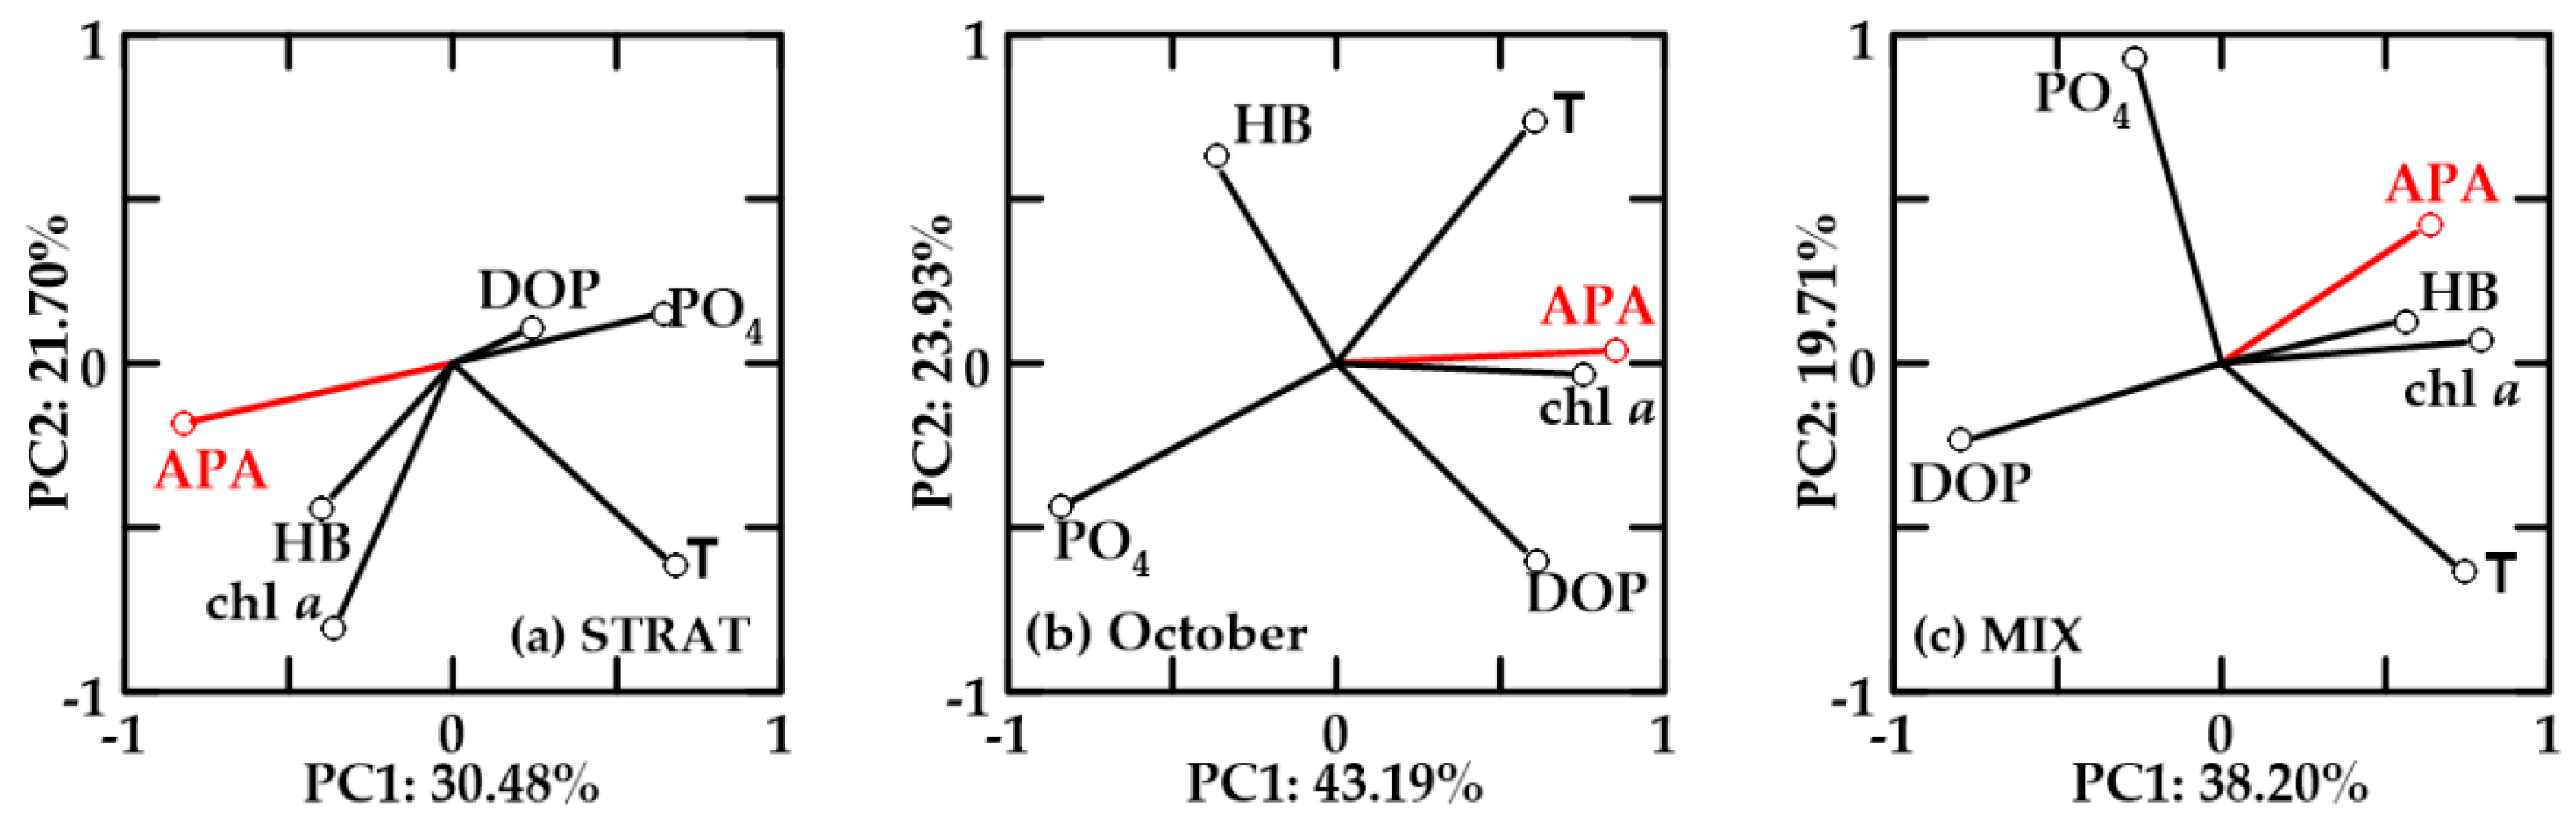
Publisher’s Note: MDPI stays neutral with regard to jurisdictional claims in published maps and institutional affiliations. |
© 2021 by the authors. Licensee MDPI, Basel, Switzerland. This article is an open access article distributed under the terms and conditions of the Creative Commons Attribution (CC BY) license (https://creativecommons.org/licenses/by/4.0/).
Share and Cite
MDPI and ACS Style
Ivančić, I.; Kraus, R.; Najdek, M.; Cozzi, S. Ecological Importance of Alkaline Phosphatase Activity in Changing Marine Environmental Conditions. Water 2021, 13, 2750. https://doi.org/10.3390/w13192750
AMA Style
Ivančić I, Kraus R, Najdek M, Cozzi S. Ecological Importance of Alkaline Phosphatase Activity in Changing Marine Environmental Conditions. Water. 2021; 13(19):2750. https://doi.org/10.3390/w13192750
Chicago/Turabian StyleIvančić, Ingrid, Romina Kraus, Mirjana Najdek, and Stefano Cozzi. 2021. "Ecological Importance of Alkaline Phosphatase Activity in Changing Marine Environmental Conditions" Water 13, no. 19: 2750. https://doi.org/10.3390/w13192750
Note that from the first issue of 2016, this journal uses article numbers instead of page numbers. See further details here.