
The Migration and Transformation of Nitrogen in the Danjiangkou Reservoir and Upper Stream: A Review


State Key Laboratory of Simulation and Regulation of Water Cycle in River Basin, Department of Water Ecology and Environment, China Institute of Water Resources and Hydropower Research, Beijing 100038, China
*
Author to whom correspondence should be addressed.
†
J.-J.L and F.D. contributed equally to this work (co-first authors).
Water 2021, 13(19), 2749; https://doi.org/10.3390/w13192749
Submission received: 25 August 2021
/
Revised: 29 September 2021
/
Accepted: 1 October 2021
/
Published: 3 October 2021
(This article belongs to the Section Water Quality and Contamination)
Abstract
:The Danjiangkou Reservoir in China is characterized by significantly high concentrations of total nitrogen (TN), and the sources are not clear. Recently, research on this reservoir has focused on the N cycle, the spatial and temporal distribution characteristics of N, and the factors influencing N concentration. Significant temporal and spatial differences in TN concentrations exist, both in the reservoir area and the tributaries. N concentration in the area is affected by numerous factors, including N transported by tributaries, nonpoint source pollution around the reservoir, internal N release, and atmospheric N deposition. Moreover, a dam heightening project led to a larger water-fluctuation zone and more bays in the reservoir, directly affecting its N cycle. However, further research is required to explore the N cycle on a large watershed scale in the Danjiangkou Reservoir and upper stream areas, determine N pollution sources using satellite remote sensing, and conduct simulations of a water body N cycle model based on data fusion. Although the issue of excessive TN has been alleviated to some extent by the South-North Water Diversion Project, the excessively high TN concentrations require more research to aid the implementation of N-reducing strategies.
1. Introduction
Nitrogen (N) is a primary cause of eutrophication in water. Moreover, the degradation of water ecosystems caused by an increase in the N content in circulation has become a global environmental issue. Extensive lakes and reservoirs, as well as other aquatic habitats, are at a growing risk of degradation from excessive N pollution in China, and the annual average anthropogenic emission of N (14.5 ± 3.1 megatons per year) to freshwater systems is approximately 2.7 times that of the safe N emission threshold (5.2 ± 0.7 megatons per year) [1]. In recent years, nitrogen pollution in reservoirs has become increasingly severe, significantly impacting water quality. The Danjiangkou Reservoir is a water-diverting reservoir situated in the middle line of the South-to-North Water Diversion Project, China’s largest protected source of drinking water, where the water quality was maintained at Class I–Class III (total nitrogen, TN, is excluded in the rating) from 2009 to 2018, according to the Chinese guidelines for the environmental quality standard for surface water (GB 3838-2002) (see Table 1).
In the past few years, N pollution in reservoirs has garnered substantial attention from water scientists [2]. The water in the Danjiangkou Reservoir is characterized by a mesotrophic state, whereas local reservoir bays are in a eutrophic state, and N has become the primary influencing factor of the quality and trophic state of water in the reservoir [3,4,5]. N is one of the key factors leading to water eutrophication [6,7,8], and the increase in the amount of N involved in the cycle leads to the degradation of the water ecosystem and has become a global environmental issue [9]. The N concentrations of the Danjiangkou Reservoir are affected by the eco-environment of the entire reservoir and the upper stream. Because of the large watershed area, the multiple inflow tributaries of the reservoir, and the complex N emissions in the water source area, previous studies have mainly focused on the prominent pollution in local areas, but an overall analysis of the sources and consequences of N pollution in the entire reservoir area has not been conducted. In this study, we review the existing literature on the N cycle in the Danjiangkou Reservoir and its upstream areas.
On the CNKI (China National Knowledge Infrastructure) data platform, a total of 65 valid papers were retrieved using the subjects “SU = (‘Danjiangkou’ + ‘Danjiangkou Reservoir’ + ‘Danjiangkou Reservoir Area’, and SU = (‘N’ + ‘TN’ + ‘Ammonia N’ + ‘Nitrate N’ + ‘Organic N’ + ‘Control of N emissions’ + ‘N cycle’)”. On the Web of Science data platform, a total of 164 valid papers were retrieved by searching all databases with the subjects ‘Danjiangkou’ and ‘Danjiangkou’, including 65 papers in core aggregate databases. The retrieval deadline was 17 March 2021. Since the middle line of the South-to-North Water Diversion Project was officially launched in 2014, research on the water quality of the Danjiangkou Reservoir has substantially increased, and the number of research papers on N issues in the reservoir has also increased, with the greatest number of research papers on this topic published in 2020 (see Figure 1). Table A1 provides statistics on recent research relating to N pollution in the Danjiangkou Reservoir in domestic and international journals.
2. Spatial-Temporal Characteristics of N in the Danjiangkou Reservoir and Upper Stream
2.1. Overview of the Danjiangkou Reservoir
The Danjiangkou Reservoir is divided into two parts: the Hanjiang subreservoir (32°26′ N–32°52′ N, 110°38′ E–111°29′ E) in Danjiangkou City, Hubei Province, and the Danjiang subreservoir (32°34′ N–33°07′ N, 111°13′ E–111°43′ E) in Xichuan County, Henan Province. The two subreservoirs are equivalent in water surface area, the number of inflow tributaries, and catchment area size. There are 16 main inflow tributaries (see Figure 2 and Table 2), among which the Hanjiang River is the main source of water, accounting for over 90% of the inflow water amount.
Since 2004, N pollution in the Danjiangkou Reservoir, indicated by the TN and NH3-N composition of the water, has severely increased [10]. Moreover, N sources in the Danjiangkou Reservoir, which are affected by pollution, hydrologic conditions, and rainfall [11,12,13], show significant spatial-temporal differences. The TN concentration in the reservoir exceeds 1.3 mg/L, and that of the inflow tributaries ranges from 2 to 10 mg/L. The spatial distribution characteristics of the NH3-N and NO3-N concentrations are similar to those of TN.
2.2. Spatio-Temporal Variation Characteristics of N in the Reservoir
2.2.1. TN Concentration
The TN load of the inflow tributaries of the Hanjiang subreservoir exceeds that of the Danjiang subreservoir, however, the TN concentration is the opposite, because the water inflow of the Hanjiang subreservoir accounts for 87.4%, which is much larger than that of Danjiang subreservoir [14,15].
Moreover, several areas of the reservoir showed relatively higher TN concentrations, and, during the dry season, significant TN accumulation in the reservoir bay was observed. The TN pollution level in the Hanjiang subreservoir was slightly higher than that of the Danjiang subreservoir, and the area with the most severe TN pollution was located in the northern part of the Danjiang subreservoir, followed by the eastern part of the Hanjiang subreservoir [3]. The areas with the highest TN concentrations were located in the northeastern part of the Danjiang subreservoir, and the estuary of the Guanshan River [16]. After the middle line of the South-to-North Water Diversion Project was launched, the dam was raised from 162.0 m to 176.6 m in 2014. The winding reservoir shoreline led to a large number of reservoir bays. Therefore, the hydraulic retention time of the local reservoir bays increased, the water exchange performance deteriorated, and nutrient substances dissolved from flooded land after the middle-line was launched [4]. This resulted in increases in the TN concentrations of the water in the reservoir bays. The Danjiangkou Reservoir can be divided into seven areas, as shown in Figure 3a, and the annual average concentration of TN in the red areas (A, C, D, and F) is >1.5 mg/L. During the dry season, the areas of the reservoir characterized by high TN concentrations expand to the entire Hanjiang subreservoir, as well as to several reservoir bays of the Danjiang Subreservoir (B*), as shown in Figure 3b. This expansion is caused by low inflow from upland water and the weak dilution effect of reservoir bays in the dry season.
2.2.2. Annual TN Fluctuations in the Reservoir
Since the 1990s, the TN concentration of the Danjiangkou Reservoir has shown an upward trend of fluctuation, which peaked in 2000 [14]. According to document statistics (Figure 4), in 2010, the TN concentration showed a marked increase of about 0.4 mg/L in the Danjiangkou Reservoir, and this high concentration was maintained from 2010–2013 and has decreased to approximately 1.25 mg/L since 2014. Specifically, the TN concentration at Taocha, the water diversion intake, improved significantly and was classified as Class III, whereas the remaining sections of the reservoir maintained a Class IV classification. The TN concentration was monitored by our team at four monitoring points of the reservoir, as shown in Figure 3a, and showed a general increasing trend before 2013, and a decreasing trend after 2013, with significant interannual fluctuations. This observation was consistent with the relevant research results and conclusions on TN concentration fluctuations in this reservoir.
2.2.3. Seasonal TN Concentration Fluctuations in the Reservoir
The TN concentrations in the reservoir were higher during the wet season than during the dry season. The overall seasonal trend in the TN concentration was as follows: wet season > dry season > other seasons [2,10,13,17], which is consistent with the results of numerous local and international watershed studies. Moreover, N was predominately exogenous pollution in the dry season, and endogenous pollution in the wet season [4].
Conversely, the TN concentrations of the reservoir bay were higher in the dry season than in the wet season. Li et al. analyzed the TN concentrations in 66 reservoir bays of the Danjiangkou Reservoir and concluded that the concentrations in the dry season were higher than those in the wet season [18]. These fluctuations in the TN concentration were attributed to a slower flow rate and the weak dilution effect in local bays caused by less water during the dry season [3]. Moreover, the TN concentrations in the Hanjiang subreservoir were lower than those in the Danjiang subreservoir in the wet season, whereas the TN concentration in the Hanjiang subreservoir increased in the normal and dry seasons. This is because the water in the Hanjiang subreservoir is derived mainly from the Hanjiang River, which accounts for >75% of the total water inflow into the reservoir, and pollutants in the Hanjiang subreservoir experience varying degrees of dilution during the wet season [3].
2.3. Spatial-Temporal Variation Characteristics of N in the Watershed and Tributaries
The upper stream of the Danjiangkou Reservoir is the primary source of water to the reservoir, and is also the main source of TN. From a spatial distribution perspective, the TN concentrations of the inflow tributaries typically exceed that of the reservoir water [19], and several inflow tributaries are heavily polluted [20,21]. The degree of TN pollution was ordered as follows: main pollutant-retaining rivers in Shiyan City > Danjiang River and tributaries > rivers in the Hanjiang River watershed > reservoir areas [17]. According to our monitoring data, since 2014, fluctuations in the TN concentrations of inflow tributaries have significantly increased on an annual and seasonal basis (Figure 5).
Time series analysis is necessary to exclude seasonal variations in the time series characteristics of the monitored data. The seasonal decomposition model in SPSS software was used. Time series analysis was conducted on the TN index (monthly average data) of two monitoring stations in the inflow tributaries (THSK, XC), and the South-to-North Water Diversion intake (Taocha), and Figure 5 shows the original series and the series corrected for seasonal factors. The results show that the seasonal effect is not significant in the time series. Figure 6 shows the monthly variation trend of the TN concentrations in two inflow tributaries (THSK, XC) and Taocha without seasonality (2009–2018).
2.3.1. Contribution of N to the Watershed
The Hanjiang River watershed is the main contributor of TN to the Danjiangkou Reservoir, and TN pollution in the Hanjiang River watershed is sourced from Shiyan City (an industrial city), and Shaanxi Province (a highly developed industrial and agricultural area in this watershed). The Danjiang River watershed is an intensive agricultural area characterized by prominent nonpoint source pollution. Although Danjiang River is close to Taocha (South-to-North Water Diversion intake), owing to the low flow and complex hydraulic environment of the Danjiang subreservoir, the contribution of this subreservoir to the TN of the Danjiang subreservoir is lower, and only the TN concentration at the boundary of the Danjiang subreservoir is higher.
2.3.2. TN Load
The TN load of the reservoir tributaries varies substantially. The top six rivers, in terms of TN load, are the Hanjiang, Duhe, Danjiang, Tianhe, Laoguan, and Qihe rivers, all of which are the main inflow tributaries (Figure 7). Moreover, these rivers account for 95.9% of the total inflow, and 90.9% of the total catchment area, in the upper stream of the Danjiangkou Reservoir [15,22]. The amount of N transported by inflow tributaries to the reservoir is not uniform, and the Hanjiang River has the most significant influence on the N concentration of the reservoir, followed by the Danjiang River, while the Guanshan and Langhe rivers have little influence [16].
2.3.3. Heavily Polluted Urban Rivers
There are a number of industrial cities in the Danjiangkou Reservoir watershed [23], including Hanzhong, Ankang, Shiyan, and Shangluo cities, among which Shiyan is the closest to the reservoir area and, because of this, Shiyan City serves as a prominent pollution source to the reservoir. The sources of pollution are domestic sewage and industrial pollution. Moreover, the Shending, Sihe, Jianghe, Guanshan, and Jianhe rivers are characterized by long pollution retention times and are located in the cities of Shiyan and Danjiangkou [17,24]. According to research conducted in 2016, the TN concentration of the Shending, Jianghe, Sihe, and Jianhe rivers was >4.10 mg/L, whereas that of the Guanshan River was 2.05 mg/L [14]. Owing to the small runoff of these five rivers, N pollution is characterized by extremely high TN concentrations and low loads, and the contribution rate to the TN load of the Danjiangkou Reservoir is relatively small [14,15].
2.3.4. Seasonal Variation Trend of the TN Concentration in the Inflow Tributaries
The overall seasonal variation trend of TN concentration in the inflow tributaries is similar, with higher concentrations observed in the wet season, followed by the normal season, and the lowest concentrations observed in the dry season [11,17]. In the wet season, the TN load (nonpoint source pollution) carried by precipitation and surface runoff into the water body increases, but precipitation dilutes the TN concentration in the water body to a greater extent; therefore, the TN concentration of the inflow tributaries is lower, which is similar to the seasonal variation trends observed for the TN concentration of the reservoir area.
2.4. Morphological N Variations
The morphological classification of N is as follows: TN includes particulate nitrogen (PN) and dissolved total nitrogen (DTN). DTN includes dissolved inorganic nitrogen (DIN) and dissolved organic nitrogen (DON), and DIN includes ammonia N (NH3-N), nitrate N (NO3-N), and nitrite N (NO2-N). DIN is the main form of N in the Danjiangkou Reservoir and inflow tributaries, which are dominated by NO3-N, and the morphology of N is in a balanced and stable state [25,26], which ensures that N is fully utilized [26]. Studies have shown that the proportion of nitrate N is lower than 50% in the heavily polluted Sihe, Guanshan, and Laoguan rivers [14,27]. Moreover, the spatial and temporal variation characteristics of N are aimed at determining the source of water pollution. Nonpoint surface pollution is the main source of NO3-N emissions in the Qihe River watershed (72%), and anthropogenic input accounts for 64% of the total NO3-N input [8]. The proportion of PN in the Danjiang subreservoir increases significantly during the wet season and is much higher than that in the Hanjiang subreservoir. Moreover, The Danjiang subreservoir was greatly affected by nonpoint source pollution, and it has been inferred that it was caused by N attached to farmland soil flowing into rivers, or directly into the reservoir, with precipitation runoff [3].
In general, N is discharged into water in the reduced form (NH3-N) and oxidized to nitrate N (NO3-N) by nitrification. Higher temperatures during the flood season are conducive to nitrification, so the proportion of nitrate N in the flood season is higher than that in other seasons [26]. The Danjiangkou Reservoir is a deep-water reservoir with marked stratification, and NO3-N shows seasonal periodic variation and stratification phenomena. Periodic variation is mainly affected by the concentration limit of ammonia N in the inflow water, and the prominent stratification of the Danjiangkou Reservoir arises because the concentration of NO3-N in the lower layer exceeds that of the upper layers [28]. The distribution and transformation of N in the reservoir area are affected, not only by the inflow river, but also by hydrological and hydrodynamic conditions and endogenous factors [3].
3. Sources of N in the Water
3.1. Overall Analysis of N Pollution
The main sources of N in the Danjiangkou Reservoir are the inflow tributaries, nonpoint source pollution around the reservoir, endogenous release, and atmospheric N deposition. In general, TN pollution in tributaries is more prominent and is the main source of high TN concentrations in the Danjiangkou Reservoir [15]. Moreover, TN pollution is primarily sourced from nonpoint sources in the area. Moreover, rivers characterized by high TN concentrations are typically classified as Class V areas, for example: the Laoguan River watershed in Henan Province; the Danjiang River watershed in the Shaanxi and Henan provinces; the Shending, Sihe, Jianhe, and Zhihe rivers and other watersheds in Shiyan City in Hubei Province; the Tianhe River in Xunxi County in Hubei Province; and the Hanjiang River watershed and its tributaries flowing through Hanzhong City in Shaanxi Province. Numerous studies have shown that the Hanjiang River is greatly affected by point source pollution, while the Danjiang River is markedly affected by nonpoint source pollution.
N pollution is severe in the area around the Danjiangkou Reservoir. Moreover, the areas characterized by severe TN pollution in the Danjiangkou Reservoir area are primarily distributed in the water–land interface area, east of the Danjiang subreservoir, and tributary storage [21]. From the perspective of spatial distribution, Xichuan County, Shiyan City, Yun County, and Danjiangkou City are situated close to the reservoir, and are characterized by significant N pollution. Among them, Xichuan County produces the largest amount of ammonia N and TN (15.32% and 18.76%, respectively) in the reservoir area [29].
In the Laoguanhe area, point source pollution and nonpoint source pollution are equal N contributors [30]. However, because of significant runoff in this area, the TN concentration is low. Shiyan City is a heavily polluted area [31]. The Shending, Zhihe, Sihe, Guanshan, and Jianhe rivers, which flow through Shiyan City and Danjiangkou City, are all direct inflow tributaries that substantially impact the water quality of the Danjiangkou Reservoir. Moreover, nonpoint source pollution severely impacts the Hanjiang and Danjiang rivers in Shanxi Province (Figure 8).
3.2. Analysis of Nonpoint Source Pollution
In recent years, the point sources around the Danjiangkou Reservoir have been controlled, but the nonpoint source pollution, and the pollutants sourced from the tributaries, pose a severe threat to the reservoir water body and have become the leading factors impacting water quality change in the Danjiangkou Reservoir [32]. The nonpoint source pollution load of the Danjiangkou Reservoir accounts for 60% of the total load [15]. Moreover, nonpoint source pollution caused by untreated agricultural wastewater, chemical fertilizers, and animal husbandry accounts for more than 50% of the input load of nutrients in the watershed [33]. Therefore, nonpoint source pollution in the Danjiangkou Reservoir area is the dominant factor influencing the TN concentration of the reservoir.
The key prevention and control areas of nonpoint source pollution in the reservoir area and upstream are around the Danjiangkou Reservoir, the boundary section of the Hanjiang and the Danjiang rivers in Shaanxi Province, and the Laoguanhe River. The spatial distribution of nonpoint source TN pollution in the reservoir area is generally characterized by “high in the east and low in the west, local concentration, uneven distribution, and close to the water source.” Moreover, the high-load area is mainly distributed near the water body [30]. Because of intensive agricultural activities, the reservoir area experiences severe soil erosion and significant runoff [34].
3.2.1. Farmland as a Nonpoint Pollution Source
Compared with woodland and grassland, agricultural land produces larger flow and soil erosion, as well as more prominent nonpoint source pollution [35,36]. Moreover, the loss of chemical fertilizer substantially impacts nutrient concentrations in the reservoir [37]. The Danjiangkou Reservoir watershed is characterized by numerous large-slope mountains and large rural and cultivated land areas. Moreover, the watershed area experiences severe soil erosion. The agricultural nonpoint N source and phosphorus pollution emissions caused by chemical fertilizer loss are 3536.32 t/a, and 553.14 t/a, respectively [29]. Areas with higher TN are usually adjacent to larger farmlands [21], and traditional slope tillage is commonly used, which aggravates soil erosion under heavy rainfall conditions [38]. Liu (2014) reported that the TN concentration in average runoff generally increased with the increase in the fertilization amount during fertilization treatment [39]. The use of a vegetation filter belt can effectively fix N in runoff and prevent and control water eutrophication [40]. Lü (2019) studied the use of the dominant species, Cynodon dactylon and Alternanthera philoxeroides, in the Danjiangkou Reservoir area as plant buffer belts to control agricultural nonpoint source pollution; after the end of flooding, the soil TN decreased by 11.75% in Alternanthera philoxeroides, and by 3.62% in Cynodon dactylon [41].
3.2.2. Pollution from Dispersed Livestock and Poultry Breeding
In recent years, to increase the economic income of farmers, the state has implemented a series of policies to promote the rapid development of rural animal husbandry. However, this has resulted in significant increases in poultry manure pollution. According to previous studies, most farms adopt free-range breeding. The treatment of poultry manure is simple, and the amount of fecal wastewater is large. Fecal wastewater with a high pollution load is discharged into surface water, leading to environmental and water pollution [17]. Several researchers estimated the amount of N loss in the water source area of Henan Province, and determined that the loss of TN was 7.16 times that of total phosphorus (TP), among which the pollutants produced by livestock breeding accounted for 69.93% of the total pollutants, and the loss of fertilizer in farmland accounted for 21.99% of the total pollutants [42].
3.2.3. Land-Use Cover Change and Soil Erosion
More than 85% of the Danjiangkou Reservoir area is hilly, with a high degree of reclamation and severe vegetation degradation. Soil erosion has become an important ecological problem in water sources areas [43,44]. According to the Second National Remote Sensing Survey, the area of soil erosion in the Danjiangkou water source area is 47,400 km2, accounting for 53.82% of the total land area. The distribution of soil and water loss in the Danjiangkou Reservoir area is generally consistent with that of the population, which is primarily distributed around the Danjiangkou Reservoir, the upper and middle streams of the Danjiang River, the Xunhe and Qianjin watersheds, along the main stream of the Hanjiang River, around the Hanzhong watershed, the source area of the Hanjiang River, the upper and middle streams of the Danjiang River, and the source area of the Hanjiang River.
The main factors affecting N loss are rainfall and land-use type [45,46]. The precipitation in the Danjiangkou Reservoir area mainly occurs from May to October, mostly in the form of rainstorms, and the annual distribution of inflow runoff is uneven; however, the amount of inflow from May to October accounts for more than 79% of the total annual water [47,48]. The surface runoff of eroded land brings a large amount of sediment and nutrients into the water, resulting in an increase in water nutrients [33]. Using the existing landscape to regulate runoff, particularly village runoff, can effectively reduce the input of N to the downstream water body and improve water quality [49]. Nitrate N is the main component of the inorganic N pool in farmland, and the N loss of cultivated soil is greater than that of woodland and shrub soil [50]. Therefore, transforming farmland to forests can effectively limit N loss [51], but this approach is difficult to implement. The destruction of surface vegetation aggravates water and soil loss, and soil erosion [38].
3.3. Analysis of Endogenous Pollution
Endogenous pollution is a commonly occurring phenomenon in numerous lakes and reservoirs in China and is also an important factor leading to the seasonal deterioration of the water quality [38]. As an important source and sink of N in lakes and reservoirs, sediment maintains a dynamic balance with the N content in the surface water layers [52], and negatively impacts water quality in the long term [53]. The water intake of the Danjiangkou Reservoir is above the dead water level, and the internal load is not reduced after water intake. Owing to the concern that there is not enough water after the flood season, the reservoir rarely opens the bottom outlet for scouring and silting, and the pollutants in the reservoir cannot be washed out of the reservoir [38]. Lei et al. studied the ammonia N and P at the water–sediment interface of three typical bays in the Danjiangkou Reservoir area and determined that ammonia N and phosphate at the water–sediment interface of typical bays were released from the sediment to the overlying water. The water quality of the reservoir had the risk of releasing potential endogenous nutrients (ammonia N and phosphate), and the diffusion flux of ammonia N in Shendinghe Bay was the highest among the three bays [27]. Through experiments, Wang et al. determined that nutrients in the reservoir were released from the sediment to the overlying water, and the sediment was an important input source of NH3-N to the overlying water. Compared with other lakes and reservoirs, both locally and internationally, the N release rate was higher [54].
3.4. Impact of Water-Fluctuation Zone on Water Quality
The water fluctuation zone is located in the transition zone of the water land ecosystem, which refers to the fluctuation zone formed between the highest water level and the lowest water level due to seasonal water level fluctuation and the periodic water storage of the reservoir [55,56]. The water-fluctuation zone is the last ecological barrier to prevent water pollution and plays an important role in the protection of the eco-environment and water sources [57,58]. Local research on the water fluctuation zone has only been conducted recently, with researchers historically focusing on the water level fluctuating zone in the Three Gorges Reservoir area.
In 2014, the normal water level of the Danjiangkou Reservoir reached 170 m. Moreover, the land area of the affected area was 307.7 km2, and the maximum water depth was 80 m [59]. Cultivated land with a high N background was inundated, and frequent hydrological processes released N from the soil of the fluctuating zone into the water. After 2014, the amount of released N increased from 196.9 t/a to 301.2 t/a [60]. Tang et al. reported that the accumulation of N, P, and other nutrients in the shoal farmland around the Danjiangkou Reservoir was higher than that in the estuarine sediment and reservoir bay sediment, and the risk of water eutrophication would increase after the dam was heightened [33]. The soil TN background and dissolved N were higher in the tributary area and the newly inundated area of the Hanjiang subreservoir. Moreover, the newly inundated area of the Danjiang subreservoir was lower, and the area with high dissolved N was characterized by intensive agricultural activity and severe soil erosion [61]. Yin et al. demonstrated that the annual release of N was 10-fold that of P in the water-level-fluctuating area of the Danjiangkou Reservoir. Moreover, they observed high N release in Xichuan County and the Yunyang District [60]. Shu et al. concluded that inundation promoted the adsorption of NO3-N and the release of NH3-N in the soil [62]. The denitrification process of reducing nitrate N to N2 by bacteria is the main mechanism of NO3-N removal in the riverside zone [63].
3.5. Atmospheric N Deposition
Liu et al. determined that atmospheric N dry deposition in the Danjiangkou Reservoir accounted for 29.4% of the total deposition, and the seasonal distribution of TN deposition was summer > autumn > spring > winter. Moreover, they determined that NH3-N, NO3-N, DON, and PN accounted for 22.1%, 16.8%, 37.2%, and 23.9%, respectively, of TN in dry deposition, and 36.6%, 34.4%, 12.9%, and 16.1%, respectively, of TN in wet deposition [64]. Dry deposition in the Danjiangkou Reservoir mainly occurs from April to September and is related to temperature change and the fertilization time [64].
4. Conclusions and Prospects
This paper summarizes and synthesizes existing research on N in the Danjiangkou Reservoir. On the basis of this research, the main conclusions follow.
N is temporally and spatially distributed in the Danjiangkou Reservoir and the surrounding area. The TN concentrations in the north of the Hanjiang subreservoir and the Danjiang subreservoir are the highest. Moreover, the contribution of TN from tributaries to the Hanjiang subreservoir is higher than that of the Danjiang subreservoir. The TN concentration in the Danjiangkou Reservoir decreased in 2014, and a large number of bays have been formed since the dam was heightened, resulting in significant N accumulation and high seasonal TN fluctuations in the Danjiangkou Reservoir area. Moreover, several of the tributaries were seriously polluted, the annual and seasonal fluctuations of TN increased significantly, and the seasonal variation trend of TN concentration was similar for the tributaries. DIN is the main form of N in the Danjiangkou Reservoir area and inflow tributaries, and other N forms were in equilibrium and stable states.
N sources of the Danjiangkou Reservoir include tributaries, which are the main source, followed by nonpoint source pollution. The fluctuation zone plays an important role in the protection of water quality in the reservoir area. Meanwhile, N release is high in the fluctuation zone, and the contribution of atmospheric N deposition to the N content of the reservoir cannot be ignored.
The N cycle and control involve many fields and complex pollution sources, and future research should focus on the following:
(1) The existing studies mainly focus on a typical small watershed, and there is a lack of large-scale research on the entire reservoir and upstream area. Combining the temporal and spatial distribution characteristics of N in the Danjiangkou Reservoir area and upstream with the regional economy, population, and pollution discharge, a large-scale pollution model should be constructed to interpret the N cycle and aid the implementation of strategies to reduce anthropogenic N sources.
(2) The Danjiangkou Reservoir and upper stream cover a large area, and there are numerous river systems, a complex surface morphology, and many pollution factors, which lead to great differences in N pollution source information, pollutant forms, and hydrodynamic conditions. Meanwhile, the transformation process of N forms continues to occur after entering the water body. Therefore, the uncertainty of the identification process of pollution sources makes it difficult to determine the influence of N control policies. The inversion method of N pollution sources, based on satellite remote sensing, can effectively identify nonpoint source pollution sources, which may be a key research direction in the future.
(3) The model data fusion method and multi-model integration analysis are effective means of studying the spatial and temporal variations of the N cycle process. The applications of dynamic monitoring data, data fusion methods, and the N cycle model can effectively reduce the uncertainty around estimating future N contents, which may be an important research direction in the future. On the one hand, remote sensing data can be automatically integrated into the objective analysis of the big data of the water quality model by means of machine learning, in combination with satellite remote sensing data, so as to realize the cross-validation of ground station data and fill or correct the shortcomings of ground data in spatial continuity, stability, and accuracy. On the other hand, the model data fusion method can dynamically monitor the real-time changes of various pollution sources so as to obtain more accurate water quality prediction results. For example, cognitive computing proposed by IBM is an idea worth learning from.
(4) Early research on the N cycle and control in the Danjiangkou Reservoir mainly focuses on the source, migration, transformation, and distribution characteristics of N in the reservoir, while more recent research has gradually expanded to include aspects of the N budget in the water level area, the endogenous release of sediment, remote sensing inversion, the influence of the planktonic bacterial community on the N cycle, atmospheric deposition, and the N fixation of surface vegetation. The proposed N control measures have certain theoretical support, and case support from other regions, but there is a lack of case studies in the Danjiangkou Reservoir watershed. Owing to the different attributes of the lakes, reservoirs, and rivers, the mutual reference in the N cycle and control is currently limited. Therefore, further research is required to establish a process control countermeasure system of source, transmission, and end of catchment, according to the characteristics of the Danjiangkou Reservoir.
Author Contributions
J.-J.L. and F.D. contributed to the main work of the study design, data collection, analyses, and manuscript writing. A.-P.H., Q.-Y.L. and W.-Q.P. contributed to data collection and analyses. All authors have read and agreed to the published version of the manuscript.
Funding
This research was funded by the National Key Research and Development Program (2018YFC0407702), National Natural Science Foundation of China (51809288), and the Basic Scientific Research Business Expenses of China Institute of Water Resources and Hydropower Research (WE0145B382019; WE0145B532017).
Institutional Review Board Statement
Not applicable.
Informed Consent Statement
Informed consent was obtained from all subjects involved in the study.
Conflicts of Interest
The authors declare no conflict of interest.
Appendix A
Statistics on recent research relating to N pollution in the Danjiangkou Reservoir in domestic and international journals.

Table A1.
Research on N in Danjiangkou reservoir and upper stream.
| Author | Year | Research Method | Research Area | Indicator | Research Content |
|---|---|---|---|---|---|
| Yin et al. | 2007 | Reservoir area, tributaries entering the reservoir | TN, NH3-N | Cause and control | |
| Wang et al. | 2008 | Reservoir area, tributaries entering the reservoir | TN, NH3-N, NO3-N, NO2-N | Dynamic characteristics | |
| Tu et al. | 2010 | Arcview | Hanjiang subreservoir | TN, NH3-N, NO3-N | Nonpoint source dynamic change |
| Lei et al. | 2012 | TLI a | Tributaries entering the reservoir | TN, NH3-N, NO3-N | Dynamic characteristics |
| Li et al. | 2012 | Soil | TN, NH3-N, NO3-N | Land-use type | |
| Qiao et al. | 2013 | SWAT | Watershed of Danjiang subreservoir | Adsorbed N, dissolved N | Spatial and temporal distribution of agricultural nonpoint source |
| Zeng et al. | 2014 | Fractional leaching by N form | Water-fluctuation zone | TF-N b, IEF-N c, CF-N d, IMOF-N e, OSF-N f, NTF-N g | |
| Lei et al. | 2016 | Soil | TN, NH3-N, NO3-N, DTN h, DON i, DIN j | N loss | |
| Zhu et al. | 2016 | Reservoir area, tributaries entering the reservoir | TN, NH3-N, NO3-N, NO2-N, DTN, DON, DIN | Distribution characteristics | |
| Wang et al. | 2016 | Reservoir area, tributaries entering the reservoir | TN, NH3-N | Distribution characteristics | |
| Chen et al. | 2005, 2010 | Watershed of Danjiang subreservoir | TN, NH3-N, NO3-N, NO2-N | Dynamic characteristics | |
| Song et al. | 2006 | Tributaries entering the reservoir in Shiyan City | TN | Pollution source | |
| Song et al. | 2009 | Hanjiang subreservoir | TN, NH3-N, NO3-N, NO2-N | Pollution source | |
| Li et al. | 2009 | Reservoir area | NH3-N, NO3-N, DIN | Distribution characteristics | |
| Xiao et al. | 2013 | Soil | TN, NH3-N, NO3-N | Distribution characteristics | |
| Ai et al. | 2015 | Reservoir area, tributaries entering the reservoir | NH3-N | Spatial and seasonal pattern | |
| Zhuang et al. | 2016 | Watershed of Danjiang subreservoir | TN | Source | |
| Min et al. | 2017 | Reservoir area, tributaries entering the reservoir | TN, NH3-N, NO3-N, NO2-N | Distribution characteristics and control of N emissions | |
| Liu et al. | 2017 | Reservoir area, tributaries entering the reservoir | TN, NH3-N | Distribution characteristics | |
| Xin et al. | 2018 | Reservoir area, tributaries entering the reservoir, bays of the reservoir | TN, NH3-N, NO3-N | Pollution source | |
| Luo et al. | 2018 | Reservoir area | TN, NH3-N, NO3-N, TDN | Dry precipitation | |
| Dang et al. | 2018 | Reservoir area | TN, NH3-N, NO3-N | Sediment | |
| Yin et al. | 2018 | Water-fluctuation zone | TN | Impact of hydro-fluctuation belt | |
| Zhao et al. | 2018 | Tributaries entering the reservoir | TN | N budget load | |
| Liu et al. | 2018 | Tributaries entering the reservoir | TN, NH3-N, NO3-N, DTN, DIN | Distribution characteristics | |
| Zhang et al. | 2019 | 16S r DNA Miseq high-throughput sequencing | Reservoir area | Phytoplankton community | N cycle |
| Wang et al. | 2019 | Danjiang subreservoir | TN, NH3-N | Internal source release | |
| Lei et al. | 2019 | Around the reservoir | TN, NH3-N, NO3-N, NO2-N | Vegetative filter strip | |
| Zhu et al. | 2020 | Reservoir area, tributaries entering the reservoir | NH3-N | Dynamic characteristics | |
| Zhang et al. | 2020 | TLI | Reservoir area, tributaries entering the reservoir | TN | Evaluation of trophic state |
| Hao et al. | 2020 | Isotope, MCMC mixing model | Tributaries entering the reservoir | TN, NH3-N, NO3-N | Source, migration and transformation |
| Han et al. | 2020 | Reservoir area, tributaries entering the reservoir | TN, NH3-N, NO3-N, NO2-N | Water-sediment interface | |
| Dong et al. | 2020 | Remote sensing | Danjiang subreservoir | TN, NH3-N | Inversion |
| Li et al. | 2020 | Bays of Danjiangkou Reservoir | TN | Impact of watershed landscape |
a Comprehensive trophic state index method; b transferable N; c ion exchange N; d carbonate bounded form; e oxidation state of iron and manganese; f bounded form of organic sulfide; g nontransferable N; difference between TN and TF-N; h total dissolved N; i dissolved organic N; j dissolved inorganic N.
References
- Yu, C.; Huang, X.; Chen, H.; Godfray, H.C.J.; Wright, J.S.; Hall, J.W.; Gong, P.; Ni, S.; Qiao, S.; Huang, G.; et al. Managing nitrogen to restore water quality in China. Nature 2019, 567, 516–520. [Google Scholar] [CrossRef]
- Ma, F.B.; Li, C.H.; Wang, X.; Yang, Z.F.; Sun, C.C.; Liang, P.Y. A Bayesian method for comprehensive water quality evaluation of the Danjiangkou Reservoir water source area, for the middle route of the South-to-North Water Diversion Project in China. Front. Earth Sci. 2014, 8, 242–250. [Google Scholar] [CrossRef]
- Zhu, Y.Y.; Liu, Y.; Zhou, B.H.; Jiang, Q.F.; Wu, D.W. The Temporal and Spatial Distribution of Nitrogen in Danjiangkou Reservoir Watershed Environmental Monitoring in China. Environ. Monit. China 2016, 32, 50–57. [Google Scholar]
- Li, S.Y.; Cheng, X.L.; Xu, Z.F.; Han, H.Y.; Zhang, Q.F. Spatial and temporal patterns of the water quality in the Danjiangkou Reservoir, China. Hydrol. Sci. J. 2009, 54, 124–134. [Google Scholar] [CrossRef]
- Chen, Z.J.; Yuan, J.; Sun, F.; Zhang, F.; Chen, Y.; Ding, C.Y.; Shi, J.W.; Li, Y.Y.; Yao, L.G. Planktonic fungal community structures and their relationship to water quality in the Danjiangkou Reservoir, China. Sci. Rep. 2018, 8, 1–11. [Google Scholar] [CrossRef] [PubMed] [Green Version]
- Galloway, J.N.; Townsend, A.R.; Erisman, J.W.; Bekunda, M.; Cai, Z.; Freney, J.R.; Martinelli, L.A.; Seitzinger, S.P.; Sutton, M.A. Transformation of the nitrogen cycle: Recent trends, questions, and potential solutions. Science 2008, 320, 889–892. [Google Scholar] [CrossRef] [PubMed] [Green Version]
- Yuan, J.; Li, S.; Han, X.; Chen, Q.; Cheng, X.; Zhang, Q. Characterization and source identification of nitrogen in a riverine system of monsoon-climate region, China. Sci. Total Environ. 2017, 592, 608–615. [Google Scholar] [CrossRef]
- Jiang, H.; Liu, W.J.; Zhang, J.Y.; Zhou, L.; Zhou, X.D.; Pan, K.; Zhao, T.; Wang, Y.C.; Xu, Z.F. Spatiotemporal variations of nitrate sources and dynamics in a typical agricultural riverine system under monsoon climate. J. Environ. Sci. 2020, 93, 98–108. [Google Scholar] [CrossRef]
- Giles, J. Nitrogen study fertilizes fears of pollution. Nature 2005, 433, 791. [Google Scholar] [CrossRef] [PubMed] [Green Version]
- Tan, X.; Xia, X.L.; Li, S.Y.; Zhang, Q.F. Water Quality Characteristics and Integrated Assessment Based on Multistep Correlation Analysis in the Danjiangkou Reservoir, China. J. Environ. Inform. 2015, 25, 60–70. [Google Scholar] [CrossRef]
- Wang, S.H.; Wang, W.W.; Jiang, X.; Zhao, L.; Zhang, B.; Wu, D.W.; Chang, L. Spatial and temporal distribution and flux of nitrogen in water of Danjiangkou Reservoir. Res. Environ. Sci. 2016, 29, 995–1005. [Google Scholar]
- Gao, Y.Y.; Li, S.C.; Chen, H.Y. Spatial and temporal distribution characteristics of nitrogen and phosphorus in the Danjiangkou reservoir area (Henan) in the past 2015–2017. J. Nanyang Norm. Univ. 2018, 17, 20–25. [Google Scholar]
- Song, G.Q.; Zhang, W.D.; Yin, M.; Jiang, B. Monitoring and Comprehensive Assessment of Total Nitrogen in Danjiangkou Reservoir. Environ. Sci. Technol. 2009, 32, 140–142. [Google Scholar]
- Xin, X.K.; Xu, J.F. Countermeasures for total nitrogen pollution control in water source area of Middle Route Project of South to North Water Diversion. Yangtze River 2018, 49, 7–12. [Google Scholar]
- Min, Z.H. Research on the Change Trend and Prevention Countermeasures of Total Nitrogen in Danjiangkou Reservoir. Water Power 2017, 43, 5–9. [Google Scholar]
- Chen, L.B.; Yang, Z.F.; Liu, H.F. Sensitivity analysis for the total nitrogen pollution of the Danjiangkou Reservoir based on a 3-D water quality model. Front. Earth Sci. 2017, 11, 609–619. [Google Scholar] [CrossRef]
- Wu, D.W.; Chang, L. Temporal and spatial distribution of total nitrogen in Danjiangkou watershed. Sci. Technol. Innov. 2019, 84–85. [Google Scholar]
- Li, N.X.; Xu, J.F.; Yin, W.; Chen, Q.Z.; Wang, J.; Shi, Z.H. Effect of local watershed landscapes on the nitrogen and phosphorus concentrations in the waterbodies of reservoir bays. Sci. Total Environ. 2020, 716, 137132. [Google Scholar] [CrossRef] [PubMed]
- Pang, Z.L.; Chang, H.J.; Li, Y.Y.; Zhang, N.Q.; Du, R.Q.; Hu, L.Q. Analytical hierarchy process (AHP) evaluation of water quality in Danjiangkou reservoir-source of the middle line project to transfer water from south to north, China. Acta Ecol. Sin. 2008, 28, 1810–1819. [Google Scholar]
- Liu, L.H.; Peng, W.Q.; Wu, L.X.; Liu, L.S. IOP, Water Quality Assessment of Danjiangkou Reservoir and its Tributaries in China. In Proceedings of the 2017 2nd International Conference on Environmental Engineering and Sustainable Development. IOP Conf. Ser. Earth Environ. Sci. 2018, 112, 012008. [Google Scholar] [CrossRef]
- Wu, J.J.; Zhang, Q.; Yang, F.; Lei, Y.; Zhang, Q.F.; Cheng, X.L. Does short-term litter input manipulation affect soil respiration and its carbon-isotopic signature in a coniferous forest ecosystem of central China? Appl. Soil Ecol. 2017, 113, 45–53. [Google Scholar] [CrossRef]
- Huang, Y.J.; Bao, X.R. Study on water environment of Danjiangkou reservoir. Yangtze River 2014, 45, 54–56. [Google Scholar]
- Lin, J.J.; Fu, C.; Zhang, X.D.; Xie, K.; Yu, Z.G. Heavy Metal Contamination in the Water–Level Fluctuating Zone of the Yangtze River within Wanzhou Section, China. Biol. Trace Elem. Res. 2012, 145, 268–272. [Google Scholar] [CrossRef] [PubMed]
- Xin, X.K.; Li, K.F.; Finlayson, B.; Yin, W. Evaluation, prediction, and protection of water quality in Danjiangkou Reservoir, China. Water Sci. Eng. 2015, 8, 30–39. [Google Scholar] [CrossRef] [Green Version]
- Li, B. The Dynamic Change of Nitrogen and Eutrophication Assessment in the Water Source Area of the Middle Line of South-To-North Water Diversion Project; Nanyang Normal University: Nanyang, China, 2019. [Google Scholar]
- Liu, Y.; Zhu, Y.Y.; Qiao, X.C.; Zheng, B.H.; Chang, S.; Fu, Q. Investigation of nitrogen and phosphorus contents in water in the tributaries of Danjiangkou Reservoir. R. Soc. Open Sci. 2018, 5, 170624. [Google Scholar] [CrossRef] [Green Version]
- Lei, P. Research for Analysis of Pollution Source of Danjiangkou Reservioir Area and Upper Recheasand Characteristics of Water Quality Risk of the Representative Input Tributaries of Danjiangkou Reservoir; Wuhan University of Technology: Wuhan, China, 2012. [Google Scholar]
- Duan, Y. Water Encironment Dynamics Simulation Technology Research Based on EFDC–Danjiangkou Reservoir as an Example; University of Geosciences: Beijing, China, 2014. [Google Scholar]
- Kong, X.L.; Zhang, H.G.; Yang, D.L. A Study on Present Situation and Countermeasures of Ecological Environment in Danjiangkou Reservoir during the 13th Five-Year. J. Hebei Univ. Environ. Eng. 2017, 27, 26–28. [Google Scholar]
- Fang, N.F.; Shi, Z.H.; Li, L. Application of Export Coefficient Model in Simulating Pollution Load of Non-point Source in Danjiangkou Reservoir Area. J. Hydroecol. 2011, 32, 7–12. [Google Scholar]
- Ai, L.; Shi, Z.H.; Yin, W.; Huang, X. Spatial and seasonal patterns in stream water contamination across mountainous watersheds: Linkage with landscape characteristics. J. Hydrol. 2015, 523, 398–408. [Google Scholar] [CrossRef]
- Zheng, Y.X.; Cheng, C.; Xin, X.K. Calculation and discussion of non-point source pollution loads in Danjiangkou Reservoir Area. Yangtze River 2015, 46, 42–47. [Google Scholar]
- Tang, X.Q.; Wu, M.; Yang, W.J.; Yin, W.; Jin, F.; Ye, M.; Currie, N.; Scholz, M. Ecological Strategy for Eutrophication Control. Water Air Soil Pollut. 2012, 223, 723–737. [Google Scholar] [CrossRef]
- Zhuang, Y.H.; Zhang, L.; Du, Y.; Yang, W.J.; Wang, L.H.; Cai, X.B. Identification of critical source areas for nonpoint source pollution in the Danjiangkou Reservoir Basin, China. Lake Reserv. Manag. 2016, 32, 341–352. [Google Scholar] [CrossRef]
- Zhou, Y. Research on Non-Point Source Pollution Export Characteristics Nutrient Import/Export in Danjiangkou Reservoir Area; Huazhong Agricultural University: Wuhan, China, 2018. [Google Scholar]
- Zhang, T.G. Response of Nutrient Transports to Runoff and Sedment Process in a Small Watershed of Danjiangkou Watershed; Xi’an University of Technology: Xi’an, China, 2016. [Google Scholar]
- Liu, R.H.; Kang, Y.H.; Pei, L.; Wan, S.Q.; Liu, S.P.; Liu, S.H. Use of a New Controlled-Loss-Fertilizer to Reduce Nitrogen Losses during Winter Wheat Cultivation in the Danjiangkou Reservoir Area of China. Commun. Soil Sci. Plant Anal. 2016, 47, 1137–1147. [Google Scholar] [CrossRef]
- Zhu, Y.R.; Wu, Z.; Wang, F. Water quality of Danjiangkou Reservoir and sustainable development of water resources strategy. Express Water Resour. Hydropower Inf. 2016, 37, 10–11, 16. [Google Scholar]
- Yang, J.J.; Liu, S.L.; Wang, C.; Deng, L.; Dong, S.K. Forest pattern dynamics and landscape connectivity changes in the Manwan Basin after dam construction in the Lancang River, China. Landsc. Ecol. Eng. 2014, 10, 77–83. [Google Scholar] [CrossRef]
- Lei, J.S.; Chen, J.Z.; Yin, W. Retention efficiency of vegetative filter strips for Nitrogen in Danjiangkou resercoir area, central China. Ecol. Chem. Eng. S. 2019, 26, 279–297. [Google Scholar]
- Lü, F.L.; Ouyang, W.; Song, Y.T.; Cai, C.F.; Hao, R.; Wang, J.G. Simulation Study on the Effects of Cynodon dactylon and Alternanthera philoxeroides on Soil Nitrogen and Phosphorus Release in the Reservoir Water–level Fluctuation Zone. J. Soil Water Conserv. 2019, 33, 240–245, 253. [Google Scholar]
- Li, Z.Y.; Wang, G.Z.; Zuo, Q.T.; Qu, J.G. Applying Fractal Theory to Estimate Loss of Total Nitrogen and Total Phosphorus in Danjiangkou Reservoir Catchment. Bull. Soil Water Conserv. 2017, 37, 302–306. [Google Scholar]
- Yin, W.; Shi, Z.H.; Lei, A.L. Research on water environment of Danjiangkou Reservoir. Yangtze River 2011, 42, 90–94. [Google Scholar]
- In, W.; Shi, Z.H.; Lei, A.L. Practice and consideration of ecological environmental protection of Danjiangkou Reservoir area. Yamgtze River 2011, 42, 59–63. [Google Scholar]
- Li, Y.J.; Zhang, Z.H.; Li, J.K.; Hao, G.R. Research progress on quantification and control of non-point source pollution in the Danjiang and Hanjiang River Basin. J. Water Resour. Water Eng. 2020, 31, 19–27, 35. [Google Scholar]
- Liu, Q. Study on Processes and Controlling of Runoff Sediment and Nutrient Losses in a Watershed of the Middle Reaches of Han River; Chinese Academy of Sciences and Ministry of Education: Beijing, China, 2013. [Google Scholar]
- Zhai, J.Q.; Zhao, Y.; Pei, Y.S. Research on Hydrological Risk Factors of Water Supply of the Source of Middle Route of the South-to-North Water Transfer Project. South North Water Transf. Water Sci. Technol. 2010, 8, 13–16, 22. [Google Scholar]
- Bao, H.F. Influence Analysis on Biogical Diversity of Danjiangkou Reservoir at the Middle Route South-to-North Water Transfer Project; Northeast Forestry University: Harbin, China, 2013. [Google Scholar]
- Tu, A.G.; Yin, W.; Chen, D.Q.; Ye, M.; Lei A, L. Dynamic change research of Nitrogen loss from surface runoff in the typical small watershed Danjiangkou Reservoir area. Resour. Environ. Yangtze Basin 2010, 19, 926–932. [Google Scholar]
- Cheng, X.L.; Yang, Y.H.; Li, M.; Dou, X.L.; Zhang, Q.F. The impact of agricultural land use changes on soil organic carbon dynamics in the Danjiangkou Reservoir area of China. Plant Soil 2013, 366, 415–424. [Google Scholar] [CrossRef]
- Li, M.; Zhou, X.H.; Zhang, Q.F.; Cheng, X.L. Consequences of afforestation for soil nitrogen dynamics in central China. Agric. Ecosyst. Environ. 2014, 183, 40–46. [Google Scholar] [CrossRef]
- Wen, S.L.; Gong, W.Q.; Wu, T.; Zheng, X.L.; Jiang, X.; Li, X.; Zhong, J.C. Distribution Characteristics and Fluxes of Nitrogen and Phosphorus at the Sediment–water Interface of Yuqiao Reservoir. Environ. Sci. 2018, 39, 2154–2164. [Google Scholar]
- Schindler, D.W.; Carpenter, S.R.; Chapra, S.C.; Hecky, R.E.; Orihel, D.M. Reducing Phosphorus to Curb Lake Eutrophication is a Success. Environ. Sci. Technol. 2016, 50, 8923–8929. [Google Scholar] [CrossRef]
- Wang, Z.Q.; Liu, X.X.; Yao, Z.H.; Yao, L.G.; Chang, Y.; Liu, Z.C.; Cao, L.H. Endogenous Release of Nitrogen and Phosphorus in the Danjiangkou Reservoir. Environ. Sci. 2019, 40, 4953–4961. [Google Scholar]
- Cheng, R.M.; Wang, X.R.; Xiao, W.F.; Guo, Q.S. Advances in Studies on Water–Level–Fluctuation Zone. Sci. Silv. Sin. 2010, 46, 111–119. [Google Scholar]
- Ai, L.J.; Wu, Z.N.; Zhang, Y.L. Research review of water fluctuation zone at home and abroad. Ecol. Sci. 2013, 32, 259–264. [Google Scholar]
- Liu, R.X.; Chen, L.Q.; Shi, Z.H. Spatial distribution of plant communities and environmental nterpretation in the riparian zone of Danjiangkou Reservoir. Acta Ecol. Sin. 2015, 35, 1208–1216. [Google Scholar]
- Pan, Y.D.; Guo, S.J.; Li, Y.Y.; Yin, W.; Qi, P.C.; Shi, J.W.; Hu, L.Q.; Li, B.; Bi, S.G.; Zhu, J.Y. Effects of Water Level Increase on Phytoplankton Assemblages in a Drinking Water Reservoir. Water 2018, 10, 256. [Google Scholar] [CrossRef] [Green Version]
- Yin, J.; Liu, H.; Chen, X.L. Dynamic Change in the Water-Level Fluctuation Zone of the Danjiangkou Reservoir and Its Influence on Water Quality. Sustainability 2018, 10, 1025. [Google Scholar] [CrossRef] [Green Version]
- Wang, J.; Yin, W.; Zhao, X.L.; Yang, M.; Duan, C.; Zhu, C.; Shi, Z.H. The potential risk evaluation of farmland soil from new submerged area in Danjiangkou Reservoir. China Environ. Sci. 2015, 35, 157–164. [Google Scholar]
- Shu, X.; Zhang, K.R.; Zhang, Q.F.; Wang, W.B. Response of soil physico-chemical properties to restoration approaches and submergence in the water level fluctuation zone of the Danjiangkou Reservoir, China. Ecotox. Environ. Saf. 2017, 145, 119–125. [Google Scholar] [CrossRef] [PubMed]
- Ye, C.; Cheng, X.; Zhang, Y.; Wang, Z.; Zhang, Q. Soil nitrogen dynamics following short-term revegetation in the water level fluctuation zone of the Three Gorges Reservoir, China. Ecol. Eng. 2011, 38, 37–44. [Google Scholar] [CrossRef]
- Liu, D.B.; Zhang, X.Y.; Ba, R.X.; Liu, Y.; Fan, X.P.; Zhang, F.L.; Xiong, G.Y. Atmospheric nitrogen deposition in Danjiangkou Reservoir area of Northwest Hubei. Acta Ecol. Sin. 2015, 35, 3419–3427. [Google Scholar]
- Luo, L.; Zhao, T.Q.; Guo, X.M.; Zhang, C.X.; Xiao, C.Y.; Wu, L.; He, Y.X. Dry deposition of atmospheric Nitrogen in large reservoir as drinking water sources: A case strdy from the Danjiangkou reservoir, China. Environ. Eng. Manag. J. 2018, 17, 2211–2219. [Google Scholar]
Figure 1.
Publication statistics.
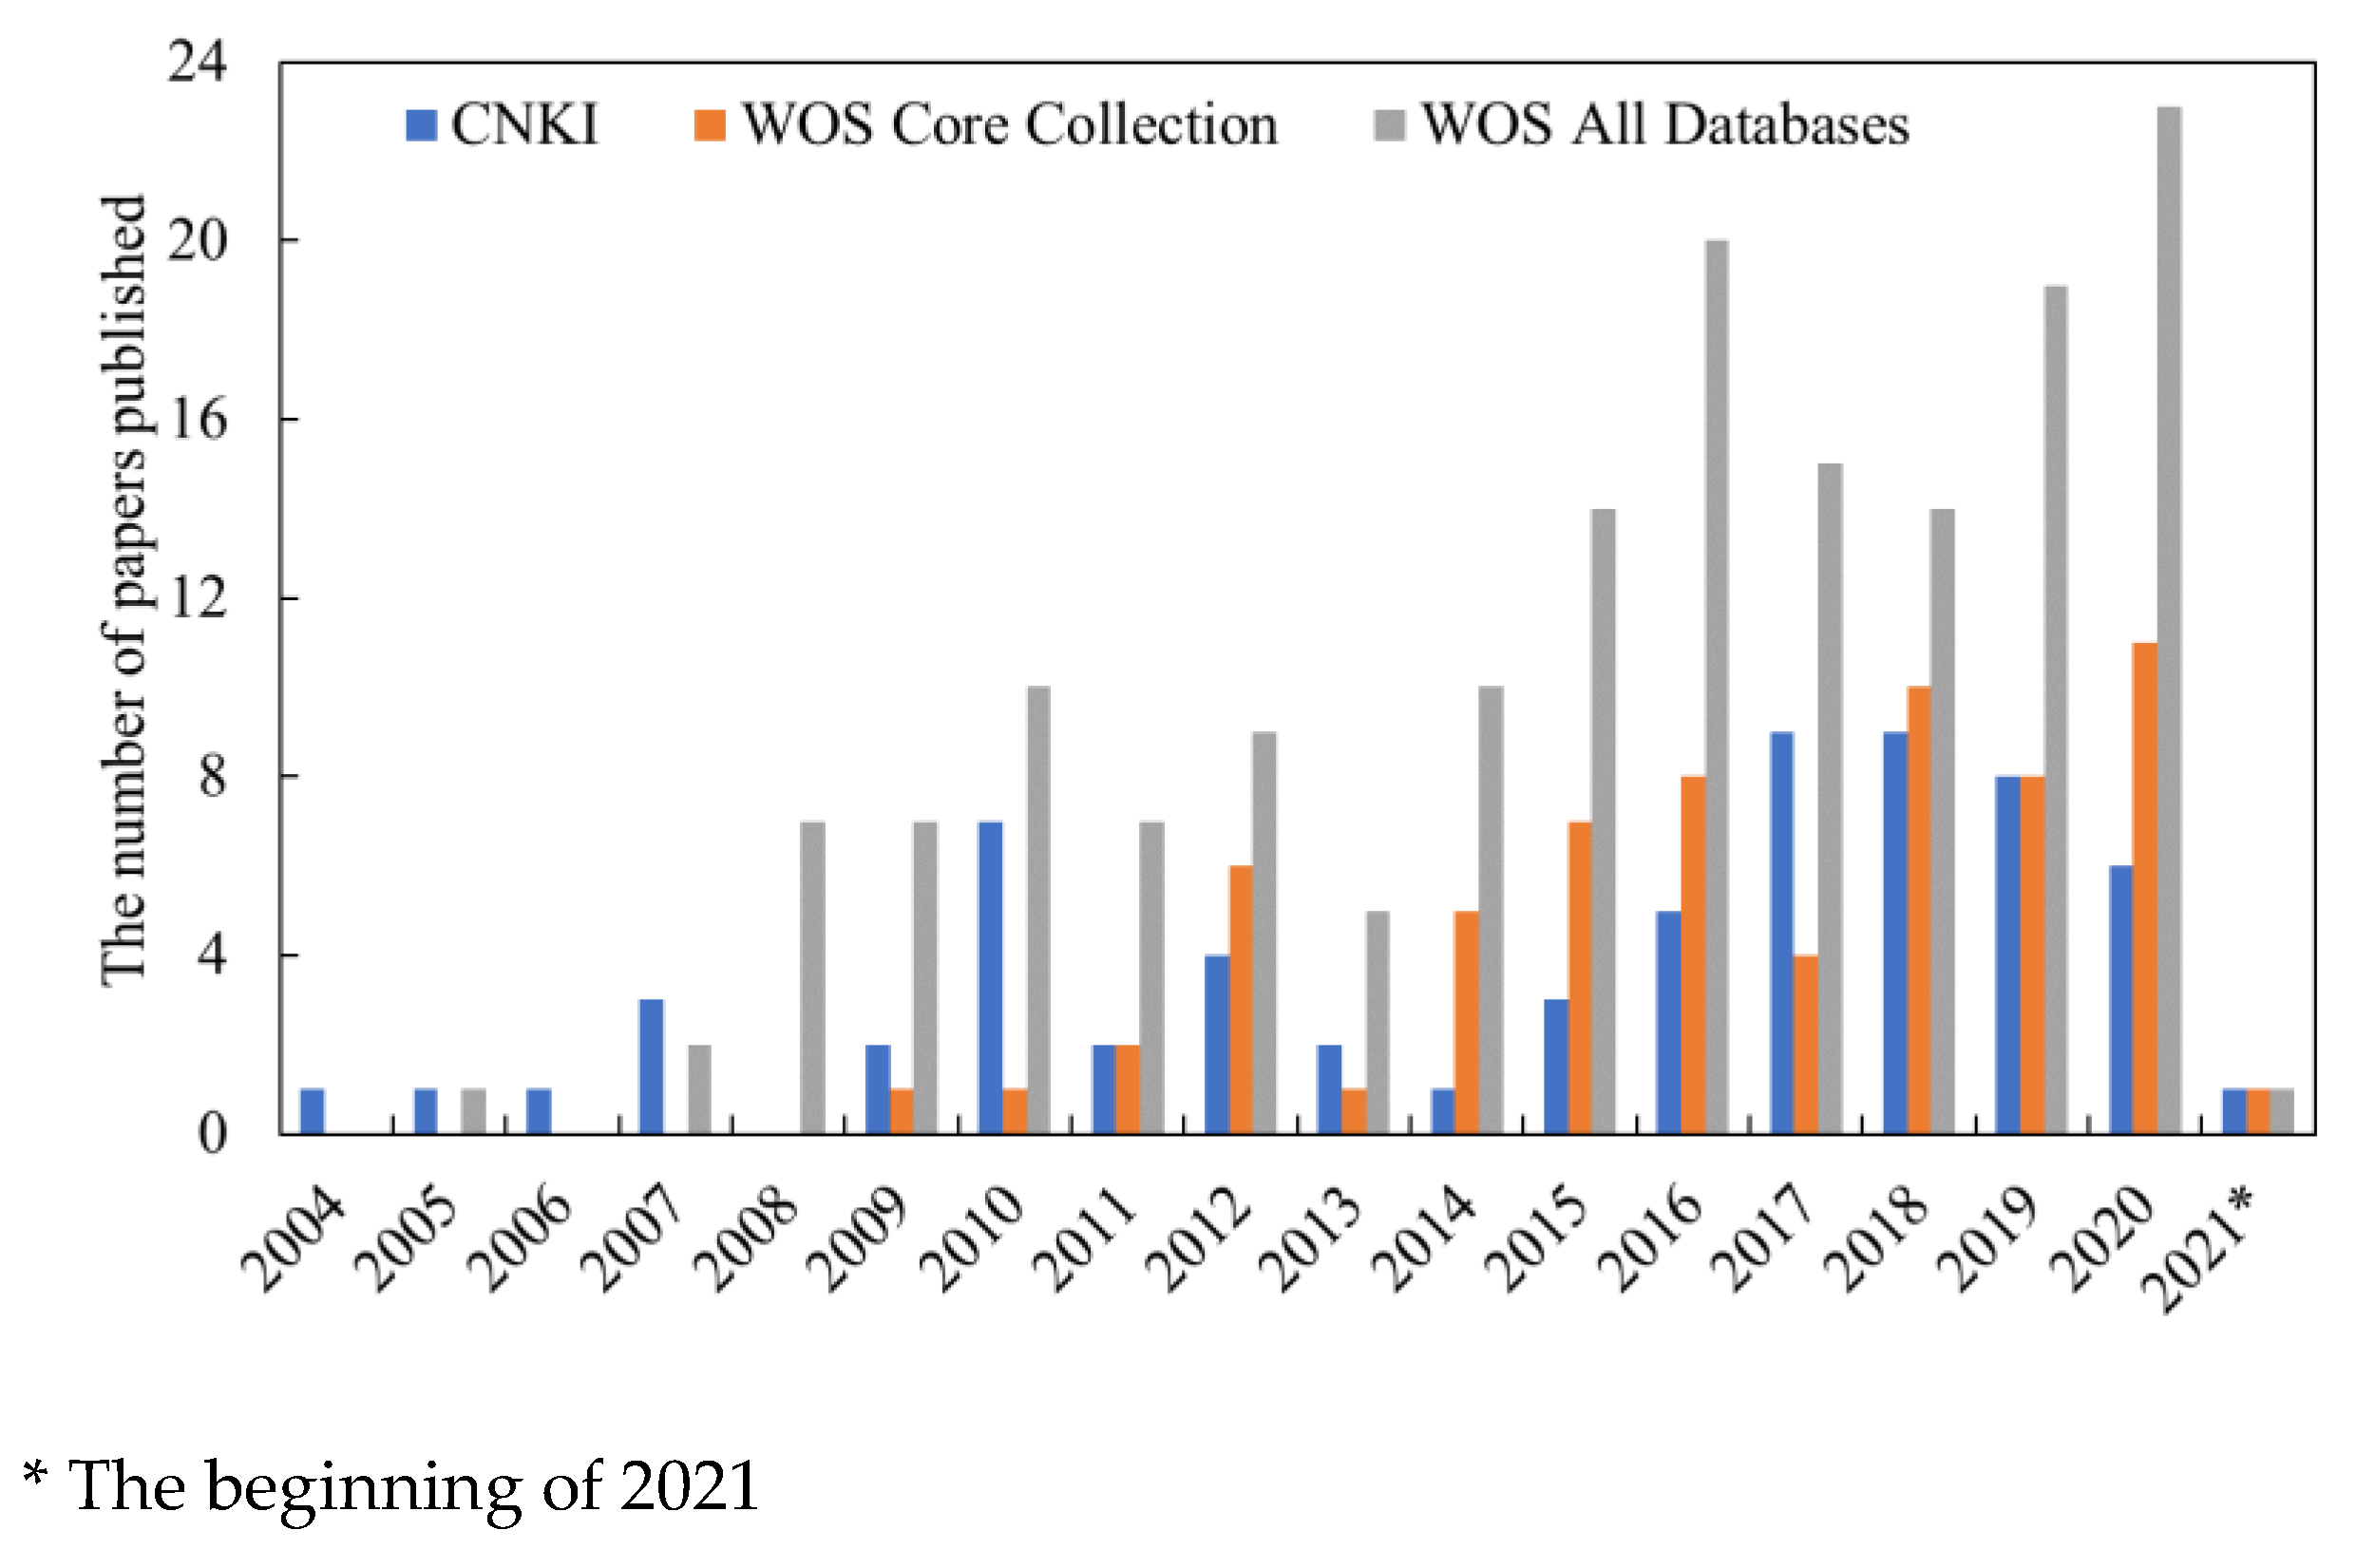
Figure 2.
River system in the Danjiangkou Reservoir watershed.

Figure 3.
TN distribution in the Danjiangkou Reservoir (2009–2018).
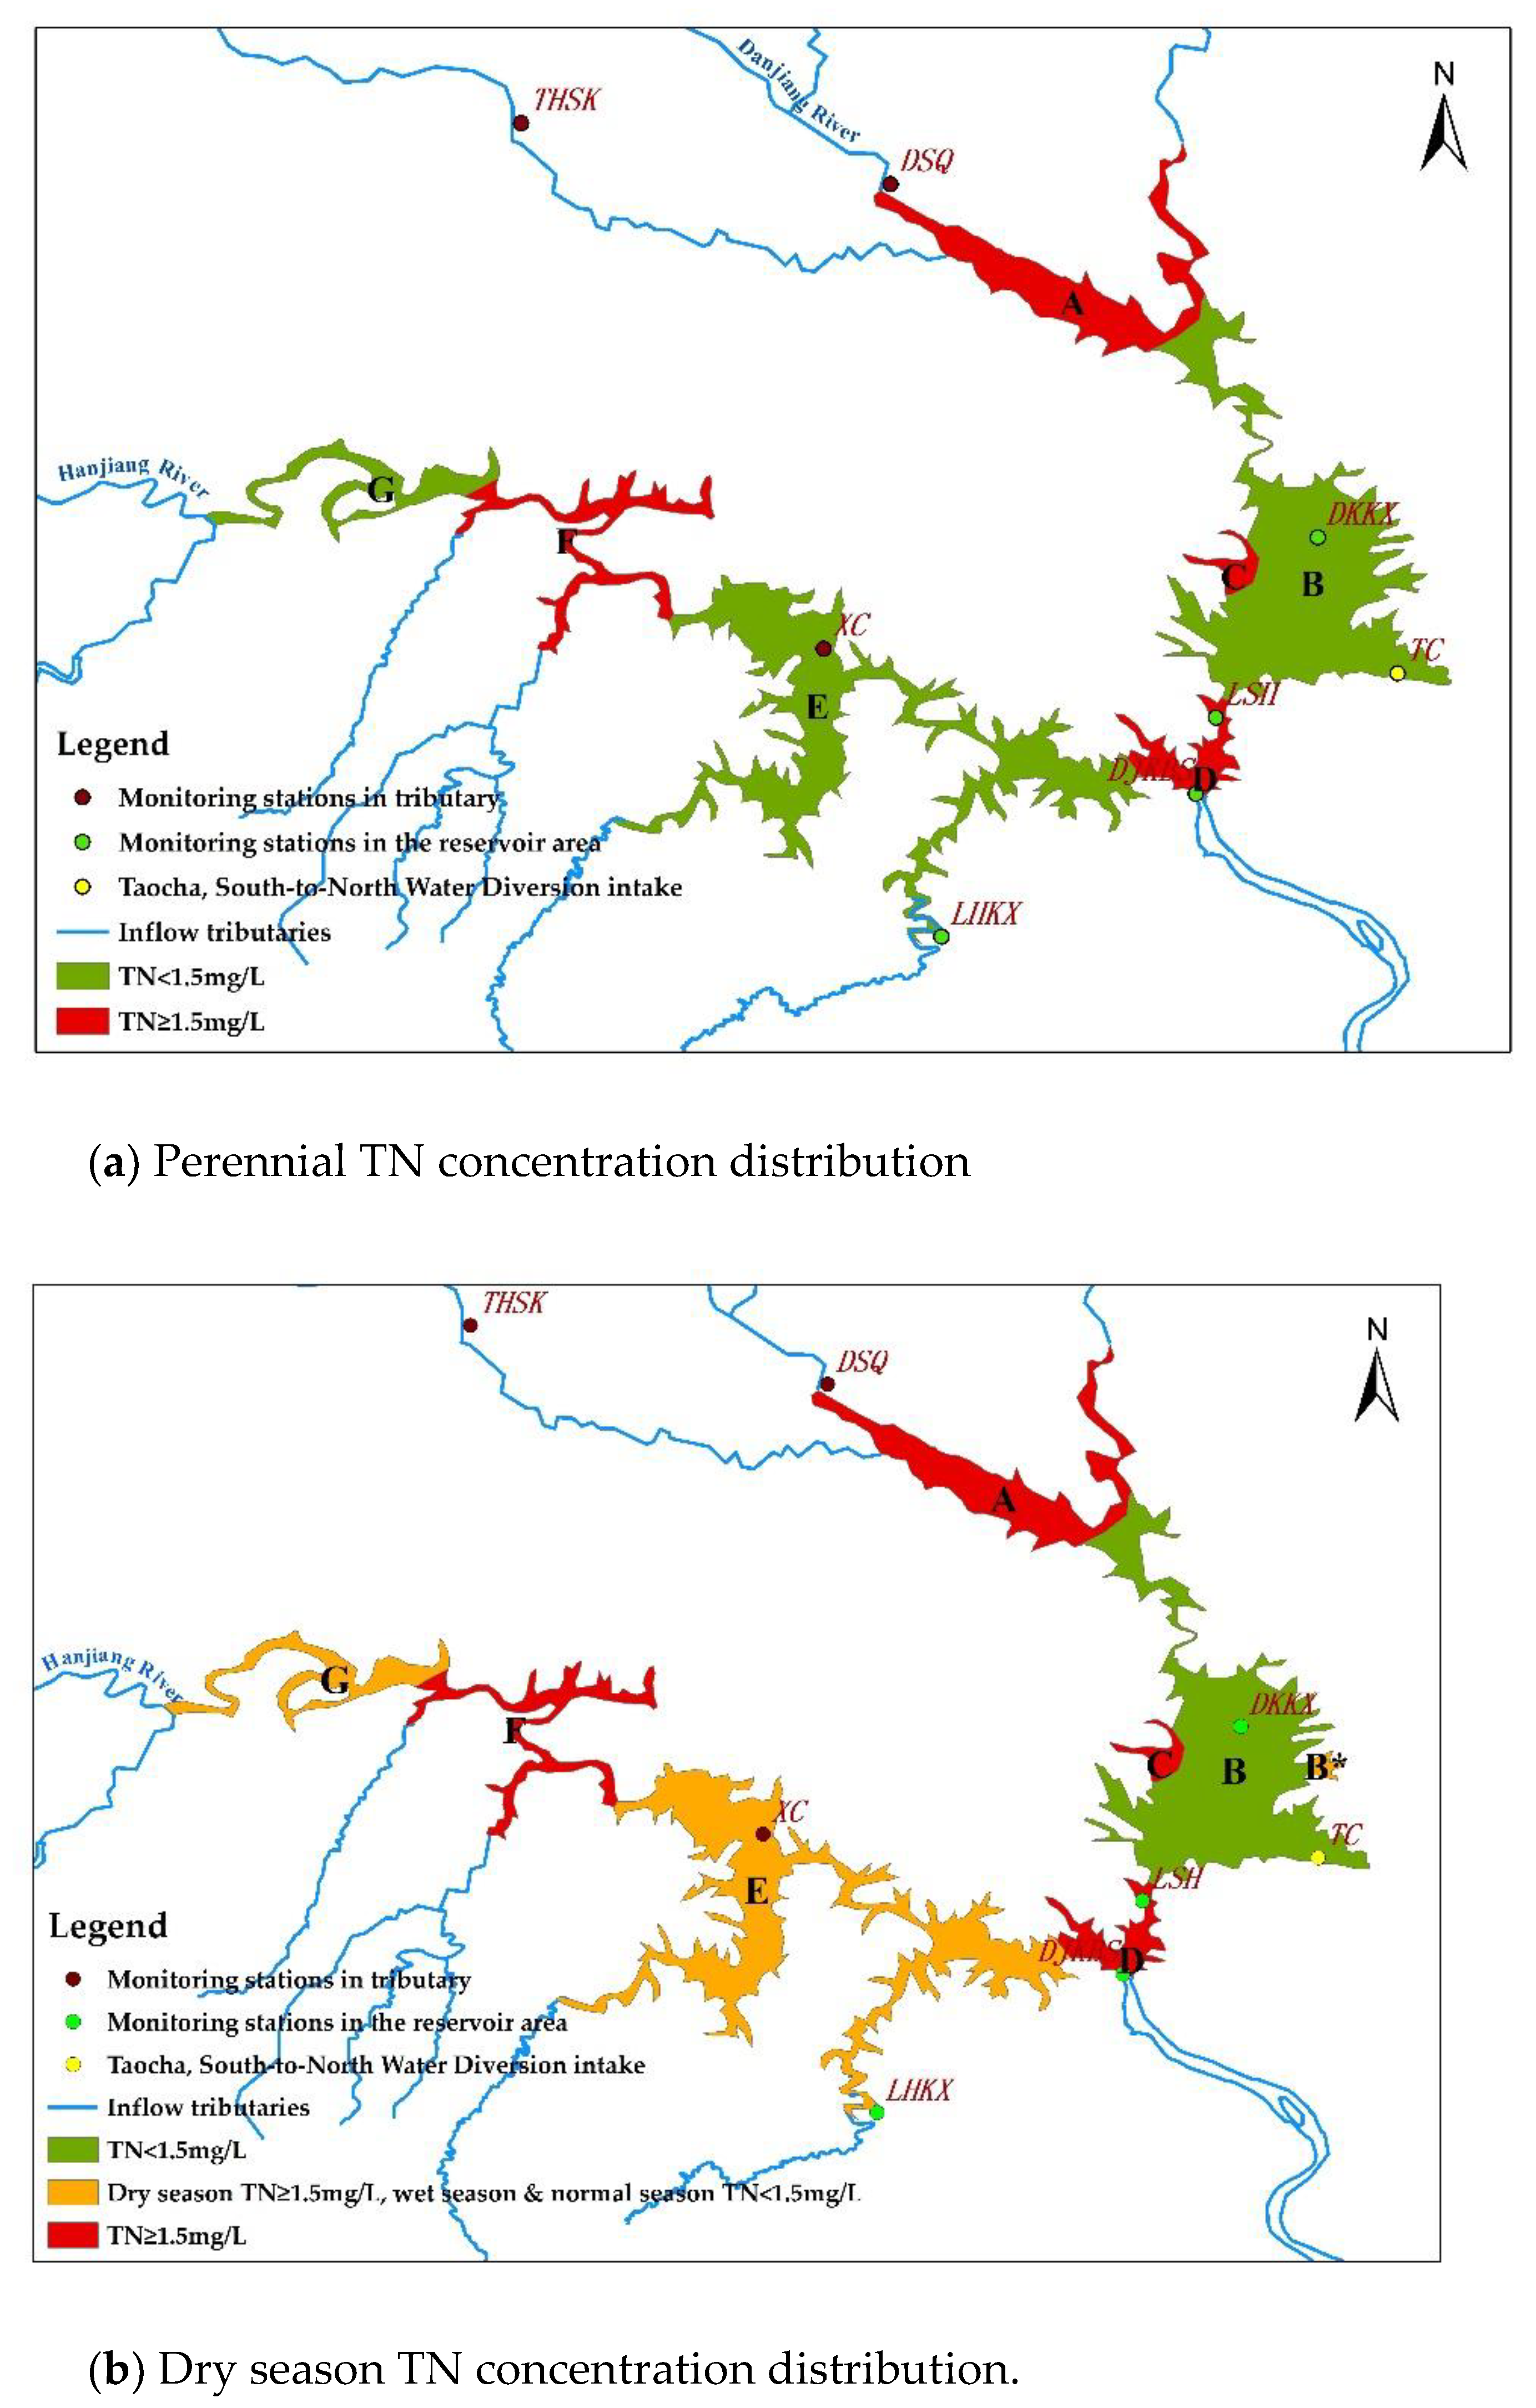
Figure 4.
Comparative analyses of TN concentrations in the Danjiangkou Reservoir from 2005–2018.
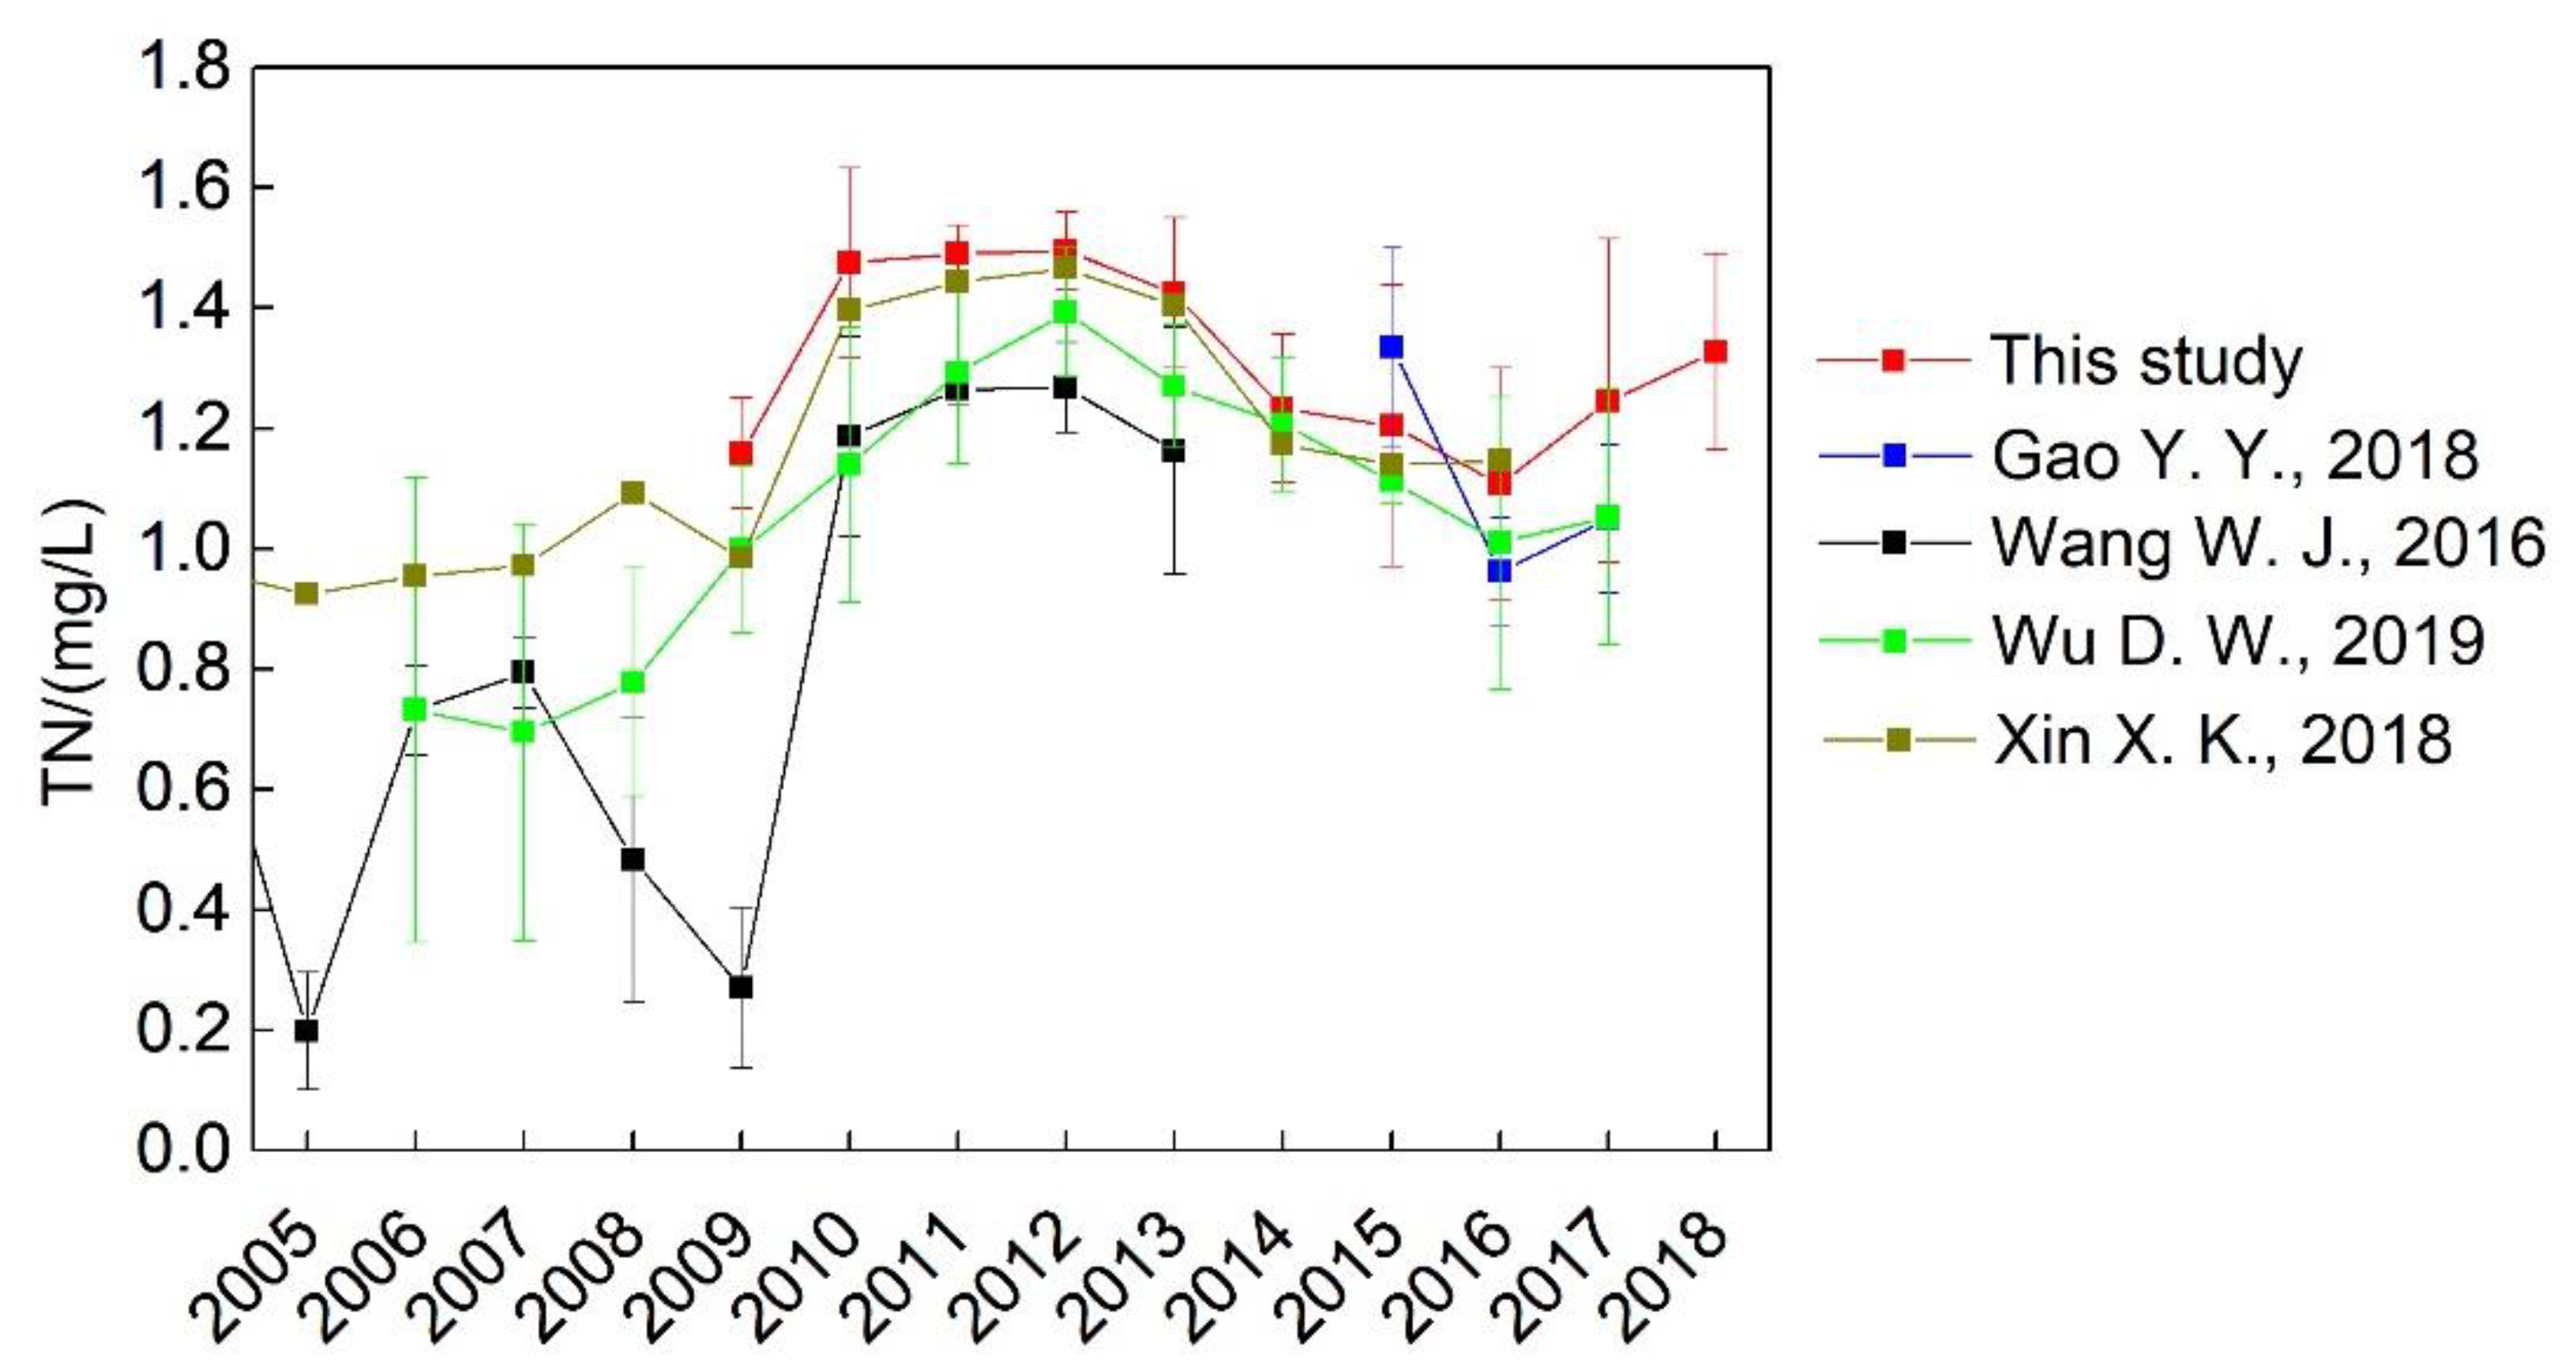
Figure 5.
The original series and the series corrected for seasonal factors.
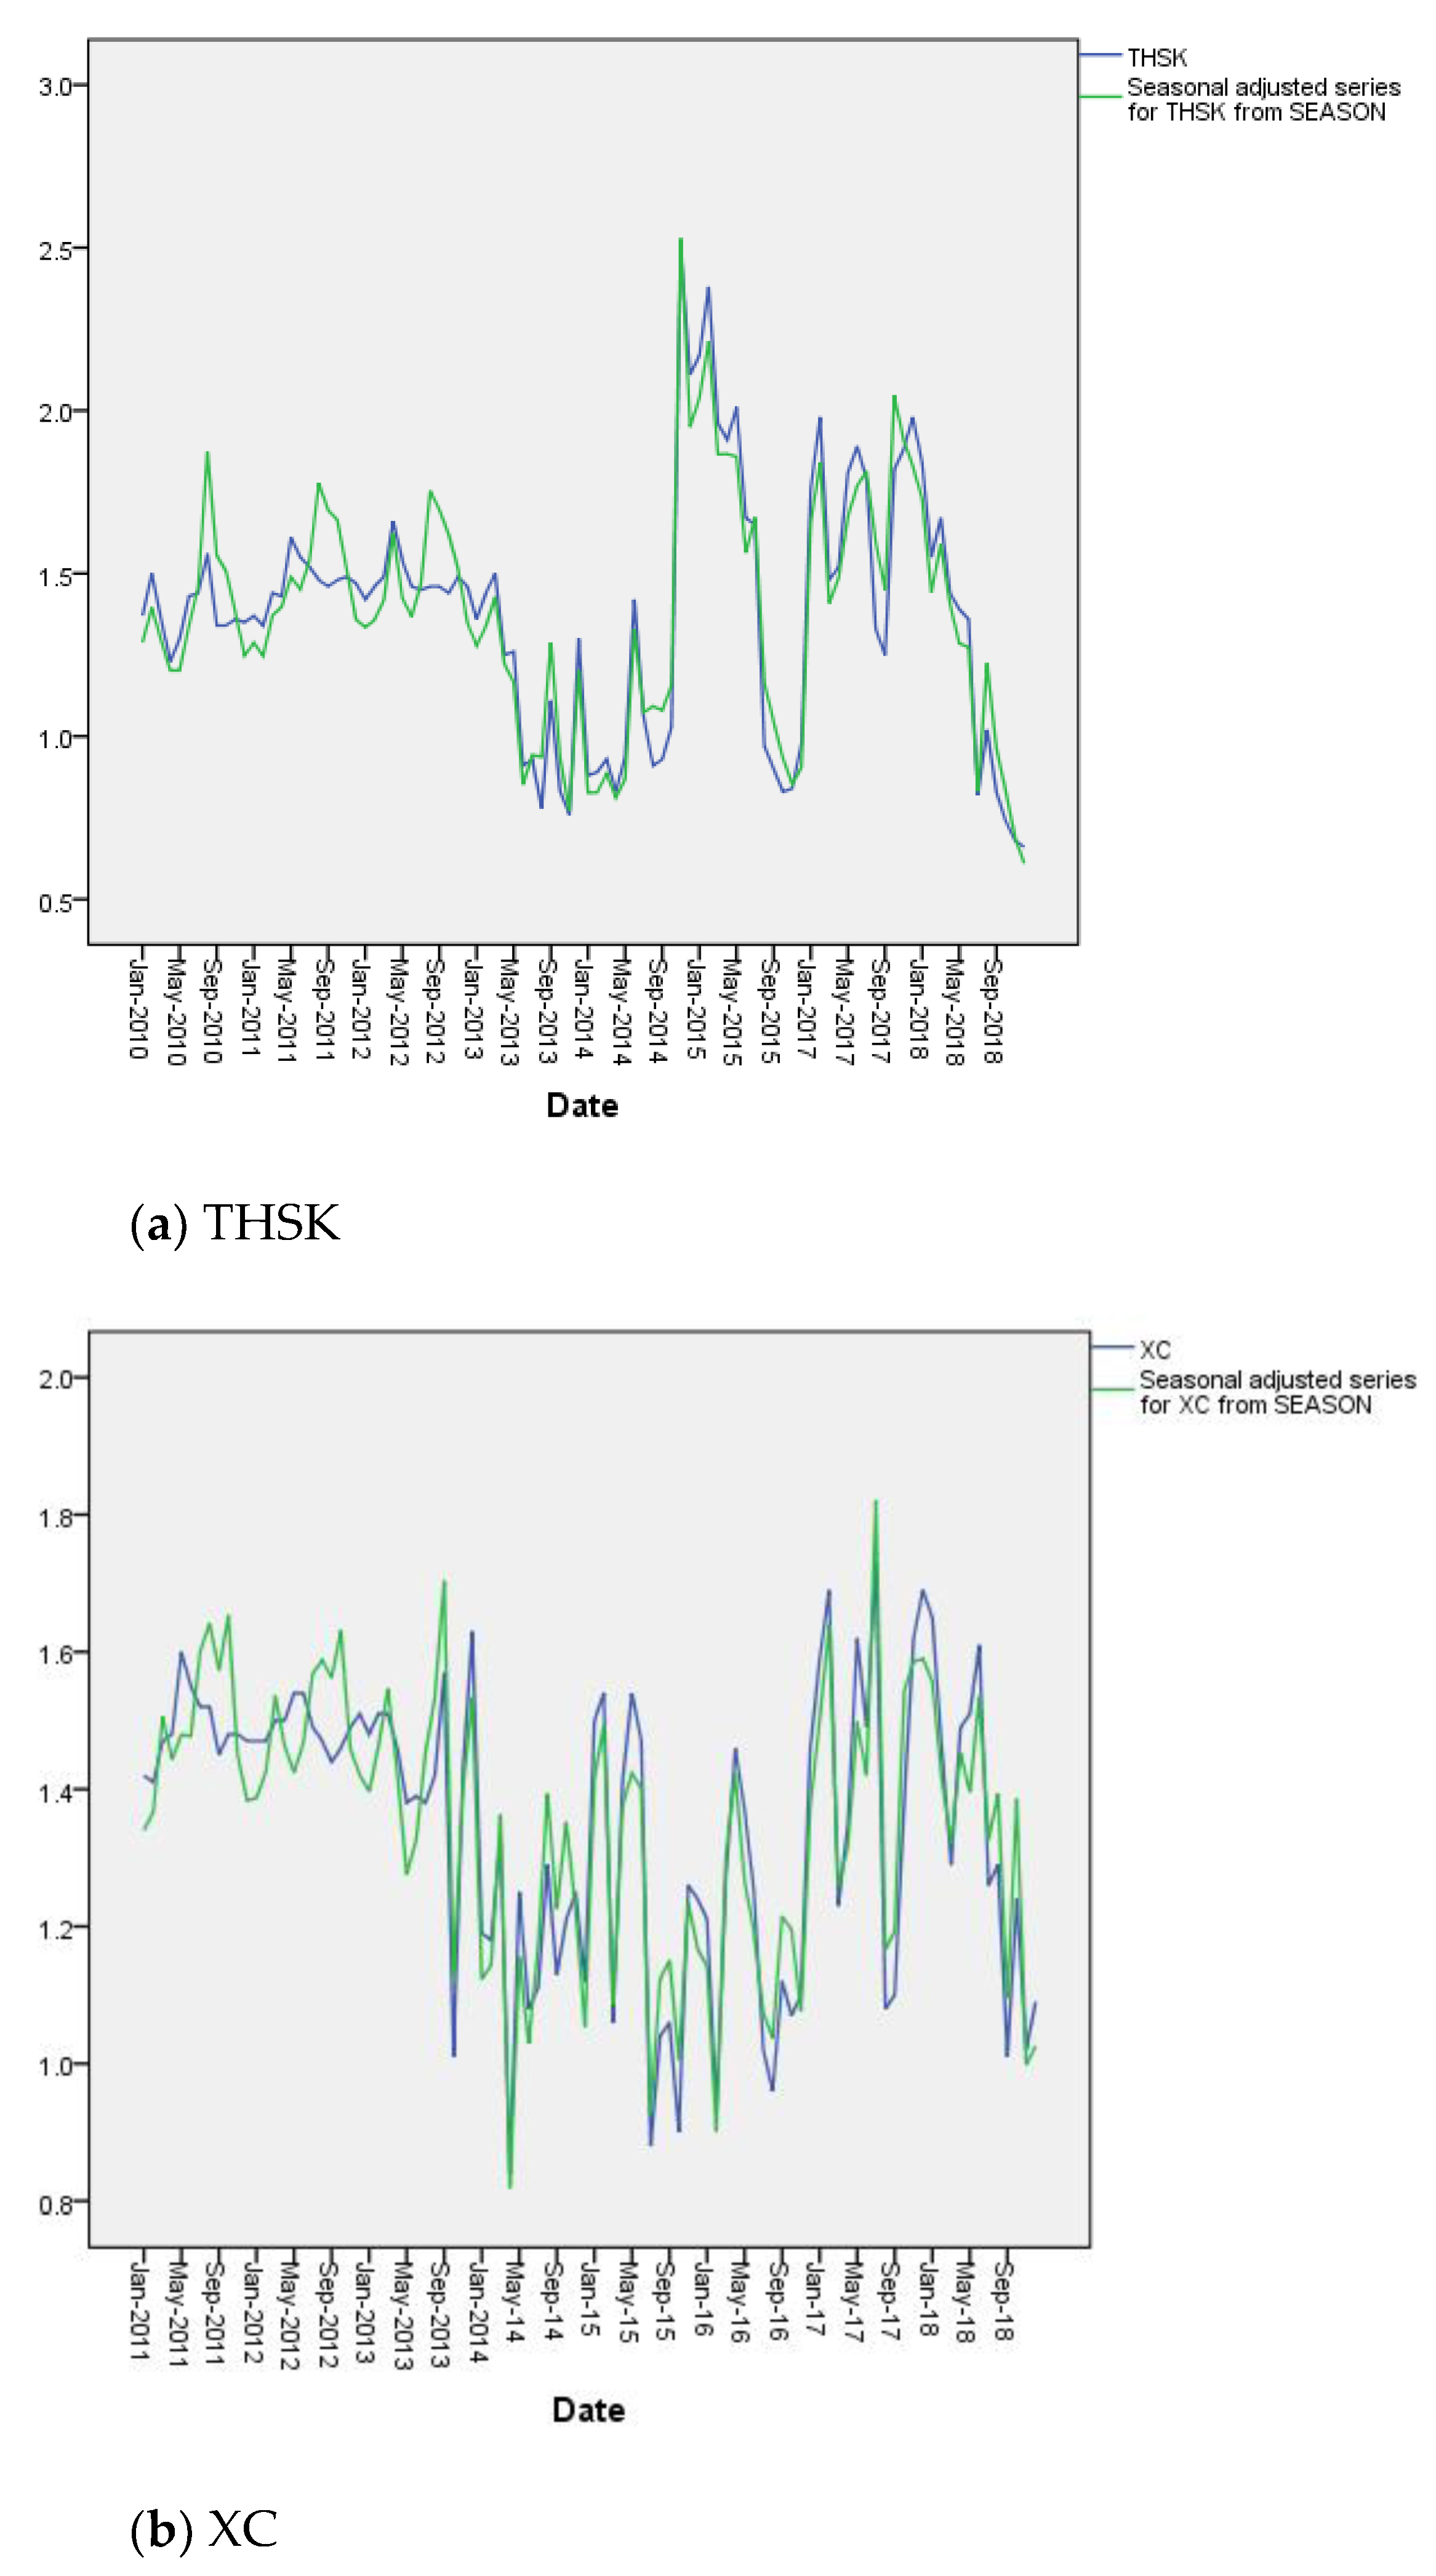
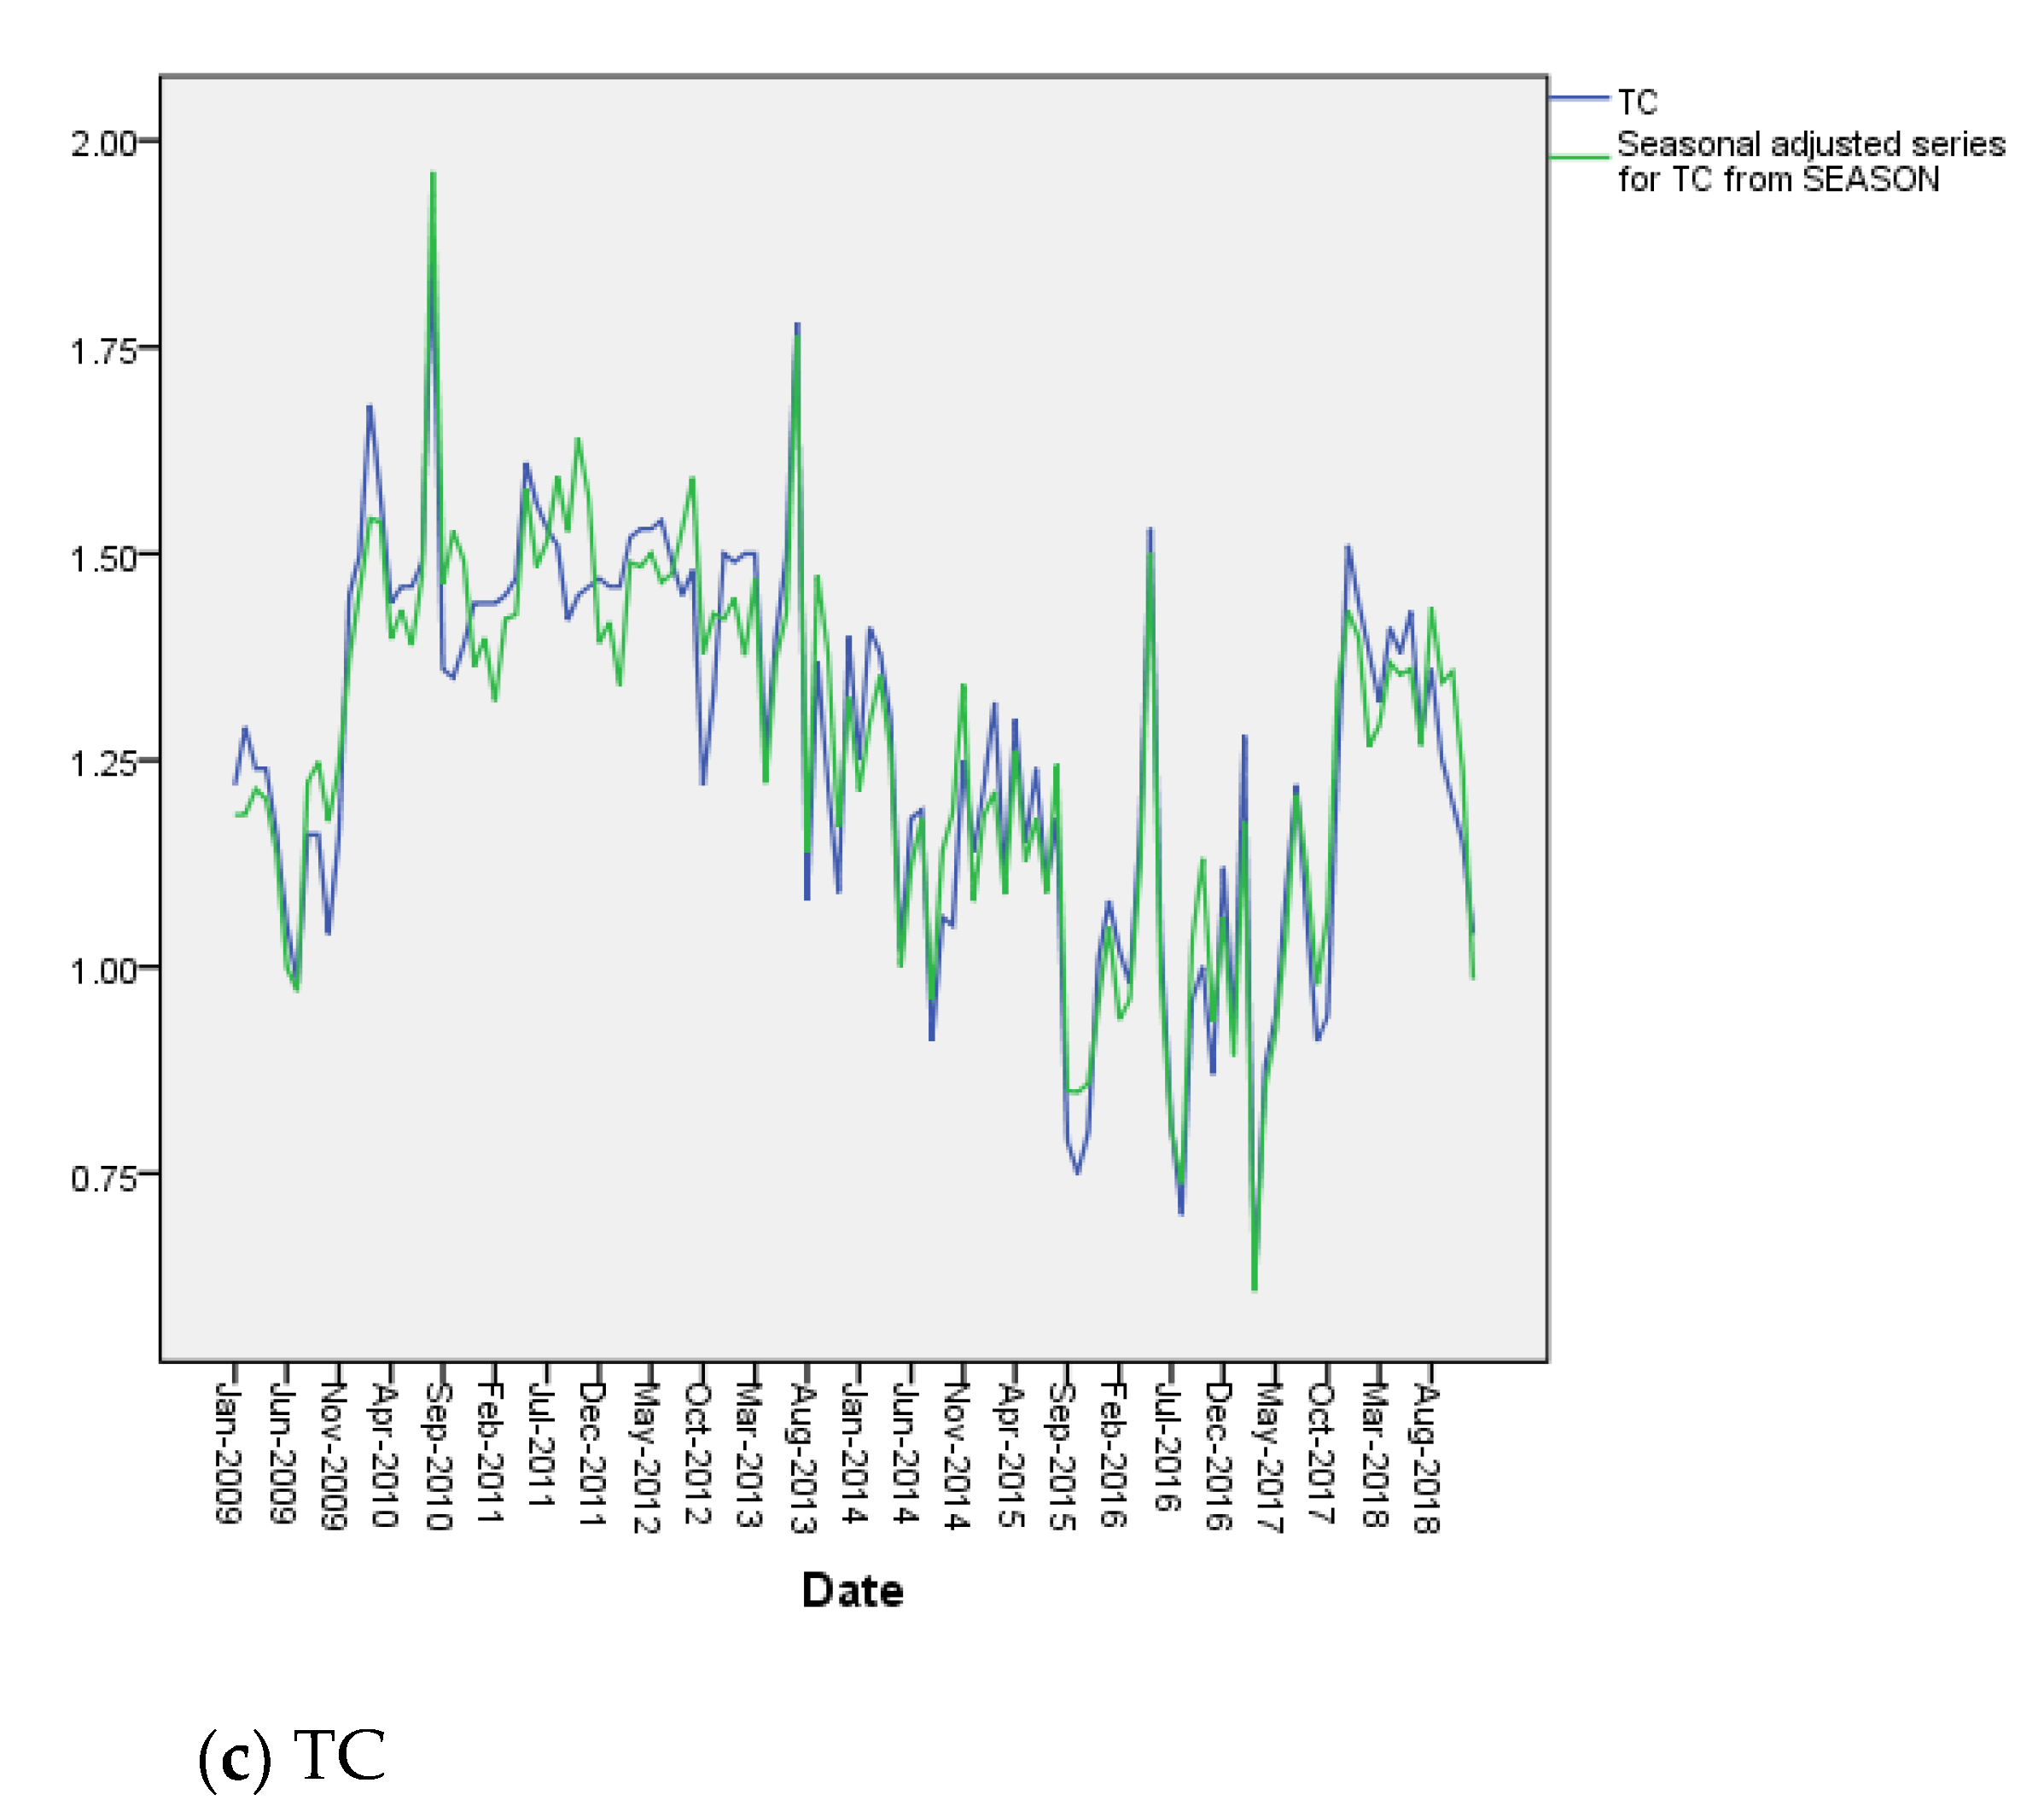
Figure 6.
Monthly variation trend of the TN Concentrations in two inflow tributaries (THSK, XC) and Taocha without seasonality (2009–2018).
Figure 6.
Monthly variation trend of the TN Concentrations in two inflow tributaries (THSK, XC) and Taocha without seasonality (2009–2018).

Figure 7.
The top six rivers in terms of TN load of the reservoir tributaries.
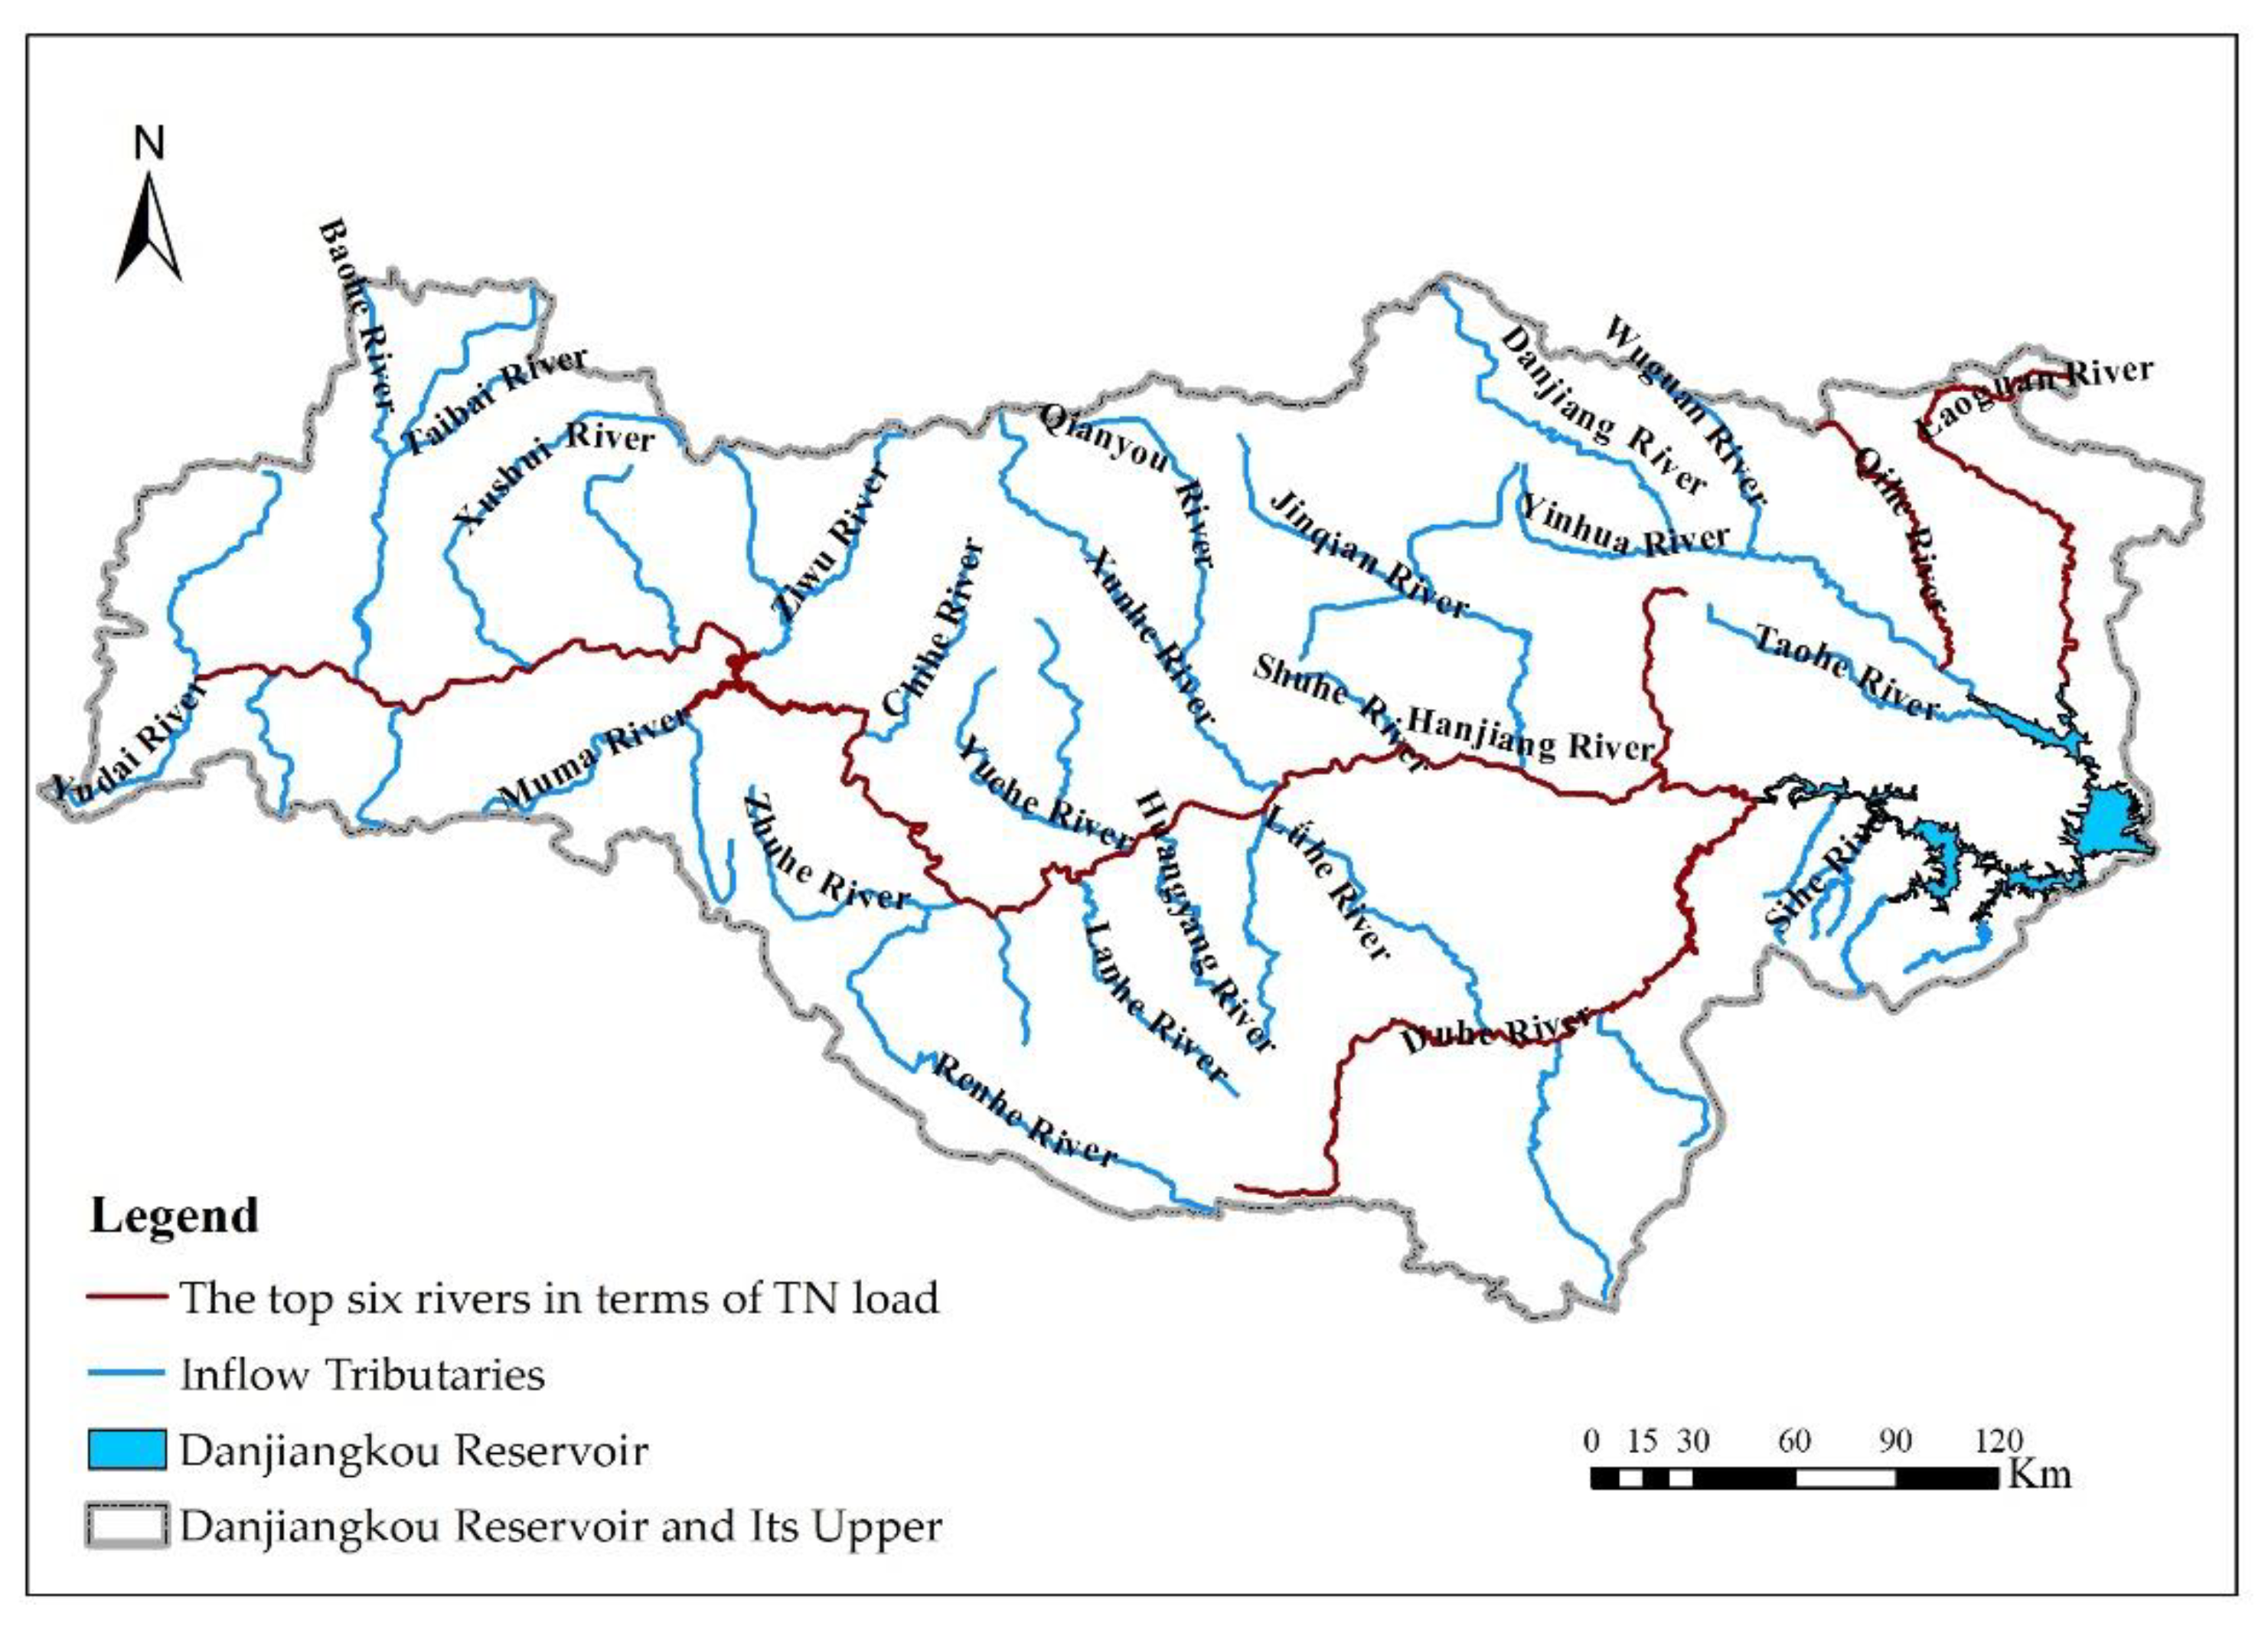
Figure 8.
Distribution of total nitrogen concentration in Danjiangkou Reservoir and upper stream.
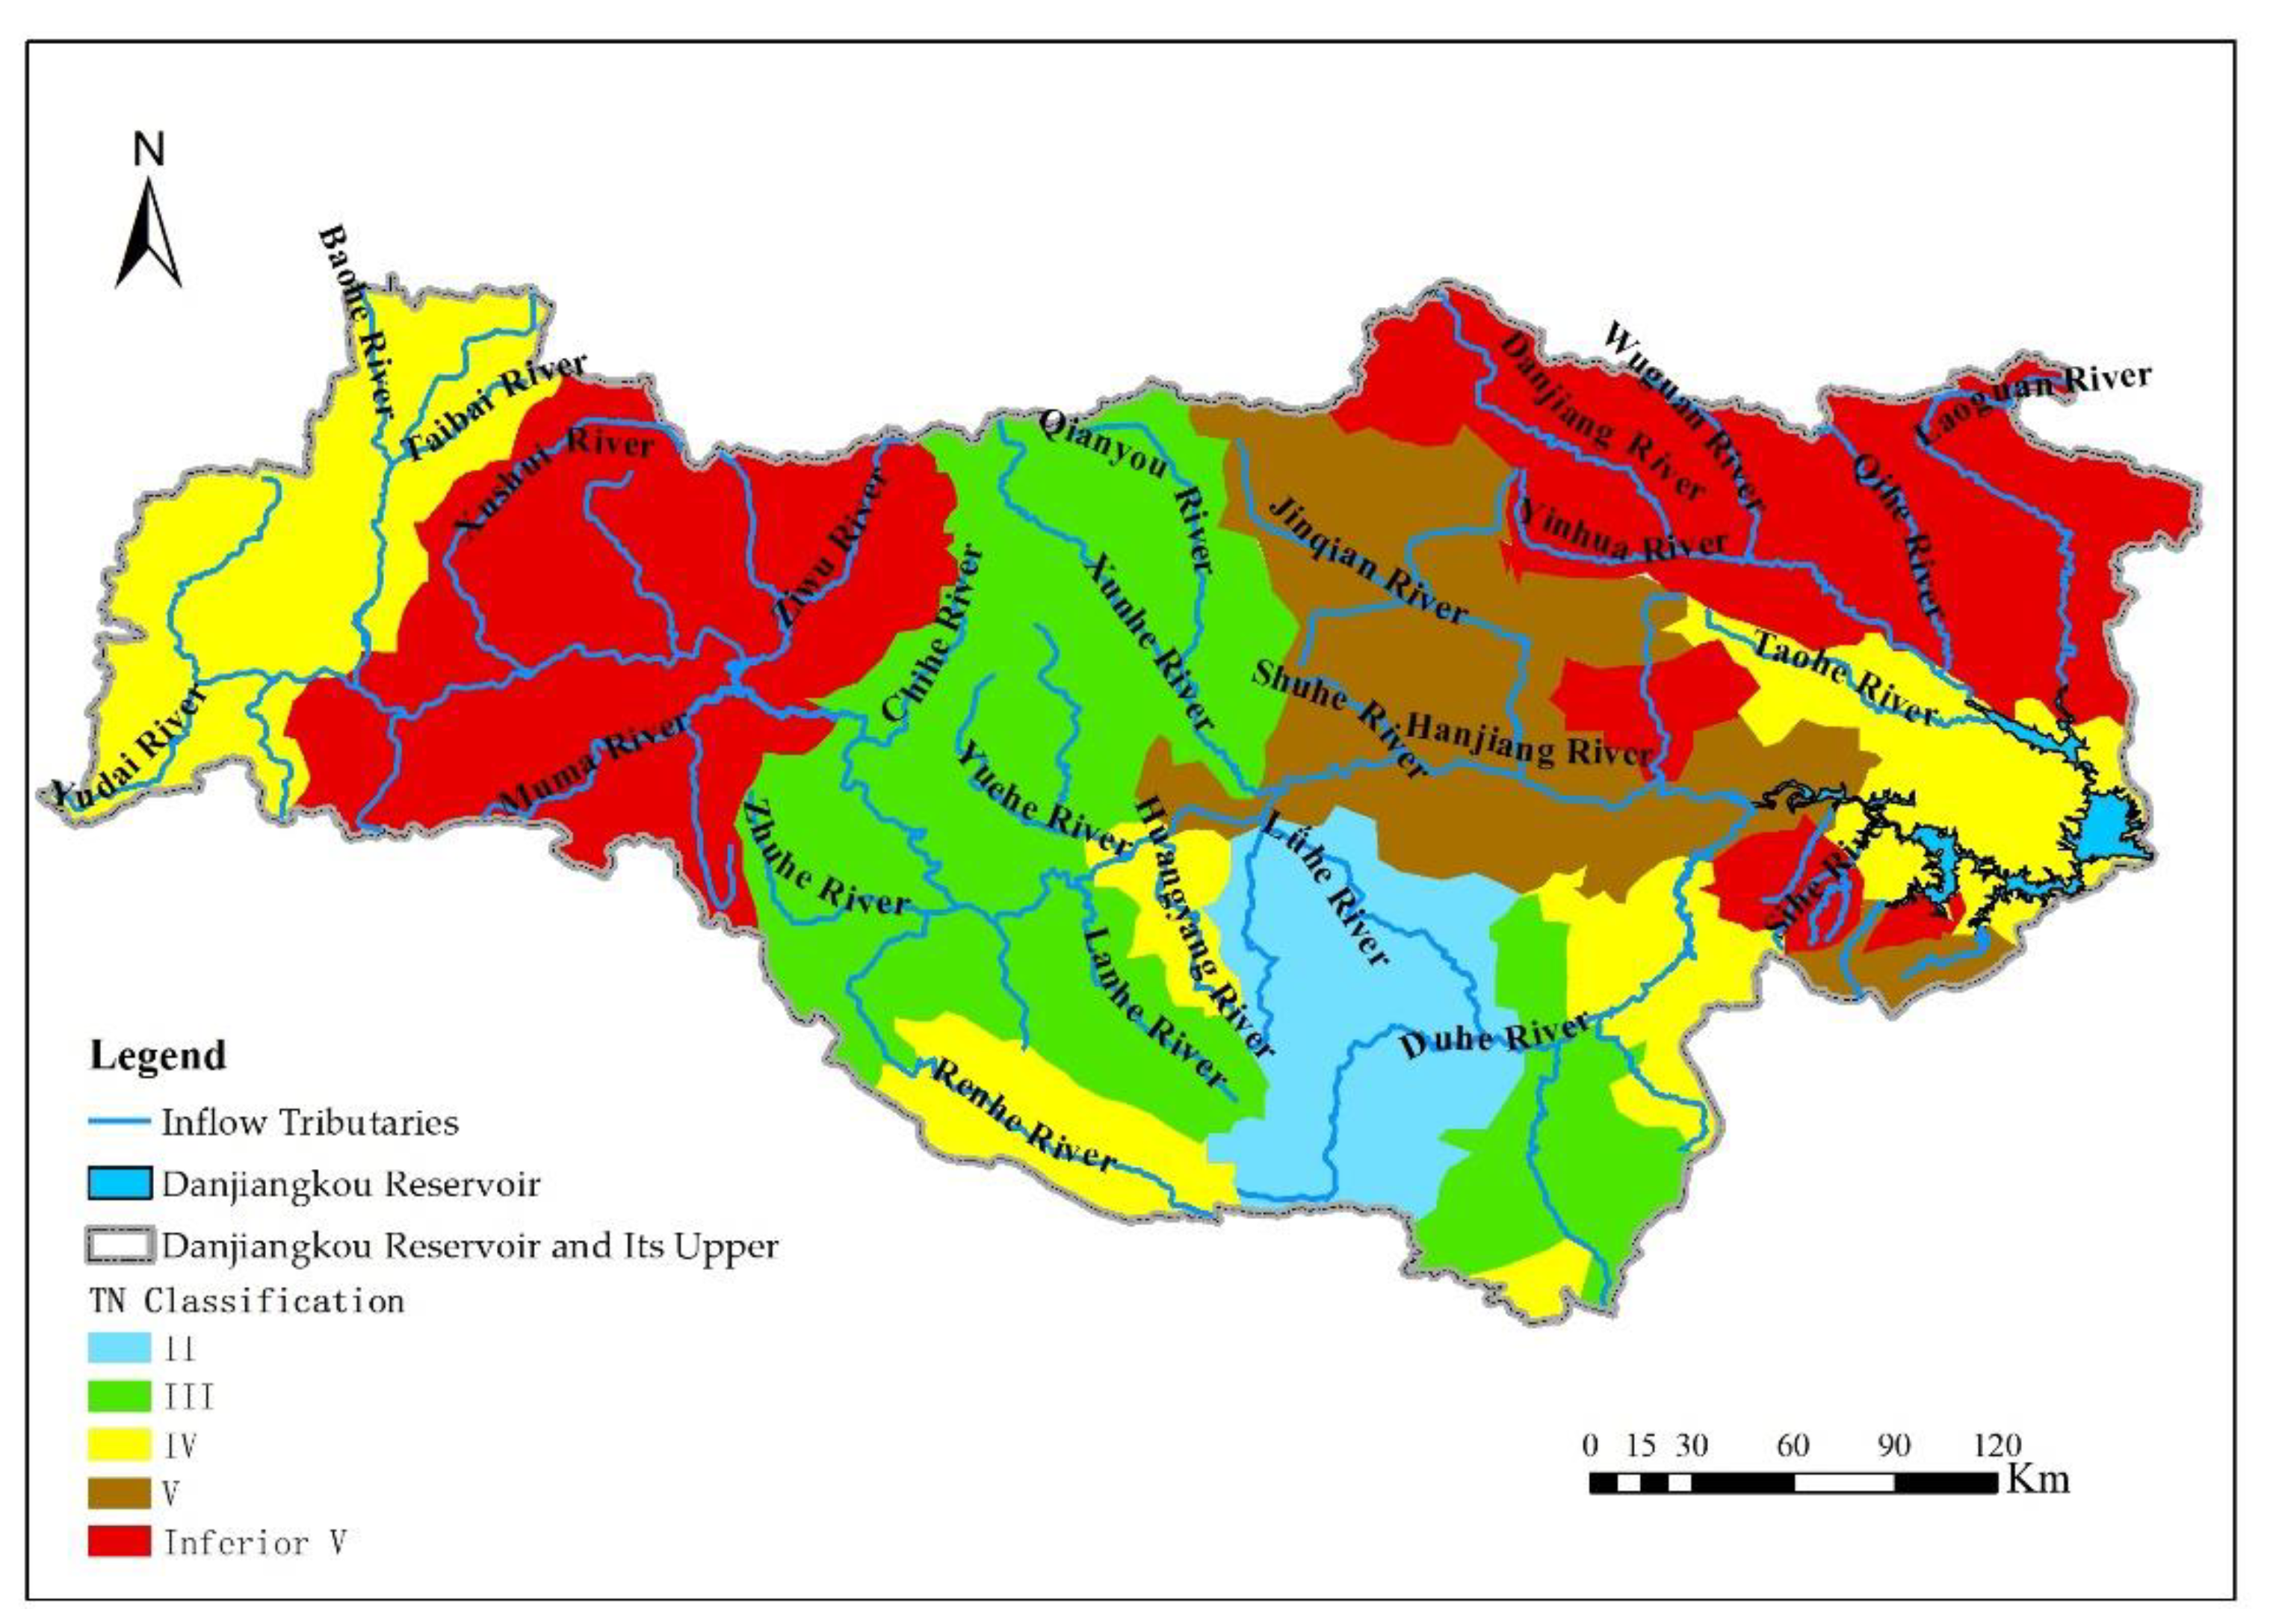
Table 1.
The nitrogen projects in the Chinese guidelines for the environmental quality standard for surface water (GB 3838-2002).
Table 1.
The nitrogen projects in the Chinese guidelines for the environmental quality standard for surface water (GB 3838-2002).
| Project | Class I | Class II | Class III | Class IV | Class V | |
|---|---|---|---|---|---|---|
| total nitrogen (TN) | <= | 0.2 | 0.5 | 1 | 1.5 | 2 |
| ammonia N (NH3-N) | <= | 0.15 | 0.5 | 1 | 1.5 | 2 |
| nitrate N (NO2-N & NO3-N) | <= | 10 (Standard limit of supplementary projects for surface sources of centralized drinking water) | ||||
Table 2.
Characteristics of the main inflow tributaries of the Danjiangkou Reservoir (2016).
| Inflow Tributaries | WATERSHED area/km2 | Mean Annual Discharge/100 million m3 | TN load/(t/a) | TN/(mg/L) | NH3-N/(mg/L) | NO3-N/(mg/L) | NO3-N Proportion/% | Presence or Absence of Main Inflow Tributaries | Pollution Degree |
|---|---|---|---|---|---|---|---|---|---|
| Hanjiang subreservoir | |||||||||
| Hanjiang River | 59,115 | 273.27 | 40,071.91 | 1.50 | 0.03 | 1.40 | 92.1 | Yes | - |
| Tianhe River | 1614 | 4.67 | 887.96 | 3.24 | 0.63 | 2.07 | 63.9 | Yes | - |
| Duhe River | 12,431 | 60.40 | 7237.52 | 0.96 | 0.05 | 0.85 | 88.3 | Yes | - |
| Shending River | 227 | 0.48 | 494.73 | 8.8 | 3.47 | 4.93 | 56 | - | Heavy |
| Jianghe River | 326 | 0.63 | 697.89 | 15.3 | 0.79 | 13.8 | 90.2 | - | Heavy |
| Sihe River | 469 | 1.14 | 1163.77 | 10.6 | 4.9 | 4.34 | 40.9 | - | Heavy |
| Guanshan River | 465 | 2.45 | 503.79 | 4.67 | 2.31 | 1.38 | 29.6 | - | - |
| Jianhe River | 47 | 0.10 | 41.51 | 3.78 | 0.38 | 2.84 | 75.1 | - | Heavy |
| Langhe River | 381 | 1.62 | 275.56 | 3.36 | 0.77 | 1.93 | 57.4 | - | - |
| Quyuan River | 312 | 0.55 | 80.57 | 2.2 | 0.54 | 1.3 | 59.1 | - | - |
| Jiangjun River | 62 | 0.14 | 21.39 | 2.18 | 0.04 | 1.94 | 89 | - | - |
| Taogou River | 45 | 0.11 | 13.78 | 0.81 | 0.03 | 0.73 | 90.2 | - | - |
| Danjiang Subreservoir | |||||||||
| Danjiang River | 7560 | 14.58 | 6175.46 | 6.13 | 0.04 | 4.83 | 78.8 | Yes | Heavy |
| Qihe River | 1598 | 3.82 | 661.73 | 6.09 | 0.06 | 4.42 | 72.6 | Yes | - |
| Taohe River | 1210 | 5.20 | 838.58 | 1.04 | 0.03 | 0.82 | 79.2 | - | - |
| Laoguan River | 4231 | 11.79 | 2180.01 | 9.76 | 6.32 | 1.46 | 15 | Yes | Heavy |
Publisher’s Note: MDPI stays neutral with regard to jurisdictional claims in published maps and institutional affiliations. |
© 2021 by the authors. Licensee MDPI, Basel, Switzerland. This article is an open access article distributed under the terms and conditions of the Creative Commons Attribution (CC BY) license (https://creativecommons.org/licenses/by/4.0/).
Share and Cite
MDPI and ACS Style
Li, J.-J.; Dong, F.; Huang, A.-P.; Lian, Q.-Y.; Peng, W.-Q. The Migration and Transformation of Nitrogen in the Danjiangkou Reservoir and Upper Stream: A Review. Water 2021, 13, 2749. https://doi.org/10.3390/w13192749
AMA Style
Li J-J, Dong F, Huang A-P, Lian Q-Y, Peng W-Q. The Migration and Transformation of Nitrogen in the Danjiangkou Reservoir and Upper Stream: A Review. Water. 2021; 13(19):2749. https://doi.org/10.3390/w13192749
Chicago/Turabian StyleLi, Jin-Jin, Fei Dong, Ai-Ping Huang, Qiu-Yue Lian, and Wen-Qi Peng. 2021. "The Migration and Transformation of Nitrogen in the Danjiangkou Reservoir and Upper Stream: A Review" Water 13, no. 19: 2749. https://doi.org/10.3390/w13192749
Note that from the first issue of 2016, this journal uses article numbers instead of page numbers. See further details here.