Article

Three-Dimensional Numerical Investigation on the Seepage Field and Stability of Soil Slope Subjected to Snowmelt Infiltration

1
School of Civil Engineering, Harbin Institute of Technology, Harbin 150090, China
2
State Key Laboratory of Frozen Soil Engineering, Northwest Institute of Eco-Environment and Resources, China Academy of Sciences, Lanzhou 730000, China
3
Chongqing Research Institute, Harbin Institute of Technology, Chongqing 401135, China
4
Railway Engineering Research Institute, China Academy of Railway Sciences, Beijing 100081, China
*
Author to whom correspondence should be addressed.
Water 2021, 13(19), 2729; https://doi.org/10.3390/w13192729
Submission received: 18 August 2021 / Revised: 24 September 2021 / Accepted: 27 September 2021 / Published: 2 October 2021

Abstract

:
Cutting slope failures occur frequently along the high-speed railways in Northeast China during the construction due to snowmelt infiltration. This study addresses this issue by applying a three-dimensional numerical model. The influence of the depth of accumulated snow (ds), daily temperature variation (ΔT), and freeze-thaw (F-T) cycles on the seepage field and stability of cutting slopes is discussed. The results demonstrate that water seepage due to snowmelt infiltration primarily extends through the ground surface by about 10 m. The deep-seated instability is likely to occur under a prolonged and highly accumulated infiltration, while shallow failure is associated with intense, short-duration snowmelt infiltration. The maximum degree of saturation (Sr) and pore-water pressure (PWP) values are observed at the slope toe. Increasing ds and ΔT increase the Sr and PWP due to snowmelt infiltration and thereby decreases cutting slope stability. Compared to the ds and ΔT, the F-T cycle is more likely to cause slope failure. In addition, the F-T cycle also induces the reduction of soil strength and the crack propagation. Overall, the conducted study provided useful help toward the process of safer design for cutting slope along the high-speed railway in seasonally cold regions.

1. Introduction

Snowmelt infiltration affects the moisture content of soils in seasonally cold regions, and extensive infiltration due to continuous snowmelt over long periods of thawing may trigger landslides [1,2,3,4,5,6,7,8] (Figure 1, from a study on a snowmelt estimation method for road management), which can result in significant loss of life and damage to public and private property. Therefore, the influence of snowmelt infiltration on the soil slope stability in seasonally cold regions cannot be ignored.
This issue is particularly significant for ensuring the safe operation and maintenance of the high-speed railways constructed in Northeast China, which is a typical seasonally cold region [9,10,11]. While some studies have reported on the occurrence of cutting slope failures due to snowmelt infiltration during the construction of high-speed railways [12], the majority of studies have been restricted to investigating the stability of soil slopes subjected to rainfall [13,14,15,16,17] and those within permafrost regions [7,18].
Moreover, the limited efforts focused on exploring the stability of soil slopes under the influence of snowmelt infiltration have relied typically on two-dimensional (2D) numerical analyses [3,5,7]. However, the slope stability in seasonally cold regions has been demonstrated to be affected by freeze-thaw (F-T) cycles as well [10]. For example, cracking is a common natural phenomenon observed within clayey soils in seasonally cold regions as a result of multiple F-T cycles and significantly influences the mechanical and hydraulic behaviors of these soils [17,19]. The effects of F-T cycles on crack propagation have been further demonstrated by computerized tomography (CT) images of clayey soil in a cutting slope along a high-speed railway, where multiple F-T cycles are observed to induce an increase in the concentration of micro-voids in the soil microstructure [20]. Nonetheless, few studies have investigated the effects of soil cracking on slope stability. Moreover, the effects of F-T cycles generate complicated slope problems that necessitate an analysis of three-dimensional (3D) geometric effects. Therefore, 3D numerical analysis of soil slope stability under the combined effects of snowmelt infiltration and F-T cycling has significant potential for directing efforts toward mitigating these effects in seasonally cold regions.
The present study addresses the above discussed issues by applying a 3D finite element (FE) model to investigate the cutting slope stability of a typical section along the Jilin–Tumen–Hunchun high-speed railway subjected to snowmelt infiltration. We first validate the numerical analysis methodology by comparing the pore-water pressure (PWP), the degree of saturation (Sr), the soil slope stability, and the slip surface predicted by the model with those obtained in [21]. Then, we investigate the influences of the depth of accumulated snow (ds), daily temperature variation (ΔT), and F-T cycling on the seepage field (i.e., PWP and Sr) and the stability of cutting slopes arising from snowmelt infiltration. Finally, some important insights for cutting slope along the high-speed railway subjected to snowmelt infiltration are presented in conclusion.

2. Numerical Analysis

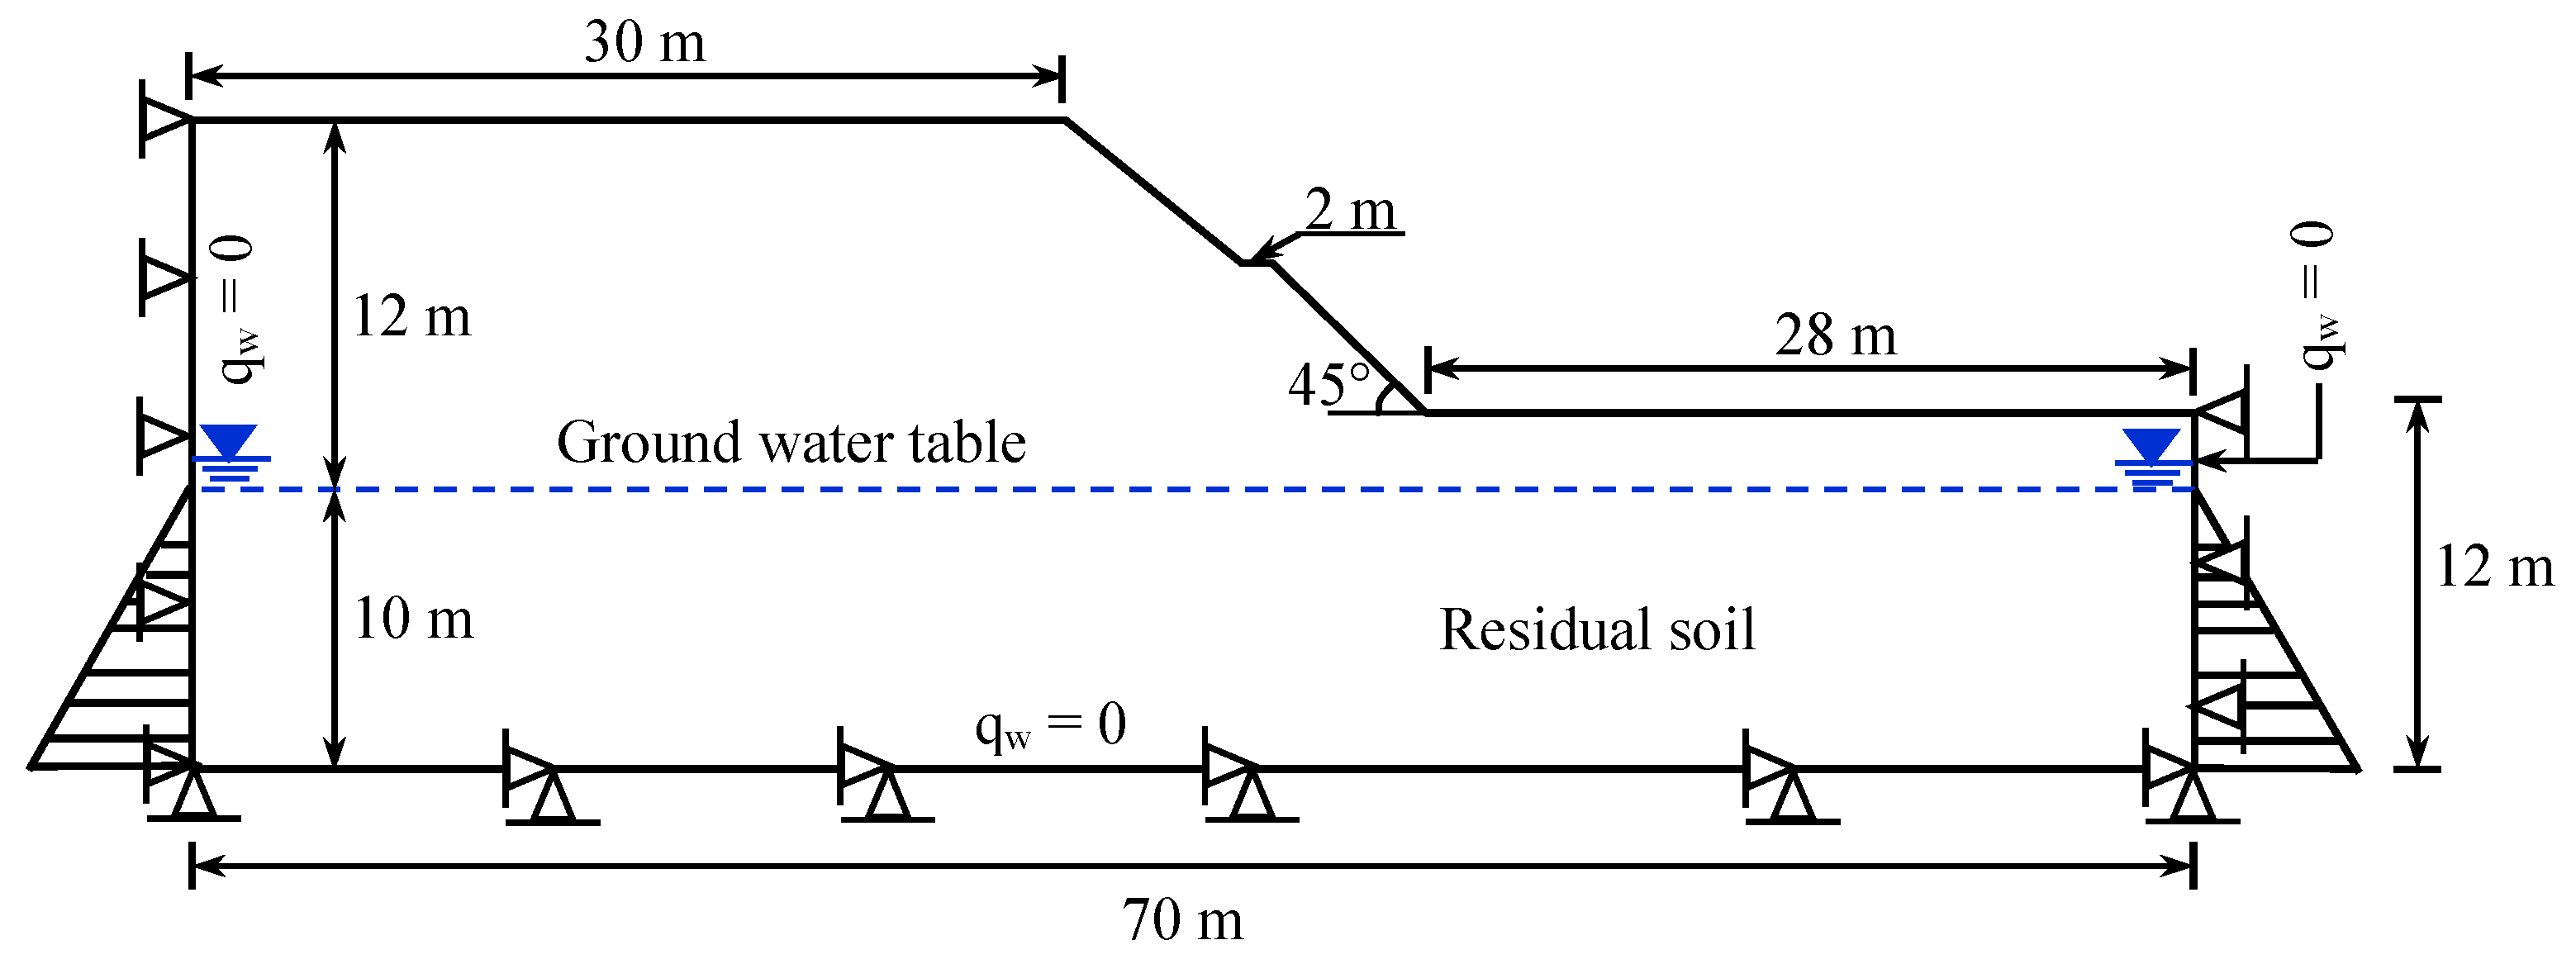
2.1. Three-Dimensional Numerical Modeling

The geometry of the cutting slope model and the FE mesh used are presented in Figure 2. The profile consists of two soil layers, including a silty clay layer and a sandstone layer, and a retaining structure composed of a sheet pile wall system with a pile length of 12 m. The initial ground-water table (GWT) is at depth ranging from about 24.8 m (10 m from the model bottom) to 22.8 m (12 m from the model bottom) within the slope profile, as illustrated in Figure 2a. A vertical view of the soil slope-sheet pile wall system and the detailed dimensions of the pile and sheet are presented in Figure 2b,c, respectively. A horizontal view of the model is presented in Figure 2d and the model width is 5 m in the y direction. The pile and sheet were both assumed to be linearly elastic for simplicity [22,23]. The 8-node brick elements were employed to simulate the sheet pile walls. In addition, 8-node brick, trilinear displacement, and trilinear pore pressure elements were used to model the soil domain [24,25].
The soil water characteristic curves (SWCCs) of the silty clay and sandstone are presented in Figure 3a, whereas the corresponding relative hydraulic conductivities, given as kw/ks, where kw and ks are the unsaturated and saturated coefficients of permeability, respectively, are presented in Figure 3b. The SWCCs of the soils were obtained using the Fredlund and Xing (1994) [26] equation with a correction factor C (ψ) = 1, as recommended by Leong and Rahardjo (1997a) [27]. The values of ks used for silty clay and sandstone were set to 1.73 × 10⁻⁶ and 10−4, respectively, and the ratios kw/ks were obtained using the indirect procedure presented by Leong and Rahardjo (1997b) [28]. The SWCC parameters (θs, a, m, and n) and the parameters (p) used for calculating kw/ks for silty clay and sandstone are listed in Table 1.
Frictional contact was considered for the interfaces between the sheet pile walls and the soil layers [23,29], and the friction coefficients μ were 0.3 and 0.52 for the interfaces involving the silty clay and sandstone layers, respectively. Besides, stiff contact was used in the normal direction for the pile elements and sheet elements, whereas the friction coefficient in the tangential direction was assumed to be 0.7 [23].
Based on the previous work of Qi and Vanapalli (2015) [30], both the PWP at the x = 0 m and x = 71.15 m faces are assumed to increase linearly with respect to increasing depth below the GWT. Water at the lateral boundaries (i.e., y = 0 and y = 5 m) as well as at the bottom boundary of the computational domain is assumed to have a zero flux. In addition, all nodes at the lateral boundaries (i.e., y = 0 and y = 5 m) are constrained by displacement degrees of freedom (DOF) in the y direction, and the horizontal displacement DOF is constrained at the x = 0 m and x = 71.15 m faces. The displacement DOF of nodes at the z = 0 m face are fully fixed in all directions [23,31,32].

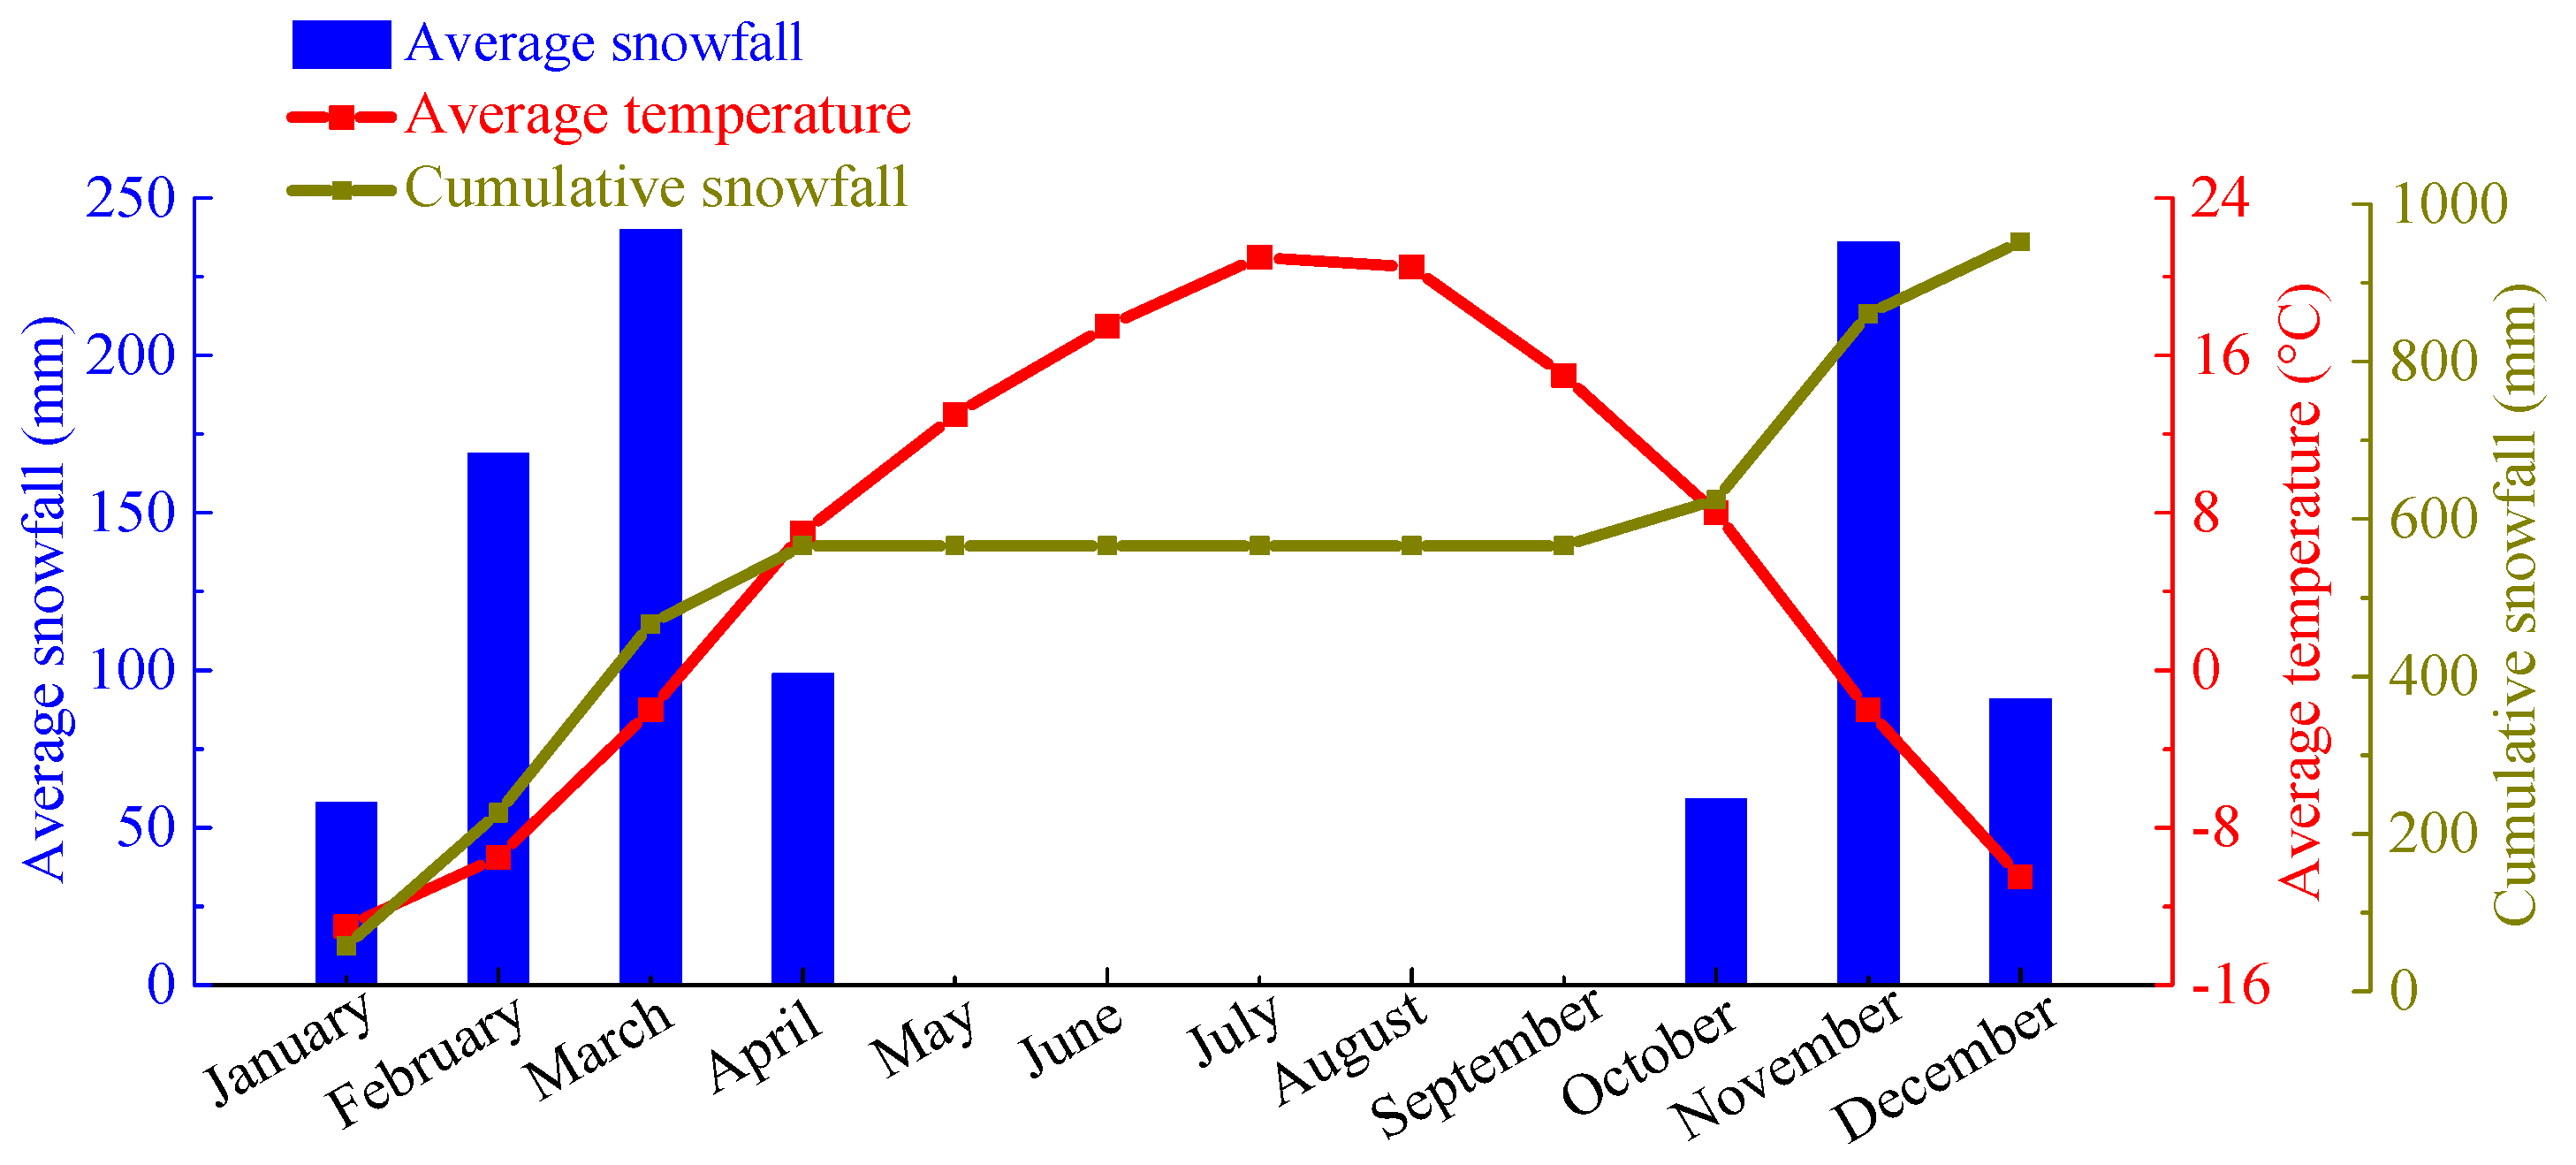
2.2. Snowmelt Infiltration

The climatic conditions used in the numerical model were based on meteorological monitoring data (i.e., monthly average snowfall and cumulative snowfall) obtained for Yanji, China, from 2010 to 2020, which are presented in Figure 4. We note that the accumulative snowfall depth ds are close to 1 m. We also note that ds can vary substantially. For example, the region of Yanji in Jilin Province experienced unusually high snowfall on 18 January 2016, and the maximum local snowfall was greater than 1 m.
The process of snowmelt infiltration is illustrated in Figure 5a [33]. This infiltration process is known to be affected by many factors, such as soil temperature, soil freezing depth, the water content of the soil before winter, and the depth of the snow cover [34]. Because of the complexity of the snowmelt infiltration, therefore, the present work uses the snow water equivalent (SWE) to simplify the analysis of the process [35,36]. Here, the SWE is the depth of water that would cover the ground if the snow cover was in a liquid state and is used for light-, normal-, and heavy-snow years. In this study, the SWE is equivalent to daily rainfall. In addition, the effect of potential root biomass or incorporated residue is not considered in this study.
According to the monthly average snowfall and cumulative snowfalls in Yanji, China, the standard simulations apply an SWE rainfall intensity (Ir) of 3 mm/h, which is equivalent to ds = 0.72 m, to the top surface of the model slope for a period of 48 h, as illustrated in Figure 5b. This represents the standard value of Ir used in all simulations unless otherwise specified. The SWE rainfall intensity on the slope surface is Ir·cosα, where α is the slope angle. Here, Ir is less than the permeability of the silty clay layer. Therefore, all snowmelt infiltrated into the soil, and no run-off occurred in the simulations employing standard conditions. Moreover, the seepage field and stability of the unsaturated soil slope were investigated from 0 h to 96 h.

2.3. FE Method with Shear Strength Reduction and Soil Model

The present work adopts the FE method with shear strength reduction technique because it has been demonstrated to be a reliable and robust approach for assessing the safety factors of slopes and locating the corresponding critical slip surfaces [37]. The Mohr–Coulomb model was employed to simulate the soil behaviors. Here, the shear strength (τ) of an unsaturated soil is expressed based on the Bishop effective stress principle outlined by Vanapalli et al. [38] as follows:
τ = c + [ ( σ n u a ) + χ ( u a u w ) ] tan φ
where c′ is the effective cohesion, σ n is the net total stress, ua is the pore-air pressure, uw is the pore-water pressure, φ′ is the effective angle of internal friction, and χ is a function of Sr, which varies between 0 (completely dry condition) and 1 (fully saturated condition). Here, χ can be expressed in terms of the volumetric water content of the soil (θw) as
χ = θ w   θ r θ s   θ r
where θs is the saturated volumetric water content, and θr is the residual volumetric water content. The calculated shear strengths of the silty clay and sandstone layers used in the numerical analyses are displayed in Table 1.

3. Validation of the Numerical Analysis Methodology

The hydraulic and mechanical boundary conditions of the soil slope prevailing at the Pohang site used in the work of Oh and Lu [21] are presented in Figure 6. In addition, the values used for the geotechnical and hydromechanical properties of the Pohang soil are listed in Table 2.
The PWP and Sr results obtained by the proposed numerical methodology for the Pohang site are presented Figure 7a,b, respectively. In addition, the potential slide surface of the soil slope obtained by the proposed methodology is compared with that obtained by Oh and Lu (2015) [21] in Figure 7c. Here, the three typical points denoted in Figure 7 as a, b, and c, respectively, represent the upper, middle, and lower regions along the failure surface.
The values of PWP, Sr, the factor of safety (FOS), and the slip surface in Oh and Lu [21] have been validated by filed evidences. Therefore, these results can be used to validate the correctness of numerical analysis methodology. We note that the PWP values obtained by the proposed methodology on 1 April 2011 are −85 kPa at point a, −55 kPa at point b, and −35 kPa at point c. We further note that the values of Sr obtained at point c are always greater and approach a saturated state earlier than those observed at points a and b. The numerically determined values of Sr on 1 April 2011 are 89%, 92.5%, and 95% at points a, b, and c, respectively. In comparison, the PWP values reported by Oh and Lu [21] were −80 kPa at point a, −60 kPa at point b, and −40 kPa at point c, whereas the Sr values were 91.5%, 92.5%, and 94% at points a, b, and c, respectively. Accordingly, we can conclude that the results obtained by the proposed numerical methodology for the PWP and Sr are in good agreement with the results presented in [21]. We further note from Figure 7c that the shape and position of the failure surface obtained by the proposed methodology compare satisfactorily with the results presented in [21]. Moreover, the factor of safety (FOS) of the soil slope at the Pohang site was calculated in [21] to be 2.8. Meanwhile, the FOS value predicted by the proposed methodology was 2.78, which again demonstrates that the results obtained by the proposed numerical methodology are in good agreement with the results presented in [21].
Therefore, this numerical analysis methodology can be used to investigate the seepage field and stability of soil slope subjected to snowmelt infiltration.

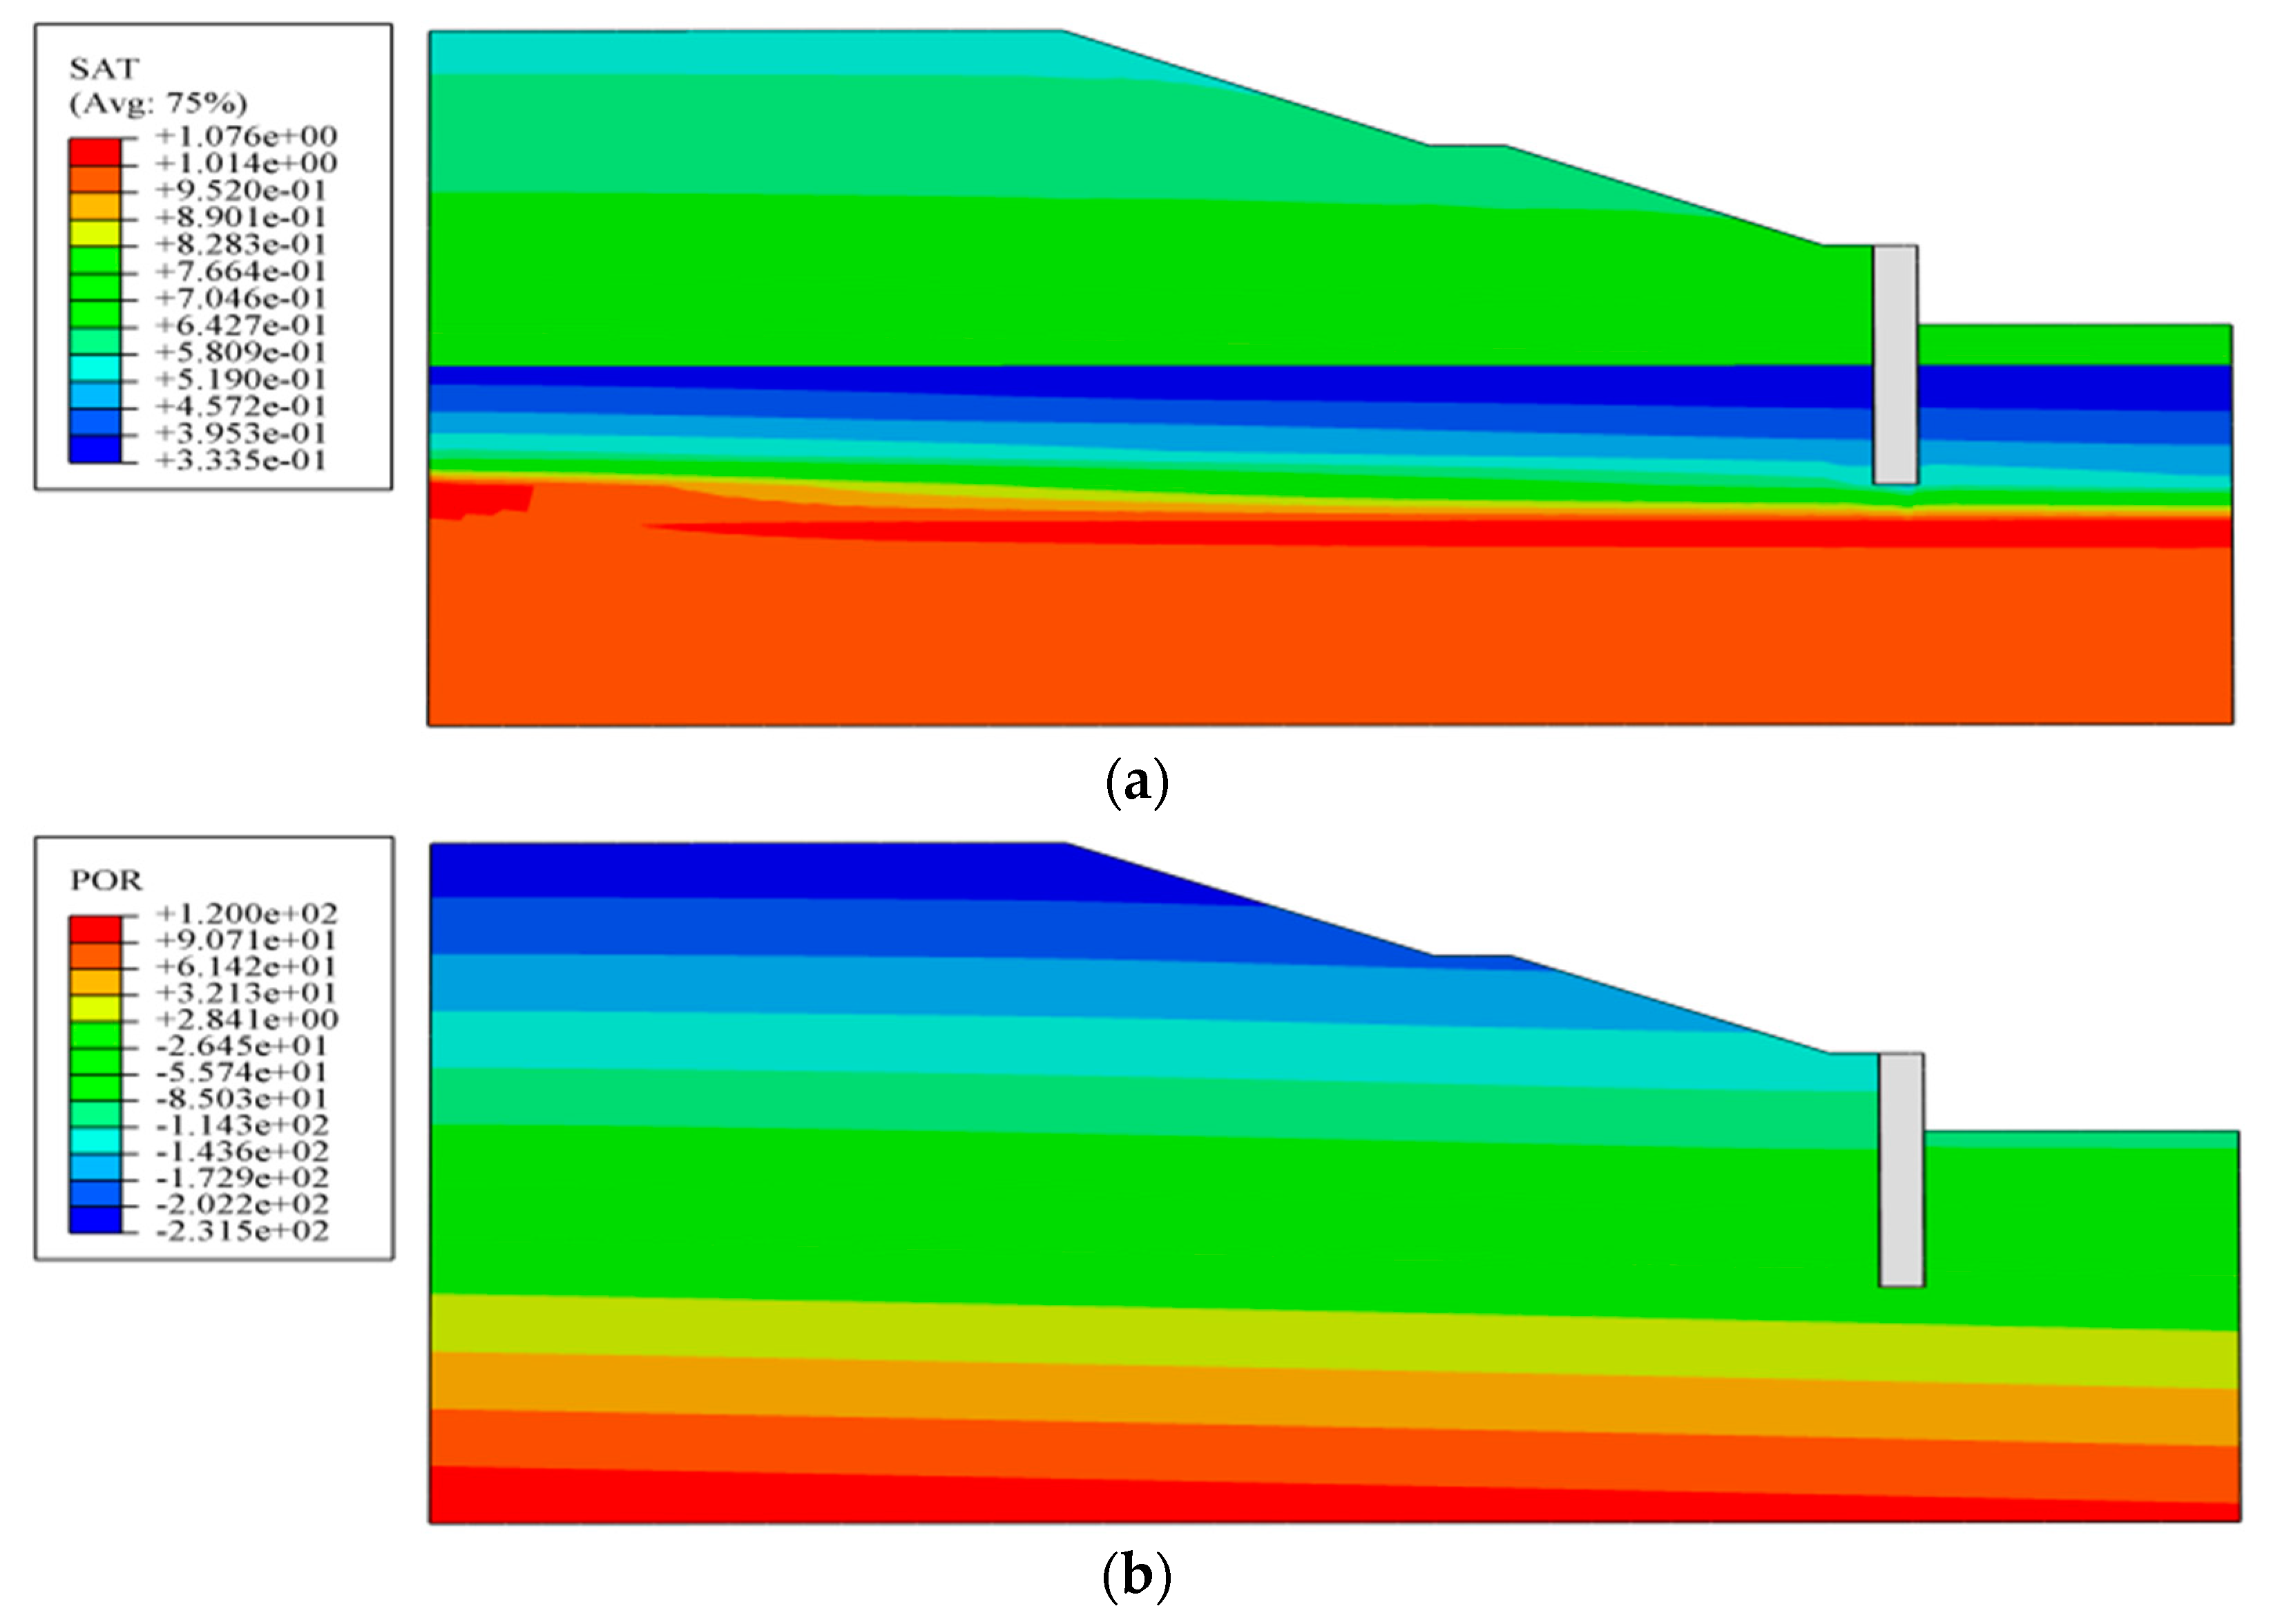
4. Snowmelt Infiltration Analysis

Before proceeding with an analysis of snowmelt infiltration, we must first evaluate the slope model in an initial state without snowmelt infiltration. The Sr values and the PWP contours in the initial state are presented in Figure 8. Differences in the hydraulic properties of the silty clay and sandstone layers (i.e., the SWCCs and ks values) result in significant changes in Sr at the interface between the two layers. Here, the value of Sr at the upper surface layer is about 55%, and it increases along the slope surface (Figure 8a). The PWP displays a linear relation with the depth (Figure 8b). The FOS obtained for the cutting slope by the FE method with shear strength reduction technique was 2.81.
The Sr values and PWP contours obtained for the cutting slope under snowmelt infiltration (Ir = 3 mm/h) are presented in Figure 9 and Figure 10, respectively. The results in Figure 9a indicate that the value of Sr at the upper surface layer is greater than 70% when snowmelt infiltration is terminated at time t = 48 h. As shown in Figure 9b, snowmelt infiltrates into the soil slope at t = 72 h, and the pressure head of the slope decreases, resulting in a decrease in Sr. Furthermore, Figure 9c indicates that the continuous infiltration of snowmelt at t = 96 h results in further decrease in Sr and PWP at the top and surface of the slope, and the seepage field gradually approaches the field observed in the initial state.
The above results indicate that due to the PWP diffusion process, the deep-seated landslide is likely to occur under a prolonged and highly accumulated infiltration, while the shallow slope failure is associated with intense, short-duration snowmelt infiltration.
In addition, the two locations denoted as L1 and L2 shown in Figure 11 were selected to illustrate the variations in the Sr and PWP in the inner region of the slope and the slope surface, respectively. Variations in Sr and PWP along the two lines under snowmelt infiltration are discussed in detail in later sections along with the computed FOS values.

5. Parametric Studies

5.1. Effect of Accumulated Snow Depth on Soil Slope Stability

The effect of ds on the seepage field and slope stability was investigated by applying ds values of 0.48 m, 0.72 m, 0.96 m, and 1.2 m to the numerical model. Here, the snowfall accumulated above the slope during the winter season will begin melting once the air temperature is greater 0 °C, and the snowmelt will infiltrate into the soil or runoff above the slope.
The obtained values of Sr and PWP at lines L1 and L2 (t = 48 h) are plotted in Figure 12 with respect to ds. Obviously, the shapes of the Sr and the PWP profiles along line L1 are quite different from those obtained in the initial state without snowmelt infiltration. As shown in Figure 12a,b, the Sr and the PWP profiles under snowmelt infiltration are all curved, and the curvatures of these profiles increase with increasing ds. The Sr and PWP values at the top also increase with increasing ds.
We also note that the values of Sr and PWP initially decreased along the line L1 and then increased with further along the L1. The results in Figure 12c,d indicate that Sr and PWP increase along the slope surface, and their maximum values are observed at the slope toe. This may be a reasonable explanation as to why snowmelt-induced soil slope failures usually initiate from the slope toe. Compared with the values of Sr observed at the top and slope toe to that in the initial state, the corresponding values of Sr obtained at ds = 1.2 m increase by about 24.3% and 17.4%, respectively. We note from Figure 12c,d that the Sr and PWP values observed at a horizontal distance of approximately 15.6 m from the slope crest are located within a “stable region” and that the Sr and PWP almost remain the same (about 3.2 m in x direction) for the initial state. However, no such “stable region” is observed with increasing ds.
The FOS values obtained for the cutting slope are plotted in Figure 13 with respect to ds. Here, the FOS of the cutting slope decreases significantly with increasing ds, which indicates that the soil slope stability is negatively affected by increasing snowmelt infiltration. In addition, the FOS obtained at the moment at which snowmelt infiltration is terminated (t = 48 h) is significantly less than that obtained at t = 96 h because the seepage field gradually tends toward its initial state with increasing time.

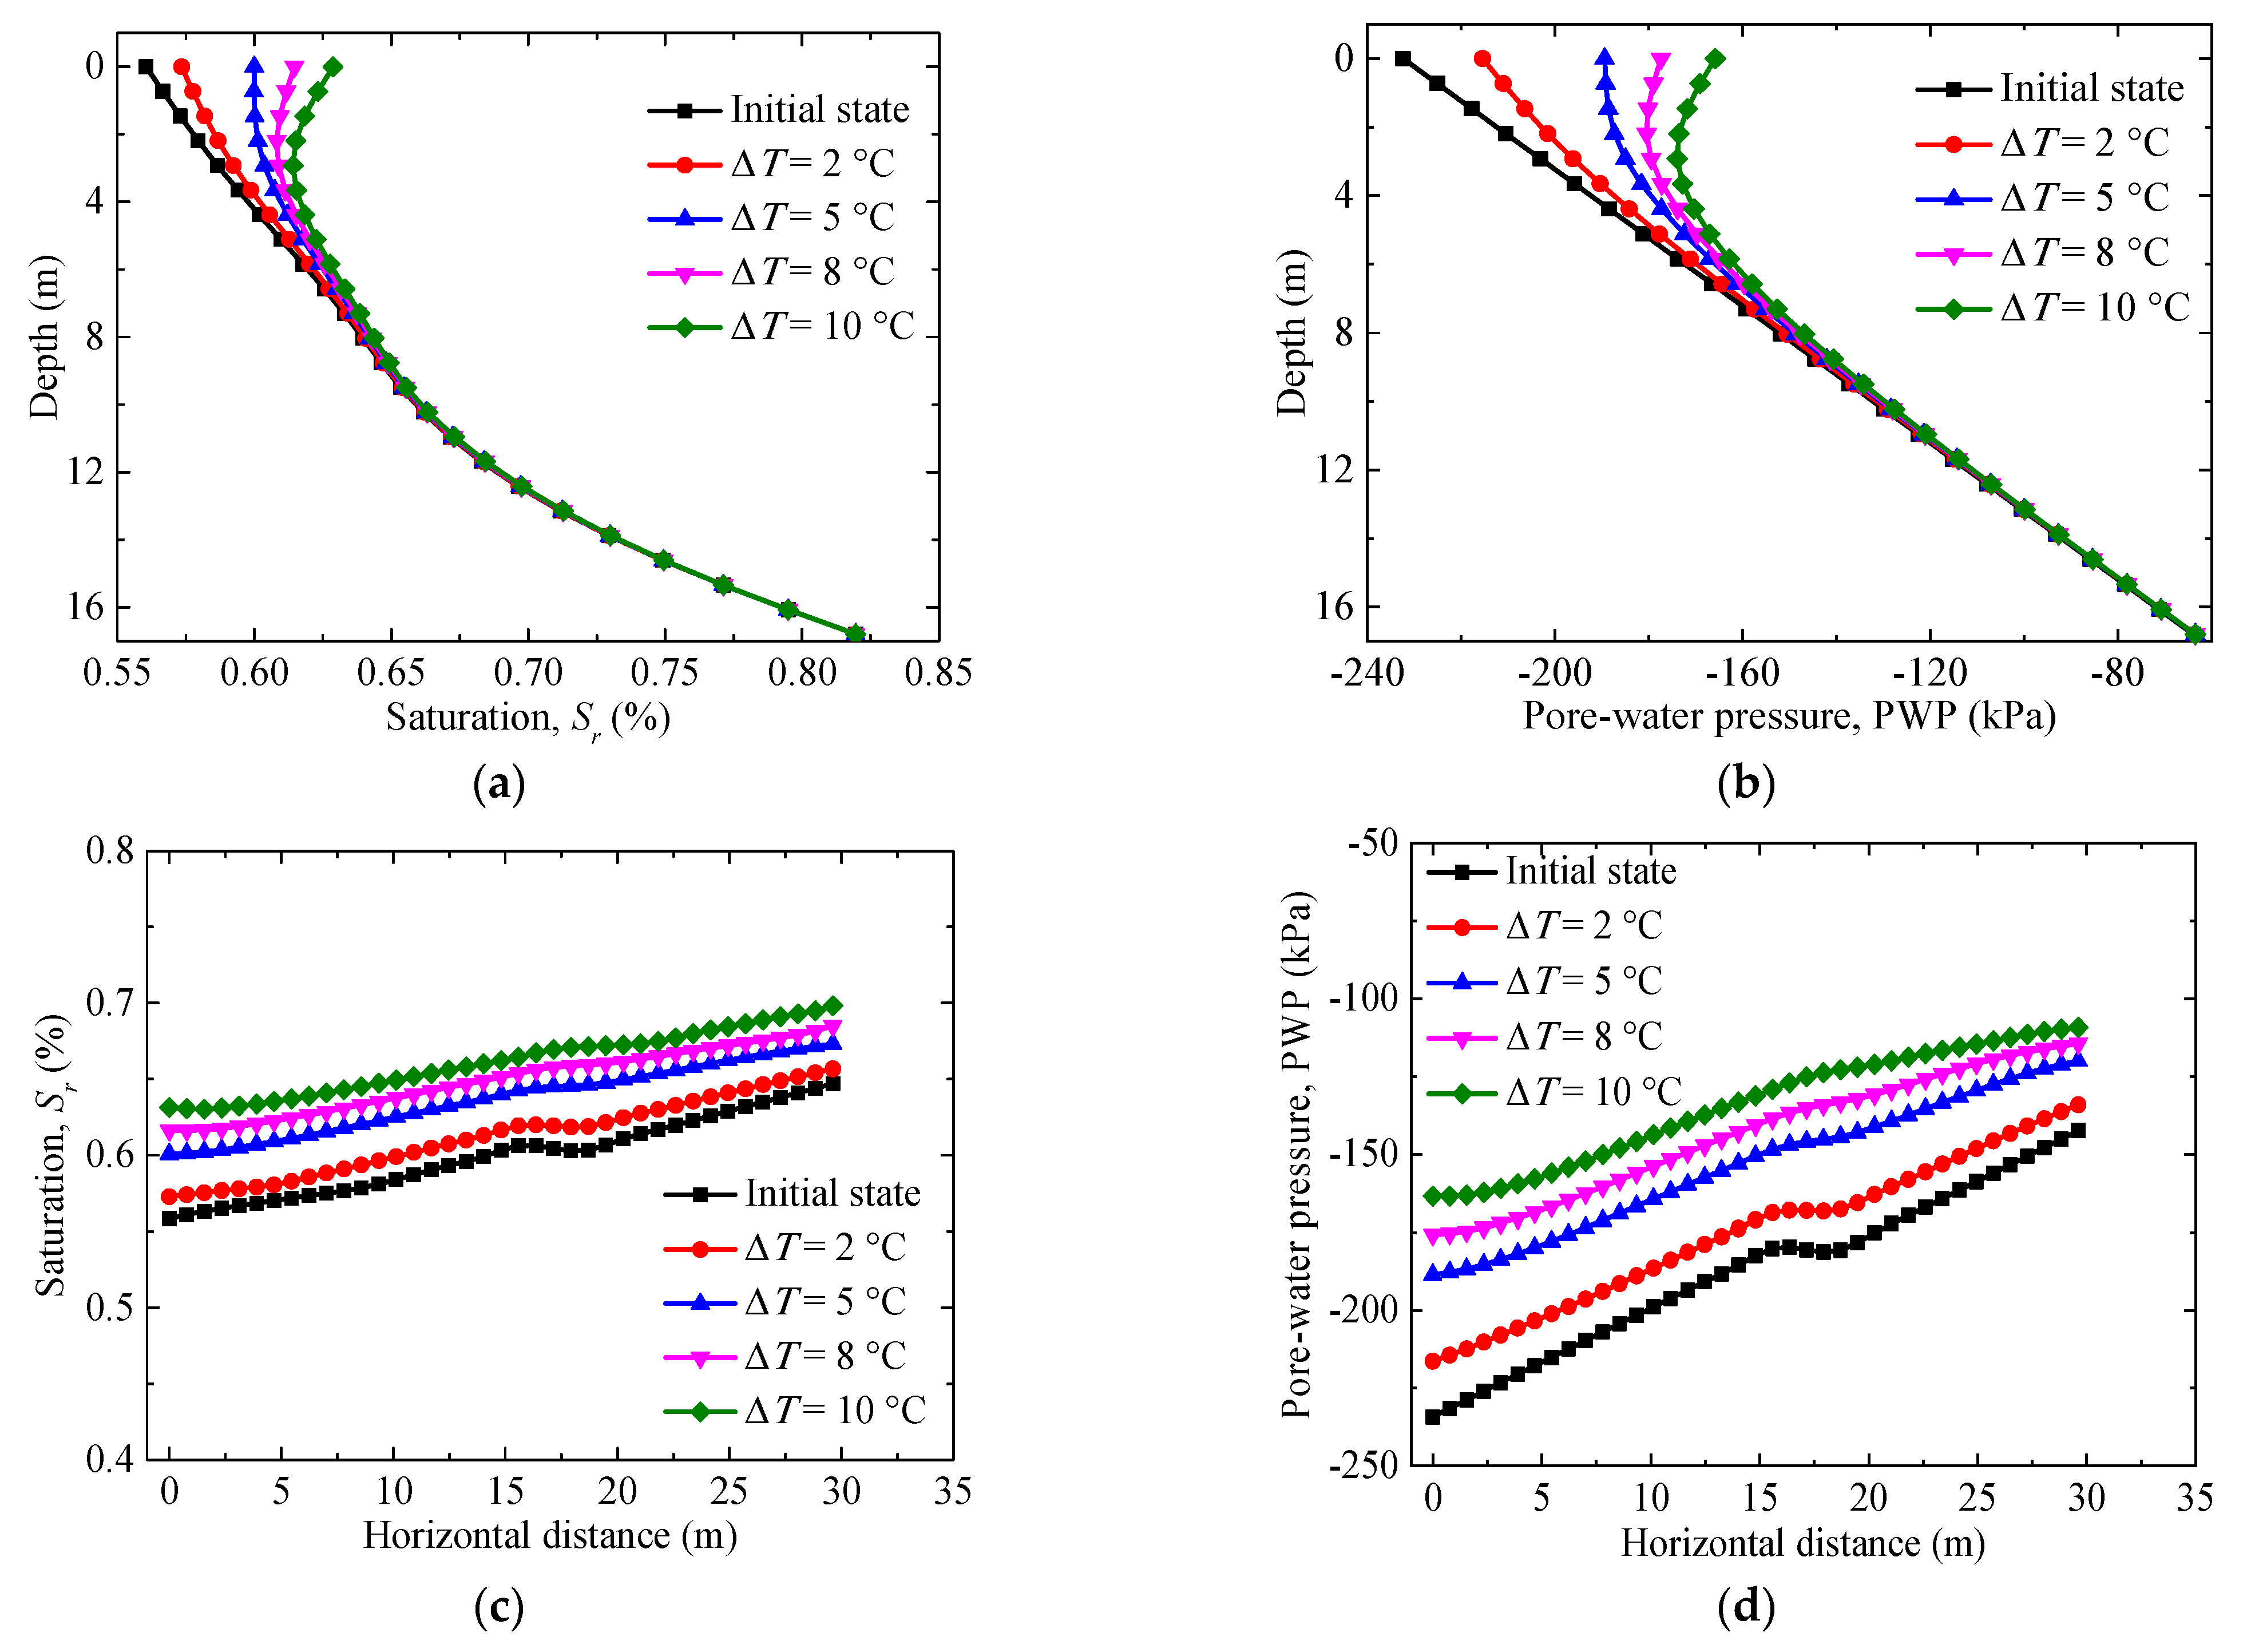
5.2. Effect of Daily Temperature Variation on Soil Slope Stability

Daily temperature variation (ΔT) is a key factor affecting the distribution of water content and the stability of soil slopes during spring thaw periods due to its effect on snowmelt and the resulting surface infiltration [5]. The degree-day factor (mm·°C−1·day−1) is typically used to convert the degree-days to snowmelt or ice melt (i.e., the depth of snowmelt induced by a temperature increase of 1 °C). The value of the degree-day factor varies with respect to the melt period due to variations in the properties of the snow or ice [39]. According to [36], an average value of the degree-day factor for snow in the region of interest over the period considered in this study was 4.8 mm·°C−1·day−1.
The values of Sr and PWP obtained along lines L1 and L2 are plotted in Figure 14 with respect to ΔT. We note that increasing ΔT from 2 °C to 10 °C yields an increase in Sr and PWP along both lines L1 and L2. The results in Figure 14a,b indicate that the effect of ΔT on the seepage field along line L1 at depths greater than 10 m is not obvious. However, snowmelt infiltration is observed to affect the seepage field in the top 10 m thickness of the soil layer seriously along line L1. The values of Sr observed at the top and slope toe at ΔT = 10 °C are about 10.8% and 7.3% greater than the corresponding values observed in the initial state. However, these differences in the seepage field are small at ΔT = 2 °C.
The FOS profile of the cutting slope is plotted in Figure 15 with respective ΔT. Here, the FOS decreases dramatically with increasing ΔT. This is because snowmelt infiltration increases with increasing ΔT, which increases the water content in the slope and thereby decreases slope stability. Again, we note that the FOS observed at the termination of snowmelt infiltration (t = 48 h) is significantly less than that observed at t = 96 h. However, we further note that the effect of ΔT on the FOS is relatively small compared with the corresponding effect of ds.

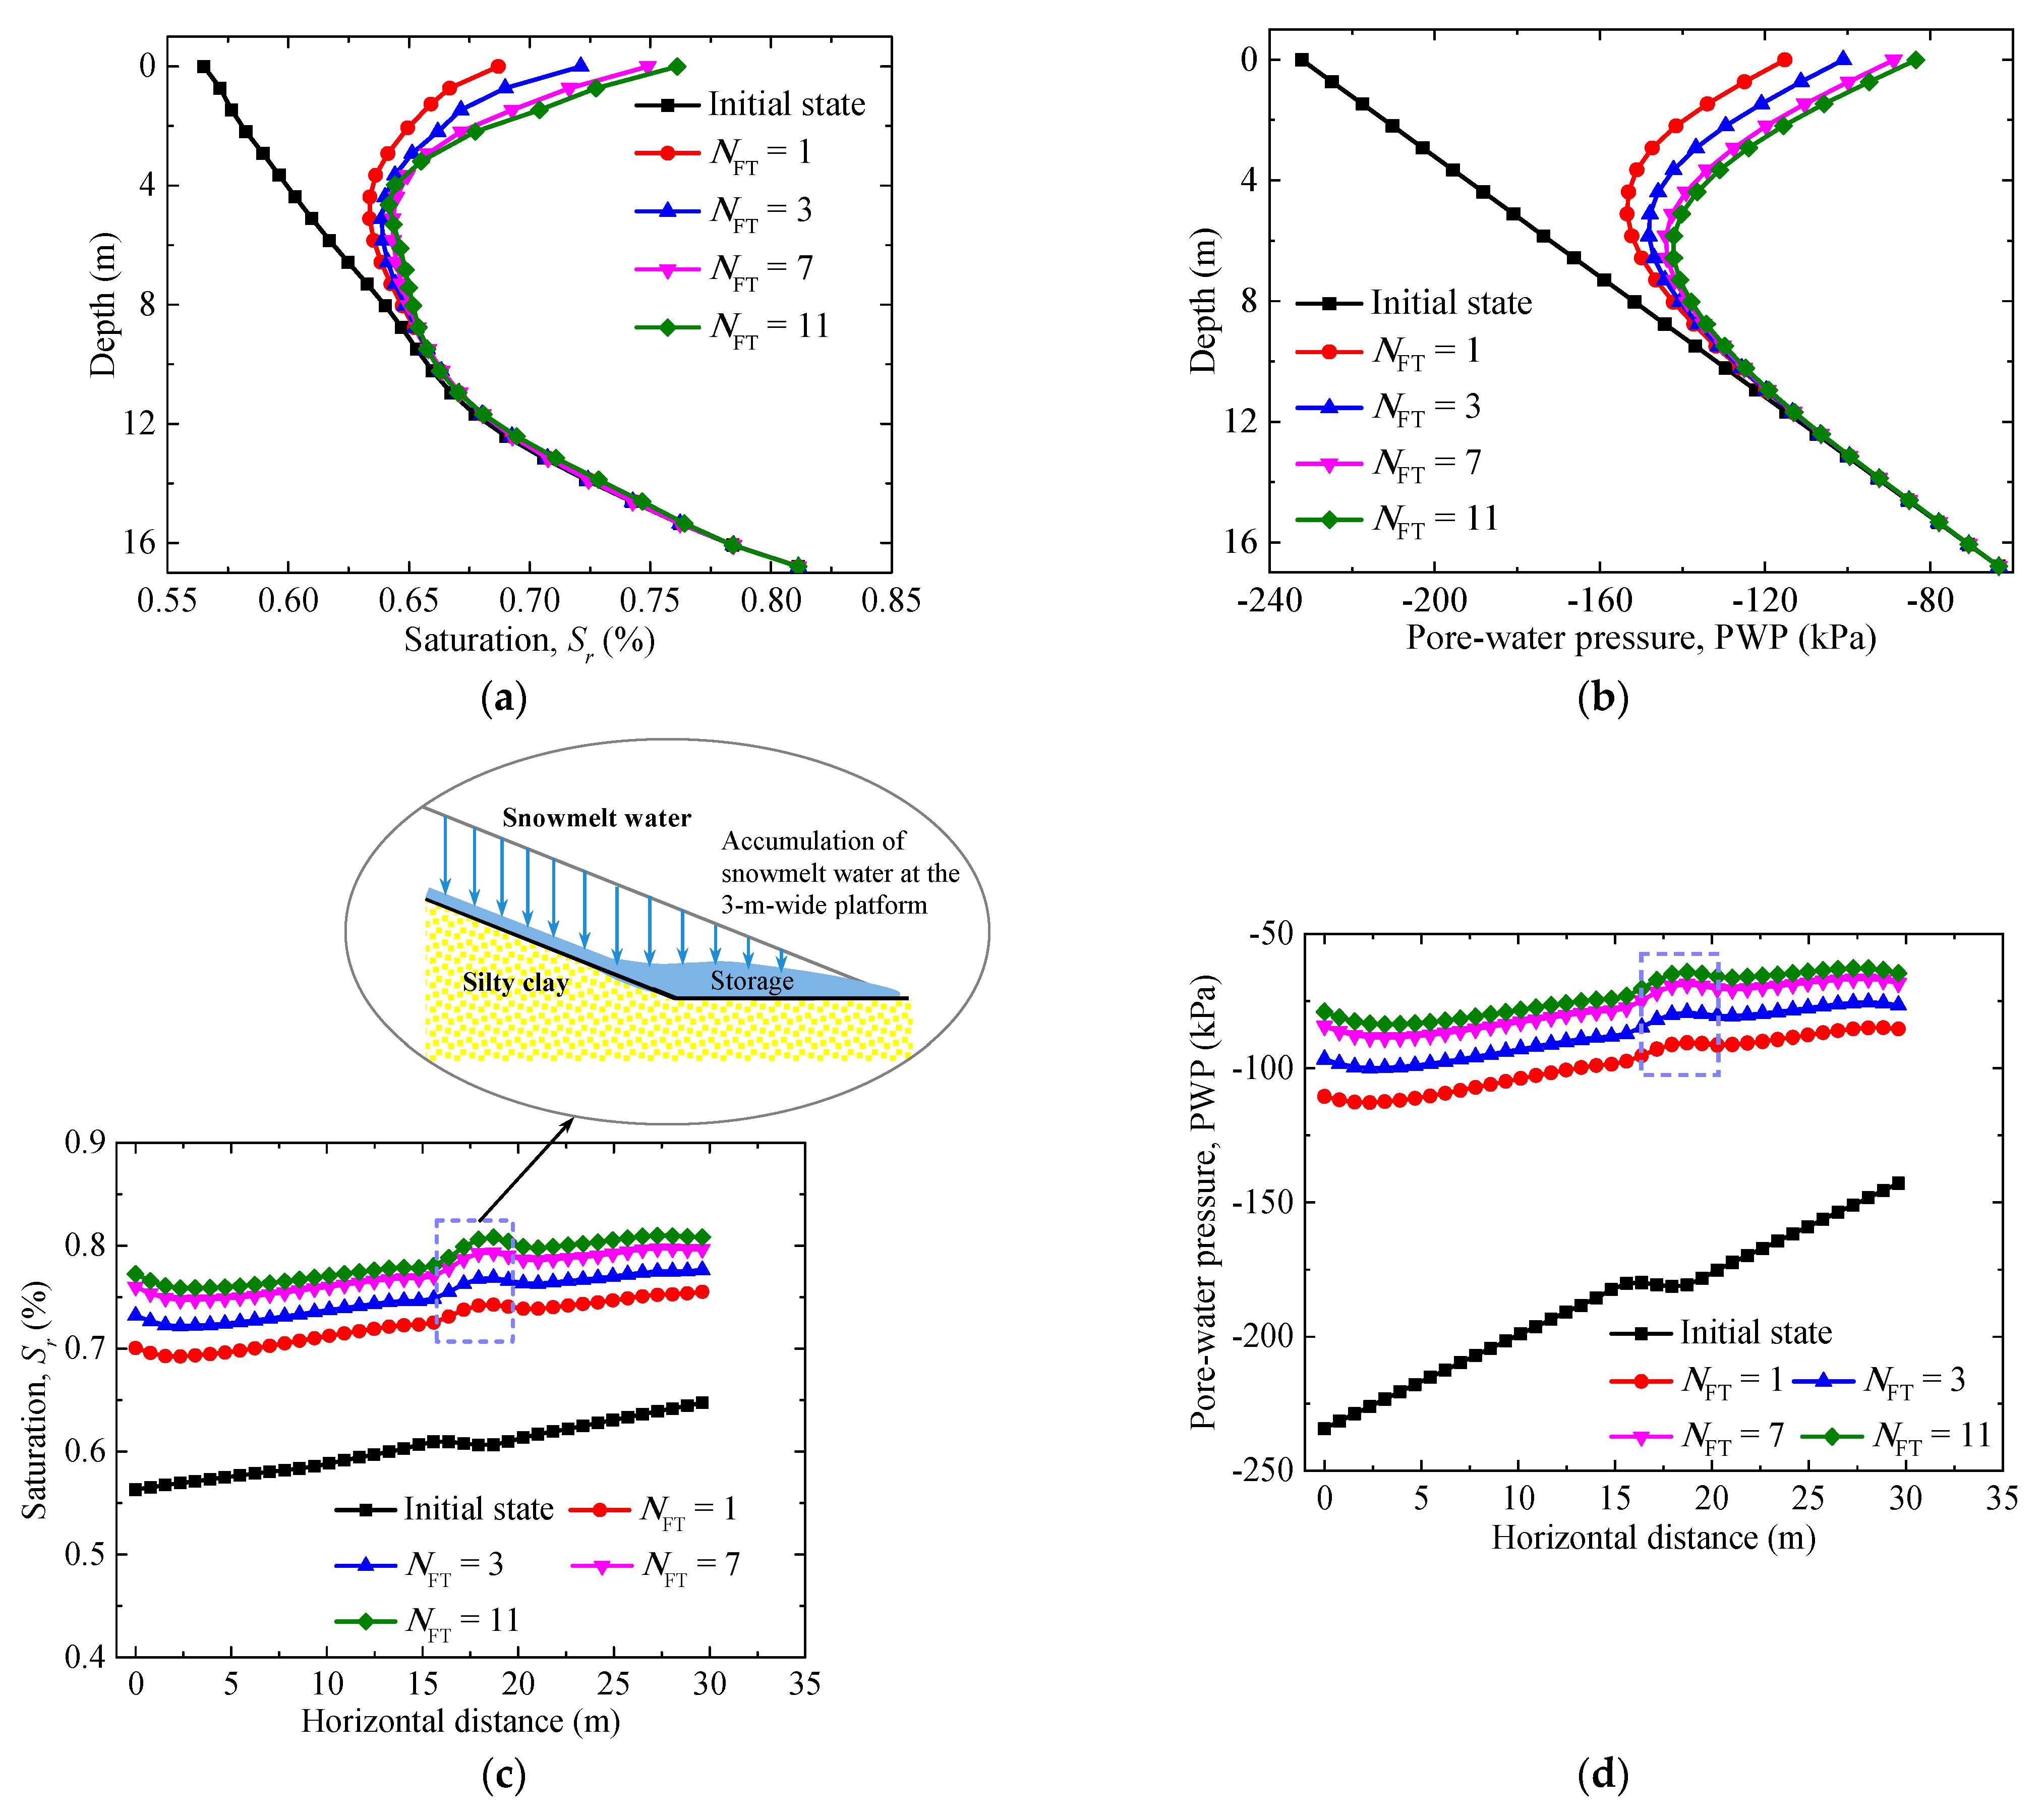
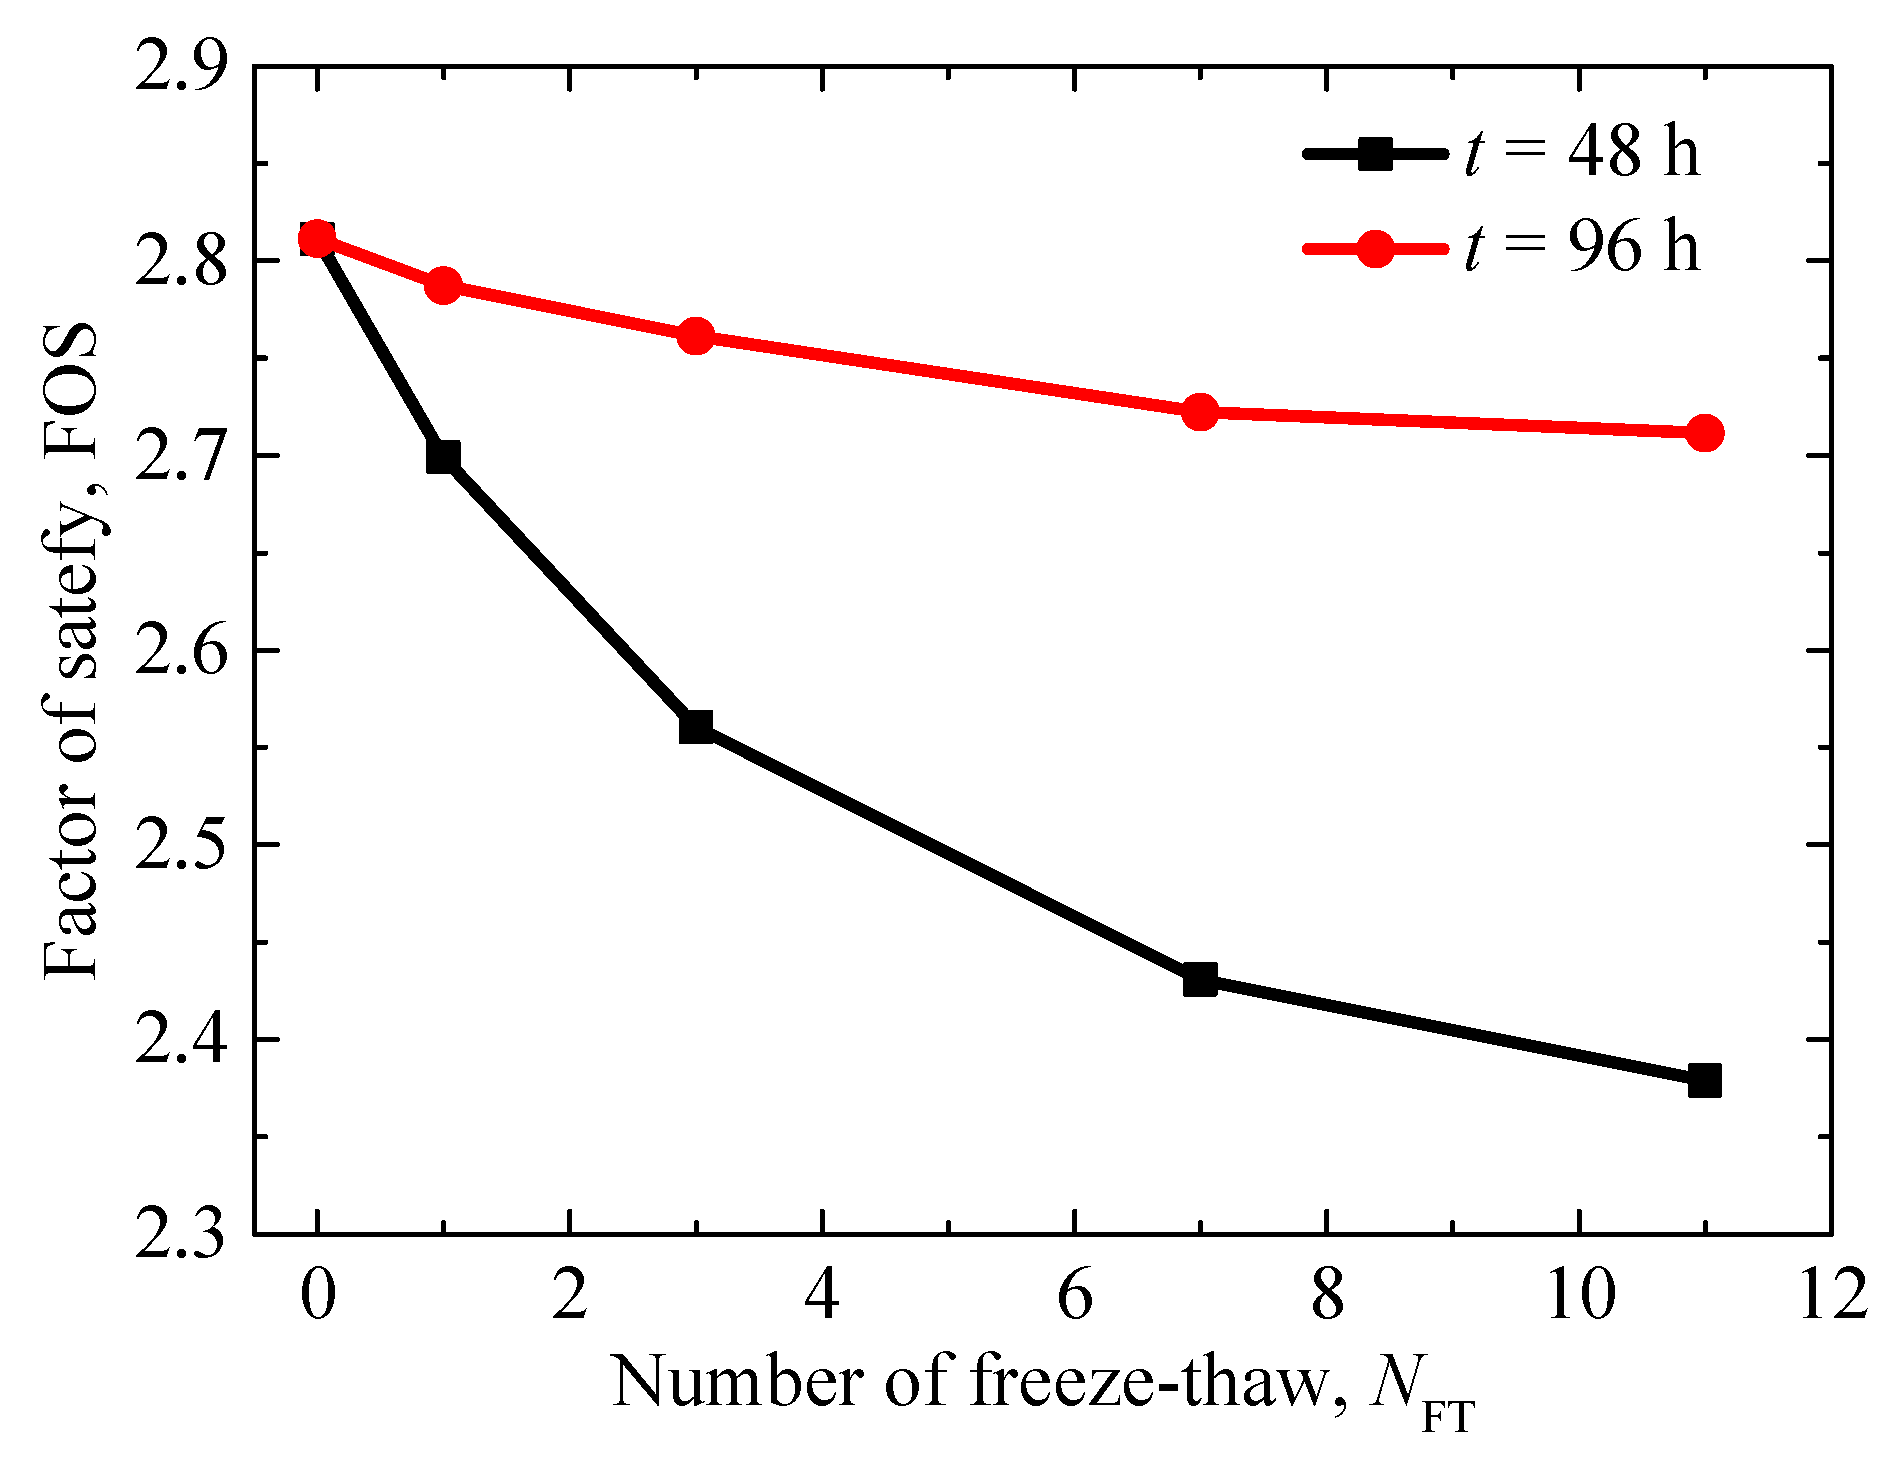
5.3. Effect of Freeze-Thaw Cycles on Soil Slope Stability

A schematic illustrating the process of crack propagation in a soil slope under F-T cycle is presented in Figure 16. The Figure 16a is the CT images of silty clay after various number of F-T cycles (NFT) (typical Section 2 of soil samples is chosen to depict the microstructure variations, and a detailed introduction was provided by Tang et al. (2018) [10]). It is obvious that as the NFT increases, the micro voids become clearly visible, as shown in the image in Figure 16a. After the F-T cycles, the soil aggregates separate and disrupt the interlocking of soil grains, thus leading to the damage in the microstructure of the soils, and more micro voids will generate. The increase in micro voids in the microstructure due to cyclic F-T deterioration results in generation of cracks at the surface of silty clay, which is increased as the NFT increases (Figure 16b). Due to the crack’s generation in the surface of soils, more snowmelt water will infiltrate into the soil slope; therefore, referring to Zhang et al. [17], different SWE rainfall intensity (Ir) values of 3.2 mm/h, 4.0 mm/h, 4.8 mm/h, and 5.2 mm/h are employed for the first, third, seventh, and eleventh F-T cycles, respectively (Figure 16c). In addition, the analysis results presented in [20] have demonstrated that only the top 2.4-m thickness of the surface layer is substantially affected by crack propagation during multiple F-T cycles. Therefore, the present work considered crack propagation only within this depth zone (Figure 17), whereas the effective shear strengths of the silty clay layer below the 2.4-m level were maintained throughout.
The effective cohesion (c′) and effective internal friction angle (φ′) obtained from the laboratory tests are plotted in Figure 18 with respect to the number of F-T cycles (NFT). We note that both c′ and φ′ decrease with increasing NFT, indicating that the shear strength of the soil decreases with increasing NFT.
The values of Sr and PWP observed along lines L1 and L2 are plotted in Figure 19 with respect to NFT. The results indicate that Sr and PWP increase significantly with increasing NFT. The values of Sr observed at the top and slope toe at the eleventh F-T cycle are about 23.7% and 17.4% greater than the corresponding values observed in the initial state. Clearly, NFT has a significant effect on fluctuations in the water content, which influences the stability of the cutting slope, as demonstrated by the plot of the FOS with respect to NFT in Figure 20. Compared to the FOS under ds and ΔT, a lower FOS was observed under the effect of F-T cycle. In addition, Figure 19c,d demonstrate that Sr and PWP are significantly increased within the dotted box region of the figures. Such behavior may be due to the application of an Ir value that is close to the value of ks for the silty clay layer, which would induce runoff along the slope surface.
The results obtained here demonstrate that, among the various parameters considered, F-T cycling has a particularly significant impact on fluctuations in the soil water content and in turn heavily influences the stability of cutting slope in seasonally cold regions. Therefore, it is important to consider the F-T cycling in estimating the soil water distributions for the proper pre-judgement of slope stability.

6. Conclusions

The present work addressed the currently limited investigation of the impact of snowmelt infiltration on the seepage field and stability of cutting slopes. A 3D FE model was employed to explore the influence of the depth of accumulated snow, daily temperature variation, and the number of F-T cycles on the seepage field and stability. The numerical analysis methodology was validated by comparisons with the analysis results obtained by Oh and Lu [21]. The primary conclusions from the parameter study can be given as follows:
(1) Due to the PWP diffusion process, the deep-seated instability is likely to occur under a prolonged and highly accumulated infiltration, while the shallow slope failure is associated with intense, short-duration snowmelt infiltration.
(2) For the given soil slope, snowmelt infiltration primarily affects the seepage field within a region about 10 m below the ground surface. Moreover, the maximum Sr and PWP values are observed at the slope toe; this may be the reason why snowmelt-induced soil slope failures usually initiate from the slope toe.
(3) The water content distributions inside the soil slope and along the slope surface are seriously affected by snowmelt infiltration. Furthermore, the depth of accumulated snow, daily temperature variation, and number of F-T cycles have a negative effect on the slope stability. Besides, as these factors increase, the Sr and PWP increase considerably. Therefore, these factors should be considered in landslide susceptibility prediction.
(4) The F-T cycle has a substantial impact on the seepage field and shear strength of soils, which in turn affects the soil slope stability. F-T cycle also induces the crack propagation in cutting slope. Compared to the depth of accumulated snow and daily temperature variation, the influence of F-T cycle is more likely to cause slope failure.

Author Contributions

Conceptualization and methodology, S.C.; validation of the numerical analysis method, X.L. (Xianzhang Ling); writing—original draft preparation, S.C.; writing—review and editing, L.T., G.L., and H.L.; parameter analysis, W.X., L.G., and X.L. (Xinyu Li). All authors have read and agreed to the published version of the manuscript.

Funding

This research was supported by the National Key R&D Program of China (Grant No. 2018YFC1505305), the National Major Scientific Instruments Development Project of China (Grant No. 41627801), the National Natural Science Foundation of China (Grant Nos. 42101125, 41772315), the Open Research Fund Program of State Key Laboratory of Frozen Soil Engineering of China (Grant No. SKLFSE202015), China Postdoctoral Science Foundation Project (2021M690840), and the Technology Research and Development Plan Program of Heilongjiang Province (Grant No. GA19A501).

Institutional Review Board Statement

Not applicable.

Informed Consent Statement

Not applicable.

Data Availability Statement

The data presented in this study is available on request from the corresponding author.

Acknowledgments

The authors wish to thank the editor and the reviewers for their contributions on the paper.

Conflicts of Interest

The authors declare no conflict of interest.

References

  1. Lu, N.; Wayllace, A.; Oh, S. Infiltration-induced seasonally reactivated instability of a highway embankment near the Eisenhower Tunnel, Colorado, USA. Eng. Geol. 2013, 163, 22–32. [Google Scholar] [CrossRef]
  2. Ishikawa, T.; Tokoro, T.; Seiichi, M. Geohazard at volcanic soil slope in cold regions and its influencing factors. Jpn. Geotech. Soc. Spec. Pub. 2015, 1, 1–20. [Google Scholar] [CrossRef] [Green Version]
  3. Trandafir, A.C.; Ertugrul, O.L.; Giraud, R.E.; McDonald, G.N. Geomechanics of a snowmelt-induced slope failure in glacial till. Environ. Earth Sci. 2015, 73, 3709–3716. [Google Scholar] [CrossRef]
  4. Osawa, H.; Matsuura, S.; Matsushi, Y.; Okamoto, T. Seasonal change in permeability of surface soils on a slow-moving landslide in a heavy snow region. Eng. Geol. 2017, 221, 1–9. [Google Scholar] [CrossRef]
  5. Siva Subramanian, S.; Ishikawa, T.; Tokoro, T. Stability assessment approach for soil slopes in seasonal cold regions. Eng. Geol. 2017, 221, 154–169. [Google Scholar] [CrossRef]
  6. Siva Subramanian, S.; Ishikawa, T.; Tokoro, T. An early warning criterion for the prediction of snowmelt-induced soil slope failures in seasonally cold regions. Soils Found. 2018, 58, 582–601. [Google Scholar] [CrossRef]
  7. Miao, F.S.; Wu, Y.P.; Li, L.W.; Liao, K.; Zhang, L.F. Risk assessment of snowmelt-induced landslides based on GIS and an effective snowmelt model. Nat. Hazards 2019, 97, 1151–1173. [Google Scholar] [CrossRef]
  8. Weidner, L.; DePrekel, K.; Oommen, T.; Vitton, S. Investigating large landslides along a river valley using combined physical, statistical, and hydrologic modeling. Eng. Geol. 2019, 259, 105169. [Google Scholar] [CrossRef]
  9. Liu, J.; Wang, T.; Tian, Y. Experimental study of the dynamic properties of cement-and lime-modified clay soils subjected to freeze-thaw cycles. Cold Reg. Sci. Technol. 2010, 61, 29–33. [Google Scholar] [CrossRef]
  10. Tang, L.; Cong, S.Y.; Ling, X.Z.; Xing, W.Z.; Nie, Z. A unified formulation of stress-strain relations considering micro-damage for expansive soils exposed to freeze-thaw cycles. Cold Reg. Sci. Technol. 2018, 153, 164–171. [Google Scholar] [CrossRef]
  11. Zhang, S.; Sheng, D.; Zhao, G.; Niu, F.; He, Z. Analysis of frost heave mechanisms in a high-speed railway embankment. Can. Geotech. J. 2015, 53, 520–529. [Google Scholar] [CrossRef]
  12. Xiang, D. Study on the Failure Mechanism and Control Technology of Deep Cutting Slope Located on High-Cold Area. Master’s Thesis, Southwest Jiaotong University, Chengdu, China, 2017. [Google Scholar]
  13. Chang, Z.L.; Huang, F.M.; Huang, J.S.; Jiang, S.H.; Zhou, C.B.; Zhu, L. Experimental study of the failure mode and mechanism of loess fill slopes induced by rainfall. Eng. Geol. 2020, 280, 105941. [Google Scholar] [CrossRef]
  14. Marin, R.J.; García, E.F.; Aristizábal, E. Effect of basin morphometric parameters on physically-based rainfall thresholds for shallow landslides. Eng. Geol. 2020, 278, 105855. [Google Scholar] [CrossRef]
  15. Sarma, C.P.; Dey, A.; Krishna, A.M. Influence of digital elevation models on the simulation of rainfall-induced landslides in the hillslopes of Guwahati, India. Eng. Geol. 2020, 268, 105523. [Google Scholar] [CrossRef]
  16. Yeh, P.T.; Lee, K.Z.; Chang, K.T. 3D Effects of permeability and strength anisotropy on the stability of weakly cemented rock slopes subjected to rainfall infiltration. Eng. Geol. 2020, 266, 105459. [Google Scholar] [CrossRef]
  17. Zhang, J.; Zhu, D.; Zhang, S.H. Shallow slope stability evolution during rainwater infiltration considering soil cracking state. Comput. Geotech. 2020, 117, 103285. [Google Scholar] [CrossRef]
  18. Kimura, T.; Katsura, S.; Maruyama, K.; Ishida, K. Topographic features of source and transfer-deposition areas of long-travelling landslides induced by snowmelt. J. Jpn. Landslide Soc. 2016, 53, 31–42. [Google Scholar] [CrossRef] [Green Version]
  19. Lu, Y.; Liu, S.H.; Weng, L.P.; Wang, L.J.; Li, Z.; Xu, L. Fractal analysis of cracking in a clayey soil under freeze-thaw cycles. Eng. Geol. 2016, 208, 93–99. [Google Scholar] [CrossRef]
  20. Cong, S.Y. Deformation Characteristics and Sliding Mechanism during Spring Thaw Period for Expansive Soil Slope in Alpine Seasonally Frozen Region. Ph.D. Thesis, Harbin Institute of Technology, Harbin, China, 2020. [Google Scholar]
  21. Oh, S.; Lu, N. Slope stability analysis under unsaturated conditions: Case studies of rainfall-induced failure of cut slopes. Eng. Geol. 2015, 184, 96–103. [Google Scholar] [CrossRef]
  22. Bilgin, Ö. Lateral earth pressure coefficients for anchored sheet pile walls. Int. J. Geomech. 2012, 12, 584–595. [Google Scholar] [CrossRef]
  23. Tang, L.; Cong, S.Y.; Xing, W.Z.; Ling, X.Z.; Geng, L.; Nie, Z.; Gan, F.D. Finite element analysis of lateral earth pressure on sheet pile walls. Eng. Geol. 2018, 244, 146–158. [Google Scholar] [CrossRef]
  24. Koltuk, S.; Azzam, R. Design charts for circular-shaped sheeted excavation pits against seepage failure by heave. Period. Polytech. Civ. Eng. 2016, 60, 421–426. [Google Scholar] [CrossRef] [Green Version]
  25. Shaghaghi, T.; Ghadrdan, M.; Tolooiyan, A. Effect of rock mass permeability and rock fracture leak-off coefficient on the pore water pressure distribution in a fractured slope. Simul. Model. Pract. Theory 2020, 105, 102167. [Google Scholar] [CrossRef]
  26. Fredlund, D.G.; Xing, A.Q. Equations for the soil-water characteristic curve. Can. Geotech. J. 1994, 31, 533–546. [Google Scholar] [CrossRef]
  27. Leong, E.C.; Rahardjo, H. Review of soil-water characteristic curve equations. J. Geotech. Geoenviron. Eng. 1997, 123, 1106–1117. [Google Scholar] [CrossRef] [Green Version]
  28. Leong, E.C.; Rahardjo, H. Permeability functions for unsaturated soils. J. Geotech. Geoenviron. Eng. 1997, 123, 1118–1126. [Google Scholar] [CrossRef] [Green Version]
  29. Diakoumi, M.; Powrie, W. Mobilisable strength design for flexible embedded retaining walls. Geotechnique 2013, 63, 95–106. [Google Scholar] [CrossRef] [Green Version]
  30. Qi, S.C.; Vanapalli, S.K. Hydro-mechanical coupling effect on surficial layer stability of unsaturated expansive soil slopes. Comput. Geotech. 2015, 70, 68–82. [Google Scholar] [CrossRef]
  31. Bahrami, M.; Khodakarami, M.I.; Haddad, A. 3D numerical investigation of the effect of wall penetration depth on excavations behavior in sand. Comput. Geotech. 2018, 98, 82–92. [Google Scholar] [CrossRef]
  32. Tan, H.; Jiao, Z.; Chen, J. Field testing and numerical analysis on performance of anchored sheet pile quay wall with separate pile-supported platform. Mar. Struct. 2018, 58, 382–398. [Google Scholar] [CrossRef]
  33. Sumio Matsuura. Difficulties in predicting snow-induced landslides. J. Jpn. Landslide Soc. 1998, 34, 39–46. [Google Scholar]
  34. Iwata, Y.; Nemoto, M.; Hasegawa, S.; Yanai, Y.; Kuwao, K.; Hirota, T. Influence of rain, air temperature, and snow cover on subsequent spring-snowmelt infiltration into thin frozen soil layer in northern Japan. J. Hydrol. 2011, 401, 165–176. [Google Scholar] [CrossRef]
  35. Kazama, S.; Izumi, H.; Sarukkalige, P.R.; Nasu, T.; Sawamoto, M. Estimating snow distribution over a large area and its application for water resources. Hydrol. Process. 2008, 22, 2315–2324. [Google Scholar] [CrossRef]
  36. Qian, X.H.; Rong, G.; Huang, K. Seepage and stability analysis of slope under the condition of snowmelt infiltration. Chin. J. Geol. Hazard Control 2010, 21, 27–33. [Google Scholar]
  37. Cai, F.; Ugai, K. Numerical analysis of rainfall effects on slope stability. Int. J. Geomech. 2004, 4, 69–78. [Google Scholar] [CrossRef]
  38. Vanapalli, S.K.; Fredlund, D.G.; Pufahl, D.E.; Clifton, A.W. Model for the prediction of shear strength with respect to soil suction. Can. Geotech. J. 1996, 33, 379–392. [Google Scholar] [CrossRef]
  39. Singh, P.; Kumar, N.; Arora, M. Degree-day factors for snow and ice for Dokriani Glacier, Garhwal Himalayas. J. Hydrol. 2000, 235, 1–11. [Google Scholar] [CrossRef]
Figure 1. Slope failure induced by snowmelt infiltration (May 2012, Nakayama Pass, National Highway 230, Sapporo. This photo is from a study on a snowmelt estimation method for road management).
Water 13 02729 g001
Figure 2. Slope-sheet pile wall system at Jilin–Tumen–Hunchun high-speed railway. (a) Cross-section of soil slope-sheet pile wall system; (b) Vertical view of soil slope-sheet pile wall system; (c) Detail dimensions of pile and sheet; (d) Finite element mesh.
Water 13 02729 g002
Figure 3. Soil water characteristic curve (SWCC) and relative hydraulic conductivity (kw/ks): (a) silty clay and (b) sandstone.
Water 13 02729 g003
Figure 4. Average climate data from 2010 to 2020 at Yanji, Jilin Province.
Water 13 02729 g004
Figure 5. Schematic view of (a) the process of snowmelt infiltration (after [33]) (b) and the equivalent rainfall infiltration.
Water 13 02729 g005
Figure 6. Hydraulic and mechanical boundary conditions of soil slope at Pohang site [21].
Water 13 02729 g006
Figure 7. Simulated results on 1 April 2011 at Pohang site: (a) the pore-water pressure, PWP (unit: kPa); (b) the degree of saturation (Sr); and (c) the potential slide surface.
Water 13 02729 g007
Figure 8. Cutting slope under the steady-state seepage (without snowmelt infiltration): (a) the degree of saturation (Sr); and (b) the pore-water pressure (PWP) (unit: kPa).
Water 13 02729 g008
Figure 9. The degree of saturation (Sr) contours of the cutting slope under the snowmelt infiltration: (a) t = 48 h; (b) t = 72 h; and (c) t = 96 h.
Water 13 02729 g009
Figure 10. The PWP contours (unit: kPa) of the cutting slope under the snowmelt infiltration: (a) t = 48 h; (b) t = 72 h; and (c) t = 96 h.
Water 13 02729 g010
Figure 11. Investigation locations at the cutting slope.
Water 13 02729 g011
Figure 12. Effect of the depth of accumulated snow (ds) on the (a) the degree of saturation profile at L1; (b) the PWP profile at L1; (c) the degree of saturation profile at L2; and (d) the PWP profile at L2.
Water 13 02729 g012
Figure 13. Factor of safety (FOS) of the cutting slope with the depth of accumulated snow (ds).
Water 13 02729 g013
Figure 14. Effect of daily temperature variation (ΔT) on the (a) the degree of saturation profile at L1; (b) the PWP profile at L1; (c) the degree of saturation profile at L2; and (d) the PWP profile at L2.
Water 13 02729 g014
Figure 15. Factor of safety (FOS) of the cutting slope with daily temperature variation (ΔT).
Water 13 02729 g015
Figure 16. Schematic view of the crack propagation in soil slope: (a) CT images of silty clay after various freeze-thaw (F-T) cycles [10]; (b) crack propagation in the surface of soil slope (after [17]); and (c) SWE rainfall intensity (Ir) for soil slope exposed to different F-T cycle.
Water 13 02729 g016
Figure 17. Cross-section of soil slope with cracking regions.
Water 13 02729 g017
Figure 18. Relationship between the effective cohesion (c′), the effective internal friction angle (φ′), and the number of freeze-thaw cycles (NFT).
Water 13 02729 g018
Figure 19. Effect of freeze-thaw cycles (NFT) on the (a) the degree of saturation profile at L1; (b) the PWP profile at L1; (c) the degree of saturation profile at L2; and (d) the PWP profile at L2.
Water 13 02729 g019
Figure 20. Factor of safety (FOS) of cutting slope along under various number of freeze-thaw cycles (NFT).
Water 13 02729 g020
Table 1. Geotechnical and hydromechanical properties of the soil materials.
TypeParameterSity ClaySandstone
Strengthc′ (kPa)15.751
φ′ (°)23.538
γsat (kN/m3)1920.5
DeformationE (MPa)1646
µ0.30.25
Hydromechanicalks (m/s)1.73 × 10−610−4
θs (%)5345
a (kPa)2810
p4.74
m11
n11
Table 2. Geotechnical and hydromechanical properties of Pohang soil [21].
TypeParameterPohang Soil
Strengthc′ (kPa)0
φ′ (°)31.6
γave (kN/m3)18.03
DeformationE (kPa)2 × 10⁶
v0.333
Hydromechanicalks (m/s)3.46 × 10−6
θs0.398
θr0.12
ub (kPa)27.93
n1.10
Publisher’s Note: MDPI stays neutral with regard to jurisdictional claims in published maps and institutional affiliations.

