Article

Expert-Based Assessment and Mapping of Ecosystem Services Potential in the Nemunas Delta and Curonian Lagoon Region, Lithuania

by
Karolina Kaziukonytė
,
Jūratė Lesutienė
*,
Zita Rasuolė Gasiūnaitė
,
Rasa Morkūnė
,
Soukaina Elyaagoubi
and
Artūras Razinkovas-Baziukas
Marine Research Institute, Klaipėda University, 92294 Klaipėda, Lithuania
*
Author to whom correspondence should be addressed.
Water 2021, 13(19), 2728; https://doi.org/10.3390/w13192728
Submission received: 20 August 2021 / Revised: 16 September 2021 / Accepted: 25 September 2021 / Published: 2 October 2021
(This article belongs to the Section Biodiversity and Functionality of Aquatic Ecosystems)

Abstract

:
The Curonian Lagoon (SE Baltic Sea) and the coastal wetland system play a vital role in maintaining the overall cultural, economic and ecological health of the region. However, its value is still largely underestimated and there is a lack of integrated ecosystem management based on multiple ecosystem services assessment. In this study, 34 ecosystem services (ES) were identified, assessed and mapped following the Common International Classification of Ecosystem Services (CICES). Using expert opinion, 35 land cover classes were scored for their ES potential, these being 15 CORINE land cover classes (CLC) and 20 Natura 2000 areas of conservation (habitat types, i.e., Sites of Community Importance). The total ES potential was calculated by averaging the opinions of experts, using self-confidence scoring as weights, and the ES relative importance index was derived from a questionnaire. As a result, three maps corresponding to each ES potential category (provisioning, regulation and maintenance and cultural) were calculated and further used for hot- and coldspot analyses. Regulation and maintenance and cultural ES were highly interrelated and had the highest potential in the studied area. Forested areas had the highest total ES potential and contributed significantly to the land cover of the ES hotspots.

1. Introduction

Over the course of the last century, strong anthropogenic pressures have resulted in widespread habitat degradation and a noticeable decline in environmental quality across many ecosystems, potentially leading to biodiversity loss and an increased risk of declining or even collapsing ecosystem functions [1]. Coastal ecosystems and surrounding terrestrial areas are particularly vulnerable to climatic and anthropogenic impacts as they are crossed by watershed migration routes and are subject to more frequent extreme hydrometeorological events and floods [2,3,4,5]. Being one of the most productive ecosystems, coastal wetlands carry out critical functions within watersheds, such as regulating water quality, water levels, flood regimes, nutrient and sedimentation levels and carbon sequestration, as well as providing habitats for many species [6,7]. Large areas of coastal wetlands have been poldered for pastures and cropland [8], thus requiring constant maintenance and defense. As a result, to ensure environmental quality and social well-being in coastal rural areas, authorities need systematic approaches for robust decision-making. To deal with the high degrees of uncertainty, the systematic approaches require tools to assess the state of the landscape, to indicate trends and to develop suitable management strategies [9]. The ecosystem services concept could be helpful in this regard, bridging research and management and providing a common language for local stakeholders and interest groups, while also assessing management scenarios [10] and harmonizing the use of ecosystem services and conservation goals [11].
It is acknowledged that ecosystems with higher biodiversity can provide a greater diversity and, in many cases, a higher supply of ES [12]. The importance of conservation areas and biodiversity in stabilizing ecosystem functions (i.e., the provision of ES) has been increasingly recognized and recommended for use in ES assessment in Natura 2000 sites [11,13]. Introduced in 2011, the European Union Biodiversity Strategy for actions moving towards 2020 called upon Member States to assess and map ES in their national territory as a supporting action to maintain and enhance ecosystems [14]. Subsequently developed, the Biodiversity Strategy for 2030 calls for the enlargement of existing Natura 2000 areas and enhanced protection of the areas that are particularly important for biodiversity and climate regulation, i.e., those that provide high levels of carbon sequestration [15]. Therefore, the ES assessment of established Natura 2000 sites and surrounding areas potentially could be useful for the further development of the network by increasing its connectivity [16], as well as for the general promotion of European green infrastructure [17] and other thematic policies [18].
Expert-based methods can help to provide a rapid starting point for the mapping and assessment of ecosystems and their services in areas with conservation potential. Emerging under the definition of the ES matrix for ES mapping, an ES mapping technique was developed by Burkhard et al. in 2009 [19] and improved in 2012 and 2014 [20,21]. It has become an increasingly popular flexible methodology and requires only a limited amount of data and standard software [10,22]. The ES matrix approach links ecosystem types or land cover types to ES by providing a score for ES capacity, supply, use, demand or other concepts [23,24,25]. Its potential to integrate use and non-use values of nature and various types of data, from expert scores to statistics, interview data, measurements and model outcomes, makes it applicable in all kinds of environments with varying data quality and availability [26]. Results based on the flexible 0–5 ranking system and the linkage to geobiophysical spatial units (e.g., land cover, biotope, vegetation or soil types) in ES maps not only provide wide application ranges for decision-making, but also ensure that none of the ES are overlooked [26,27]. A more recent attempt to develop the matrix approach focused on ranking or assigning weights for ES categories [28,29,30], demonstrating that perceptions and priorities of well-being are area- and society-specific.
In Lithuania, the first comprehensive attempt to map expert-based potential ES using CORINE land cover data was performed by Depellegrin et al. in 2016 [31]. This study concluded that regulating and cultural ES have the highest ES potential in the country, particularly in the case of broadleaf, coniferous and mixed forest ecosystems [31]. Thereafter, a series of studies have focused on the mapping of the actual flow (real supply) of individual ES in Lithuania, e.g., forest provisional ES [32] and cultural ES of landscape aesthetics [33]. The LIFE VivaGrass project has been dedicated to the mapping and assessment of ES supply in grasslands, with the aim of supporting decision-making in the spatial planning and management of agroecosystems [34]. Finally, practitioners (the Ministry of Environment, the LIFE Naturalit project consortium) have also shown a particular interest in assessing ES provision and optimization in the Natura 2000 network territory [35]. This effort has included the valuation of provisioning ES (value of honey, mushrooms and berries collected in Natura 2000 areas; consumption value of catches by fishermen and hunters), some selected regulation and maintenance ES (provision of drinking water quality, soil erosion control, carbon sequestration, maintaining the stability of the hydrological regime) and cultural ES such as visitor value and existence or bequest value. The obtained results of the study showed that the total benefits of the Natura 2000 network (200.8 Eur/ha) exceed by 2.18 times the socio-economic costs for maintaining the Natura 2000 network (92 Eur/ha), with the highest benefit generated by cultural ES. In the next step, ecosystem accounting is expected to be integrated into the decision-making process. Accounting examples are already available at the region level [18], though local authorities dealing with decisions at a small scale, such as territorial planning, also need supporting information about ecosystem assets.
All previous ES mapping and assessment initiatives in Lithuania have largely focused on mainland territories, excluding coastal regions. As suggested by Depellegrin et al. [31], ES scoring and valuation in mainland areas is not transferrable to coastal areas, due to their specific features, such as their high nature heritage value, their aquatic resources and their leisure and touristic potential. The Nemunas River Delta area, Curonian Lagoon and Curonian Spit are the largest continuous Natura 2000 areas in the country (750.5 km2). The Nemunas Delta area serves as an important stop-over site for migrating birds (Ramsar territory) and as a nesting habitat for vulnerable species such as the Aquatic Warbler Acrocephalus paludicola and Great Snipe Gallinago media. The territories of local administrative units (seniunija) bordering the Curonian Lagoon and the lower reaches of the Nemunas River incorporate relatively high areas of Natura 2000 sites, these ranging from 21 to 83% of the areas of seniunija (this exceeding the national average of 13%). A wide variety of ES have been identified [9,36] in this region. ES mapping and assessment at the habitat level, taking into account its conservation status, is still absent.
The identification of trade-offs and synergies between the ES is particularly relevant for both the conservation and the territorial and civil management of this area. Historically, over the 20th century, due to land reclamation, the Nemunas Delta floodplain wetlands were converted into agricultural land [37]. In total, 30,000 ha were drained and poldered before the 1990s. The abandonment of some pumping stations and drainage canals since the 1990s has created a variety of hydrological and ecological conditions that provide habitats for protected species. It has now become a particular challenge for environmental managers and landowners to understand trade-offs and synergies between the use of ecosystem services and conservation goals. ES matrix and mapping output will help to identify the areas with the highest ES potential and the general patterns of ES potential distribution in the territory, thereby supporting ecosystem-based decision-making, landscape management and territorial planning. Some recent studies have highlighted habitats as the most relevant assessment unit for management needs along the coastline and surroundings [38,39]. In the present study, effort is made to include habitats (Sites of Community Importance) as expert-based assessment units, and an extensive list of ES is incorporated to address all nature values in the territory, as well as relationships between ES and their spatial patterns.

2. Materials and Methods

2.1. Study Area

The study area is located in the south-western region of Lithuania. This territory includes seven seniunija, the lowest administrative units of Lithuania—these being Priekulė, Kintai, Rusnė, Šilutė, Saugos, Juknaičiai and Usėnai (Figure 1). At an average of 17.8 inhabitants/km2, the population density is among the lowest in the country. There has also been a significant depopulation rate of around −6.6% over the past decade (ECOSERVE database) [40]. Three of these elderships border the Curonian Lagoon, and 4 elderships border the Nemunas River. The total area of the study site, excluding the Curonian Lagoon, is 942.4 km2. Almost one third of the study area is the Nemunas Delta Regional Park (290.7 km2), which was established in 1992. Protected territories have biosphere polygons, reserves, strict reserves, Natura 2000 (Special Protection Areas (Birds Directive), Sites of Community Importance (Habitats Directive)) and Ramsar sites with various status. In total, protected areas cover 406.2 km2, which is 43% of the terrestrial part of the study area, while the Natura 2000 network covers 27.4% of the studied territory.
The terrestrial part of the study area is dominated by agricultural areas, forests and grasslands. The floodplains of the lower reaches of the Nemunas River are poldered with two types of polders: (i) winter polders, aimed at protecting arable land and settlements all year round, and (ii) summer polders, aimed at protecting meadows from floods in the summer–autumn period. With the winter polders, covering a total area 8500 ha, maintenance is a priority for civil safety. The summer polders, covering a total area of more than 20,000 ha, are flooded during the spring floods but are later drained to maximize the grass yield. To maintain a ground water level lower than the neighboring river water level at times of high rainfall or flood, pumping from the polder main dyke is needed.

2.2. CICES Classification and Compilation of Land Cover Datasets (CORINE LC + Natura 2000 Habitats)

To be completed by the chosen experts, the matrix table consisted of a list of ES (on the x-axis) and geobiophysical data (on the y-axis). The primary motivation for building the matrix was the abundance of the Natura 2000 network in the study area, as well as conservation objectives interfering with ES, resulting in potential trade-offs or synergies among the ES, i.e., this led to the selection of habitats as assessment units and the compilation of the ES list. ES were selected based on literature analysis [9,36] and expert judgment on habitat types within the study area. In this way, 34 ES were selected, belonging to three categories according to the CICES V5.1 (Common International Classification of Ecosystem Services) [41] classification: provision, regulation and maintenance and cultural.
The geobiophysical data were compiled from the satellite-based CORINE (Coordination of information on the environment) land cover classification data (2018; resolution of 100 m) from the European Union and the list of natural Sites of European Community Importance for Natura 2000, compiled in 2015 [42]. This resulted in an integrated land cover map (Figure 1). Natura 2000 habitats were prioritized in the land cover mapping, while CORINE land use classes (CLC) were selected in areas where Natura 2000 habitats did not exist. CORINE urbanized and urban areas from the artificial surfaces category were not included on the list. The selection of Natura 2000 habitats was based on their area and whether they were priority habitats. Habitats with a total area of less than 1 km2 were reviewed individually. If a habitat type was concentrated in one location, it would be considered appropriate for the assessment, while if the habitat type consisted of small, fragmented sites throughout the study area, such a habitat type would be considered inappropriate. This approach helped to reduce the list of assessment units, i.e., it removed Natura 2000 habitat types that were rare in the study area, insignificant in size or scattered. Moreover, despite its high areal coverage and its internal heterogeneity, the Curonian Lagoon was classified as one single class, i.e., a coastal lagoon. With its coastal halophyte habitats, this covered around one third of the total investigated territory (28.3%, Figure 1).
All of this resulted in a list of 35 land cover classes consisting of 15 CORINE classes and 20 Natura 2000 habitat types (Table 1). In the terrestrial part of the study site, the compiled land cover map showed a dominance of agricultural areas (CLC), natural and semi-natural grassland formations (Natura 2000) and forests (CLC), these together covering 86.8% of the terrestrial part of the studied territory (Table 1, Figure 1). Natural and semi-natural grassland formations (Natura 2000) included northern boreal alluvial meadows (6450; 65.72 km2), lowland hay meadows (6510; 57.28 km2), Fennoscandian lowland species-rich dry to mesic grasslands (6270; 34.11 km2), hydrophilous tall herb fringe communities of plains and of the montane to alpine levels (6430; 0.89 km2), semi-natural dry grasslands and scrubland facies on calcareous substrates (6210; 0.48 km2), Molinia meadows on calcareous, peaty or clayey-silt-laden soils (6410; 0.10 km2).

2.3. Scoring and Compiling the Values

Using authors of studies from different fields (ecologists, biologists, hydrologists, ichthyologists, specialists in tourism and others) and thus having knowledge of or work experience in the study area, regional experts were asked to complete the matrix table consisting of 34 ES × 35 land cover classes (Table 2). It is recommended to ensure that at least 10–15 different experts complete each score to achieve sufficient statistical reliability [26]. Therefore, a partial individual fill-in approach was applied, this meaning that each expert adjusts or completes the part of the matrix depending on their expertise. In this way, the individual fill-in process is shorter than with a full individual fill-in and allows more experts to participate. In total, 21 experts completed the matrix table and all ES had at least 10 scores. The experts’ workshop to complete the matrix table was held in 2019, though some of the experts filled in the matrix individually.
Each assessed ES had two ratings—a service potential score and an expert confidence score. The potential of the different LC classes to provide an individual ES was scored with values between 0 and 5, following the scale given in Burkhard et al. [19] and updated by Poikolainen et al. [43] to assess the potential of the ES, where 0 = no relevant potential for the ES to supply the respective ES; 1 = low relevant potential; 2 = relevant potential; 3 = medium potential; 4 = high potential; 5 = very high potential.
Following the proposal of Campagne et al. [24], each expert was asked to state their confidence in their knowledge regarding the land cover and ES using a confidence score with the following values: 1 = I don’t feel comfortable with my score, 2 = I feel fairly comfortable with my score and 3 = I feel comfortable with my score. The central value was computed using the weighted arithmetic mean of all individual expert scores for each combination of ES and ecosystem type [24]. The experts’ self-confidence scores were used as a weight to calculate the arithmetic mean as follows:
W e s = i = 1 n e i P i i = 1 n e i
where Wes was the weighted average value of the ES potential, ei, was the expert’s confidence score and Pi was the ES potential value. The numbers were rounded to the nearest integer. The matrix of the estimated ES potentials was linked to the polygons of the compiled biophysical data using a polygon attribute table with CORINE land cover and Natura 2000 site code field to produce maps of individual ES using ArcMap 10.5.

2.4. Relative Importance (RI) of Ecosystem Services

To aggregate the values of individual ES within categories and to calculate the total ES potential in each assessment unit, the relative importance (RI) of ES was considered. The assignment of an RI value helped to avoid the equal contribution of individual ES to the average score and, at least to some extent, reflected the specifics of local priorities. For ranking ES by their importance in the study area, we used questionnaire data collected in parallel by Morkūnė et al. (submitted manuscript) within the scientists’ community at the national “Marine and Coastal Research 2019” conference in May 2019. The contributing participants (64 scientists) evaluated the ES importance on a scale of 1, 2, 3, 4 and 5. Preference was defined as the importance of a particular ecosystem service according to its necessity or existing actual threats of losing it. The scale ranged from not important (1) to very important (5). Further, in this study, these values were transformed to 0, 1, 2, 4 and 8, respectively, and analyzed using the methodology presented in Robbe et al. [30]. This non-linear transformation of the scores allowed the highlighting of the highest scoring value, thus having more robust and clear mapping results and a better understanding of the most important and valuable ES. Scores were transformed into percentage values, i.e., relative importance (RI) values were given to each of the ES assessed in this study (Table 2). Missing RI values were replaced by ES category median values. The total RI was highest for cultural services (sum 46%), followed by regulation and maintenance services (40%) and provisioning services (15%).
The weighted arithmetic mean was used to aggregate total ES value and ES values within categories using the calculated RI:
W c = i = 1 n R I i P i i = 1 n R I i
where W c is the weighted average value of the ES category (provisioning, regulation and maintenance and cultural) and RIi is the relative importance. Each ES category matrix was further used for hotspot analyses.

2.5. Data Analysis

For the potential trade-off, synergies and ES association analyses, we applied correlation and principal component analyses (PCA). Relationships between provided scores and between individual pairs of ES were identified using Spearman rank correlation. To evaluate multiple relationships of ES, ordinations of land use classes and ES as the identification of ES bundles, we applied a PCA analysis using R package FactoMineR (v. 1.7, 2020) [44].
For hot/coldspot analyses using the ArcMap (v10.5) tool, we used ES potential values within each aggregate category: provisioning, regulation and maintenance and cultural services. Further, using these aggregate values, the Gi* statistics were calculated to identify hotspots and coldspots of ES potentials. This tool took each raster pixel within the context of neighboring features into the calculation and output a new feature class with a z-score, p-value and confidence level. Features with a high z-score and small p-value indicated statistically significant hotspots, while features with a low negative z-core and small p-value demonstrated statistically significant coldspots [45].

3. Results

3.1. Assessment of Ecosystem Service Potential

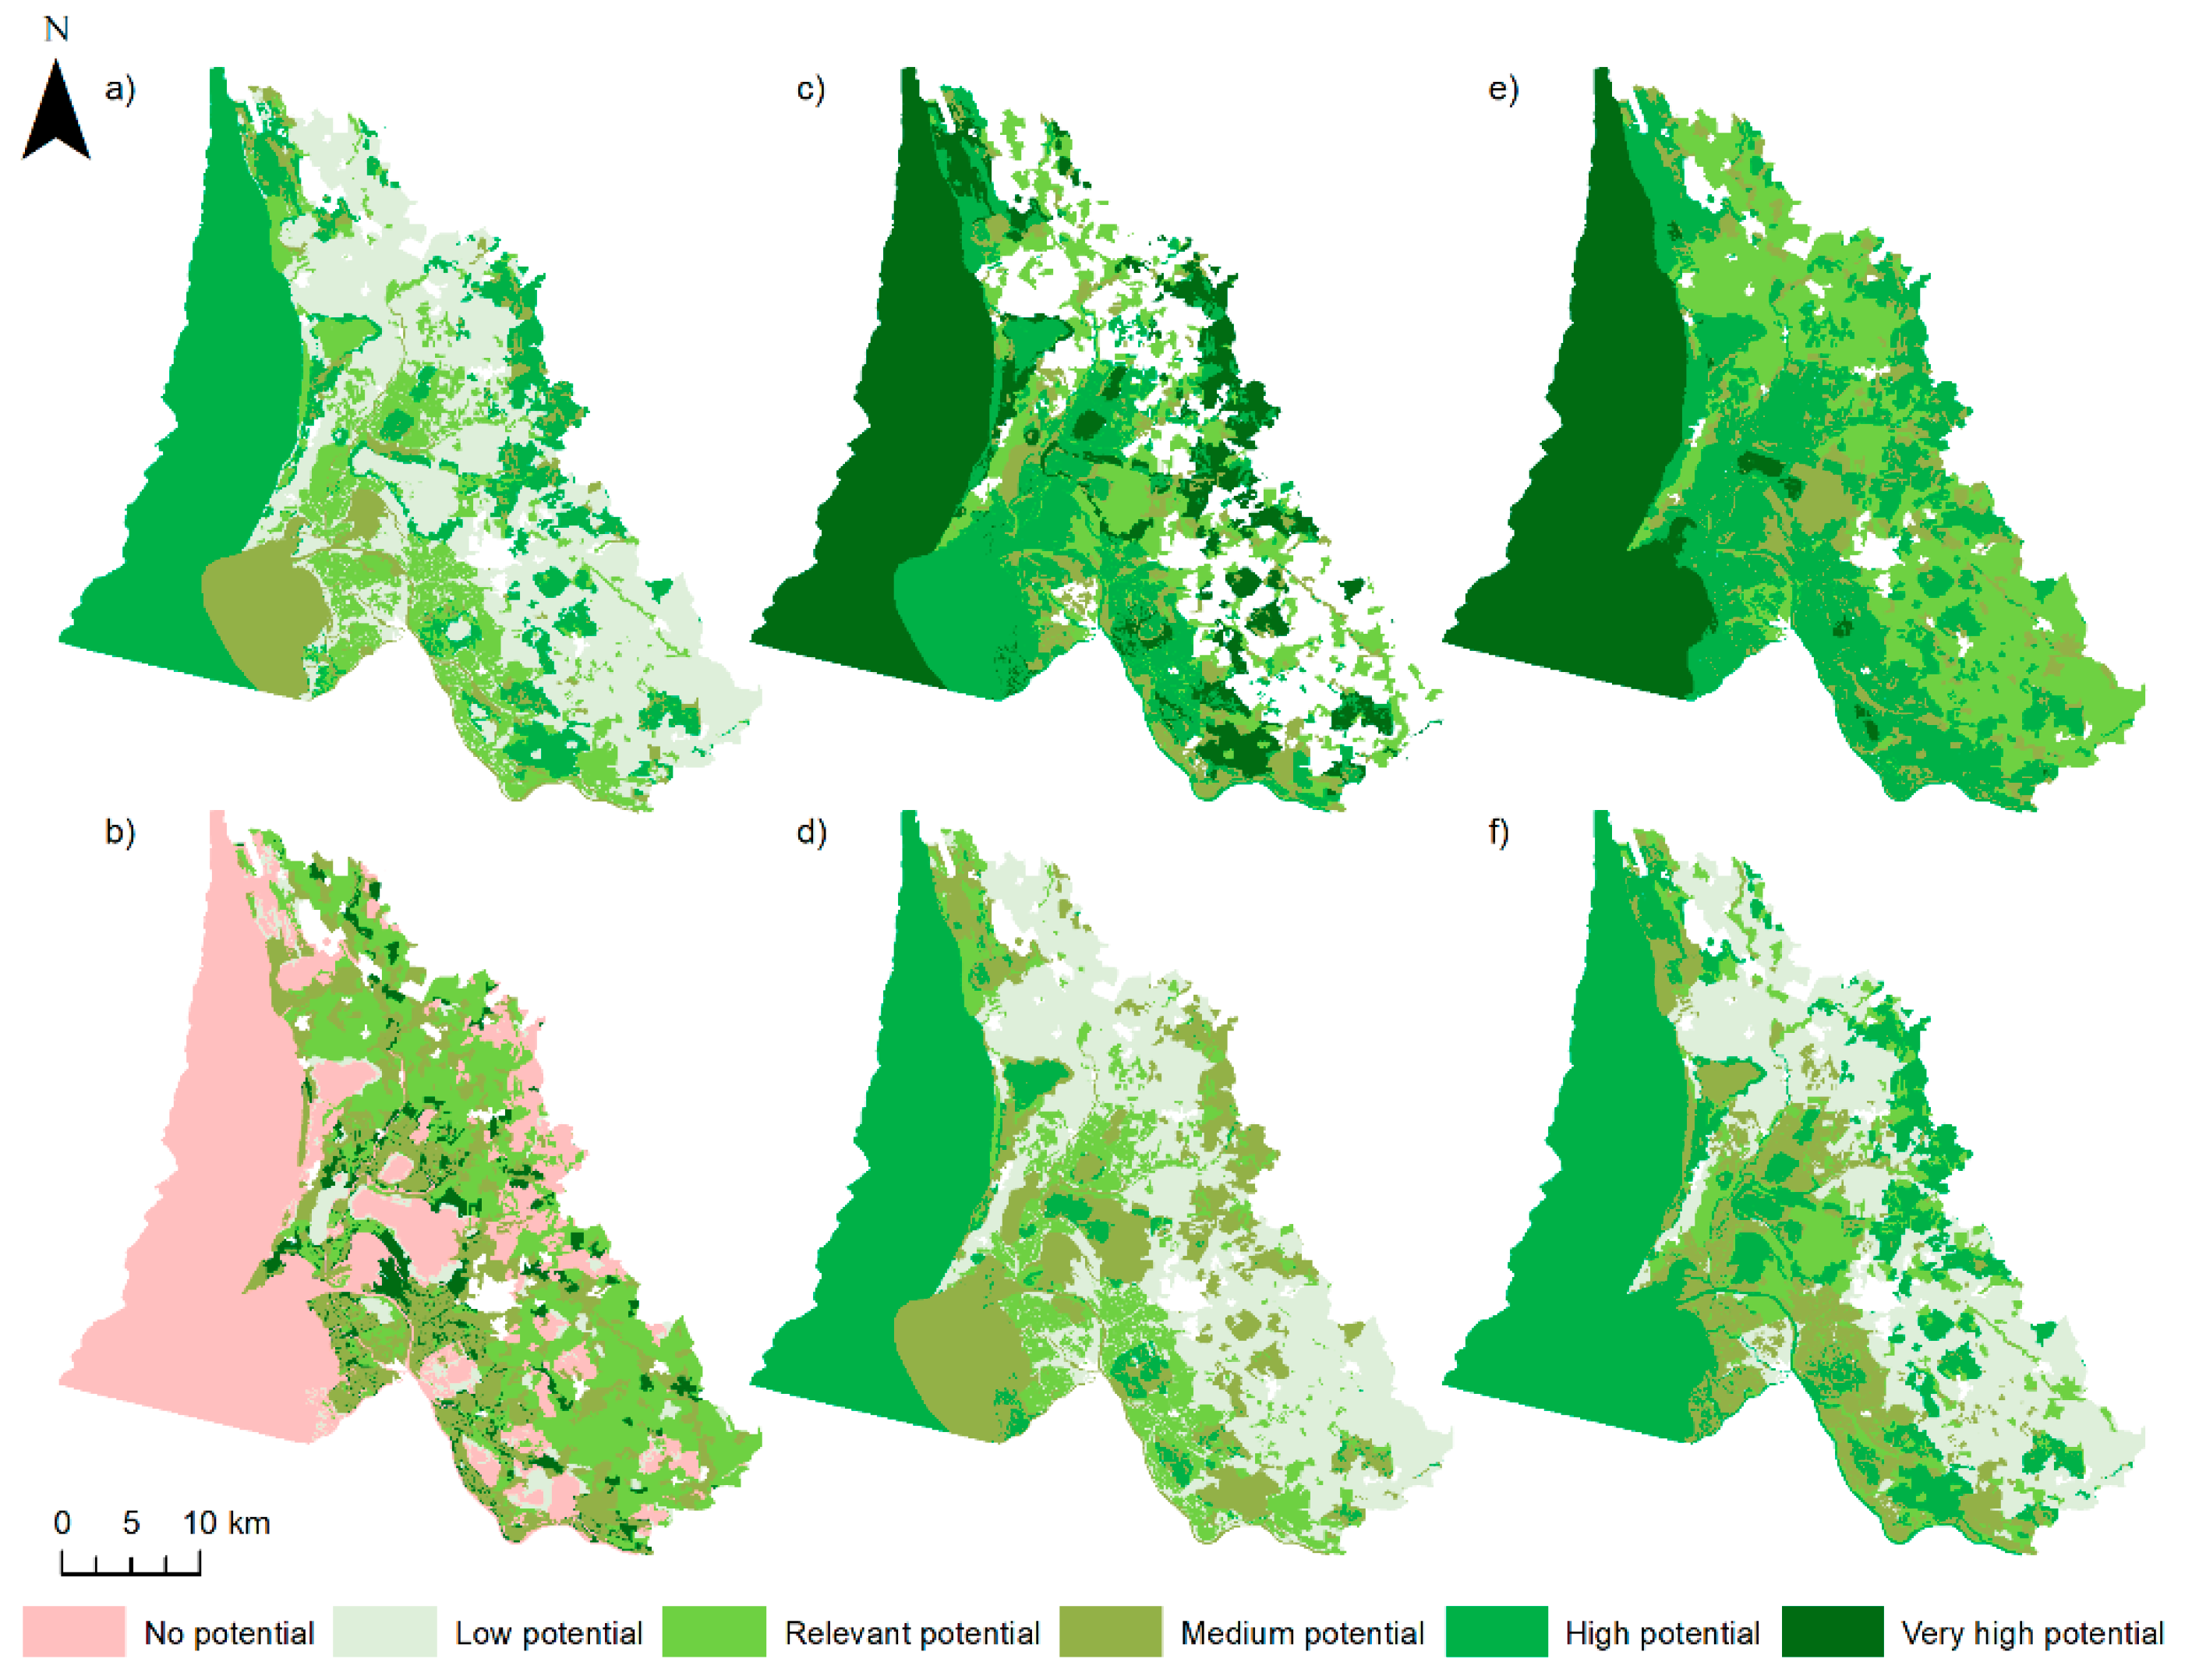
From the list of 34 ES provided for expert scoring, 27 to 33 services were identified for each land cover class (Table 2). All ES categories had at least some scores of very high potential. Mineral extraction sites had an exceptionally low number of identified ES (18). In the regulation and maintenance category, the service RM 7 (CICES 2.2.2.3), i.e., maintaining nursery populations and habitats (including gene pool protection), had the most frequent highest potential scoring of 4–5 (Table 2). High potential was also identified in the regulation of air and water quality, RM 11 (CICES 2.2.6.1), as well as regulating temperature and humidity, RM 12 (CICES 2.2.6.2). Most of the provisioning services were assessed as having low potential; their highest potential was found only in the specific land cover territories, e.g., aquaculture ponds and pastures (Figure 2b). In the cultural ES category, the highest scores were given for the potential characteristics of living systems that enable scientific investigation or the creation of traditional ecological knowledge, C3 (CICES 3.1.2.1). Experts decided that they could potentially derive scientific knowledge (C3) from all land classes (Figure 2e) and that, in most of them, there was some potential for training and education (C4), as well as for the development of future ES potential (i.e., biodiversity elements with option or bequest values, C11). Characteristics of living systems that are resonant in terms of culture or heritage, C5 (CICES 3.1.2.3), had the lowest potential in the cultural ES category, with a potential scoring from 0 to 3.
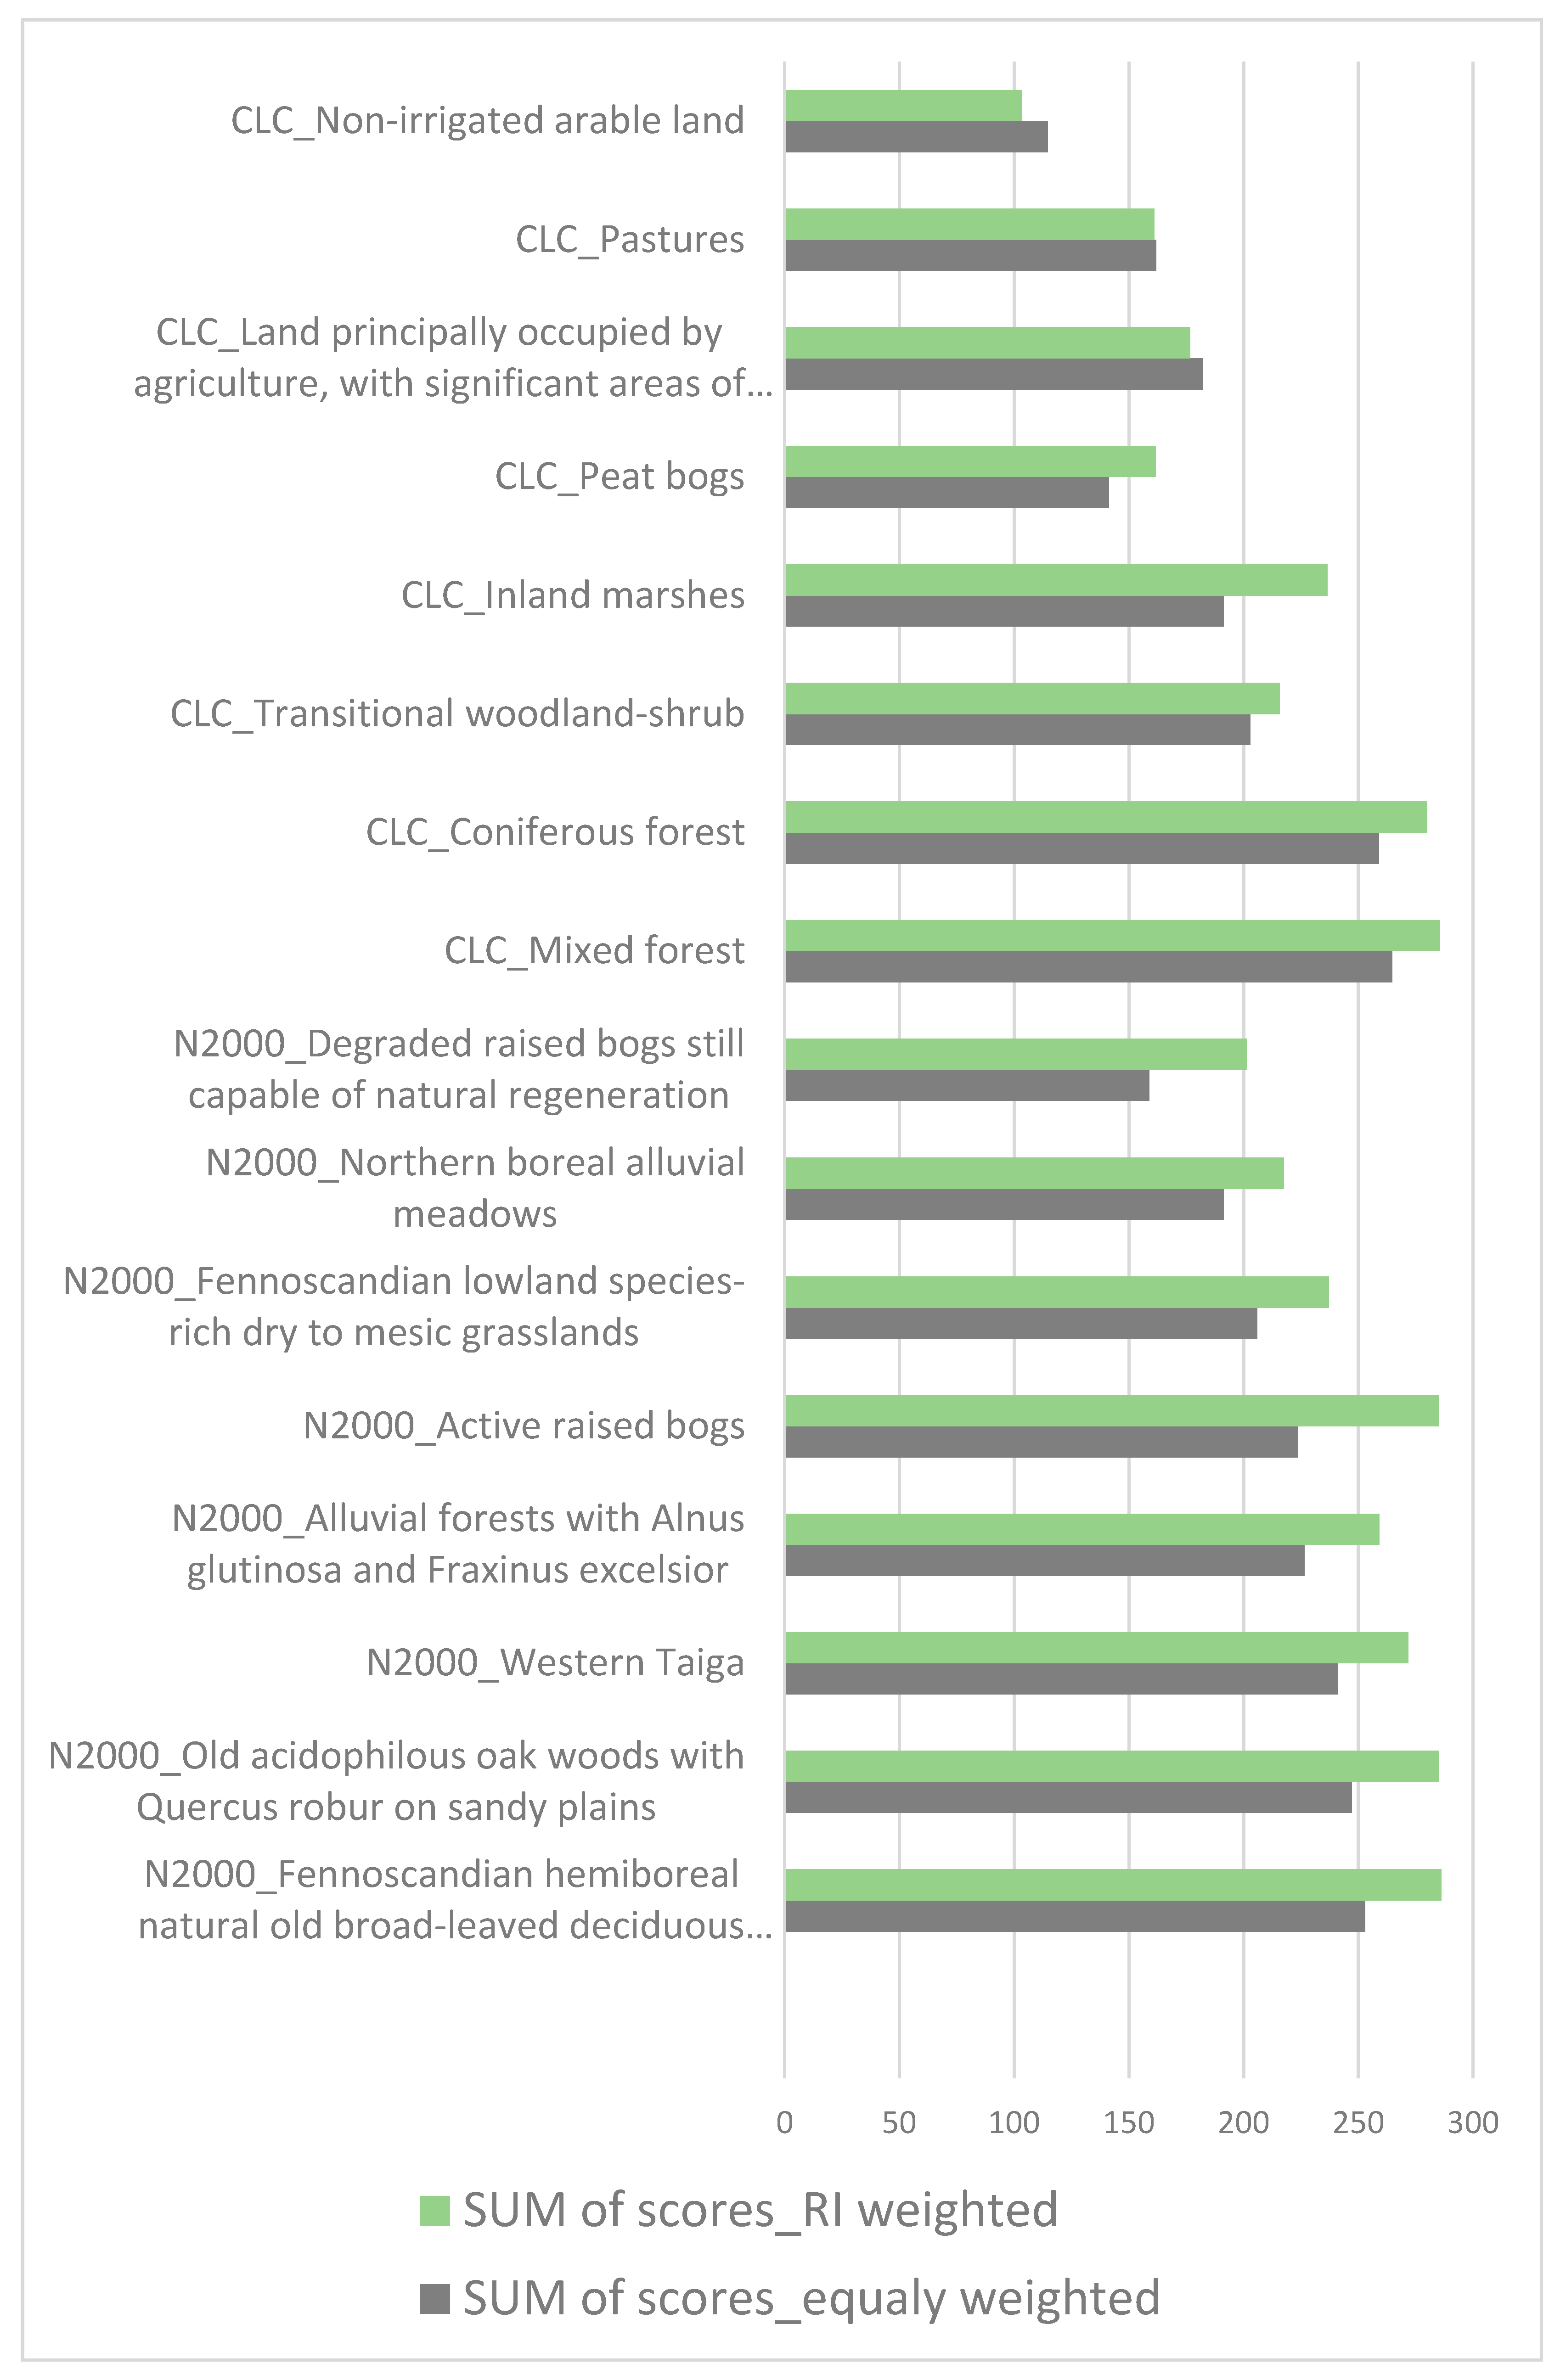
The land cover class ranking, using the total ES potential, is presented in Figure A1 (Appendix A). All the forest classes from the CORINE classification obtained the highest ES potential. Many other forest types from the Natura 2000 classification had a slightly lower sum of scores; however, if RI was assumed, Natura and CLC forests had equal total ES potential. Other congeneric land classes, such as CLC peat bogs vs. Natura 2000 active raised bogs, or pasture vs. natural grassland, had substantially lower total ES potential. Most land cover classes with typical provisioning services potential had lower total ES potential scores (agricultural land, fruit and berry plantations, other complex cultivation areas and pastures). In these areas, the total ES potential assuming RI was lower than the total ES potential, assuming an equal contribution of all ES (Figure A1).

3.2. Associations between ES

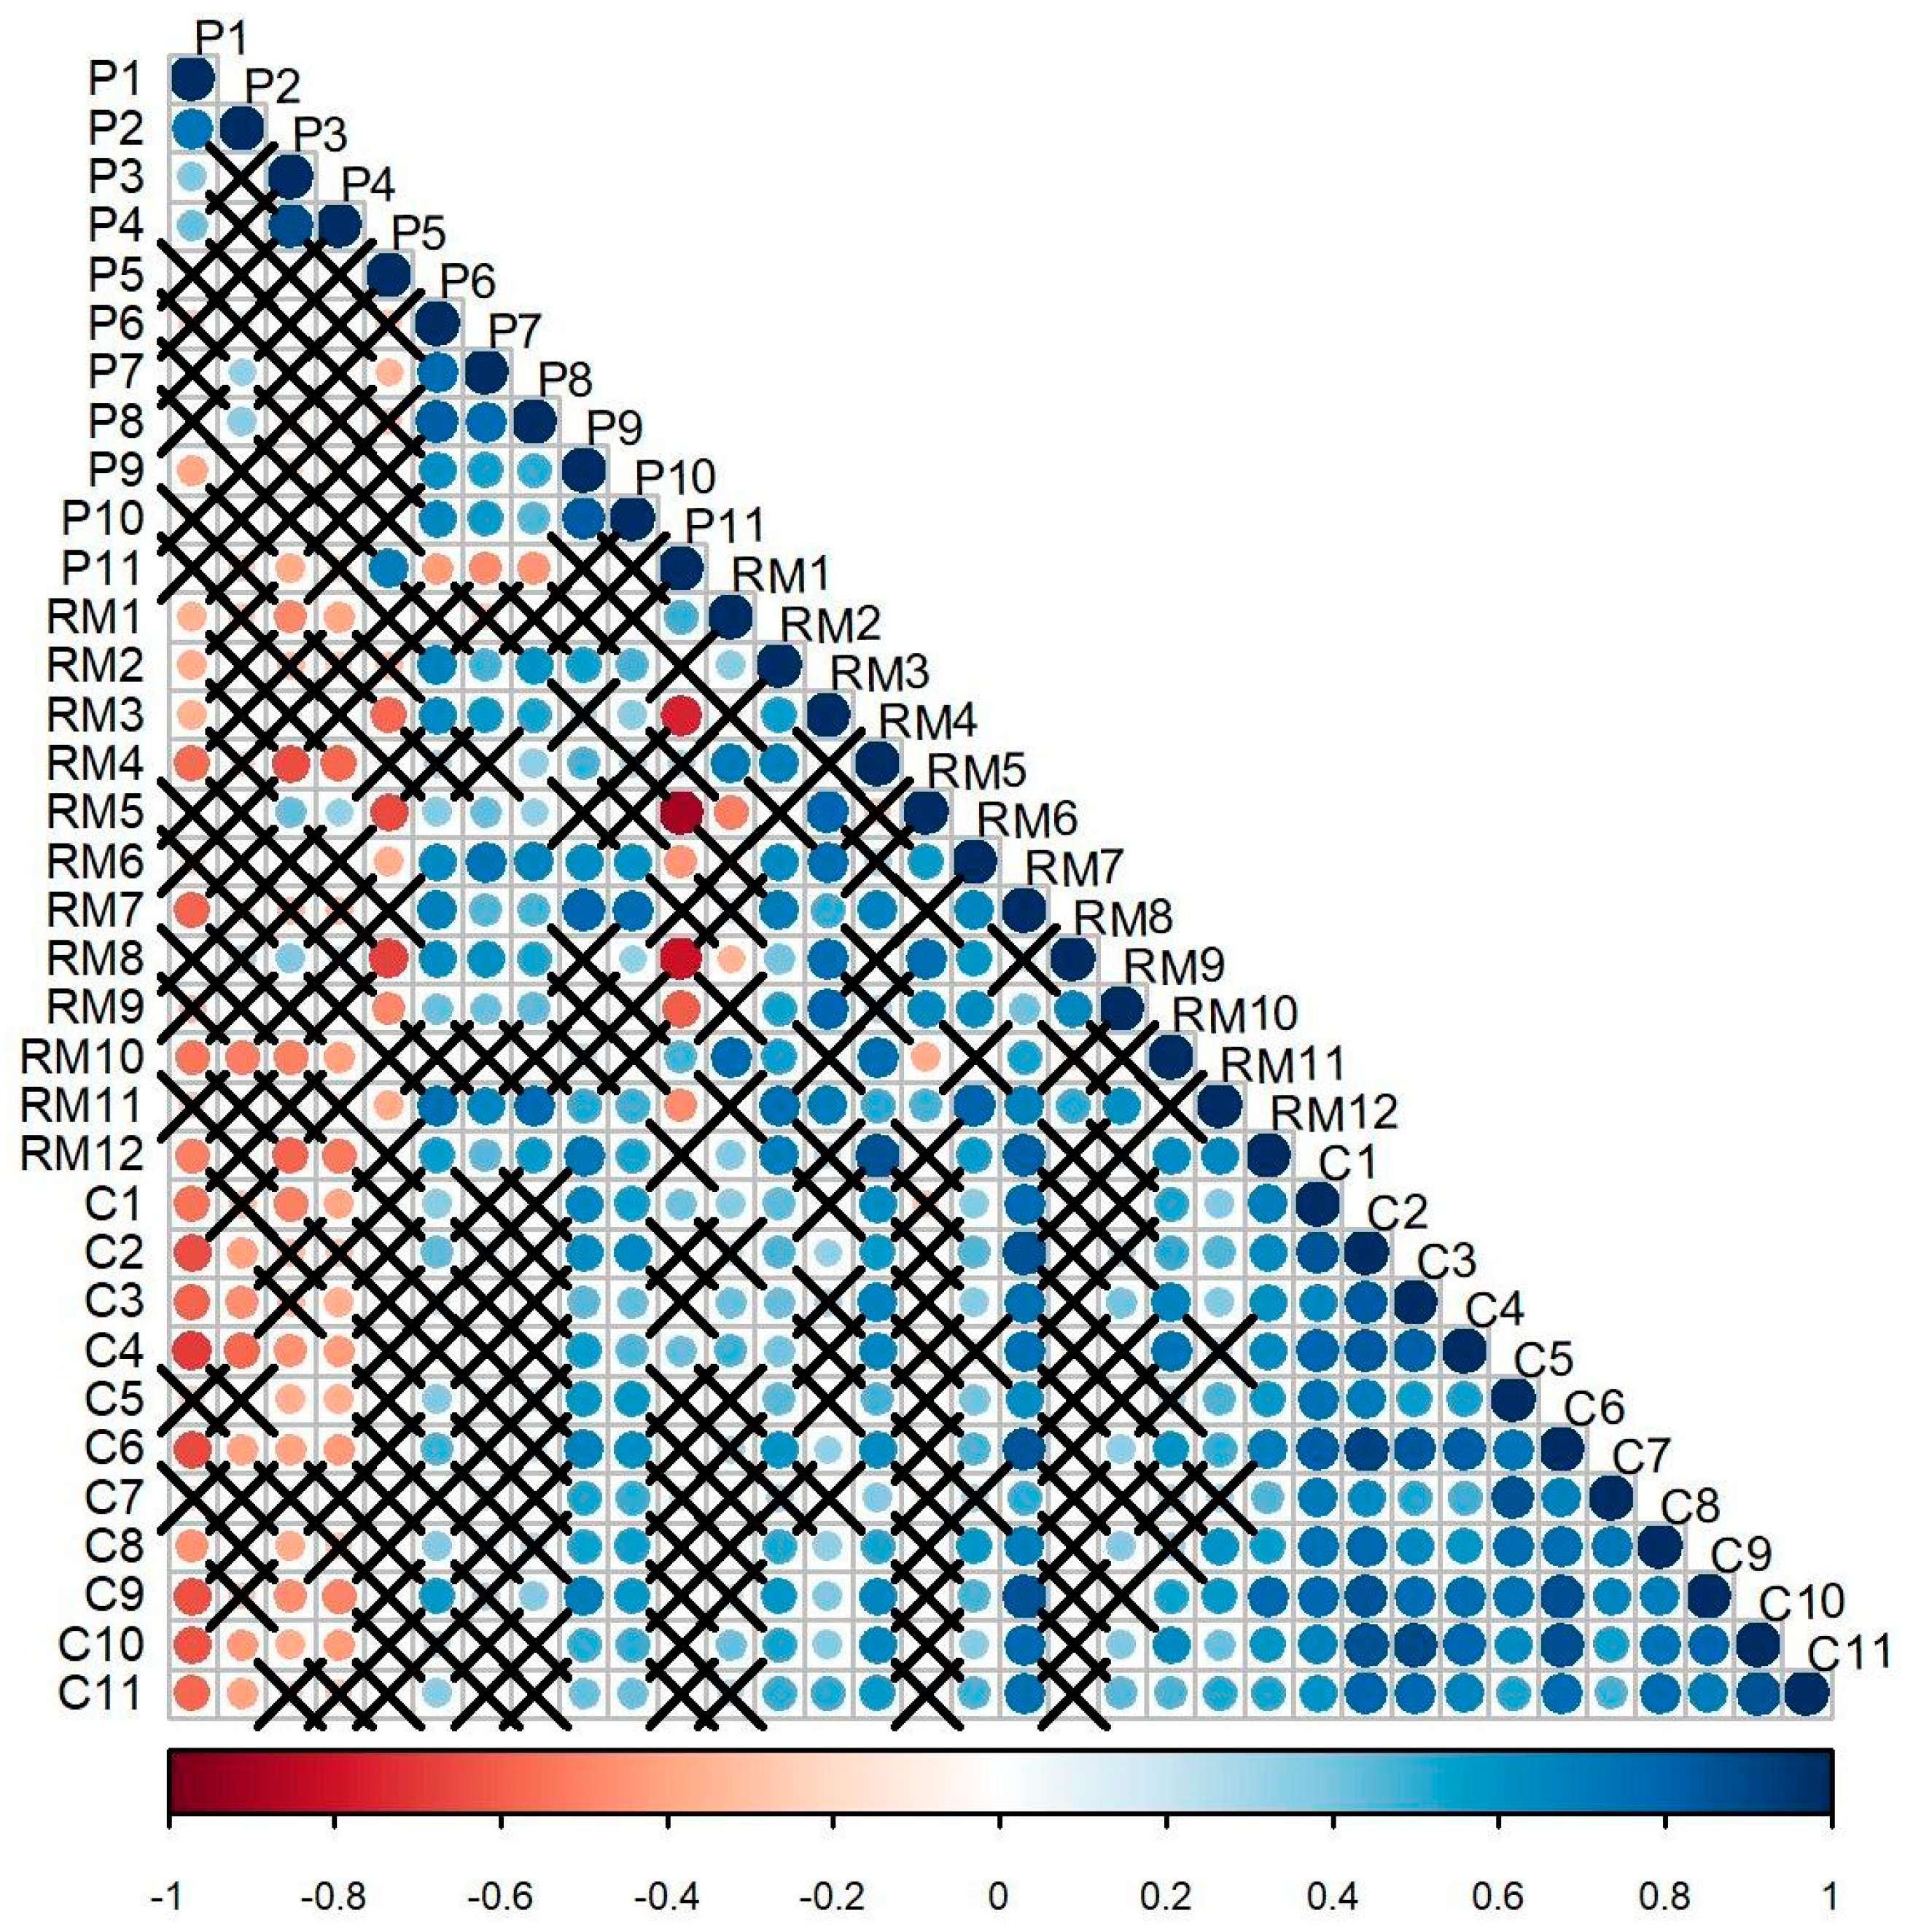
Interplay between the ES scores was illustrated by correlation and PCA analyses (Figure 3 and Figure 4). The correlation between the provisioning services, P1–5, and most of the regulation and maintenance services, RM1–12, and cultural services, C1–C11, was either negative or non-significant. However, provisioning services derived from wild resources, P6–10, and all regulation and maintenance services and cultural services correlated positively. The high number of significant positive correlations among cultural ecosystem services (Figure 4) strongly indicates common features of natural landscapes having a high capacity to meet multiple spiritual, cognitive and recreational needs of people.
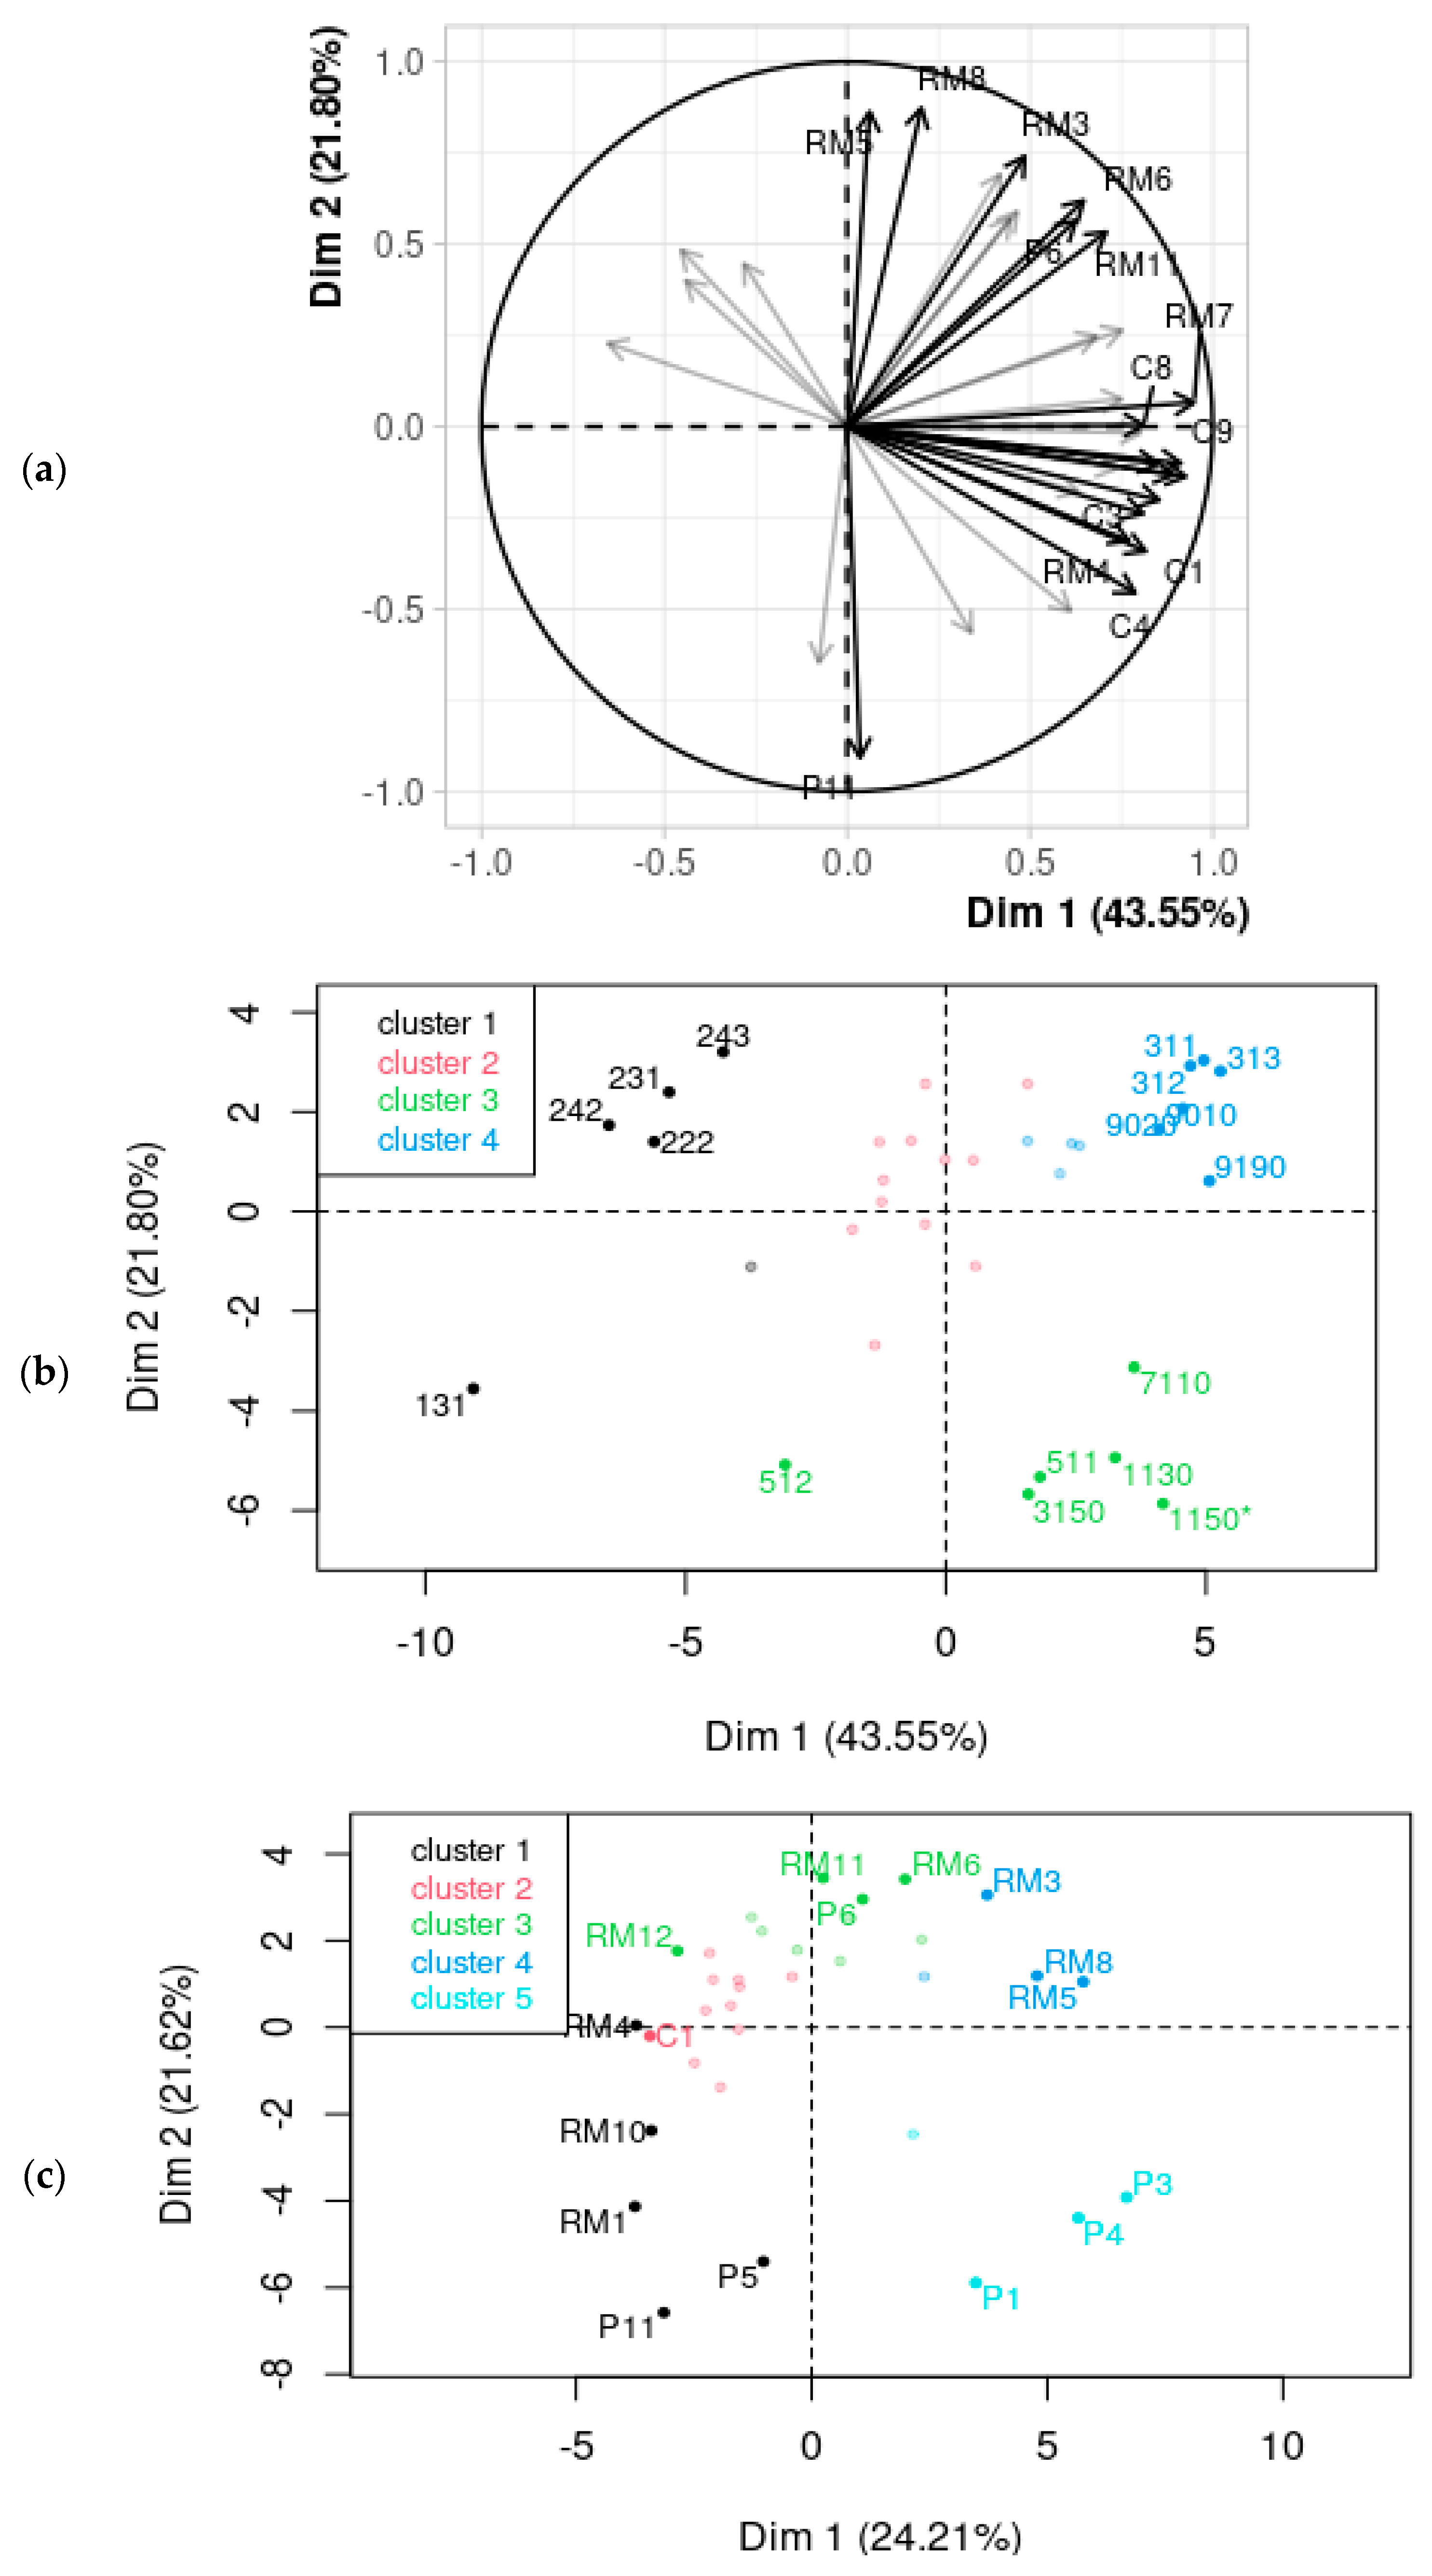
The PCA showed strong relationships between ES and the clustering of land cover classes sharing similar trends of ES scores (Figure 4a,b). The first two dimensions of the PCA expressed 65.35% of the total dataset inertia. This percentage was relatively high and thus the first plane well represented the data variability. The habitat provision service (RM7) was highly correlated with dimension 1 (correlation of 0.9). Forested land use classes such as 9020, 9010, 311, 312, 313 and 9190 (cluster 4) had a strongly positive coordinate on the dimension 1 axis, this indicating a high habitat provision service potential (RM7). However, agricultural land use classes such as 211, 131, 242, 222, 243 and 231 (cluster 1) were characterized by a strongly negative coordinate on the dimension 1 axis, i.e., they had low habitat provision potential. Cluster 2 was composed of land use classes sharing high values for pollination (RM5) and control of erosion rates (RM3). It included all types of meadows and natural and semi-natural grasslands. Cluster 3 was strongly differentiated from the other three clusters by a strong negative coordinate on the dimension 2 axis. The group included aquatic habitats and water courses (3150, 1150, 1130, 511, 512 and 7110), these sharing high values for the specific set of ecosystem services (P11, RM10, RM1, C4, P5, C3, RM4, C1 and C10).
PCA analyses of the reverse matrix, i.e., analyzing land use classes as variables, showed a less pronounced relationship. The first two dimensions of analyses expressed a medium–high rate of 45.84% of the total dataset inertia. The classification of individual ES revealed five clusters (Figure 4c). If the cluster could be defined as a bundle of ES, it could be seen that cultural ecosystem services contributed only a little in explaining the differentiation among land use classes and were not highly mixed in clusters. Characteristics of living systems that enable active or immersive interaction with nature, C1 (CICES 3.1.1.1), were most differentiated among the land use classes. The highest C1 scores, in cluster 2 (Figure 4c), were typical at Natura 2000 sites (2180, 9190, 1130, 2330, 7110, 1150, 3150 and CORINE water courses 511, sorted from the strongest).
As already clarified, there was a well-differentiated bundle of RM3, RM5 and RM8 erosion control (cluster 4, Figure 4c), i.e., pollination and effect on soil formation processes, respectively, that is typical for Natura 2000 meadows and CORINE natural grassland. Other regulation and maintenance ES had less pronounced consistent associations among land use classes (clusters 1 and 3, Figure 4c).

3.3. Spatial Pattern of Ecosystem Services Potential

ES potentials based on territorial size in the study area are presented in Figure A2 (Appendix A). Provisioning services had no relevant potential or low potential in a large proportion of the territory as they were mainly restricted to agricultural areas or forests (not Natura 2000). For example, maintaining nursery populations and habitats (RM7) had very high potential only within almost 20% of all the study territory. In 60–80% of the territory, seven cultural ES had relevant to high or very high potential (scores 2–5), such as passive enjoyment (C2), scientific research (C3), education (C4), aesthetic experiences (C6), representation value (C9), existence value (C10) and option and bequest value (C11). More than 30% of the territory had very high potential for characteristics of living systems that enable scientific investigation or the creation of traditional ecological knowledge (C3). Cultural ES related to culture and heritage (C5), having symbolic (C7) or religious meaning (C8), were less frequently identified in the territory with only relevant or medium potential and had no or low potential in 50% of the investigated area. The listed ES with lower potential scores also tended to have lower RI values (Table 2), i.e., lower weights in their average ES potential score.
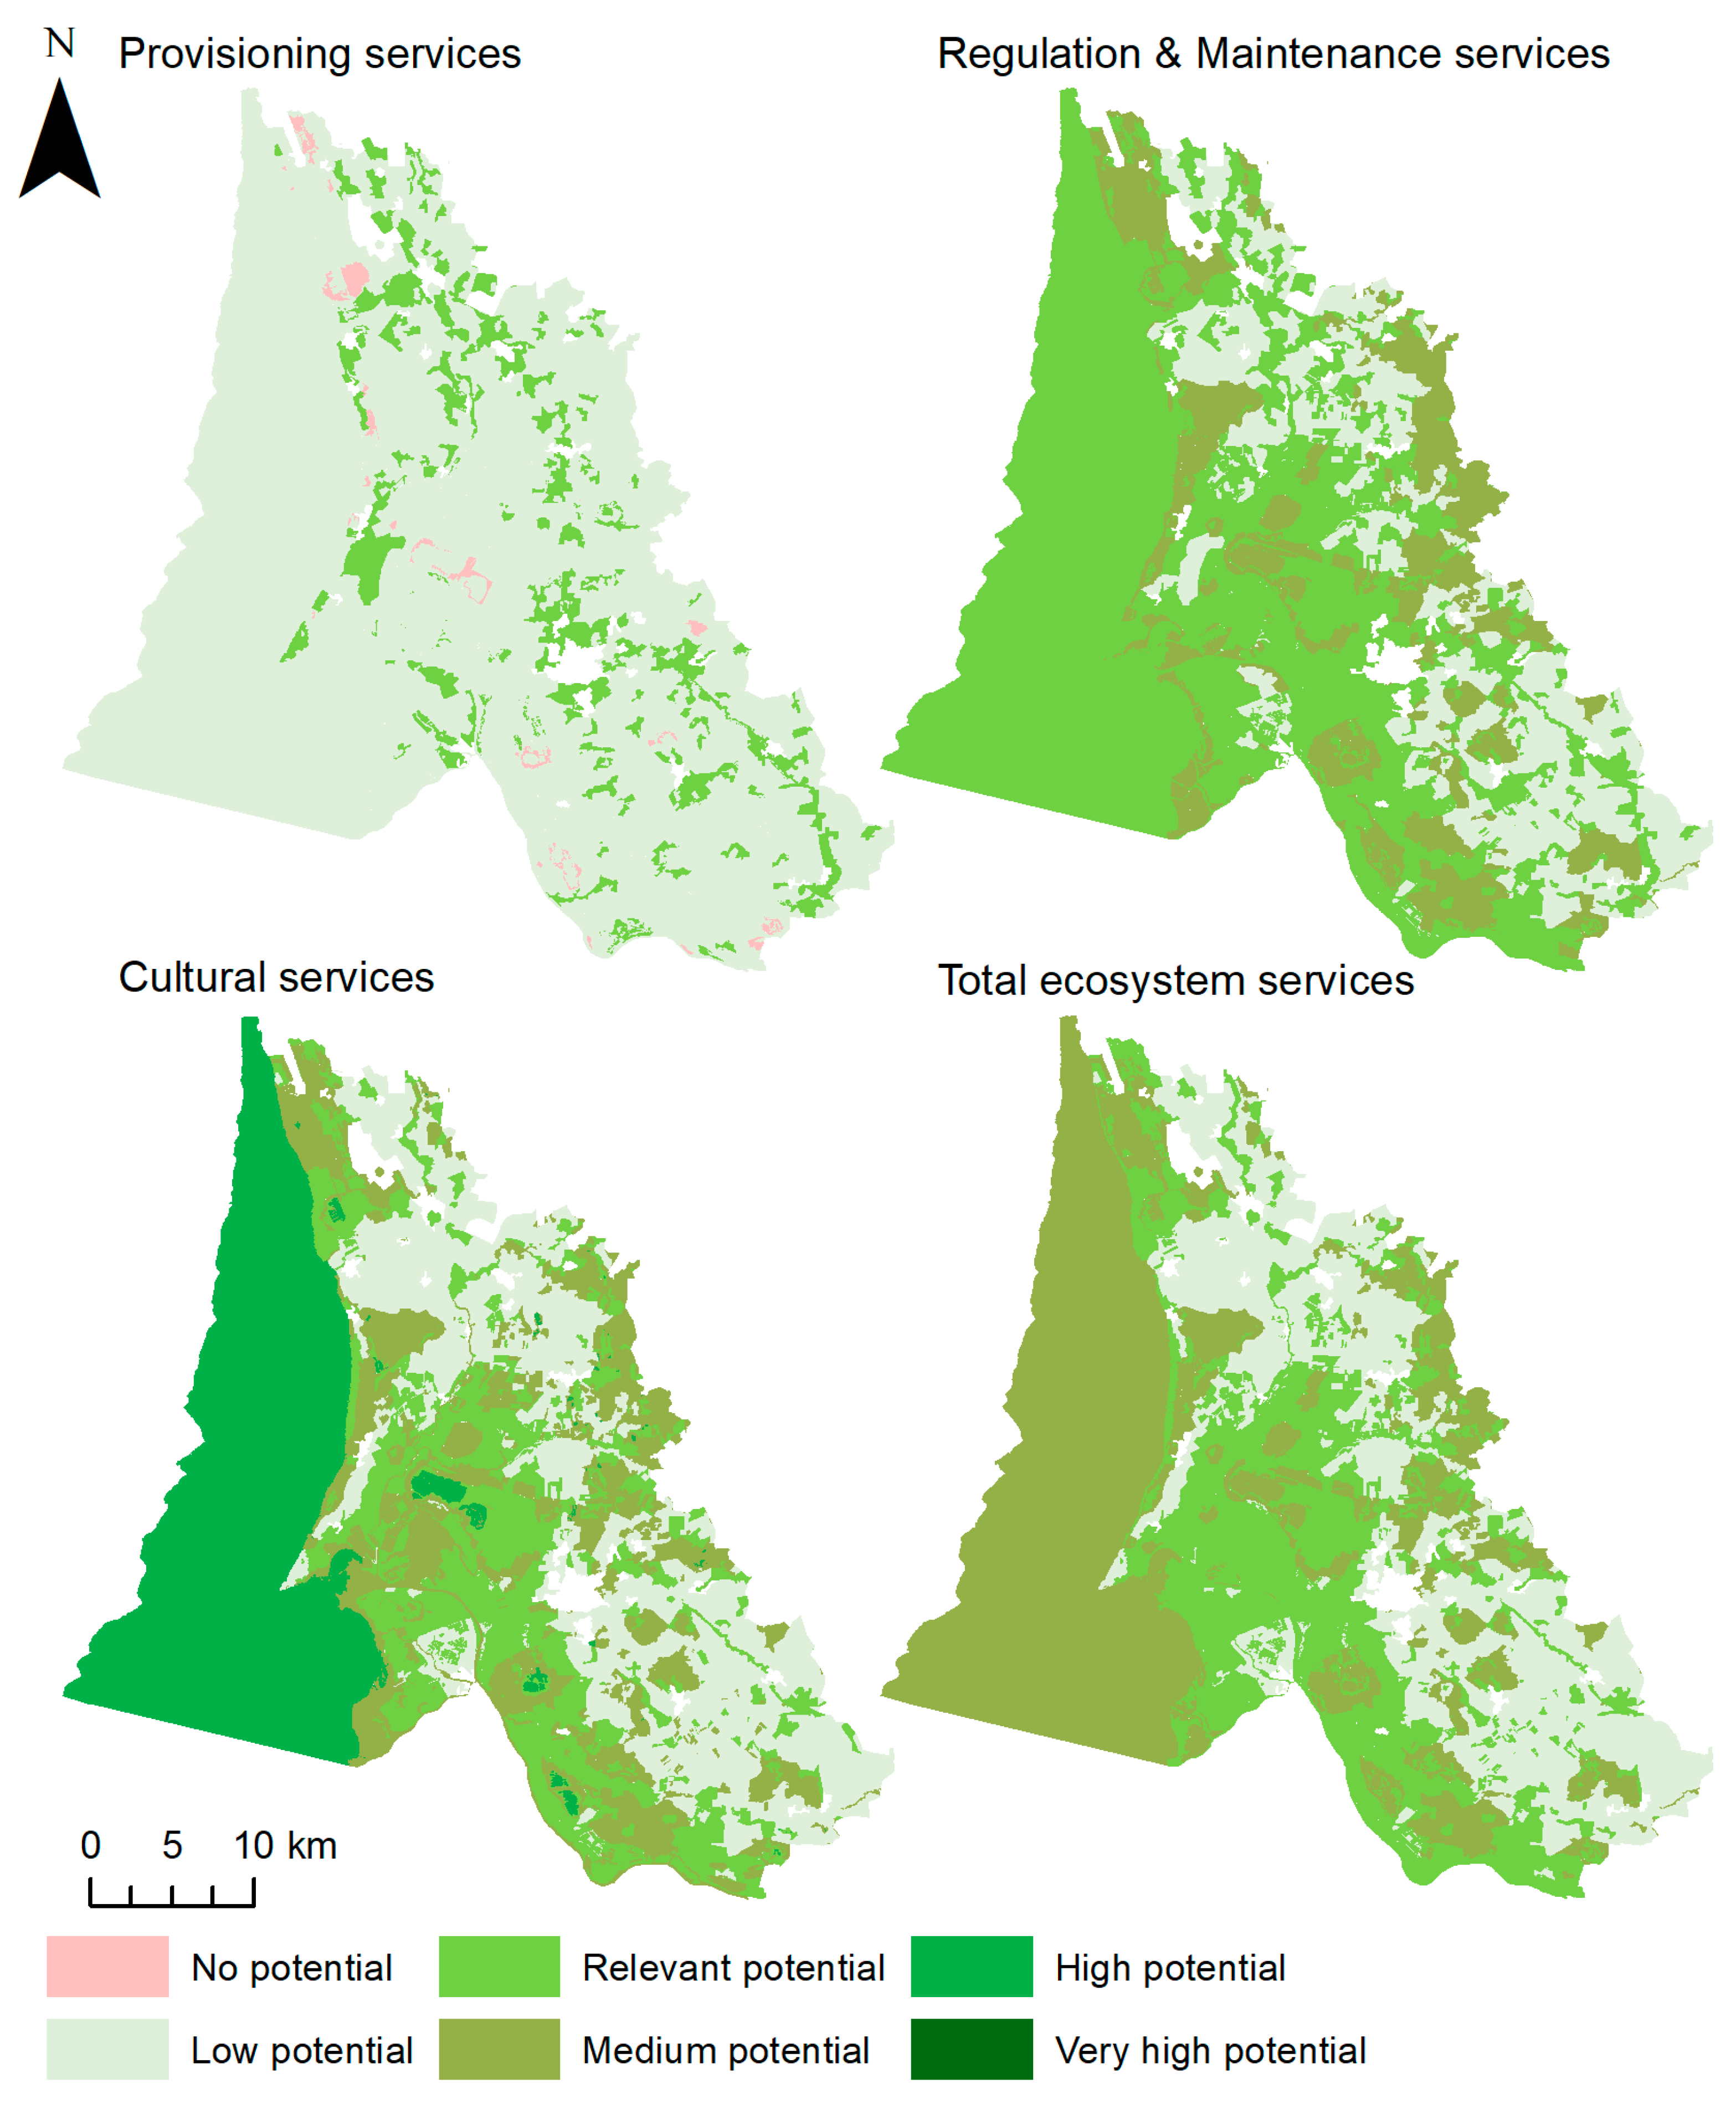
Assuming the relative importance of the ES, the average weighted ES potential values in each land cover class were calculated and mapped to visualize the spatial distribution of the mean ES potential in the three main ES categories—provisioning, regulation and maintenance and cultural (Figure 5). The maps show that areas with relevant provisioning services potential were generally distributed in the two land cover classes, namely complex cultivation patterns and land principally occupied by agriculture, with significant areas of natural vegetation, and CORINE water bodies (such as aquaculture ponds). This mosaic landscape provides a higher diversity and slightly higher overall potential of provisioning ES than arable land, pasture or even forest (Figure 5). The coastal area has potential for regulation and maintenance as well as cultural ES. The cultural services have the most diverse potential, varying from low relevant potential to high potential across the whole area.
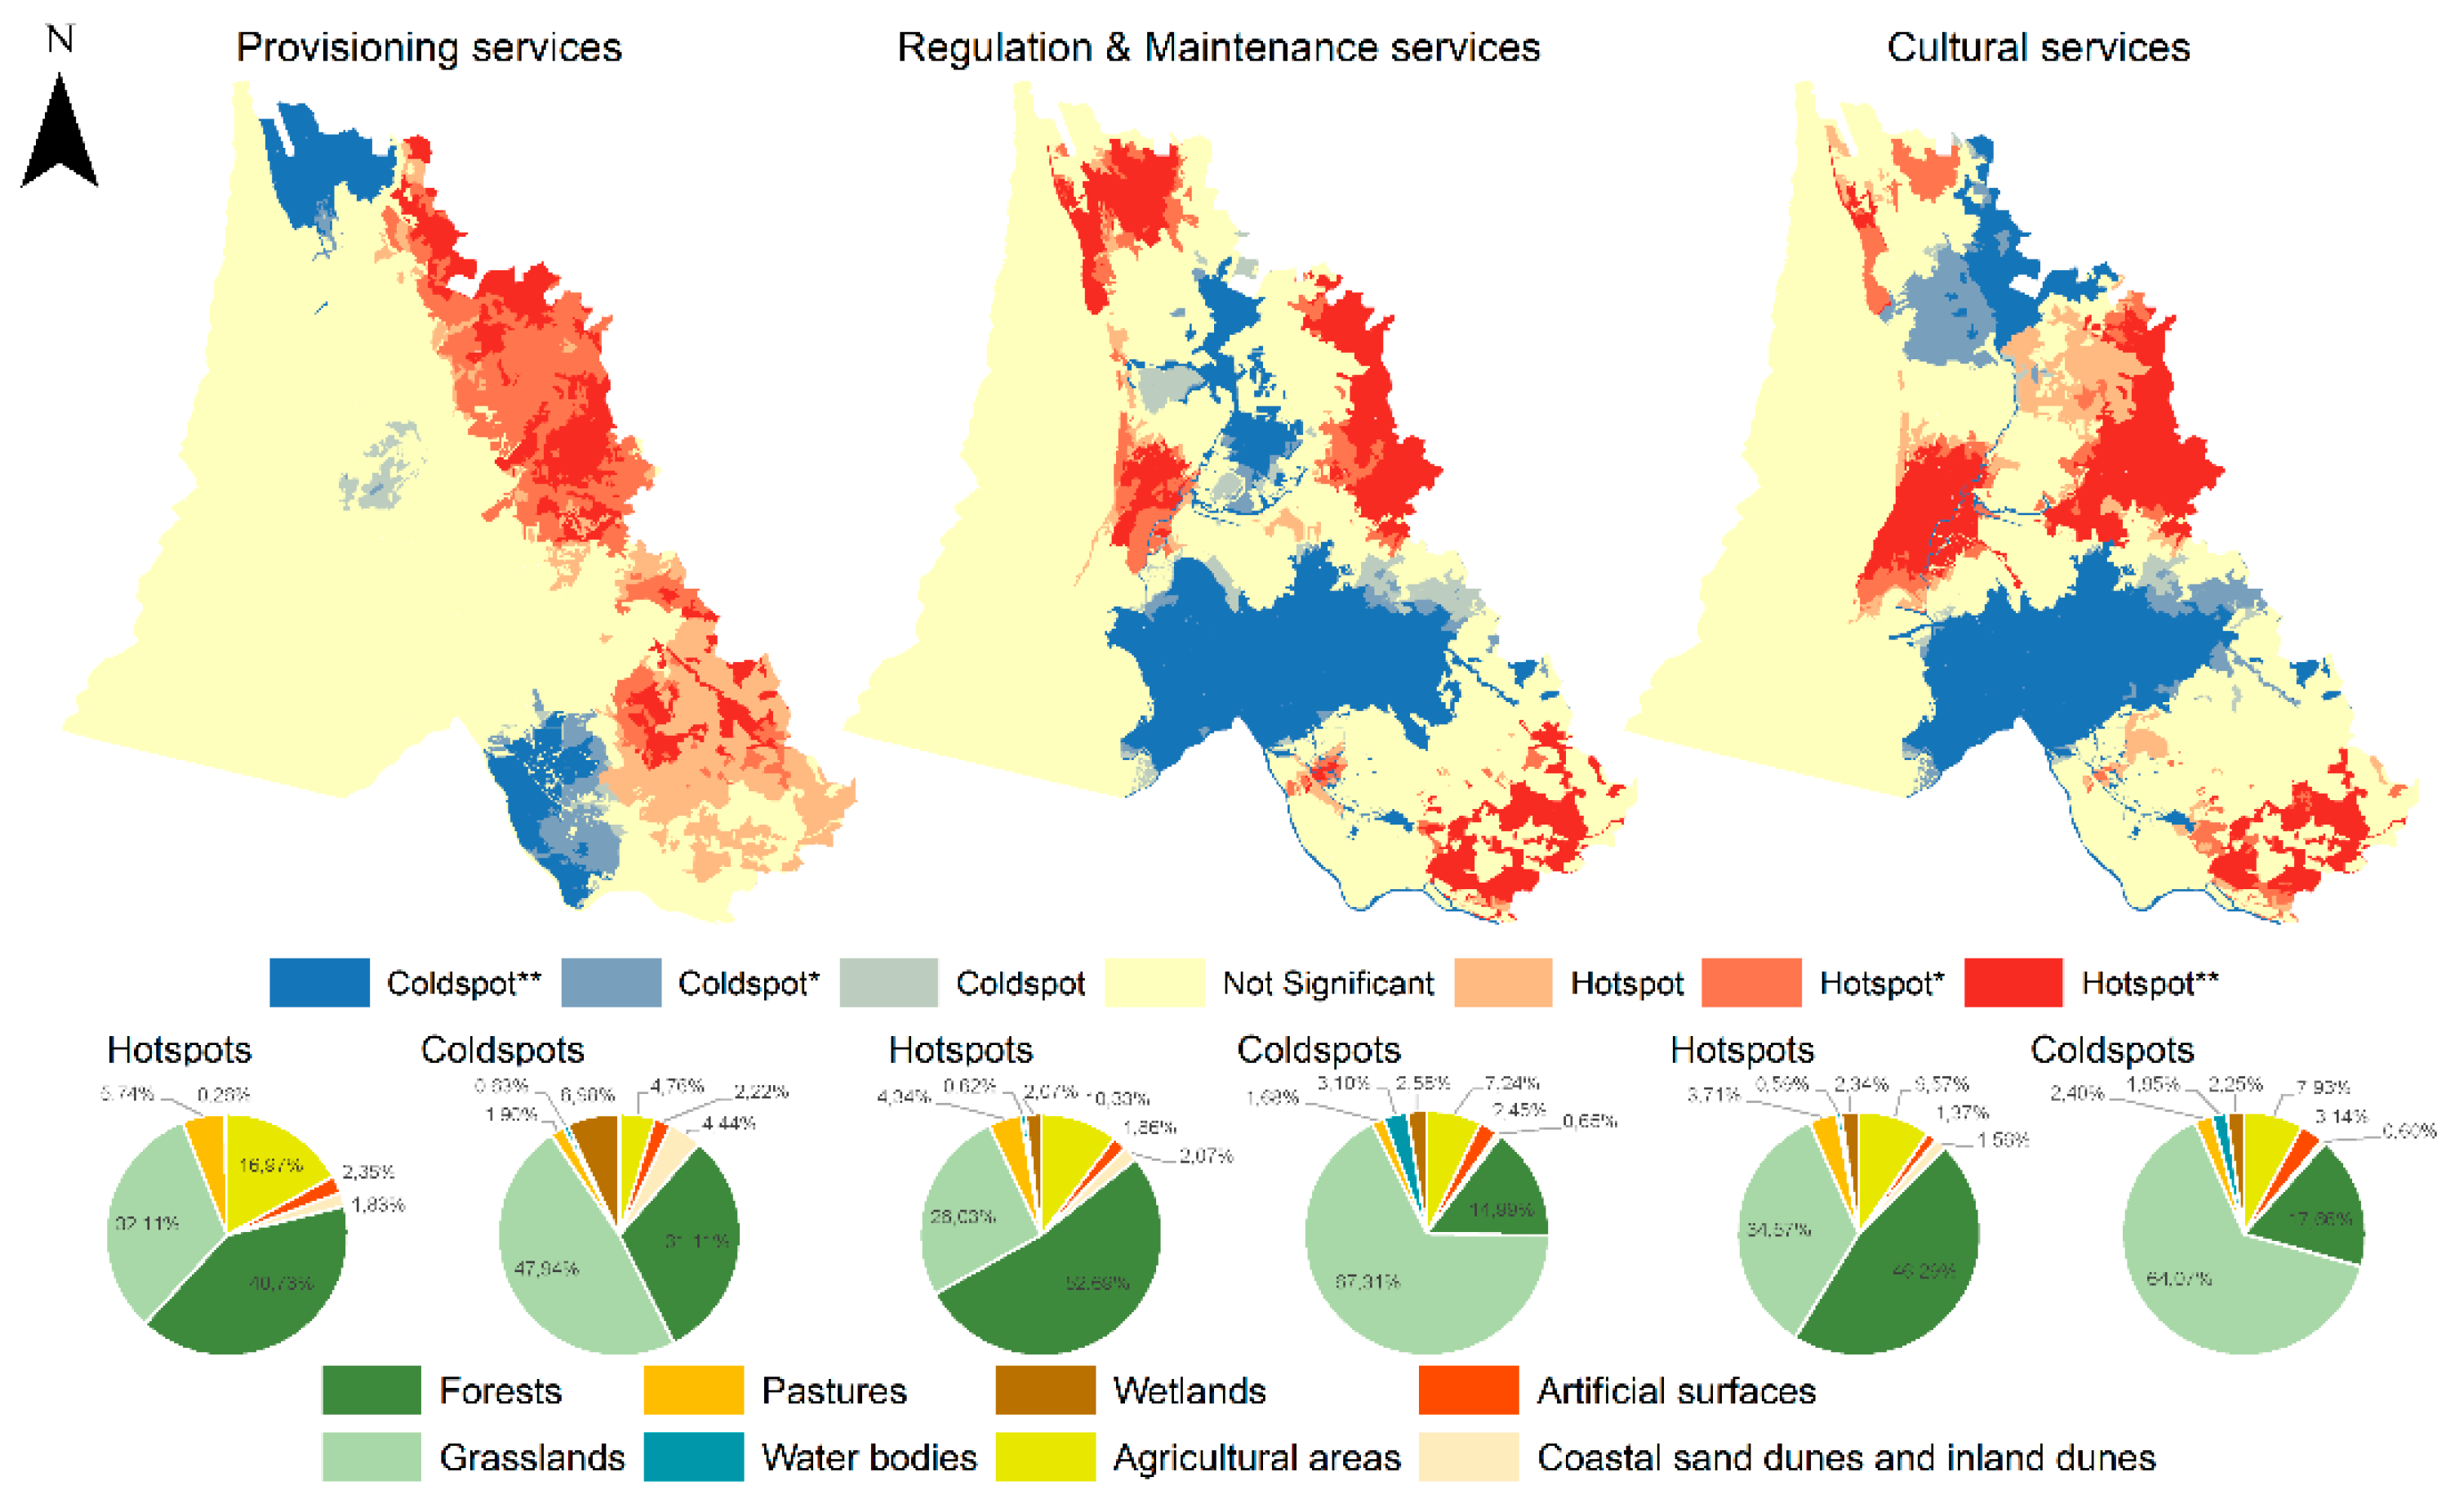
Using Gi * statistics, we identified hotspots and coldspots of ES potential for the three ES categories in the study site. Hotspots of provisioning, regulation and maintenance and cultural services covered 22.4%, 20.9% and 21.8% of the territory, respectively, and coldspots covered 11%, 26.4% and 27.9%, respectively (Figure 6). Both forests and grasslands dominated in hotspots and coldspots in the three ES categories, together covering from 73% to 81% in hotspots and from 79% to 82% in coldspots. Forests tended to dominate in hotspots, while grasslands dominated in coldspots. Agricultural areas and pastures had significant coverage (~20%) in hotspots of provisioning services. Wetlands were identified as a typical feature in the coldspots of provisioning services (7% and 0% wetland cover in coldspots and hotspots, respectively).
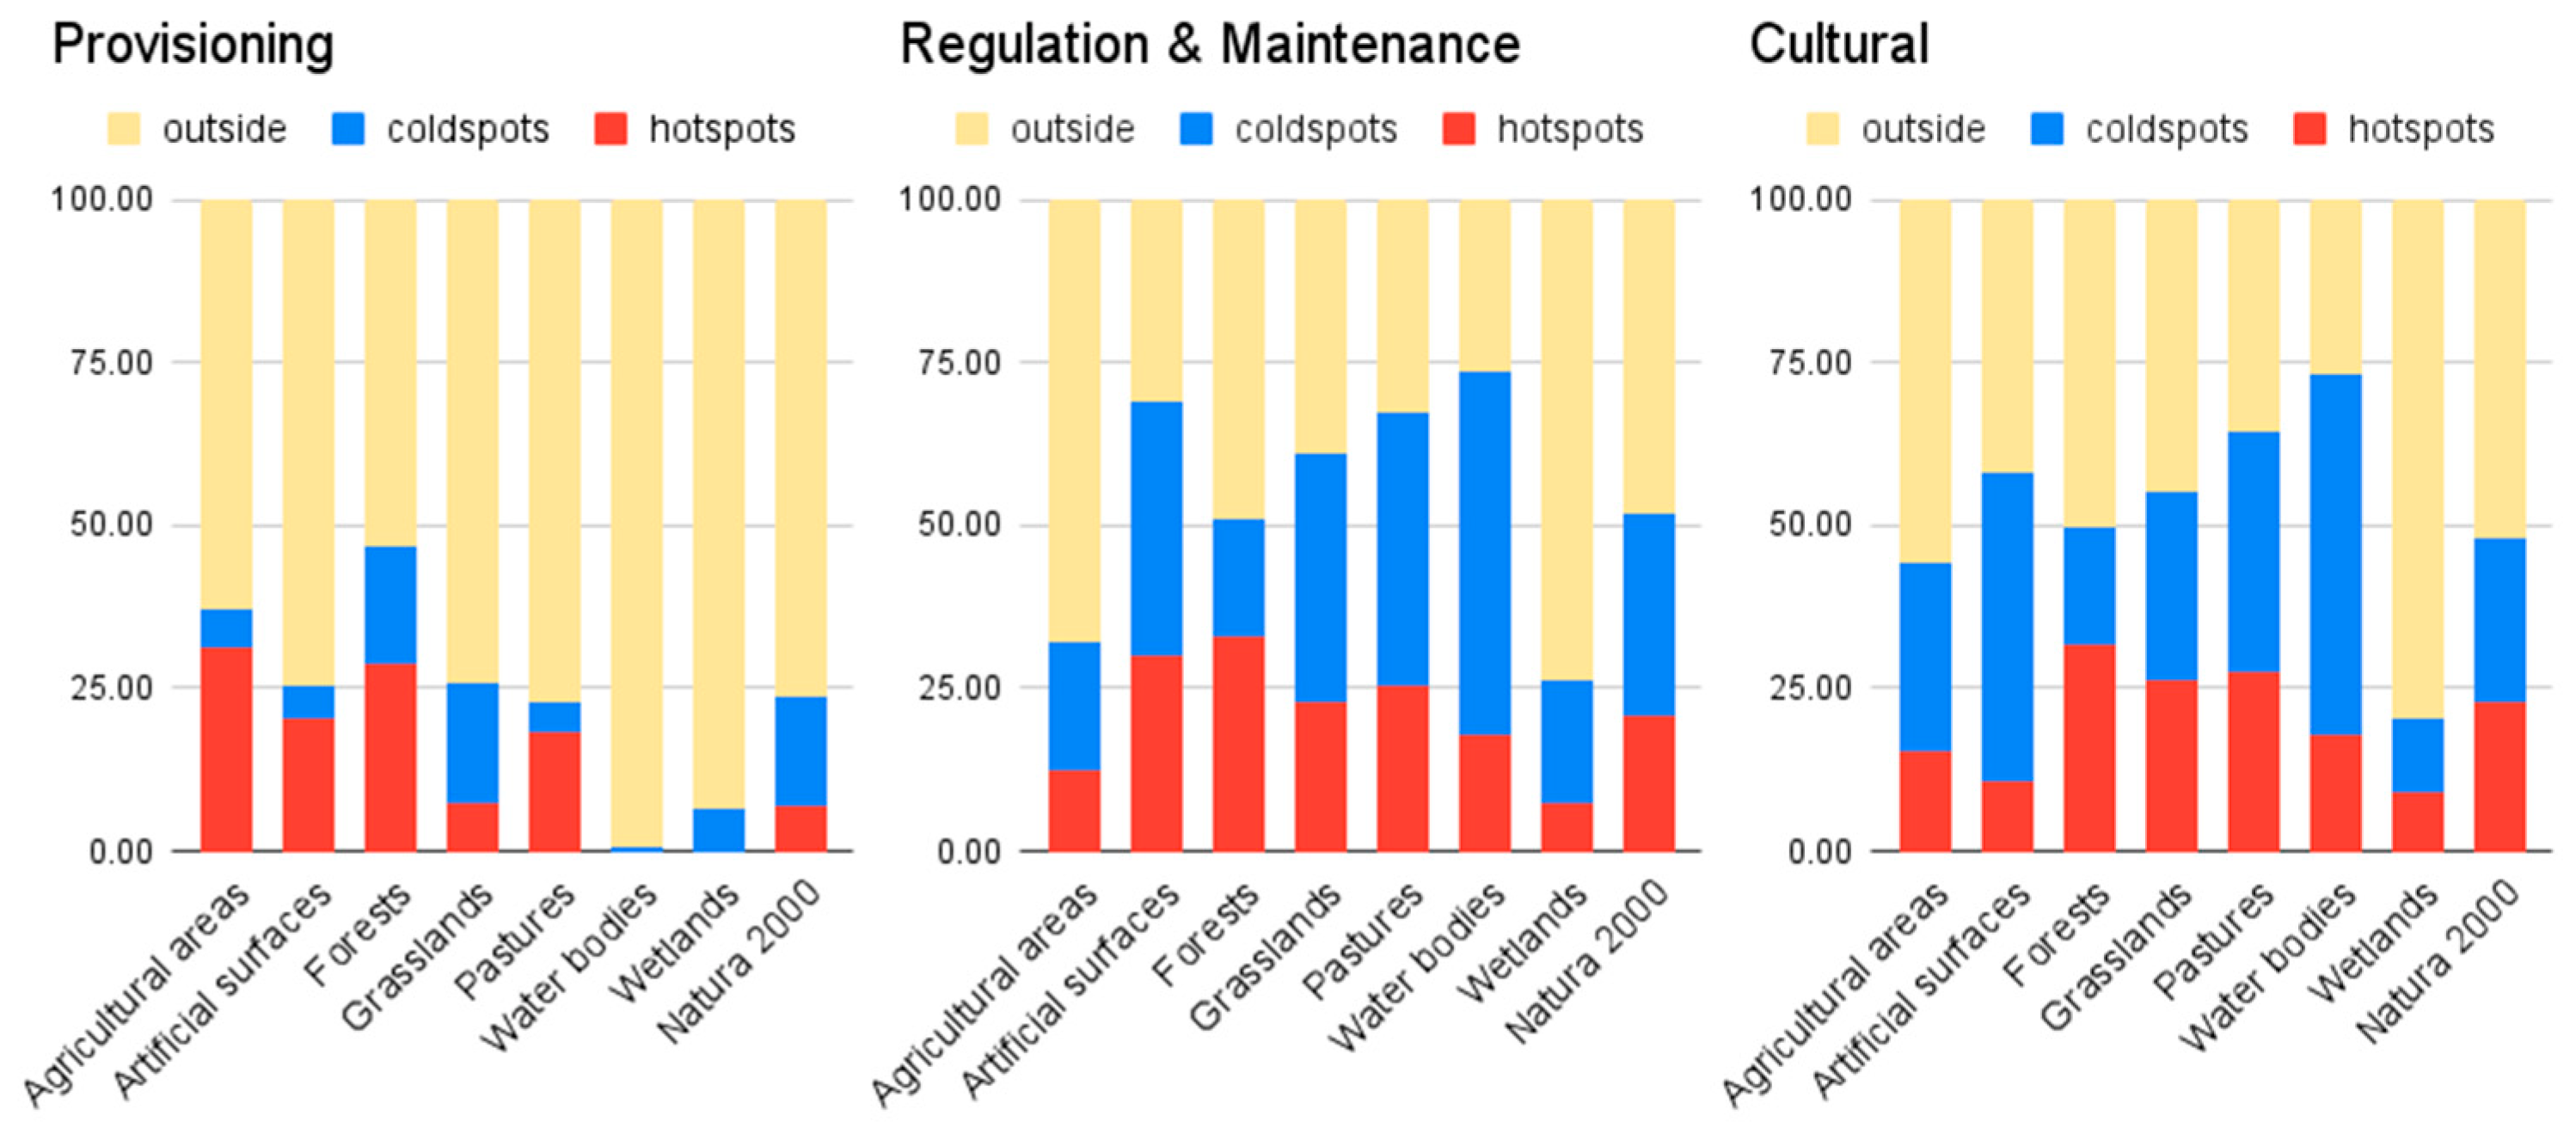
There were four overlapping hotspot areas of regulation and maintenance and cultural ES located around the forested areas (Figure 6). The dominance of grassland, the absence of forests and the somewhat higher coverage of water bodies resulted in the formation of a large coldspot of ES potential in the river delta area and the region centered on Šilute town and the Rusne Island area (Figure 6). In general, Natura 2000 areas only partially overlapped with hotspots of regulation and maintenance and cultural ES (Figure 7). A significant part of the Natura 2000 network area was within the coldspots of regulation and maintenance and cultural ES, this being 31.14% and 25.15%, respectively.

4. Discussion

This assessment revealed that the overall ES potential varies from low in agricultural areas to medium in natural areas. This and other studies show that the provision of regulation and maintenance services and cultural ES frequently is found in a bundle, while there is a trade-off between these two categories and provisioning ecosystem services in those areas with high provisioning services potential, i.e., agricultural areas, timber production areas, etc. [46]. Contributing significantly to the overall higher ES potential in natural areas and Natura 2000 sites than in the agricultural areas, the experts in our study particularly highlighted the potential of habitat provision as well as several cultural ES.
In the investigated region, restriction of land cultivation in the flooded areas basically limits agricultural land from spreading to the coastline and leaves space for semi-natural grassland, wetland or wet forest habitats. In the past, dominant policies and economic activities had significant effects on the coastal landscape [37]. Under the Soviet Union regime (1945–1990), flooded meadows with intrinsically low potential for provisioning services were converted into cultivated grassland and thus drained, fertilized and harvested up to four times annually to produce grass meal. The collapse of this policy, the extensification of farming and the establishment of protected areas have resulted in the naturalization of the floodplain [47]. These territories have high potential for habitat provision, the regulation of air and water quality and the regulation of temperature and humidity. The dominant Natura 2000 site complex is natural and semi-natural grassland and shrubland formations (~19% of the area) in the Nemunas River floodplains, sharing high potential for erosion control and soil formation, as well as pollination services. Most of the grassland is located in the poldered areas; therefore, the grassland’s existence crucially depends on land use and on polder management, i.e., ground water table maintenance to access the area for mowing or grazing. Grazing by livestock maintains open habitats, essential for many bird species, whereas coastal fields also are important stop-over sites for migrating birds [11]. As elsewhere in Europe, these habitats have become endangered due to abandonment, the spread of weeds and succession to woodland, nitrogen deposition and other threats [48]. Measures to maintain the wet meadows include hydrological management, i.e., groundwater table maintenance in the polder channels, removal of shrubs and reeds, initiation of extensive grazing and late mowing.
The highest total ES potential in the studied area, as well as at the country scale, is estimated in the forests [31]. The main ES provided by forests are those of wood provision, water supply, erosion control, pollination, habitat protection, soil formation, climate regulation and recreation [49]. Compared to the country average (33.7%), forest coverage is relatively low in the terrestrial part of the investigated area (22%). According to historical satellite images of the studied area, a 4% increase in the forested areas could be observed during the 1984–2018 period, this including some shrubland converting into forest and the encroachment of larger forests onto adjacent sandy arable land [50]. Seven forests in the category of Natura 2000 Sites of Community Importance can be found in the area. All of them are important for habitat provision and biodiversity. Wet forests, particularly Fennoscandian deciduous swamp woods (9080), bog woodland (91D0) and alluvial forests with Alnus glutinosa and Fraxinus excelsior (91E0), have high potential for water flow regulation and mitigation of flood effects. Some provisioning services and cultural services hotspots can be found at a distance from the coast, around the largest forest areas beyond Natura 2000 sites. These include forests and mosaic landscapes, safe from flooding and suitable for traditional agriculture and potential farm tourism. A synergy of provisioning and cultural ES potential could be used to increase income and enhance the well-being of the rural communities.
In general, the cultural services have variable potential across the whole study area. The Curonian Lagoon, active raised bogs and old oakwoods with Quercus robur on sandy plains (Sites of Community Importance, 9190) had the highest overall potential of cultural ES. Although the fish provision service potential was still ranked as high in the lagoon, fisheries are no longer a dominant economic activity. It is still, however, tightly linked to the local cultural identity and both tradition and tourism. There is increasing demand for other services (angling, boating, kiting, bird watching, sightseeing) and increasing demand for active sports, such as water contact activities in the lagoon, hindered by issues such as poor water quality and eutrophication, frequent algal blooms and unpleasant smells [51].
This study also shows that hotspots of cultural ES are not necessarily spatially coherent with cultural heritage concentration sites. For example, the Pakalnė River polder landscape reserve of Rusnė Island is designated to protect the unique oldest polders, with flooded meadows as habitats for birds, but it occurs within a cultural ES coldspot in this assessment. Some of the cultural services, especially those related to aesthetic value, cannot be fully evaluated by an expert matrix approach, because it considers only the attractiveness of the existing land cover class and does not consider other objects in view (e.g., panoramic views) present at the point, or the historical heritage value of the site. This suggests that more detailed analyses are needed to investigate cultural ES at a smaller spatial scale, using some empirical data of the site visitors in the context of cultural heritage, tourism infrastructure and the demographic characteristics of society [52].
The relatively large percentage of protected areas, along with associated land use and farming restrictions and low to moderate land fertility, results in generally low potentials for provisioning services in this coastal region. Only two provisioning ES achieved the highest potential score of 5 in some land cover classes: animals reared in cultured pastures (milk and meat production) (P3) and animals reared by in situ aquaculture in fishery ponds (P5). Livestock production still has high economic importance in the area. Small and medium dairy farms still dominate, but under recent agricultural policy and pressures of the market economy, small dairy farms are increasingly being converted into beef cattle production farms [53]. Quality meat production with high added value is suggested as a future perspective for local farmers. Moreover, livestock farms with a low number of animals would avoid environmental issues such as pollution of ground and surface waters and habitat destruction for endangered bird species. Differently from livestock farms, aquaculture is concentrated in a single company located in the Nemunas Delta RP. Operating ponds of 600 ha and raising carp, bighead carp, sturgeon, grass carp and trout, an important aspect is that the company has diverse additional activities, such as a fish restaurant, recreational fishery, tourism services and bird watching. Intense production-targeted aquaculture is turning into more environmentally and socioeconomically friendly aquaculture. These two examples show the importance of the multiple values of nature.

5. Conclusions

Regulations on Natura 2000 habitat protection and general agriculture, climate and other thematic policies implemented after Lithuania’s accession to the EU in 2004 would also have a significant effect at the landscape level. Having only low potential for provisioning services, natural or semi-natural grassland or wet meadows are particularly vulnerable to abandonment, e.g., the stopping of mowing or grazing by cattle, or reciprocal intensified activities such as the unsustainable renovation of drainage and polder systems. Maintenance costs and effort could potentially be compensated by socio-economic benefits such as contributions to the preservation of global biodiversity, feeling the intrinsic existence value of biodiversity and benefiting from a group of other regulatory and cultural ES, having relevant potential for aesthetics and education or the creation of knowledge. Cultural services related to landscape and biodiversity, such as birdwatching services, could be an example of an income source for landowners to compensate expenses on land management.
The use of expert analysis, such as the matrix method, can help to provide a good starting overview of a topic involving complex information from stakeholders in order to identify multiple ES and possible synergies and trade-offs, especially when they are used in decision-making. This assessment provides insight into the total ES potential’s dependence on land use and land cover and its spatial pattern in the area. Administrative layers are considered, so the local communities of the seven coastal seniunija could obtain information about the total potential of ES in their area, as well as the locations of ES hotspots, and determine the strengths and potential for their well-being of the ES, as well as the protection of nature values. ES mapping could be used by municipalities and multiple stakeholders (foresters, drainage and protected area managers) starting the co-creation of landscape-level management options. However, the state-of-the-art review of existing ES does not account for trends and directions of change in ES potential, whether positive or negative. Therefore, future application of the matrix should be linked to environmental driver assessment, either based on scorings, e.g., Leitão et al. [54], or existing drainage basin and climate models [5].

Author Contributions

Conceptualization, K.K., J.L., R.M., Z.R.G. and A.R.-B.; Methodology, K.K., S.E. and R.M.; Formal Analysis, K.K.; Investigation, K.K. and S.E.; Data Curation, K.K.; Writing—Original Draft Preparation, K.K., J.L. and Z.R.G.; Writing—Review and Editing, Z.R.G., R.M. and A.R.-B.; Visualization, K.K.; Supervision, A.R.-B.; Project Administration, A.R.-B.; Funding Acquisition, A.R.-B. All authors have read and agreed to the published version of the manuscript.

Funding

This project has received funding from the European Social Fund (project No 09.3.3-LMT-K-712-01-0178) under grant agreement with the Research Council of Lithuania (LMTLT).

Institutional Review Board Statement

Not applicable.

Informed Consent Statement

Not applicable.

Data Availability Statement

The data presented in this study are openly available in data repository Zenodo at doi:10.5281/zenodo.5266518, or upon request to the corresponding author.

Acknowledgments

We are grateful to Georg Umgiesser for initiating this research and leading the ECOSERVE project. We thank our group members, Vaidotas Andrašūnas and Edgaras Ivanauskas, as well as project collaborators, Lina Marcinkevičiūtė, Jolanta Vilkevičiūtė and Jan Žukovskis (Vytautas Magnus University), for their help and consultancy regarding the ecosystem services in the study area.

Conflicts of Interest

The authors declare no conflict of interest. The funders had no role in the design of the study; in the collection, analyses, or interpretation of data; in the writing of the manuscript, or in the decision to publish the results.

Appendix A

Figure A1. Ranking of land-cover classes using overall Ecosystem Services potential values sum of equally (×100/34) weighted values and RI (provided in Table 2) weighted values.
Water 13 02728 g0a1
Figure A2. Values of classified Ecosystem Services according to their potentials, based on territorial size in study area.
Water 13 02728 g0a2

References

  1. Reid, W.V.; Mooney, H.A.; Cropper, A.; Capistrano, D.; Carpenter, S.R.; Chopra, K.; Dasgupta, P.; Dietz, T.; Duraiappah, A.K.; Hassan, R.; et al. Ecosystems and Human Well-Being: Synthesis: A Report for the Millennium Ecosystem Assessment; Island Press: Washington, DC, USA, 2005; ISBN 1597260401. [Google Scholar]
  2. Krause, B.; Culmsee, H.; Wesche, K.; Bergmeier, E.; Leuschner, C. Habitat Loss of Floodplain Meadows in North Germany since the 1950s. Biodivers. Conserv. 2011, 20, 2347–2364. [Google Scholar] [CrossRef] [Green Version]
  3. Lu, Y.; Yuan, J.; Lu, X.; Su, C.; Zhang, Y.; Wang, C.; Cao, X.; Li, Q.; Su, J.; Ittekkot, V.; et al. Major Threats of Pollution and Climate Change to Global Coastal Ecosystems and Enhanced Management for Sustainability. Environ. Pollut. 2018, 239, 670–680. [Google Scholar] [CrossRef] [Green Version]
  4. Vousdoukas, M.I.; Mentaschi, L.; Hinkel, J.; Ward, P.J.; Mongelli, I.; Ciscar, J.-C.; Feyen, L. Economic Motivation for Raising Coastal Flood Defenses in Europe. Nat. Commun. 2020, 11, 2119. [Google Scholar] [CrossRef]
  5. Čerkasova, N.; Ertürk, A.; Zemlys, P.; Denisov, V.; Umgiesser, G. Curonian Lagoon Drainage Basin Modelling and Assessment of Climate Change Impact. Oceanologia 2016, 58, 90–102. [Google Scholar] [CrossRef] [Green Version]
  6. Moomaw, W.R.; Chmura, G.L.; Davies, G.T.; Finlayson, C.M.; Middleton, B.A.; Natali, S.M.; Perry, J.E.; Roulet, N.; Sutton-Grier, A.E. Wetlands In a Changing Climate: Science, Policy and Management. Wetlands 2018, 38, 183–205. [Google Scholar] [CrossRef] [Green Version]
  7. Verma, M.; Negandhi, D. Valuing Ecosystem Services of Wetlands—A Tool for Effective Policy Formulation and Poverty Alleviation. Hydrol. Sci. J. 2011, 56, 1622–1639. [Google Scholar] [CrossRef]
  8. Junk, W.J.; An, S.; Finlayson, C.M.; Gopal, B.; Květ, J.; Mitchell, S.A.; Mitsch, W.J.; Robarts, R.D. Current State of Knowledge Regarding the World’s Wetlands and Their Future under Global Climate Change: A Synthesis. Aquat. Sci. 2012, 75, 151–167. [Google Scholar] [CrossRef] [Green Version]
  9. Rashleigh, B.; Razinkovas Baziukas, A.; Pilkaitytė, R. Ecosystem Services Assessment of the Nemunas River Delta. Transit. Waters Bull. 2011, 5, 75–78. [Google Scholar] [CrossRef]
  10. Vrebos, D.; Staes, J.; Vandenbroucke, T.; D’Haeyer, T.; Johnston, R.; Muhumuza, M.; Kasabeke, C.; Meire, P. Mapping Ecosystem Service Flows with Land Cover Scoring Maps for Data-Scarce Regions. Ecosyst. Serv. 2015, 13, 28–40. [Google Scholar] [CrossRef]
  11. Ziv, G.; Hassall, C.; Bartkowski, B.; Cord, A.F.; Kaim, A.; Kalamandeen, M.; Landaverde-González, P.; Melo, J.L.B.; Seppelt, R.; Shannon, C.; et al. A bird’s eye view over ecosystem services in Natura 2000 sites across Europe. Ecosyst. Serv. 2018, 30, 287–298. [Google Scholar] [CrossRef] [Green Version]
  12. Harrison, P.A.; Berry, P.M.; Simpson, G.; Haslett, J.R.; Blicharskac, M.; Bucur, M.; Dunford, R.; Egoh, B.; Garcia-Llorentea, M.; Geamănă, N.; et al. Linkages between biodiversity attributes and ecosystem services: A systematic review. Ecosyst. Serv. 2014, 9, 191–203. [Google Scholar] [CrossRef] [Green Version]
  13. Bastian, O. The role of biodiversity in supporting ecosystem services in Natura 2000 sites. Ecol. Indic. 2013, 24, 12–22. [Google Scholar] [CrossRef]
  14. European Commission. Our Life Insurance, Our Natural Capital: An EU Biodiversity Strategy to 2020; COM(2011) 244 Final; European Commission: Brussels, Belgium, 2011. [Google Scholar]
  15. European Commission. EU Biodiversity Strategy for 2030 Bringing Nature back into our Lives; COM(2020) 380 final; European Commission: Brussels, Belgium, 2020. [Google Scholar]
  16. Fňukalová, E.; Zýka, V.; Romport, D. The Network of Green Infrastructure Based on Ecosystem Services Supply in Central Europe. Land 2021, 10, 592. [Google Scholar] [CrossRef]
  17. Liquete, C.; Kleeschulte, S.; Dige, G.; Maes, J.; Grizzetti, B.; Olah, B.; Zulian, G. Mapping green infrastructure based on ecosystem services and ecological networks: A Pan-European case study. Environ. Sci. Policy 2015, 54, 268–280. [Google Scholar] [CrossRef]
  18. Vysna, V.; Maes, J.; Petersen, J.E.; La Notte, A.; Vallecillo, S.; Aizpurua, N.; Ivits, E.; Teller, A. Accounting for Ecosystems and Their Services in the European Union (INCA). Final Report from Phase II of the INCA Project Aiming to Develop a Pilot for an Integrated System of Ecosystem Accounts for the EU. Statistical Report; Publications Office of the European Union: Luxembourg, 2021. [Google Scholar]
  19. Burkhard, B.; Kroll, F.; Müller, F.; Windhorst, W. Landscapes’ Capacities to Provide Ecosystem Services—A Concept for Land-Cover Based Assessments. Landsc. Online 2009, 15, 1–22. [Google Scholar] [CrossRef]
  20. Burkhard, B.; Kroll, F.; Nedkov, S.; Müller, F. Mapping Ecosystem Service Supply, Demand and Budgets. Ecol. Indic. 2012, 21, 17–29. [Google Scholar] [CrossRef]
  21. Burkhard, B.; Kandziora, M.; Hou, Y.; Müller, F. Ecosystem Service Potentials, Flows and Demands-Concepts for Spatial Localisation, Indication and Quantification. Landsc. Online 2014, 34, 1–32. [Google Scholar] [CrossRef]
  22. Jacobs, S.; Burkhard, B.; Van Daele, T.; Staes, J.; Schneiders, A. ‘The Matrix Reloaded’: A Review of Expert Knowledge Use for Mapping Ecosystem Services. Ecol. Model. 2015, 295, 21–30. [Google Scholar] [CrossRef]
  23. Maes, J.; Egoh, B.; Willemen, L.; Liquete, C.; Vihervaara, P.; Schägner, J.P.; Grizzetti, B.; Drakou, E.G.; Notte, A.L.; Zulian, G.; et al. Mapping Ecosystem Services for Policy Support and Decision Making in the European Union. Ecosyst. Serv. 2012, 1, 31–39. [Google Scholar] [CrossRef]
  24. Campagne, C.S.; Roche, P.; Gosselin, F.; Tschanz, L.; Tatoni, T. Expert-Based Ecosystem Services Capacity Matrices: Dealing with Scoring Variability. Ecol. Indic. 2017, 79, 63–72. [Google Scholar] [CrossRef] [Green Version]
  25. Campagne, C.S.; Roche, P. May the Matrix Be with You! Guidelines for the Application of Expert-Based Matrix Approach for Ecosystem Services Assessment and Mapping. One Ecosyst. 2018, 3, e24134. [Google Scholar] [CrossRef]
  26. Campagne, C.S.; Roche, P.; Müller, F.; Burkhard, B. Ten years of ecosystem services matrix: Review of a (r)evolution. One Ecosyst. 2020, 5, e51103. [Google Scholar] [CrossRef]
  27. Hauck, J.; Schweppe-Kraft, B.; Albert, C.; Görg, C.; Jax, K.; Jensen, R.; Fürst, C.; Maes, J.; Ring, I.; Hönigová, I.; et al. The Promise of the Ecosystem Services Concept for Planning and Decision-Making. GAIA 2013, 22, 232–236. [Google Scholar] [CrossRef]
  28. Bezák, P.; Mederly, P.; Izakovicová, Z.; Moyzeová, M.; Bezáková, M. Perception of Ecosystem Services in Constituting Multi-Functional Landscapes in Slovakia. Land 2020, 9, 195. [Google Scholar] [CrossRef]
  29. Khomalli, Y.; Elyaagoubi, S.; Maanan, M.; Razinkova-Baziukas, A.; Rhinane, H.; Maanan, M. Using Analytic Hierarchy Process to Map and Quantify the Ecosystem Services in Oualidia Lagoon, Morocco. Wetlands 2020, 40, 2123–2137. [Google Scholar] [CrossRef]
  30. Robbe, E.; Wolfel, J.; Balčiūnas, A.; Schernewski, G. An impact assessment of beach wrack and litter on beach ecosystem services to support coastal management at the Baltic Sea. Environ. Manag. 2021, 9, 1–25. [Google Scholar] [CrossRef]
  31. Depellegrin, D.; Pereira, P.; Misiunė, I.; Egarter-Vigl, L. Mapping Ecosystem Services Potential in Lithuania. Int. J. Sustain. Dev. World Ecol. 2016, 23, 441–455. [Google Scholar] [CrossRef]
  32. Pang, X.; Trubins, R.; Lekavicius, V.; Galinis, A.; Mozgeris, G.; Kulbokas, G.; Mörtberg, U. Forest Bioenergy Feedstock in Lithuania—Renewable Energy Goals and the Use of Forest Resources. Energy Strategy Rev. 2019, 24, 244–253. [Google Scholar] [CrossRef]
  33. Kalinauskas, M.; Mikša, K.; Inácio, M.; Gomes, E.; Pereira, P. Mapping and Assessment of Landscape Aesthetic Quality in Lithuania. J. Environ. Manag. 2021, 286, 112239. [Google Scholar] [CrossRef]
  34. Vinogradovs, I.; Villoslada, M.; Nikodemus, O.; Ruskule, A.; Veidemane, K.; Gulbinas, J.; Morkvenas, Ž.; Kasparinskis, R.; Sepp, K.; Järv, H.; et al. Integrating Ecosystem Services into Decision Support for Management of Agroecosystems: Viva Grass Tool. One Ecosyst. 2020, 5, e53504. [Google Scholar] [CrossRef]
  35. BGI Consulting. Socio-Economic Benefit Assessment Study of the NATURA 2000 Network. Summary of the Final Report. 14 September 2020. Vilnius, Lithuania. 2020. Available online: https://naturalit.lt/wp-content/uploads/2020/12/BGI_VSTT_Natura-2000_Santrauka_EN_20200916.pdf (accessed on 1 August 2021).
  36. Inácio, M.; Schernewski, G.; Nazemtseva, Y.; Baltranaitė, E.; Friedland, R.; Benz, J. Ecosystem Services Provision Today and in the Past: A Comparative Study in Two Baltic Lagoons. Ecol. Res. 2018, 33, 1255–1274. [Google Scholar] [CrossRef]
  37. Breber, P.; Povilanskas, R.; Armaitienė, A. Recent Evolution of Fishery and Land Reclamation in Curonian and Lesina Lagoons. Hydrobiologia 2008, 611, 105–114. [Google Scholar] [CrossRef]
  38. Karstens, S.; Inácio, M.; Schernewski, G. Expert-Based Evaluation of Ecosystem Service Provision in Coastal Reed Wetlands Under Different Management Regimes Front. Environ. Sci. 2019, 31, 63. [Google Scholar] [CrossRef]
  39. Hattam, C.; Broszeit, S.; Langmead, O.; Praptiwi, R.A.; Lim, V.C.; Creencia, L.A.; Hau, T.D.; Maharja, C.; Wulandari, P.; Setia, T.M.; et al. A matrix approach to tropical marine ecosystem service assessments in South east Asia. Ecosyst. Serv. 2021, 51, 101346. [Google Scholar] [CrossRef]
  40. Umgiesser, G.; Cerkasova, N.; Idzelyte, R.; Zukovskis, J.; Mezine, J.; Kaziukonyte, K. Database for EcoServe project, Lithuania [Data set]. Zenodo 2021. [Google Scholar] [CrossRef]
  41. Haines-Young, R.; Potschin-Young, M. Revision of the Common International Classification for Ecosystem Services (CICES V5.1): A Policy Brief. One Ecosyst. 2018, 3, e27108. [Google Scholar] [CrossRef]
  42. Institute of Botany, Nature Research Centre. Natural Habitats of EU Importance. 2015. Available online: https://www.geoportal.lt/mapproxy/am_bigis_spalvotas/MapServer (accessed on 1 May 2020).
  43. Poikolainen, L.; Pinto, G.; Vihervaara, P.; Burkhard, B.; Wolff, F.; Hyytiäinen, R.; Kumpula, T. GIS and Land Cover-Based Assessment of Ecosystem Services in the North Karelia Biosphere Reserve, Finland. Fennia 2019, 197, 249–267. [Google Scholar] [CrossRef]
  44. Lê, S.; Josse, J.; Husson, F. FactoMineR: An R Package for Multivariate Analysis. J. Stat. Softw. 2008, 25, 1–18. [Google Scholar] [CrossRef] [Green Version]
  45. Li, Y.; Zhang, L.; Yan, J.; Wang, P.; Hu, N.; Cheng, W.; Fu, B. Mapping the Hotspots and Coldspots of Ecosystem Services in Conservation Priority Setting. J. Geogr. Sci. 2017, 27, 681–696. [Google Scholar] [CrossRef]
  46. Raudsepp-Hearne, C.; Peterson, G.D.; Bennett, E.M. Ecosystem Service Bundles for Analyzing Tradeoffs in Diverse Landscapes. Proc. Natl. Acad. Sci. USA 2010, 107, 5242–5247. [Google Scholar] [CrossRef] [Green Version]
  47. Skuodiene, R.; Katutis, K.; Nekrosiene, R.; Repsiene, R.; Karcauskiene, D. Effects of Soil Properties and Humidity Regimes on Semi-Natural Meadow Productivity. Acta Agric. Scand. B Soil Plant Sci. 2016, 66, 653–663. [Google Scholar] [CrossRef]
  48. Calaciura, B.; Spinelli, O. Management of Natura 2000 Habitats. 6210 Semi-Natural Dry Grasslands and Scrubland Facies on Calcareous Substrates (Festuco-Brometalia) (*Important Orchid Sites); European Commission: Brussels, Belgium, 2008. [Google Scholar]
  49. Orsi, F.; Ciolli, M.; Primmer, E.; Varumo, L.; Geneletti, D. Mapping Hotspots and Bundles of Forest Ecosystem Services across the European Union. Land Use Policy 2020, 99, 104840. [Google Scholar] [CrossRef]
  50. Gozdowski, D.; Žukovskis, J.; Kaziukonytė, K.; Razinkovas-Baziukas, A. Evaluation of Land Cover Changes in Southwestern Lithuania from 1984 to 2018 Medium Spatial Resolution Imagery. Pol. J. Environ. Stud. 2020, 29, 4041–4051. [Google Scholar] [CrossRef]
  51. Bartoli, M.; Zilius, M.; Bresciani, M.; Vaiciute, D.; Vybernaite-Lubiene, I.; Petkuviene, J.; Giordani, G.; Daunys, D.; Ruginis, T.; Benelli, S.; et al. Drivers of Cyanobacterial Blooms in a Hypertrophic Lagoon. Front. Mar. Sci. 2018, 5, 434. [Google Scholar] [CrossRef] [Green Version]
  52. Vlami, V.; Kokkoris, I.P.; Zogaris, S.; Kehayias, G.; Dimopoulos, P. Cultural Ecosystem Services in the Natura 2000 Network: Introducing Proxy Indicators and Conflict Risk in Greece. Land 2021, 10, 4. [Google Scholar] [CrossRef]
  53. Lithuanian Institute of Agrarian Economics. Agricultural and Food Sector in Lithuania 2017. Vilnius. Online Source. 2017. Available online: https://www.laei.lt/?mt=leidiniai&straipsnis=1347&metai=2018 (accessed on 1 August 2021).
  54. Leitão, I.A.; Ferreira, C.S.S.; Ferreira, A.J.D. Assessing long-term changes in potential ecosystem services of a peri-urbanizing Mediterranean catchment. Sci. Total Environ. 2019, 660, 993–1003. [Google Scholar] [CrossRef]
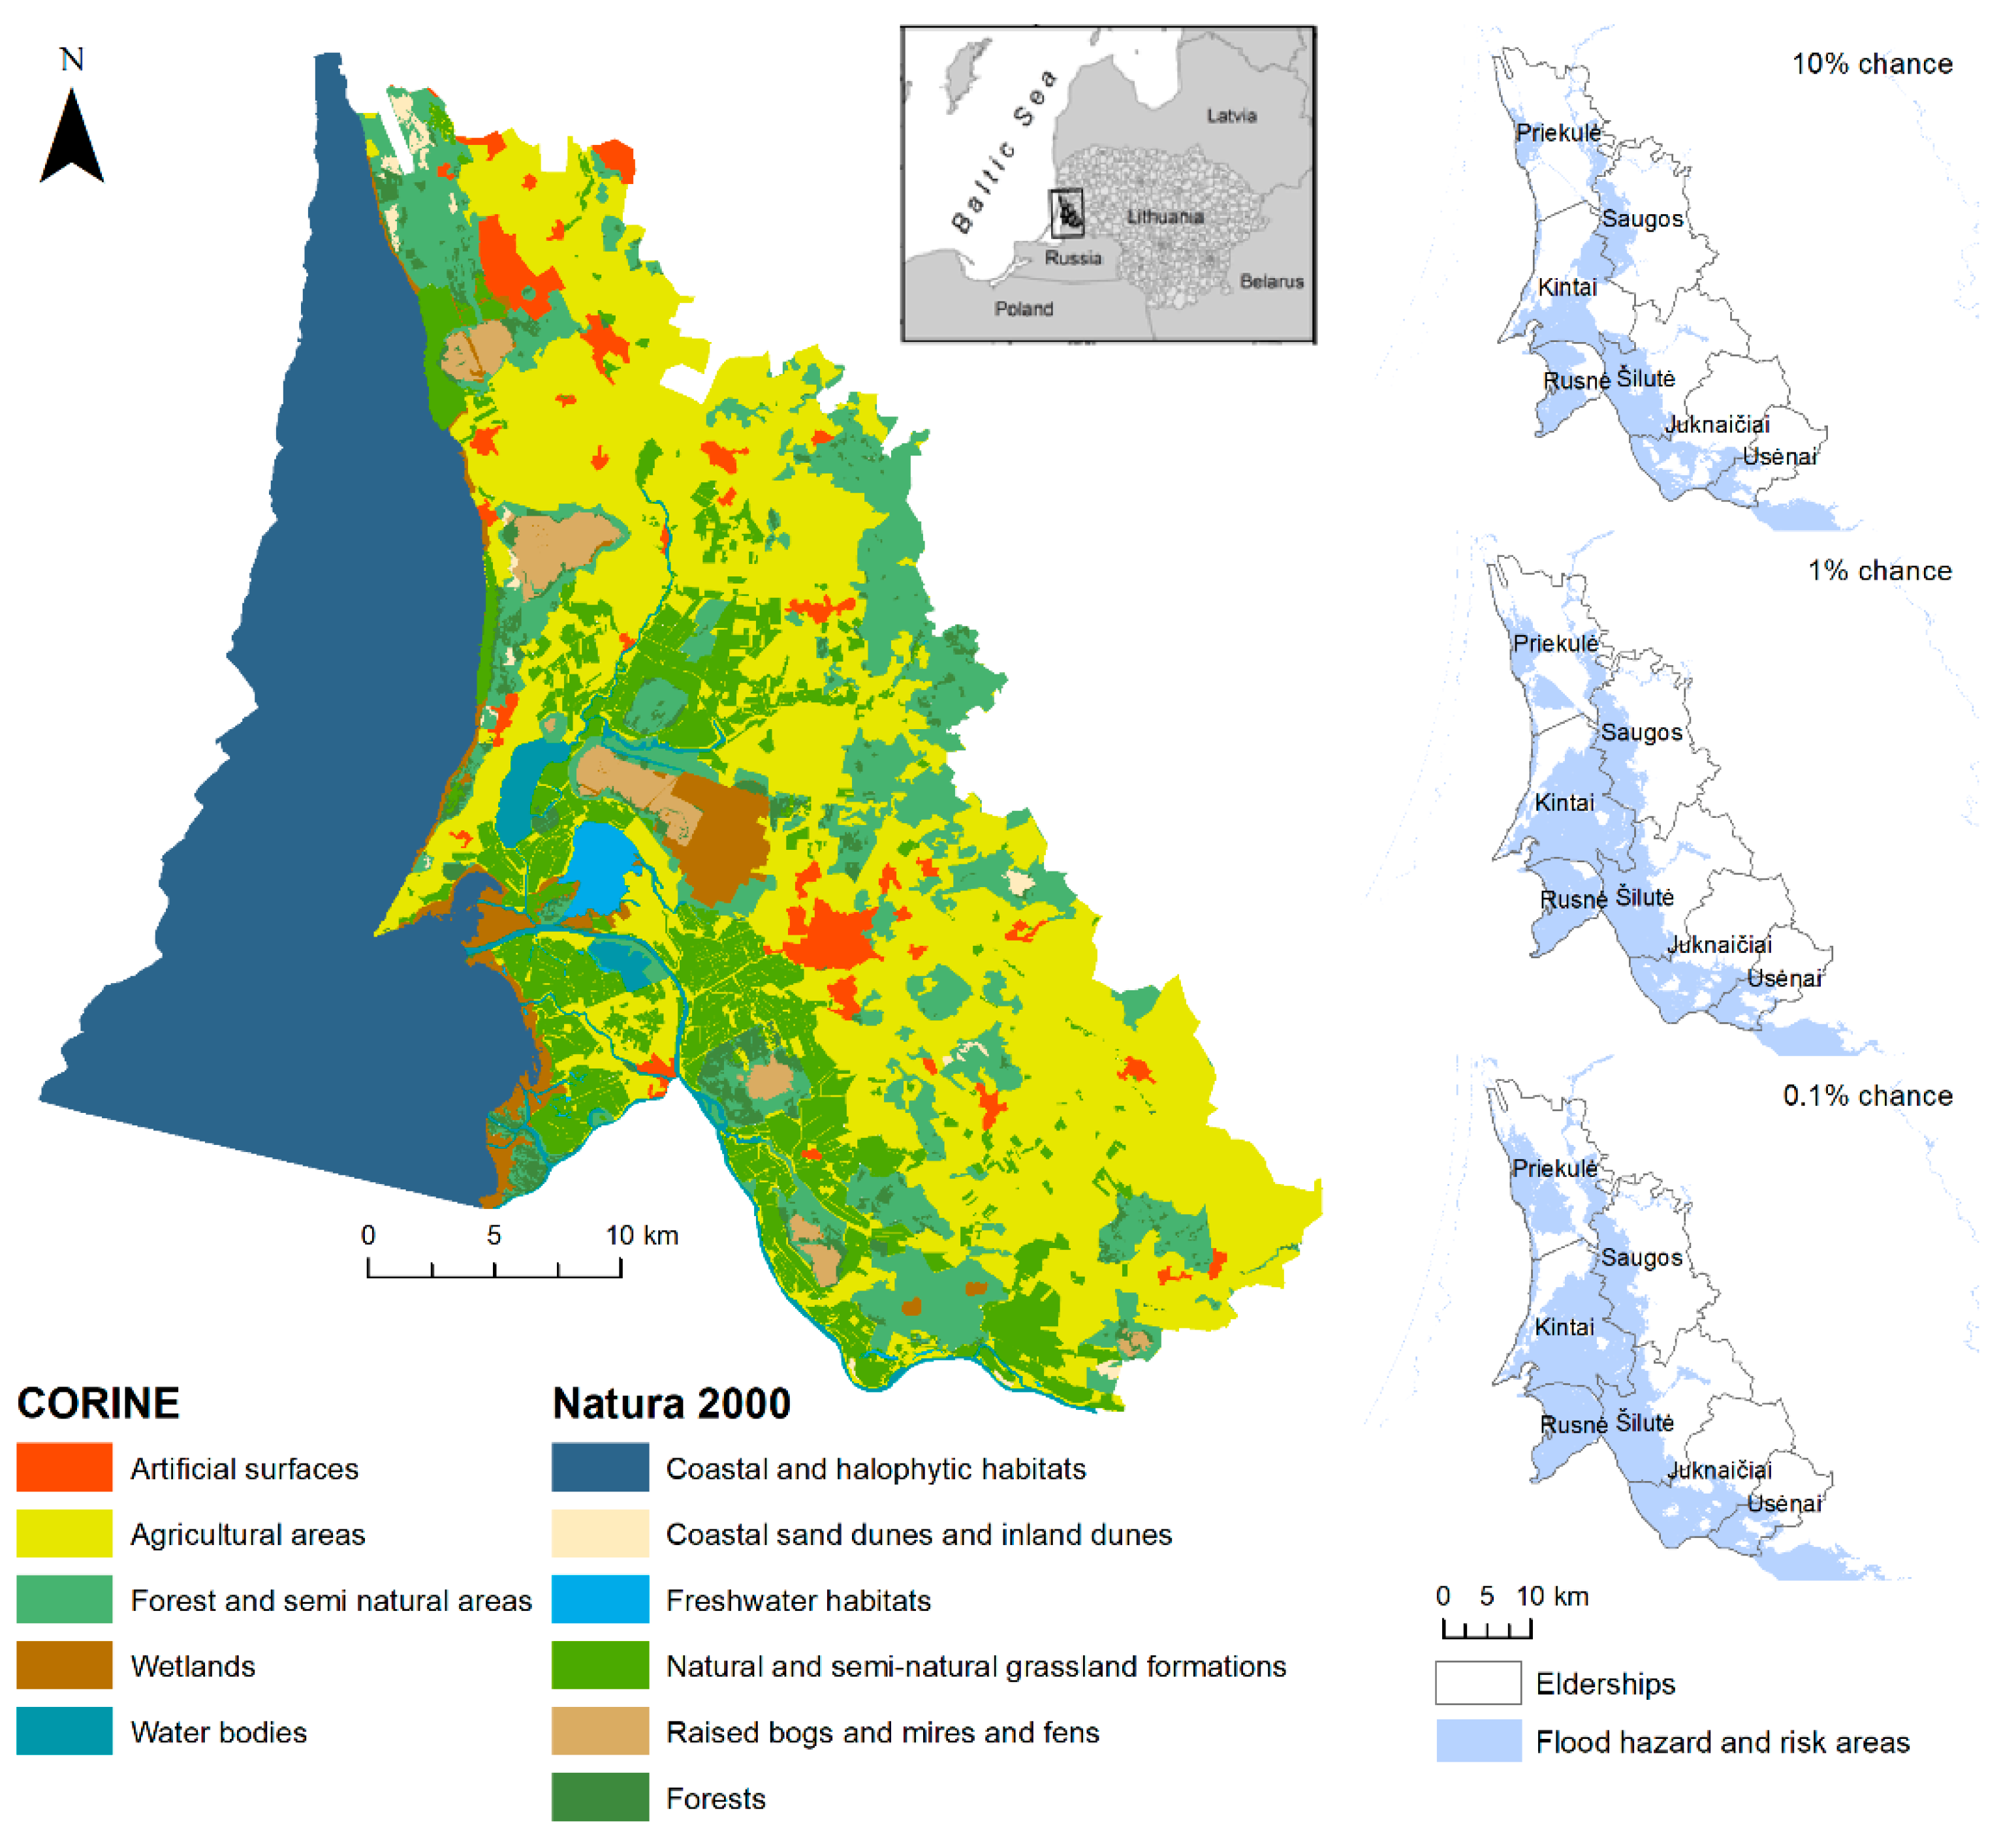
Figure 1. Compiled land cover map of land cover categories from CORINE land cover and Natura 2000 habitats in the study area and flood areas with 0.1, 1 and 10% probability (Environmental Protection Agency, 2020).
Water 13 02728 g001
Figure 2. Maps of 6 ecosystem services in 3 ES categories. Provisioning: (a) wild animals used for nutritional purposes (CICES 1.1.6.1); (b) animals reared for nutritional purposes (CICES 1.1.3.1); in regulation and maintenance category: (c) maintaining nursery populations and habitats (CICES 2.2.2.3); (d) hydrological cycle and water flow regulation (including flood control and coastal protection, CICES 2.2.1.3); in cultural: (e) characteristics of living systems that enable scientific investigation or the creation of traditional ecological knowledge (CICES 3.1.2.1); (f) characteristics of living systems that enable aesthetic experiences (CICES 3.1.2.4).
Water 13 02728 g002
Figure 3. Spearman rank correlation matrix of ecosystem services. Significant positive correlations are marked in blue, significant negative correlations in red, and non-significant or weak correlations are marked as crosses.
Water 13 02728 g003
Figure 4. Variables factor map (principal component analyses) (a); ascending hierarchical classification of the land use classes (b) and ecosystem services, based on reversed matrix (c).
Water 13 02728 g004
Figure 5. Maps of the ecosystem service potentials grouped into the ecosystem service categories in the Nemunas Delta and Curonian Lagoon region: provisioning services, regulation and maintenance and cultural services. The average data from the expert evaluations for each ecosystem service category were taken and final values were rounded to the nearest integer.
Water 13 02728 g005
Figure 6. Hotspots and coldspots with different confidence levels. The double star (**) and single star (*) superscript indicate hotspots or coldspots that were significant at 99% and 95% level, respectively. The pie charts indicate the percentage of each CORINE/Natura 2000 land cover category from the total area of hotspots or coldspots.
Water 13 02728 g006
Figure 7. Distribution of land cover categories (including CLC and Natura 2000) and Natura 2000 network inside and outside of cold- and hotspots of ES.
Water 13 02728 g007
Table 1. Distribution of land cover categories in the terrestrial part of the study area according to the compiled map.
Land Cover Categories%
Agricultural areas (CORINE)45.5%
Natural and semi-natural grassland formations (Natura 2000)19.0%
Forest and semi natural areas (CORINE)17.9%
Forests (Natura 2000)4.3%
Artificial surfaces (CORINE)3.6%
Wetlands (CORINE)3.2%
Raised bogs and mires and fens (Natura 2000)2.6%
Water bodies (CORINE)2.3%
Freshwater habitats (Natura 2000)0.9%
Coastal sand dunes and inland dunes (Natura 2000)0.5%
Total100
Table 2. Ecosystem services matrix filled with the average values of the expert-based assessment. The values follow the scale: no potential = 0, low relevant potential = 1, relevant potential = 2, medium potential = 3, high potential = 4, very high potential = 5, highlighted with a color scheme where dark green indicates higher values. Yellow columns represent ES categories with calculated RI weighted average for land cover classes.
Ecosystem service codeProvisioning servicesP1P2P3P4P5P6P7P8P9P10P11Regulation and Maintenance servicesRM1RM2RM3RM4RM5RM6RM7RM8RM9RM10RM11RM12Cultural servicesC1C2C3C4C5C6C7C8C9C10C11Total ecosystem servicesEcosystem Services count
CICES1.1.1.11.1.1.21.1.3.11.1.3.21.1.4.11.1.5.11.1.5.21.1.5.31.1.6.11.1.6.24.2.1.22.1.1.12.1.1.22.2.1.12.2.1.32.2.2.12.2.2.22.2.2.32.2.4.12.2.4.22.2.5.12.2.6.12.2.6.23.1.1.13.1.1.23.1.2.13.1.2.23.1.2.33.1.2.43.2.1.13.2.1.23.2.1.33.2.2.13.2.2.2
CORINE/Natura 2000 coding Cultivated terrestrial plants (including fungi, algae) grown for nutritional purposesFibres and other materials from cultivated plants, fungi, algae and bacteria for direct use or processing (excluding genetic materials)Animals reared for nutritional purposesFibres and other materials from reared animals for direct use or processing (excluding genetic materials)Animals reared by in-situ aquaculture for nutritional purposesWild plants (terrestrial and aquatic, including fungi, algae) used for nutritionFibres and other materials from wild plants for direct use or processing (excluding genetic materials)Wild plants (terrestrial and aquatic, including fungi, algae) used as a source of energyWild animals (terrestrial and aquatic) used for nutritional purposesFibres and other materials from wild animals for direct use or processing (excluding genetic materials)Surface water used as a material (non-drinking purposes)Bio-remediation by micro-organisms, algae, plants, and animalsFiltration/sequestration/storage/accumulation by micro-organisms, algae, plants, and animalsControl of erosion ratesHydrological cycle and water flow regulation (Including flood control, and coastal protection)Pollination (or ‘gamete’ dispersal in a marine context)Seed dispersalMaintaining nursery populations and habitats (Including gene pool protection)Weathering processes and their effect on soil qualityDecomposition and fixing processes and their effect on soil quality Regulation of the chemical condition of freshwaters by living processesRegulation of chemical composition of atmosphere and oceansRegulation of temperature and humidity, including ventilation and transpirationCharacteristics of living systems that that enable activities promoting health, recuperation or enjoyment through active or immersive interactionsCharacteristics of living systems that enable activities promoting health, recuperation or enjoyment through passive or observational interactionsCharacteristics of living systems that enable scientific investigation or the creation of traditional ecological knowledgeCharacteristics of living systems that enable education and trainingCharacteristics of living systems that are resonant in terms of culture or heritageCharacteristics of living systems that enable aesthetic experiencesElements of living systems that have symbolic meaningElements of living systems that have sacred or religious meaningElements of living systems used for entertainment or representationCharacteristics or features of living systems that have an existence valueCharacteristics or features of living systems that have an option or bequest value
RI weight1.31.31.31.31.32.51.30.61.30.60.62.53.33.13.13.13.81.93.15.03.13.15.02.52.54.25.05.05.05.02.52.55.00.65.05.05.02.9
CORINE131Mineral extraction sites1000011011021110100100101111120100101118
211Non-irrigated arable land1442101111101111121121011101211110111129
222Fruit trees and berry plantations1411101111101011142221122212321211112131
231Pastures1115401211102112132222121212321221112232
242Complex cultivation patterns2433301111112121132221121112221111112133
243Land principally occupied by agriculture, with significant areas of natural vegetation2433202122202122132332121212321211122232
311Broad-leaved forest1011004344303133333532244334432422333330
312Coniferous forest1020004344203133333532244334432422333329
313Mixed forest1020004344303133333532244334442422333329
Natura 20009010Western Taiga1010003233203133333522244334432422333329
9020Fennoscandian hemiboreal natural old broad-leaved deciduous forests rich in epiphyte1011003233203133333532244334432422344330
9070Fennoscandian wooded pastures1011102123203133333422233323432312233231
9080Fennoscandian deciduous swamp woods1010002233203233433422244323431312233229
9190Old acidophilous oak woods with Quercus robur on sandy plains1010002123203133333422243434433444344329
91D0Bog woodland1010002132113233433423344323431312233330
91E0Alluvial forests with Alnus glutinosa and Fraxinus excelsior1010002232103233433423344323431312234329
CORINE321Natural grasslands1003302213203133243433222334431422233330
324Transitional woodland-shrub1002202233203123243422233223331211222230
Natura 20006210Semi-natural dry grasslands and scrubland facies on calcareous substrates1002102112202113242422122324431312234230
6270Fennoscandian lowland species-rich dry to mesic grasslands1002202112202123242422222324431312244230
6410Molinia meadows on calcareous, peaty or clayey-silt-laden soils0001001012102123242322222213431311233228
6430Hydrophilous tall herb fringe communities of plains and of the montane to alpine levels1002001112102123242322222213431311233229
6450Northern boreal alluvial meadows1003102112202123232432222213431311233230
6510Lowland hay meadows1003202112102123232332222213431311233230
2180Wooded dunes of the Atlantic, Continental and Boreal region0011001111102112232322122334432322233230
2330Inland dunes with open Corynephorus and Agrostis grasslands0000001011102112132322121323431312233227
CORINE411Inland marshes1000002111113233322422423323431311233229
412Peat bogs1110001121112221311222212212321211122231
Natura 20007110Active raised bogs1000002011113332421422433434542422344328
7120Degraded raised bogs still capable of natural regeneration0000001011112221321312322223431311232228
CORINE511Water courses1000011013242220302411313344442422233227
512Water bodies2111151012131110301301213223431211222230
Natura 20003150Natural eutrophic lakes with Magnopotamion or Hydrocharition—type vegetation1000011003232220301401323334442422243225
1130Estuaries1000011113232221302411414434542432343329
1150Coastal lagoons1000021104242221402501324444542432344327
Publisher’s Note: MDPI stays neutral with regard to jurisdictional claims in published maps and institutional affiliations.