Article

Natural and Anthropogenic Controls of Groundwater Quality in Sri Lanka: Implications for Chronic Kidney Disease of Unknown Etiology (CKDu)

1
Institute of Surface-Earth System Science, School of Earth System Science, Tianjin University, Tianjin 300072, China
2
Tianjin Key Laboratory of Earth Critical Zone Science and Sustainable Development in Bohai Rim, School of Earth System Science, Tianjin University, Tianjin 300072, China
3
Department of Geology, Faculty of Science, University of Peradeniya, Peradeniya 20400, Sri Lanka
4
China-Sri Lanka Joint Research and Demonstration Center (JRDC), University of Peradeniya, Peradeniya 20400, Sri Lanka
*
Author to whom correspondence should be addressed.
Water 2021, 13(19), 2724; https://doi.org/10.3390/w13192724
Submission received: 27 August 2021 / Revised: 28 September 2021 / Accepted: 30 September 2021 / Published: 1 October 2021

Abstract

:
Poor groundwater quality in household wells is hypothesized as being a potential contributor to chronic kidney disease of unknown etiology (CKDu) in Sri Lanka. However, the influencing factors of groundwater quality in Sri Lanka are rarely investigated at a national scale. Here, the spatial characteristics of groundwater geochemistry in Sri Lanka were described. The relationships of groundwater quality parameters with environmental factors, including lithology, land use, and climatic conditions, were further examined to identify the natural and anthropogenic controlling factors of groundwater quality in Sri Lanka. The results showed that groundwater geochemistry in Sri Lanka exhibited significant spatial heterogeneity. The high concentrations of NO3 were found in the districts that have a higher percentage of agricultural lands, especially in the regions in the coastal zone. Higher hardness and fluoride in groundwater were mainly observed in the dry zone. The concentrations of trace elements such as Cd, Pb, Cu, and Cr of all the samples were lower than the World Health Organization guideline values, while some the samples had higher As and Al concentrations above the guideline values. Principal component analysis identified four components that explained 73.2% of the total data variance, and the first component with high loadings of NO3, hardness, As, and Cr suggested the effects of agricultural activities, while other components were primarily attributed to natural sources and processes. Further analyses found that water hardness, fluoride and As concentration had positive correlations with precipitation and negative correlations with air temperature. The concentration of NO3 and water hardness were positively correlated with agricultural lands, while As concentration was positively correlated with unconsolidated sediments. The environmental factors can account for 58% of the spatial variation in the overall groundwater geochemistry indicated by the results of redundancy analysis. The groundwater quality data in this study cannot identify whether groundwater quality is related to the occurrence of CKDu. However, these findings identify the coupled controls of lithology, land use, and climate on groundwater quality in Sri Lanka. Future research should be effectively designed to clarify the synergistic effect of different chemical constituents on CKDu.

1. Introduction

Chronic kidney disease (CKD) is a very common public health problem that can be observed in many parts of the world and a higher prevalence is reported from many countries including the USA, Australia, and Japan [1,2]. A CKD of unknown etiology (CKDu) has been reported in some countries in recent years in which the etiology is not recognizable [3]. Such a disease with unknown etiology has been reported in certain parts of the world, especially in Africa, Central America, and Asia [4,5]. CKDu is also found in the rural dry zone regions of Sri Lanka, particularly in the North Central Province adjacent regions for more than two decades [6,7]. Due to its remarkable geographical distribution in some specific regions where groundwater is the main drinking water source, it is generally suspected that long-term exposure to various nephrotoxic elements through drinking groundwater is an important risk factor [7,8,9]. In the rural dry zone regions of Sri Lanka, groundwater is the primary source of water for both drinking and cooking, and CKDu is considered to be related to poor groundwater quality [10,11,12].
Groundwater is an indispensable limited resource, playing an important role in the social and economic development throughout the world. High temperature and limited precipitation in the rural dry zone regions of Sri Lanka pose challenges in the supply of adequate water to meet daily needs [10]. Groundwater provides domestic water and also contributes irrigation water supply for rural communities in Sri Lanka, since no or less treatment is often required [10,13]. However, the deterioration of groundwater quality and the depletion of water resources due to population growth and excessive use of pesticides and agrochemicals, pose threats to public health [13]. Previous studies found that the prevalence of CKDu is related to the recharge sources of groundwater, and is significantly higher with the groundwater stagnated as well as groundwater recharged from regional flow paths [8,14]. Therefore, it is suggested that the source, recharge mechanism, and flow pattern of groundwater, as well as geological conditions that would cause natural contamination of groundwater, may be the main causative factors for CKDu [14,15].
Anthropogenic activities such as agricultural and sanitation practices, and environmental factors such as lithology, land use, and climatic conditions impact on the groundwater quality in Sri Lanka [16,17,18]. Proposed factors related to etiology of CKDu in groundwater include but not be limited to fluoride [8,19,20,21,22,23,24], hardness [8,15,22], major ions [12,20], heavy metals and metalloids [18,25,26], and agrochemical residues [18,27]. Despite groundwater quality related to the occurrence of CKDu in Sri Lanka has been studied extensively, few studies have been carried out to analyze the natural and anthropogenic factors that control the groundwater geochemistry in Sri Lanka. Therefore, the objective of this paper is to investigate the spatial characteristics of groundwater geochemistry, and its relationships with environmental factors, and also to provide a comprehensive review regarding the relationships between groundwater quality and the occurrence of CKDu in the dry zone of Sri Lanka.

2. Materials and Methods
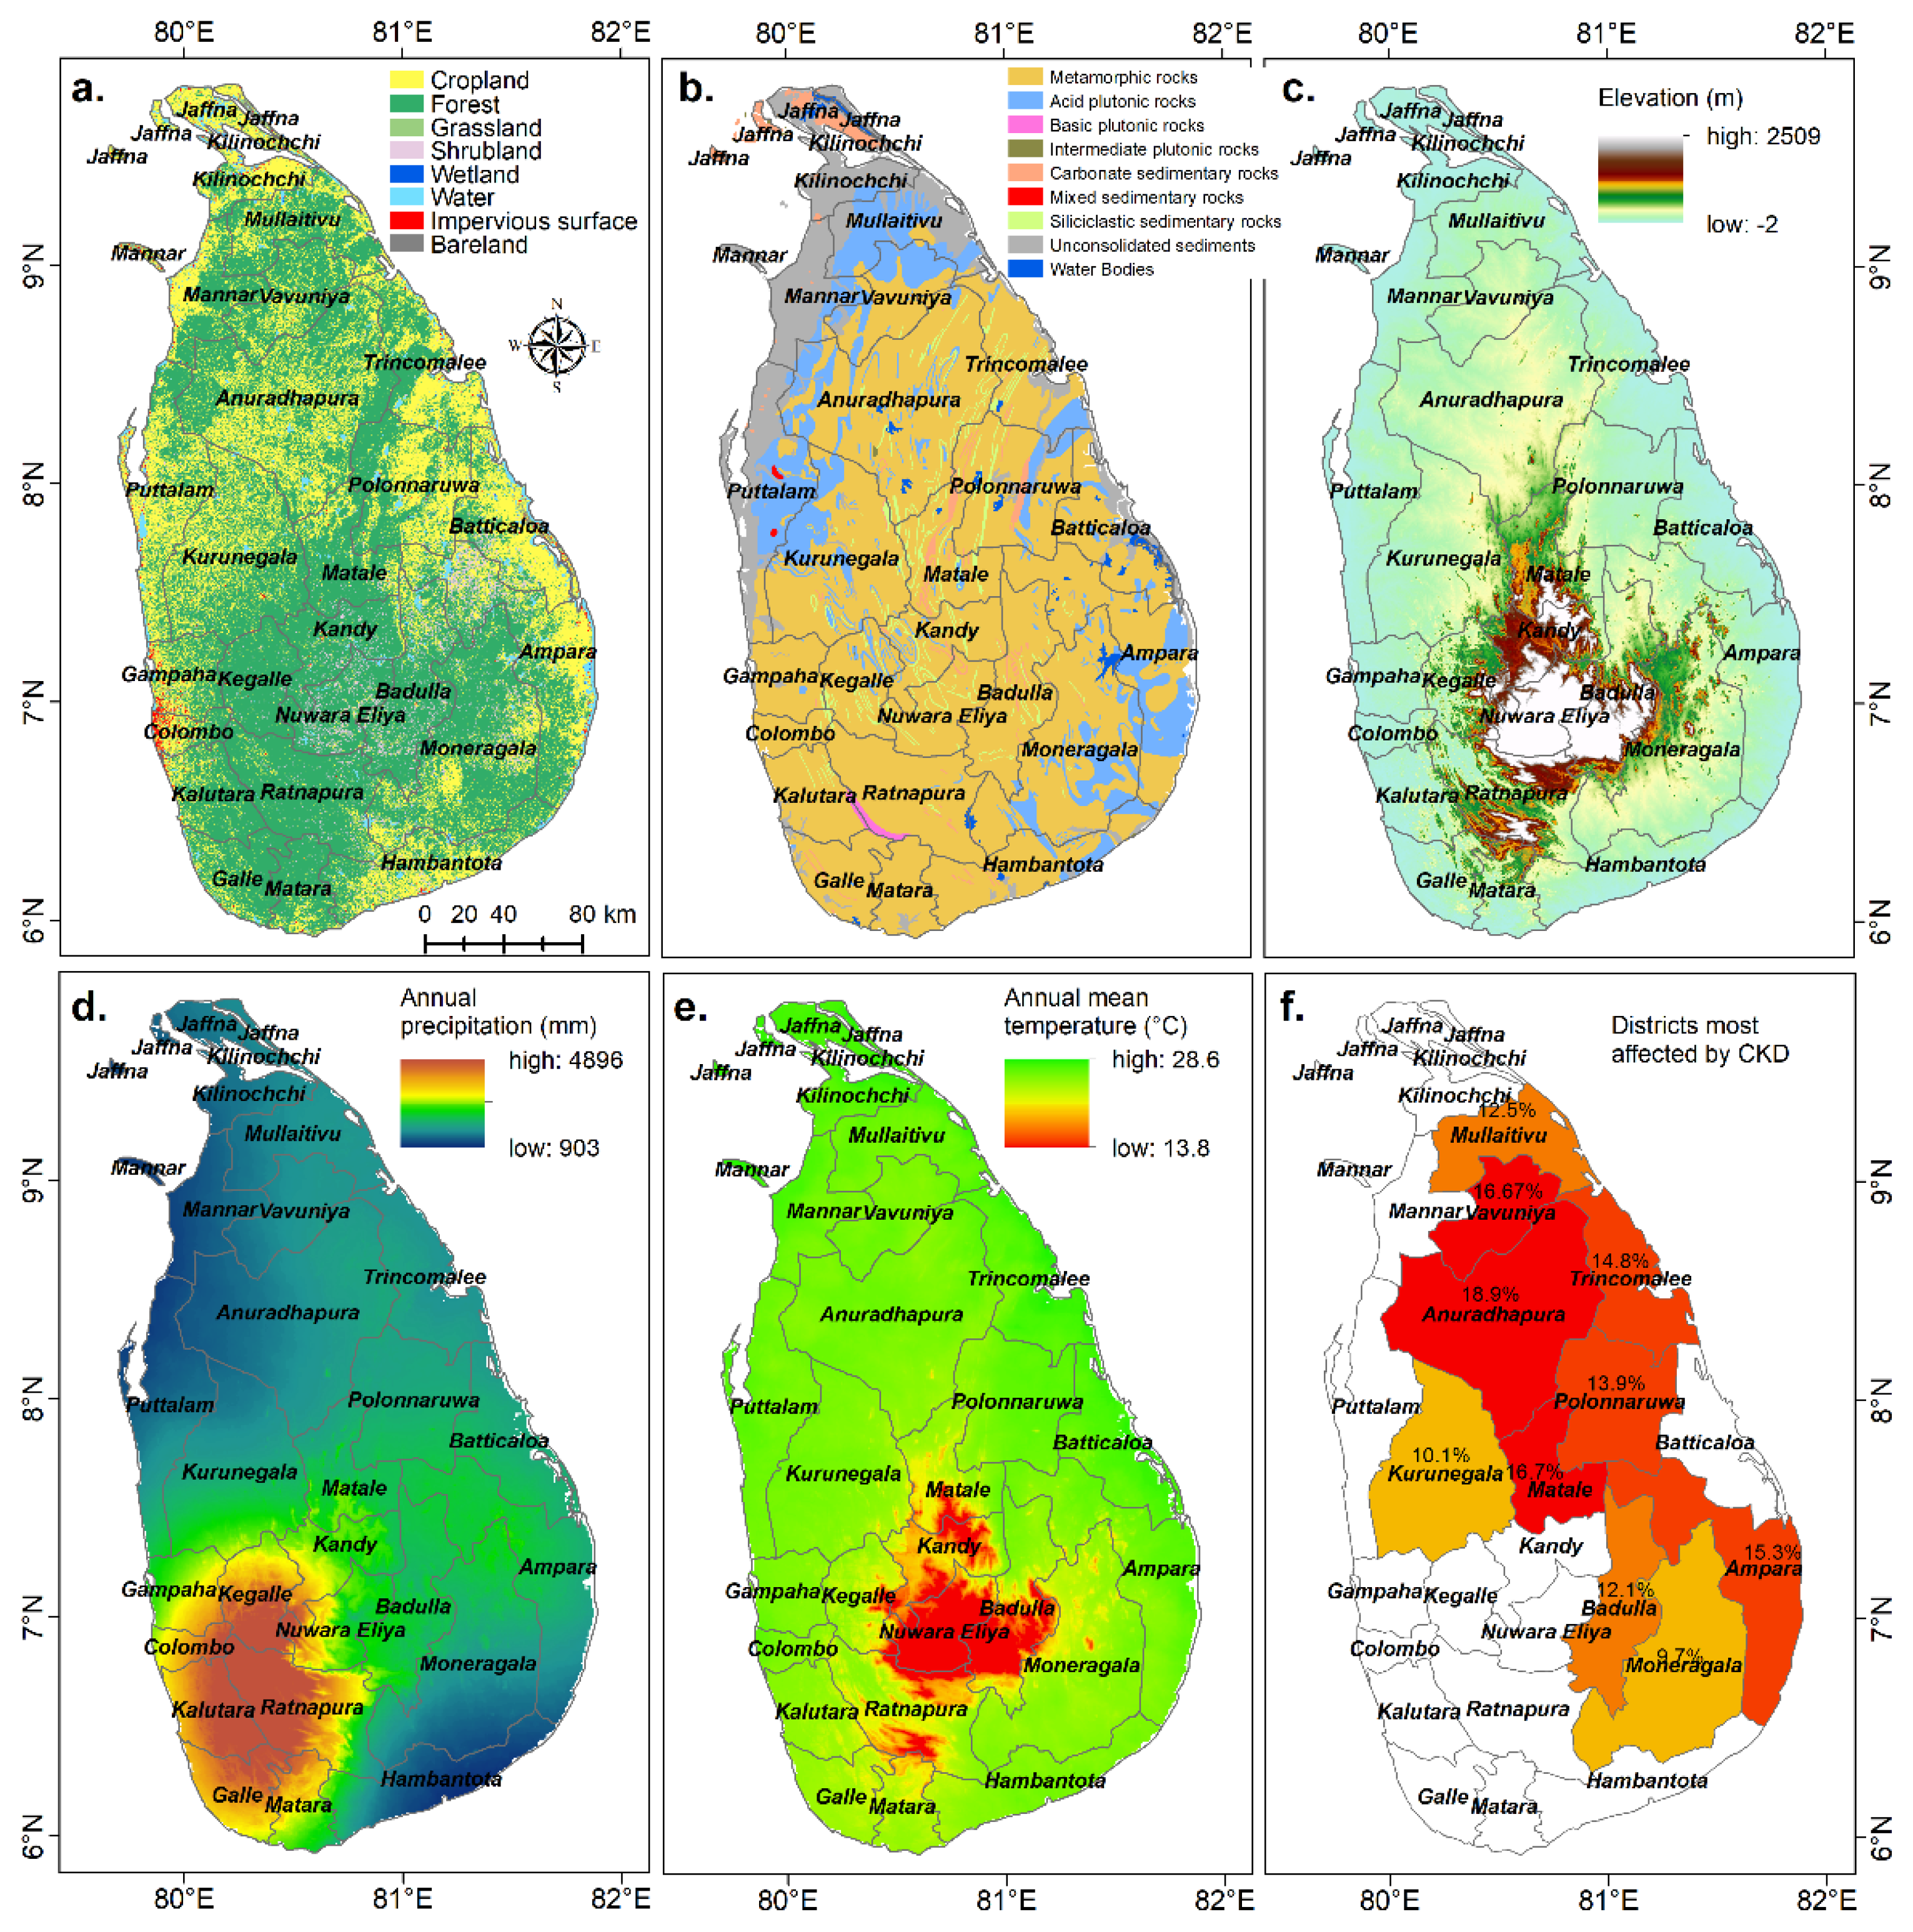
2.1. Study Area

Sri Lanka (6–10° N, 79–82° E) is an island located in the Indian Ocean, just 800 km north of the equator, close to southeastern coast of the Indian subcontinent, and includes 25 administrative districts with a total area of 65,610 km2. The length of the island is 440 km from north to south with a maximum width of 226 km. Although the area of the island is relatively small, it has a widely changing topography, geology, and climate within a short distance imparting some unique environmental features (Figure 1) [28]. The topographical configuration of the island is a highland region located in the center, surrounded by a vast lowland plain. Over 90% of the island is underlain by Precambrian rocks. According to a global lithological map [29], metamorphic rocks cover about 68.2% of the island, followed by acid plutonic rocks (14.4%) and unconsolidated sediments (12%). As per the year 2017, the percentages of forest, cropland, and impervious surface of the island were 60.4%, 30.9%, and 0.6%, respectively. The island is situated in the tropical, Indian ocean monsoonal climate region that contains three climate zones based on the amount of precipitation, named as the wet, dry and intermediate zones [13,16]. The western slopes of the central highlands have the highest intensity of precipitation that exceeds 4000 mm per annum according to the records of the average for years 1970–2000 [30]. The lowest precipitation is recorded in the Mannar Island with values about 900 mm per annum. CKDu is found particularly in the dry zone, metamorphic terrain that occupies two-thirds of the country with the annual rainfall of about 1250 mm, while air temperature varies from 28 to 30 °C, with humidity of around 70% [16].

2.2. Data Source

Groundwater quality data including the concentrations of NO3, hardness, fluoride, heavy metals and metalloids (As, Cd, Fe, Mn, Cu, Cr, Pb, and Al) of groundwater samples collected from the wells in Sri Lanka were obtained from Groundwater Quality Atlas of Sri Lanka [31]. A total of 1304 samples were collected and analyzed from 2010 to 2014 for their study. The maximum and average concentrations of the water quality parameters of all the samples in each district were reported by Kawakami et al. (2014) [31], and used and reanalyzed in this study (Table S1).
Lithology, land use, and climatic conditions were quantitatively described for each district to examine the effects of environmental factors on groundwater quality (Table S2). The elevation data was obtained from EarthEnv-DEM90, that is a digital elevation model derived from CGIAR-CSI SRTM v4.1 and ASTER GDEM v2 data products [32]. To quantify the lithological distribution, a global lithological map was used and analyzed for Sri Lanka [29]. Land use dataset with a 10 m resolution was also used to obtain information for this study [33]. Land use types include cropland, forest, grassland, shrubland, wetland, water body, impervious surface, and bare land, among which cropland and impervious surface were mainly focused. Meteorological data including air temperature and precipitation data used in this study were obtained from WorldClim version 2.1 at a spatial resolution of 30 arc-seconds and are the averages for years 1970–2000 [30].

2.3. Statistical Methods

Correlation Analysis (CA) and Principal Component Analysis (PCA) were used to examine the relationships between the groundwater quality parameters for exploring their possible sources. The suitability of data for PCA was checked by Kaiser–Meyer–Olkin (KMO) and Bartlett’s sphericity tests. The average concentrations of groundwater quality parameters were used in the CA and PCA. Redundancy analysis (RDA) was selected to assess the explanation of variations of groundwater quality parameters by environmental factors. In the ordination diagram resulted from RDA, the arrows pointing in the same direction represent positive correlations, or vice versa. The data shown in Figure 2 were used in the RDA. The CA and PCA were performed through the statistical software package SPSS 22.0, and the RDA was carried out using CANOCO 5.0 software (Microcomputer Power Company, Ithaca, NY, USA).

3. Results and Discussion

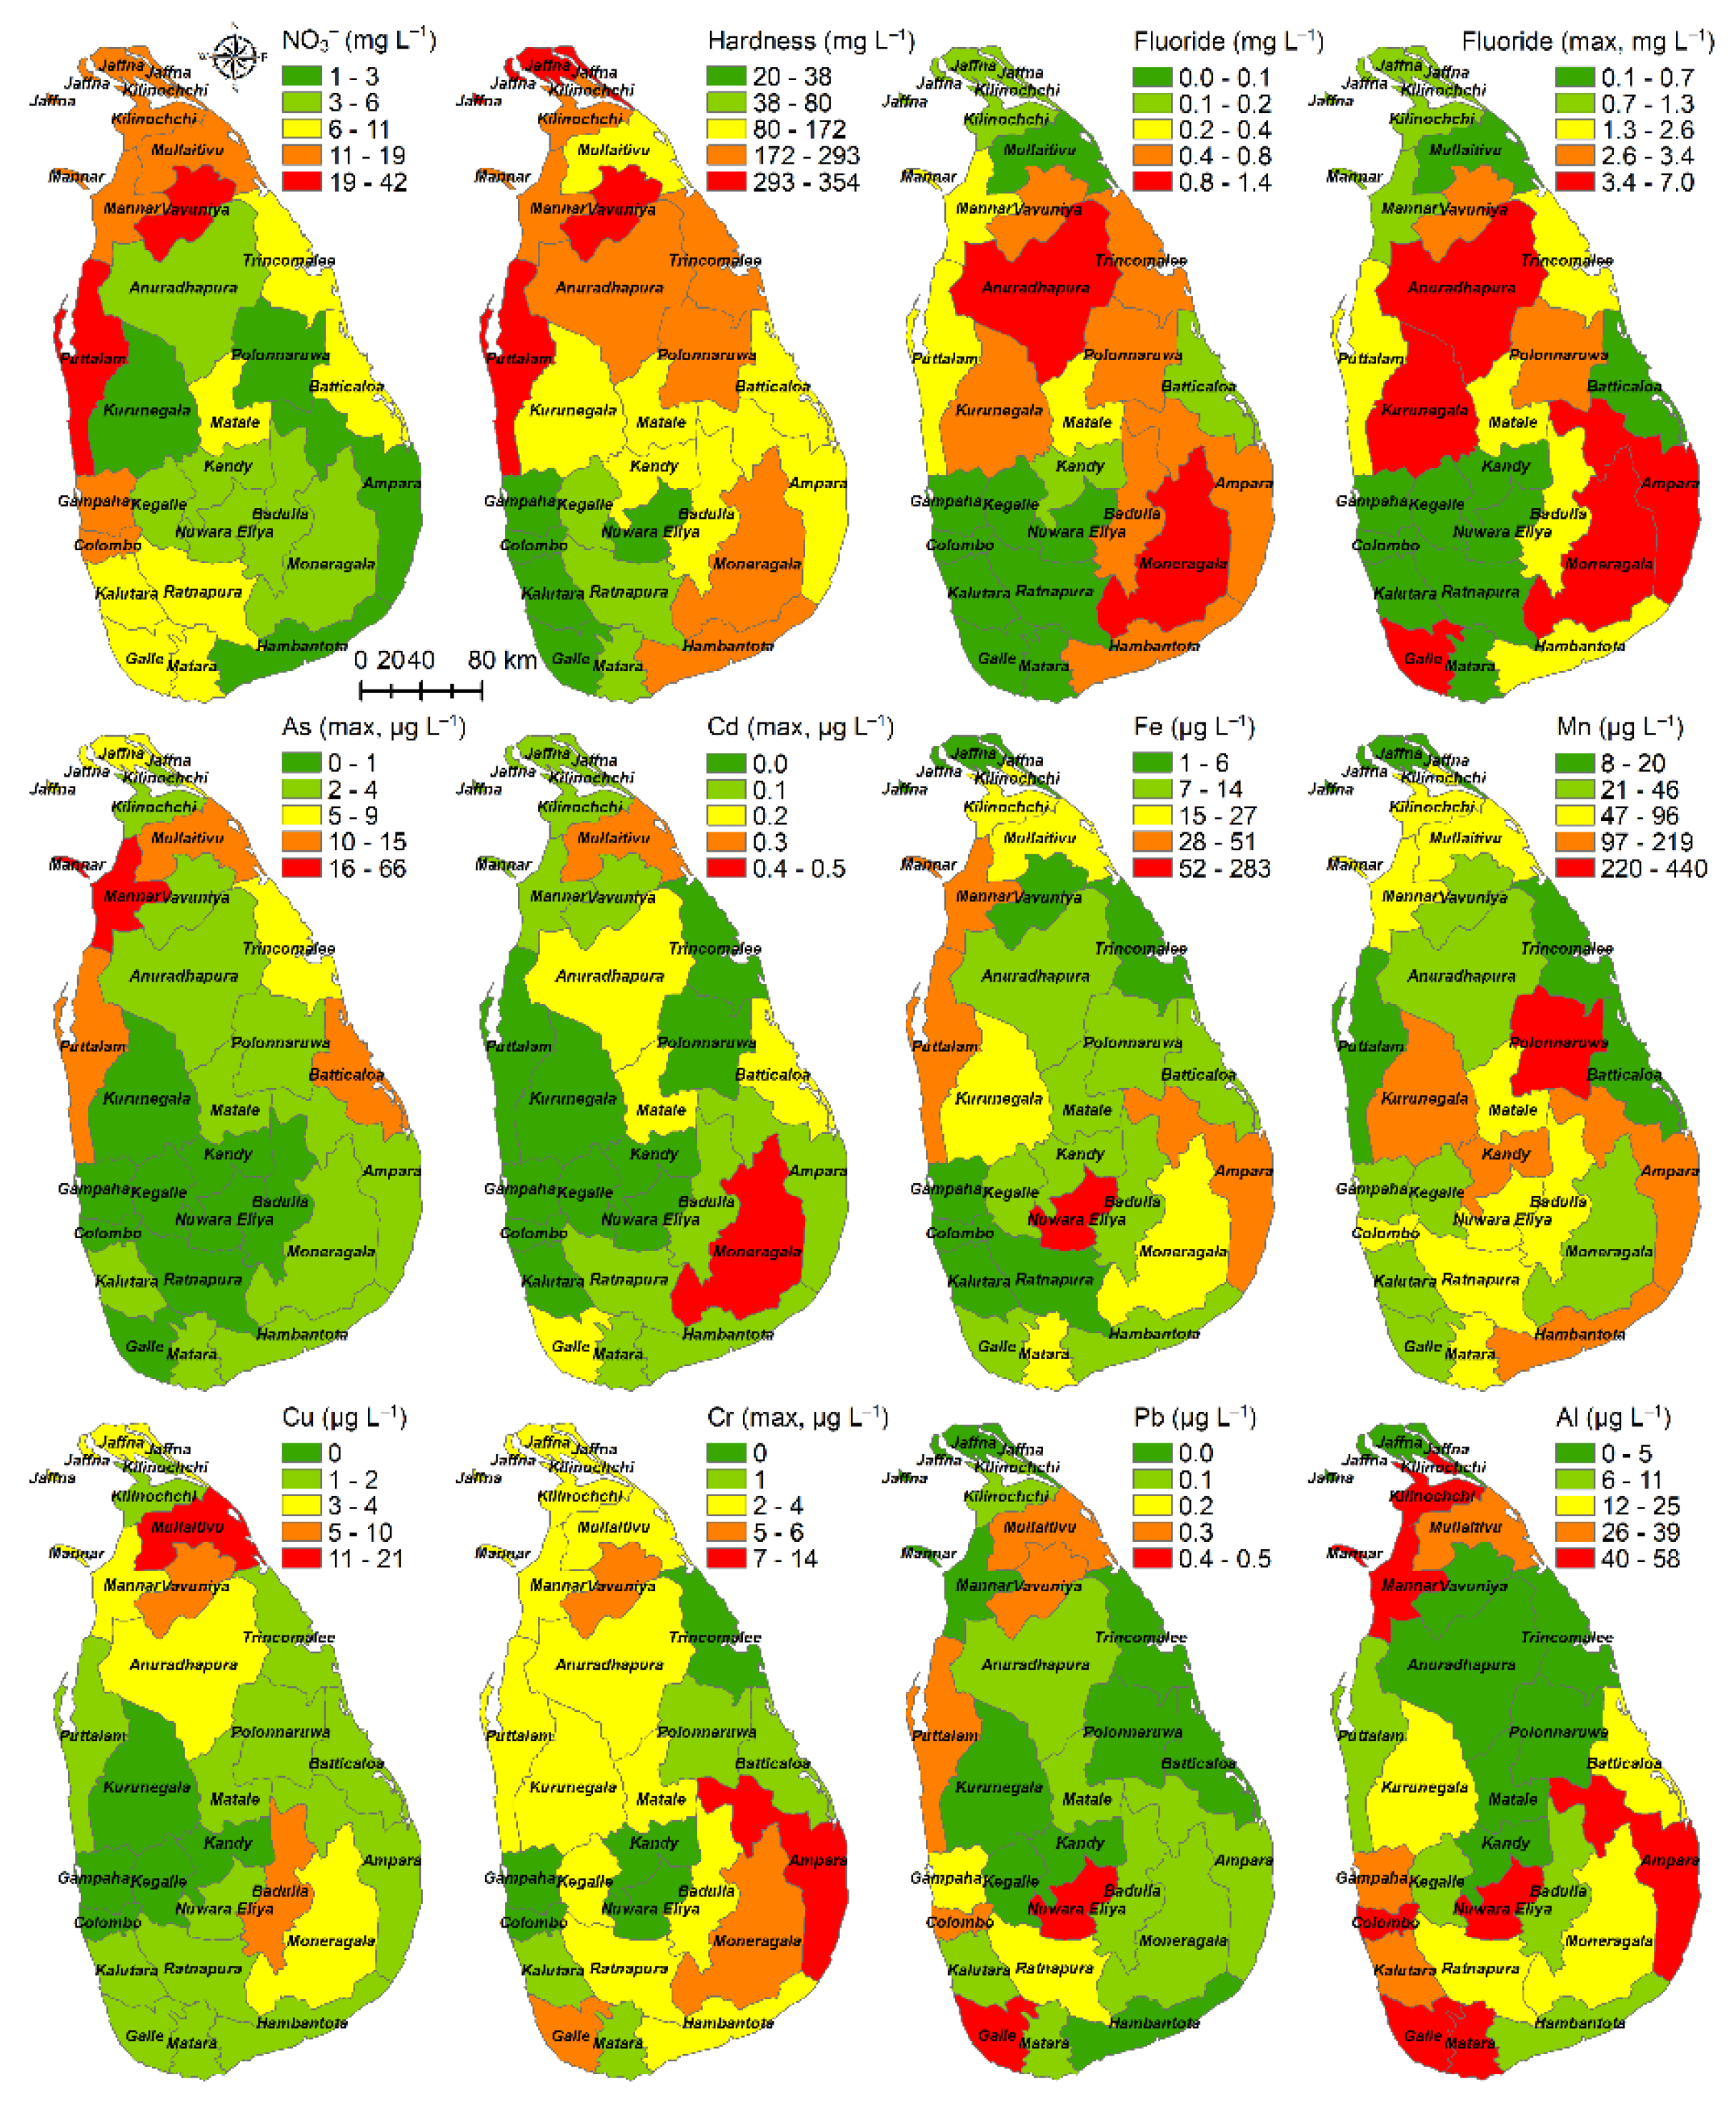
3.1. Spatial Characteristics of Groundwater Geochemistry

3.1.1. Nitrate, Hardness, and Fluoride

Groundwater quality parameters varied considerably in different regions (Figure 2). The average concentration of NO3 in the district ranged from 1 mg/L to 42 mg/L. The highest concentration (366 mg/L) and highest average concentration (42 ± 90 mg/L) of NO3 were observed in the Puttalam district, where 49.7% of the land area is used for agriculture. The World Health Organization (WHO) guideline for NO3 in drinking water is 50 mg/L [34]. The maximum NO3 concentration in 13 out of 25 districts exceeded 50 mg/L limit. Higher concentrations of NO3 were also found in other districts where a high percentage of land is used for agricultural purposes, for instance, the Jaffna (62.9%), Mannar (35.3%), and Vavuniya (28%) districts. Agricultural regions in the coastal zone are mainly underlain by recent unconsolidated sediments in which farmers excessively use a large amount of nitrate fertilizers for their cultivations, leading to nitrate pollution of groundwater [35]. Manure may be a cause for the high NO3 concentration found in the Vavuniya district [36].
The average hardness ranged from 20 to 354 mg/L. The highest hardness (1734 mg/L) was found in the Hambantota district, while the highest average hardness (354 ± 190 mg/L) was noted in the Jaffna district, where the percentage of carbonate sedimentary rocks (37.1%) is the highest. The Puttalam and Vavuniya districts also showed a higher hardness. Since water hardness poses no apparent health concerns, there are no guidelines or regulations for optimum hardness in drinking water [34]. Considering the impact of hardness on water palatability, a non-health-based standard of 250 mg/L (as CaCO3) was defined by the Sri Lankan Standard for drinking water [37]. The geographic distribution of CKDu cases in the endemic region showed a strong association with the consumption of hard water [27].
The average concentration of fluoride ranged from <0.02 mg/L to 1.4 mg/L in Sri Lanka. The highest average concentration of fluoride (1.4 ± 1.3 mg/L) was recorded in the Moneragala district. High concentrations of fluoride (max: 7 mg/L; ave: 1.1 ± 0.9 mg/L) were also found in the Anuradhapura district. Spatially, fluoride showed a high concentration in the dry zone and a low concentration in the wet zone and also in the northern coastal zone. The spatial distribution of fluoride is closely resembled with that of the hardness. Although the maximum guideline value for fluoride in drinking groundwater as suggested by the WHO is 1.5 mg/L [34], and the limit suggested by the Sri Lankan Standard is 1.0 mg/L [37], both values cannot be applicable to the dry zone regions of Sri Lanka due to a higher water consumption for drinking under prevailing hot and dry ambient conditions [19]. The average concentrations of fluoride recorded in all the districts were lower than 1.5 mg/L, and only 9.9% of the samples had a concentration higher than 1.5 mg/L [36]. The fluoride concentration in Sri Lanka is much lower than that in many other regions in the world, however dental and skeletal fluorosis cases are common in these areas [10,16,19].

3.1.2. Heavy Metals and Metalloids

In some studies of potential nephrotoxic effects of environmental exposure to heavy metals and metalloids, mainly As, Cd, and Pb have been identified as causative factors for CKDu [18,25,27,38,39], although some studies reject this hypothesis [7,8,15,20,40]. These metals in groundwater may be derived from rock weathering or by human activities, such as the use of agricultural chemicals [18]. Arsenic in groundwater has been proposed as a causal factor for CKDu in Sri Lanka [18,27]. The WHO guideline value and Sri Lankan standard limit for As are 10 µg/L [34,37]. The highest concentration (66 µg/L) and highest average concentration (7 ± 11.7 µg/L) of As were recorded in the Mannar district. High As concentrations were also found in the Batticaloa, Mullaitivu, and Puttalam districts that had the maximum As concentration higher than 10 µg/L. Some recent detail studies also noted higher As concentrations in groundwater, particularly in groundwater extracted from sedimentary aquifer systems [35,41].
Cd is known to be a toxic metal and has been listed as one of the causes of CKDu due to the well-known nephrotoxicity [12,25]. The highest Cd concentration in this study was 0.5 µg/L and recorded in the Moneragala district. All of the well water samples had a Cd concentration much lower than the WHO guideline value of 3 µg/L [34]. The highest Pb concentration (288 µg/L) was noted in the southern district of Galle, however, it may be an outlier. If this data was eliminated, the highest Pb concentration of 4.6 µg/L was recorded in the Anuradhapura district, but it is lower than the WHO guideline value of 10 µg/L [34].
Fe is one of the most abundant metals in the Earth’s crust and is an essential human micronutrient [34]. Mn usually coexists with Fe and is also one of the most abundant metals in the Earth’s crust. Cu is an essential nutrient and also a contaminant of drinking water. The highest concentrations and highest average concentrations of Fe (max: 828 µg/L; ave: 283 µg/L), Mn (max: 9772 µg/L; ave: 440 µg/L), and Cu (max: 443 µg/L; ave: 21 µg/L) were recorded in the Nuwara Eliya, Polonnaruwa, and Mullaitivu districts, respectively. The WHO guideline value for Cu in drinking water is 2 mg/L, but no WHO guideline values for Fe and Mn in drinking water are proposed [34]. The highest Cr concentration (14 µg/L) was found in the Ampara district, yet the level is lower than the WHO guideline value for Cr in drinking water of 50 µg/L [34]. The highest concentration (1457 µg/L) and highest average concentration (58 µg/L) of Al were found in the Moneragala and Nuwara Eliya districts, respectively. The maximum guideline value for Al in drinking water suggested by the WHO is 200 µg/L [34], and 2.3% of the samples exceeded the guideline value [36].

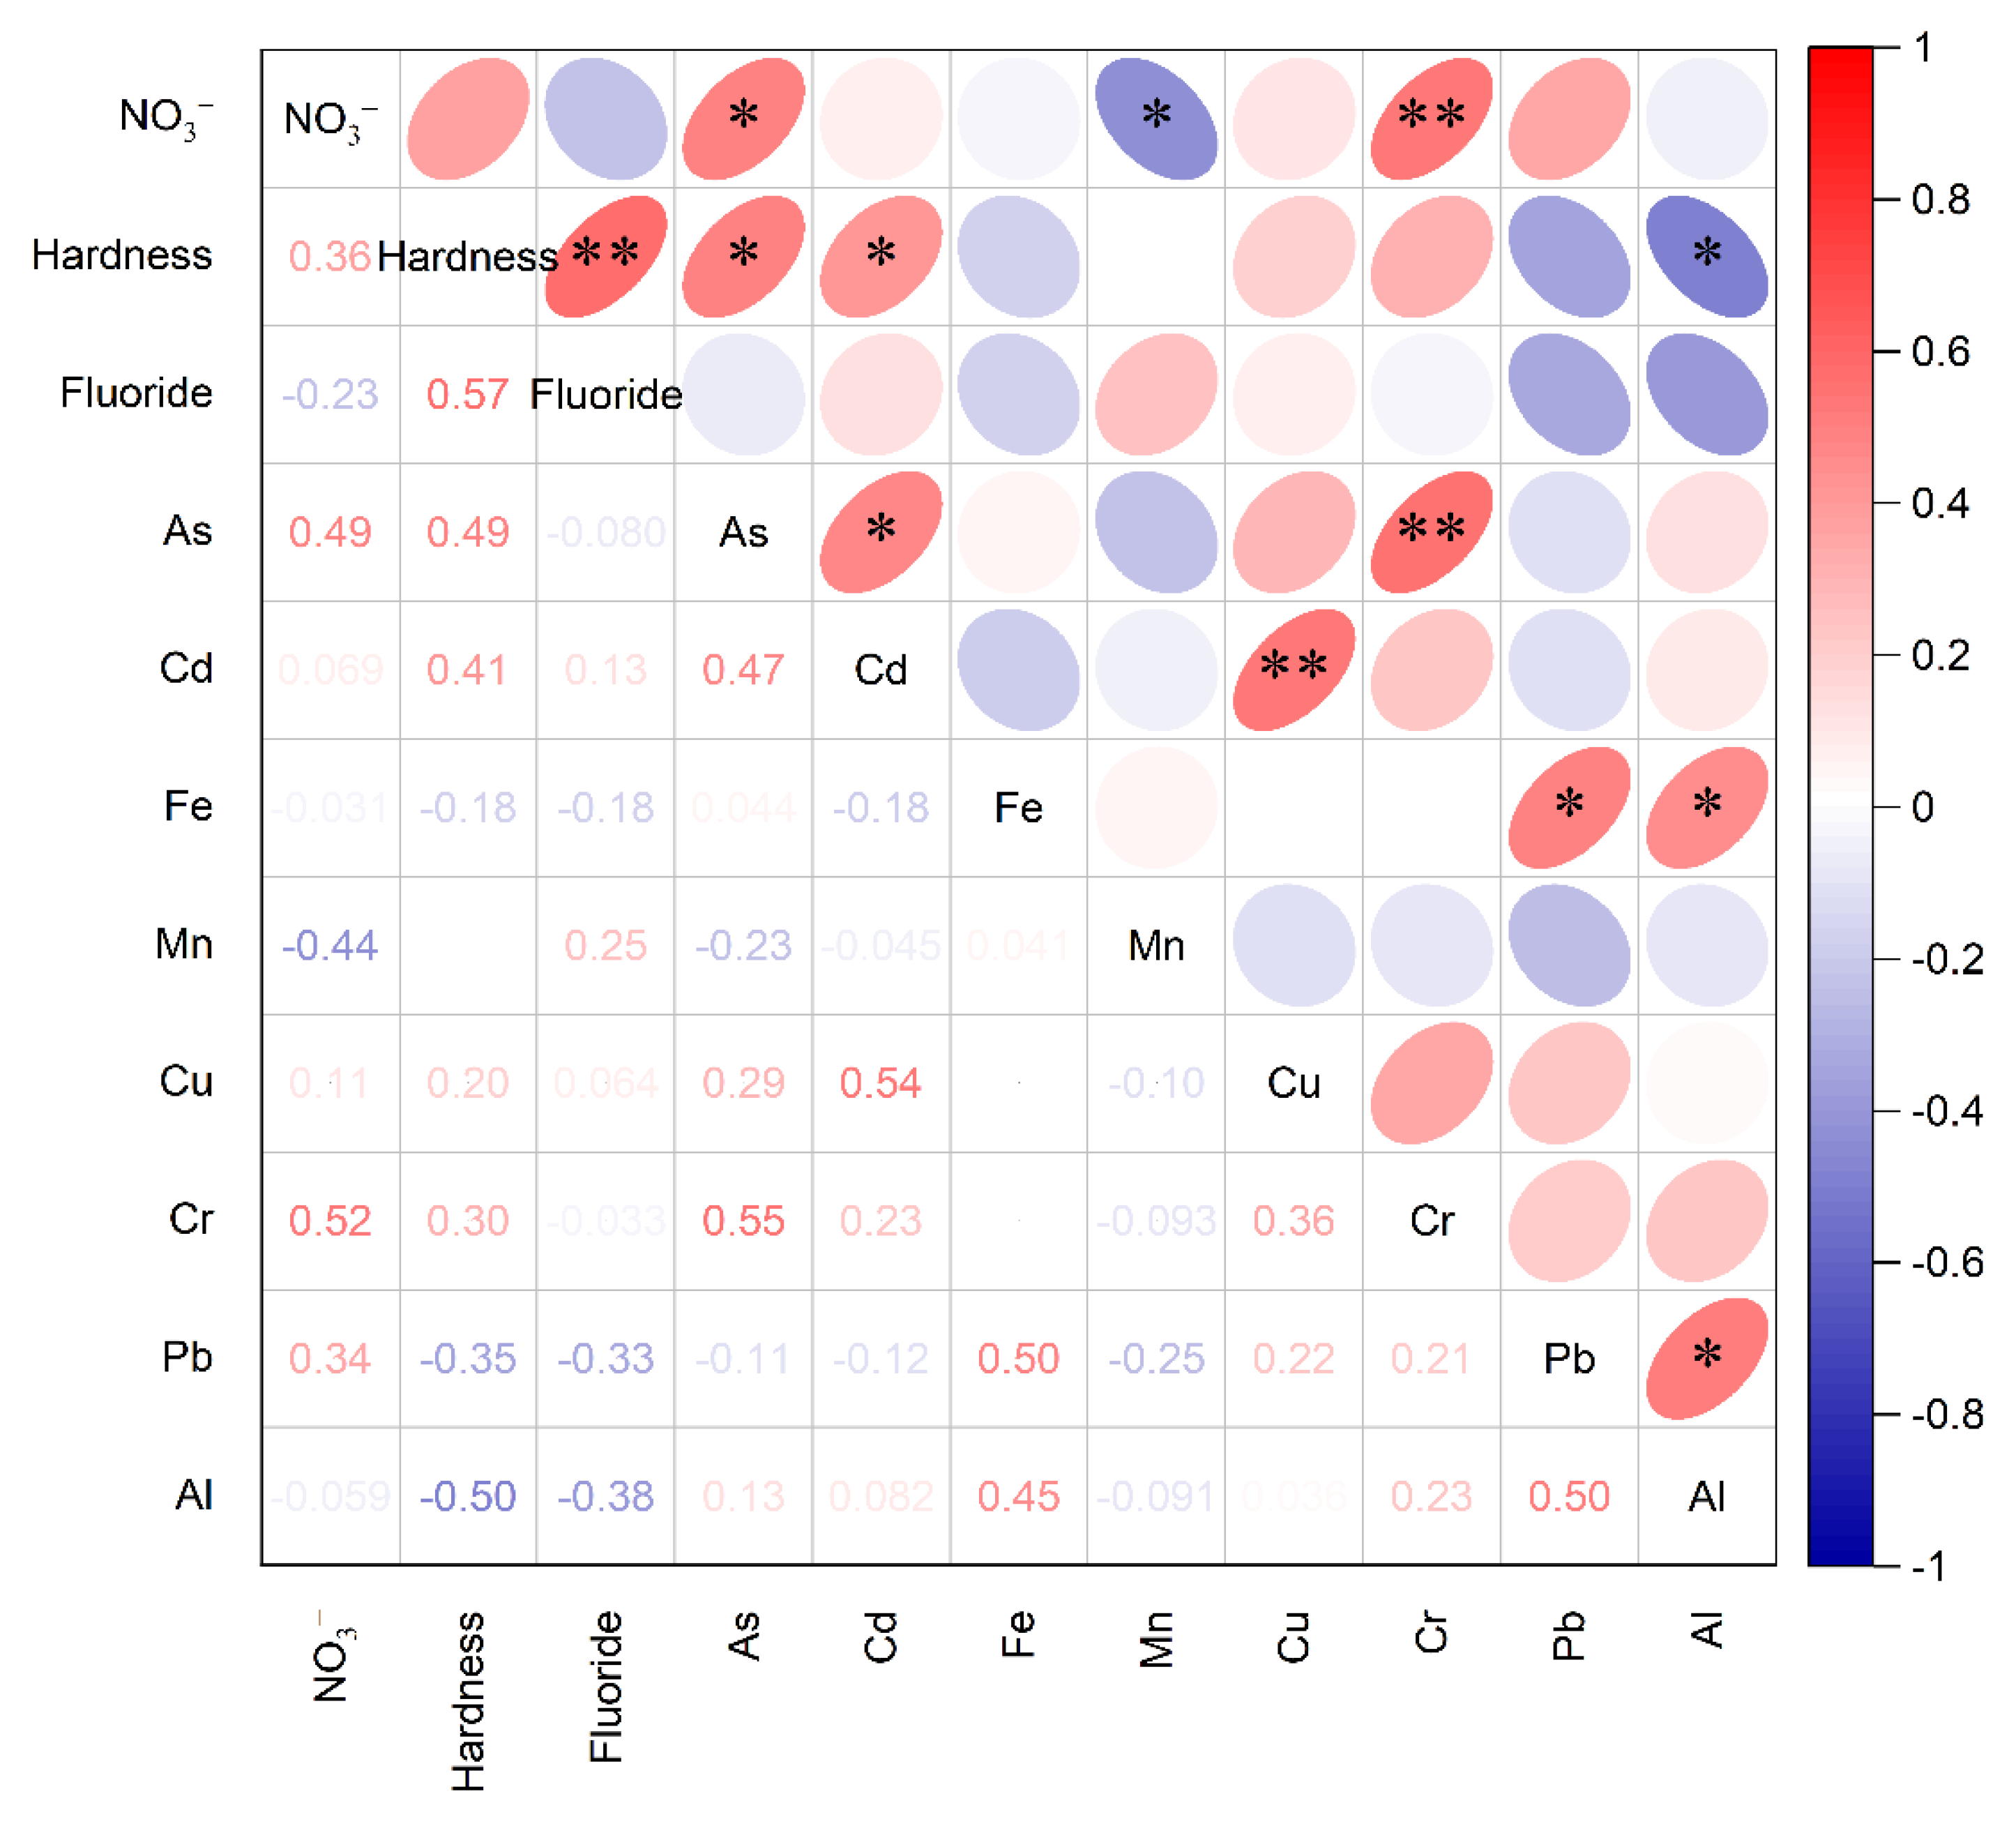
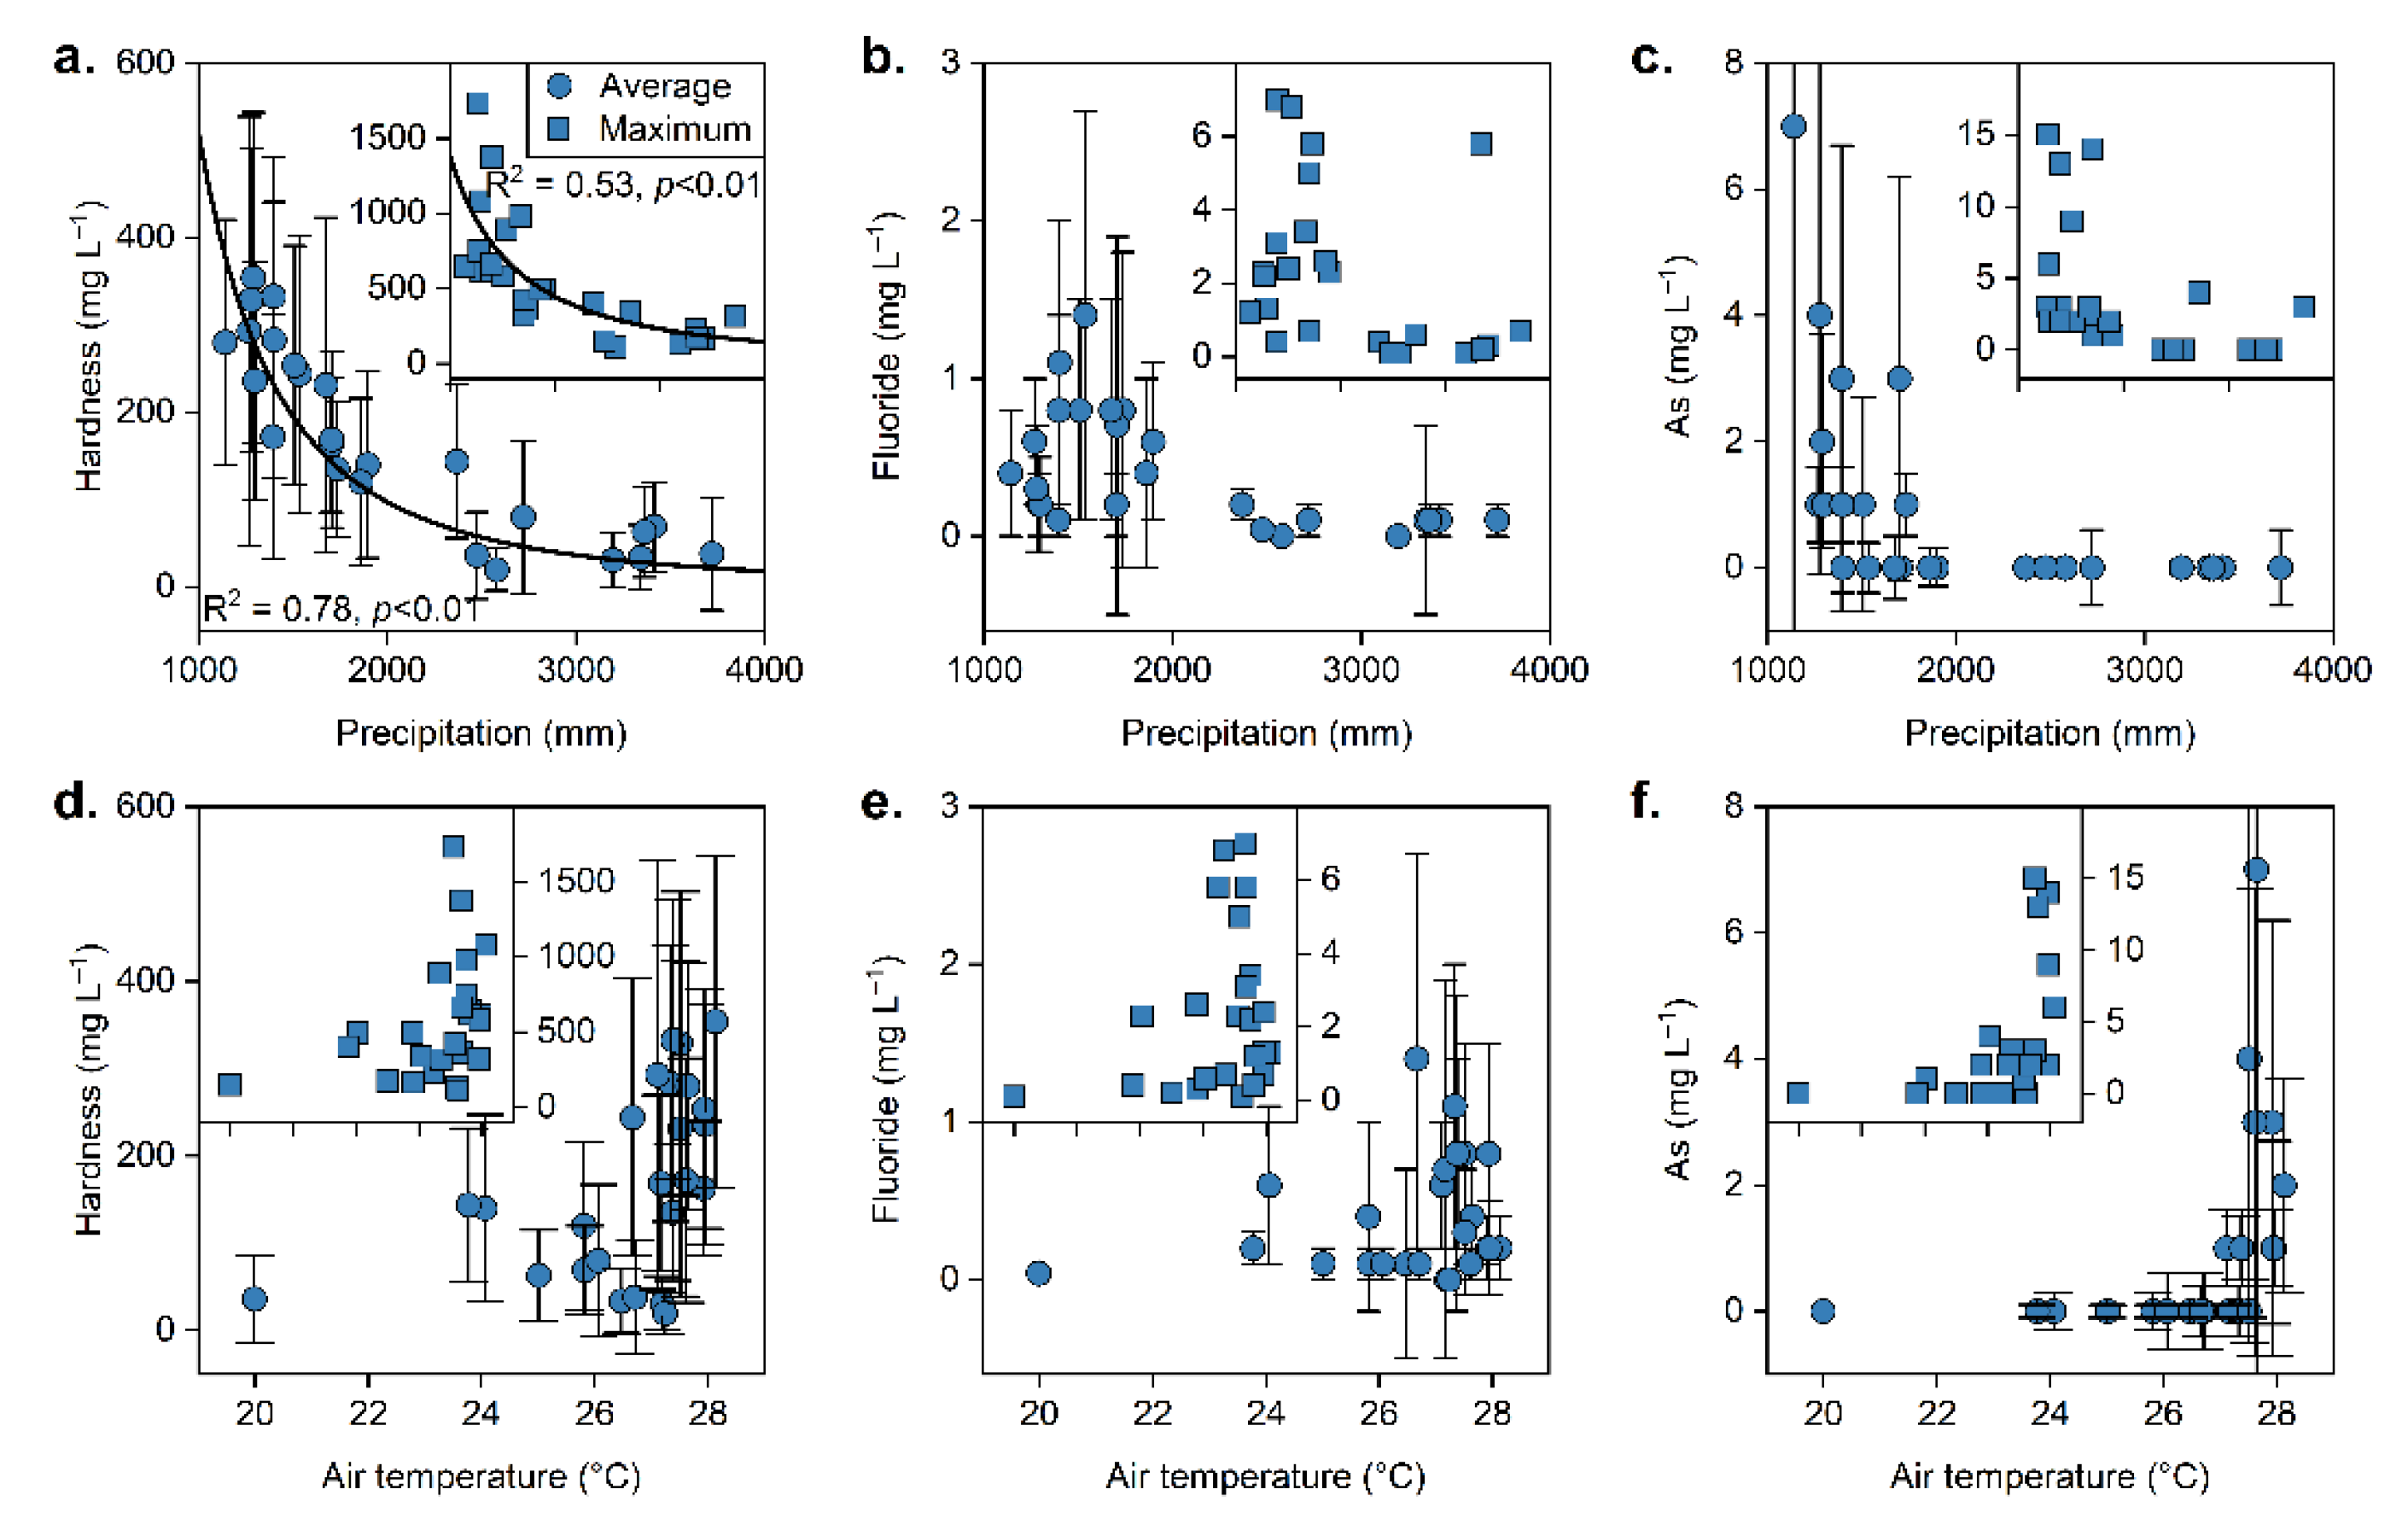
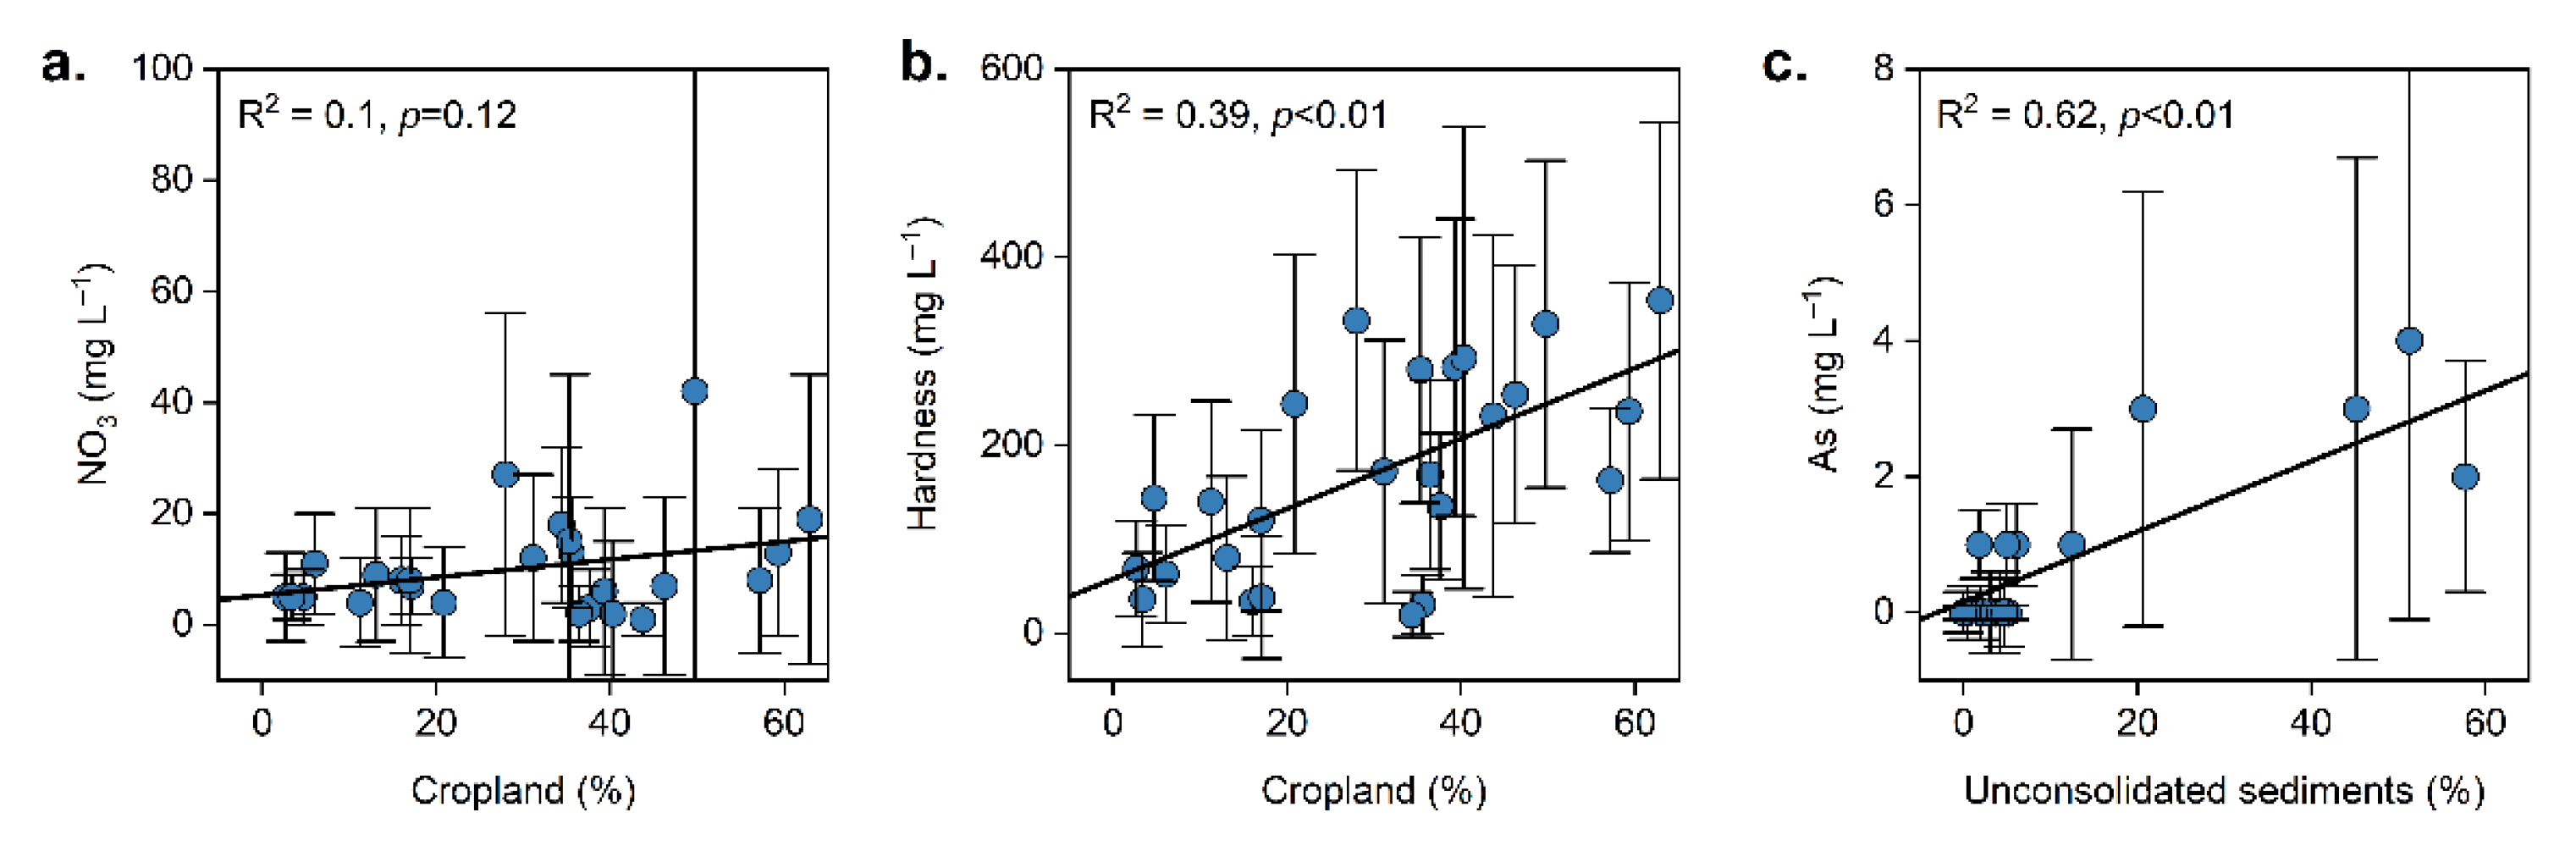
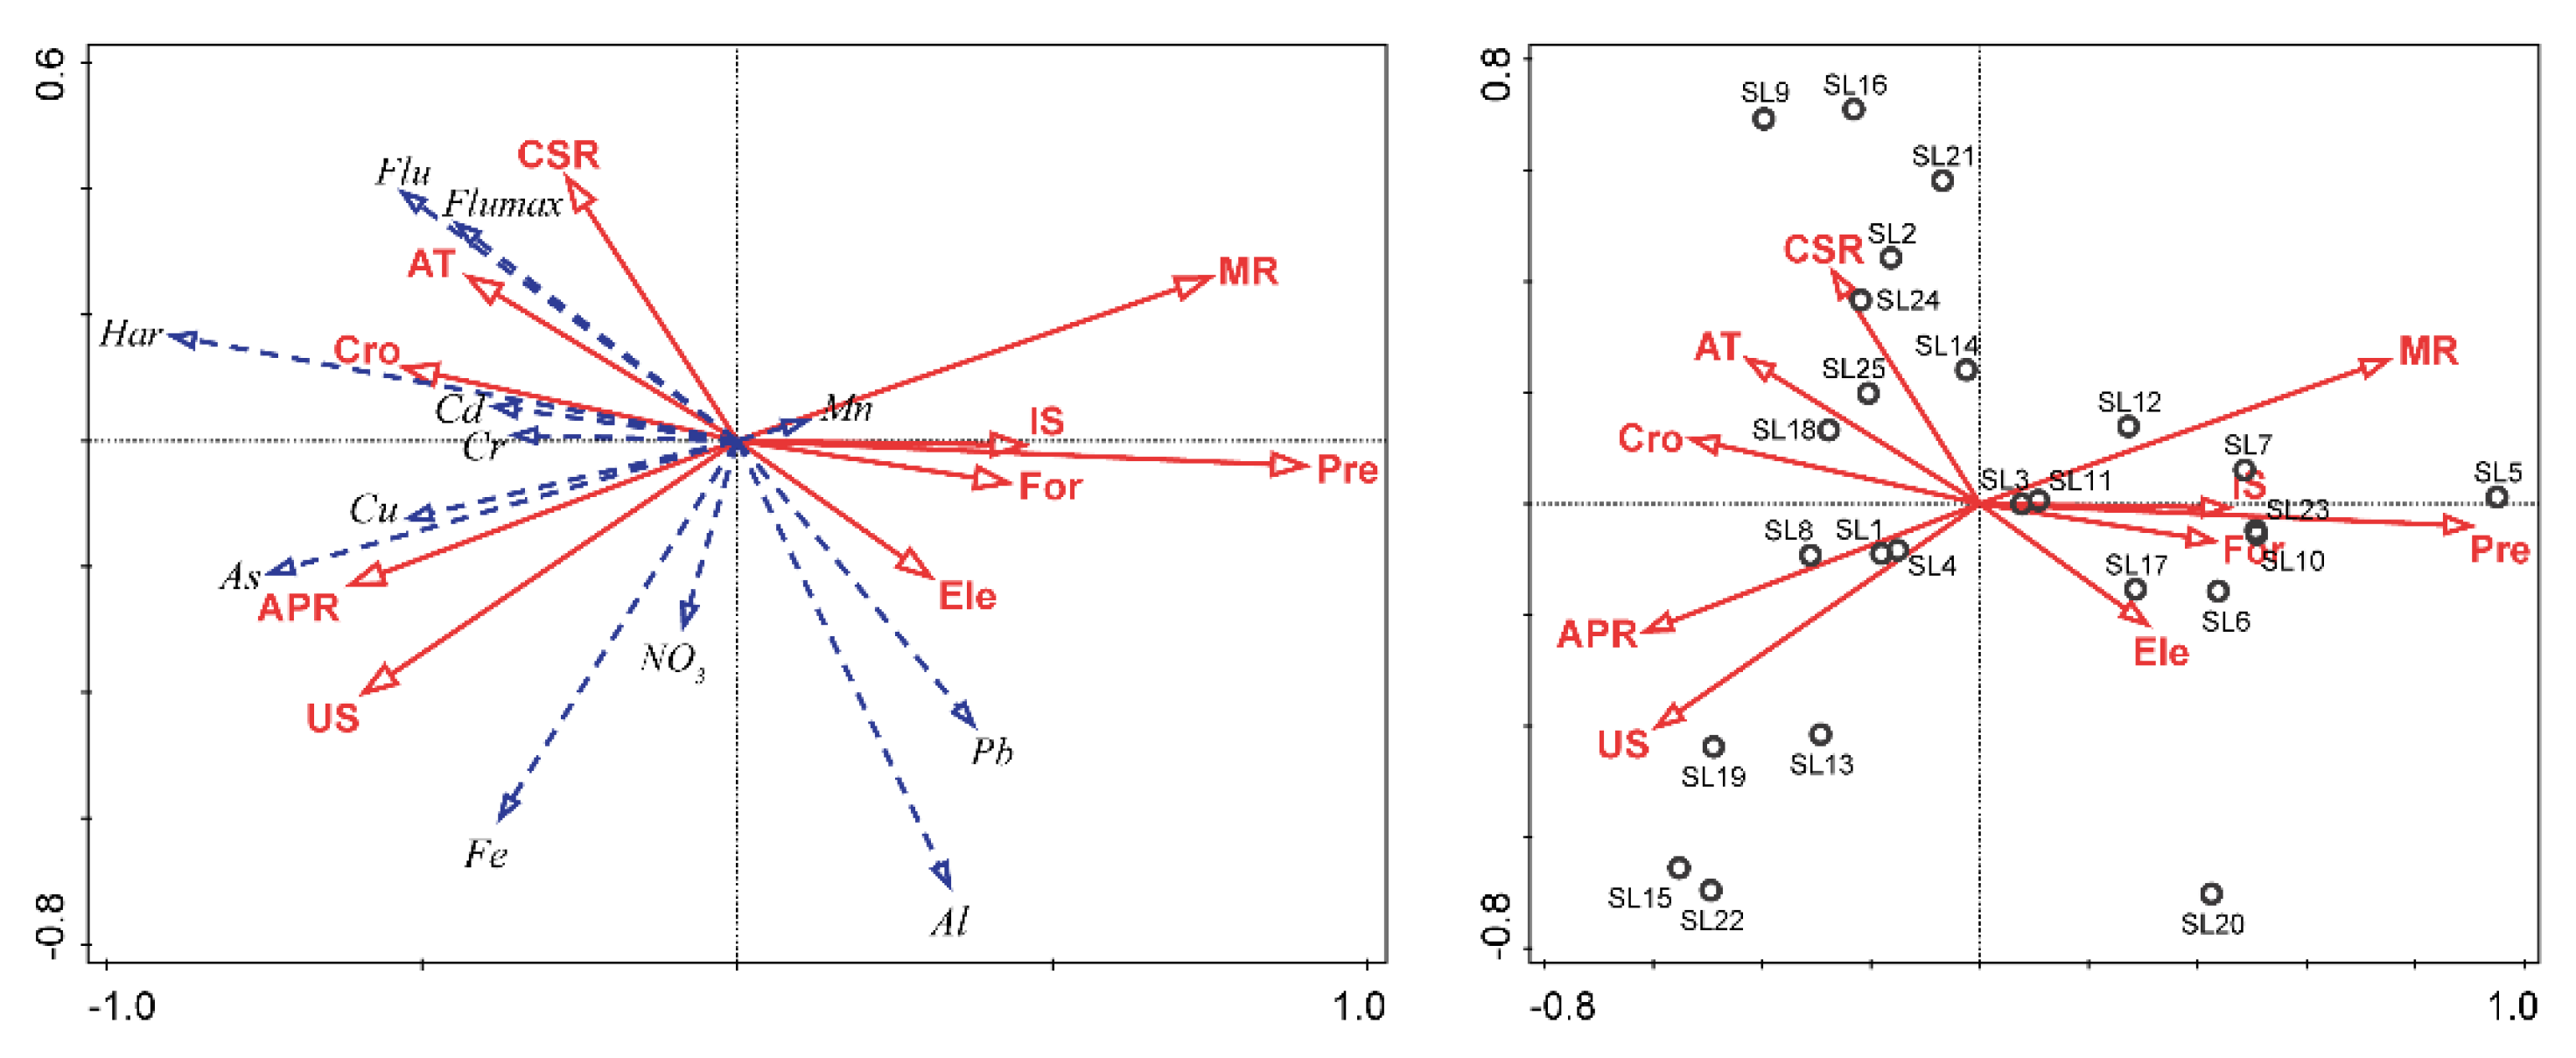
3.2. Natural and Anthropogenic Controls on Groundwater Geochemistry

The correlation matrix demonstrated that there were significant positive correlations among NO3, As, and Cr (p < 0.05) (Figure 3), indicating the higher contamination of As and Cr of groundwater in agricultural areas. Water hardness was positively correlated with fluoride (R = 0.57, p < 0.01), which suggests that they may be affected by similar geogenic factors and processes, such as the weathering of fluoride-bearing minerals under the hot climatic condition and excessive evaporation in the dry zone [19,42]. Cd and Cu showed a significant positive correlation (R = 0.54, p < 0.01), implying that they may be derived from the same source.
PCA was employed to identify the associations between groundwater quality parameters and their potential sources [43]. Four principal components (PCs) with eigenvalues exceeding 1 were identified, and the PCA results are shown in Table 1. The first PC was dominated by NO3, water hardness, As, and Cr, with high loadings of 0.86, 0.67, 0.7, and 0.71, respectively, explaining 26.5% of the total data variance. The second PC explained 24.6% of the total data variance and was mainly contributed by Fe, Pb, and Al, with higher loadings of 0.81, 0.77 and 0.78, respectively. The third PC was mainly contributed by Cd and Cu, with high loadings of 0.88 and 0.76, respectively, explaining 12.6% of the total data variance. The fourth PC was mainly contributed by fluoride and Mn, with high loadings of 0.75 and 0.72, respectively, and explained 9.5% of the total data variance. The four PCs totally accounted for 73.2% of the total data variance. Agrochemicals especially phosphate fertilizer used in agriculture have been identified as the main source of As in areas affected with CKDu in Sri Lanka [18]. The groundwater in the dry zone has high fluoride concentrations due to the water–rock interaction with the aquifer [15,19]. In addition, the occurrence of CKDu is strongly associated with the consumption of hard water in the rural dry zone [22,27]. Therefore, the first PC may be related to the agricultural activities in the rural dry zone, suggesting the contributions of anthropogenic sources to NO3, As, and Cr. In contrast, other PCs may be dominated by natural geogenic sources and processes, especially bedrock weathering.
The groundwater quality in Sri Lanka is mainly influenced by environmental factors such as lithology, land use, and climatic condition, and anthropogenic activities including agricultural practices, disposal of domestic sewage, and industrial effluents [16,17,18]. To explore the potential influencing factors of groundwater quality in Sri Lanka, the relationships between the environmental factors and the groundwater quality parameters were examined. As shown in Figure 4, water hardness showed a negative correlation with the precipitation (for average hardness: R2 = 0.78, p < 0.01; for maximum hardness: R2 = 0.53, p < 0.01), following a power law relationship. Similar relationships were also found between fluoride and precipitation, and between As and precipitation. This suggests that in the dry zone with low precipitation, the concentrations of fluoride and As in groundwater were higher than those in the wet zone where excessive precipitation is characterized. Since lower precipitation is generally accompanied by high ambient temperature in Sri Lanka, the higher concentrations of hardness, fluoride, and As were also found in areas with high air temperature.
The positive correlations between NO3 and hardness and cropland suggest the effects of agricultural activities on groundwater quality and that most high nitrate regions are underlain by sedimentary limestone sequences (Figure 5). In Sri Lanka, all wells with a high As concentration were located on a specific soil type of “sandy regosols on recent beach and dune sands” [36]. The positive correlation between As concentration and unconsolidated sediments and the spatial characteristics of As concentration indicate that As had a geological source. Amarathunga, et al. (2019) [44] noted that As is released from coatings of sand grains due to reductive dissolution under near natural pH condition in the Mannar region where a majority of wells exceeded the WHO recommended level of As.
RDA was used to assess the explanation of variations of the groundwater quality parameters by the environmental factors. The RDA results provided overall descriptions of the influences of environmental factors on groundwater geochemistry [45]. The results showed that the environmental factors can account for 58% of the spatial variation in the overall groundwater geochemistry (pseudo-F = 2.5; p = 0.002). The first two axes explained most of the spatial variation of groundwater geochemistry, with the first axis explaining 26% of the variation and the second axis explaining 16% of the variation. Ordination diagrams resulted from RDA showed the relationships between the groundwater quality parameters and the potential influencing factors (Figure 6). The results indicated that hardness was positively correlated with agricultural lands while fluoride concentration was positively correlated with ambient temperature. By contrast, precipitation and forest were negatively correlated with most of the groundwater quality parameters. These results indicate the synergetic controls of lithology, land use, and climate on the groundwater quality in Sri Lanka.

3.3. Relationships between Groundwater Quality and Occurrence of CKDu

In the past three decades, possible etiology of CKDu has been extensively explored through multi-disciplinary studies. The CKDu distribution related to geography and socio-economy showed that the possible etiology is related to geogenic environment and occupational factors [6,9,39,46,47]. The long-term exposure to various nephrotoxic elements through drinking groundwater is widely suspected due to the geographical distribution of CKDu [7,8,15,16,20,21,28,40]. CKDu in Sri Lanka was first reported from the north central province of the rural dry zone, and the main victims of CKDu are young male farmers with substandard socio-economic background [6,10,39]. In the worst affected areas of CKDu, more than 98% of the population had completely relied on groundwater as their primary source for drinking or cooking at least five consecutive years between 1999 and 2018 [10]. This indicates that groundwater quality may interfere with human health in CKDu endemic region.

3.3.1. Relationship between Fluoride and CKDu

Fluoride has been proposed as a causal factor for CKDu through drinking water. It is suggested that the source of F is bedrock weathering [19,21,22]. Climatic and hydrological conditions were found to be related to the anomalous concentrations of fluoride in the groundwater in Sri Lanka [19]. Fluoride may be an essential element for humans, for instance, fluoride is a beneficial element in the prevention of dental caries [34]. However, elevated fluoride intakes can have more detrimental effects such as dental and skeletal tissues [34]. Previous studies have revealed the dose–effect relationships between drinking water fluoride levels and damage to kidney functions [11,24]. High fluoride concentrations in drinking water elevated the levels of renal and liver function enzymes in serum and caused severe histological changes of the liver and kidneys [48]. Due to its high rank in the Hofmeister Series for denaturing proteins of the kidney membrane, fluoride may contribute to CKDu [20]. In this study, high fluoride concentrations were found in the dry zone where CKDu has its higher prevalence (Figure 1). Interestingly, no CKDu was observed in the areas in the southeast where the fluoride concentration in groundwater was greater than 1.0 mg/L [31]. This suggests that the high concentration of fluoride in groundwater is not only the factor affecting the occurrence of CKDu. The interaction of fluoride with aluminum to form nephrotoxic aluminum fluoride complexes has been proposed as a cause of CKDu [26]. In addition, when fluoride interacts with major cations (Ca2+, Mg2+, and Na+) and metals such as cadmium, it is suspected that it will aggravate kidney failure [12,21,22,28,49]. Therefore, the synergistic effect between fluoride and major ions, and metals on kidney functions should be paid more attention.

3.3.2. Water Hardness and Major Ions

Hardness in water is caused by a variety of dissolved polyvalent metallic ions, predominantly the cations of Ca and Mg. As classification of hardness, the ranges of 0–60 mg/L, 61–120 mg/L, 121–180 mg/L, and >181 mg/L are classified as soft, moderately hard, hard, and very hard, respectively [34]. Previous studies revealed the highly statistically positive correlation between the occurrence of CKDu and the hard water consumption in Sri Lanka, and found that 96% of CKDu patients consumed hard or very hard water from wells in shallow regolith aquifers for at least 5 years [12,27]. However, many studies found that hard to very hard groundwater is not exclusive to all CKDu endemic areas [14,16]. For instance, only 14% of the samples from Mahiyanganaya, a high CKDu endemic dry zone area of Sri Lanka, had hard to very hard groundwater [16]. Moreover, the groundwaters from some areas of Sri Lanka that are not seriously affected by CKDu had very hard waters, such as the districts of Puttalam (329 ± 174 mg/L) and Jaffna (354 ± 190 mg/L). Nevertheless, hardness might interfere with other chemical constituents in water to form various complexes harmful to human health [8,15].

3.3.3. Nephrotoxic Heavy Metals and Metalloids

Heavy metals and metalloids such as As and Cd have been considered as important risk factors for CKDu [18,25,38]. The application of pesticides and fertilizers in rice paddy cultivation in Sri Lanka is a possible source of high Cd [25]. In this study, the Cd concentrations of all the well water samples were significantly below the WHO guideline value. Similar results were also reported by many other studies [16,40,46]. Moreover, previous studies noted that the levels of Cd and As of drinking water and rice samples collected from the affected areas of CKDu were within the levels recommended by WHO and Sri Lankan standard and did not indicate contamination in any form [40]. A number of studies also found that in the CKDu endemic areas of Sri Lanka, the As concentration in groundwater is significantly low [8,15,16,46]. Therefore, it is suggested that As and Cd in groundwater are unlikely to be risk factors for CKDu in Sri Lanka. In addition, Jayasumana et al. (2014) [27] have demonstrated the link between hardness and As. They proposed that As mainly derived from chemical fertilizers and pesticides can eventually damage kidney tissue when combined with Ca and/or Mg in groundwater. In addition, there is considerable evidence that agricultural workers in the CKDu endemic areas are exposed to As, but the exact source and entry mode of As are still controversial [27].

4. Conclusions

This study investigated the spatial characteristics of groundwater geochemistry in Sri Lanka. Groundwater quality data of 1304 water samples collected from 2010 to 2014 were statistically analyzed. Land use and lithology were quantitatively described to examine their relationships with the groundwater quality parameters. The data of ambient temperature and precipitation were used to explore the effects of climatic conditions on groundwater quality. The results showed that the high concentrations of NO3 were found in the districts with a high percentage of cropland, especially in the districts in the coastal zone. The Puttalam district had the highest concentration and highest average concentration of NO3. The samples from the dry zone had a higher hardness, and in the Jaffna district, where the percentage (37.1%) of carbonate sedimentary rocks is the highest, the average hardness (354 ± 190 mg/L) of samples was the highest. Similar to the spatial distribution of hardness, fluoride also showed a high concentration in the dry zone, and 9.9% of the samples had a concentration higher than the WHO guideline value of 1.5 mg/L. Heavy metals and metalloids such as As, Cd and Pb have been suggested as causal factors for CKDu in Sri Lanka. The maximum As concentrations of the samples in the Mannar, Batticaloa, Mullaitivu, and Puttalam districts were higher than the WHO guideline and Sri Lankan standard value (10 µg/L). The Cd and Pb concentrations of all the samples were lower than the WHO guideline values of 3 µg/L and 10 µg/L, respectively. In addition, all of the samples had Cu and Cr concentrations below the WHO guideline values, and 2.3% of the samples had a concentration of Al above the WHO guideline value (200 µg/L).
Significant positive correlations (p < 0.05) among NO3, As, and Cr were observed, suggesting the effects of agricultural activities on As and Cr concentrations. The significant positive correlation between water hardness and fluoride indicated that they might be affected by rock weathering in the dry zone. According to the results of PCA, four PCs were identified and explained 73.2% of the total data variance. Considering the concentrations and spatial characteristics of groundwater quality parameters, PC1 with high loadings of NO3, hardness, As, and Cr was considered to be affected by agricultural activities, and other PCs was primarily attributed to natural sources and processes. Hardness, fluoride, and As concentration were positively correlated with precipitation and negatively correlated with air temperature, showing a clear difference in groundwater quality between different climatic regions, and suggesting that groundwater geochemistry in Sri Lanka is closely related to climatic conditions. In addition, NO3 concentration and water hardness had positive correlations with cropland, and As concentration had a positive correlation with unconsolidated sediments, implying the effects of land use and lithology on groundwater geochemistry. The RDA results showed that 58% of the spatial variation in the overall groundwater geochemistry can be accounted by the environmental factors.
To our knowledge, there are few previous studies that quantitatively describe land use and lithology, and identify the natural and anthropogenic controlling factors of groundwater quality in Sri Lanka, especially at a national scale. This study provided key insights of the effects of environmental factors on groundwater quality in Sri Lanka, which considerably helps to investigating the relationships between groundwater quality and the occurrence of CKDu. In the future, high spatial-temporal resolution sampling is needed to unravel controlling factors of groundwater quality, and multidisciplinary studies are required to identify risk factors of CKDu in Sri Lanka.

Supplementary Materials

The following are available online at https://www.mdpi.com/article/10.3390/w13192724/s1, Table S1: Statistics of the groundwater quality parameters for each district in Sri Lanka, Table S2: Characteristics of the 25 administrative districts in Sri Lanka.

Author Contributions

Conceptualization, S.X. and S.-L.L.; methodology, S.X. and F.Y.; resources, S.-L.L. and F.Y.; data curation, S.X. and S.-L.L.; writing—original draft preparation, S.X., S.-L.L., F.Y., C.U. and R.C.; writing—review and editing, S.X., S.-L.L., F.Y., C.U. and R.C.; visualization, S.X. and S.-L.L.; supervision, C.U. and R.C.; project administration, S.-L.L. and R.C.; funding acquisition, S.-L.L. and R.C. All authors have read and agreed to the published version of the manuscript.

Funding

This work was carried out as collaborative research, funded by the National Natural Science Foundation, China (Grant No. 41861144026) and National Science Foundation, Sri Lanka (Grant No. ICRP/NSF-NSFC/2019/BS/02).

Institutional Review Board Statement

Not applicable.

Informed Consent Statement

Not applicable.

Data Availability Statement

The data presented in this study are available on request from the corresponding author.

Conflicts of Interest

The authors declare no conflict of interest.

References

  1. Atkins, R.C. The epidemiology of chronic kidney disease. Kidney Int. 2005, 67, S14–S18. [Google Scholar] [CrossRef] [Green Version]
  2. Jha, V.; Garcia, G.G.; Iseki, K.; Li, Z.; Naicker, S.; Plattner, B.; Saran, R.; Wang, A.Y.-M.; Yang, C.-W. Chronic kidney disease: Global dimension and perspectives. Lancet 2013, 382, 260–272. [Google Scholar] [CrossRef]
  3. Weaver, V.M.; Fadrowski, J.J.; Jaar, B.G. Global dimensions of chronic kidney disease of unknown etiology (CKDu): A modern era environmental and/or occupational nephropathy? BMC Nephrol. 2015, 16, 145. [Google Scholar] [CrossRef] [Green Version]
  4. Almaguer, M.; Herrera, R.; Orantes, C.M. Chronic kidney disease of unknown etiology in agricultural communities. MEDICC Rev. 2014, 16, 9–15. [Google Scholar] [CrossRef]
  5. Gifford, F.J.; Gifford, R.M.; Eddleston, M.; Dhaun, N. Endemic nephropathy around the world. Kidney Int. Rep. 2017, 2, 282–292. [Google Scholar] [CrossRef] [PubMed] [Green Version]
  6. Athuraliya, N.T.; Abeysekera, T.D.; Amerasinghe, P.H.; Kumarasiri, R.; Bandara, P.; Karunaratne, U.; Milton, A.H.; Jones, A.L. Uncertain etiologies of proteinuric-chronic kidney disease in rural Sri Lanka. Kidney Int. 2011, 80, 1212–1221. [Google Scholar] [CrossRef] [PubMed] [Green Version]
  7. Chandrajith, R.; Nanayakkara, S.; Itai, K.; Aturaliya, T.N.C.; Dissanayake, C.B.; Abeysekera, T.; Harada, K.; Watanabe, T.; Koizumi, A. Chronic kidney diseases of uncertain etiology (CKDue) in Sri Lanka: Geographic distribution and environmental implications. Environ. Geochem. Health 2011, 33, 267–278. [Google Scholar] [CrossRef] [PubMed]
  8. Balasooriya, S.; Munasinghe, H.; Herath, A.T.; Diyabalanage, S.; Ileperuma, O.A.; Manthrithilake, H.; Daniel, C.; Amann, K.; Zwiener, C.; Barth, J.A.C.; et al. Possible links between groundwater geochemistry and chronic kidney disease of unknown etiology (CKDu): An investigation from the Ginnoruwa region in Sri Lanka. Expo. Health 2020, 12, 823–834. [Google Scholar] [CrossRef]
  9. Vlahos, P.; Schensul, S.L.; Nanayakkara, N.; Chandrajith, R.; Haider, L.; Anand, S.; Silva, K.T.; Schensul, J.J. Kidney progression project (KiPP): Protocol for a longitudinal cohort study of progression in chronic kidney disease of unknown etiology in Sri Lanka. Glob. Public Health 2019, 14, 214–226. [Google Scholar] [CrossRef]
  10. Kafle, K.; Balasubramanya, S.; Horbulyk, T. Prevalence of chronic kidney disease in Sri Lanka: A profile of affected districts reliant on groundwater. Sci. Total Environ. 2019, 694, 133767. [Google Scholar] [CrossRef]
  11. Ludlow, M.; Luxton, G.; Mathew, T. Effects of fluoridation of community water supplies for people with chronic kidney disease. Nephrol. Dial. Transpl. 2007, 22, 2763–2767. [Google Scholar] [CrossRef] [PubMed] [Green Version]
  12. Wasana, H.M.S.; Aluthpatabendi, D.; Kularatne, W.M.T.D.; Wijekoon, P.; Weerasooriya, R.; Bandara, J. Drinking water quality and chronic kidney disease of unknown etiology (CKDu): Synergic effects of fluoride, cadmium and hardness of water. Environ. Geochem. Health 2015, 38, 157–168. [Google Scholar] [CrossRef] [PubMed]
  13. Balasooriya, B.M.J.K.; Chaminda, G.G.T.; Weragoda, S.K.; Kankanamge, C.E.; Kawakami, T. Assessment of groundwater quality in Sri Lanka using multivariate statistical techniques. In Contaminants in Drinking and Wastewater Sources: Challenges and Reigning Technologies; Kumar, M., Snow, D.D., Honda, R., Mukherjee, S., Eds.; Springer: Singapore, 2021. [Google Scholar]
  14. Edirisinghe, E.A.N.V.; Manthrithilake, H.; Pitawala, H.M.T.G.A.; Dharmagunawardhane, H.A.; Wijayawardane, R.L. Geochemical and isotopic evidences from groundwater and surface water for understanding of natural contamination in chronic kidney disease of unknown etiology (CKDu) endemic zones in Sri Lanka. Isot. Environ. Health Stud. 2018, 54, 244–261. [Google Scholar] [CrossRef]
  15. Wickramarathna, S.; Balasooriya, S.; Diyabalanage, S.; Chandrajith, R. Tracing environmental aetiological factors of chronic kidney diseases in the dry zone of Sri Lanka—A hydrogeochemical and isotope approach. J. Trace Elem. Med. Biol. 2017, 44, 298–306. [Google Scholar] [CrossRef]
  16. Nikagolla, C.; Meredith, K.T.; Dawes, L.A.; Banati, R.B.; Millar, G.J. Using water quality and isotope studies to inform research in chronic kidney disease of unknown aetiology endemic areas in Sri Lanka. Sci. Total Environ. 2020, 745, 140896. [Google Scholar] [CrossRef]
  17. Amarathunga, A.; Kazama, F. Impact of land use on surface water quality: A case study in the Gin river basin, Sri Lanka. Asian J. Water Environ. Pollut. 2016, 13, 1–13. [Google Scholar] [CrossRef]
  18. Jayasumana, C.; Fonseka, S.; Fernando, P.U.A.I.; Jayalath, K.; Amarasinghe, M.; Siribaddana, S.; Gunatilake, S.; Paranagama, P. Phosphate fertilizer is a main source of arsenic in areas affected with chronic kidney disease of unknown etiology in Sri Lanka. SpringerPlus 2015, 4, 90. [Google Scholar] [CrossRef] [Green Version]
  19. Chandrajith, R.; Diyabalanage, S.; Dissanayake, C. Geogenic fluoride and arsenic in groundwater of Sri Lanka and its implications to community health. Groundw. Sustain. Dev. 2020, 10, 100359. [Google Scholar] [CrossRef]
  20. Dharma-Wardana, M.W.C.; Amarasiri, S.L.; Dharmawardene, N.; Panabokke, C.R. Chronic kidney disease of unknown aetiology and ground-water ionicity: Study based on Sri Lanka. Environ. Geochem. Health 2015, 37, 221–231. [Google Scholar] [CrossRef]
  21. Dissanayake, C.B.; Chandrajith, R. Groundwater fluoride as a geochemical marker in the etiology of chronic kidney disease of unknown origin in Sri Lanka. Ceylon J. Sci. 2017, 46, 3–12. [Google Scholar] [CrossRef] [Green Version]
  22. Dissanayake, C.B.; Chandrajith, R. Fluoride and hardness in groundwater of tropical regions—Review of recent evidence indicating tissue calcification and calcium phosphate nanoparticle formation in kidney tubules. Ceylon J. Sci. 2019, 48, 197–207. [Google Scholar] [CrossRef]
  23. Chandrajith, R.; Dissanayake, C.; Ariyarathna, T.; Herath, H.; Padmasiri, J. Dose-dependent Na and Ca in fluoride-rich drinking water—Another major cause of chronic renal failure in tropical arid regions. Sci. Total Environ. 2011, 409, 671–675. [Google Scholar] [CrossRef]
  24. Xiong, X.-Z.; Liu, J.; He, W.; Xia, T.; He, P.; Chen, X.; Yang, K.; Wang, A. Dose–effect relationship between drinking water fluoride levels and damage to liver and kidney functions in children. Environ. Res. 2007, 103, 112–116. [Google Scholar] [CrossRef] [PubMed]
  25. Wanigasuriya, K.P.; Peiris-John, R.J.; Wickremasinghe, R. Chronic kidney disease of unknown aetiology in Sri Lanka: Is cadmium a likely cause? BMC Nephrol. 2011, 12, 32. [Google Scholar] [CrossRef] [PubMed] [Green Version]
  26. Ileperuma, O.; Dharmagunawardhane, H.; Herath, K. Dissolution of aluminium from sub-standard utensils under high fluoride stress: A possible risk factor for chronic renal failure in the North-Central province. J. Natl. Sci. Found. Sri Lanka 2009, 37, 219–222. [Google Scholar] [CrossRef] [Green Version]
  27. Jayasumana, C.; Gunatilake, S.; Senanayake, P. Glyphosate, hard water and nephrotoxic metals: Are they the culprits behind the epidemic of chronic kidney disease of unknown etiology in Sri Lanka? Int. J. Environ. Res. Public Health 2014, 11, 2125–2147. [Google Scholar] [CrossRef] [Green Version]
  28. Dissanayake, C.B.; Chandrajith, R. The hydrogeological and geochemical characteristics of groundwater of Sri Lanka. In Groundwater of South Asia; Mukherjee, A., Ed.; Springer: Singapore, 2018; pp. 405–428. [Google Scholar]
  29. Hartmann, J.; Moosdorf, N. The new global lithological map database GLiM: A representation of rock properties at the Earth surface. Geochem. Geophys. Geosyst. 2012, 13, Q12004. [Google Scholar] [CrossRef]
  30. Fick, S.E.; Hijmans, R.J. WorldClim 2: New 1-km spatial resolution climate surfaces for global land areas. Int. J. Clim. 2017, 37, 4302–4315. [Google Scholar] [CrossRef]
  31. Kawakami, T.; Motoyama, A.; Nagasawa, S.; Weragoda, S.; Chaminda, T. Groundwater Quality Atlas of Sri Lanka; Sanduni Offset Printers Kandy: Peradeniya, Sri Lanka, 2014. [Google Scholar]
  32. Robinson, N.; Regetz, J.; Guralnick, R.P. EarthEnv-DEM90: A nearly-global, void-free, multi-scale smoothed, 90m digital elevation model from fused ASTER and SRTM data. ISPRS J. Photogramm. Remote Sens. 2014, 87, 57–67. [Google Scholar] [CrossRef]
  33. Gong, P.; Liu, H.; Zhang, M.; Li, C.; Wang, J.; Huang, H.; Clinton, N.; Ji, L.; Li, W.; Bai, Y.; et al. Stable classification with limited sample: Transferring a 30-m resolution sample set collected in 2015 to mapping 10-m resolution global land cover in 2017. Sci. Bull. 2019, 64, 370–373. [Google Scholar] [CrossRef] [Green Version]
  34. WHO. Guidelines for Drinking-Water Quality, 4th ed.; World Health Organization: Geneva, Switzerland, 2011; p. 541. [Google Scholar]
  35. Jayathunga, K.; Diyabalanage, S.; Frank, A.; Chandrajith, R.; Barth, J.A.C. Influences of seawater intrusion and anthropogenic activities on shallow coastal aquifers in Sri Lanka: Evidence from hydrogeochemical and stable isotope data. Environ. Sci. Pollut. Res. 2020, 27, 23002–23014. [Google Scholar] [CrossRef] [PubMed]
  36. Herath, H.M.A.S.; Kubota, K.; Kawakami, T.; Nagasawa, S.; Motoyama, A.; Weragoda, S.K.; Chaminda, G.G.T.; Yatigammana, S.K. Potential risk of drinking water to human health in Sri Lanka. Environ. Forensics 2017, 18, 241–250. [Google Scholar] [CrossRef]
  37. SLS. Specification for Bottled (Packaged) Drinking Water; Sri Lanka Standard 894; Sri Lanka Standard Insitute: Colombo, Sri Lanka, 2020. [Google Scholar]
  38. Bandara, J.; Wijewardena, H.; Liyanege, J.; Upul, M. Chronic renal failure in Sri Lanka caused by elevated dietary cadmium: Trojan horse of the green revolution. Toxicol. Lett. 2010, 198, 33–39. [Google Scholar] [CrossRef] [PubMed]
  39. Jayatilake, N.; Mendis, S.; Maheepala, P.; Mehta, F.R. Chronic kidney disease of uncertain aetiology: Prevalence and causative factors in a developing country. BMC Nephrol. 2013, 14, 180. [Google Scholar] [CrossRef] [PubMed] [Green Version]
  40. Nanayakkara, S.; Senevirathna, L.; Harada, K.H.; Chandrajith, R.; Hitomi, T.; Abeysekera, T.; Muso, E.; Watanabe, T.; Koizumi, A. Systematic evaluation of exposure to trace elements and minerals in patients with chronic kidney disease of uncertain etiology (CKDu) in Sri Lanka. J. Trace Elem. Med. Biol. 2019, 54, 206–213. [Google Scholar] [CrossRef]
  41. Bandara, U.; Diyabalanage, S.; Hanke, C.; van Geldern, R.; Barth, J.A.; Chandrajith, R. Arsenic-rich shallow groundwater in sandy aquifer systems buffered by rising carbonate waters: A geochemical case study from Mannar Island, Sri Lanka. Sci. Total Environ. 2018, 633, 1352–1359. [Google Scholar] [CrossRef]
  42. Ranasinghe, N.; Kruger, E.; Chandrajith, R.; Tennant, M. The heterogeneous nature of water well fluoride levels in Sri Lanka: An opportunity to mitigate the dental fluorosis. Community Dent. Oral Epidemiol. 2019, 47, 236–242. [Google Scholar] [CrossRef]
  43. Zeng, J.; Han, G.; Yang, K. Assessment and sources of heavy metals in suspended particulate matter in a tropical catchment, northeast Thailand. J. Clean. Prod. 2020, 265, 121898. [Google Scholar] [CrossRef]
  44. Amarathunga, U.; Diyabalanage, S.; Bandara, U.; Chandrajith, R. Environmental factors controlling arsenic mobilization from sandy shallow coastal aquifer sediments in the Mannar Island, Sri Lanka. Appl. Geochem. 2019, 100, 152–159. [Google Scholar] [CrossRef]
  45. Xu, S.; Li, S.-L.; Zhong, J.; Li, C. Spatial scale effects of the variable relationships between landscape pattern and water quality: Example from an agricultural karst river basin, Southwestern China. Agric. Ecosyst. Environ. 2020, 300, 106999. [Google Scholar] [CrossRef]
  46. Rango, T.; Jeuland, M.; Manthrithilake, H.; McCornick, P. Nephrotoxic contaminants in drinking water and urine, and chronic kidney disease in rural Sri Lanka. Sci. Total Environ. 2015, 518-519, 574–585. [Google Scholar] [CrossRef] [PubMed] [Green Version]
  47. Wanigasuriya, K. Update on uncertain etiology of chronic kidney disease in Sri Lanka’s North-Central dry zone. MEDICC Rev. 2014, 16, 61–65. [Google Scholar] [CrossRef] [PubMed]
  48. Perera, T.; Ranasinghe, S.; Alles, N.; Waduge, R. Effect of fluoride on major organs with the different time of exposure in rats. Environ. Health Prev. Med. 2018, 23, 17. [Google Scholar] [CrossRef] [PubMed]
  49. Zhang, J.; Song, J.; Zhang, J.; Chen, X.; Zhou, M.; Cheng, G.; Xie, X. Combined effects of fluoride and cadmium on liver and kidney function in male rats. Biol. Trace Elem. Res. 2013, 155, 396–402. [Google Scholar] [CrossRef]
Figure 1. Maps showing (a) land use, (b) lithology, (c) elevation, (d) annual precipitation, (e) annual mean temperature, and (f) CKD prevalence rates across the most affected districts in Sri Lanka [10].
Water 13 02724 g001
Figure 2. Maps showing the spatial patterns of average concentrations of groundwater quality parameters in each district (maximum concentration (max) was showed for fluoride, As, and Cd). The ranges of data values were categorized into five classes based on the natural break method.
Water 13 02724 g002
Figure 3. Correlation coefficients for Pearson correlation analysis among groundwater quality parameters. * Correlation is significant at p < 0.05; ** Correlation is significant at p < 0.01.
Water 13 02724 g003
Figure 4. The relationships between hardness, fluoride, and As concentrations, and precipitation (ac) and air temperature (df).
Water 13 02724 g004
Figure 5. The relationships between NO3 concentration (a) and hardness (b) and cropland, and between As concentration and unconsolidated sediments (c).
Water 13 02724 g005
Figure 6. Ordination diagrams showing the relationships between the groundwater quality parameters (represented by blue lines) and the potential influencing factors (represented by red lines) according to the redundancy analysis (RDA). The analyzed potential influencing factors include elevation (Ele), cropland (Cro), forest (For), impervious surface (IS), metamorphic rocks (MR), acid plutonic rocks (APR), unconsolidated sediments (US), carbonate sedimentary rocks (CSR), precipitation (Pre), and air temperature (AT).
Water 13 02724 g006
Table 1. Component matrix and explained variance (principal component analysis (PCA)) for groundwater quality parameters.
VariablePC1PC2PC3PC4
NO30.86 0.03 −0.12 −0.36
Hardness0.67 −0.47 0.16 0.46
Fluoride0.08 −0.37 0.04 0.75
As0.70 −0.01 0.42 −0.05
Cd0.17 −0.16 0.88 0.05
Fe0.07 0.81 −0.15 0.24
Mn−0.34 0.05 −0.01 0.71
Cu0.20 0.12 0.76 0.01
Cr0.71 0.24 0.28 0.02
Pb0.17 0.77 −0.06 −0.27
Al−0.12 0.78 0.25 −0.22
Eigenvalue2.92 2.70 1.39 1.05
Variance (%)26.5 24.6 12.6 9.5
Cumulative (%)26.5 51.1 63.7 73.2
Publisher’s Note: MDPI stays neutral with regard to jurisdictional claims in published maps and institutional affiliations.

