
Numerical Modeling of Microfluid Dynamics in Xylem Vessels of Khaya grandifoliola

 ,
,  , , , and
Abstract
:1. Introduction
2. Materials and Methods
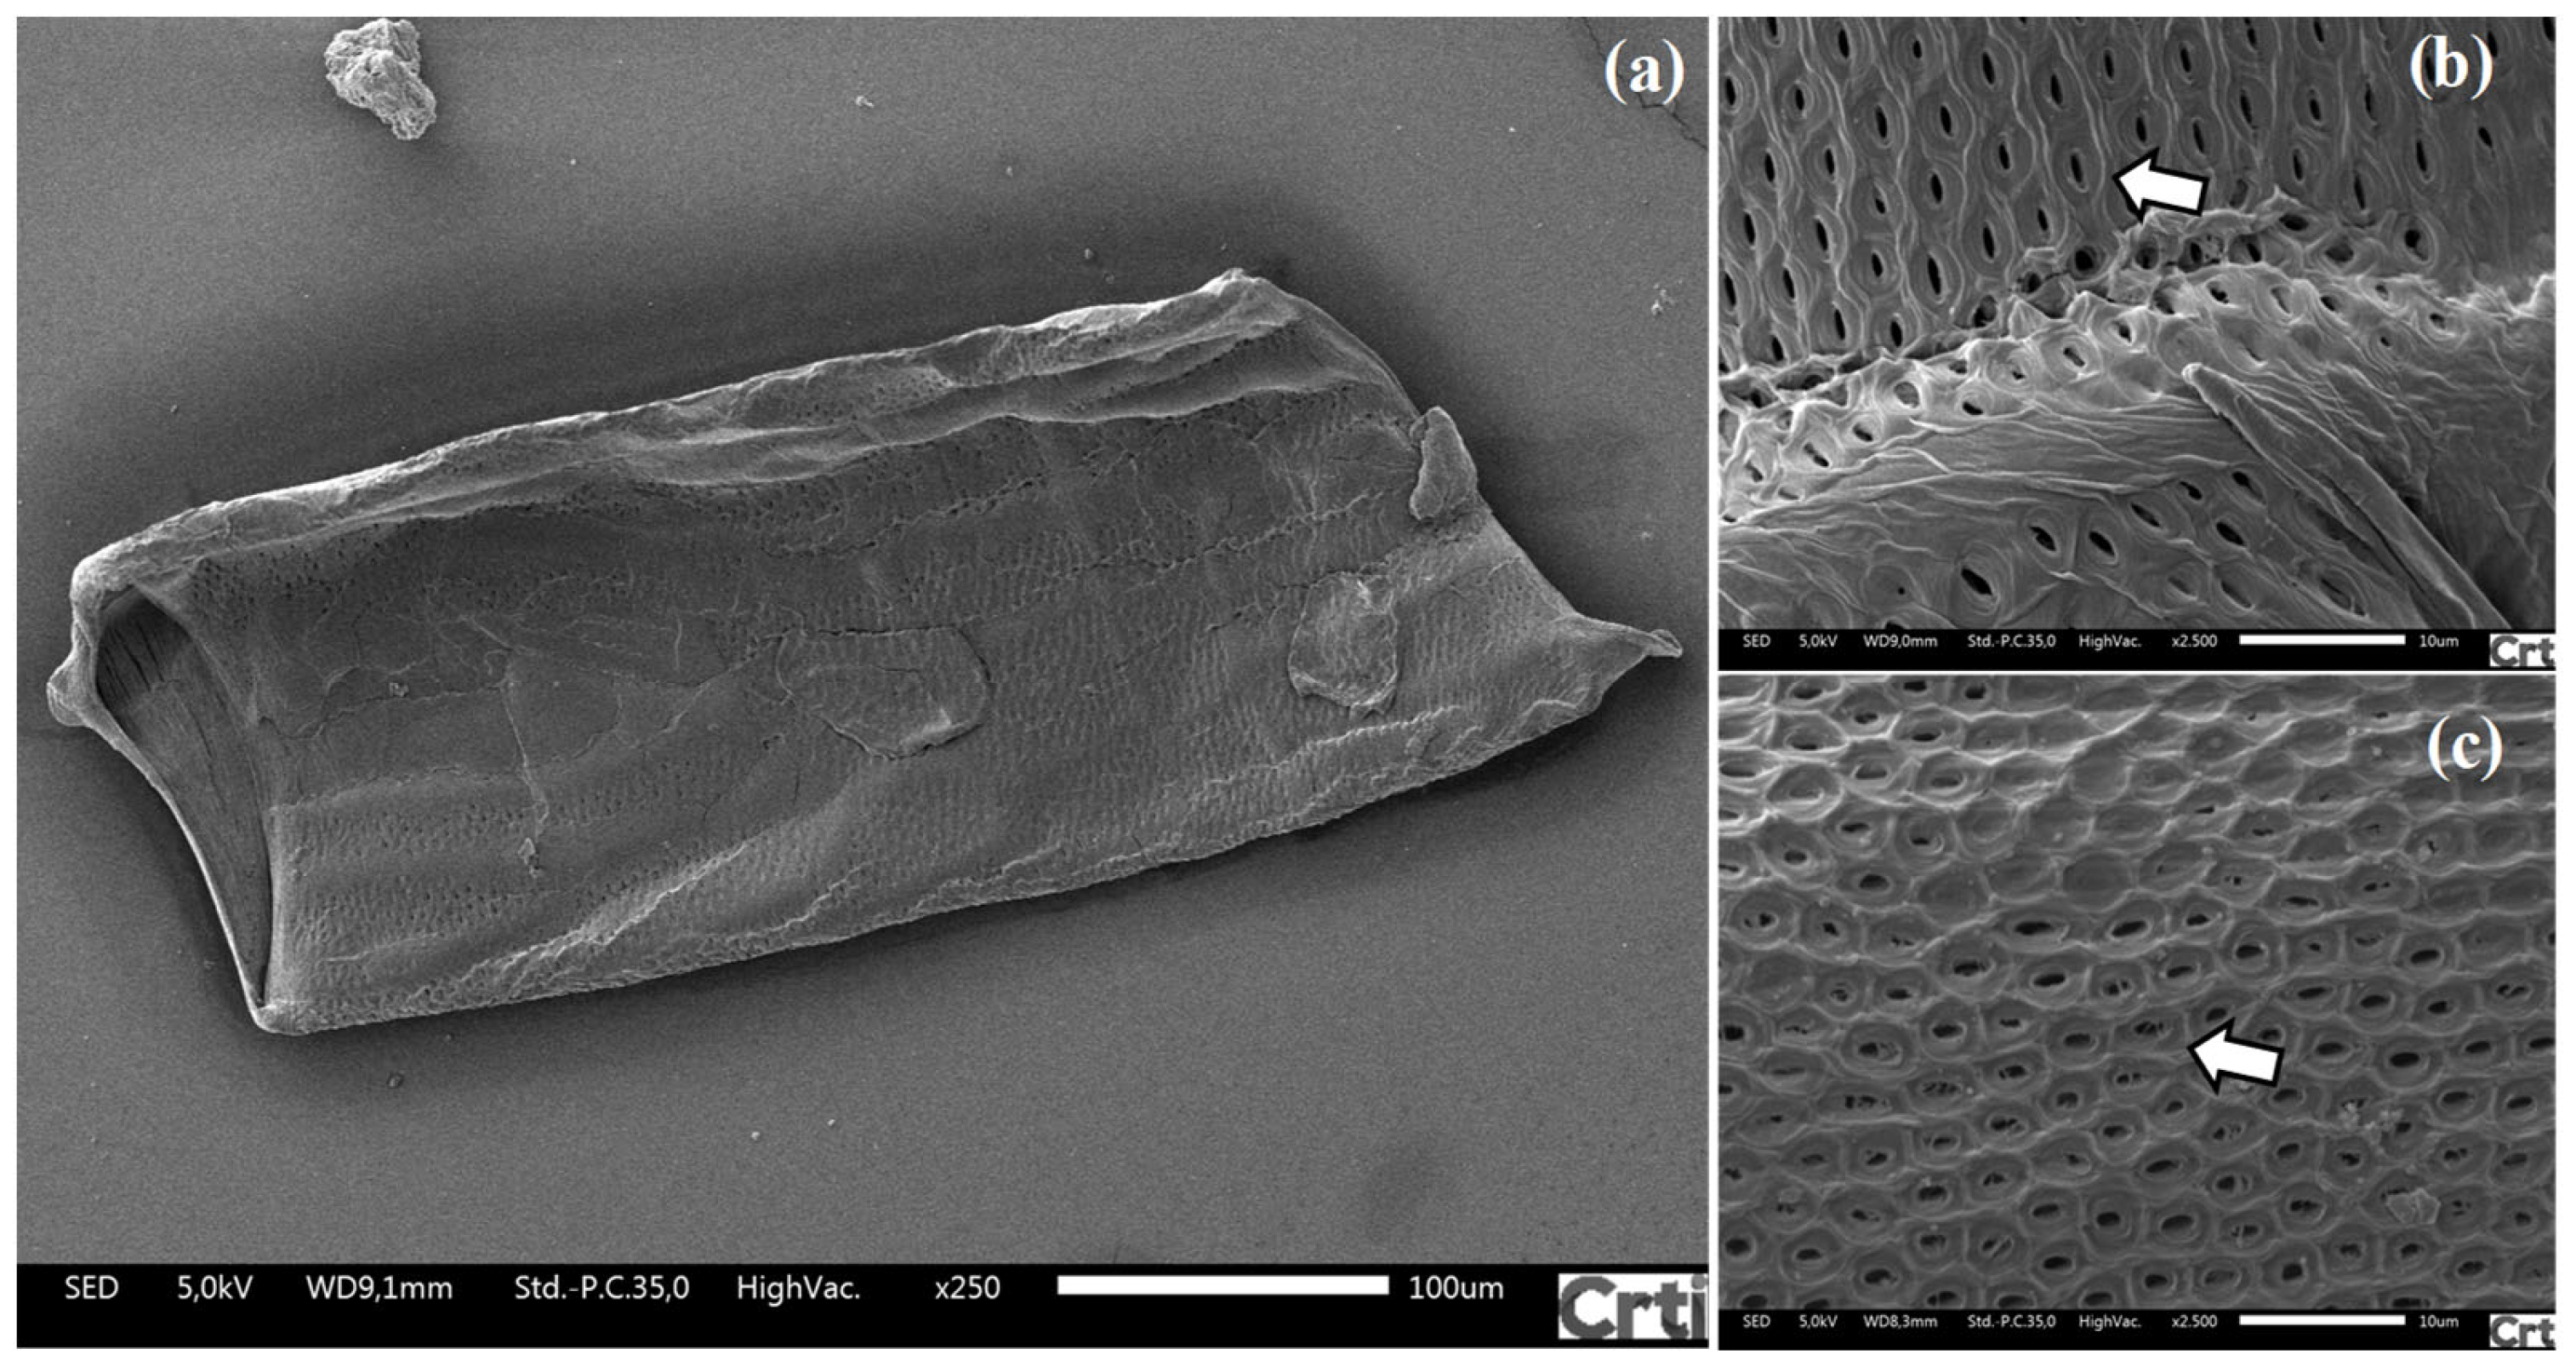
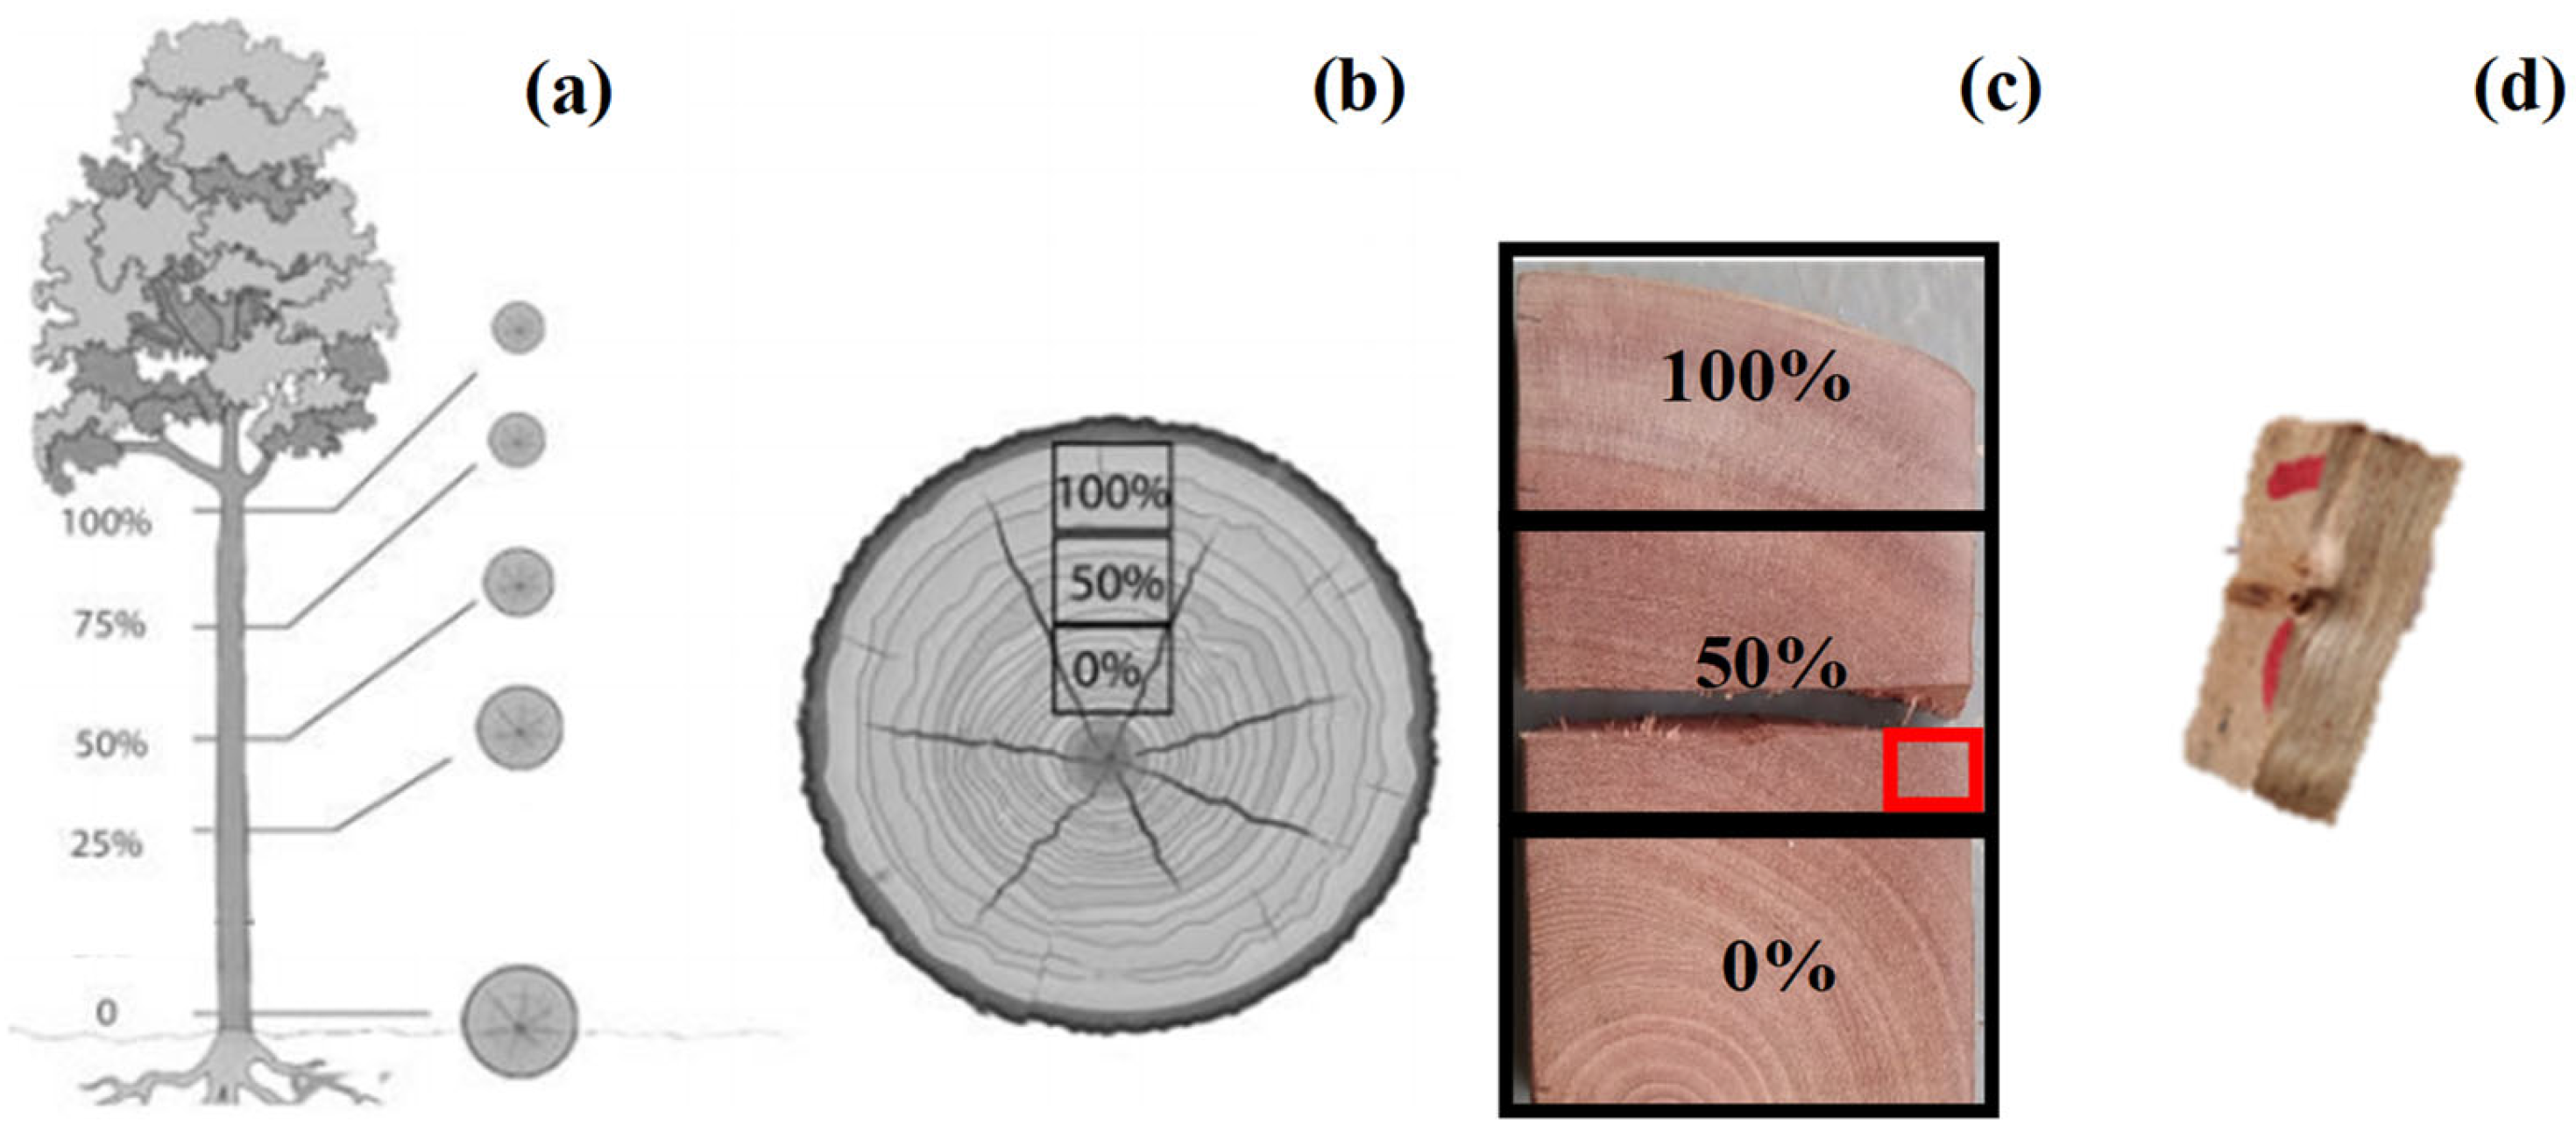
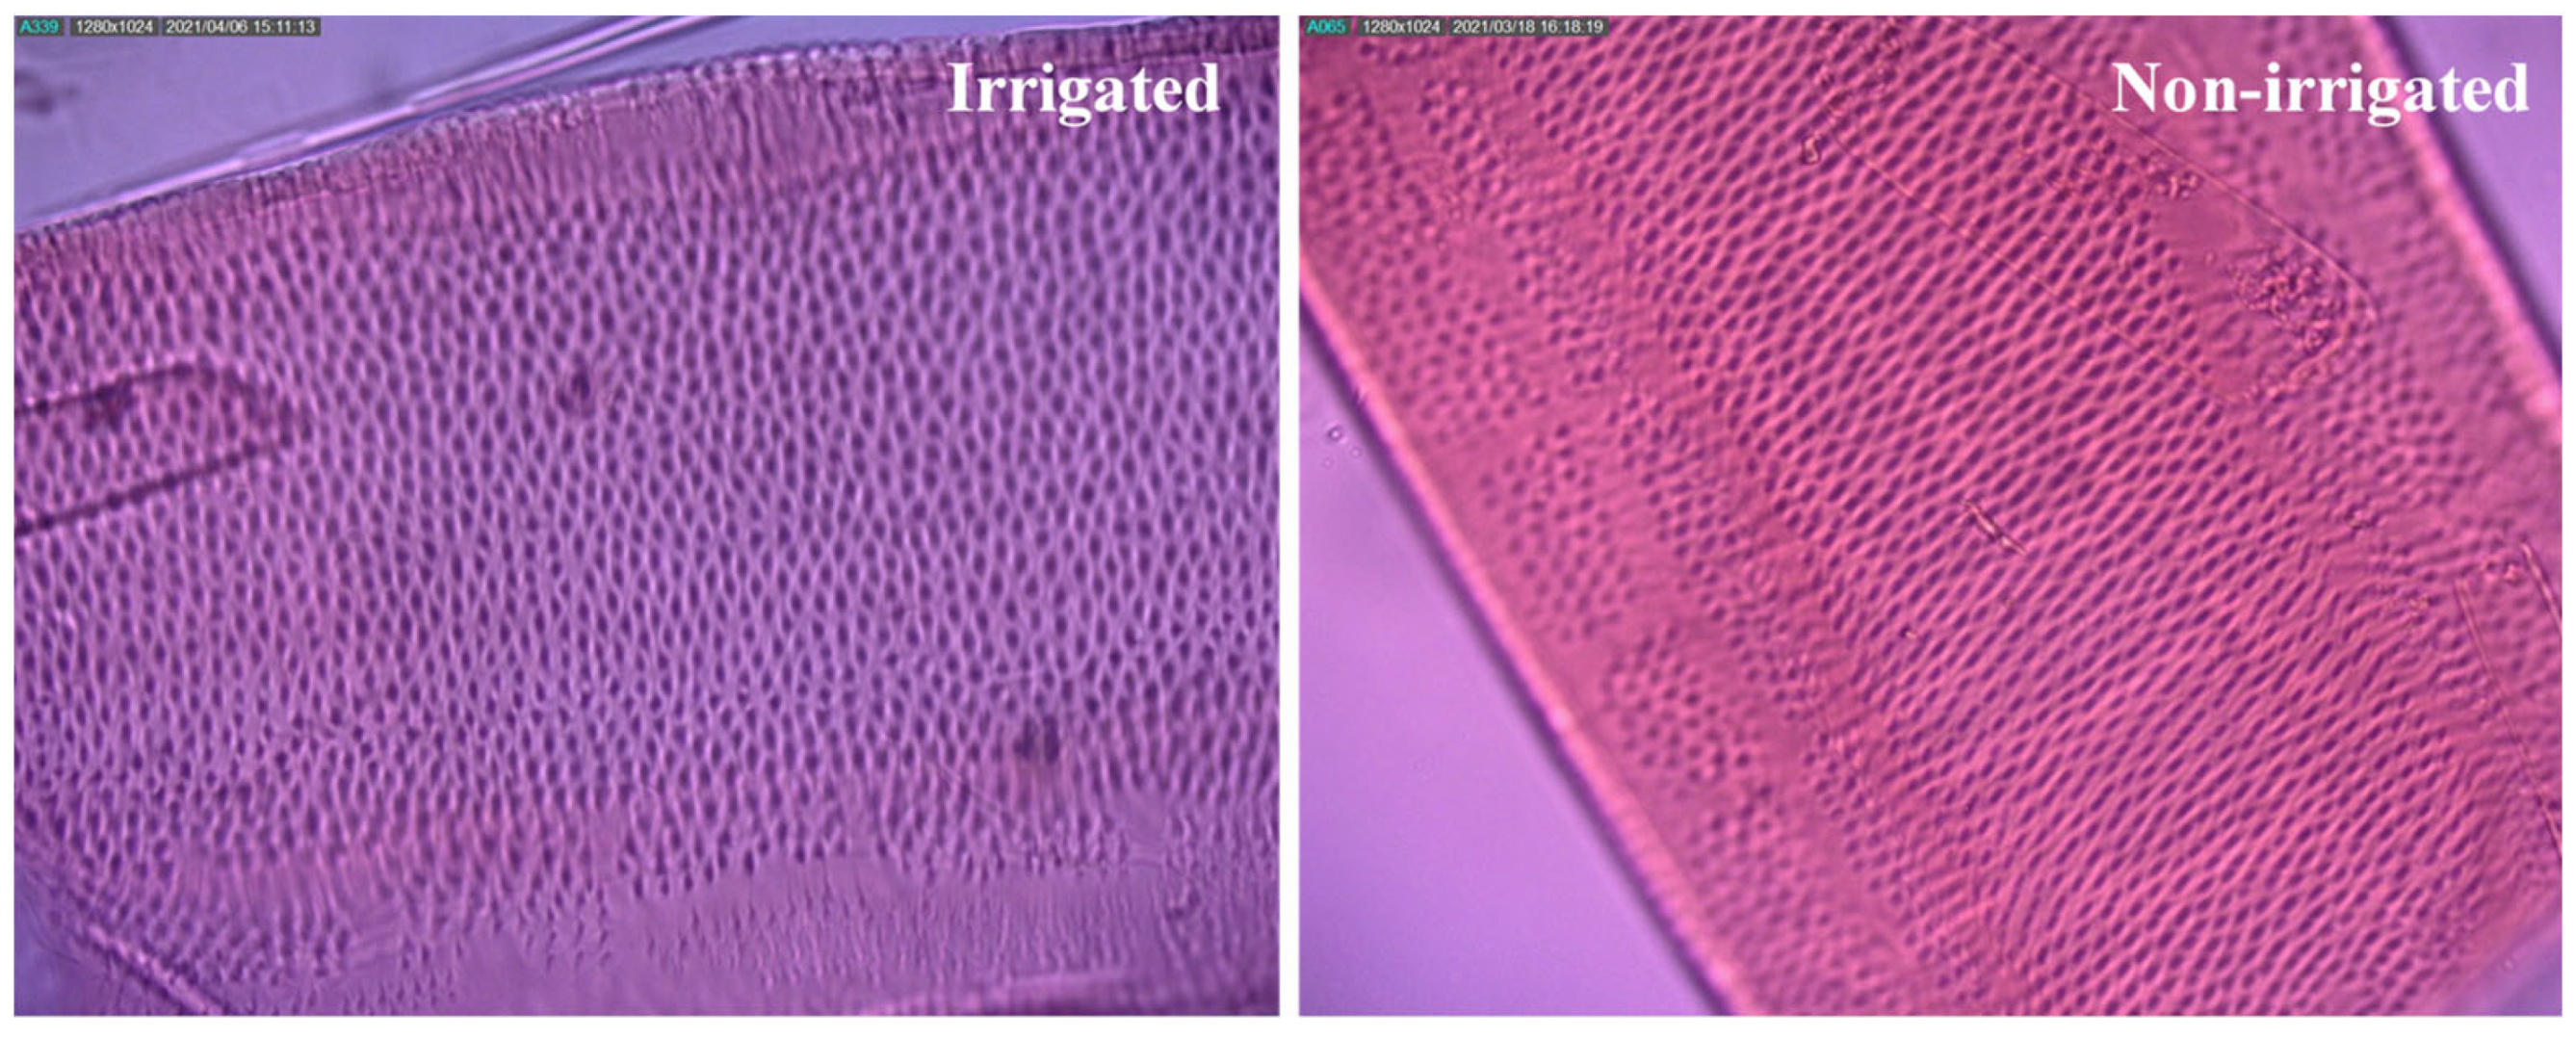
2.1. Description of Plant Material and Analysis of Anatomical Samples
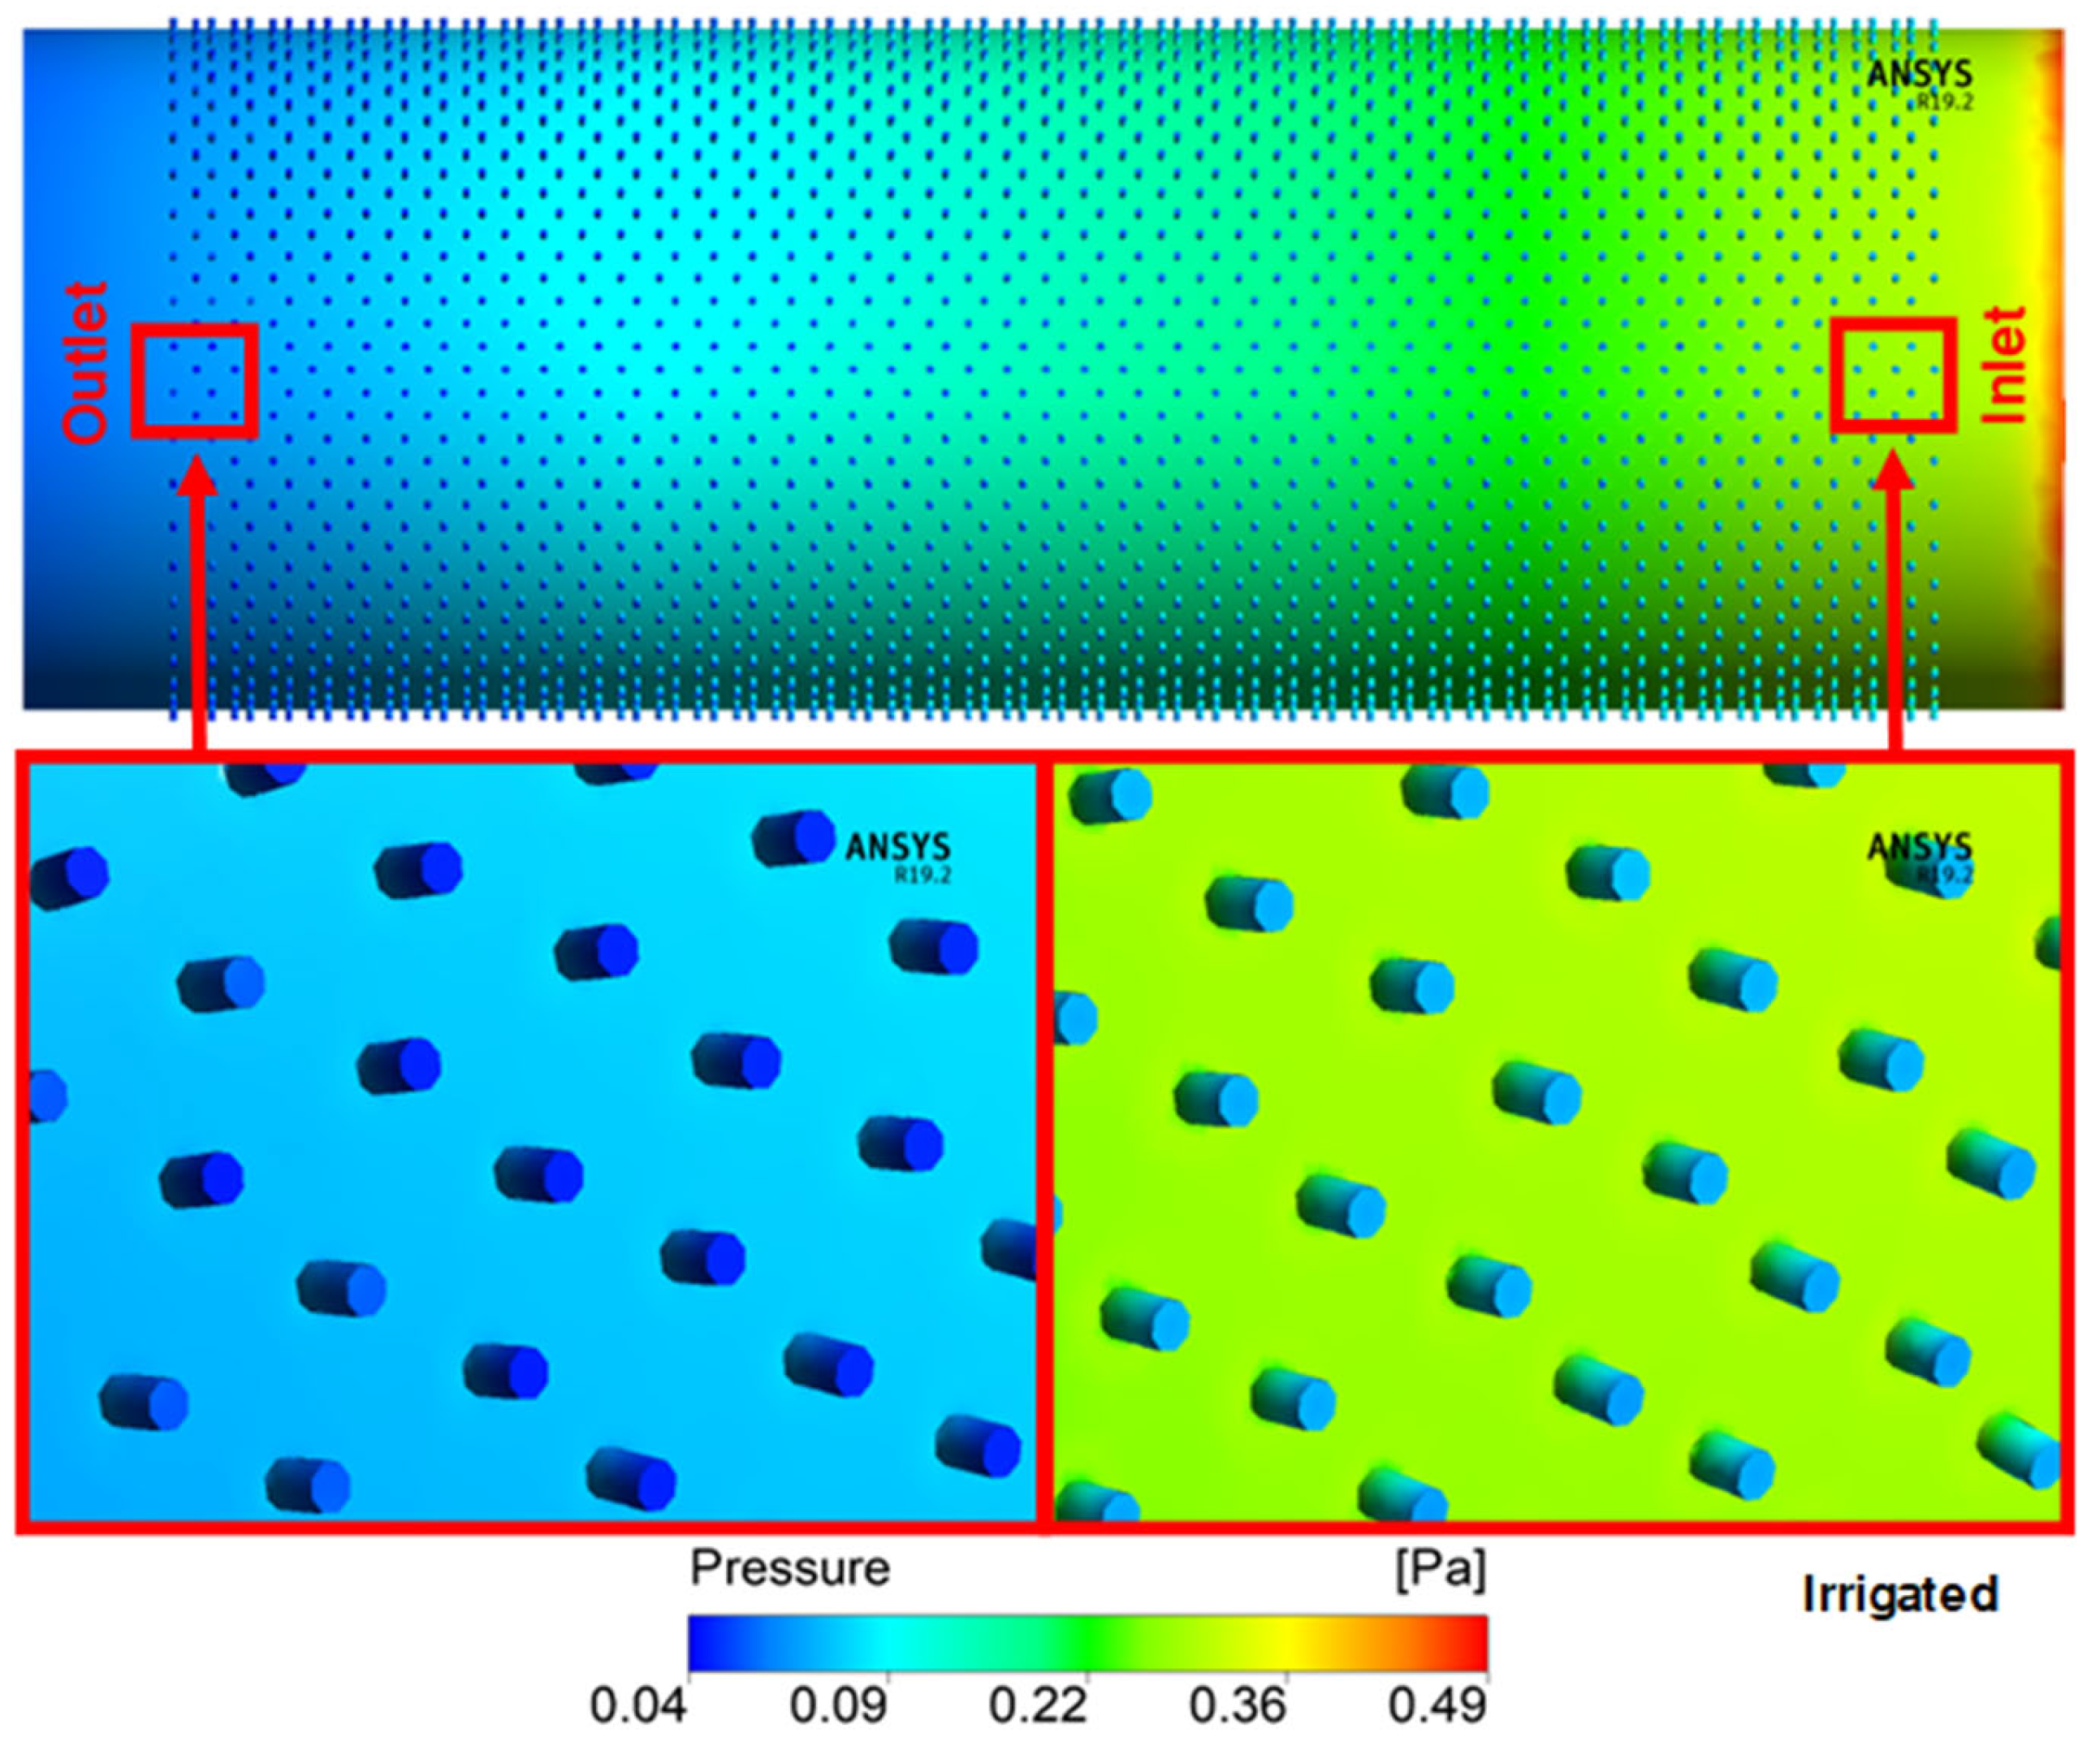
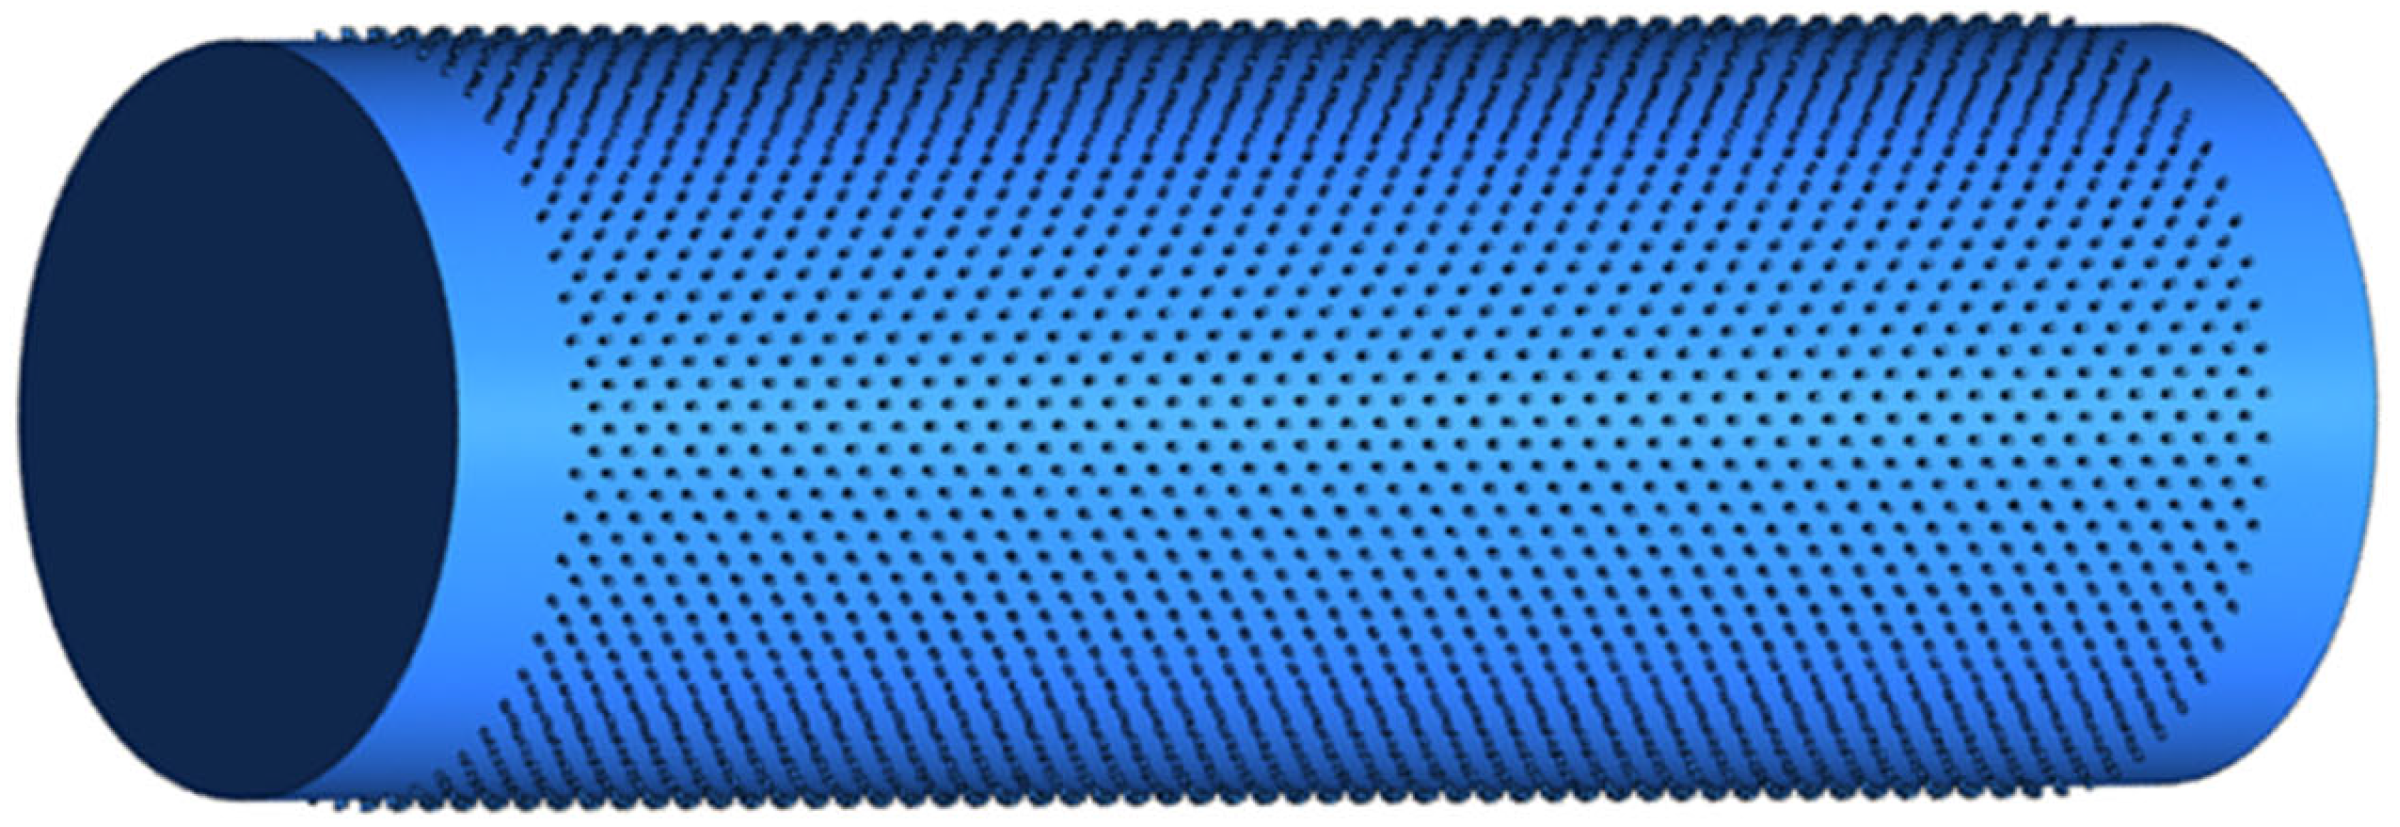
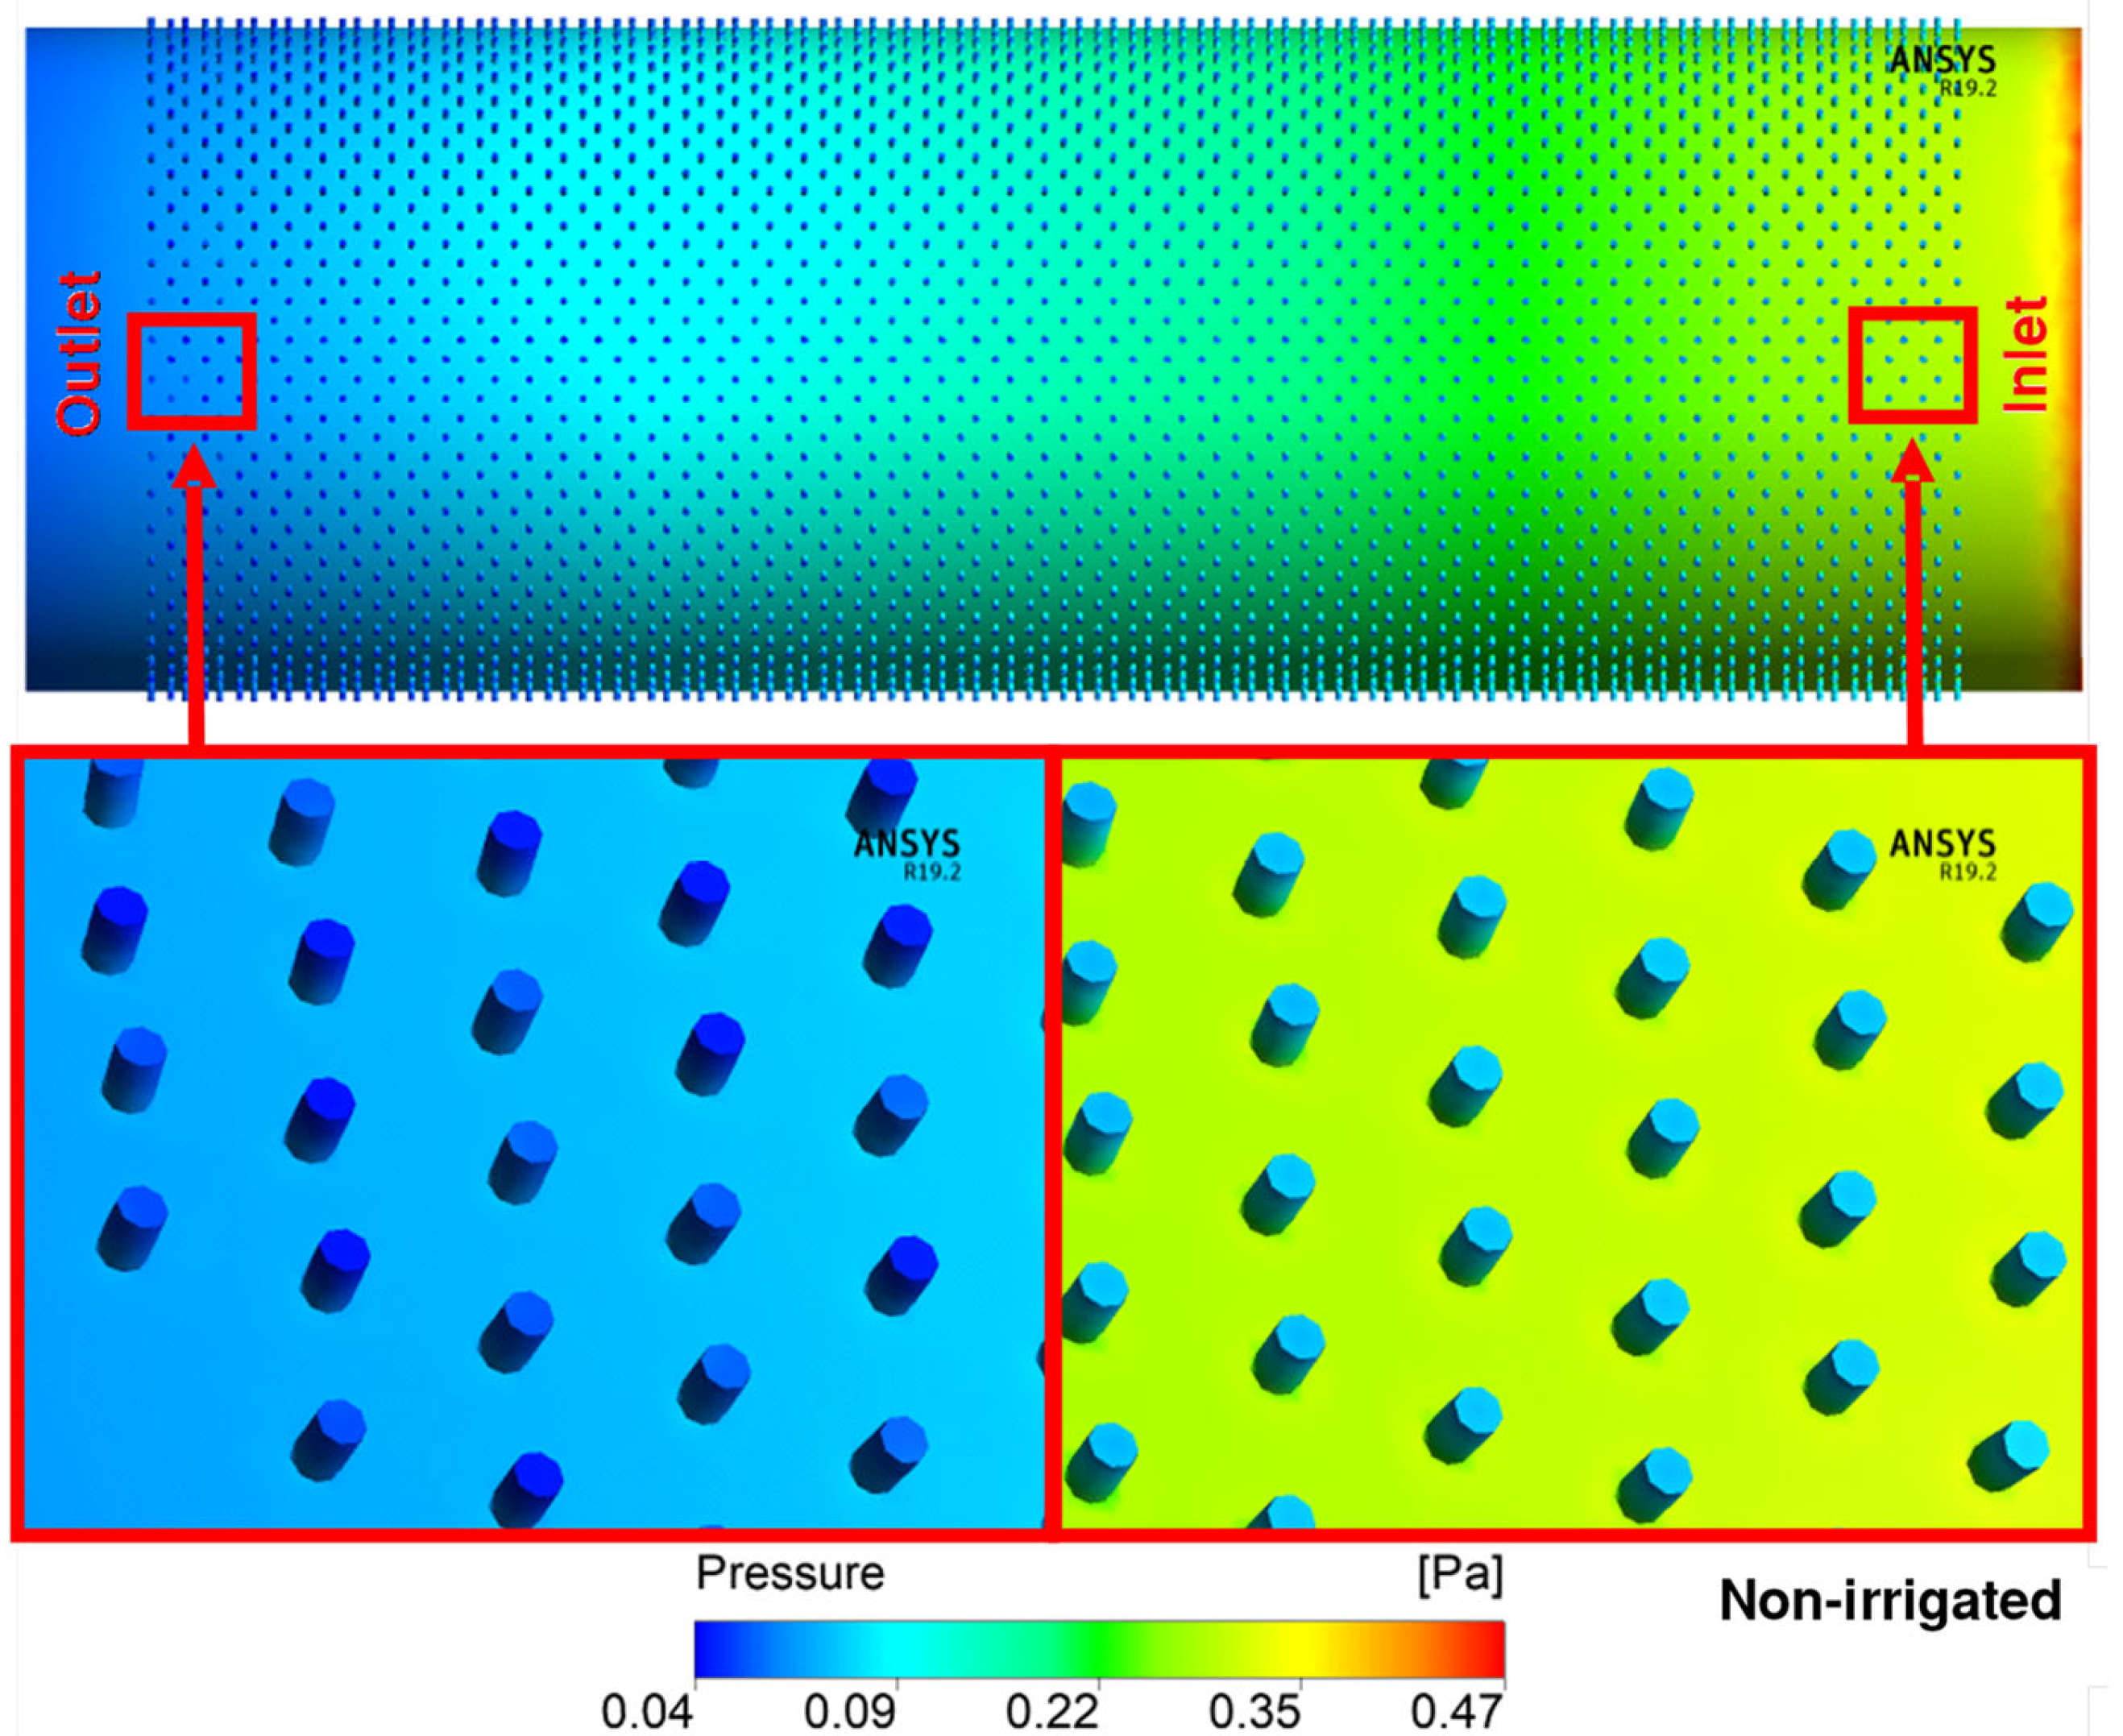
2.2. Determination of the Anatomical Model and Numerical Simulation Parameterization
2.3. Statistical Analysis
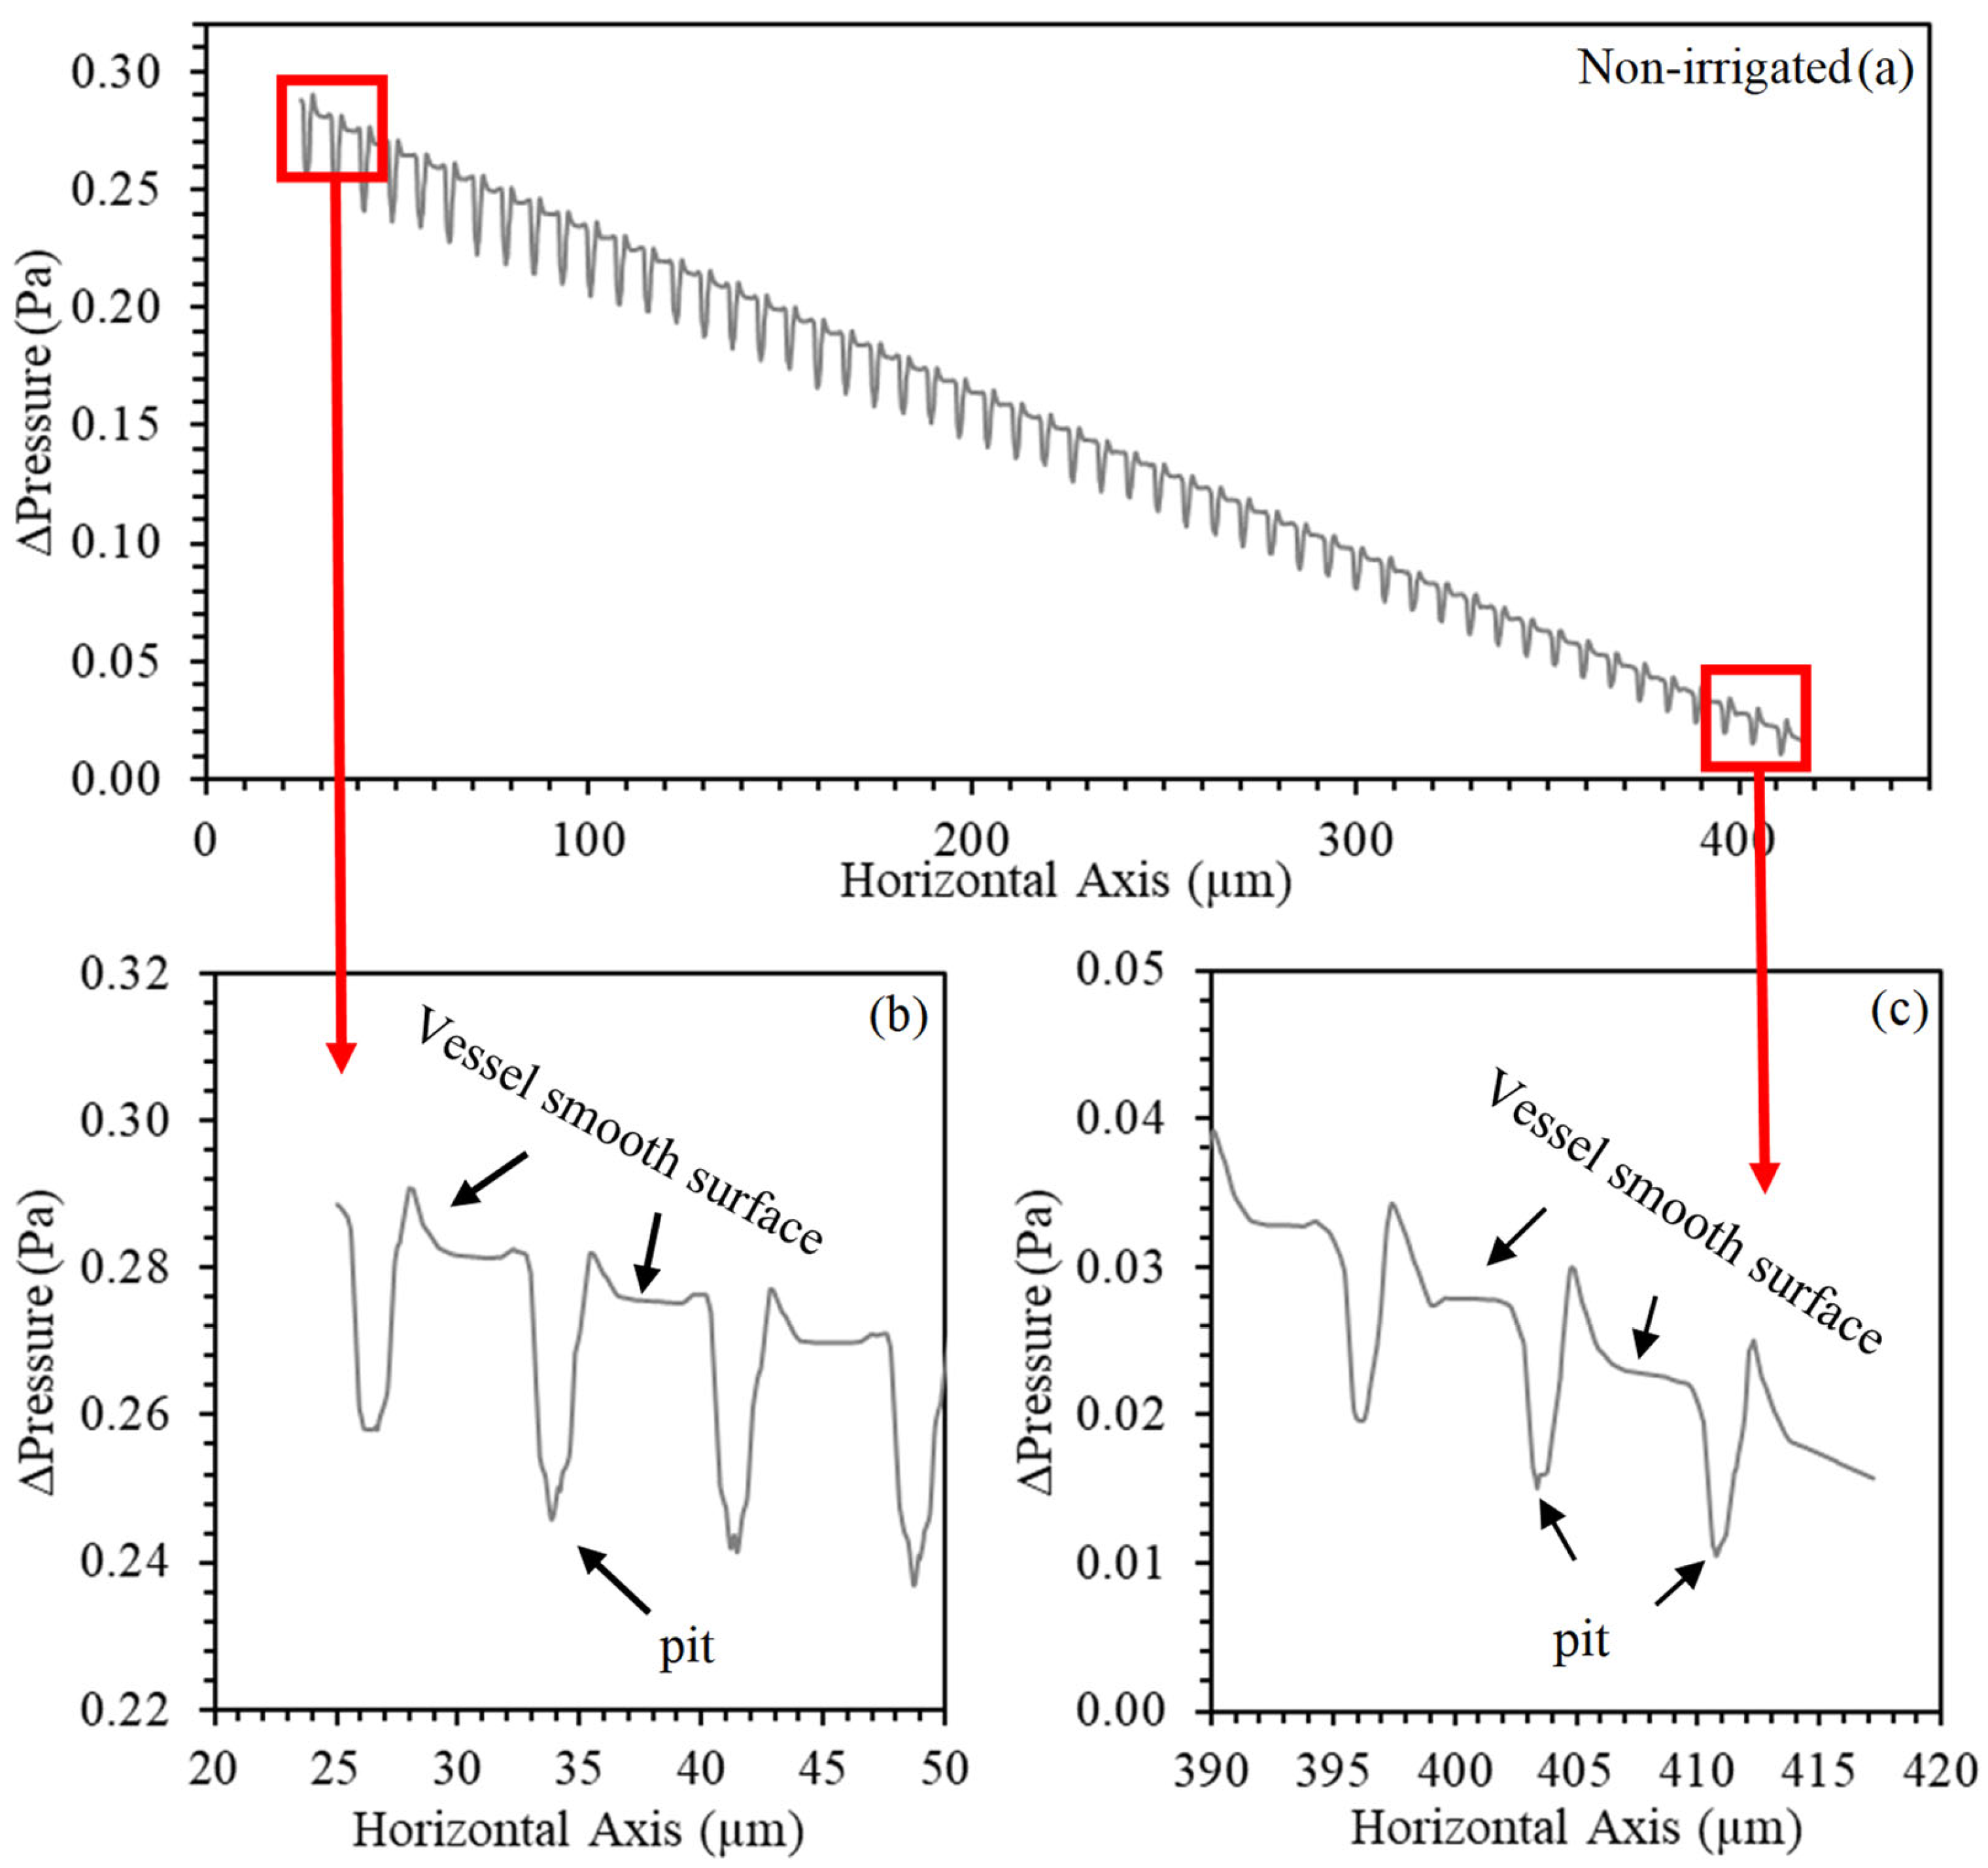
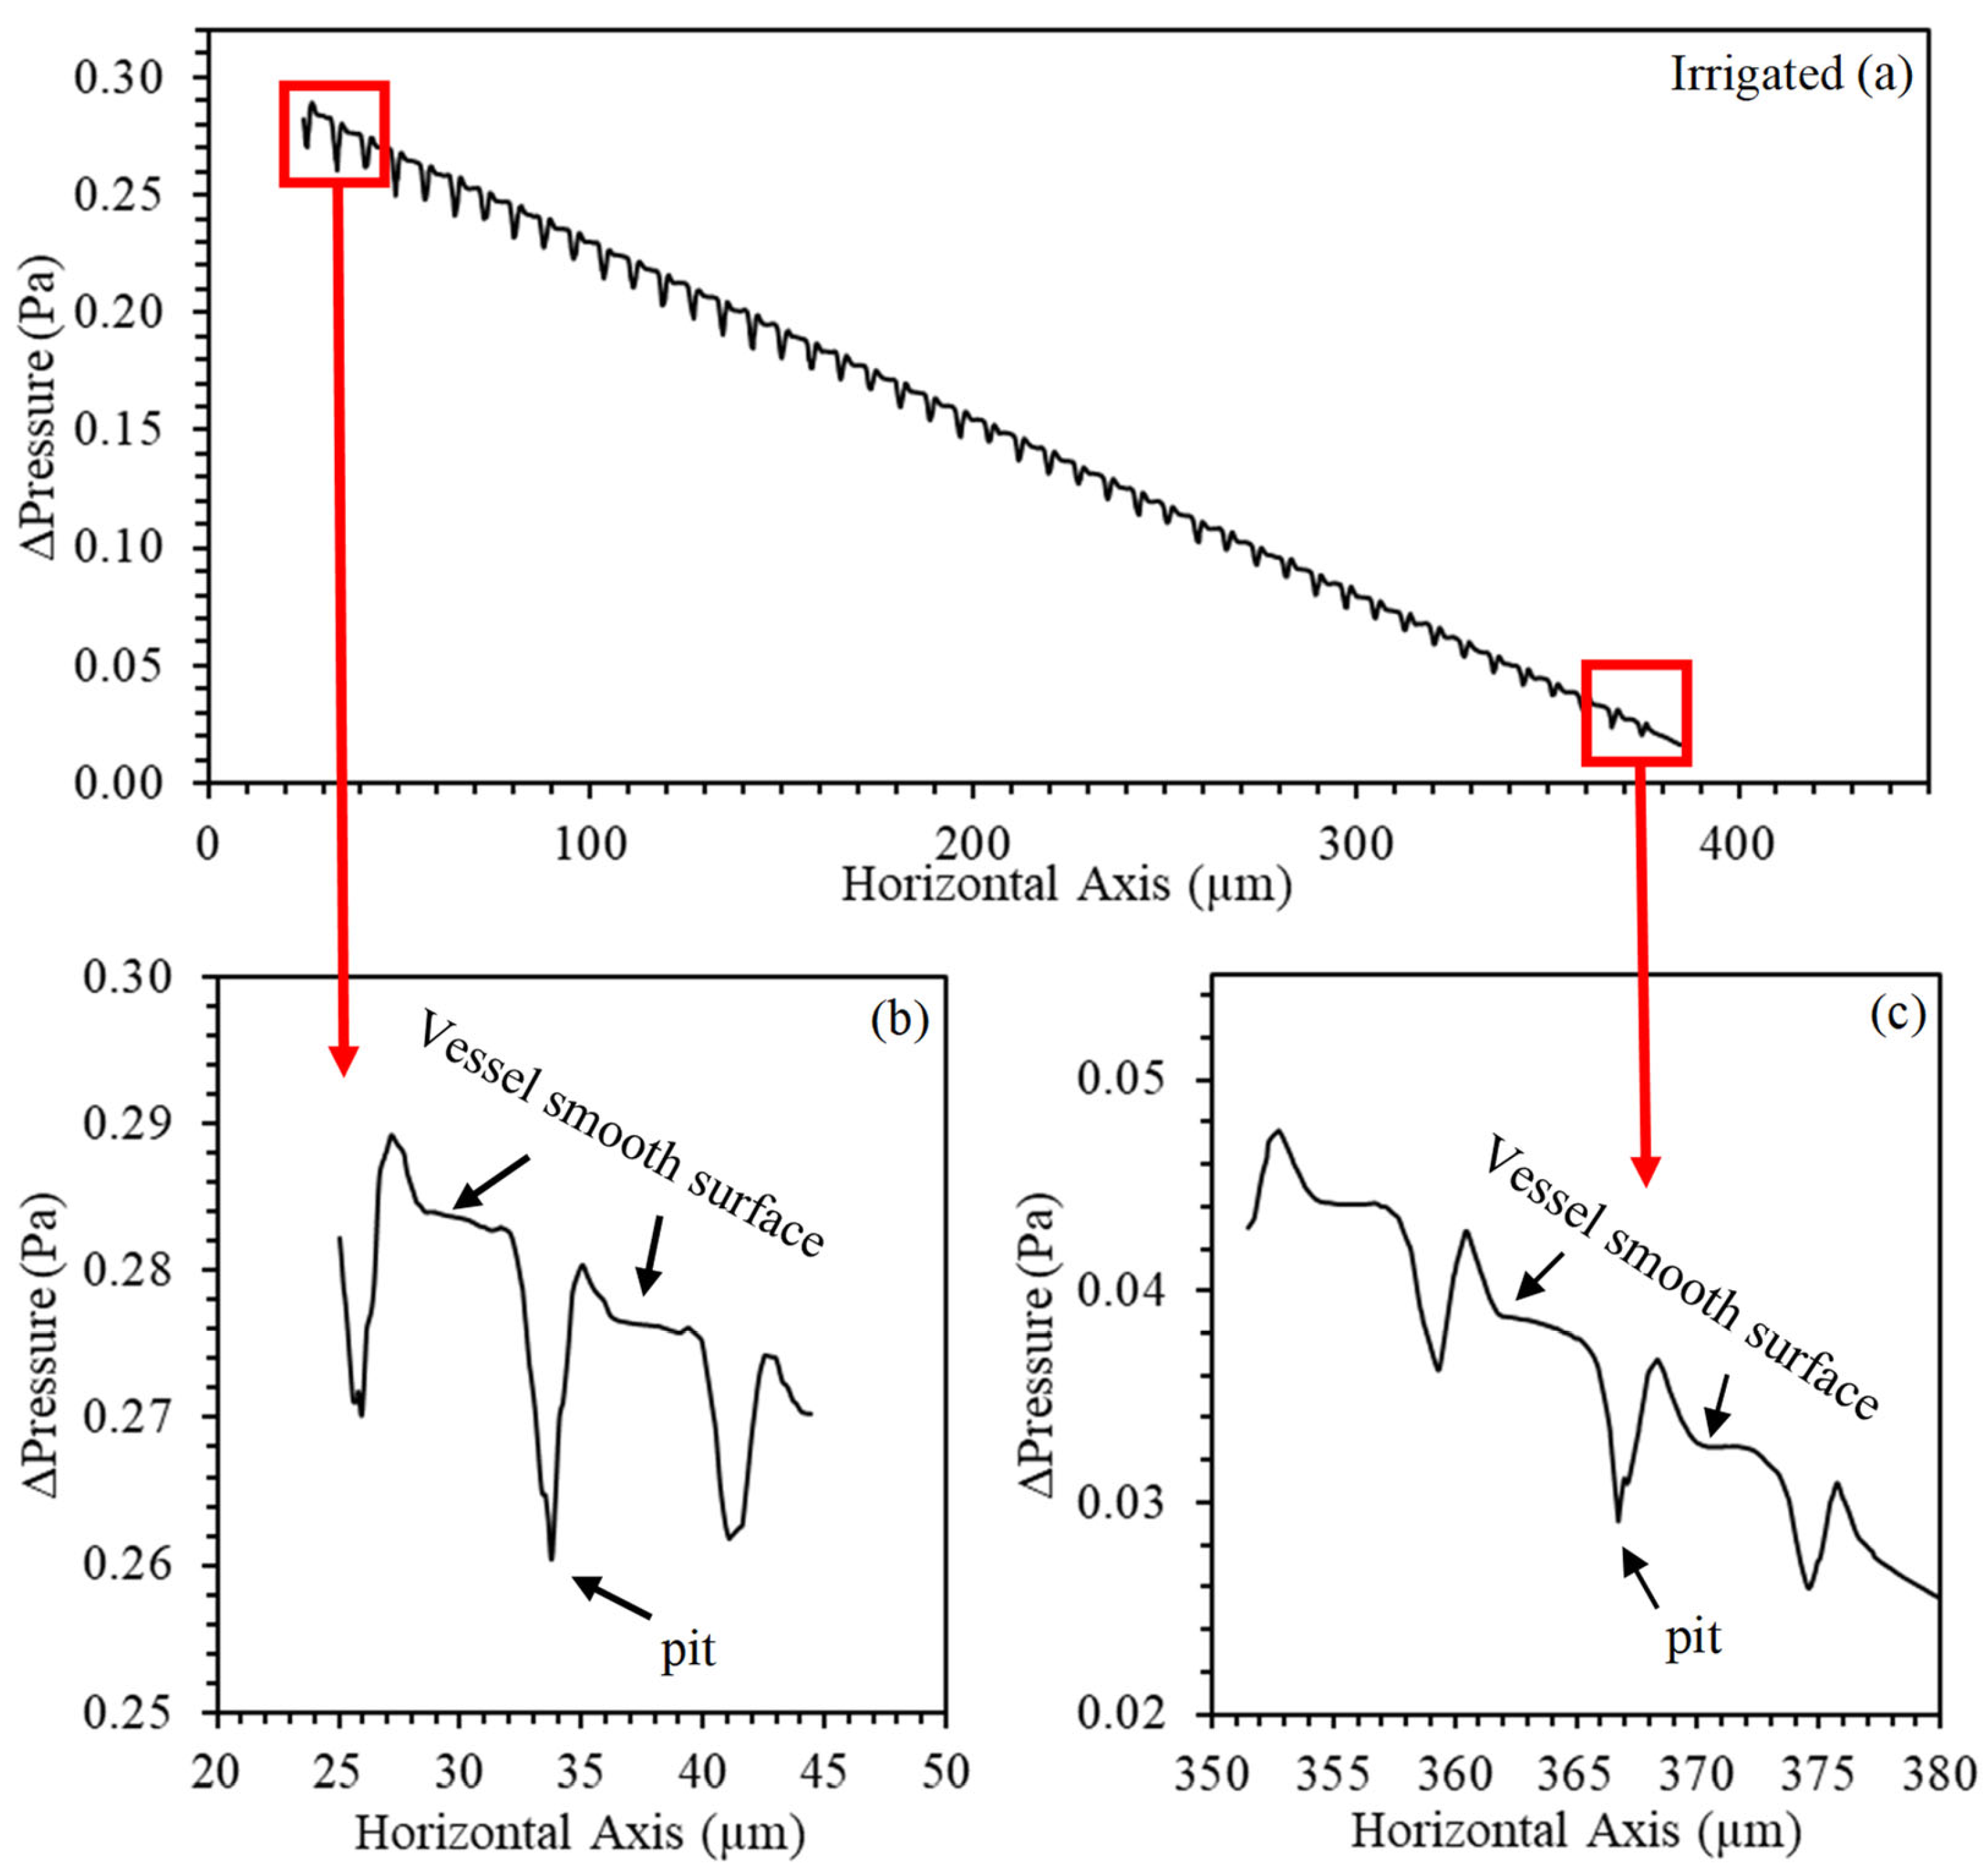
3. Results and Discussion
4. Conclusions
Author Contributions
Funding
Institutional Review Board Statement
Informed Consent Statement
Acknowledgments
Conflicts of Interest
References
- Koch, G.W.; Sillett, S.C.; Jennings, G.M.; Davis, S.D. The Limits to Tree Height. Nature 2004, 428, 851–854. [Google Scholar] [CrossRef]
- Hall, A.J.; Minchin, P.E.H. A Closed-Form Solution for Steady-State Coupled Phloem/Xylem Flow Using the Lambert-W Function. Plant Cell Environ. 2013, 36, 2150–2162. [Google Scholar] [CrossRef] [Green Version]
- Lacointe, A.; Minchin, P.E.H. Modelling Phloem and Xylem Transport within a Complex Architecture. Funct. Plant Biol. 2008, 35, 772–780. [Google Scholar] [CrossRef]
- Loepfe, L.; Martinez-Vilalta, J.; Piñol, J.; Mencuccini, M. The Relevance of Xylem Network Structure for Plant Hydraulic Efficiency and Safety. J. Theor. Biol. 2007, 247, 788–803. [Google Scholar] [CrossRef]
- Patankar, S.V. Numerical Heat Transfer and Fluid Flow; CRC Press: Boca Raton, FL, USA, 2018; ISBN 978-1-315-27513-0. [Google Scholar]
- Schulte, P.J. Computational Fluid Dynamics Models of Conifer Bordered Pits Show How Pit Structure Affects Flow. New Phytol. 2012, 193, 721–729. [Google Scholar] [CrossRef]
- Schulte, P.J.; Hacke, U.G.; Schoonmaker, A.L. Pit Membrane Structure Is Highly Variable and Accounts for a Major Resistance to Water Flow through Tracheid Pits in Stems and Roots of Two Boreal Conifer Species. New Phytol. 2015, 208, 102–113. [Google Scholar] [CrossRef] [PubMed]
- QingLin, A.; Fang, X.; Qi, C.; JiaoLiao, C.; Peng, W. Flow resistance characteristics of scalariform perforation plates in plant xylem vessels. Nongye Jixie Xuebao Trans. Chin. Soc. Agric. Mach. 2011, 42, 110–143. [Google Scholar]
- Chen, Q.; Xu, F.; Ai, Q.; Zhang, L. Hydrodynamic Model and Flow Resistance Characteristics of Plant Vessel Wall Thickenings. Trans. Chin. Soc. Agric. Eng. 2015, 31, 1–8. [Google Scholar]
- Xu, T.; Zhang, L.; Li, Z. Computational Fluid Dynamics Model and Flow Resistance Characteristics of Jatropha Curcas L Xylem Vessel. Sci. Rep. 2020, 10, 14728. [Google Scholar] [CrossRef]
- Motta, J.P.; da Silva Oliveira, J.T.; Braz, R.L.; Duarte, A.P.C.; Alves, R.C. Caracterização da madeira de quatro espécies florestais. Cienc. Rural 2014, 44, 2186–2192. [Google Scholar] [CrossRef] [Green Version]
- Pinto, C.A.; David, J.S.; Cochard, H.; Caldeira, M.C.; Henriques, M.O.; Quilhó, T.; Paço, T.A.; Pereira, J.S.; David, T.S. Drought-Induced Embolism in Current-Year Shoots of Two Mediterranean Evergreen Oaks. For. Ecol. Manag. 2012, 285, 1–10. [Google Scholar] [CrossRef]
- Reboita, M.S.; Rodrigues, M.; Silva, L.F.; Alves, M.A. Aspectos Climáticos Do Estado de Minas Gerais (Climate Aspects in Minas Gerais State). Rev. Bras. Climatol. 2015, 17. [Google Scholar] [CrossRef] [Green Version]
- Gea-Izquierdo, G.; Fonti, P.; Cherubini, P.; Martín-Benito, D.; Chaar, H.; Cañellas, I. Xylem Hydraulic Adjustment and Growth Response of Quercus Canariensis Willd. to Climatic Variability. Tree Physiol. 2012, 32, 401–413. [Google Scholar] [CrossRef] [PubMed] [Green Version]
- Bryukhanova, M.; Fonti, P. Xylem Plasticity Allows Rapid Hydraulic Adjustment to Annual Climatic Variability. Trees 2013, 27, 485–496. [Google Scholar] [CrossRef] [Green Version]
- Moraes, M.D.A. De Qualidade E Potencial Energético Da Madeira de Desbaste de Mogno Africano. Master’s Thesis, Federal University of Goiás, Goiânia, Brazil, 2017. [Google Scholar]
- Trevisan, R.; Rosa, M.; Haselein, C.R.; Santini, E.J.; Gatto, D.A. Dimensões Das Fibras E Sua Relação Com A Idade de Transição Entre Lenho Juvenil E Adulto de Eucalyptus grandis W. Hill ex Maiden. Ciênc. Florest. 2017, 27, 1385–1393. [Google Scholar] [CrossRef] [Green Version]
- Shi, C.-L.; Butenko, M.A. Visualizing Morphological Changes of Abscission Zone Cells in Arabidopsis by Scanning Electron Microscope. In Plant Senescence: Methods and Protocols, Methods in Molecular Biology; Guo, Y., Ed.; Springer: New York, NY, USA, 2018; pp. 321–328. ISBN 978-1-4939-7672-0. [Google Scholar]
- Menter, F.R. Review of the Shear-Stress Transport Turbulence Model Experience from an Industrial Perspective. Int. J. Comput. Fluid Dyn. 2009, 23, 305–316. [Google Scholar] [CrossRef]
- Jensen, K.H.; Berg-Sørensen, K.; Bruus, H.; Holbrook, N.M.; Liesche, J.; Schulz, A.; Zwieniecki, M.A.; Bohr, T. Sap Flow and Sugar Transport in Plants. Rev. Mod. Phys. 2016, 88, 035007. [Google Scholar] [CrossRef] [Green Version]
- Donkor, B.N. Stem Wood Structure of Four Ghanaian Khaya Species. Ph.D. Thesis, Lakehead University, Faculty of Forestry, Thunder Bay, ON, Canada, 1997. [Google Scholar]
- Soranso, D.R.; Vidaurre, G.B.; Chagas, M.P.; Oliveira, J.T.d.S.; Silva, J.G.M.d.; Latorraca, J.V.d.F. Radial Growth Dynamics of Khaya Ivorensis Trees from Experimental Plantation. Rev. Árvore 2018, 42. [Google Scholar] [CrossRef]
- Christiansen, J.E. Hydraulics of Sprinkling Systems for Irrigation. Trans. Am. Soc. Civ. Eng. 1942, 107, 221–239. [Google Scholar] [CrossRef]
- Xu, F.; Chen, J.L.; Ai, Q.L.; Chen, Q. Modeling Fluid Flow in Angiosperms Xylem Pits. Appl. Mech. Mater. 2012, 195–196, 577–582. [Google Scholar] [CrossRef]
- Swidrak, I.; Gruber, A.; Oberhuber, W. Xylem and Phloem Phenology in Co-Occurring Conifers Exposed to Drought. Trees 2014, 28, 1161–1171. [Google Scholar] [CrossRef] [PubMed] [Green Version]
- Zwieniecki, M.A.; Secchi, F. Threats to Xylem Hydraulic Function of Trees under ‘New Climate Normal’ Conditions. Plant Cell Environ. 2015, 38, 1713–1724. [Google Scholar] [CrossRef] [PubMed] [Green Version]
- Martín, J.A.; Esteban, L.G.; de Palacios, P.; Fernández, F.G. Variation in Wood Anatomical Traits of Pinus Sylvestris L. between Spanish Regions of Provenance. Trees 2010, 24, 1017–1028. [Google Scholar] [CrossRef]
- Zimmermann, M.H. Xylem Structure and the Ascent of Sap; Springer Science & Business Media: Berlin, Germany, 2013; ISBN 978-3-662-22627-8. [Google Scholar]
- Schulte, P.J.; Castle, A.L. Water Flow Through Vessel Perforation Plates—The Effects of Plate Angle and Thickness for Liriodendron Tulipifera. J. Exp. Bot. 1993, 44, 1143–1148. [Google Scholar] [CrossRef]
- Chen, Q.; Xu, F.; Ai, Q.L.; Chen, J.L. Numerical Simulation of Water Transport through Vessel Perforation Plates. Available online: https://doi.org/10.4028/www.scientific.net/AMM.195-196.645 (accessed on 9 March 2020).
- Lucas, W.J.; Groover, A.; Lichtenberger, R.; Furuta, K.; Yadav, S.-R.; Helariutta, Y.; He, X.-Q.; Fukuda, H.; Kang, J.; Brady, S.M.; et al. The Plant Vascular System: Evolution, Development and FunctionsF. J. Integr. Plant Biol. 2013, 55, 294–388. [Google Scholar] [CrossRef]


| Treatment | Length (µm) | Diameter (µm) | Reticle Area (µm2) | N. of Pits | RA/SAV 1 |
|---|---|---|---|---|---|
| Irrigated | 359.97 ns | 137.01 ns | 1.80 ns | 4362 b | 5.13% b |
| Non-irrigated | 392.65 ns | 143.26 ns | 1.78 ns | 5732 a | 5.63% a |
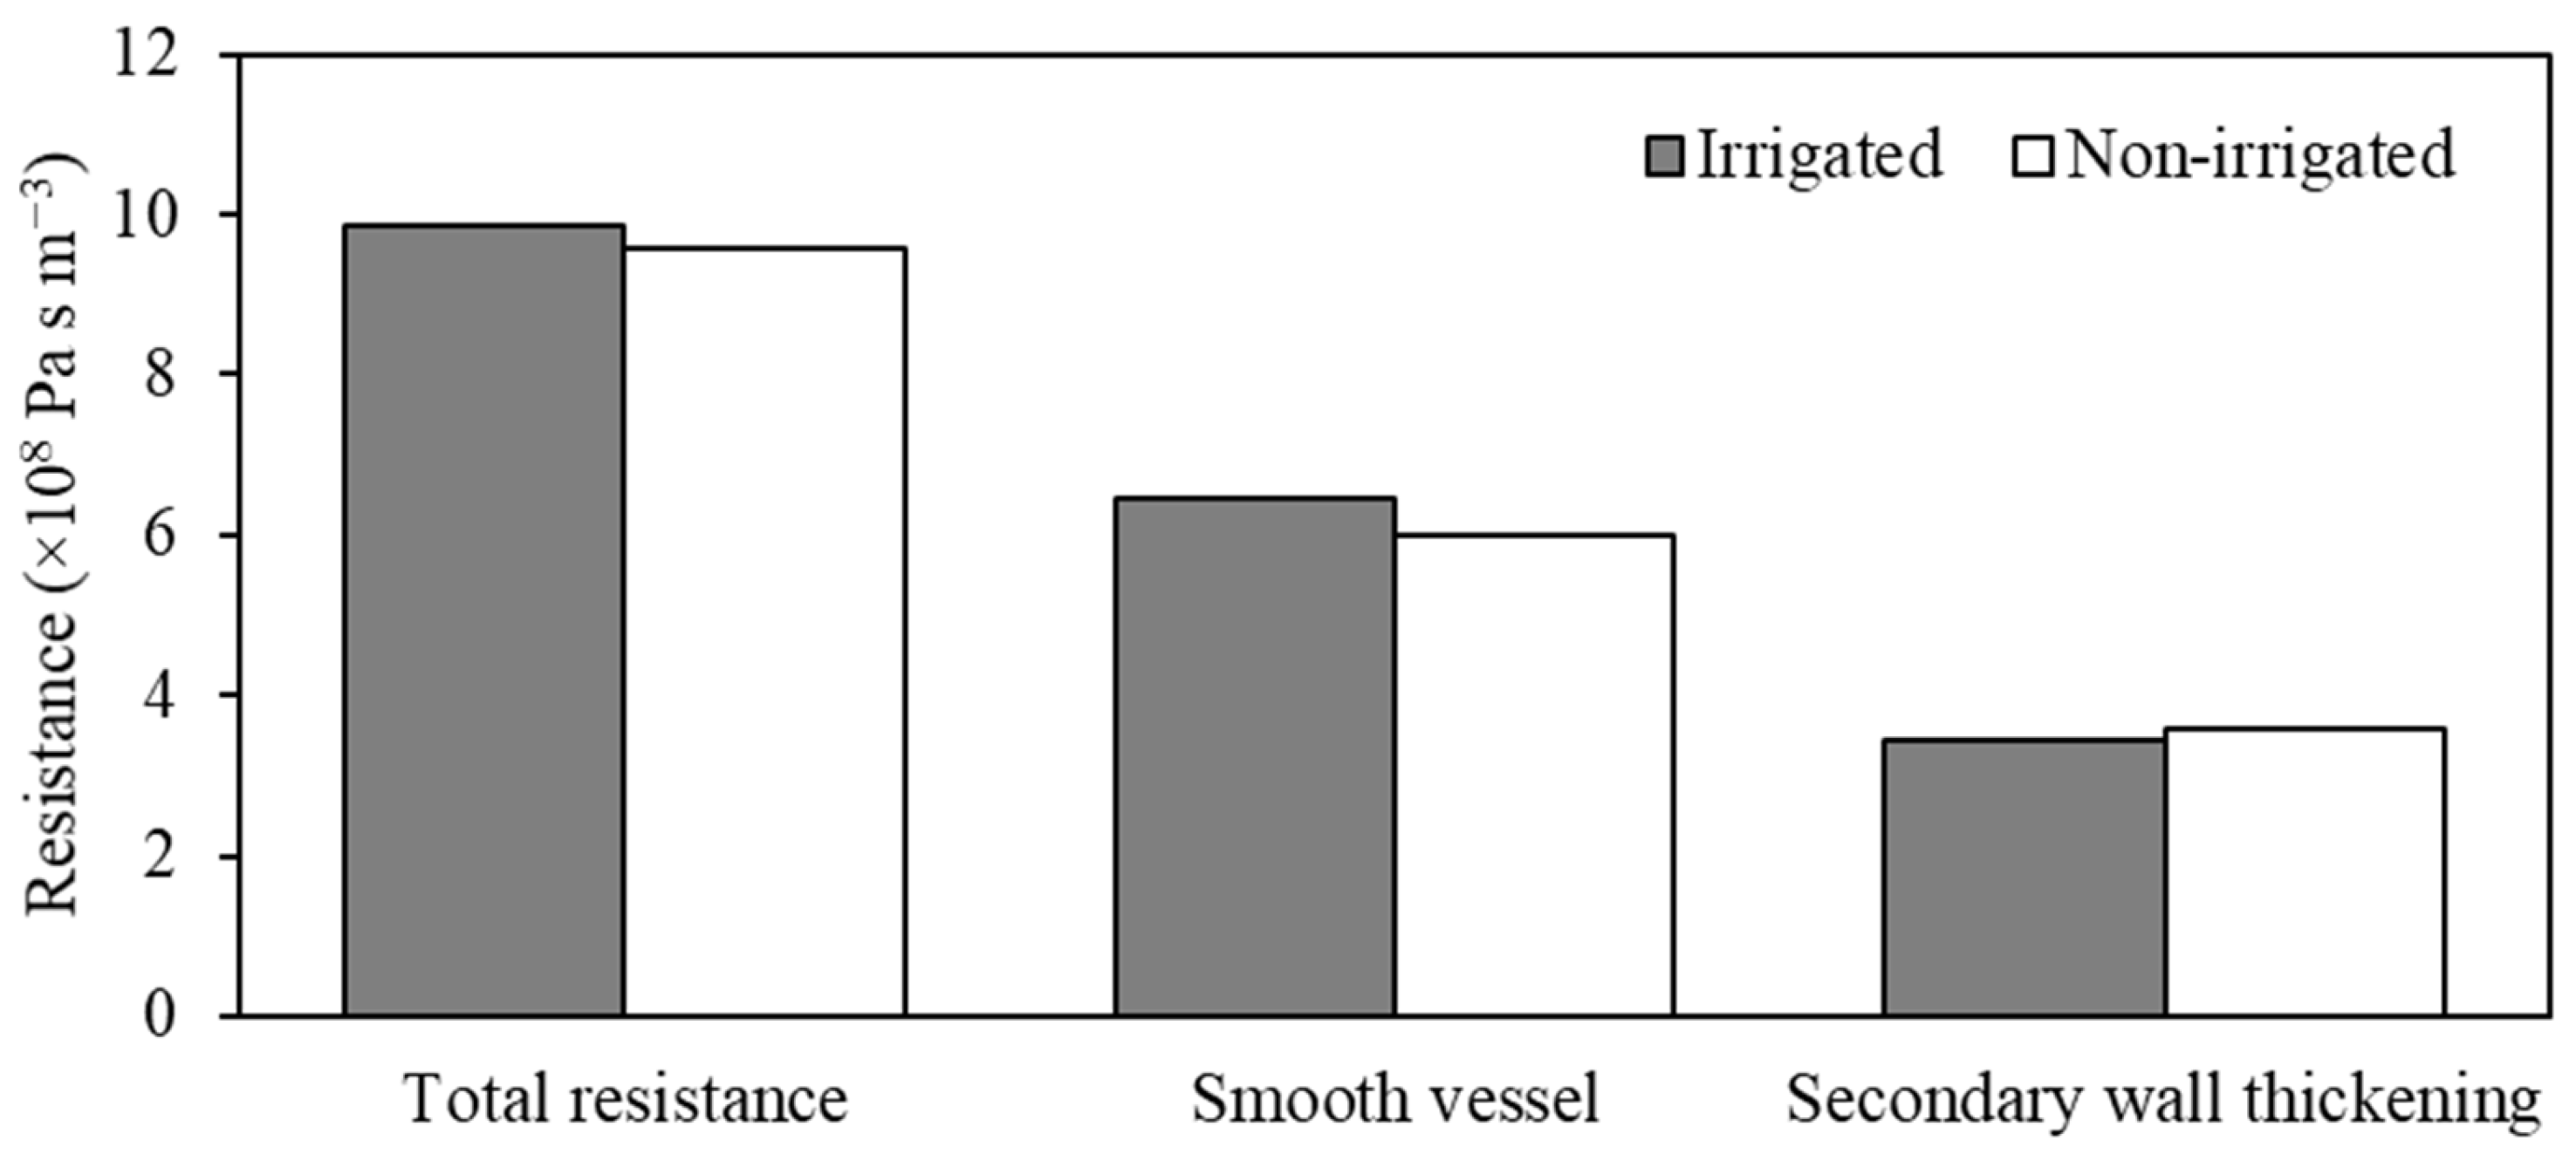
| Total Resistance | |||
|---|---|---|---|
| Treatments | Simulated | Ohm’s Law | %Diff |
| Irrigated | 9.86 × 10⁸ | 3.08 × 10⁸ | 68.72% |
| Non-irrigated | 9.56 × 10⁸ | 3.68 × 10⁸ | 61.44% |
Publisher’s Note: MDPI stays neutral with regard to jurisdictional claims in published maps and institutional affiliations. |
© 2021 by the authors. Licensee MDPI, Basel, Switzerland. This article is an open access article distributed under the terms and conditions of the Creative Commons Attribution (CC BY) license (https://creativecommons.org/licenses/by/4.0/).
Share and Cite
de Araujo, D.S.; de Moraes, D.H.M.; Mesquita, M.; Flores, R.A.; Battisti, R.; Santos, G.G.; de Deus, F.P.; Ferrarezi, R.S. Numerical Modeling of Microfluid Dynamics in Xylem Vessels of Khaya grandifoliola. Water 2021, 13, 2723. https://doi.org/10.3390/w13192723
de Araujo DS, de Moraes DHM, Mesquita M, Flores RA, Battisti R, Santos GG, de Deus FP, Ferrarezi RS. Numerical Modeling of Microfluid Dynamics in Xylem Vessels of Khaya grandifoliola. Water. 2021; 13(19):2723. https://doi.org/10.3390/w13192723
Chicago/Turabian Stylede Araujo, Daniel Somma, Diogo Henrique Morato de Moraes, Marcio Mesquita, Rilner Alves Flores, Rafael Battisti, Glenio Guimarães Santos, Fabio Ponciano de Deus, and Rhuanito Soranz Ferrarezi. 2021. "Numerical Modeling of Microfluid Dynamics in Xylem Vessels of Khaya grandifoliola" Water 13, no. 19: 2723. https://doi.org/10.3390/w13192723
APA Stylede Araujo, D. S., de Moraes, D. H. M., Mesquita, M., Flores, R. A., Battisti, R., Santos, G. G., de Deus, F. P., & Ferrarezi, R. S. (2021). Numerical Modeling of Microfluid Dynamics in Xylem Vessels of Khaya grandifoliola. Water, 13(19), 2723. https://doi.org/10.3390/w13192723