Communication

A New Non-Inserted and Portable FDR Instrument for Measuring Surface Soil Water Content

1
Key Laboratory of Ecosystem Network Observation and Modeling, Institute of Geographic Sciences and Natural Resources Research, Chinese Academy of Sciences, Beijing 100101, China
2
Shandong Yucheng Agro-Ecosystem National Observation and Research Station, Ministry of Science and Technology, Yucheng 251200, China
3
College of Resource and Environment, University of Chinese Academy of Sciences, Beijing 100049, China
4
Chinese Research Academy of Environment Sciences, Beijing 100012, China
5
Insentek, Oriental Sense of Wisdom (Zhejiang) Technology Co., Ltd., Hangzhou 311200, China
*
Author to whom correspondence should be addressed.
Water 2021, 13(19), 2712; https://doi.org/10.3390/w13192712
Submission received: 31 August 2021 / Revised: 26 September 2021 / Accepted: 27 September 2021 / Published: 30 September 2021
(This article belongs to the Section Soil and Water)

Abstract

:
Soil water content (SWC) is a vital parameter for understanding crop growth and the soil nutrient water cycle. Monitoring SWC without inserting sensors into the soil, which can break the soil structure, has previously been a significant challenge for scientists. In this study, we developed a non-inserted portable frequency domain reflection (NIP-FDR) instrument to monitor SWC continuously and automatically. The working technique of this instrument was based on the improved adjustable high-frequency oscillation method originating from the frequency domain reflection principle. Compared to the control SWC measurement instrument, the difference in SWC at 0–10 cm, 10–20 cm, and 20–30 cm depth was within 1%, 3%, and 15%, respectively, and the mean variation of SWC was less than 5% in the indoor measurements. In the field verification experiment conducted in the summer of 2020, the mean error of SWC measurements at a depth of 0–20 cm was 5%, while we failed to compare SWC at a depth of 20–30 cm due to low variability in the SWC measurement at this depth during the summer measurement period. This pioneer NIP-FDR was able to effectively monitor surface SWC, especially at depths of 0–20 cm.

1. Introduction

Soil water content (SWC) has an important impact on rainfall runoff, transpiration, and vegetation ecosystems in ecological environments [1]. Furthermore, SWC is one of the most significant factors influencing soil physical qualities, pH, plant growth, and biomass [2,3,4], and it has a key effect on soil organic deposition by providing proper water for root respiration and soil microbial activities, especially under dry conditions [5,6,7]. Moreover, excessive soil water inhibits root growth, leading to root disease and subsequent crop death [8]. Therefore, it is essential to instantly monitor SWC to guide land use management and ensure soil protection of croplands.
To date, a number of methods at different scales have been proven useful for measuring SWC, including the weighing method [9], neutron instrument method [10,11], capacitance method [12], time domain reflection (TDR) method [13], frequency domain reflection (FDR) method [14], and remote sensing [15]. Among them, monitoring SWC at a point scale (less than 0.01 cm2) has advanced with various in-situ sensors, and the FDR method has been widely used [16]. The FDR method can measure the soil apparent dielectric constant using the electromagnetic pulse principle, according to the frequency of the electromagnetic waves propagating in the soil [17,18,19,20]. Because soil dielectric content is related to the SWC, the dynamic SWC can be calculated using the relationship curve generated by the FDR method. Most previous studies have suggested that FDR instruments are convenient for measuring the SWC [17,19]. However, the FDR method requires instrument sensors to be inserted into the soil to obtain the SWC data while breaking the original soil structure at the point scale.
Therefore, it is necessary to develop a non-inserted portable frequency domain reflection (NIP-FDR) instrument to achieve immediate and mutable measurements on the SWC. This quick measurement will provide on-site data to calibrate the results measured by neutron instruments and remote sensing methods at the mesoscale and macroscale, respectively. In this study, we developed a new NIP-FDR instrument for monitoring the SWC. The objectives of this study were the following: (1) to develop a NIP-FDR instrument for SWC measurement that did not require soil insertion, and (2) to verify that this instrument was effective in monitoring SWC at depths of 0–30 cm. The hypotheses of this study are as follows: (1) the NIP-FDR will be useful for measuring surface SWC; (2) the NIP-FDR is accurate when compared with other available instruments for monitoring the SWC.

2. Materials and Methods

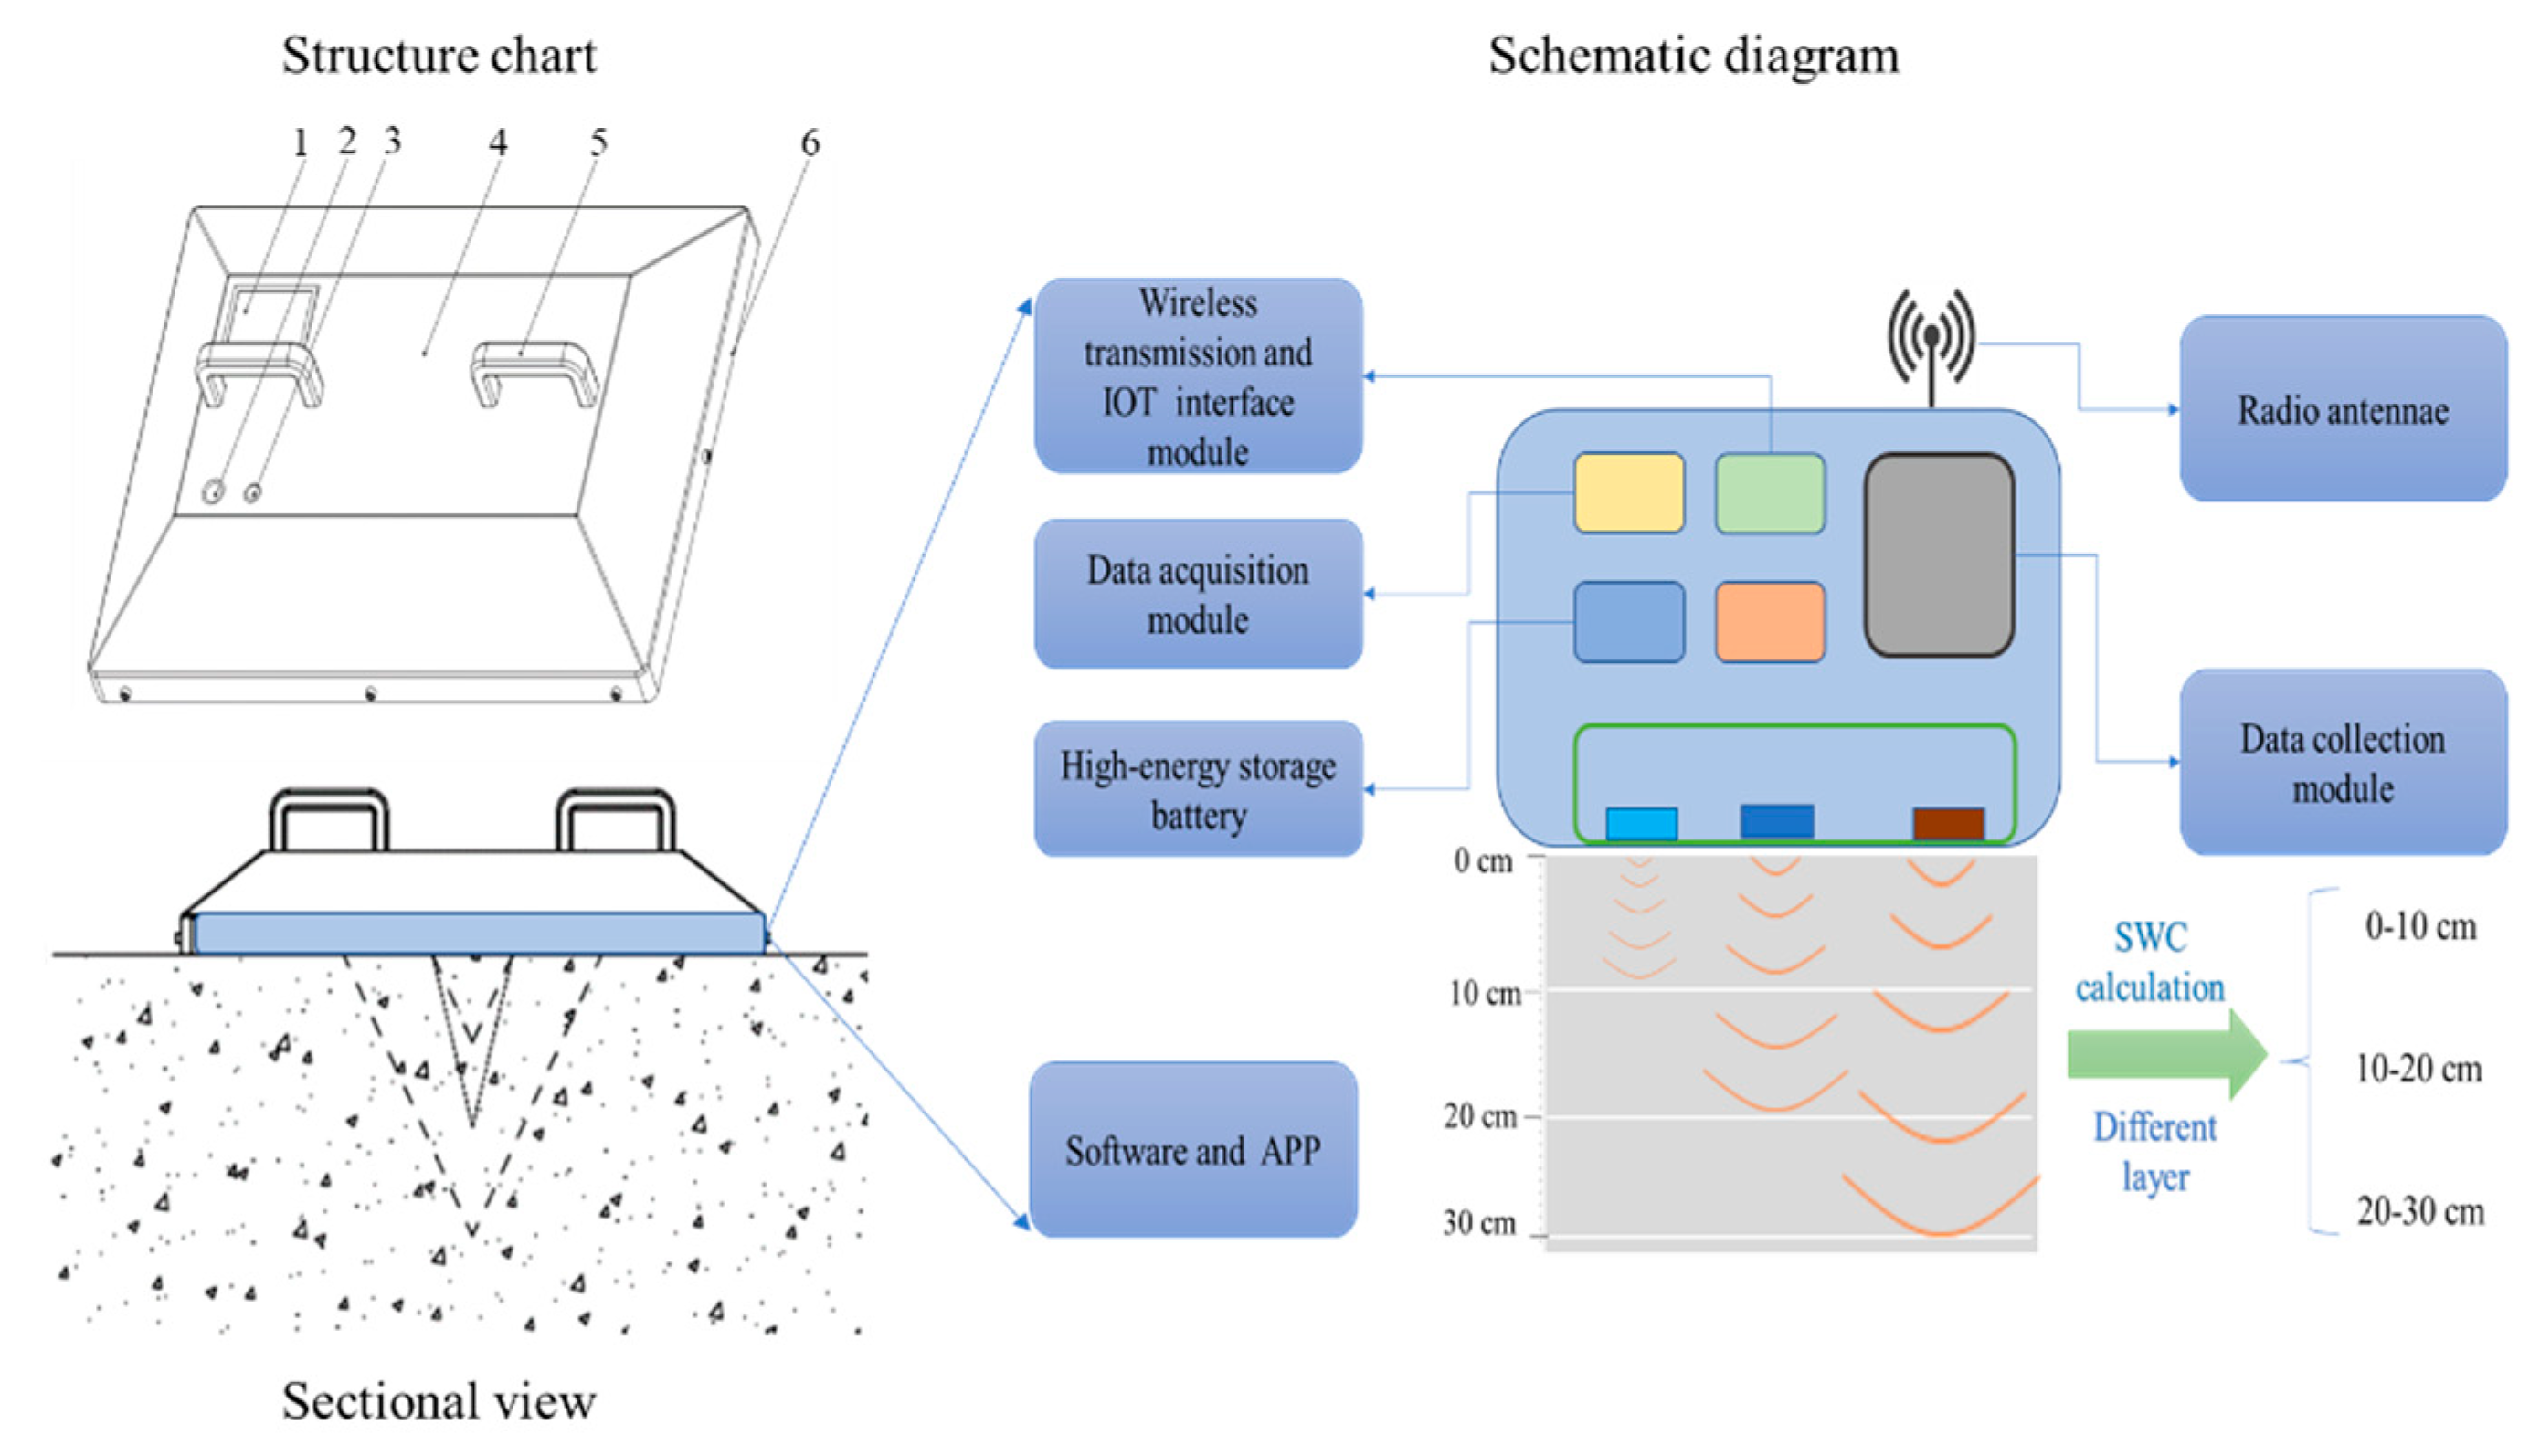
2.1. Instrument Design

The device resembled a fixed-point measurement mode in terms of appearance and structural design. The equipment platform was fixed at a test point for long-term observation, and the sampling frequency could be adjusted to form 2D time distribution information of the SWC at the measured point. The device design diagram is shown in Figure 1 and covered an area of 0.6 m × 0.5 m.
Target technical parameters were as follows:
  • soil (volume) water content measurement range: 0—saturation.
  • measurement accuracy: ±5%.
  • measurement soil depth: 0–10, 10–20, 20–30 cm.
  • stability time: 1 min.
  • power supply mode: lithium iron phosphate battery (+3.3 V DC).
  • working voltage: 3.3 V.
  • average fault-free time: ≥100 h.
  • operating temperature duration: −40–85 °C.

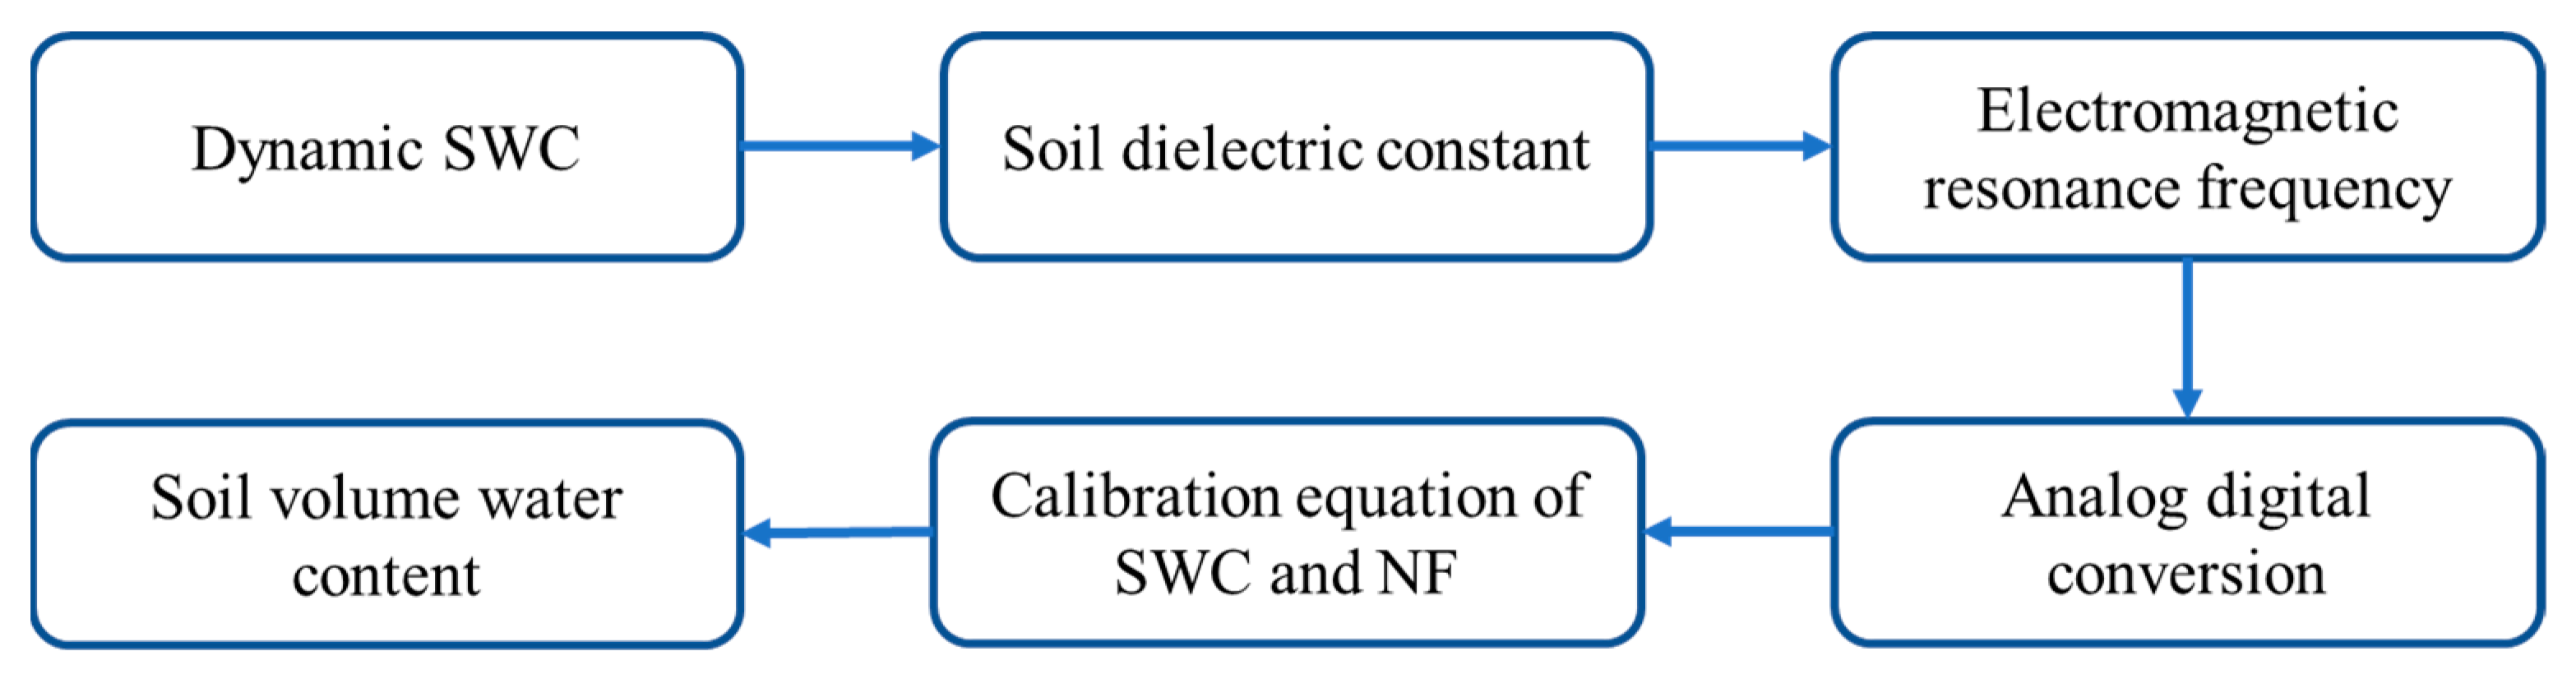
2.2. Instrument Operation Mechanism

The critical technique of the instrument was an improved adjustable high-frequency oscillation method [21], based on the FDR principle [17,19]. In this study, the maximum resonance frequency was monitored by considering the soil as a capacitor, and the normalized resonance frequency (reflecting the soil dielectric constant) was related to the target SWC. Then, the measured SWC data monitored by the NIP-FDR were calibrated using the true SWC data monitored by the other mutable instrument [14]. Therefore, we were able to obtain the target SWC data using the NIP-FDR instrument (Figure 2).
This method was first used to measure the SWC of different soil depths by adjusting the distance between the oscillating circuit electrodes and the starting frequency of the vibration reference. The main advantages of this device are that it is non-inserted, portable, and does not break the soil structure.
The oscillation circuit design of the equipment was as follows:
(1) Vertical transmission and reception. The electromagnetic wave of the existing high-frequency oscillating sensor was transmitted to all sides, and its transmission and reception were symmetrically arranged face-to-face. The vertical transmitting and receiving sensors of the new instrument were placed in the same plane to address the problem of non-insertion.
(2) Different oscillating circuits were used to obtain different experimental results. It was found that different oscillating frequencies had different sensitivities to SWC changes at different soil depths. Therefore, the SWC at various depths was measured at different frequencies. After calibration, the SWC was converted into the layered average volume water content of the soil.
The long-term monitoring data of multiple groups of normalized frequency (NF) at the same time were used to obtain the corresponding values of SWC at different soil depths and NF at different soil depths. In this study, one of the most important assumptions was that there is a linear relationship between the SWC and NF at different soil depths [9,22]. Therefore, the calculated values of SWC at different soil depths could be transformed into multiple linear regression models of SWC with NF at different burial depths and then solved.
It should be noted that the relationship between NF and SWC was probably not linear, and accurate model fitting required the use of Hydrus, MATLAB, and other software for simulation and fitting. To conduct multiple linear regression analysis, the Pearson correlation analysis was used to evaluate the correlation coefficient between the NF and SWC. The formula for calculating the correlation coefficient is shown in Equation (1) [17]:
r ( X , Y ) = C o v ( X , Y ) V a r [ X ] V a r [ Y ]
where X is NF, Y is SWC, r(X,Y) is the correlation coefficient, Cov(X,Y) is the covariance of X and Y, and Var[X] and Var[Y] are the variances of X and Y, respectively.
According to the hypotheses in Section 1, the multiple linear regression equations of NF and SWC were obtained as follows:
SWC i = a + b NF i + ε
where SWCi is the soil moisture content at soil depth i, a represents the fitted constant term or intercept, b is the regression coefficient, NF represents dimensionless signal data, and ε is the error term.

2.3. Calibration and Verification Measurement

2.3.1. Indoor Calibration and Test

In an indoor environment, three sensing vibration circuits worked stably on the soil medium at a depth of 30 cm, and the frequency decreased with the moisture change of the soil samples. Using a soil experiment of 45 groups, the equipment recorded the frequency data of soil samples with different soil depths and water contents. The soil samples were stirred to ensure that the SWC was evenly distributed to facilitate the calibration parameters.
The obtained frequencies were normalized, fitted, and calibrated by parameters using non-linear regression statistical methods, with indoor measurement accuracy of up to 5%.
After the SWC at 0–10 cm, 10–20 cm, and 0–30 cm depths were measured, the SWC at 10–20 cm and 20–30 cm was calculated using a multivariate linear fitting method. The basic assumption is that the SWC at 0–10 cm depth is linear to 0–20 cm, and 0–10 cm and 10–20 cm is also linear to that of 0–30 cm. Therefore, SWC at depths of 10–20 cm and 20–30 cm could be calculated by multivariate linear fitting after 0–10 cm, 0–20 cm, and 0–30 cm SWC were measured.
To verify the above linear regression hypothesis, a layered soil rate device was built indoors at a depth of 30 cm. At depths of 5, 15, and 25 cm, a plug-in 5 TE SWC sensor (METER Group, Inc., Washington, DC, USA) was installed, respectively [23,24]. When SWC is uniform (dry soil before adding water, full penetration after adding water), the prototype equipment was relatively consistent with the soil water value measured by the reference equipment 5TE.

2.3.2. Field Measurement

From mid-July 2020, field comparison testing was conducted at the Shandong Yucheng Agro-ecosystem National Observation and Research Station, Ministry of Science and Technology (36°50′ N, 116°34′ E). Detailed environment and cropland management information on this station can be found in previous studies [25,26,27,28]. An ET60 instrument (Insentek Oriental Sense of WisdomTechnology Co. Ltd., Hangzhou, China) was installed as the control instrument after soil punching and grouting [29]. Before the NIP-FDR was placing next to the ET60, covered surface soil was manually leveled. The distance between those two meters was 0.50 m, ensuring that the quality of the soil was consistent. All data were transmitted regularly and remotely (recorded every 30 min) and then transmitted to the system background for recording and analysis.
Field comparison tests were conducted over 12 days between 31 July and 10 August 2020, covering a certain area during the same hours every day. To protect the portable instrument from precipitation, the NIP-FDR was placed outside when it was not raining.

3. Results

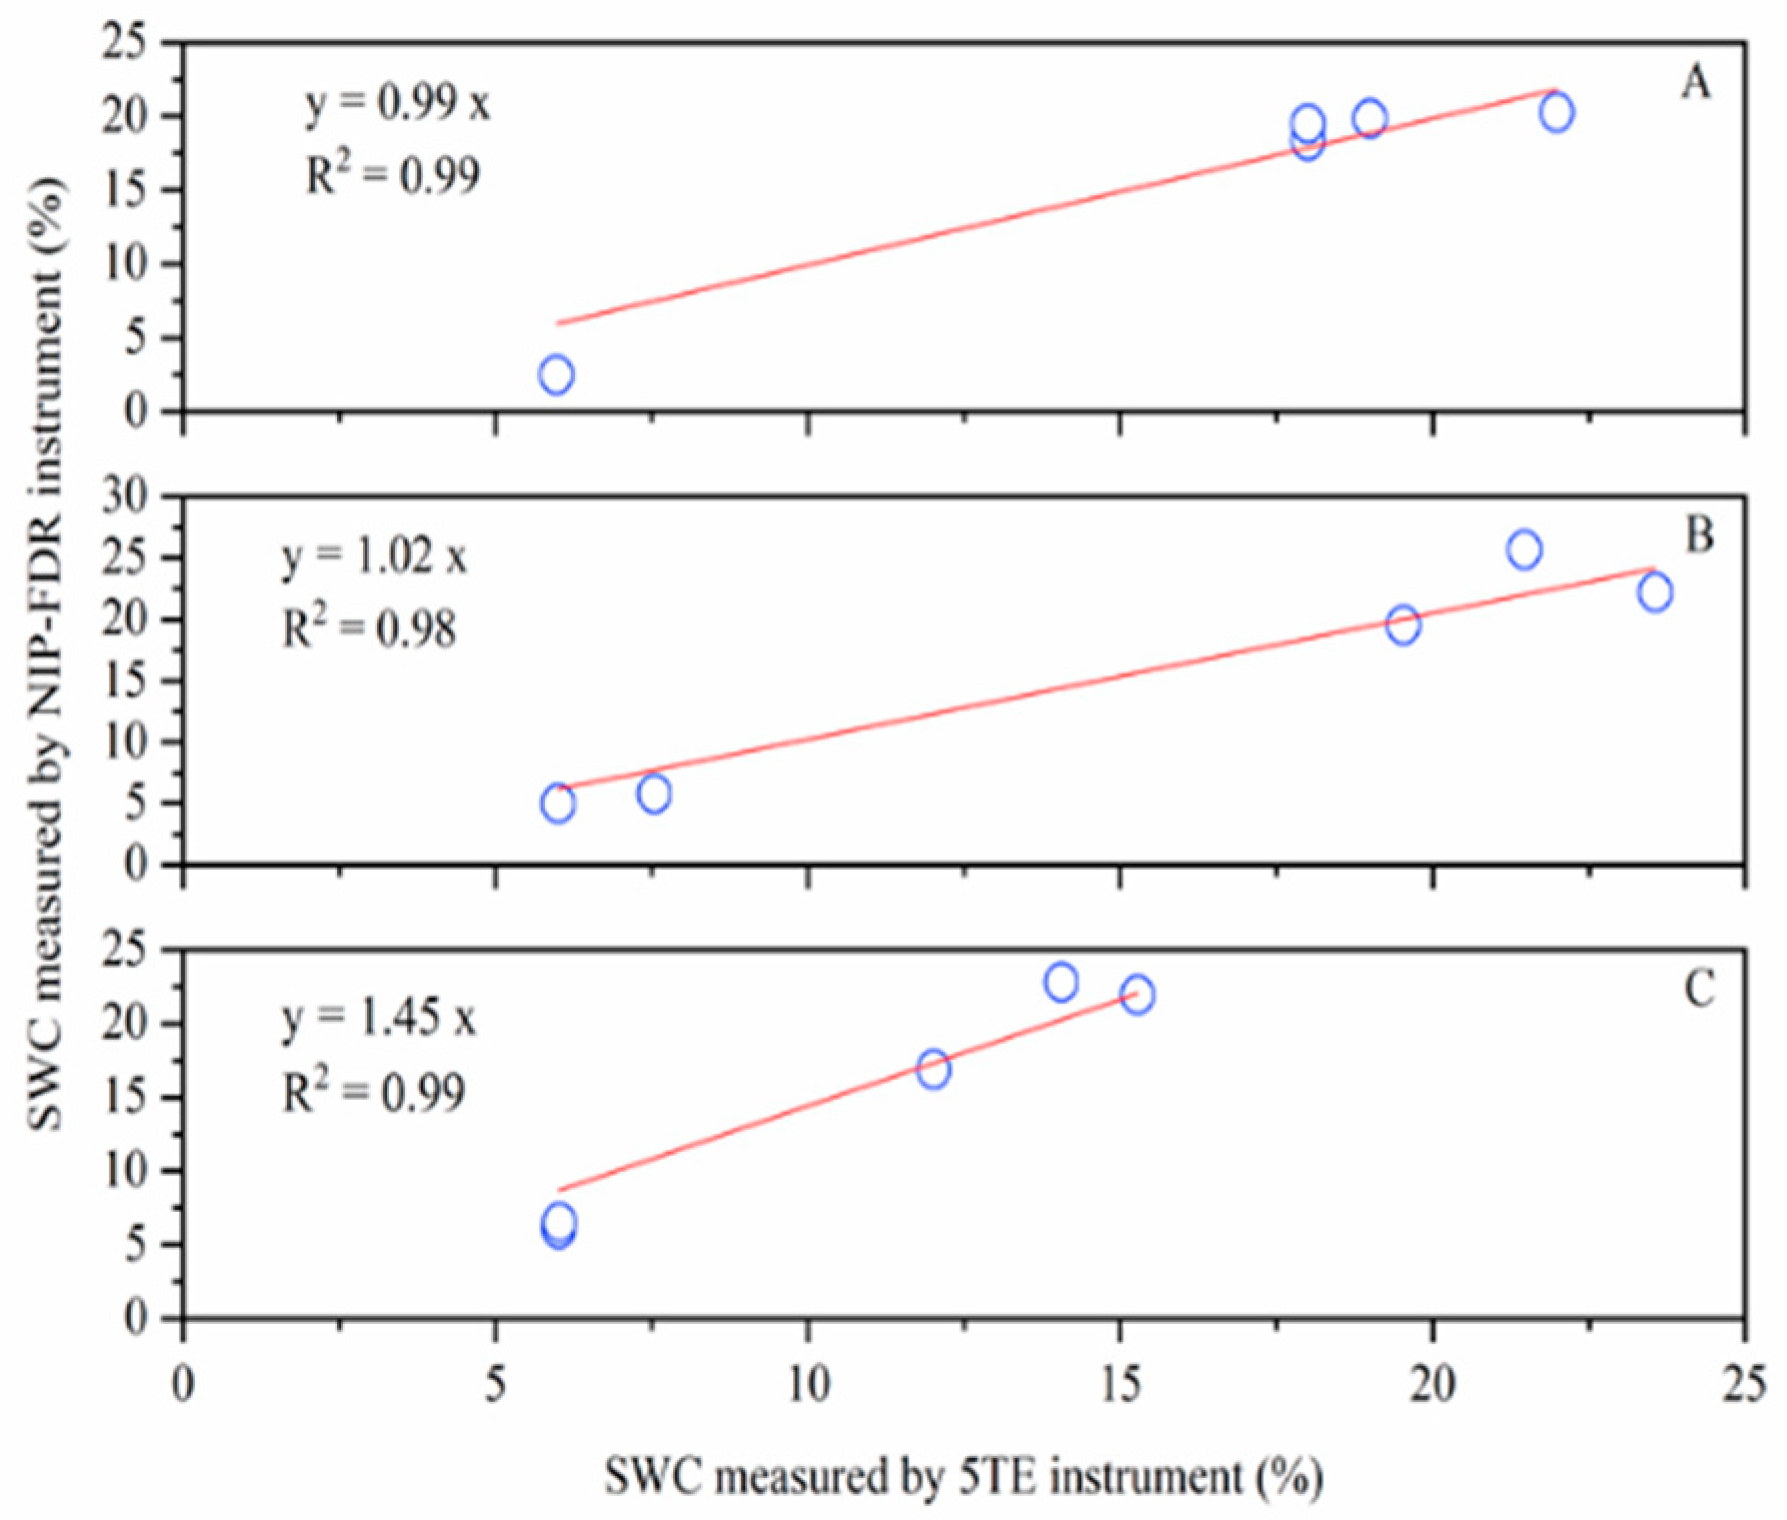
3.1. Indoor Test and Calibration

The results showed that SWC at depths of 0–10, 10–20, and 20–30 cm measured by the non-inserted SWC monitor were consistent with the 5TE SWC sensor (Figure 3). The difference in the measured SWC data between the two instruments at 0–10, 10–20, and 20–30 cm was within 1%, 3%, and 15%, respectively (Figure 3). This result suggests that SWC at these three depth ranges could be converted from SWC measurements at depths of 0–10 cm, 0–20 cm, and 0–30 cm using multivariate linear regression.

3.2. Field Measurement

Farmland SWC data varied little at depths of 10–20 cm and 20–30 cm, but notable differences were recorded at soil depths of 0–10 cm (Figure 4). The measurement results showed that the NIP-FDR instrument was effective for SWC measurements at depths of 0–10 cm and 10–20 cm (Figure 4). However, the SWC at a depth of 20–30 cm was concentrated in approximately 29%, and the results could not reflect the quality of our instrument.

4. Discussion

Soil water content is a key factor that limits crop growth and soil organic matter deposition [1,3]. In the cropland system, the roots of most crops, including wheat, maize, and beans, are distributed at depths of 0–20 cm. Therefore, it is necessary to monitor SWC in the surface soil of croplands. In this study, we developed an NIP-FDR instrument to measure cropland SWC at depths of 0–20 cm. The verification experiment showed that our instrument was effective for monitoring SWC at depths of 0–20 cm (Figure 3 and Figure 4). However, the linear regression of SWC data between the NIP-FDR and ET60 instruments was not significant at depths of 20–30 cm (Figure 4). This could be explained by the SWC in the 20–30 cm soil layer having no apparent variation during the short experimental period in summer, resulting from the lack of irrigation and precipitation.
In this study, the indoor experiment results showed that the non-inserted SWC instrument was sensitive to SWC variation from 4% to 24% (Figure 3). This SWC interval resulted from the addition of dry soil and water to simulate natural SWC after rain and irrigation. Moreover, the field measurement verified this quality; the mean error of SWC data was less than 5% between the NIP-FDR and control SWC instruments (Figure 4). Therefore, this non-inserted meter is sensitive to short-term weather changes and the measuring environment. However, the NIP-FDR was not tested on different soil types or climate zones. Thus, further verification is needed in future work.
The FDR method has been widely used in SWC measurements, while nearly all FDR instruments measure SWC using the insertion method [9,22]. This method breaks the initial soil structure and leads to unexpected artificial interference on SWC after measurements are taken, and may have had an impact on SWC accuracy at the next monitoring point [30]. Therefore, it was necessary to reduce the influence of artificial interference on the soil during SWC measurements. In this study, we suggested that this NIP-FDR could measure SWC immediately without inserting sensors into the soil and changing the original SWC character. Moreover, the developed instrument has a relatively greater cover area and is more representative than traditional SWC monitoring with needle sensors [22].
It is necessary to monitor SWC quickly and accurately without interfering with the soil, especially for agricultural activities in excessive dry and flood areas. In this study, we developed an NIP-FDR instrument to measure SWC, and the indoor and field verification work proved that it was possible to monitor SWC at depths of 0–20 cm during a short time frame and easy to move due to it being light-weight. However, it failed to compare SWC accuracy at depths of 20–30 cm due to the relatively less mutable SWC during summer. Therefore, it is necessary to conduct further comparisons of SWC measurements at deeper soil layers in future studies to optimize the newly designed NIP-FDR instrument for measurements at these depths.

5. Conclusions

This study successfully developed a new FDR instrument to measure the SWC without soil insertion. This new NIP-FDR instrument was based on an improved adjustable high-frequency oscillation method. After calibration, indoor and field comparisons of the measured SWC data between our instrument and other SWC meters was conducted. The results showed that the NIP-FDR is suitable for monitoring surface SWC. Compared with other SWC instruments, NIP-FDR was useful for measuring SWC at soil depths of 0–10 and 10–20 cm. Compared with the control instrument, the error of SWC measured by the NIP-FDR was 1% and 3% at depths of 0–10 and 10–20 cm in the indoor experiment and 4% and 6% in the field experiment, respectively. However, this NIP-FDR instrument was not effective at depths of 20–30 cm. Therefore, further experiments are needed to monitor SWC at deeper soil depths and to improve the performance of the NIP-FDR at those depths.

Author Contributions

Conceptualization, F.L., Q.Z. and K.D.; methodology, Y.Q., F.L., H.Z., B.L. and K.D.; formal analysis, Y.Q.; investigation, Q.L., S.L., H.Z. and B.L.; writing—original draft preparation, Y.Q. and K.D.; writing—review and editing, F.L. and K.D. All authors have read and agreed to the published version of the manuscript.

Funding

This research was funded by the National Natural Science Foundation of China (No. U1906219), the National Key Research and Development Program of China (No. 2016YFC0500101) and the National Natural Science Foundation of China (No. 42007155, U2006212).

Institutional Review Board Statement

Not applicable.

Informed Consent Statement

Not applicable.

Acknowledgments

We would like to thank colleagues at the Yucheng experimental station for experimental support and constructive advice on this manuscript.

Conflicts of Interest

The authors declare no conflict of interest.

References

  1. Kampf, S.K.; Tyler, S.W.; Ortiz, C.A.; Munoz, J.F.; Adkins, P.L. Evaporation and land surface energy budget at the Salar de Atacama, Northern Chile. J. Hydrol. 2005, 310, 236–252. [Google Scholar] [CrossRef]
  2. Hammami, Z.; Qureshi, A.S.; Sahli, A.; Gauffreteau, A.; Chamekh, Z.; Ben Azaiez, F.E.; Ayadi, S.; Trifa, Y. Modeling the effects of irrigation water salinity on growth, yield and water productivity of barley in three contrasted environments. Agronomy 2020, 10, 1459. [Google Scholar] [CrossRef]
  3. Jia, X.; Shao, M.A.; Wei, X.; Wang, Y. Hillslope scale temporal stability of soil water storage in diverse soil layers. J. Hydrol. 2013, 498, 254–264. [Google Scholar] [CrossRef]
  4. Kim, S.; Meki, M.N.; Kim, S.; Kiniry, J.R. Crop modeling application to improve irrigation efficiency in year-round vegetable production in the Texas winter garden region. Agronomy 2020, 10, 1525. [Google Scholar] [CrossRef]
  5. Guo, H.; Li, S.; Kang, S.; Du, T.; Tong, L.; Ding, R. Annual ecosystem respiration of maize was primarily driven by crop growth and soil water conditions. Agric. Ecosyst. Environ. 2019, 272, 254–265. [Google Scholar] [CrossRef]
  6. Sherrod, L.A.; Mcmaster, G.S.; Delgado, J.A.; Schipanski, M.E.; Fonte, S.J.; Montenieri, R.L.; Larson, K. Soil carbon pools in dryland agroecosystems as affected by several years of drought. J. Environ. Qual. 2018, 47, 766–773. [Google Scholar] [CrossRef] [Green Version]
  7. Shi, A.; Marschner, P. Drying and rewetting frequency influences cumulative respiration and its distribution over time in two soils with contrasting management. Soil Biol. Biochem. 2014, 72, 172–179. [Google Scholar] [CrossRef]
  8. Khanthavong, P.; Yabuta, S.; Asai, H.; Hossain, M.A.; Akagi, I.; Sakagami, J.-I. Root response to soil water status via interaction of crop genotype and environment. Agronomy 2021, 11, 708. [Google Scholar] [CrossRef]
  9. Vereecken, H.; Huisman, J.A.; Franssen HJ, H.; Brueggemann, N.; Bogena, H.R.; Kollet, S.; Javaux, M.; Van Der Kruk, J.; Vanderborght, J. Soil hydrology: Recent methodological advances, challenges, and perspectives. Water Resour. Res. 2015, 51, 2616–2633. [Google Scholar] [CrossRef]
  10. Fersch, B.; Francke, T.; Heistermann, M.; Schroen, M.; Doepper, V.; Jakobi, J.; Baroni, G.; Blume, T.; Bogena, H.; Budach, C.; et al. A dense network of cosmic-ray neutron sensors for soil moisture observation in a highly instrumented pre-Alpine headwater catchment in Germany. Earth Syst. Sci. Data 2020, 12, 2289–2309. [Google Scholar] [CrossRef]
  11. Du, K.; Qiao, Y.; Zhang, Q.; Li, F.; Li, Q.; Liu, S.; Tian, C. Modeling soil water content and crop-growth metrics in a wheat field in the North China plain using RZWQM2. Agronomy 2021, 11, 1245. [Google Scholar] [CrossRef]
  12. Egorov, Y.V.; Sudnitsyn, I.I.; Bobkov, A.V.; Kirichenko, A.V. Effect of the structure on the electrical properties of soils. Eurasian Soil Sci. 2013, 46, 284–290. [Google Scholar] [CrossRef]
  13. Fu, Y.; Lu, Y.; Heitman, J.; Ren, T. Root influences on soil bulk density measurements with thermo-time domain reflectometry. Geoderma 2021, 403, 115195. [Google Scholar] [CrossRef]
  14. Lukanu, G.; Savage, M.J. Calibration of a frequency-domain reflectometer for determining soil-water content in a clay loam soil. Water SA 2006, 32, 37–42. [Google Scholar]
  15. Zeng, J.; Li, Z.; Chen, Q.; Bi, H. Method for soil moisture and surface temperature estimation in the Tibetan Plateau Using spaceborne radiometer observations. IEEE Geosci. Remote Sens. Lett. 2015, 12, 97–101. [Google Scholar] [CrossRef]
  16. Robinson, D.A.; Campbell, C.S.; Hopmans, J.W.; Hornbuckle, B.K.; Jones, S.B.; Knight, R.; Ogden, F.; Selker, J.; Wendroth, O. Soil moisture measurement for ecological and hydrological watershed-scale observatories: A review. Vadose Zone J. 2008, 7, 358–389. [Google Scholar] [CrossRef] [Green Version]
  17. He, H.; Turner, N.C.; Aogu, K.; Dyck, M.; Feng, H.; Si, B.; Wang, J.; Lv, J. Time and frequency domain reflectometry for the measurement of tree stem water content: A review, evaluation, and future perspectives. Agric. For. Meteorol. 2021, 306, 108442. [Google Scholar] [CrossRef]
  18. Qin, A.; Ning, D.; Liu, Z.; Duan, A. Analysis of the accuracy of an FDR sensor in soil moisture measurement under laboratory and field conditions. J. Sens. 2021, 2021, 6665829. [Google Scholar] [CrossRef]
  19. De Oliveira, I.N.; De Souza, Z.M.; Lovera, L.H.; Farhate, C.V.V.; Lima, E.D.S.; Esteban, D.A.A.; Totti, M.C.V. Capacitance probe calibration for an Ultisol Udult cultivated with sugarcane by soil tillages. Agric. Water Manag. 2020, 241. [Google Scholar] [CrossRef]
  20. Sanches, A.C.; De Souza, D.P.; Ferreira De Jesus, F.L.; Mendonca, F.C.; Gomes, E.P.; Macedo Pezzopane, J.R. Comparison of water consumption estimates for tropical and winter forages by FDR probes and weighing lysimeters. Semin.-Cienc. Agrar. 2019, 40, 1115–1125. [Google Scholar] [CrossRef]
  21. Holthusen, D.; Pertile, P.; Awe, G.O.; Reichert, J.M. Soil density and oscillation frequency effects on viscoelasticity and shear resistance of subtropical Oxisols with varying clay content. Soil Tillage Res. 2020, 203, 104677. [Google Scholar] [CrossRef]
  22. Acosta-Motos, R.J.; Rothwell, S.A.; Massam, M.J.; Albacete, A.; Zhang, H.; Dodd, I.C. Alternate wetting and drying irrigation increases water and phosphorus use efficiency independent of substrate phosphorus status of vegetative rice plants. Plant Physiol. Biochem. 2020, 155, 914–926. [Google Scholar] [CrossRef]
  23. Kaluzewicz, A.; Bosiacki, M.; Spizewski, T. Influence of biostimulants on the content of macro- and micronutrients in broccoli plants exposed to drought stress. J. Elementol. 2018, 23, 287–297. [Google Scholar]
  24. Ozmen, S. Soil temperature activity on soil water content under organic and conventional managements in hazelnut or-chard. Fresenius Environ. Bull. 2016, 25, 3654–3665. [Google Scholar]
  25. Tu, C.; Li, F. Responses of greenhouse gas fluxes to experimental warming in wheat season under conventional tillage and no-tillage fields. J. Environ. Sci. 2017, 54, 314–327. [Google Scholar] [CrossRef]
  26. Zhao, X.; Li, F.; Ai, Z.; Li, J.; Gu, C. Stable isotope evidences for identifying crop water uptake in a typical winter wheat-summer maize rotation field in the North China Plain. Sci. Total Environ. 2018, 618, 121–131. [Google Scholar] [CrossRef]
  27. Du, K.; Li, F.; Leng, P.; Li, Z.; Tian, C.; Qiao, Y.; Li, Z. Differential influence of no-tillage and precipitation pulses on soil heterotrophic and autotrophic respiration of summer maize in the North China plain. Agronomy 2020, 10, 2004. [Google Scholar] [CrossRef]
  28. Du, K.; Li, F.; Qiao, Y.; Leng, P.; Li, Z.; Ge, J.; Yang, G. Influence of no-tillage and precipitation pulse on continuous soil respiration of summer maize affected by soil water in the North China Plain. Sci. Total Environ. 2021, 766, 144384. [Google Scholar] [CrossRef] [PubMed]
  29. Qin, A.; Ning, D.; Liu, Z.; Sun, B.; Zhao, B.; Xiao, J.; Duan, A. Insentek sensor: An alternative to estimate daily crop evapotranspiration for maize plants. Water 2019, 11, 25. [Google Scholar] [CrossRef] [Green Version]
  30. Skierucha, W.; Wilczek, A. A FDR sensor for measuring complex soil dielectric permittivity in the 10-500 MHz frequency range. Sensors 2010, 10, 3314–3329. [Google Scholar] [CrossRef] [Green Version]
Figure 1. Structure chart and schematic diagram of the non-inserted portable frequency domain reflection (NIP-FDR) for measuring soil water content (SWC). The features of the structure chart are numbered and represent the antenna window (1), charging interface (2), power button (3), stainless steel shell (4), handle (5), and footwall (6).
Water 13 02712 g001
Figure 2. The technique route line of the NIP-FDR instrument designed in this study.
Water 13 02712 g002
Figure 3. Comparisons of SWC measured by the NIP-FDR and 5 TE instruments. (A) 0–10 cm; (B) 10–20 cm; (C) 20–30 cm.
Water 13 02712 g003
Figure 4. Comparisons of SWC measured by the NIP-FDR and ET60 instruments at the depth ranges 0–10, 10–20, and 20–30 cm.
Water 13 02712 g004
Publisher’s Note: MDPI stays neutral with regard to jurisdictional claims in published maps and institutional affiliations.

