Article

Investigations on the Influence of Total Water Hardness and pH Value on the Measurement Accuracy of Domestic Cold Water Meters

1
RISE—Research Institutes of Sweden, Brinellgatan 4, 504 62 Borås, Sweden
2
PTB—Physikalisch-Technische Bundesanstalt, Bundesallee 100, 38116 Braunschweig, Germany
3
CMI—Czech Metrology Institute, Okruzni 31, 638 00 Brno, Czech Republic
4
TZW—DVGW-Technologiezentrum Wasser, Wasserwerkstraße 2, 01326 Dresden, Germany
*
Author to whom correspondence should be addressed.
Water 2021, 13(19), 2701; https://doi.org/10.3390/w13192701
Submission received: 3 September 2021 / Revised: 23 September 2021 / Accepted: 24 September 2021 / Published: 29 September 2021
(This article belongs to the Section Water Quality and Contamination)

Abstract

:
In the framework of the ongoing EMPIR Joint Research Project (JRP) 17IND13 Metrology for real-world domestic water metering (Metrowamet), a main task is to investigate the influence of realistic operation conditions, that is, typical water qualities (suspended particles, degree of hardness, and pH value), on the measurement accuracy. For this purpose, two representative types of cold water meters were investigated in more detail. Initially, the cold water meters were calibrated and then subjected to an accelerated wear test with water of different pH values and degrees of hardness. The accelerated wear tests were designed to reproduce the realistic use and service life of a cold water meter. Subsequently, the cold water meters were re-calibrated to assess the influence of the different water qualities on the measurement accuracy. One of the results was that the measurement accuracy of the water meters investigated was not strongly affected by the water quality. The practical realisation and the measurement results are reported in this paper.

1. Introduction

The European Council (EC) Measuring Instruments Directive (MID) 2004/22/EC [1] is a directive by the European Union, which was officially launched on 30 October 2006. To ensure free trade and reduce trade barriers within the European countries, it was decided that only one type of examination certificate will be required in the future. In the time before MID, with directive 75/33/EEC (cold-water meters) [2], country specific approvals were needed to sell water meters in Europe. The MID was introduced with the aim of harmonising many aspects of legal metrology across all member states of the EU. For this reason, directive 75/33/EEC was partially repealed by directive 2004/22/EC for meters defined in Annex MI-001 (water meters intended for the measurement of volumes of clean, cold or heated water in residential, commercial and light industrial use). The MID describes how measuring instruments are to be designed, how the conformity (previously verification) of measuring instruments to the MID can be declared, how the instruments must be marked and how the instruments are then to be transferred to legal metrology. The manufacturer certifies, by means of a written declaration of conformity, that the meters produced comply with the requirements of the MID and that the approval specifications are permanently met by means of a quality management system (QMS). A ten-year transition period ended on 30 October 2016. From this date, only conformity assessed measuring instruments have been permitted to be placed on the market. Directive 2014/32/EU [3] repeals Directive 2004/22/EC with effect from 20 April 2016. The MID also regulates the European-wide Maximum Permissible Error (MPE) limits for cold water meters. These values correspond to the previously known values. This means that domestic water meters will continue to be allowed to measure with an accuracy of ±5% in the lower flow range and ±2% in the continuous load range. However, the MID brings completely new designations for water meters, Table 1. The previous designations, Q min , Q t , Q n and Q max , will be replaced by Q 1 , Q 2 , Q 3 and Q 4 . In addition, there are other dependencies between these quantities (e.g., R-factor on the meter instead of the metrological class (A, B or C) and Q 4 = 1.25 × Q 3 instead of Q max = 2 × Q n ).
The European Parliament formally adopted the revised Drinking Water Directive 2020/2184 [4] related to the quality of water intended for human consumption on 16 December 2020. The new regulation is based on the Drinking Water Directive (Council Directive 98/83/EC) from 3 November 1998 [5]. The objective of this directive is to protect human health from the harmful effects of water contamination by ensuring that water is healthy and clean. The directive sets essential quality standards at the EU level. One requirement of the directive is that a total of 48 microbiological, chemical and indicator parameters must be regularly monitored and tested. When transposing the Drinking Water Directive into national law, EU member states can set higher but not lower standards. The limits of the microbiological, chemical and indicator parameters are specified in the annexes to the Drinking Water Directive. For water meters, this means that the measurement accuracy must be maintained for all types of water that comply with the parameter limits specified in this document. This can pose a real challenge in terms of the measurement accuracy and particularly the measurement stability of water meters for some of the parameters. The long-term use of the water meter with water with certain properties can especially have a negative effect on the measurement accuracy. The focus of the investigations is on the influence of total water hardness and pH value on the measurement accuracy and measurement stability of different types of water meters as these two parameters are considered to be two of the most important influencing factors. There are virtually no data in the literature and certainly no detailed study on the influence of pH value and water hardness on the measurement accuracy of domestic water meters. For this reason, the EMPIR Joint Research Project (JRP) 17IND13 Metrology for real-world domestic water metering (Metrowamet) was launched. What was clear almost from the beginning is that water quality can significantly affect the measurement performance of domestic water meters. On the other hand, random testing of water meters has shown that there is no correlation between meter performance and age, measured volume, and chemo-physical parameters of the tap water. It was therefore considered helpful, if the field investigations could be complemented by laboratory tests to detect any water quality problems as early as possible. With regard to water quality, there are European regulations [4,5] that define the limit values of drinking water in order to protect human health from the adverse effects of any contamination of water intended for human consumption. In addition to this, there have been several studies on water quality. Two major studies [6,7] from 2015 contain the most recent European revision of tap water quality. The samples were all taken in 2009 in 30 European countries, including most EU member states (except Belgium; Denmark, Ireland, Malta, Netherlands and Romania) but also from other European countries. Germany accounted for about 30% of the total number of samples. The second largest sample size (about 9%) originated from Greece. Some other countries are therefore underrepresented in the studies. In total, 579 tap water samples were analysed for more than 60 parameters. Within the Metrowamet project, four project partners (PTB, CMI, DVGW/TZW, RISE) have set up infrastructure to test commercially available domestic water meters for different water qualities. The investigations covered a total of around 200 Q 3 2.5 (DN 15 and DN 20) domestic water meters of the five most common water meter types (single-jet, multi-jet, rotary piston, magnetic inductive and ultrasonic cold water meter) in Europe. In total, 160 cold water meter were studied with regard to pH value and water hardness. This paper includes the results for these studies at RISE in Sweden. Here, two representative types of water meters, each from one manufacturer were chosen for the investigations. The first type is a Q 3 2.5 DN 20 mechanical water meter (multi-jet water meter) and the other type is a Q 3 2.5 DN 15 electronic water meter (ultrasonic water meter). Both meter types are very common and are often used as domestic cold water meters all over Europe and particularly in Sweden.

2. Background

2.1. Cold Water Meters

In Germany ( 83.0 million inhabitants), water consumption is measured by more than 45 million water meters [8] and it is not unusual to measure the individual consumption with a smaller water meter ( Q 3 2.5 ) at flat level. The MID does not make any specifications regarding calibration periods. This means that the calibration duration is regulated nationally in the respective countries. In Germany, the calibration interval for cold water meters is generally 6 years. In Sweden (10.3 million inhabitants) the situation is different. Only 1.6 million meters [9] are currently in use. In Sweden it is nowadays uncommon to measure water consumption at the individual flat level. A larger water meter ( Q 3 4.0 ) is usually installed in a single-family house or apartment building. The calibration interval is depending on the meter sizes according to STAFS 2007:2 [10]. Cold water meters with a permanent flow rate ( Q 3 ) of not more than 4 m 3   h −1 have a maximum calibration interval of 10 years and cold water meters with a permanent flow rate of above 4 m 3   h −1 of 5 years. For this reason it can be observed that, in Sweden Q 3 4.0 , cold water meters are also installed in larger residential buildings in, for example, three to four parallel pipelines instead of one larger water meter. This has the advantage that a change of a water meter can be carried out without any service interruption. Another advantage is that the calibration period for these meters is 10 years instead of 5 years when using larger water meters. The situation may change in Sweden due to the implementation of the EU’s Energy efficiency Directive (EED) 2012/27/EU Individual Metering and Billing (in Swedish: “Individuell mätning och debitering”, IMD) [11] means that measurements should be performed at individual (flat) level where it is economically justifiable. It has started with domestic hot water meters but domestic cold water meters could follow. Flat water meters are used to distribute the consumption measured by the house water meter and to distribute the water charges to the individual residential units. Table 2 serves as a guideline [12] in Germany for the meter size depending on the number of flats in a building.

2.2. Water Quality Parameter: pH Value

By definition, the pH value is the negative common logarithm of the hydrogen ion (H+) activity. In dilute solutions, the hydrogen ion activity is approximately equal to the hydrogen ion concentration and hence a measure of whether the liquid is acidic or alkaline. The pH scale (derived from the ionisation constant of water) ranges from 0 (very acid) to 14 (very alkaline). The natural pH range in freshwaters is from about 4.5 for acidic, peaty high mountain waters to over 10.0 in waters with strong photosynthetic activity by algae.

2.2.1. Low pH Value

Acidic water (pH value below 7.0 ) is usually due to the general acidification in air, soil and water. The pH value shows the balance between the acidic and alkaline properties of the water, where acidic and aggressive water means that the pH value is low. It is not considered harmful to drink an acidic water. A water with a low pH value can cause corrosion damage to the pipe and water system, which in turn causes metals, for example, copper, to precipitate from the pipes or the ground into the drinking water. Acidic water can corrode pipes and water heaters through corrosion, which can cause water damage to the property and be devastatingly expensive to repair and replace. Metals from the pipes are precipitated into the drinking water through this corrosion, which can in turn make the water unhealthy to drink and use. Precipitated copper can cause diarrhoea in small and sensitive children, but also cause itching of the skin during showering.

2.2.2. High pH Value

A pH value that is too high can be hazardous to health. If the water has a high pH value (pH value above 10.5 ), there is a risk of damage to the mucous membranes and eyes.

2.3. Water Quality Parameter: Hardness

Total hardness is the sum of all dissolved ions of alkaline earth metals in the water. Drinking water mainly contains the alkaline earth metals calcium and magnesium and, rarely, traces of barium and strontium. The total water hardness can be divided into carbonate and non-carbonate hardness. The dissolved alkaline earth metals bound to carbonate or hydrogen carbonate ions are classified as carbonate hardness (temporary hardness). Non carbonate hardness comprises the dissolved alkaline earth metals bound to other ions such as sulfates or chlorides.

2.3.1. Low Hardness (Soft Water)

Inadequate calcium intake is associated with an increased risk of osteoporosis, nephrolithiasis (kidney stones), colorectal cancer, hypertension and stroke, coronary heart disease, insulin resistance and obesity [13]. Inadequate magnesium intake is associated with hypertension, coronary heart disease, type 2 diabetes mellitus and metabolic syndrome. Magnesium deficiency is associated with the development of hypertension [14]. Calcium and magnesium intake is positively associated with bone mass density. Calcium or magnesium deficiency in drinking water appears to cause lower bone mass density (osteoporosis) and thus leads to a higher incidence of bone fractures [15]. Soft water is usually not a problem. However, the taste of soft water is typically rather smooth or even flat. Soft water not only does not contain minerals, but the softening process can make the water taste a little salty because potassium or sodium ions are used to remove magnesium and calcium. Soft water has a strong tendency to corrode metal surfaces and pipes, leading to the presence of certain heavy metals such as cadmium, copper, lead and zinc in drinking water. Corrosion can be associated with health risks (from leachate such as lead, copper and other metals) reduced lifespan of the distribution network and appliances (e.g., water heaters) that use the water. Soft or softened water has the advantage that it hardly calcifies and therefore enables more efficient heat transfer in heat exchangers and probably a longer service life of hot water heaters.

2.3.2. High Hardness (Hard Water)

In general, an excess intake of calcium is not a problem. If more calcium is taken in than is necessary, the excess is simply excreted by the kidneys in healthy people. Increased intake of magnesium may cause a temporary change in bowel habits (diarrhoea), but rarely leads to hypermagnesemia for people with normal kidney function. As hard water is full of minerals, and minerals improve the taste of water, hard water tastes better to most people than soft water. A disadvantage with hard water is that increased soap consumption is needed. Hard water can therefore lead to metal or soap salt residues on the skin or clothing, which can cause contact irritation. Depending on interactions with other factors, such as pH and alkalinity, hard water can cause limescale deposits in the water distribution system. In hot water applications, insoluble metal carbonates can be formed, coating the surfaces and reducing the efficiency of heat exchangers. Excessively hard water can also lead to corrosion.

3. Boundary Conditions and Procedure

3.1. Accelerated Wear Test

To investigate the effect of different pH values and hardness levels on the measurement accuracy of domestic water meters, an accelerated wear test (stress test) was developed. The idea was that this test should be relatively simple, that is, reproducible by everyone, but still as realistic as possible. This means, for example, it should be ensured that the accelerated wear test can be carried out in a time frame suitable for practical application.

3.2. Water Meter Calibration—Before and after

The water meters are measured before and after the stress tests. For this reason, the water meters are tested according to ISO 4064 [16] and OIML R 49 [17] at a minimum of six flow rates at water temperature of 20 ± 5   C and line pressure (downstream the last DUT) in a range of 0.3 bar to 10 bar. The purpose is to compare the measurement deviation of the meters before and after the accelerated wear tests. The aim is to verify whether the water meters after the stress test also comply with the MPE when placing the water meter on the market, or at least with the so-called MPE in service, which is double the aforementioned MPE.

3.3. Test Conditions of the Accelerated Wear Test

In the PTB study [18], it was found that the average consumption for a Q n 1.5 ( Q 3 2.5 ) domestic water meter was 31.5   m 3 per year for cold water and 14.0   m 3 per year for hot water. These numbers correspond quite well with the Techem report [19], which indicates a consumption of 579.79   L m −2 and year for cold water and 233.08   L   m −2 and year for hot water. With the stated average unit size (flat size) of 68.65   m 2 this results in 36.8   m 3 per year for cold water and 16.0   m 3 per year for warm water for an average flat size. Taking into account a legal calibration period of 6 years for cold water meters, this results in a test quantity of around 200 m 3 from installation to removal or re-calibration, the value chosen for the accelerated wear tests. As a side note, the Techem report makes no statement on how many cold water meters were installed per flat unit. It can be assumed that the total quantities stated were statistically measured with more than one cold water meter per residential household. The value of 200 m 3 specified for the long-term experiments is therefore a conservative value.

3.3.1. Water Temperature

The supply water temperature is different in many regions and can also fluctuate over the season. It is, for example not unusual that the water temperature in Northern Europe is below 10 C and even lower, especially in the cold seasons. For hygienic reasons, it is intended to keep the water temperature below 20 C in all regions, even if this is not always the case. The partners have agreed on a representative average water temperature between 14 C to 16 C for the experiments.

3.3.2. Flow Rate and Pressure

Long-term studies have shown that most flow events occur in a range of 0 L   h −1 to 1260 L   h −1 (0 L   s −1 to 0.35 L   s −1). A flow rate of this magnitude was discussed for the experiments. Finally, with regard to a practical duration of the experiments, a flow rate in the range from 750 L   h −1 to 800 L   h −1 was set for the accelerated wear tests. Concerning the line pressure it was decided to specify a pressure range from 0.03 M Pa to 1 M Pa (0.3 bar to 10 bar) according to ISO 4064.

4. Test Water Preparation

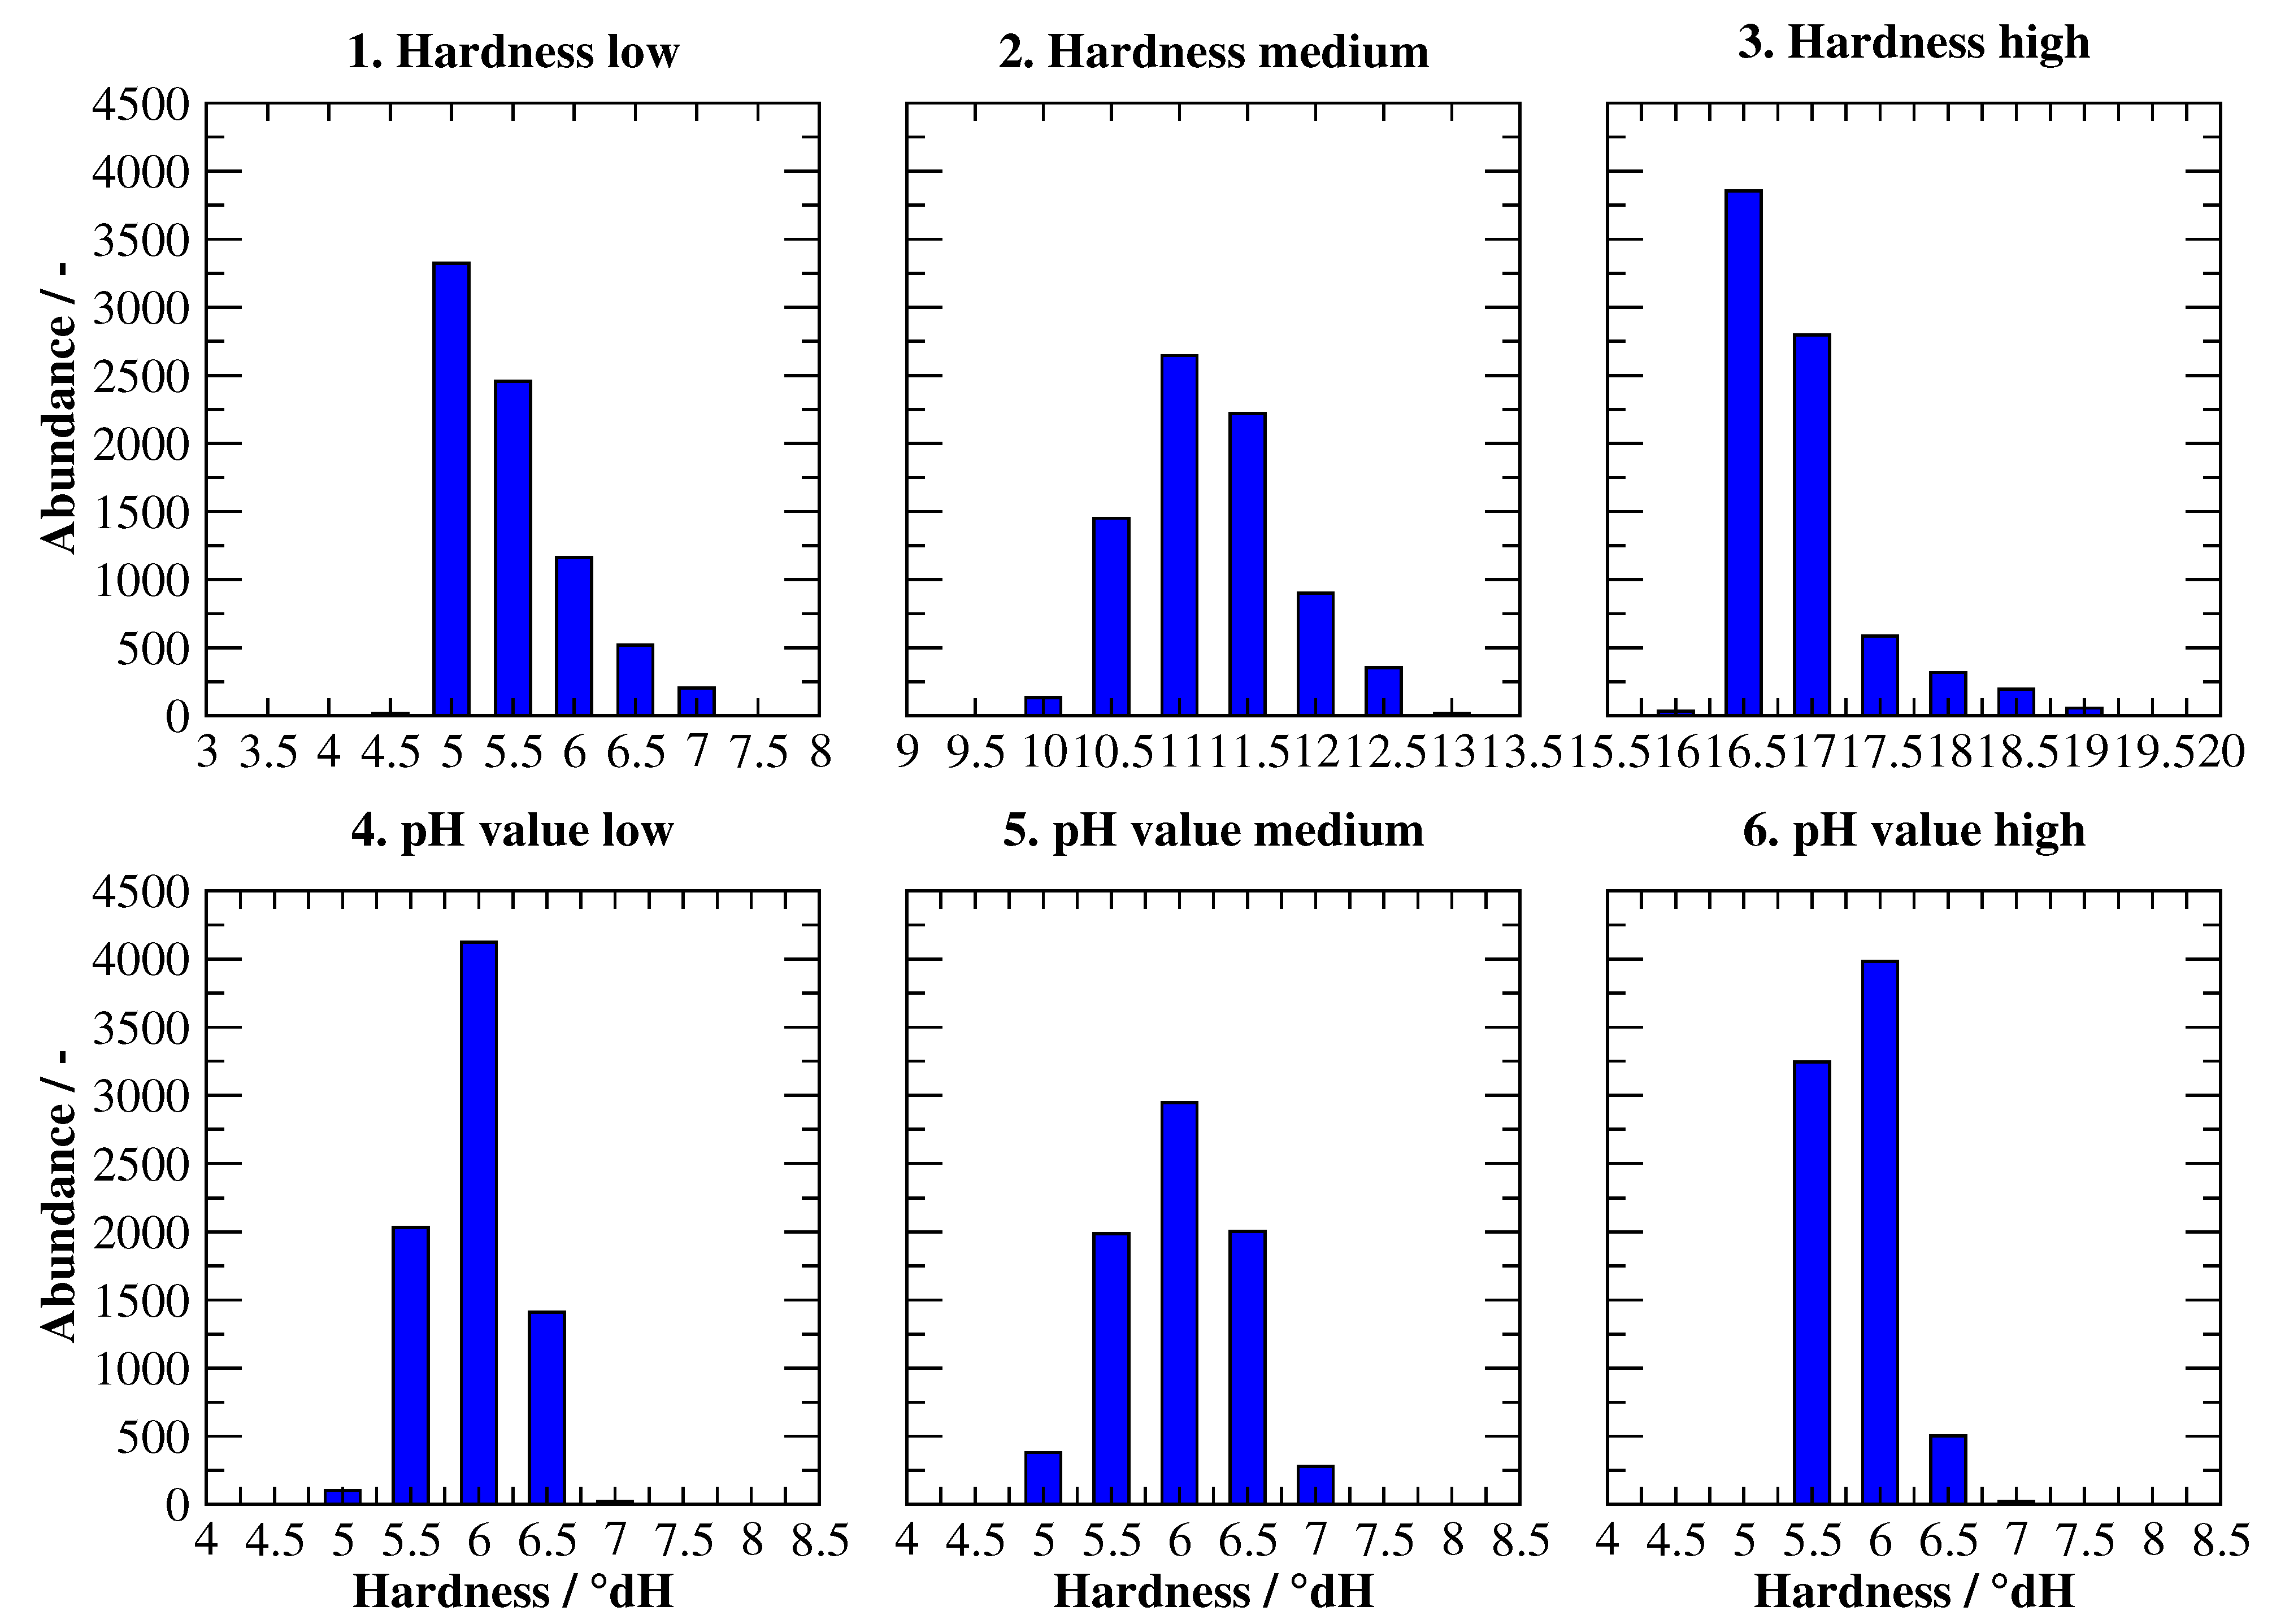
4.1. pH Value Experiments

According to European regulations [4], drinking water should have a pH value of between 6.5 and 9.5 . From this specification, the following pH values were determined for the experiments:
  • pH value low: pH 6.5 ;
  • pH value medium: pH 7.7 ;
  • pH value high: pH 9.5 .
As can be seen, both extreme values were selected for the experiments. The third value (pH value medium) is the median pH value in Europe, as reported in the study by Banks [6].

4.2. Hardness Experiments

According to the German Washing and Cleaning Agents Act (Act on environmental compatibility of detergents and cleaning products, WRMG) [20], water supply companies must inform consumers of the hardness range of the drinking water distributed by them at least once a year. In paragraph § 9 of the WRMG, the hardness ranges are defined as follows:
  • Hardness low (soft water): less than 1.5 mmol L −1 calcium carbonate;
  • Hardness medium: 1.5 mmol L −1 to 2.5 mmol L −1 calcium carbonate;
  • Hardness high (hard water): more than 2.5 mmol L −1 calcium carbonate.
The three hardness ranges are based on European law. Based on this statement, the following three degrees of hardness were agreed between the project partners for the experiments:
  • Hardness low: 1 mmol L −1 calcium carbonate ( 5.6   dH );
  • Hardness medium: 2 mmol L −1 calcium carbonate ( 11.2   dH );
  • Hardness high: 3 mmol L −1 calcium carbonate ( 16.8   dH ).

4.3. Chemicals

A total of six different chemicals are required to produce the different test waters, Table 3. The initial point for each experiment is a so-called base model water (MW) to which additional chemicals are added for the various experiments. All chemicals were purchased from Merck/Sigma-Aldrich, Stockholm, Sweden.

4.4. Base Model Water (MW)

To ensure comparability between experiments and partners it was decided to start from a base model water (MW). The base MW, that is, the dosage of CaCl2, MgSO4 and NaHCO3 is essentially extracted from a former DVGW/TZW project [21]. The model water (MW-1) described there is based on a common water chemistry recipe. The difference to the MW specified in the report is that KBr and NaNO3 are not added in order to keep the base MW as simple as possible. To summarize, this water consists only of hardeners and a substance to ensure the stability of the pH value. The MW has a total hardness of 1 mmol L −1 (sum of Ca2+ and Mg2+ concentration) and a pH value of about 8.4 . The components of the MW are calcium chloride dihydrate (CaCl2 × 2 H2O), magnesium sulphate heptahydrate (MgSO4 × 7 H2O) and sodium bicarbonate (NaHCO3). The basic components into which the chemicals are dissolved is highly purified water (HPW). HPW water that has a hardness and electrical conductivity close to zero. Since HPW has to be produced in large quantities for the experiments, it was decided that the conductivity must be at least below 15 μ S cm−1. The stability of the MW was investigated in preliminary tests at a temperature of 25 C at TZW. The MW showed an adequate stability with a pH value corresponding to the theoretical value of around 8.4 , a total hardness of 1 mmol L −1, an average conductivity of 392 μ S cm−1 and a value of turbidity close to the limit of quantification (approx. 0.05   F N U ). To ensure the stability of the MW it is strongly recommended to keep the contact area between water and ambient atmosphere to a minimum.

4.5. Highly Purified Water (HPW)

At RISE, there were two options to get the water for the experiments. On the one hand, with the aid of the laboratory apparatus Barnstead EASYpure UV. The compact ultrapure water system EASYpure UV is a line-fed water purification system. The major advantage is that the water produced by this system exceeds the definitions of HPW according to ASTM D1193-6 (type I water) [22] and ISO 3696 [23]. The measured pH value (measured directly after sampling) is below 6.0 , the hardness is 0.00 and the conductivity is below 0.1   μ S cm−1. The big disadvantage, however, is that this system can only deliver small quantities (flow rates below 1 L   min −1) and hence cannot be used. The other possibility is the RISE in-house purified water supply. RISE has its own water treatment system with tapping points in almost every laboratory. This system is mainly meant to provide water for the chemistry department. The measured pH value directly on the tap is around 6.4 , the hardness is 0.01   dH and the conductivity is 3 μ S cm−1. The big advantage is that this line can deliver relatively large quantities (flow rates greater than 15 L   min −1) and is therefore very practical. This system can provide the large amounts of water needed for the experiments in a relatively short time. After filling the storage tank by means of the RISE in-house purified water supply, the following values were measured (Section 5), pH value: around 6.4 , hardness: 0.03   dH and conductivity: from 6 μ S cm−1 to 8 μ S cm−1. This water is the starting point for the production of the base MW.

4.6. Test Waters

For each of the three components, a separate stock solution (SL) was prepared in HPW. The SL had the concentrations indicated in the Table 2, Table 3, Table 4, Table 5, Table 6, Table 7, Table 8 and Table 9.

5. Measurement Set-Up

5.1. Calibration Facility

The water meters were calibrated before and after the wear test campaign using one of the primary standard (national standard) water flow calibration facilities at RISE. A comprehensive description of the operating principle of the calibration facility VM7 (Vattenmätbänk no. 7) can be found in [24]. The most important specifications are summarised in Table 10. All water meters were calibrated with five repeated measurements per flow point by means of the respective high-resolution pulse outputs.

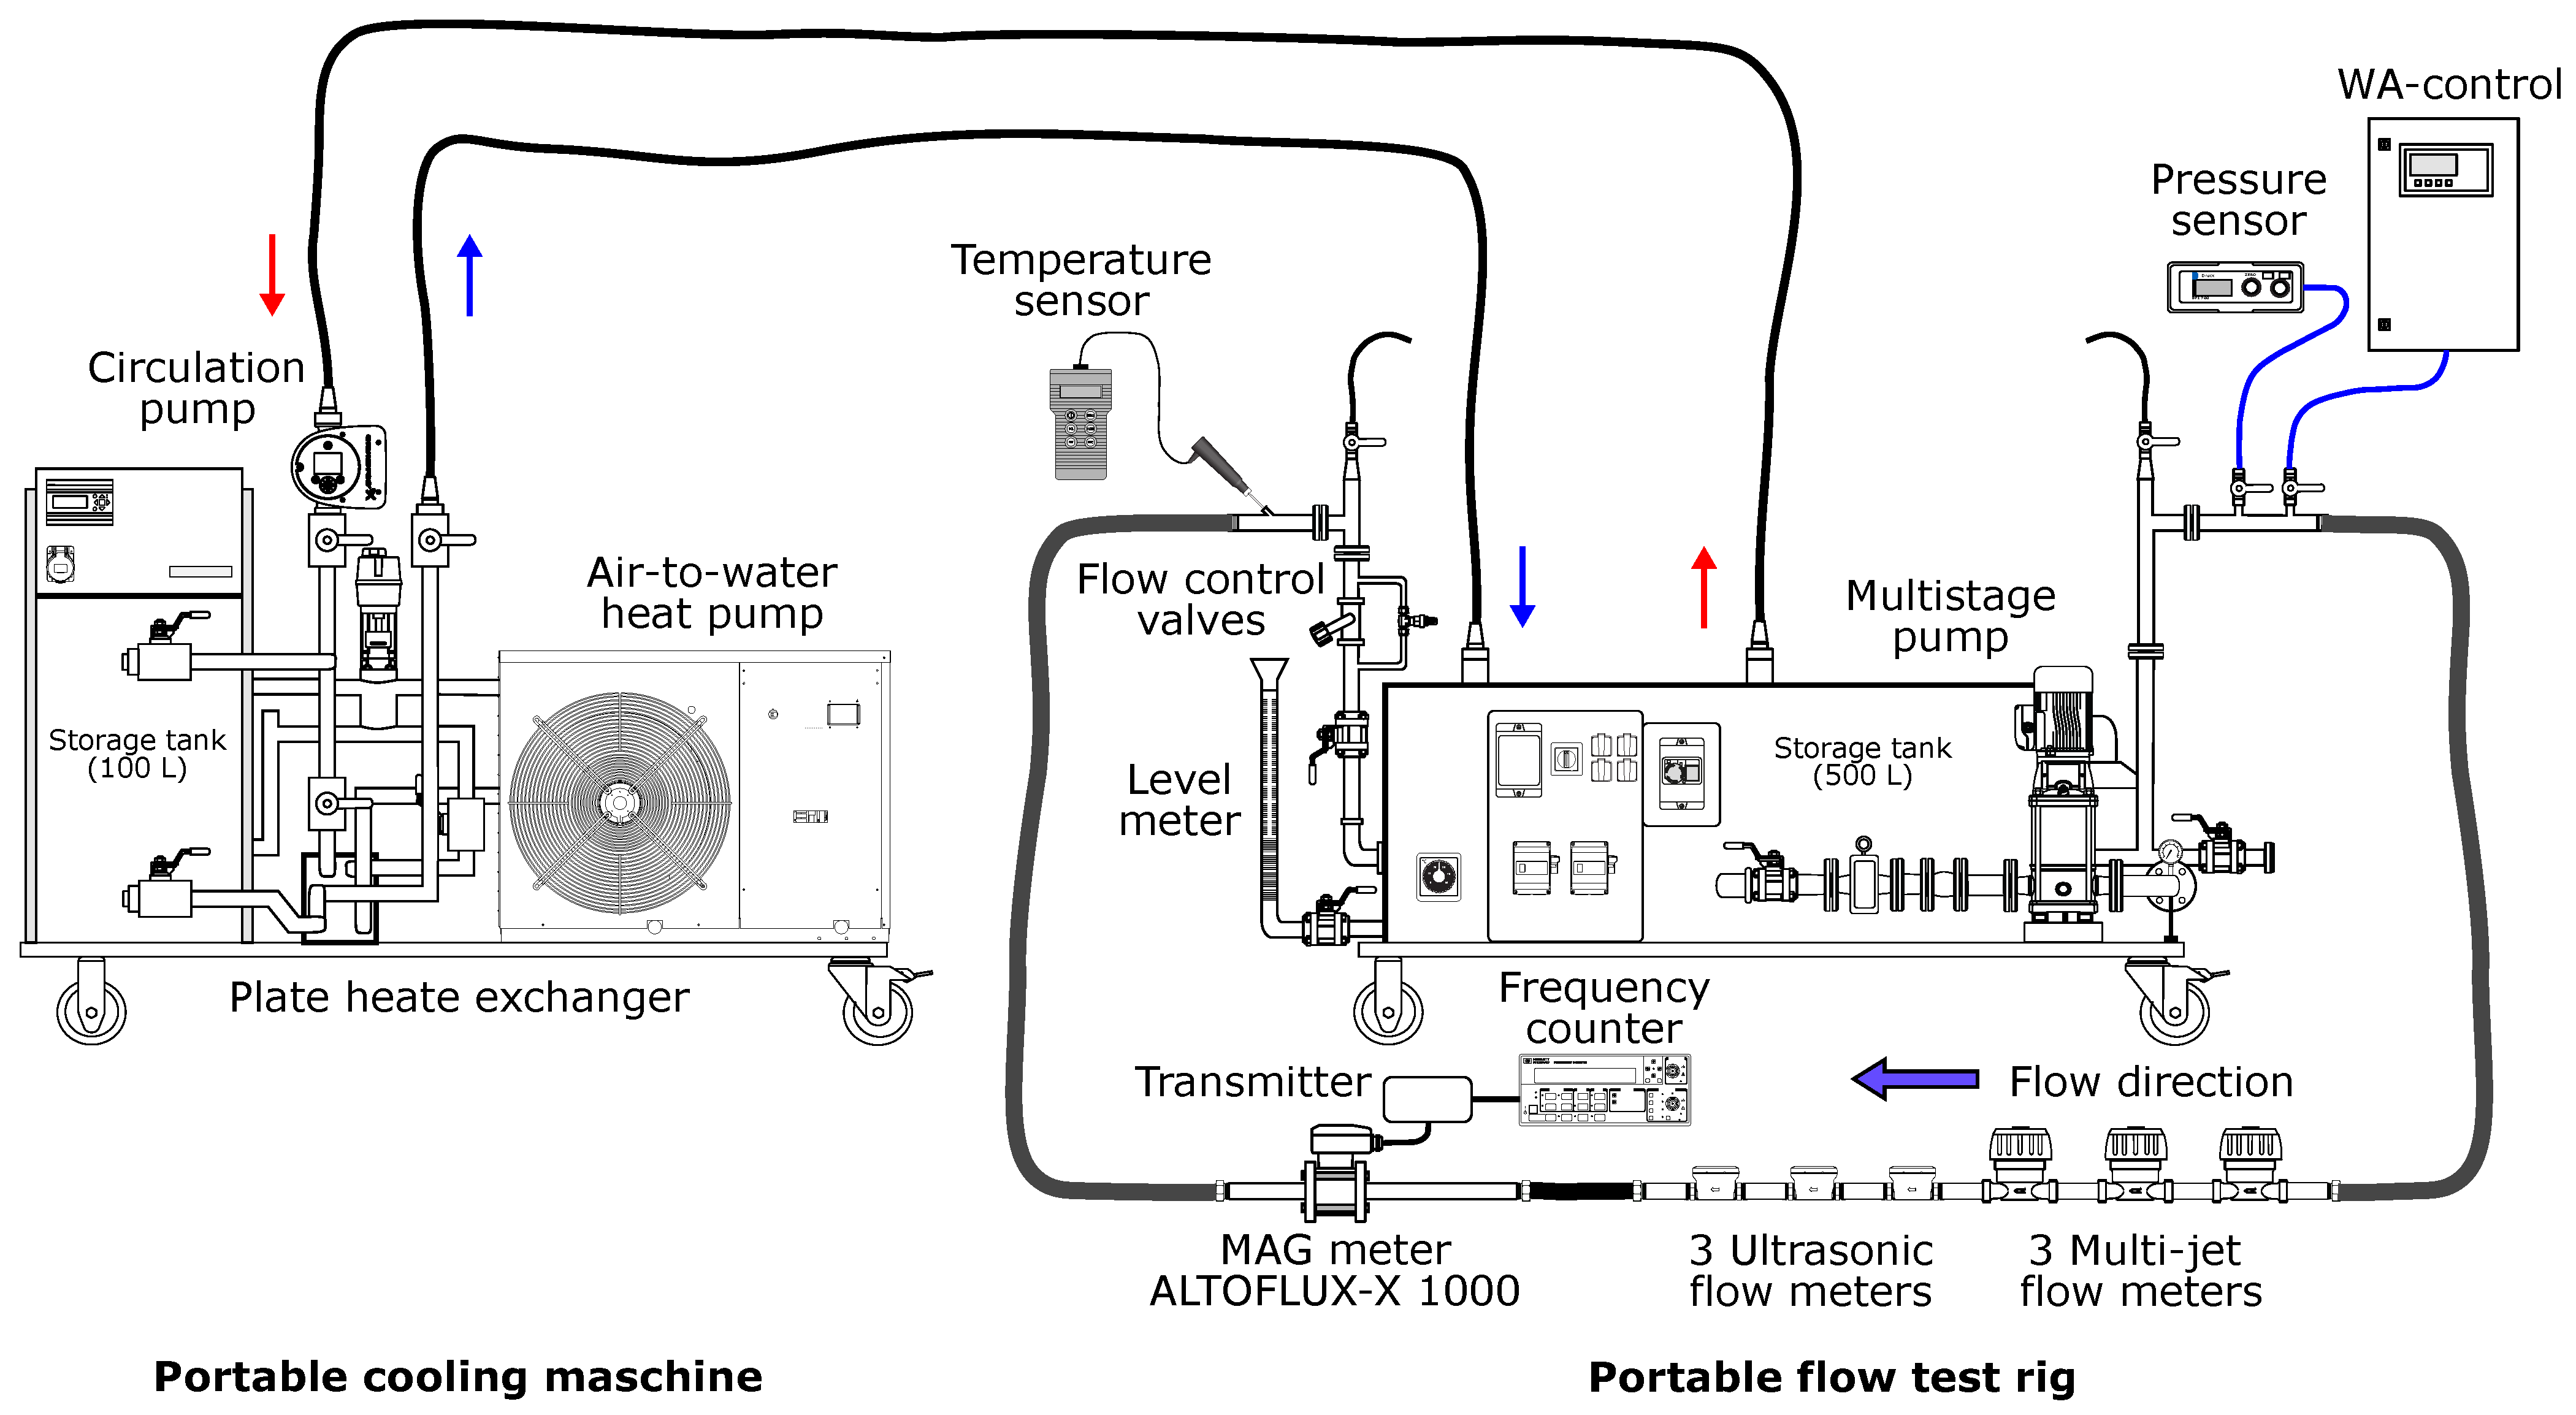
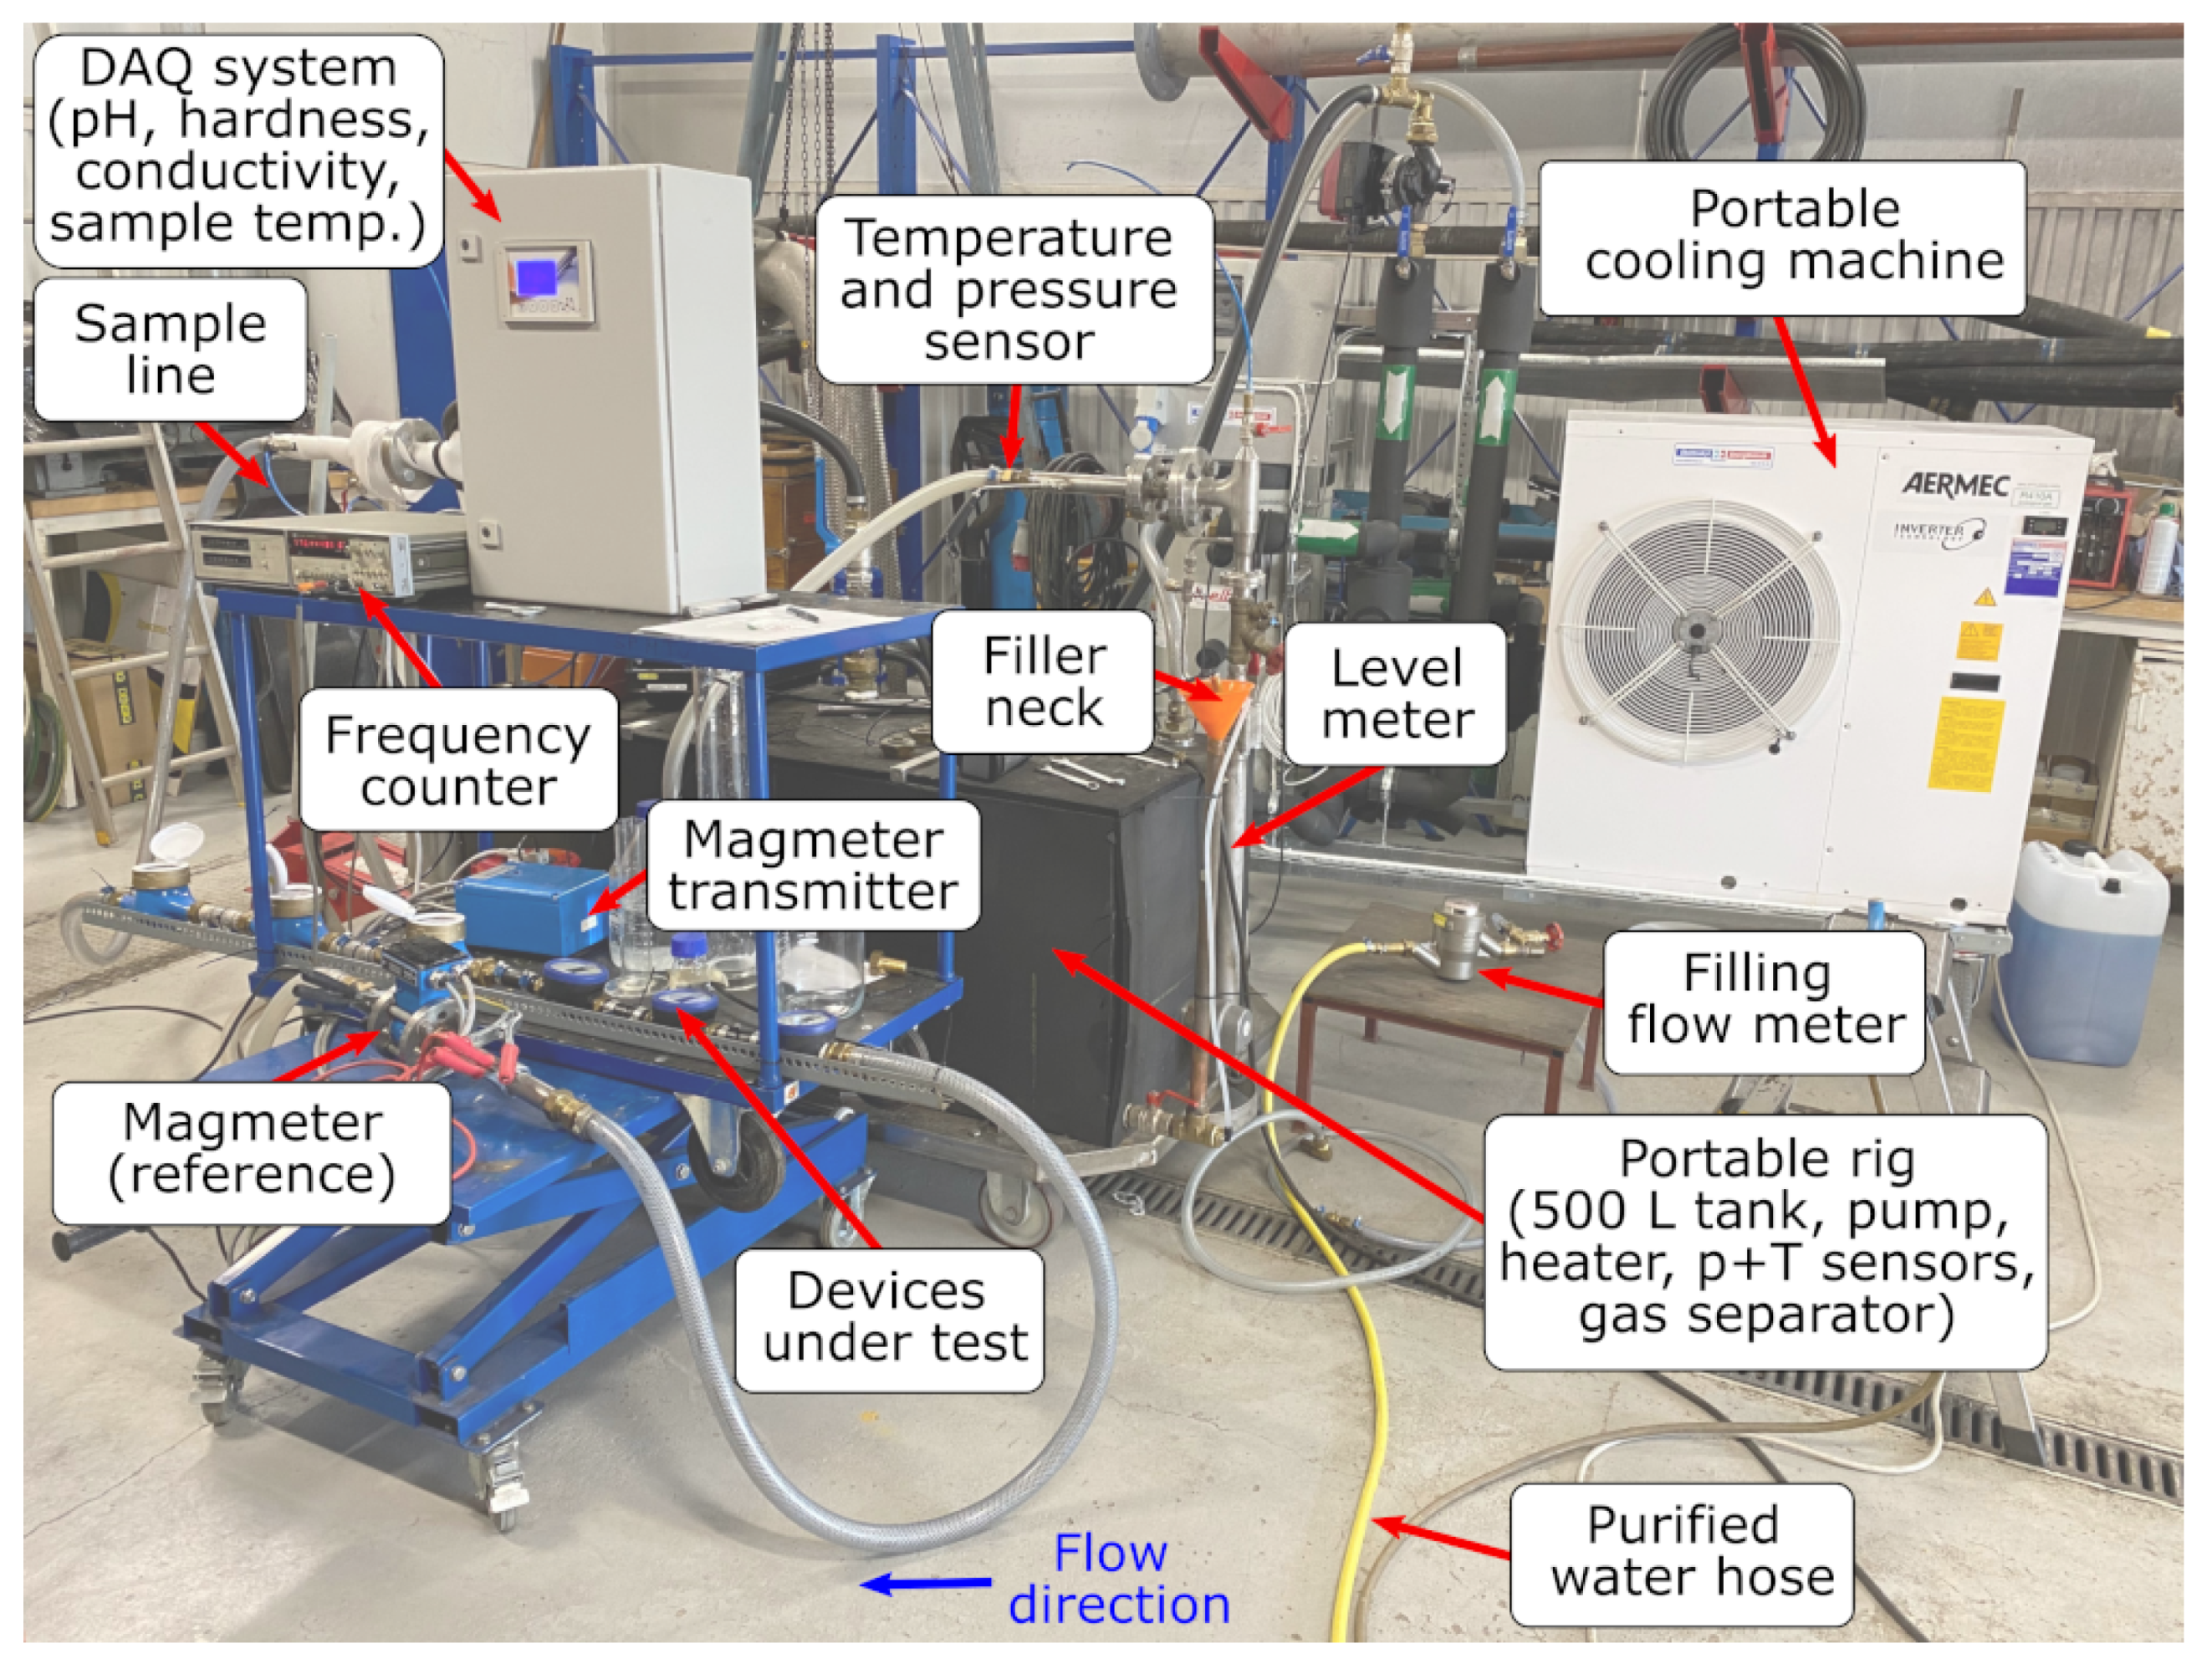
5.2. Accelerated Wear Test facility

The test facility at RISE mainly consists of a portable flow test rig usually used for EMC testing of flow meters in a temperature range from 20 C to 50 C , Figure 1. The portable EMC rig has a size of 2100   mm × 1000   mm × 1400   mm (L × B × H) and provides a 500 L storage tank, a DN 40 vertical multistage electric pump (Lowara) with a maximum flow rate of 170 L   min −1, a water filter (Alfons Haar), compression couplings, an air separator (self-built), pressure and temperature sensors and a heating unit. The entire measuring set-up is built on a three-wheel cart. This makes it possible to use the test setup in a very flexible way.
In order to carry out the experiments in the specified water temperature range between 14 C and 16 C a mobile cooling system with the dimensions 2500   mm × 700   mm × 1700   mm (L × B × H) was used, Figure 1. The cooling system consists of an air-to-water heat pump (up to 5.2   k W cooling effect) with built-in inverter-controlled circulation pump, a 100 L storage tank, expansion vessel, a circulation pump (Grundfos Magna3) and plate heat exchanger. The inlet and the outlet of the portable cooling machine are connected to the storage tank. In this manner the water temperature inside the storage tank is controlled and kept constant.
To prepare the desired test water, the tank is initially filled with about 400 L of water directly from RISE own purified water supply, mainly utilised by the chemistry department. The filling quantity of the water is measured by means of an extra flow meter (filling flow meter, Figure 2) and additionally controlled by using a level meter. Then a certain amount of water is taken out of the reservoir (storage tank) to produce the base or test water according to the preparation prescription provided by DVGW/TZW.

5.2.1. Operating Principle

From the insulated storage tank, the water passes the pump. At each test, three multi-jet flow meters and three ultrasonic flow meters are investigated. The water meters were installed with 3/4 and 1 standard connections and hoses respectively. The distance between the individual water meters is approximately 5 D. The in total 6 devices under test (DUT) are installed in a by-pass line. That means the pump is set to a much higher flow rate and most of the water is pumped back into the storage tank. This arrangement guarantees a good mixing of water and chemicals and a homogeneous temperature distribution. The flow rate (750 L   h −1 to 800 L   h −1) is adjusted by the flow control valves and indicated by a reference flow meter (Krohne Altoflux-X 1000 DN 25, Krohne Messtechnik GmbH, Duisburg, Germany) located downstream of the DUTs. The transmitter of the reference meter is connected to a frequency counter (HP 5315B universal counter, Hewlett-Packard, Palo Alto, CA, USA) which is used to display the current flow rate updated every 30 s . As can be seen in Figure 1, at the beginning of the by-pass line (upstream the DUTs) there are two pipe junctions, one for the inline pressure sensor (Druck DPI 700, Baker Hughes, Houston, TX, USA) and one for the sample line. The sample line is directly connected to the WA-control (OFS Online Fluid Sensoric GmbH), an online measuring system for pH value, hardness, conductivity, and sampling temperature. Water samples of around 100 mL to 200 mL are measured periodically at intervals of 2 min . After the water analysis is performed, the sampled water is returned via the drain line and the filler neck to the storage tank. Shortly before the end of the actual measuring section (the by-pass line), that is, just before the water is returned to the storage tank, the water temperature is measured with the aid of a handheld temperature sensor (Comark C9011, Fluke, Everett, WA, USA).

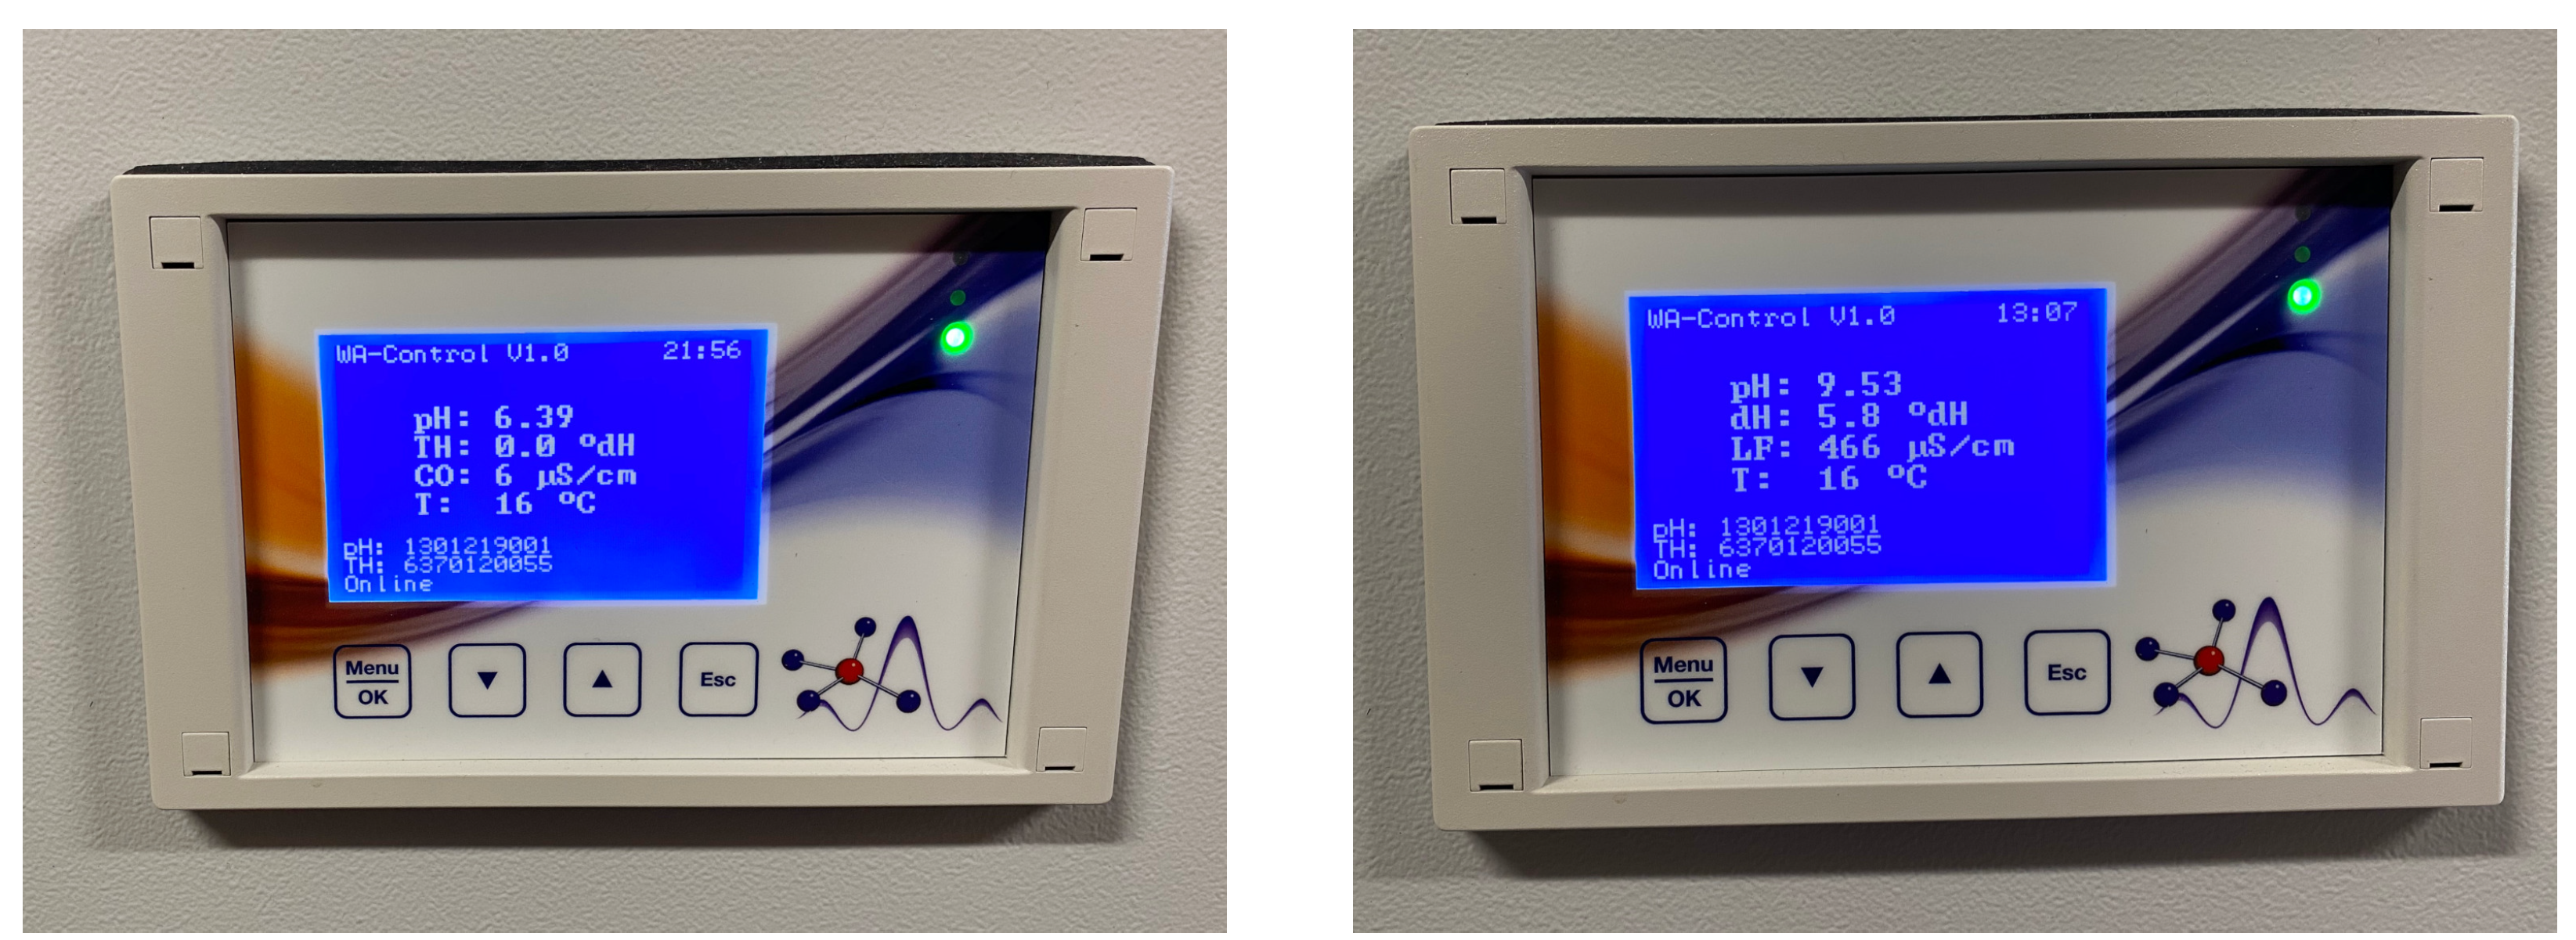
5.2.2. Acquired Measurement Data

The WA-control is an online measurement system for the cyclical monitoring of specified test water manufacture by OFS (Online Fluid Sensoric GmbH, Ronneburg, Germany). The WA-control (Figure 3) has the following specifications:
(a)
Temperature compensated pH value measurements in a range from 0 to 14; resolution: pH ± 0.01 ; accuracy: pH ± 0.02 ;
(b)
Temperature compensated water hardness measurements in a range from 0.1 dH to 40 dH ; resolution: 0.1   dH (optional: 0.01   dH ); accuracy: ±5%);
(c)
Temperature compensated conductivity measurements in a range from 0 μ S cm−1 to 2000 μ S cm−1; resolution: 1 μ S cm−1; accuracy: below ±1%.
(a)
pH Value Sensor
The pH of an aqueous sample is usually measured electrometrically using either a glass electrode in combination with a reference potential or a combination electrode. The measurement of the pH value is carried out with a pH sensor of type 130. Temperature has a significant effect on pH measurement as the electrodes used are temperature-dependent. This influence can be minimised by using devices with temperature compensation. For quality assurance, the pH sensor can be re-calibrated manually with external buffers (technical buffer solutions) and the determined pH value can be corrected manually afterwards. The pH sensor is factory calibrated and checked with five external buffer solutions at different pH values.
(b)
Hardness Sensor
An ion-sensitive hardness sensor (Ca/Mg selective) with polymer membrane of type 630 is used to measure water hardness. The measuring range is between 0.1   dH and 40 dH . The hardness sensor can be re-calibrated by means of buffer solutions and simple entering the actual value of the water hardness. The hardness sensor is factory calibrated.
(c)
Conductivity Sensor with in-Built Temperature Sensor
The conductivity sensor (JUMO conductivity electrode with integrated temperature sensor) is temperature compensated (25 C ) in the range from 0 μ S cm−1 to 2000 μ S cm−1. Analogous to the pH and hardness measurement, re-calibration can be performed by entering the manually measured actual value. Two conductive electrodes of defined area are immersed in the water at a certain distance from each other. They are then fed with an alternating voltage of a specific measuring frequency (depending on the measuring range) by the separate measuring transducer. Due to the conductive components (ions, salts) contained in the water, an alternating current is generated between the electrodes, via which the transmitter determines the conductivity, displays it, and converts it into a standard signal. The conductivity sensor is factory calibrated.

6. Measurement Results

Three multi-jet cold water meters (B meters GMB-I, Q 3 2.5 R = 160 ) and three ultrasonic cold water meters (Kamstrup Multical 21, Q 3 2.5 R = 100 ) were used for each test carried out at RISE. A total of 36 cold water meters were investigated during the experiments at RISE. This includes 18 multi-jet cold water meters in the following named with A01-A09 (pH value tests) and A10-A18 (hardness tests) and 18 ultrasonic cold water meters named with B01-B09 (pH value tests) and B10-B18 (hardness tests). The cold water meters were purchased anonymously from the manufacturers via a Swedish water supplier. For each test, a set of three flow meters of each type were calibrated in series before and after the accelerated wear tests.

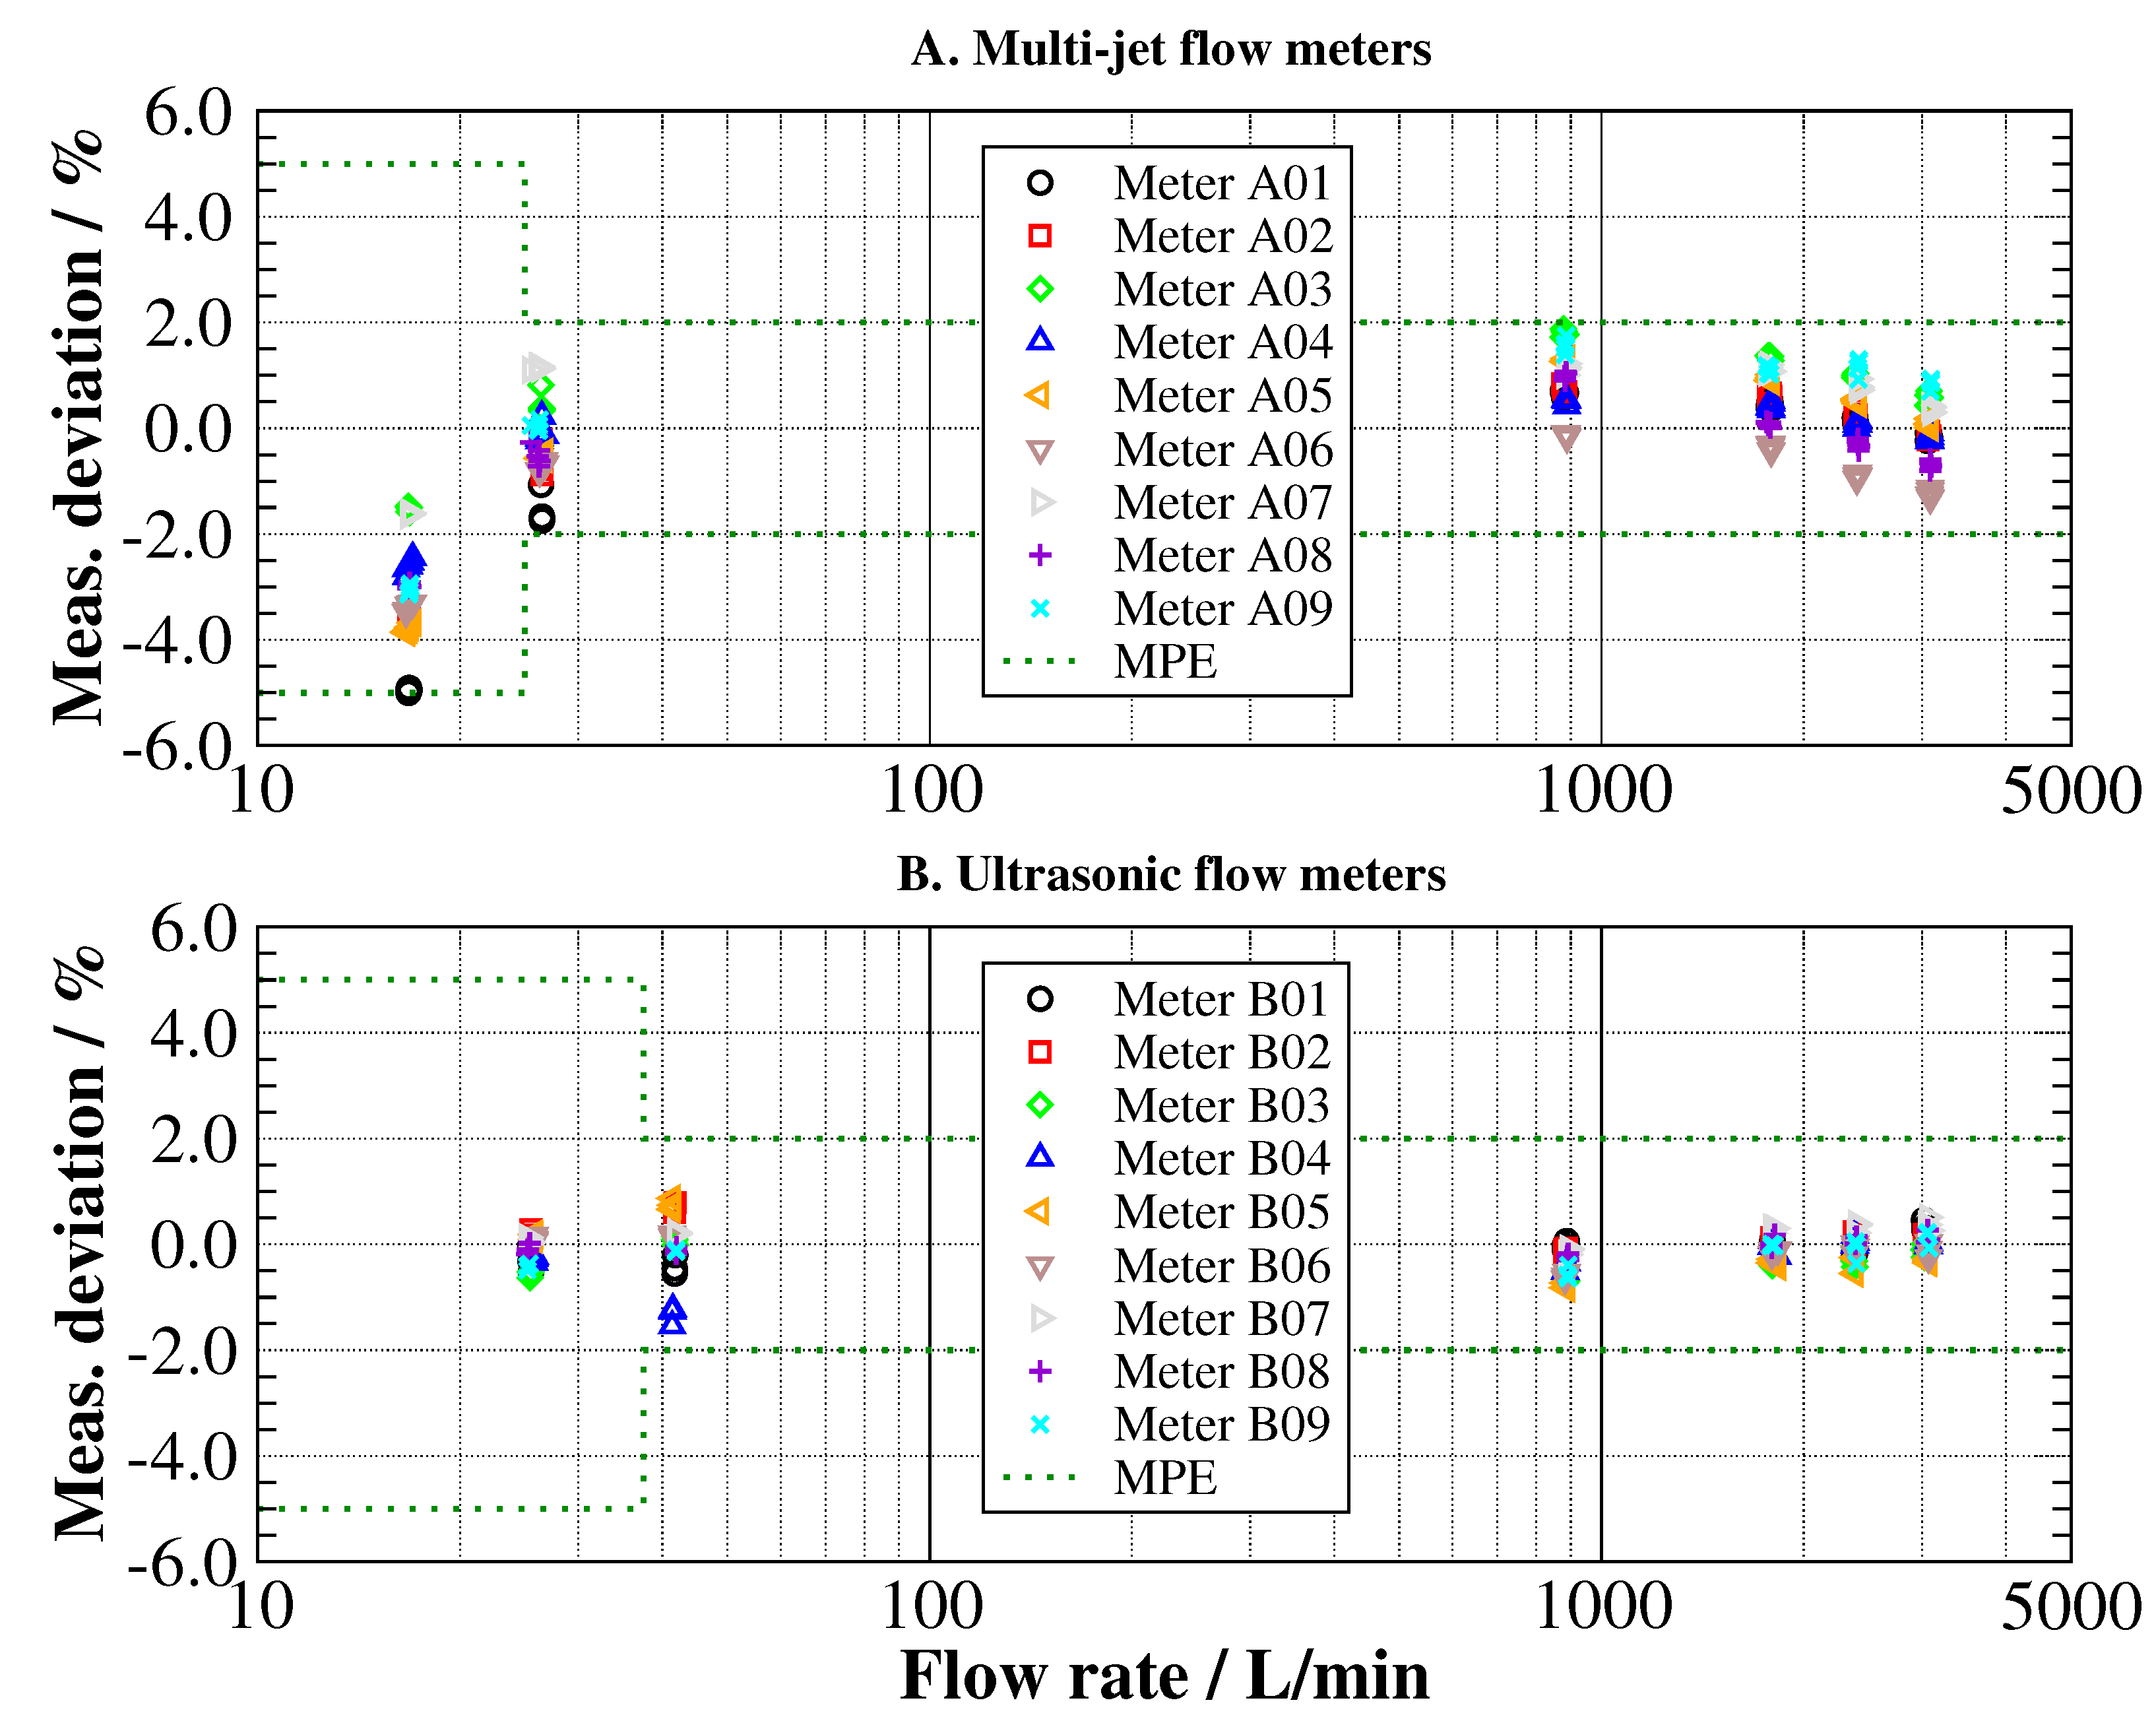
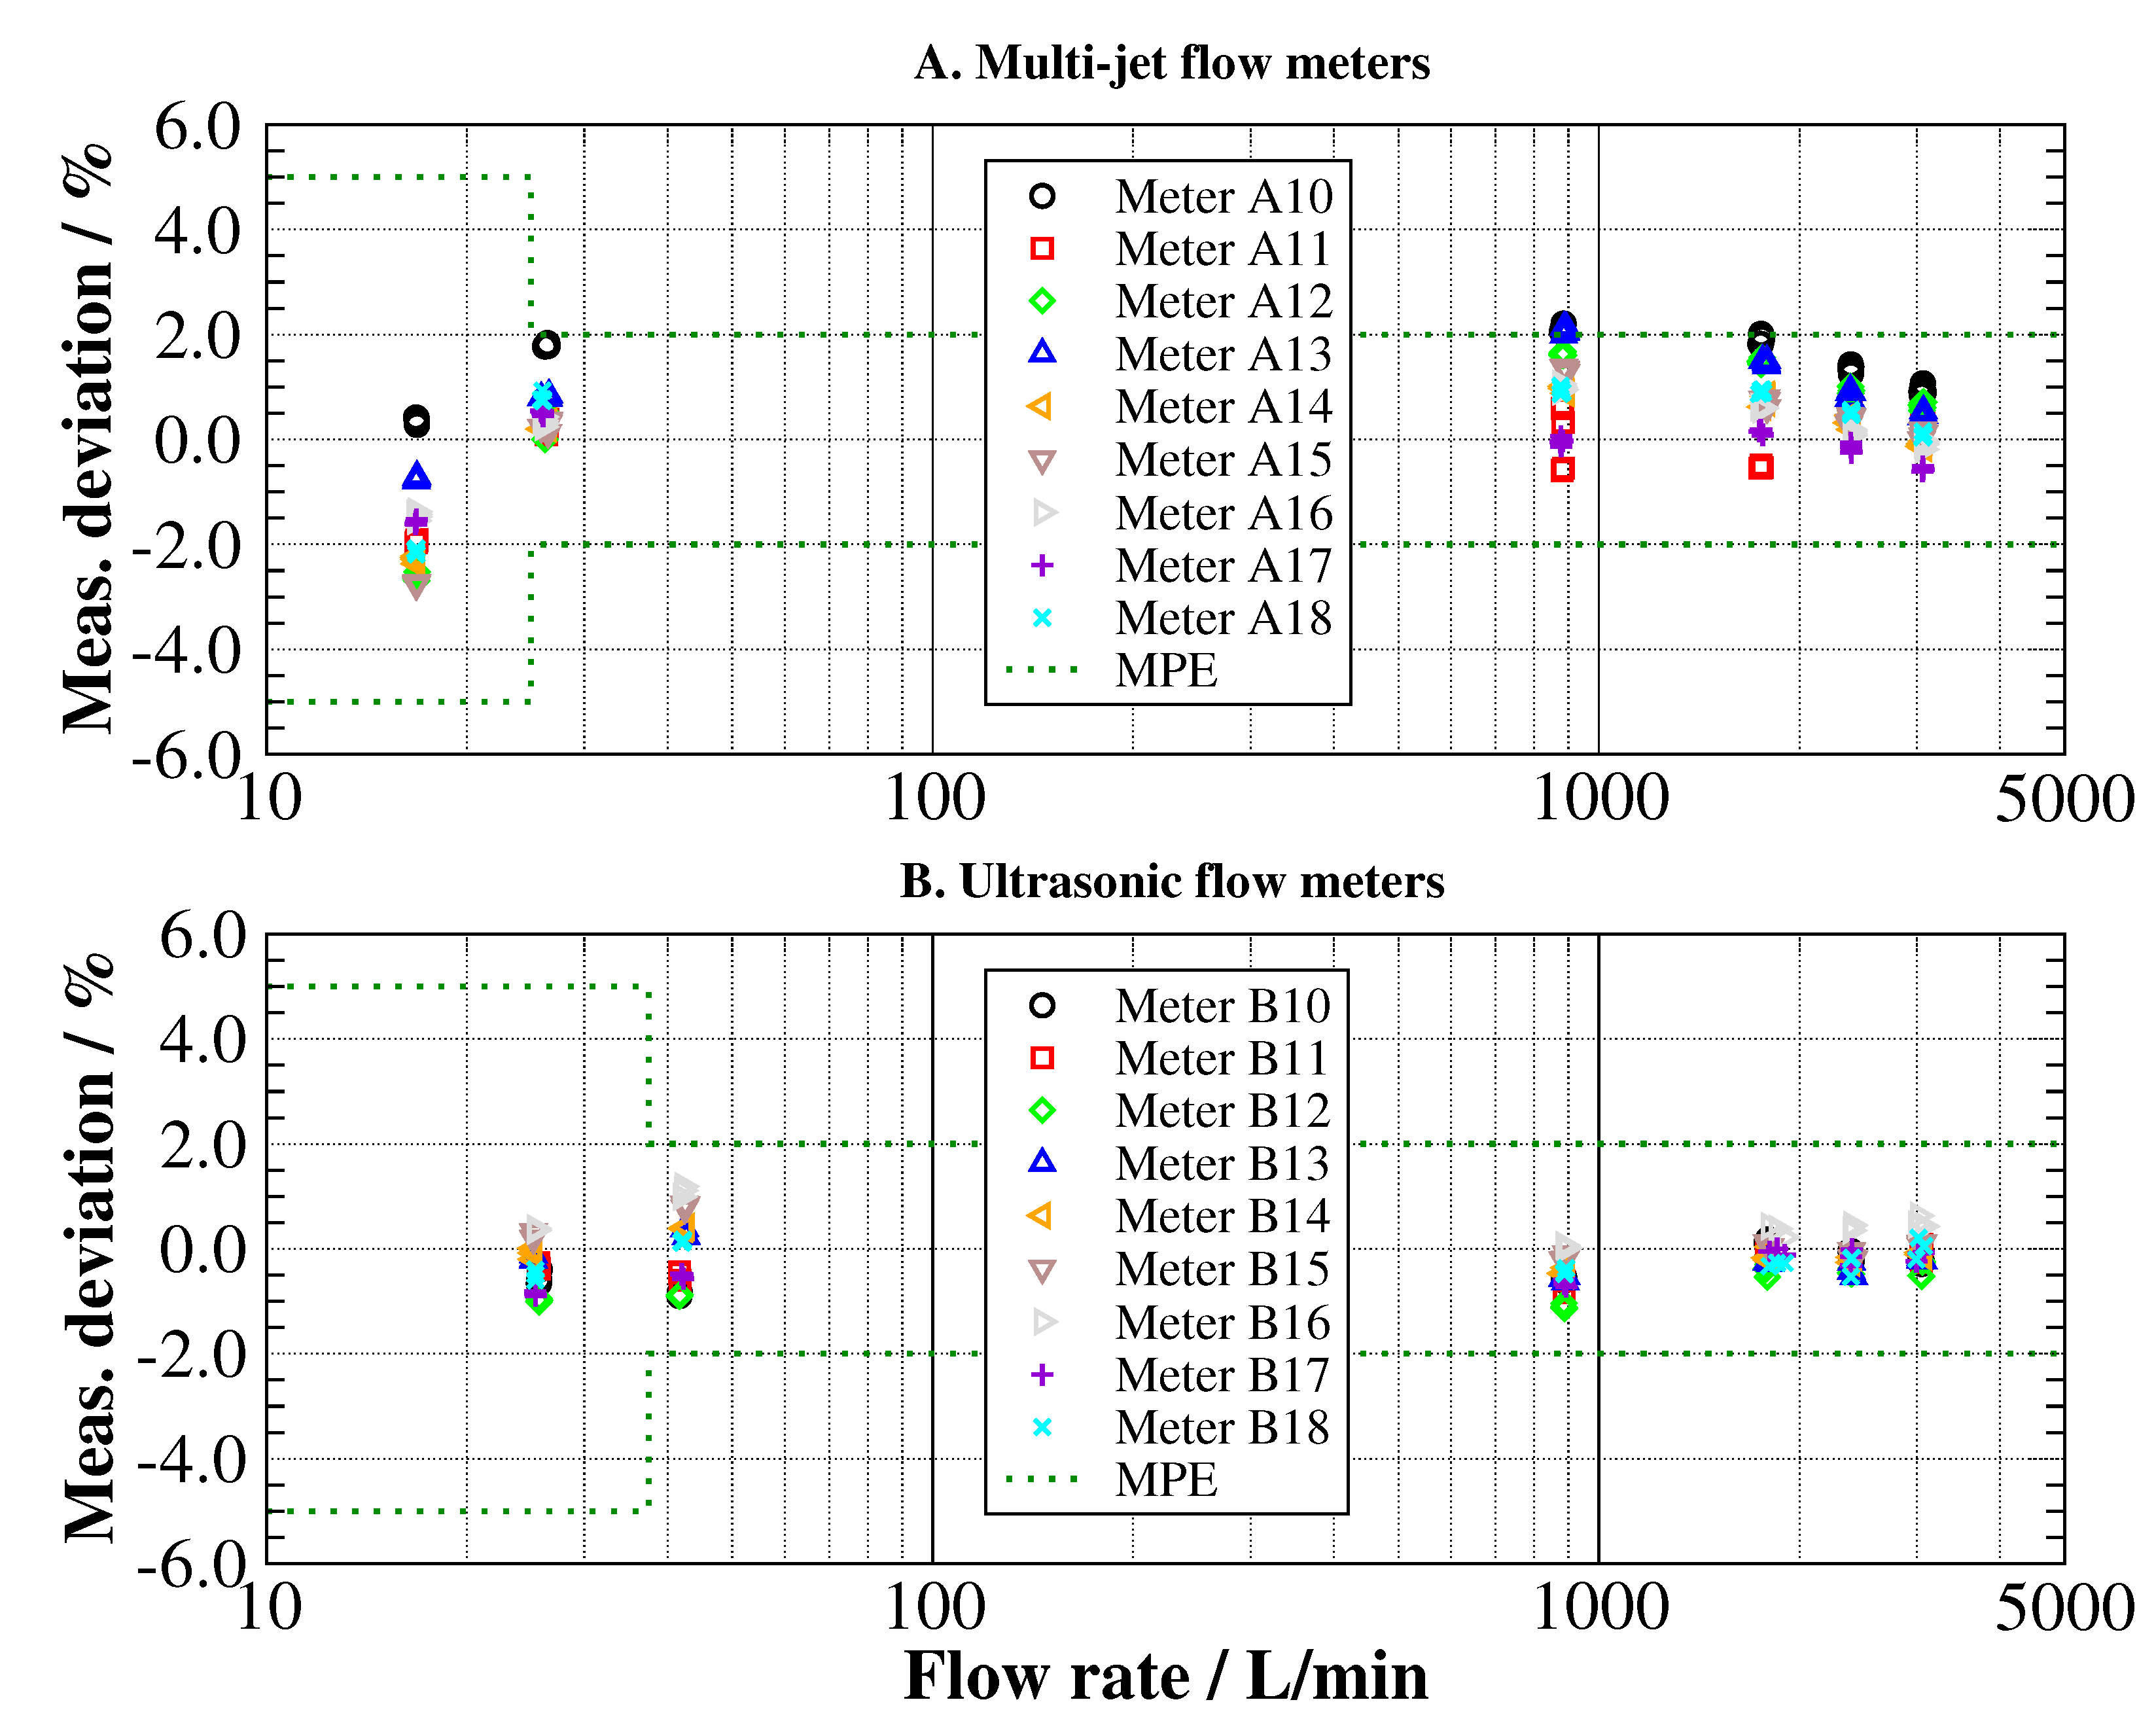
6.1. Calibration of the Water Meters before the Wear Test

Before the actual accelerated wear test, the cold water meters were calibrated at a temperature of 20 C at six different flow points with five repetitions. The flow points were selected according to ISO 4064-2:2014 [16] Section 7.4.4 and OIML R 49-2:2013 Section 7.4.4 [17] respectively:
  • Flow rate: Q 1 to 1.1 Q 1 ;
  • Flow rate: Q 2 to 1.1 Q 2 ;
  • Flow rate: 0.33 ( Q 2 + Q 3 ) to 0.37 ( Q 2 + Q 3 );
  • Flow rate: 0.67 ( Q 2 + Q 3 ) to 0.74 ( Q 2 + Q 3 );
  • Flow rate: 0.9 Q 3 to Q 3 ;
  • Flow rate: 0.95 Q 4 to Q 4 .
The volume pulses of the multi-jet cold water meters from B meters were read out by means of an optical contrast scanner (photoelectric direct reading sensor) Sick Sensick NT8. The nominal k-factor was 176.136   pulses / L . The volume pulses of the ultrasonic cold water meters from Kamstrup were read out by means of pulse interface with an optical reading head with associated holder and a connection unit for high-resolution pulse output. The nominal k-factor was 100 pulses / L .

6.1.1. Multi-Jet Cold Water Meters (B Meters)

By applying the acceptance criteria for accuracy measurements during market surveillance (including the measurement uncertainty of the test equipment) according to WELMEC guide 13.1 [25] all water meters used for the hardness experiments (Figure 4) and pH value experiments (Figure 5) are within the error limits (MPE) according to OIML R 49 at the initial calibration. In case the stricter acceptance criteria would be applied, as in the case of a conformity assessment according module B or module H1 (excluding the uncertainty of the test equipment), two water meters (Meter A10 and Meter A13) would not have fulfilled the requirements. Both water meters would be slightly outside the MPE at the fourth flow point respectively. Taking into account the uncertainty of the calibration facility used (Table 10), both water meters just meet the requirements according market surveillance which is the benchmark here.

6.1.2. Ultrasonic Cold Water Meters (Kamstrup)

Each of the water meters used for hardness experiments (Figure 4) and pH value experiments (Figure 5) are within the MPE at initial calibration.

6.2. Accelerated Wear Tests

The accelerated wear test was carried out from 30 June 2020 to 4 September 2020. Each of the six tests (three hardness tests and three pH value tests) lasted about 11 days in total. This period resulted from the average flow of about ( 780 ± 10   L   h −1) and the specified total test volume of 200 m 3 . For all experiments, the temperature in the measuring section was in the range of ( 14.3 ± 0.2   C ) and the line pressure in the range of ( 1.15 ± 0.02 bar).
Table 11 gives an overview of target value and the measured values. It can be observed that the target points were well met. As a side note, however, it must be mentioned that a slightly lower amount of the chemicals (Table 2, Table 3, Table 4, Table 5, Table 6, Table 7, Table 8 and Table 9) was needed than calculated to reach the target values. This may be due to the fact that our initial water had slightly different values.

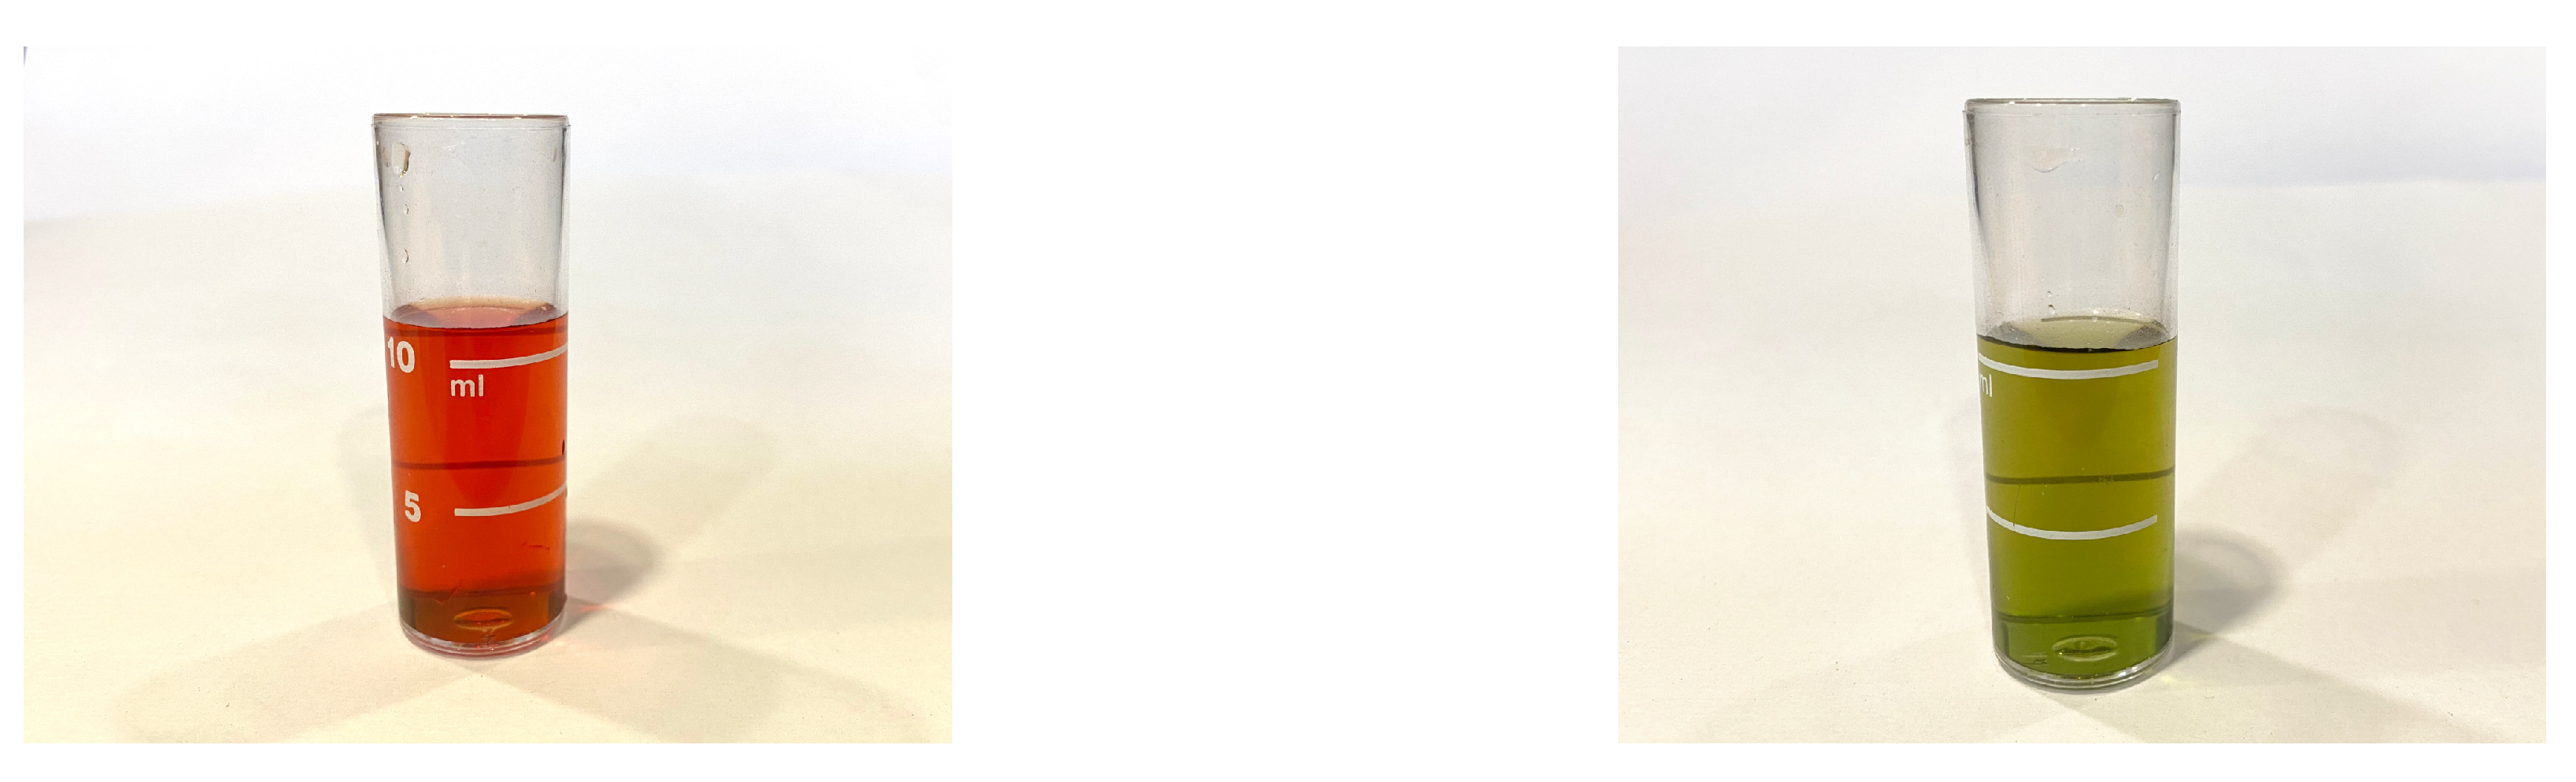
6.2.1. pH Value Measurements

The pH sensor was checked with three buffer solutions at different pH value levels. During the experiments, in addition to logging the values from the WA-control system, redundant measurements of all three parameters were carried out. In the case of pH value measurements, the pH value measurements of the WA-control system were compared in good agreement with a handheld device (WTW 340i, Xylem, Rye Brook, NY, USA) shortly after the start and shortly before the end of each experiment.

6.2.2. Total Hardness Measurements

The total hardness of the base and test waters were additionally checked by complexometric titration according to DIN 38406-3:2002-03 [26] before and after (and up to four times in between) each experiment. Alkaline earth ions form a red coloured complex with the indicator used. Titration with Na2-EDTA (Titriplex III) releases the indicator while the alkaline earth ions of EDTA are complexed. The free indicator turns the solution green. The titration is finished when the colour is turned from red to grey-green (shortly before colour change) to green, Figure 6. By counting the drops, the total hardness of the water can be determined directly since 1 drop equals 0.5   dH at 10 m L sample volume, which also represents the measurement uncertainty of the method. During the entire measurement campaign, i.e., for all experiments, the hardness value of the water measured was in good agreement with the value determined by titration at that time.
It is noticeable that the measured values of the pH value and conductivity are relatively stable, but the measured values of the total hardness fluctuate, Figure 7. The reason for the fluctuation of the hardness sensor could not be clarified conclusively. This could be that it is due to the measuring principle. The water hardness sensor used is a Ca/Mg ion-selective sensor which can be affected by other chemicals present or impurities in the water.
When looking at the measured values in a frequency diagram (Figure 8), most of the measured hardness values agree well with the respective target values. In the first experiment (hardness low) the target value is 5.2   dH and by far the most measured values are in the range of 5.0   dH and 5.5   dH . The same applies to the second experiment (hardness medium) and the third experiment (hardness high) where the target values are 11.2   dH and 16.8   dH , respectively. In the second experiment, the most frequently measured values are 11.0   dH and 11.5   dH and in the third experiment they are 16.5   dH and 17.0   dH . A remarkable observation is that the distributions do not correspond to a normal distribution, but rather that higher values occur more frequently. This is especially the case for the first (hardness low) and third (hardness high) experiments. Finally, it should be pointed out once again that the comparison with the titration method was carried out in very good agreement and the results were within the measurement uncertainty of the titration method.

6.2.3. Conductivity Measurements

The JUMO conductivity sensor was compared with a calibrated laboratory handheld device WTW LF 318, Xylem, Rye Brook, NY, USA, which has a poorer resolution. The WTW LF 318 measures the water temperature and uses, like the JUMO sensor, a reference temperature of 25 C . The measured values of both devices were in very good agreement. It should be mentioned that at the pH low measurements (Figure 7) the conductivity value was above 2000 μ S cm−1, that means outside the specifications of the WA-control online pH sensor. In this experiment, the conductivity value was determined twice a day by means of the WTW LF 318. During the entire experiment, the same conductivity values were measured with the handheld device. This is why the standard deviation of the conductivity measurement in the low pH value experiment is zero (Table 11). In addition, the standard deviation of the conductivity is larger for the high pH value experiment compared to the other experiments. This is because the pH value was not stable over time and a small amount of sodium hydroxide had to be added up to twice a day. Finally, a temperature compensation between the reference temperature and the actual water temperature in the measuring line can be performed according to EN 27888 (ISO 7888) [27]. An indicated conductivity of 2660 μ S cm−1 at a reference temperature of 25 C , as for example in the pH value high experiment (Figure 7), corresponds to an actual conductivity of around 2050 μ S cm−1 at a temperature of 14 C , which reflects the measurement conditions during all experiments.

6.3. Re-Calibration of the Water Meters after the Wear Test

After the accelerated wear tests were completed, all water meters were re-calibrated. As the accelerated wear tests simulate a six-year operation of the water meters under different water conditions, it is interesting to see how the water meters behave afterwards.

6.3.1. Multi-Jet Cold Water Meters (B Meters)

It can be noted that almost all multi-jet cold water meters (except for the two lowest flow rates for Meter A07) used for the hardness experiments (Figure 9) show that the error values tend to go in the plus direction. This is an effect that can often be observed for multi-jet water meters and represents a typical running-in behaviour. The water lubricates the impeller and makes it move more smoothly. The same behaviour can be noticed for the water meters used in the pH value high experiments (Figure 10). For the three water meters used in the pH value medium experiments, it can be stated that the measurement deviation of the four highest flow rates moves into the plus direction, while the deviation of the two lowest flow rates moves into the minus direction. The three water meters used in the pH value low experiments do not show any trend. In summary, five of the 18 water meters (Meter A03, two flow rates; Meter A07, three flow rates; Meter A10, two flow rates; Meter A13 one flow rate and Meter A15 one flow rate) do not comply with the MPE according R49 (or more precise verification error limits) after the accelerated wear tests. In this respect, all outliers are positive. Some multi-jet cold water meters were already at the upper limit during the initial calibration and do not comply with the MPE after the accelerated wear tests most probably due to the above-mentioned running-in behaviour. However, it can be determined that the water meters are only very slightly outside the MPE and that this only affects the average flow rates. Using the MPE in service (double MPE according OIML R 49) as a benchmark as usual after the end of the operational period, all water meters easily meet the requirements.

6.3.2. Ultrasonic Cold Water Meters (Kamstrup)

From the calibration curves (Figure 9 and Figure 10), no discernible trend can be observed for the ultrasonic water meters. With the exception of four water meters (Meter B03, Meter B04, Meter B09 and Meter B12) where the measurement deviation for all six flow rates tended in the positive direction and one water meter (Meter A11), where all six flow rates went in the negative direction, no pattern can be identified for the other thirteen water meters. In summary, it can be stated that all ultrasonic water meters investigated are within MPE limits (verification error limits) after the accelerated wear tests.

7. Conclusions and Discussion

The measuring accuracy of cold water meters for drinking water can depend decisively on the conditions of operation. Alongside many parameters, water quality plays a significant role. Drinking water is not always the same and can, for example, have different properties depending on the region and production process. However, drinking water is defined by standards and can have wide limits in terms of microbiological and chemical properties. The measurement accuracy of water meters must be guaranteed for all waters that comply with these standards. This can be a considerable challenge in the case of some parameters. Water meter manufacturers and water suppliers consider the two parameters, water hardness and pH value, as two of the most important factors influencing the measurement accuracy and measurement stability of water meters.
As part of a European research project, two of the most common domestic water meters types were examined with regard to the influence of water hardness and pH value. For the implementation, infrastructure was established to subject the water meters to accelerated wear tests with different test waters under defined conditions (water temperature, inline pressure, and flow rate). Special attention was paid to the logging of the most important parameters (pH value, hardness, conductivity, and sample line temperature) during the long-term experiments. Each accelerated wear test simulates a six-years operation of ( Q 3 2.5 ) cold water meters which corresponds to the calibration period in Germany with the associated accumulated volume (200 m 3 ) during this period. The simple designed test waters used in the accelerated wear tests are prepared comprehensibly according to given chemical quantities (cooking recipes) with three different degrees of hardness and three different pH levels. In the study presented in this paper, experiments with three different degrees of hardness and three different pH levels were carried out, each with three water meters per type. Before the water meters were subjected to the accelerated wear tests, the water meters were calibrated to determine the baseline situation. After the water meters were stressed, the water meters were re-calibrated.
As a result of these investigations, it can be determined that the poorest water qualities do not necessarily lead to the largest measurement deviations. In addition, it has not been observed that the measurement deviation is larger at the low flow rates, as one might expect. It can be concluded that the two types of water meter have different measurement stabilities and that the water meters of the same type can behave differently depending on the test water. It seems that multi-jet water meters are somewhat more affected by water quality than ultrasonic water meters. On the other hand, the influence of the water quality on the measurement accuracy is usually very small for both meter types.
It can be stated that all the water meters examined complied with the maximum permissible error limits (MPE) in service (double verification error limits) after the experiments and, in the case of the ultrasonic meter, even the stricter MPE limits according to OIML R 49.
Similar experiments were carried out at other project partners (PTB, CMI, DVGW/TZW) where even more types of domestic cold water meters (e.g., single-jet, rotary piston and magnetic inductive water meters) and similar research results were obtained. When looking at the overall results, it can be concluded that the results are very heterogeneous and strongly depend on the water meter type and respective manufacturer.

Author Contributions

Conceptualization, O.B., C.K. and M.B.; methodology, O.B., C.K. and M.B.; investigation, O.B. and K.S.; supervision, C.K. and M.B.; project administration, C.K.; resources, V.S.; writing–original draft preparation, O.B.; visualization, O.B.; writing–review and editing, K.S., C.K., M.B., J.P. and V.S. All authors have read and agreed to the published version of the manuscript.

Funding

This project 17IND13 Metrowamet has received funding from the EMPIR programme co-financed by the Participating States and from the European Union’s Horizon 2020 research and innovation programme.

Institutional Review Board Statement

Not applicable.

Informed Consent Statement

Not applicable.

Data Availability Statement

Data sharing not applicable.

Conflicts of Interest

The authors declare no conflict of interest.

Abbreviations

The following abbreviations are used in this manuscript:
ASTMAmerican Society for Testing Materials
CMICzech Metrology Institute
DINDeutsche Industrienorm (German Institute for Standardization)
DVGWDeutscher Verein des Gas- und Wasserfaches e.V. (German Technical and Scientific Association for Gas and Water)
ECEuropean Commission
EECEuropean Economic Community
EMCElectromagnetic Compatibility
EMPIREuropean Metrology Programme for Innovation and Research
FNUFormazin Nephelometric Unit
HPWHighly Purified Water
IMDIndividuell mätning och debitering (Individual metering and billing)
ISOInternational Organization for Standardization
JRPJoint Research Project
MIDMeasuring Instruments Directive
MPEMaximum Permissible Error
MWModel Water
NMINational Metrology Institute
OIMLInternational Organization of Legal Metrology
PTBPhysikalisch-Technische Bundesanstalt (The National Metrology Institute of Germany)
QMSQuality Management System
RISEResearch Institutes of Sweden
SLStock Solution
TZWDVGW-Technologiezentrum Wasser (German Water Centre)
VM7Vattenmätbänk no. 7 (calibration facility at RISE)
WELMECWestern European Legal Metrology Cooperation
WRMGWasch- und Reinigungsmittelgesetz (Washing and Cleaning Agents Act)

References

  1. The European Parliamente and the Council of the European Union. Directive 2004/22/EC on Measuring Instruments. Official Journal of the European Union, L 135/3. 2004. Available online: https://eur-lex.europa.eu/legal-content/EN/TXT/HTML/?uri=CELEX:32004L0022&from=EN (accessed on 23 September 2021).
  2. The Council of the European Communities. Council Directive 75/33/EEC on the Approximation of the Laws of the Member States Relating to Cold-Water Meters. Official Journal of the European Communities, L 14/1. 1974. Available online: https://op.europa.eu/en/publication-detail/-/publication/916e0da6-a11b-4dfd-aaa4-839fc68e5b47/language-en (accessed on 23 September 2021).
  3. The European Parliamente and the Council of the European Union. Directive 2014/32/EU on the Harmonisation of the Laws of the Member States Relating to the Making Available on the Market of Measuring Instruments (Recast). Official Journal of the European Union, L 96/149. 2014. Available online: https://eur-lex.europa.eu/legal-content/EN/TXT/HTML/?uri=CELEX:32014L0032&from=EN (accessed on 23 September 2021).
  4. The European Parliamente and the Council of the European Union. Directive (EU) 2020/2184 on the Quality of Water Intended for Human Consumption (Recast). Official Journal of the European Union, L 435. 2020. Available online: https://eur-lex.europa.eu/legal-content/EN/TXT/HTML/?uri=CELEX:32020L2184&from=EN (accessed on 23 September 2021).
  5. The Council of the European Union. Council Directive 98/83/EC on the Quality of Water Intended for Human Consumption. Official Journal of the European Union, L 330/32. 1998. Available online: https://eur-lex.europa.eu/legal-content/EN/TXT/HTML/?uri=CELEX:31998L0083&from=EN (accessed on 23 September 2021).
  6. Banks, D.; Birke, M.; Flem, B.; Reimann, C. Inorganic chemical quality of European tap-water: 1. Distribution of parameters and regulatory compliance. Appl. Geochem. 2015, 59, 200–210. [Google Scholar] [CrossRef]
  7. Flem, B.; Reimann, C.; Birke, M.; Banks, D.; Filzmoser, P.; Frengstad, B. Inorganic chemical quality of European tap-water: 2. Geographical distribution. Appl. Geochem. 2015, 59, 211–224. [Google Scholar] [CrossRef]
  8. Zenner. Zenner Informiert—Über das Messverhalten und die Dimensionierung von Wasserzählern & Informationen zur MID Measurement Instrument Directive; Zenner International GmbH & Co. KG: Saarbrücken, Germany, 2011. [Google Scholar]
  9. Swedac. Sveriges Vattenleverantörer har Sina mäTare under Kontroll. 2020. Available online: https://www.swedac.se/sveriges-vattenleverantorer-har-sina-matare-under-kontroll (accessed on 19 June 2021). (In Swedish).
  10. Swedac. STAFS 2007:2—Swedacs Föreskrifter och Allmänna råd om åTerkommande Kontroll av Vatten- och väRmemätare. 2007. Available online: https://www.swedac.se/wp-content/uploads/2016/06/STAFS-2007_2-konsol.pdf (accessed on 19 June 2021).
  11. The European Parliamente and the Council of the European Union. Directive 2012/27/EU on Energy Efficiency. Official Journal of the European Union, L 315/1. 2012. Available online: https://eur-lex.europa.eu/legal-content/EN/TXT/HTML/?uri=CELEX:32012L0027&from=EN (accessed on 23 September 2021).
  12. DVGW. Technische Regel—Arbeitsblatt DVGW W406(A)—Wasserzählermanagement; DVGW Deutscher Verein des Gas-und Wasserfaches e.V.: Bonn, Germany, 2021. [Google Scholar]
  13. World Health Organization (WHO). Hardness in Drinking-Water. Background Document for Preparation of WHO Guidelines for Drinking-Water Quality; (WHO/HSE/WSH/10.01/10/Rev/1); World Health Organization: Geneva, Switzerland, 2011. [Google Scholar]
  14. Sengupta, P. Potential health impacts of hard water. Int. J. Prev. Med. 2013, 4, 866–875. [Google Scholar] [PubMed]
  15. Kozisek, F. Regulations for calcium, magnesium or hardness in drinking water in the European Union member states. Regul. Toxicol. Pharmacol. 2020, 112, 104589. [Google Scholar] [CrossRef] [PubMed]
  16. ISO 4064. Water Meters for Cold Potable Water and Hot Water. Part 1: Metrological and Technical Requirements; Part 2: Test Methods; International Organization for Standardization: Geneva, Switzerland, 2014. [Google Scholar]
  17. OIML R 49. Water Meters for Cold Potable Water and Hot Water. Part 1: Metrological and Technical Requirements; Part 2: Test Methods; International Organization of Legal Metrology: Paris, France, 2013. [Google Scholar]
  18. Wendt, G. Untersuchung von Wohnungswasserzählern bezüGlich Messverhalten und Messstabilität wäHrend Ihres Einbaus in Kommunalen Versorgungsnetzen; Physikalisch-Technische Bundesanstalt, Department ‘Liquids’: Braunschweig, Germany, 2015. [Google Scholar]
  19. Techem. Techem Energiekennwerte; Techem Energy Services GmbH, Corporate Communications: Eschborn, Germany, 2018. [Google Scholar]
  20. Deutsches Bundesgesetz (German Federal Law). Gesetz über die Umweltverträglichkeit von Wasch- und Reinigungsmitteln (Wasch- und Reinigungsmittelgesetz—WRMG); Bundesgesetzblatt, Teil I, Nr. 100: Bonn, Germany, 1975. [Google Scholar]
  21. DVGW. Untersuchungen zur Desinfektionswirkung und Sicherheit der In-Line-Elektrolyse von Chlor als Umweltschonendes Verfahren für die Desinfektion von Trinkwasser. Abschlussbericht DVGW-F&E-Vorhaben 10/02/08 und DBU-Verbundprojekt (AZ 25386). 2012. Available online: https://www.dbu.de/OPAC/ab/DBU-Abschlussbericht-AZ-25386.pdf (accessed on 19 June 2021).
  22. ASTM D1193-06 (2018). Standard Specification for Reagent Water; ASTM International: West Conshohocken, PA, USA, 2018. [Google Scholar]
  23. ISO 3696. Water for Analytical Laboratory Use—Specification and Test Methods; International Organization for Standardization: Geneva, Switzerland, 1987. [Google Scholar]
  24. Büker, O.; Stolt, K.; Lindström, K.; Wennergren, P.; Penttinen, O.; Mattiasson, K. A unique test facility for calibration of domestic flow meters under dynamic flow conditions. Flow Meas. Instrum. 2021, 79, 101934. [Google Scholar] [CrossRef]
  25. WELMEC. WELMEC Guide 13.1—Common Application for Utility Meters (Water Meters and Thermal Energy Meters); WELMEC Secretariat: Braunschweig, Germany, 2020. [Google Scholar]
  26. DIN 38406-3. German Standard Methods for the Examination of Water, Waste Water and Sludge—Cations (Group E)—Part 3: Determination of Calcium and Magnesium, Complexometric Method (E 3); DIN: Berlin, Germany, 2002. [Google Scholar]
  27. DIN EN 27888. Water Quality—Determination of Electrical Conductivity (ISO 7888:1985); European Committee for Standardization (CEN): Brussels, Belgium, 1993. [Google Scholar]
Figure 1. Schematic diagram of the wear test facility. The wear test facility mainly consists of a portable flow test rig and a mobile cooling system to keep the water temperature at a constant low level.
Water 13 02701 g001
Figure 2. Overview of the wear test facility.
Water 13 02701 g002
Figure 3. Measurement values of the WA-control. (Left): Reading values of the initial water (starting point for the production of the base model water) taken some minutes after filling the empty storage tank from the RISE in-house purified water supply; (Right): Typical reading values during the accelerated wear tests (values taken on 24 August 2020).
Water 13 02701 g003
Figure 4. Top: (A). Calibration results of the B meters multi-jet cold water meters before the hardness tests; Below: (B). Calibration results of the Kamstrup ultrasonic cold water meters before the hardness tests.
Water 13 02701 g004
Figure 5. Top: (A). Calibration results of the B meters multi-jet cold water meters before the pH value tests; Below: (B). Calibration results of the Kamstrup ultrasonic cold water meters before the pH value tests.
Water 13 02701 g005
Figure 6. Titration. (Left): Starting point of the titration; (Right): Final result after colour change.
Water 13 02701 g006
Figure 7. The logged data (pH value, hardness and conductivity) from the WA-control during the accelerated wear tests.
Water 13 02701 g007
Figure 8. Frequency distribution of the measured degrees of hardness in the accelerated wear tests.
Water 13 02701 g008
Figure 9. Top: (A). Calibration results of the B meters multi-jet cold water meters after the hardness tests; Below: (B). Calibration results of the Kamstrup ultrasonic cold water meters after the hardness tests.
Water 13 02701 g009
Figure 10. Top: (A). Calibration results of the B meters multi-jet cold water meters after the pH value tests; Below: (B). Calibration results of the Kamstrup ultrasonic cold water meters after the pH value tests.
Water 13 02701 g010
Table 1. Former and new designations and calculations regarding flow measurement points.
ISO 4064 (Old)
Earlier Version of ISO 4064
MID (New)
Current Version of ISO 4064
Nominal flow rate; given value Q n (n or N: meter designation) Q 3
(Permanent flow rate q p )
Measuring range; given value Q min to Q max ( 1 : Q max / Q min ); depending onR with: R ≥ 40
the metrological class A, B or C
Minimum flow rate Q min ; depending on the metrological class Q 1 with: Q 3 / Q 1 = R
( q min ) Q min = k 1 · Q n with: k 1 = 0.04 (class A),
k 1 = 0.02 (class B), k 1 = 0.01 (class C)
Transitional flow rate Q t ; depending on the metrological class Q 2 with: Q 2 / Q 1 = 1.6
( q t ) Q t = k 2 · Q n with: k 2 = 0.10 (class A),
k 2 = 0.08 (class B), k 2 = 0.015 (class C)
Maximum flow rate Q max with: Q max / Q n = 2 Q 4 with: Q 4 / Q 3 = 1.25
(Overload flow rate q s )
Maximum Permissible Error Q min to < Q t : ±5% Q 1 to < Q 2 : ±5% and
(MPE) Q t to Q max : ±2% Q 2 to Q 4 : ±2%
Table 2. Design limits for residential buildings according the guideline DVGW-W-406 [12].
Water Meter SizeNumber of Residential Units
Q 3 2.5 Flat water meter (individual level, 1 residential unit)
Q 3 4 House water meter: 1 to 30 residential units
Q 3 10 House water meter: 31 to 200 residential units
Q 3 16 House water meter: 201 to 600 residential units
Table 3. Chemicals required for the preparation of the test waters.
Chemical NameChemical FormulaCAS Number
Calcium chlorideCaCl2 × 2H2O10035-04-8
dihydrate
Magnesium sulfateMgSO4 × 7H2O10034-99-8
heptahydrate
Sodium bicarbonate/NaHCO3144-55-8
Sodium hydrogen
carbonate
Di-Sodium hydrogenNa2HPO4 × 2H2O10028-24-7
phosphate dihydrate
Potassium dihydrogenKH2PO47778-77-0
phosphate
Sodium hydroxideNaOH1310-73-2
Table 4. A. Base model water (MW) and test water for hardness low—Experiment no. 1.
Chemical NameConcentration SL g L 1 IonIon Concentration in SL g L 1 SL Dosing mL (SL)/L (MW)Concentration MW mg L 1
Calcium chloride Cl41.9 21.0
dihydrate86.9Ca2+23.70.511.8
Magnesium sulfate SO42−30.4 60.7
heptahydrate77.9Mg2+7.72.015.4
Sodium
bicarbonate67.2HCO348.82.5122.0
Table 5. B. Test water for hardness medium—Experiment no. 2.
Chemical NameConcentration SL g L 1 IonIon Concentration in SL g L 1 SL Dosing mL (SL)/L (MW)Concentration MW mg L 1
Calcium chloride Cl41.9 44.6
dihydrate86.9Ca2+23.71.06425.2
Magnesium sulfate SO42−30.4 129.3
heptahydrate77.9Mg2+7.74.25632.7
Sodium
bicarbonate67.2HCO348.82.5122.0
Table 6. C. Test water for hardness high—Experiment no. 3.
Chemical NameConcentration SL g L 1 IonIon Concentration in SL g L 1 SL Dosing mL (SL)/L (MW)Concentration MW mg L 1
Calcium chloride Cl41.9 68.4
dihydrate86.9Ca2+23.71.63238.7
Magnesium sulfate SO42−30.4 198.2
heptahydrate77.9Mg2+7.76.52650.1
Sodium
bicarbonate67.2HCO348.82.5122.0
Table 7. D. Test water for pH value low—Experiment no. 4.
Chemical NameConcentration SL g L 1 IonIon Concentration in SL g L 1 SL Dosing mL (SL)/L (MW)Concentration MW mg L 1
Calcium chloride Cl41.9 21.0
dihydrate86.9Ca2+23.70.511.8
Magnesium sulfate SO42−30.4 60.7
heptahydrate77.9Mg2+7.72.015.4
Sodium HCO348.8 122.0
bicarbonate67.2Na+18.42.546.0
Di-Sodium hydrogen
phosphate dihydrate1370.0
Potassium dihydrogen
phosphate3340.0
Table 8. E. Test water for pH value medium—Experiment no. 5.
Chemical NameConcentration SL g L 1 IonIon Concentration in SL g L 1 SL Dosing mL (SL)/L (MW)Concentration MW mg L 1
Calcium chloride Cl41.9 21.0
dihydrate86.9Ca2+23.70.511.8
Magnesium sulfate SO42−30.4 60.7
heptahydrate77.9Mg2+7.72.015.4
Sodium
bicarbonate67.2HCO348.82.5122.0
Di-Sodium hydrogen
phosphate dihydrate1443.0
Potassium dihydrogen
phosphate258.0
Table 9. F. Test water for pH value high—Experiment no. 6.
Chemical NameConcentration SL g L 1 IonIon Concentration in SL g L 1 SL Dosing mL (SL)/L (MW)Concentration MW mg L 1
Calcium chloride Cl41.9 21.0
dihydrate86.9Ca2+23.70.511.8
Magnesium sulfate SO42−30.4 60.7
heptahydrate77.9Mg2+7.72.015.4
Sodium
bicarbonate67.2HCO348.82.5122.0
Sodium
hydroxide80.00.17
Table 10. Specifications of the water flow calibration facility at RISE (VM7).
ParameterSpecification
Measuring methodVolumetric (prover or master meter)
MediumWater
Flow rate0.1 L   min −1 to 100 L   min −1
6 L   h −1 to 6000 L   h −1
Temperature5 C to 90 C
PressureUp to 0.8   M Pa
Measurement uncertaintyU ( k = 2 ) 0.1 %
Table 11. Overview of the target values and measured values during the accelerated wear tests.
1. Hardness2. Hardness3. Hardness4. pH Value5. pH Value6. pH Value
LowMediumHighLowMediumHigh
Target values
pH value ( ) 6.507.709.50
Hardness ( dH )5.611.216.8
Measured values
pH values mean ( ) 7.877.657.666.497.699.50
pH values Std Dev0.110.030.020.040.070.04
Hardness mean ( dH )5.311.016.75.75.85.6
Hardness Std Dev0.50.50.50.30.40.2
Conductivity mean ( μ S cm−1)380.6571.4752.526601684.7501.3
Conductivity Std Dev1.12.13.906.625.2
Publisher’s Note: MDPI stays neutral with regard to jurisdictional claims in published maps and institutional affiliations.

