Article

Irrigation Scheme Selection Based on Water Footprint Analysis of Winter Wheat Production in Piedmont Plains of Hebei Province under Future Climate Scenarios

1
Key Laboratory of Crop Growth Regulation of Hebei Province, College of Agronomy, Hebei Agricultural University, Baoding 071001, China
2
Shunping Meteorological Bureau of Hebei Province, Shunping 072250, China
3
Baoding Meteorological Bureau of Hebei Province, Baoding 071000, China
4
Department of Economics and Management, North China Electric Power University, Baoding 071003, China
*
Author to whom correspondence should be addressed.
Water 2021, 13(19), 2640; https://doi.org/10.3390/w13192640
Submission received: 13 July 2021 / Revised: 13 September 2021 / Accepted: 22 September 2021 / Published: 25 September 2021
(This article belongs to the Section Hydrology)

Abstract

:
The statistical downscaling tool of a statistical downscaling model (SDSM) to generate the future climate of the piedmont plain area in Hebei Province for a 30-year period. The Xinji city was selected as a typical example of this area. The crop growth model of the decision support system for agrotechnology transfer (DSSAT) was adopted to estimate the changing trends of the water footprint of winter wheat production in this area under future climate conditions, and to obtain the optimal irrigation scheme of winter wheat for an ‘acceptable yield’. According to the test results, all the temperature indices of the piedmont plain area increased in the two selected future climate scenarios. In addition, the effective precipitation exhibited a slight decrease in scenario A2 and a remarkable increase in scenario B2. Both the total water footprint and green water footprint increased. A yield of 500 kg per mu was taken as the acceptable yield. In scenario A2, to achieve this acceptable yield, it was required to irrigate once in the jointing period with an irrigation rate of 105 mm. In scenario B2, one-time irrigation with an amount of 85 mm was sufficient to reach the acceptable yield.

1. Introduction

China’s agricultural production has been facing many risks and challenges such as global climate change, restricted resources, ecological function degradation, surface–source environmental pollution, and food security. Among these, water resource shortage is a prominent problem. According to statistics, China’s water resources correspond to only 28% of the world average in terms of per capita and are extremely imbalanced in time and space. China’s most agricultural regions are facing water shortage [1]. In 2017, China’s agricultural water use was as high as 376.64 billion m3 (62.3% of the total water use). Agriculture has become China’s largest water-intensive industry. In 2017, the actual water use per ha of cultivated land irrigation was 5655 m3, and the effective water use efficiency of farmland irrigation was only 0.548 [2]. The limited supply and inefficient use of water resources have become main constraints to China’s agricultural development. A quantitative evaluation of agricultural water use to improve the irrigation regime and achieve the sustainable use of water resources has become a current, hot research topic for agricultural sustainable development [3,4]. Water footprint is a multi-dimensional index that reflects the overall water use and water source types. Since its inception, the integrated approach to consider water use based on the whole product supply chain and service process has attracted considerable attention and is widely applied [5]. This concept has its origin in the idea of ‘virtual water’. The term, virtual water, was coined in 1993 and is defined as the quantity of water resources ‘hidden’ behind and materialised in products or services [6]. The concept of water footprint was proposed in 2002 on the basis of the idea of ‘virtual water’ and with the aid of the ‘ecological footprint’ theory. It is defined as the quantity of fresh-water resources consumed to produce a certain amount of goods and services for human consumption under specific material living conditions [7,8,9,10,11]. In addition, this concept is mentioned in the international standard ISO 14046: 2014 Environmental management.
Agriculture is a main contributor of water footprint, and several studies have focused on this aspect [12,13,14,15]. At present, most researches on agricultural water footprint were focused on the production sphere, with both the regional and product scales. In particular, there have been remarkable research results based on product water footprint [16,17,18], which are of great significance for improving the irrigation system, and thus achieving sustainable crop production.
The piedmont plain area in Hebei Province is one of China’s most important areas of winter wheat production. However, this area is facing severe water shortage. Its per capita water availability is as low as 5% of the world average and is decreasing annually. Its agricultural water use is 63% of the total water use [19,20]. In this area, winter wheat is the main water-intensive crop, and its production is highly dependent on irrigation with the extracted underground water. In recent years, as climate change intensifies, this production mode can no longer support sustainable agricultural development. Under this circumstance, it is of great significance to abandon the previous production mode that pursues high yield and investigate the irrigation scheme to obtain the ‘acceptable yield’ with the water footprint evaluation method under future climate conditions. According to the questionnaire survey and expert consultation results of this study, 500 kg was set as the acceptable yield of winter wheat in piedmont plains.
The main goals of this study were to calculate and predict the water footprint of winter wheat production in piedmont plains of Hebei Province under future climate scenarios and to select the optimal irrigation scheme for winter wheat according to the acceptable yield.

2. Material and Methods

2.1. Overview of the Test Site

In this study, considering the natural resources, agricultural production conditions, and planting structures, Xinji city of Shijiazhuang was selected as a typical example of the piedmont plain area for research. The research was conducted at the Xinji Test Site of Hebei Agricultural University from 2015 to 2017. The site is located in the south of Xinji city, with geographical coordinates of 115°17′53.23″ E, 37°47′58.30″ N and an altitude of 37 m.

2.1.1. Test Material

Jimai 585 (approval number: GSM 2011010; provider: Xinji Academy of Agriculture and Forestry Sciences) was selected as the test variety of wheat. This wheat is a high-quality wheat recommended by the Department of Agriculture and Rural Affairs of Hebei Province. Moreover, it is suitable for plots with medium to high contents of water and fertiliser in the central-southern part of Hebei Province of the northern part of the Huanghe–Huaihe–Haihe wheat production area. Currently, a large promotion area is available for this wheat variety in the piedmont plain area in Hebei Province.

2.1.2. Test Treatment

The field tests were conducted during 2015–2016 and 2016–2017 (with test codes W1, W2 and N1, N2, where W indicates the test treatment of irrigation and N indicates the test treatment of nitrogen fertiliser application). These tests were based on a two-factor split-slot design with three times repetitions. The plot area was 36 m2 (6 × 6 m), and the 1-m-wide isolation strip was separated between the plots subjected to different test treatments. The primary plots were subjected to irrigation, whereas the secondary plots were subjected to nitrogen fertiliser application. Research has indicated that the jointing period and blossoming period are the key irrigation periods of winter wheat in northern China. Therefore, three levels of irrigation were employed in this study: No irrigation during the complete growth period (W10 and W20); irrigation once in the reviving–jointing period (W11 and W21, with 60 mm irrigation); and irrigation once in the reviving–jointing period and once in the heading–flowering period (W12 and W22, with 60 mm irrigation each time, respectively). The sprinkling irrigation with a sprinkling belt was used as the irrigation method, and the irrigation rate was controlled using a water meter.
Similarly, three levels of nitrogen fertiliser application were arranged for the secondary plots: No nitrogen fertiliser application during the complete growth period (N10 and N20); 120 kg/hm2 nitrogen fertiliser application (N11 and N21); and 240 kg/hm2 nitrogen fertiliser application (N12 and N22). The nitrogen fertiliser application method was dependent on the irrigation method of the primary plots, for example, 100% basal dressing in the case of W10 and W20 and 50% basal dressing and 50% top dressing before the irrigation in the reviving–jointing period, in the case of other irrigation methods (Table 1).
Seeding was conducted on 15 October 2015 and 12 October 2016. The seeding rate was 225 kg/hm2, and the seeding method used was mechanised seeding, with a regular interval of 15 cm and compaction after seeding. Other field management measures were the same as those of the high-yield fields in this area. Harvesting was conducted on 9 June 2016 and 8 June 2017.

2.2. Water Footprint of Wheat Production

The research on water footprint is limited to the water footprint of wheat production. If water pollution is not considered, water footprint should be the total water used in wheat production. In other words, it should be composed of blue and green water footprints. The quantification method was as follows. First, the evapo-transpiration, effective precipitation, and irrigation rate in the growth period were calculated. Then, the water footprint per unit yield was calculated in view of the unit yield.
The green and blue water footprints in the crop water use (CWU, m3/hm2) are equal to the long-term accumulated value of the crop’s daily evapo-transpiration (ET, mm/day).
The following formulae were used for calculation:
W F W = W F W g r e e n + W F W b l u e
W F W g r e e n = C W U g r e e n P = 10 × E T g r e e n P
W F W b l u e = C W U b l u e P = 10 × E T b l u e P
C W U g r e e n = 10 × d = 1 l g p E T g r e e n
C W U b l u e = 10 × d = 1 l g p E T b l u e
where W F W is the water footprint per unit wheat yield (m3/kg), W F W g r e e n is the green water footprint per unit wheat yield (m3/kg), and W F W b l u e is the blue water footprint per unit wheat yield (m3/kg). C W U g r e e n is the green water used in the wheat growth period (m3/hm2), C W U b l u e is the blue water used in the wheat growth period (m3/hm2), P is the unit yield (kg/hm2), E T g r e e n is the green water evapo-transpiration in the wheat growth period (mm), E T b l u e is the blue water evapo-transpiration in the wheat growth period (mm), and 10 is the conversion coefficient.
The crop evapo-transpiration was calculated using the revised FAO Penman–Monteith method. This method is the only FAO recommended standard method to calculate the reference evapo-transpiration.
The calculation formula is as follows:
E T 0 = 0.408 ( R n G ) + r 900 T + 273 u 2 ( e s e a ) + r ( 1 + 0.34 u 2 )
where E T 0 is the reference evapo-transpiration (mm/day) of the crop, R n is the net radiation at the crop surface (MJ/m2·day), G is the soil heat flux density (MJ/m2·day), T is the daily mean temperate at 2 m (°C), u 2 is the wind speed at 2 m (m/s), e s is the saturated vapour pressure (kPa), e a is the actual vapour pressure (kPa), e s e a is the saturated vapor pressure deficit (kPa), is the slope of the saturated vapor pressure curve, and r is the hygrometer constant (kPa/°C).

2.3. Historical Meteorological Data

For the simulation model, the historical meteorological data from four meteorological observation stations located in the Zhuozhou city, Baoding city, Shijiazhuang city, and Xingtai city in the piedmont plain area of Mount Taihang during the 41-year period from 1961 to 2001, were selected as the basic data. The period from 1 January 1961 to 31 December 1990 was considered the calibration period, and the period from 1 January 1991 to 31 December 2001 was considered the verification period. The selected data of meteorological indices were daily data of seven indices, namely maximum, minimum, and mean temperatures; precipitation; wind speed; sunshine hour; and humidity. All the meteorological data were actual measured data obtained from the China Meteorological Data Service Centre and the relevant ground observation stations.

2.4. Re-Analysis Data

In this study, the large-scale climate factor variables were selected from the global atmosphere re-analysis daily data developed by the National Centers for Environmental Prediction (NCEP) and the National Center for Atmospheric Research (NCAR). There were three sets of grid data covering the whole territory of Hebei Province, with a resolution of 1.875 × 1.875° during the period of 1961–2001. Of these, the grid BOX_30X_19Y could completely cover the piedmont plain area of Mount Taihang in Hebei Province. The meteorological observation stations in the Zhuozhou city, Baoding city, Shijiazhuang city, and Xingtai city are evenly distributed from the north to south of the piedmont plain area and are suitable point sources for interpolation into their respective total areas. The NCEP/NCAR re-analysis data included 26 meteorological predictors.

2.5. General Circulation Model and SRES Scenarios

According to the existing research, the GCM of Had CM3 proposed by the Hadley Centre for Climate Prediction and Research is suitable for China and Eastern Asia at large. Among the greenhouse gas emission scenarios in the next 100 years proposed in the SRES released by IPCC, scenario A2 envisions the status of continuous population growth, higher greenhouse gas emissions, slow economic growth, and serious protectionism. Whereas, scenario B2 envisions the situations of slower population growth, lower greenhouse gas emissions, sustainable economic development, and technical advancement and diversification. These two scenarios represent the most possible and reasonable future scenarios. Therefore, the Had CM3 model adopted in this study was based on scenarios A2 and B2 among the SRES scenarios to generate and output future climate data. The data used in the Had CM3 model in scenarios A2 and B2 were obtained from the Environment and Climate Change, Canada. For the grid data, the resolution was 3.75 × 2.5°, and the predictors were the same as the predictors of the NCEP/NCAR re-analysis data.
The NCEP/NCAR data are re-sampled to ensure that their resolution is the same as the resolution of the Had CM3 model. Then, the variables are standardised to enable their application for future prediction.

2.6. Statistical Downscaling Model

At present, the Global Climate Model (GCM) is an important tool to estimate future climate changes, and it has been recognised and recommended by the Intergovernmental Panel on Climate Change (IPCC). According to relevant research, the GCM model can properly simulate the characteristics of large-scale climate change, but it cannot accurately predict regional-scale climate scenarios due to its low space resolution. Therefore, a downscaling method is required to compensate its deficiency [21,22]. In this study, a statistical downscaling tool, namely the statistical downscaling model (SDSM), established by Wilby and other scholars, was adopted. Of the scenarios in Special Report on Emission Scenarios (SRES) proposed by IPCC, the future emission models of scenarios A2 and B2 were selected. In addition, the ocean–atmosphere coupled model of Hadley Centre Coupled Model version 3 (Had CM3) proposed by the Hadley Centre for Climate Prediction and Research was used to conduct downscaling of the main wheat production area of the piedmont plain area in Hebei Province and to generate its future climate. According to studies, the SDSM model can accurately simulate a future climate [23,24,25]. In this paper, the future climate prediction for the piedmont plain area in Hebei Province was mainly based on local historical meteorological data, global atmosphere re-analysis daily data, and global atmosphere circulation model. Moreover, it was conducted using the downscaling tool of SDSM and under the SRES scenarios.
w i = α 0 + j = 1 n α j P i j ; R i 0.25 = β 0 + j = 1 n β j P i j + e i
T i = γ 0 + j = 1 n γ j P i j + e i
where w i is the probability of precipitation in day i , α , β , and γ are the model parameters, R i is the precipitation, T i is the temperature, and e i is the error.

2.7. CROPWAT Model

The CROPWAT model was developed by the Land and Water Division of the United Nations, Food and Agriculture Organization, for the design and evaluation of irrigation plans. This model is mainly used to calculate the crop evapo-transpiration, effective precipitation, crop water demand, and irrigation water demand. This model can simulate the water supply conditions, irrigation efficiency, and precipitation efficiency through the daily water equilibrium [26,27,28].

2.8. DSSAT Model

The DSSAT model is one of the world’s most important crop modelling systems. This model is integrated with a group of crop simulation models. Of these models, the wheat simulation model is CERES-Wheat. Its analysis module can be used to evaluate the management measures in the growth period and improve variety screening, planting method, plant density and spacing, irrigation time and rate, fertiliser application, and other characteristics [29,30].

3. Results and Analyses

3.1. Information on Xinji City

Xinji city has a warm, temperate, semi-arid monsoon climate, with an annual mean precipitation of 461 mm in the past 30 years and a precipitation of 177.91 mm in the winter wheat growth period (38.65% of the total precipitation). The day-by-day meteorological data released by the national meteorological observation station in Xinji city were used to obtain all the meteorological data, which included day-by-day precipitation, sunshine hour, day-by-day maximum and minimum temperatures, daily mean temperature, and wind speed. The day-by-day solar radiation was calculated using the Angstrom formula (Table 2).

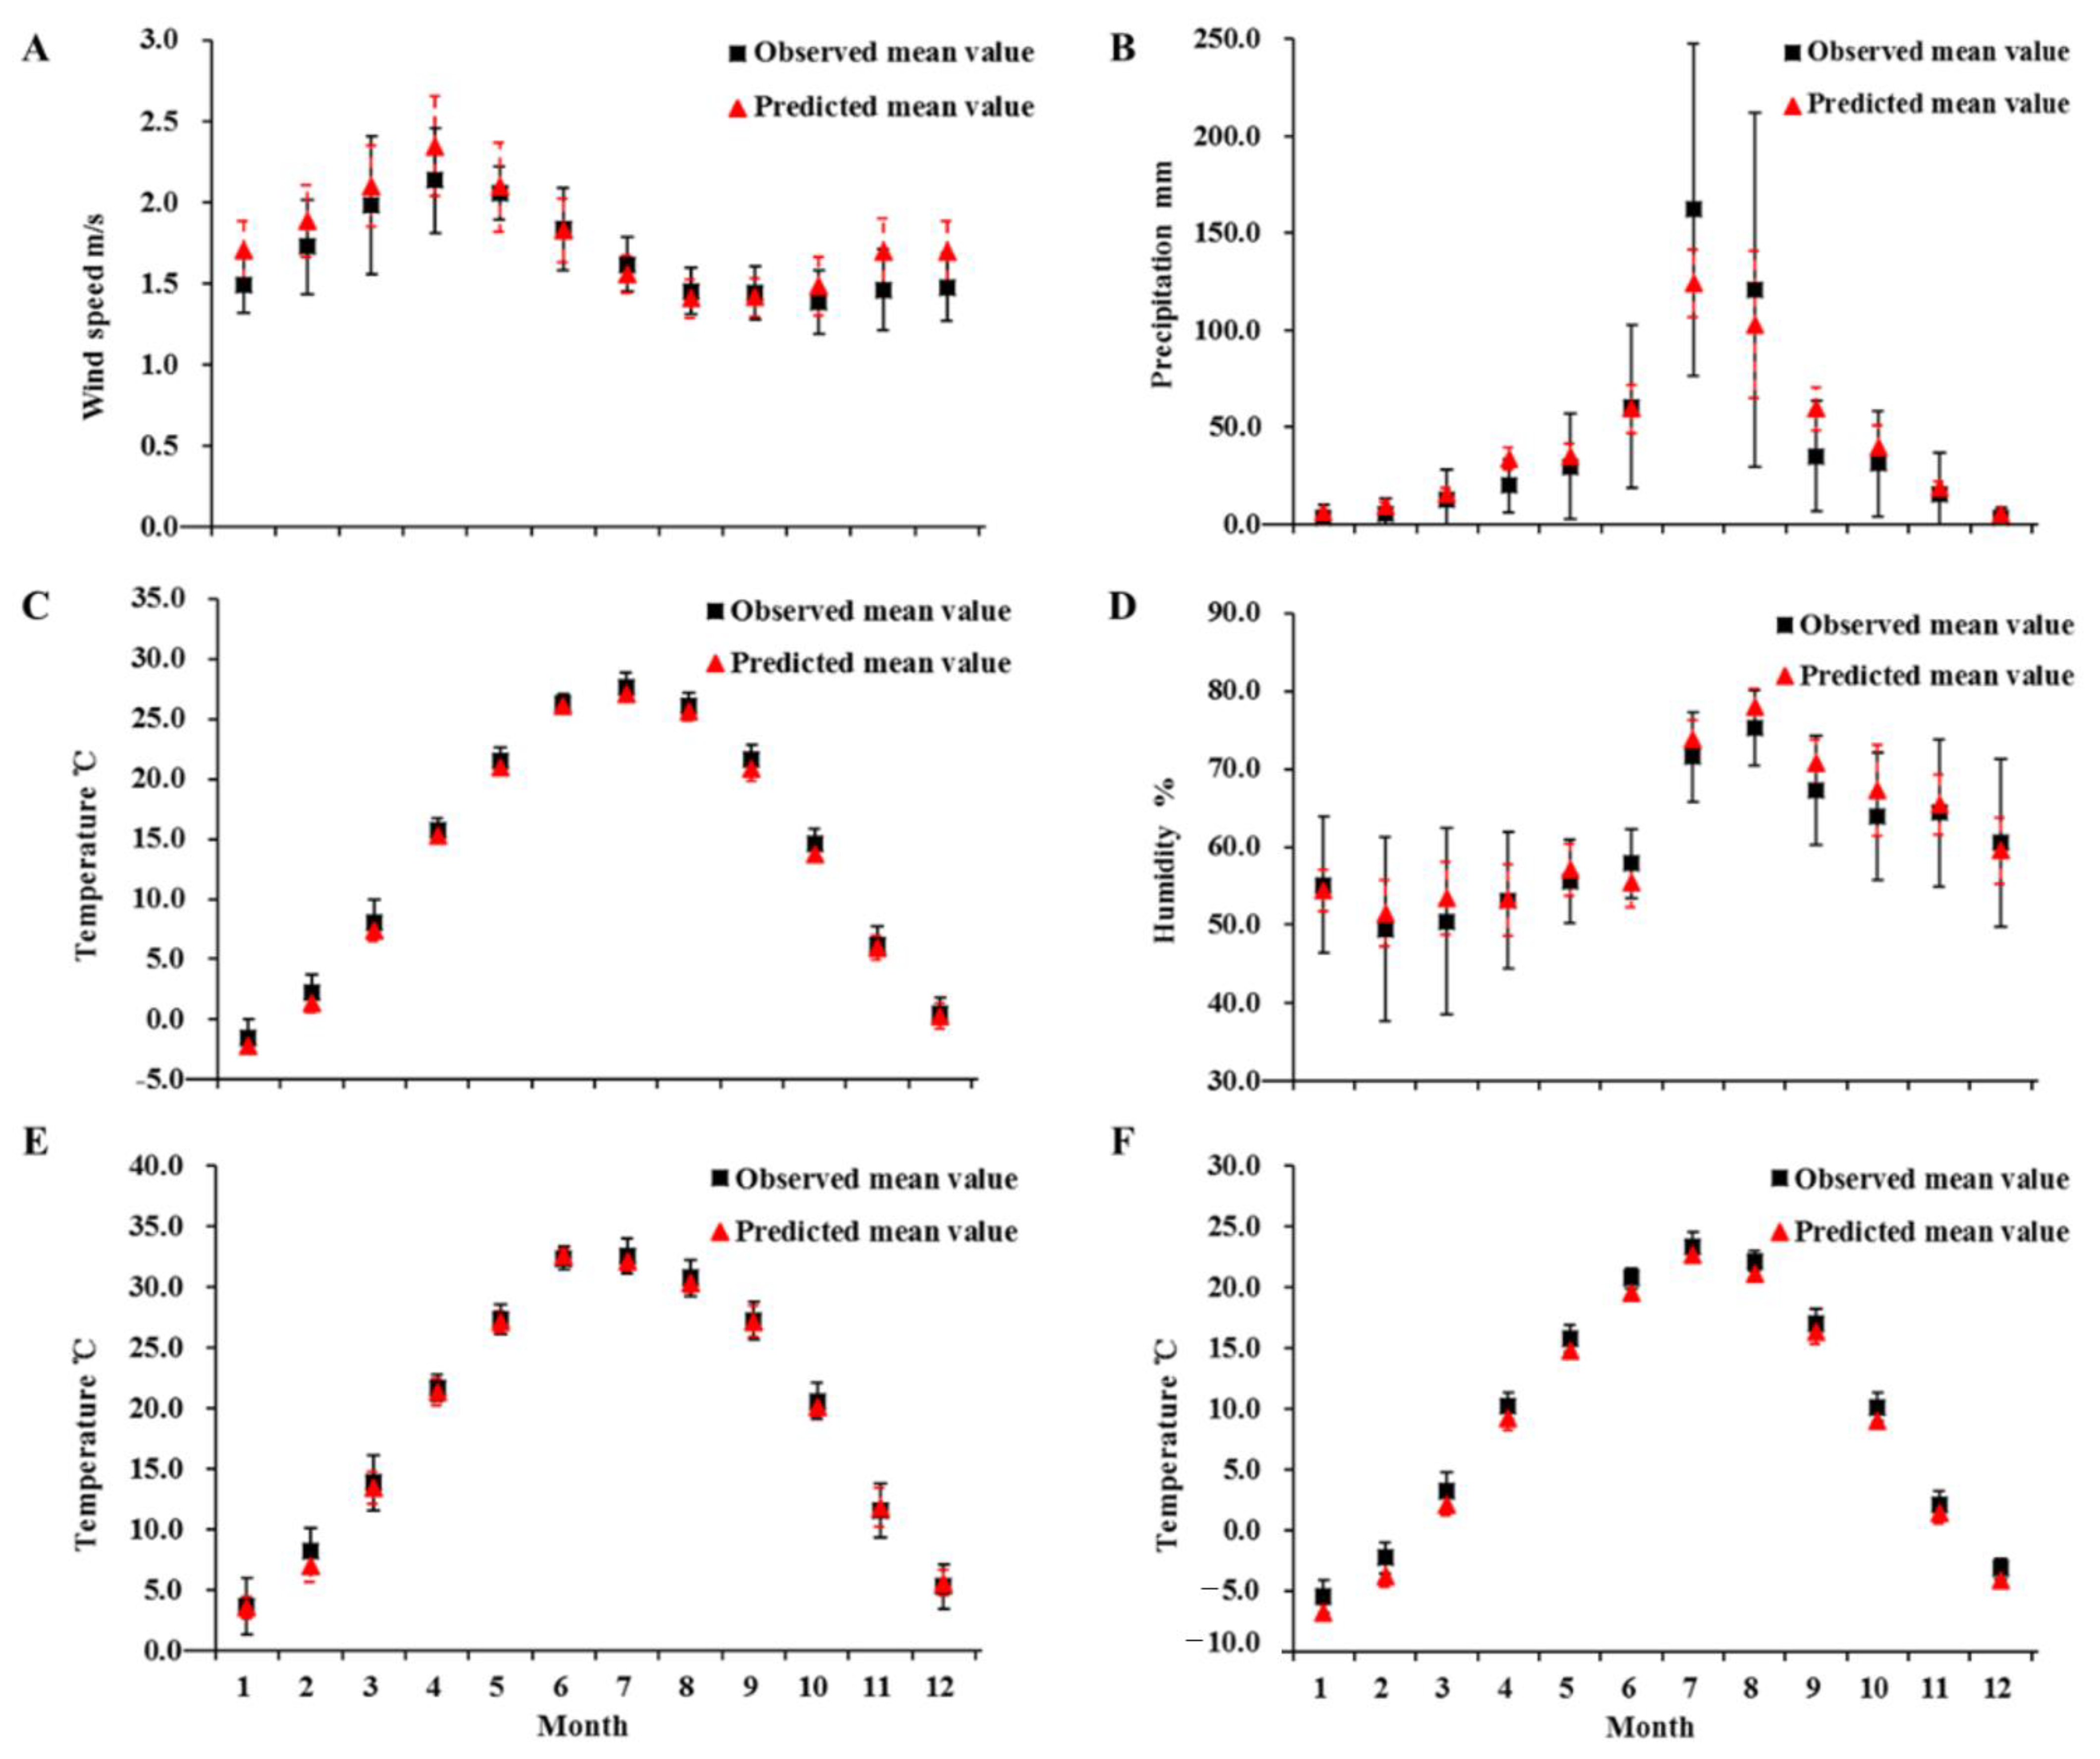
3.2. Evaluation of Simulation Effects

As shown in Table 3 and Figure 1, the SDSM model provided good simulation results for daily maximum temperature, with explained variances of 0.65–0.87 and standard errors of 2.1–4.1 for various locations. In addition, it provided good simulation results for daily minimum temperature, with explained variances of 0.63–0.89 and standard errors of 2.3–3.7. These findings indicated that the simulation effects were good for temperature indices and that accurate predictions can be made for future temperature change. Meanwhile, this model was found to produce poor simulation results for wind speed, humidity, sunshine hour, and precipitation when compared with those for temperature indices. However, it could still satisfy the basic standard value requirement of 0.5. This finding indicated that the overall simulation results were reliable, but the simulation errors of process indices were greater than those of temperature indices. Therefore, such indices can only be used to predict overall future situations on monthly, quarterly, and yearly basis and cannot be used for calculations with strict requirements on daily sequences. The overall simulation performance in the calibration period was found to be superior to that in the verification period.
To summarise, the calculations and verification showed that the downscaling method of SDSM can be used to predict the future weather factors of the piedmont plain area of Mount Taihang in Hebei Province, and the future meteorological conditions generated by its weather generator can represent the trend characteristics.

3.3. Generation of Future Climate

Based on the verified SDSM model and in view of the current situation of agricultural production of Hebei Province and the priority areas of future prediction, future climate was generated for the aforementioned four meteorological stations in the piedmont plain area for the 30-year period from 2020 to 2049 in scenarios A2 and B2. The impact range of each meteorological station was calculated on the ArcGIS platform using the Thiessen polygon method and used as the weight coefficient for weighing the total range of the piedmont plain area of Mount Taihang in Hebei Province. Furthermore, the weighted values were calculated for the seven meteorological indices, namely maximum, minimum, and mean temperatures; precipitation; wind speed; sunshine; and relative humidity. The calculation results are shown in Table 4.
As shown in Table 4, the main meteorological indices of the piedmont plain area changed in different directions and to different extents in these two future climate models. The specific manifestations were as follows. All the temperature indices were increased: The annual mean, maximum, and minimum temperatures in the future period of 2020–2049 were higher than those in the base period of 1989–2018 by 0.17 and 0.14 °C, 0.4 and 0.38 °C, 0.6 and 0.2 °C in scenarios A2 and B2, respectively. This finding indicated greater temperature ranges and climate change amplitudes in the future period. The mean humidity was increased, and the value in scenario B2 was higher than that in scenario A2. The sunshine hour exhibited changes in different directions in these two scenarios. It was slightly increased in scenario A2 and slightly decreased in scenario B2. The wind speed exhibited a decrease of 0.06 and 0.04 m/s in scenarios A2 and B2, respectively. The precipitation exhibited changes in different directions in these two future climate scenarios, with a decrease of 7.52 mm in scenario A2 and an increase of 6.86 mm in scenario B2.

3.4. Establishment and Verification of the Crop Model

3.4.1. Parameter Estimation

The Weather Man program in the CERES-Wheat model of DSSAT 4.7.5 was used to prepare the meteorological observation file based on the measured day-by-day temperature, precipitation, and radiation data of the test site; the soil observation file based on the measured soil data; and the test data file based on field tests. In accordance with the relevant literature [31], the Genotype program was used to prepare the initial variety parameter file for model calibration. In view of the manifestation of growth characteristics of Jimai 583, the manually defined data ranges and the improved Clue program were used to calibrate the variety parameters of the test wheat variety with the trial-and-error method on the basis of the phenophase and yield data of winter wheat. The Clue program was used to configure 20,000 times of random searching. The calibration period was the wheat growth period of 2015–2016, and the verification period was the wheat growth period of 2016–2017. The specific parameters and values are shown in Table 5.

3.4.2. Model Calibration

As shown in Table 6, after parameter adjustment, the DSSAT model could accurately simulate the main evaluation index of winter wheat yield, with the RMSE and RRMSE values of as low as 722.05 kg/hm−2 and 10.94% (at the border line of the ‘excellent’ range), respectively, and the R2 score of as high as 0.989, which was very close to 1. Meanwhile, this model can be used to accurately simulate the winter wheat growth period, with the anthesis period and the maturity period kept within 2 days. Subsequently, model verification was performed.

3.4.3. Model Verification

As shown in Table 7, in the wheat growth period of 2016–2017, the DSSAT model could satisfactorily simulate the winter wheat yield, with the RMSE and RRMSE values as low as 549.42 kg/hm−2 and 8.26% (at the boundary of ‘outstanding’ range), respectively, and the R2 score of as high as 0.955, which is within the ‘excellent’ range. This model can be used to accurately simulate the winter wheat growth period, with the anthesis period and the maturity period of within 1 day. After comparative analysis of the model simulated values and the actual observed data in the calibration period and the parameter verification period, the variety parameters of winter wheat estimated by the DSSAT model were found to accurately simulate the winter wheat production process and support the yield prediction of the test site.

3.5. Water Footprint of Winter Wheat Production in Future Climate Scenarios

The water footprint of wheat production is calculated not only to examine the historical change characteristics and the current usage status, but also to explore the future change trends [32,33] by predicting the quantity, nature, and situation of the available water resources within a certain future period. These predictions are essential to ensure in-advance arrangements from the macro perspective through long-term considerations and water use strategy adjustments for wheat planting.
  • Analysis of Pearson-III frequency curve of the Xinji city
In this study, the formula of density function and the Excel software were used, and the Pearson-III frequency curve was analysed to select the typical years by considering the precipitation in the winter wheat growth period as the evaluation index. Furthermore, the climate characteristics of various typical years were extracted and input into the DSSAT model to examine the irrigation time and irrigation rate in different typical years. In the data extraction process, the period from January to September of the following year and October to December of the current year were considered as the complete wheat growth year.
The aforementioned method was adopted to examine and analyse the observed pre-cipitation data of the winter wheat growth period (from 25 September of the current year to 20 June of the following year) of Xinji city, Hebei Province, in the preceding 30 years. The calculation results were as follows. Under the probability of 20% for the wet year, 50% for the normal year, and 75% for the dry year, the respective precipitation values of the winter wheat growth period for this area were 193.6, 150.8, and 122.6 mm, respectively, and the mean value for these three years was 156.7 mm. Therefore, the typical years were as follows. The wet year was 2002–2003, the normal year was 2015–2016, and the dry year was 2013–2014. The detailed information is presented in Figure 2.
2.
Prediction of effective precipitation under future climate conditions
The FAO-recommended reference crop coefficients and single crop coefficient method were used to determine the local crop coefficients of winter wheat. Furthermore, the acquired data were input into the CROPWAT model to calculate the mean value of the monthly sequence of the evapo-transpiration in the winter wheat growth period using the revised FAO Penman–Monteith method.
In accordance with the observed test data and literature review, the typical whole winter wheat growth period in Xinji city was from 15 October of the current year to 15 June of the following year. Therefore, the respective lengths of various stages in the CROPWAT model were 35, 141, 41, and 27 days for the initial stage, developmental stage, mid- season, and late-season, respectively. The total length of the growth period was 244 days.
Using the relevant formulae, the crop coefficients of winter wheat in various stages in Xinji city were 0.45–1.25.
The monthly data of maximum temperature, minimum temperature, sunshine hour, wind speed, and humidity generated using the CROPWAT and SDSM models in the future period of 2020–2049 in scenarios A2 and B2, as well as the relevant data obtained from the Thiessen polygon were used to calculate the effective precipitation of the piedmont plain area of Mount Taihang in these two scenarios. The calculation results are as follows.
As shown in Table 8, in these two future climate scenarios, the crop water demand of winter wheat exhibited no remarkable change relative to that in the observed period, and the effective precipitation exhibited a slight decrease in scenario A2 and a remarkable increase of 23.7 mm in scenario B2. The irrigation water demand under non-water-stress conditions exhibited corresponding changes, with a slight increase of 3.9 mm in scenario A2 and a remarkable decrease of 24.2 mm in scenario B2.
3.
Prediction of the water footprint of winter wheat production under future climate conditions
We adopted the following method to predict the water footprint of winter wheat production in future climate models.
(1)
The CERES-Wheat model in DSSAT 4.7.5 was used to conduct the simulation and prediction of winter wheat growth, water resource use, and winter wheat yield.
(2)
Considering that the future climate data generated using the SDSM model are verified on a monthly scale and the input data required by the DSSAT model for future prediction are daily data, the following data processing measures were adopted. The Pearson-III frequency curve was used to screen the normal years in the 30-year future period of 2020–2049. The ratio of the daily data to the annual total of the meteorological indices of the normal years for the 30-year period of 1989–2018 from the national meteorological observation station in Xinji city was considered the coefficient to quantify the annual meteorological data of the normal years, screened for future climate scenarios into the daily data with the same characteristics as those of the normal years of the past 30-year period from the meteorological observation station. Furthermore, the DSSAT model was used to obtain the final calculation results, which is the water footprint per unit yield of two ecotype areas.
(3)
The actual observed data of the observed period were used as the soil data.
As shown in Table 9, under the same variety parameters and farmland management measures, the winter wheat yield in scenario A2 exhibited slight decreases compared with those in the normal year of the observed period. At the normal irrigation rate, noticeable differences were observed. This situation was mainly attributed to the low precipitation in the future climate model of scenario A2, the low coupling between the daily sequence data converted under the future climate conditions and the main water-demanding periods of the wheat variety. In scenario A2, under the condition of one-time irrigation, the standard requirement of wheat yield per mu of 500 kg could be satisfied only when the irrigation rate was up to 105 mm, which was higher by 10 mm than the standard irrigation rate in the observed period. In comparison, under the condition of one-time irrigation, a lower wheat yield of 490 kg was achieved when the irrigation rate was 95 mm, which was similar to the irrigation standard in the observed period. Therefore, the critical value of the irrigation rate of winter wheat in this area in scenario A2 was approximately 105 mm, which was higher than that in the base period.
Under the condition of two-time irrigation, the trends of scenario A2 were not significantly different from those of the base period. The yield requirement per mu was achieved at the total irrigation rate of 95 mm in both cases. In the observed period, two combinations with an irrigation rate of 95 mm in the jointing period and anthesis period could achieve the acceptable yield, whereas in scenario A2, only one combination could realize it. For test plans No. 14–No. 17, no significant differences were observed in the simulation results between scenario A2 and the base period. This finding indicated that the most efficient irrigation scheme should be selected on the basis of the simulation results obtained under the condition of one-time irrigation.
From the perspective of water footprint per unit yield, the water footprint per unit yield for winter wheat in this area in scenario A2 was 0.37–0.52 m3/kg, of which the green and blue water footprints were 0.17–0.28 and 0.20–0.24 m3/kg, respectively. Therefore, the water footprint per unit yield for winter wheat in scenario A2 exhibited a noticeable increase compared with that in the base period.
As shown in Table 10, under the same variety parameters and farmland management measures, the winter wheat yield in scenario B2 exhibited increases compared with that in the normal year of the observed period. In scenario B2, under the condition of one time irrigation once, the yield requirement per mu of 500 kg could be satisfied when the irrigation rate was only 85 mm, which was an irrigation standard lower by 10 mm than that in the observed period. This simulation result was different from that in scenario A2. In comparison, under the condition of one-time irrigation once, an impressive yield of approximately 520 kg was achieved when the irrigation rate was 95 mm, which was the same irrigation standard as that in the observed period. However, the winter wheat yield at the irrigation rate of 105 mm, which was the highest test irrigation rate under the condition of one-time irrigation once, was not significantly higher than that at the irrigation rate of 95 mm. Therefore, a further increase in the irrigation rate under the condition of one-time irrigation once in scenario B2 is of little significance. The critical value of the irrigation rate of winter wheat in this area in scenario B2 was approximately 100 mm.
Under the condition of two-time irrigation, the winter wheat yield achieved in scenario B2 in the irrigation-rate simulation test was the same as that in the observed period for test plan No. 9. However, it was significantly higher than that in the observed period for test plans No. 10–No. 12 and was not significantly different from that in the observed period for test plans No. 13–No. 17. Moreover, in scenario B2, under the condition of two-time irrigation, the yield requirement per mu was satisfied when the irrigation rate was 95 mm. Furthermore, only one combination for this irrigation rate was used: 60 mm for the jointing period and 35 mm for the anthesis period. This situation was the same as that in the observed period but was different from that in scenario A2. This finding again indicated that the most efficient irrigation scheme should be selected according to the simulation results obtained under the condition of one-time irrigation.
The water footprint per unit yield for winter wheat in this area in scenario B2 was 0.37–0.51 m3/kg, of which the green and blue water footprints were 0.24–0.34 and 0.18–0.23 m3/kg, respectively. Therefore, the water footprint per unit yield for winter wheat in scenario B2 exhibited a slight increase compared with that in the base period, of which the green water footprint exhibited a remarkable increase and the blue water footprint exhibited a slight decrease. At the same irrigation rate, a higher yield could be achieved in scenario B2 than in the observed period.

4. Discussion

(1)
Simulation effects of SDSM tool for various meteorological indices
In this study, the statistical downscaling tool of SDSM was adopted to reduce the space resolution of GCM to the regional scale. The ocean–atmosphere coupled model of Had CM3 was used to generate the future climate in the future emission models of scenarios A2 and B2 among SRES scenarios proposed by IPCC. The SDSM model has good simulation effects for maximum and minimum temperatures, and accurate predictions could be made for future temperature change [34,35]. Meanwhile, this model was found to have poor inferior simulation effects for wind speed, humidity, sunshine hour, and precipitation compared with those for temperature indices, but its simulation accuracy remained higher than the basic standard value requirement of 0.5. This finding indicated that the simulated trends were reliable as a whole, but the simulation errors of process indices were greater than those of the temperature indices. Therefore, these indices cannot be used for calculations with strict requirements on daily sequences. This may be attributed to differences in predictor screening.
(2)
Regional suitability of the DSSAT model
According to the research findings, the DSSAT model can accurately estimate the crop variety genetic parameters for winter wheat in the piedmont plain area in Hebei Province. The calibrated variety parameters can be applied to the production simulation producing high-confidence simulation results and to the growth process simulation and yield prediction under different production conditions and field management measures for winter wheat in this area, achieving good overall performance. This finding is consistent with the result of a study [36]. However, the simulation effects were not the same under different irrigation conditions. The main differences were as follows. The simulation effects were relatively better under normal water and fertiliser conditions and slightly poorer under water and fertiliser stress conditions, as manifested by the insufficient sensitivity to water and fertiliser stress and low simulated change-rate relative to the actual observed value. The simulation effects were unsatisfactory under severe water deficit conditions, as evidenced by the high simulated yield relative to the actual observed value [37].
(3)
The optimal irrigation scheme for an ‘acceptable yield’
In the view of the restricted water resource and its storage in the piedmont plain area in Hebei Province, a high yield should not be the top priority of winter wheat production in this area under future climate conditions, and achieving an ‘acceptable yield’ should be the main objective [31,38,39]. In the production mode of ‘irrigation once in spring’, the irrigation rate of 95 mm in the jointing period was the optimal irrigation scheme, and this irrigation rate was the lowest to achieve the acceptable yield of 500 km per mu for winter wheat in this area. In the production mode of ‘irrigation twice in spring’, the combination of the irrigation rates of 60 mm in the jointing period and 35 mm in the anthesis period was the optimal irrigation scheme, and this combination of irrigation rates was the lowest rate to achieve the acceptable yield. In the piedmont plain area of Mount Taihang, an impressive yield could be achieved as long as the irrigation rate satisfied 60% of the normal irrigation demand in the key growth periods of winter wheat. Overall, 75–95 mm was the irrigation range of efficient water use for winter wheat in the piedmont plain area, whereas 95 mm was the critical value of the irrigation rate under the condition of one-time irrigation for winter wheat in the piedmont plain area. In this study, irrigation schemes at various irrigation rates were arranged and the yield and water use efficiency under various irrigation schemes were discussed. However, the resource constraints were not considered.
(4)
Solution of the SDSM tool for the insufficient simulation accuracy of daily sequences of precipitation data
The Pearson-III frequency curve was adopted to determine the normal years in the future period [39]. The relevant values of its meteorological characteristics were input into the daily data sequences of the normal years in the future period based on the proportion coefficient determined using the daily and annual data of the test site in the observed period. These values were used in future climate analyses for the typical years to solve the problem of an insufficient accuracy of daily sequence of precipitation data faced by the downscaling model of SDSM [25]. The DSSAT model was used to design irrigation tests at different irrigation rates and conduct simulation calculations for the irrigation rate and winter wheat yield in the future period. An integrated approach was employed to calculate the water footprint per unit yield and the green and blue water footprints.
This study adopted an integrated approach to use the global atmosphere downscaling model, crop model, and water evapo-transpiration model, and the local suitability of the relevant models was verified. The field irrigation scheme for winter wheat was improved when the condition of the ‘acceptable yield’ was achieved. The water footprint of the relevant area in the future period was predicted. In addition, an attempt was made to overcome the limitations of most existing calculation methods for water footprint, which is to focus on the estimation of the current situation and the examination of the historical trends.
From the perspective of acceptable yield, the 500 kg standard with ‘one-time spring irrigation’ in piedmont plains is reasonable. However, the actual irrigation rate in the production practice of winter wheat in Hebei Province is much higher than that in the technical guidelines and standard regulations. For instance, new planting units such as family farms and large planting households typically irrigate for 3 to 4 times, whereas traditional small farmers generally irrigate for 4 times or even 5 times. Only when the standard procedure is binding in practice can it truly play its role. The main reason for the unsatisfactory implementation is the irrigation cost. At present, the irrigation water in the primary winter wheat producing areas of Hebei Province is basically not priced separately, and only the electricity bills for pumping need to be paid. The cost-benefit ratio of irrigation makes it difficult for growers to adopt the water-limiting planting mode, which necessitates the reform of agricultural water pricing. However, when formulating policies, we must fully consider the particularity and vulnerability of food crops, and cannot simply stipulate the water price, as it is bound to increase the planting cost and aggravate the already-weak willingness to grow crops. Therefore, the reform of water pricing should first maintain the grain planting enthusiasm. Tiered water prices combined with water-saving subsidies are suggested. Intelligent control equipment should be installed for the irrigation wells, household management should be implemented, irrigation times and amount should be controlled through mobile APP or water cards, and the water usage quota should be distributed according to soil moisture and weather conditions. Certain compensation should also be given according to the difference between the yield under the water-saving mode and the yield from unlimited irrigation.
The piedmont plain area of Hebei Province is one of the most important major wheat producing areas in China. Once the ‘one-time spring irrigation’ technique is implemented on a large scale here, the impact of the acceptable yield on national food security also needs to be carefully investigated. The simulation test shows that after the application of the technique, the water footprint of winter wheat production in the piedmont plain area has been low. The future climate environment, as predicted by the downscaling model, may be even worse, indicating that the potential for further water saving by regulating the irrigation rate and system in this area is limited. Therefore, new ideas are needed for sustainable agricultural development and restoration of ecological resources. For a long time to come, with the continuous increase of industrial, household, and ecological water use, the problem of water shortage can only become more and more serious. Therefore, the adjustment of agricultural and industrial structures and planting modes is the inevitable course. It is suggested that the pursuit of winter wheat planting should be abandoned if possible, and the international grain market should be leveraged to supply domestic demand on the premise of fully maintaining grain reserves and production potentials.

5. Conclusions

Prediction of the water footprint of winter wheat production, using a combination of the SDSM model and DSSAT model in the piedmont plain area of Mount Taihang in Hebei Province under future climate conditions, was feasible. The overall trends of the 30-year future period from 2020 to 2049 relative to the base period of 1989–2018 were as follows. All the temperature indices exhibited an increase, although the extent of increase varied. The sunshine hour exhibited changes in different directions in different scenarios. It increased slightly in scenario A2 and decreased slightly in scenario B2. The wind speed exhibited a slight decrease. The precipitation exhibited changes in different directions in different scenarios, with a remarkable decrease in scenario A2 and a slight increase in scenario B2.
Simulation of the winter wheat planting process in the piedmont plain area in Hebei Province was feasible using the DSSAT model. On the basis of the irrigation rate; the sim-ulation yield generated using the DSSAT model; and the effective precipitation generated using the CROPWAT model, the Pearson-III frequency curve was used to determine the normal year in the future period. The relevant values of its climate characteristics were used in the future climate analysis for the typical years. The DSSAT model was used to design irrigation tests at different irrigation rates and to conduct simulation calculations for the irrigation rate and wheat yield in the future for winter wheat. Moreover, an integrated approach was employed to calculate the water footprint per unit yield and the green and blue water footprints. The water footprint per unit yield for winter wheat in this area in scenario A2 was 0.37–0.52 m3/kg, of which the green and blue water footprints were 0.17–0.28 and 0.20–0.24 m3/kg, respectively. In scenario B2, the water footprint per unit yield for winter wheat in this area was 0.37–0.51 m3/kg, of which the green and blue water footprints were 0.24–0.34 and 0.18–0.23 m3/kg, respectively. The water footprint of winter wheat production in this area was at a considerably low level, and the adjustment of the irrigation rate and regime exhibited a low potential in saving water.

Author Contributions

P.T. designed the research; Z.S., T.C., X.S. and H.W. performed the experiments; Z.S. analyzed the data; Z.S. wrote the manuscript; P.T. revised the manuscript. All authors have read and agreed to the published version of the manuscript.

Funding

This study was supported by the National Key Research and Development Project (2018YFD0300507).

Institutional Review Board Statement

Not applicable.

Informed Consent Statement

Informed consent was obtained from all subjects involved in the study.

Data Availability Statement

No new data were created or analyzed in this study. Data sharing is not applicable to this article.

Conflicts of Interest

The authors have declared that no conflict of interest exists.

References

  1. Galli, A.; Wiedmann, T.; Ercin, E.; Knoblauch, D.; Ewing, B.; Giljum, S. Integrating Ecological, Carbon and Water Footprint into a “Footprint Family” of Indicators: Definition and Role in Tracking Human Pressure on the Planet. Ecol. Indic. 2012, 16, 100–112. [Google Scholar] [CrossRef]
  2. Ministry of Water Resources People’s Republic of China. China Water Resources Bulletin; Water&Power Press: Beijing, China, 2017.
  3. Hoekstra, A.Y.; Chapagain, A.K.; Aldaya, M.M. The Water Footprint Assessment Manual; Science Press: Beijing, China, 2012. [Google Scholar]
  4. Jeswani, H.K.; Burkinshaw, R.; Azapagic, A. Environmental Sustainability Issues in the Food–Energy–Water Nexus: Breakfast Cereals and Snacks. Sustain. Prod. Consum. 2015, 2, 17–28. [Google Scholar] [CrossRef]
  5. Hoekstra, A.Y.; Mekonnen, M.M.; Chapagain, A.K.; Mathews, R.E.; Richter, B.D. Global Monthly Water Scarcity: Blue Water Footprints Versus Blue Water Availability. PLoS ONE 2012, 7, e32688. [Google Scholar] [CrossRef]
  6. Allan, J.A. Handbook of Land and Water Grabs in Africa: Foreign Direct Investment and Food and Water Security; ‎University of London Press: London, UK, 1993. [Google Scholar]
  7. Hoekstra, A.Y. Virtual Water Trade: Proceedings of the International Expert Meeting on Virtual Water Trade; IHE Delft: Delft, The Netherlands, 2003. [Google Scholar]
  8. Xie, P.; Zhuo, L.; Yang, X.; Huang, H.; Gao, X.; Wu, P. Spatial-Temporal Variations in Blue and Green Water Resources, Water Footprints and Water Scarcities in a Large River Basin: A Case for the Yellow River Basin. J. Hydrol. 2020, 590, 125222. [Google Scholar] [CrossRef]
  9. Moghazy, N.E. Handbook of Land and Water Grabs in Africa: Foreign Direct Investment and Food and Water Security. Eur. J. Dev. Res. 2013, 25, 842–844. [Google Scholar] [CrossRef]
  10. Rajakal, J.P.; Ng, D.K.S.; Tan, R.R.; Andiappan, V.; Wan, Y.K. Multi-Objective Expansion Analysis for Sustainable Agro-Industrial Value Chains Based on Profit, Carbon and Water Footprint. J. Clean. Prod. 2021, 288, 125117. [Google Scholar] [CrossRef]
  11. Chapagain, A.K.; Hoekstra, A.Y.; Savenije, H.H.G.; Gautam, R. The Water Footprint of Cotton Consumption: An Assessment of the Impact of Worldwide Consumption of Cotton Products on the Water Resources in the Cotton Producing Countries. Ecol. Econ. 2006, 60, 186–203. [Google Scholar] [CrossRef]
  12. Abbade, E.B. Land and Water Footprints Associated with Rice and Maize Losses in Brazil. Land Use Policy 2020, 99, 105106. [Google Scholar] [CrossRef]
  13. Suebkam, R.; TreloGes, V.; Konyai, S. The Application of Deficit Water and Fertiliser Upon Yield and Water Footprint in Baby Corn. Int. J. Environ. Rural dev. 2015, 6, 159–164. [Google Scholar] [CrossRef]
  14. Hoekstra, A.Y.; Hung, P.Q. Globalisation of Water Resources: International Virtual Water Flows in Relation to Crop Trade. Glob. Environ. Chang. 2005, 15, 45–56. [Google Scholar] [CrossRef]
  15. Hoekstra, A.Y.; Chapagain, A.K. The Water Footprints of Morocco and the Netherlands: Global Water Use as a Result of Domestic Consumption of Agricultural Commodities. Ecol. Econ. 2007, 64, 143–151. [Google Scholar] [CrossRef]
  16. Zheng, X.; Qin, L.; He, H. Impacts of Climatic and Agricultural Input Factors on the Water Footprint of Crop Production in Jilin Province, China. Sustainability 2020, 12, 6904. [Google Scholar] [CrossRef]
  17. Hess, T.; Chatterton, J.; Daccache, A.; Williams, A. The Impact of Changing Food Choices on the Blue Water Scarcity Footprint and Greenhouse Gas Emissions of the British Diet: The Example of Potato, Pasta and Rice. J. Clean. Prod. 2016, 112, 4558–4568. [Google Scholar] [CrossRef] [Green Version]
  18. Ridoutt, B.G.; Eady, S.J.; Sellahewa, J.; Simons, L.; Bektash, R. Water Footprinting at the Product Brand Level: Case Study and Future Challenges. J. Clean. Prod. 2009, 17, 1228–1235. [Google Scholar] [CrossRef]
  19. Kong, Y.; He, W.; Yuan, L.; Shen, J.; An, M.; Degefu, D.M.; Gao, X.; Zhang, Z.; Sun, F.; Wan, Z. Decoupling Analysis of Water Footprint and Economic Growth: A Case Study of Beijing–Tianjin–Hebei Region from 2004 to 2017. Int. J. Environ. Res. Public Health 2019, 16, 4837. [Google Scholar] [CrossRef] [Green Version]
  20. Chu, Y.; Shen, Y.; Yuan, Z. Water Footprint of Crop Production for Different Crop Structures in the Hebei Southern Plain, North China. Hydrol. Earth Syst. Sci. 2017, 21, 3061–3069. [Google Scholar] [CrossRef] [Green Version]
  21. Thomas, A. Spatial and Temporal Characteristics of Potential Evapotranspiration Trends over China. Int. J. Climatol. 2000, 20, 381–396. [Google Scholar] [CrossRef]
  22. He, D.; Liu, Y.; Pan, Z.; An, P.; Wang, L.; Dong, Z.; Zhang, J.; Pan, X.; Zhao, P. Climate Change and Its Effect on Reference Crop Evapotranspiration in Central and Western Inner Mongolia during 1961–2009. Front. Earth Sci. 2013, 7, 417–428. [Google Scholar] [CrossRef]
  23. Murphy, J. Predictions of Climate Change over Europe Using Statistical and Dynamical Downscaling Techniques. Int. J. Climatol. 2000, 20, 489–501. [Google Scholar] [CrossRef]
  24. Wang, L.; Zhao, J.; Chen, S.Y. Analysis of Ecosystem Carbon Sources/Sinks and Carbon Footprint in Farmland Ecosystem of Shandong Province. J. China Agric. Univ. 2016, 21, 133–141. [Google Scholar]
  25. Wilby, R.L.; Dawson, C.W.; Barrow, E.M. Sdsm—A Decision Support Tool for the Assessment of Regional Climate Change Impacts. Environ. Model. Softw. 2002, 17, 145–157. [Google Scholar] [CrossRef]
  26. Patil, D.; Patel, H. Assessment of Mustard Yield Response, Soil Moisture Depletion and Yield Reduction under Different Irrigation Levels Using Cropwat Model. Trends Biosci. 2015, 8, 3091–3095. [Google Scholar]
  27. Kingra, P. Climate Variability Impact on Reference Crop Evapotranspiration Computed Using Cropwat Model. Agric. Res. J. 2018, 55, 265–273. [Google Scholar] [CrossRef]
  28. Dang, T.A. Establishment of Irrigation Schedule for Rice Cropping Seasons in the Long Xuyen Quadrangle, Vietnam Using Cropwat Model. Indian J. Agric. Res. 2018, 52, 448–451. [Google Scholar] [CrossRef]
  29. Jeong, H.; Jang, T.; Seong, C.; Park, S. Assessing Nitrogen Fertiliser Rates and Split Applications Using the DSSAT Model for Rice Irrigated with Urban Wastewater. Agric. Water Manag. 2014, 141, 1–9. [Google Scholar] [CrossRef]
  30. Liu, Z.C.; Wang, C.; Bi, R.T.; Zhu, H.F.; Yang, W.D. Winter Wheat Yield Estimation Based on Assimilated Sentinel-2 Images with the CERES-Wheat Model. J. Integr. Agric. 2021, 20, 1958–1968. [Google Scholar] [CrossRef]
  31. Wang, W.W.; Wang, J.G.; Cao, X.C. Water Use Efficiency and Sensitivity Assessment for Agricultural Production System from the Water Footprint Perspective. Sustainability 2020, 12, 9665. [Google Scholar] [CrossRef]
  32. Serhan, Y.; Levent, Ş. Yields and Water Footprints of Sunflower and Winter Wheat under Different Climate Projections. J. Clean. Prod. 2021, 298, 126780. [Google Scholar] [CrossRef]
  33. Ali, S.R.; Khan, J.N.; Dar, M.U.D.; Bhat, S.A.; Mehraj, I. Modeling Climate Change Projections for Ferozpur Sub-Catchment of Jhelum Sub-Basin of Kashmir Valley. Int. J. Environ. Clim. Chang. 2018, 8, 39–52. [Google Scholar] [CrossRef] [Green Version]
  34. Guo, B.B.; Zhang, J.; Xu, T.B. Comparison of Two Statistical Climate Downscaling Models: A Case Study in the Beijing Region, China. Int. J. Water 2018, 12, 22–38. [Google Scholar] [CrossRef]
  35. Zhang, D. Study on the Mechanism of High-Yield and Water-Saving Technology for Winter Wheat and Optimum Agricultural Managements Using DSSAT Model. Master’s Thesis, Hebei Agricultural University, Baoding, China, 2018. [Google Scholar]
  36. Xiong, S.P.; Wu, K.Y.; Wang, X.C.; Zhang, J.; Du, P.; Wu, Y.X.; Ma, X.M. Analysis of Root Absorption Characteristics and Nitrogen Utilization of Wheat Genotypes with Different N Efficiency. Agric. Sci. China 2016, 49, 2267–2279. [Google Scholar]
  37. Tang, X.P.; Song, N.; Chen, Z.F.; Wang, J. Spatial and Temporal Distribution of ET0 Under Main Climate Scenarios in Future Across Huang-Huai-Hai Plain. Trans. CSAE 2016, 32, 168–176. [Google Scholar] [CrossRef]
  38. Du, L.; Xu, C.C.; Yin, X.; Ti, J.S.; Chen, F. Impact of Climate Change on Crop Evaportranspiration and Water Ecological Adaptability of Winter Wheat in Hebei Lowland Plain. J. China Agric. Univ. 2017, 22, 1–9. [Google Scholar]
  39. Du, X.Y. Study on Optimal Irrigation Scheme of Winter Wheat in North China Based on DSSAT Model-A Case Study of Luancheng. Master’s Thesis, Hebei Normal University, Shijiazhuang, China, 2016. [Google Scholar]
Figure 1. Comparison between the measured and simulated values in the piedmont plain area of Hebei Province during the verification period. Note: (A) The wind speed; (B) the precipitation; (C) the average temperature; (D) the humidity; (E) the maximum temperature; and (F) the minimum temperature.
Water 13 02640 g001
Figure 2. Pearson-Ⅲ frequency curve of rainfall in the growth period of winter wheat in Xinji city for nearly 30 years.
Water 13 02640 g002
Table 1. Experiments on the irrigation and nitrogen application for winter wheat at Xinji city (2015–2017).
No.ItemTotal Irrigation
(mm)
N Application
(mm)
Before SowingJointingAnthesis
IrrigationN ApplicationIrrigationN ApplicationIrrigationN Application
1W0N000000000
2W0N120012001200000
3W0N240024002400000
4W1N06000060000
5W1N12060120060606000
6W1N2406024001206012000
7W2N0120000600600
8W2N1201201200606060600
9W2N240120240012060120600
Table 2. Physical and chemical properties of soil at the Xinji test site.
Test SiteOrganic Matter
g/kg−1
Alkali-Hydrolyzable Nitrogen
mg/kg−1
Available Phosphorus
mg/kg−1
Available Potassium
mg/kg−1
Water Content
(%)
Soil Bulk Density
g/cm3
Wilting CoefficientField Water Capacity
Xinji18.760.4837.05179.7416.311.24–1.390.15–0.170.29–0.31
Table 3. Simulation results of scale reduction in the piedmont plain area in Hebei Province.
PeriodEvaluation IndexMax Temperature (°C)Min Temperature (°C)Average Wind Speed
(m/s)
Relative HumiditySunshine Hour
(h)
Precipitation
Calibration periodExplained variance
R-square
0.740.710.510.570.530.58
Verification periodExplained variance R-square0.720.630.520.590.530.58
Table 4. Future climate of the piedmont plain area in Hebei Province.
Piedmont Plain AreaMaximum Temperature
(°C)
Minimum Temperature
(°C)
Mean Temperature
(°C)
HumiditySunshine Hour
(h)
Wind Speed
(m/s)
Precipitation
1989–201819.659.3914.0560.566.921.60462.84
2020–2049 (A2)20.059.4514.2262.607.041.54455.32
2020–2049 (B2)20.039.4114.1963.196.841.56469.70
Table 5. Parameters of DSSAT winter wheat variety, Jimai 585.
Genetic CoefficientMeaningRangeValue
P1VNumber of days in the vernalization stage at the optimum temperature (d)0~6055.2
P1DInfluence factors of the photoperiod (%·10 h−1)0~200130.7
P5Accumulated temperature in the grain filling period (°C·d)100~999752
G1Number of grains per unit mass at the canopy in the anthesis period (g)10~5019.81
G2Size of standard grain under the ideal conditions (mg)10~8045
G3Mass of single mature plant under the standard non-stress conditions (g, dry weight)0.5~8.01.5
PHINTPhyllochron (°C)30~150116.7
Table 6. Periodic simulation effect of the Xinji city winter wheat rate based on DSSAT (2015–2016).
ItemActual ValueSim ValueRMSERRMSEARER2
Anthesis (d)2001982.521.27%1%0.999
Maturity (d)2362383.461.46%0.80%0.999
Mat Yield (kg/hm−2)61346598722.0510.94%7.56%0.989
Table 7. Simulation effects of the Xinji city winter wheat validation period based on DSSAT (2016–2017).
ItemActual ValueSim ValueRMSERRMSEARER2
Anthesis (d)2032021.730.86%0%0.999
Maturity (d)2392402.310.96%0.42%0.999
Mat Yield (kg/hm−2)63716648549.428.26%4.35%0.955
Table 8. Effective precipitation and irrigation water demand during the winter wheat growth period for the future climate model of the piedmont plain area.
TimeETcEff RainIrr. Req
Ymm/decmm/decmm/dec
1989–2018425.8127.7298.9
2020–2049 (A2)424.8126.2302.8
2020–2049 (B2)431.7151.4274.7
Table 9. Yield simulation of scenario A2 in the piedmont plain area.
No.Item30 March
mm
5 May
mm
Normal Year
kg/ha
1WO135 5368
2WO245 5471
3WO355 5789
4WO465 6621
5WO575 6811
6WO685 7104
7WO795 7359
8WO8105 7531
9WT135356007
10WT235606115
11WT335757414
12WT460357631
13WT560608152
14WT660758477
15WT775357789
16WT875608432
17WT975758808
Table 10. Yield simulation of the B2 scenario in the piedmont plain area.
No.Item30 March
mm
5 May
mm
Normal Year
kg/ha
1WO135 5169
2WO245 5312
3WO355 5711
4WO465 5979
5WO575 6852
6WO685 7497
7WO795 7858
8WO8105 7918
9WT135356131
10WT235607145
11WT335757219
12WT460357705
13WT560607987
14WT660758328
15WT775357814
16WT875608478
17WT975758508
Publisher’s Note: MDPI stays neutral with regard to jurisdictional claims in published maps and institutional affiliations.

