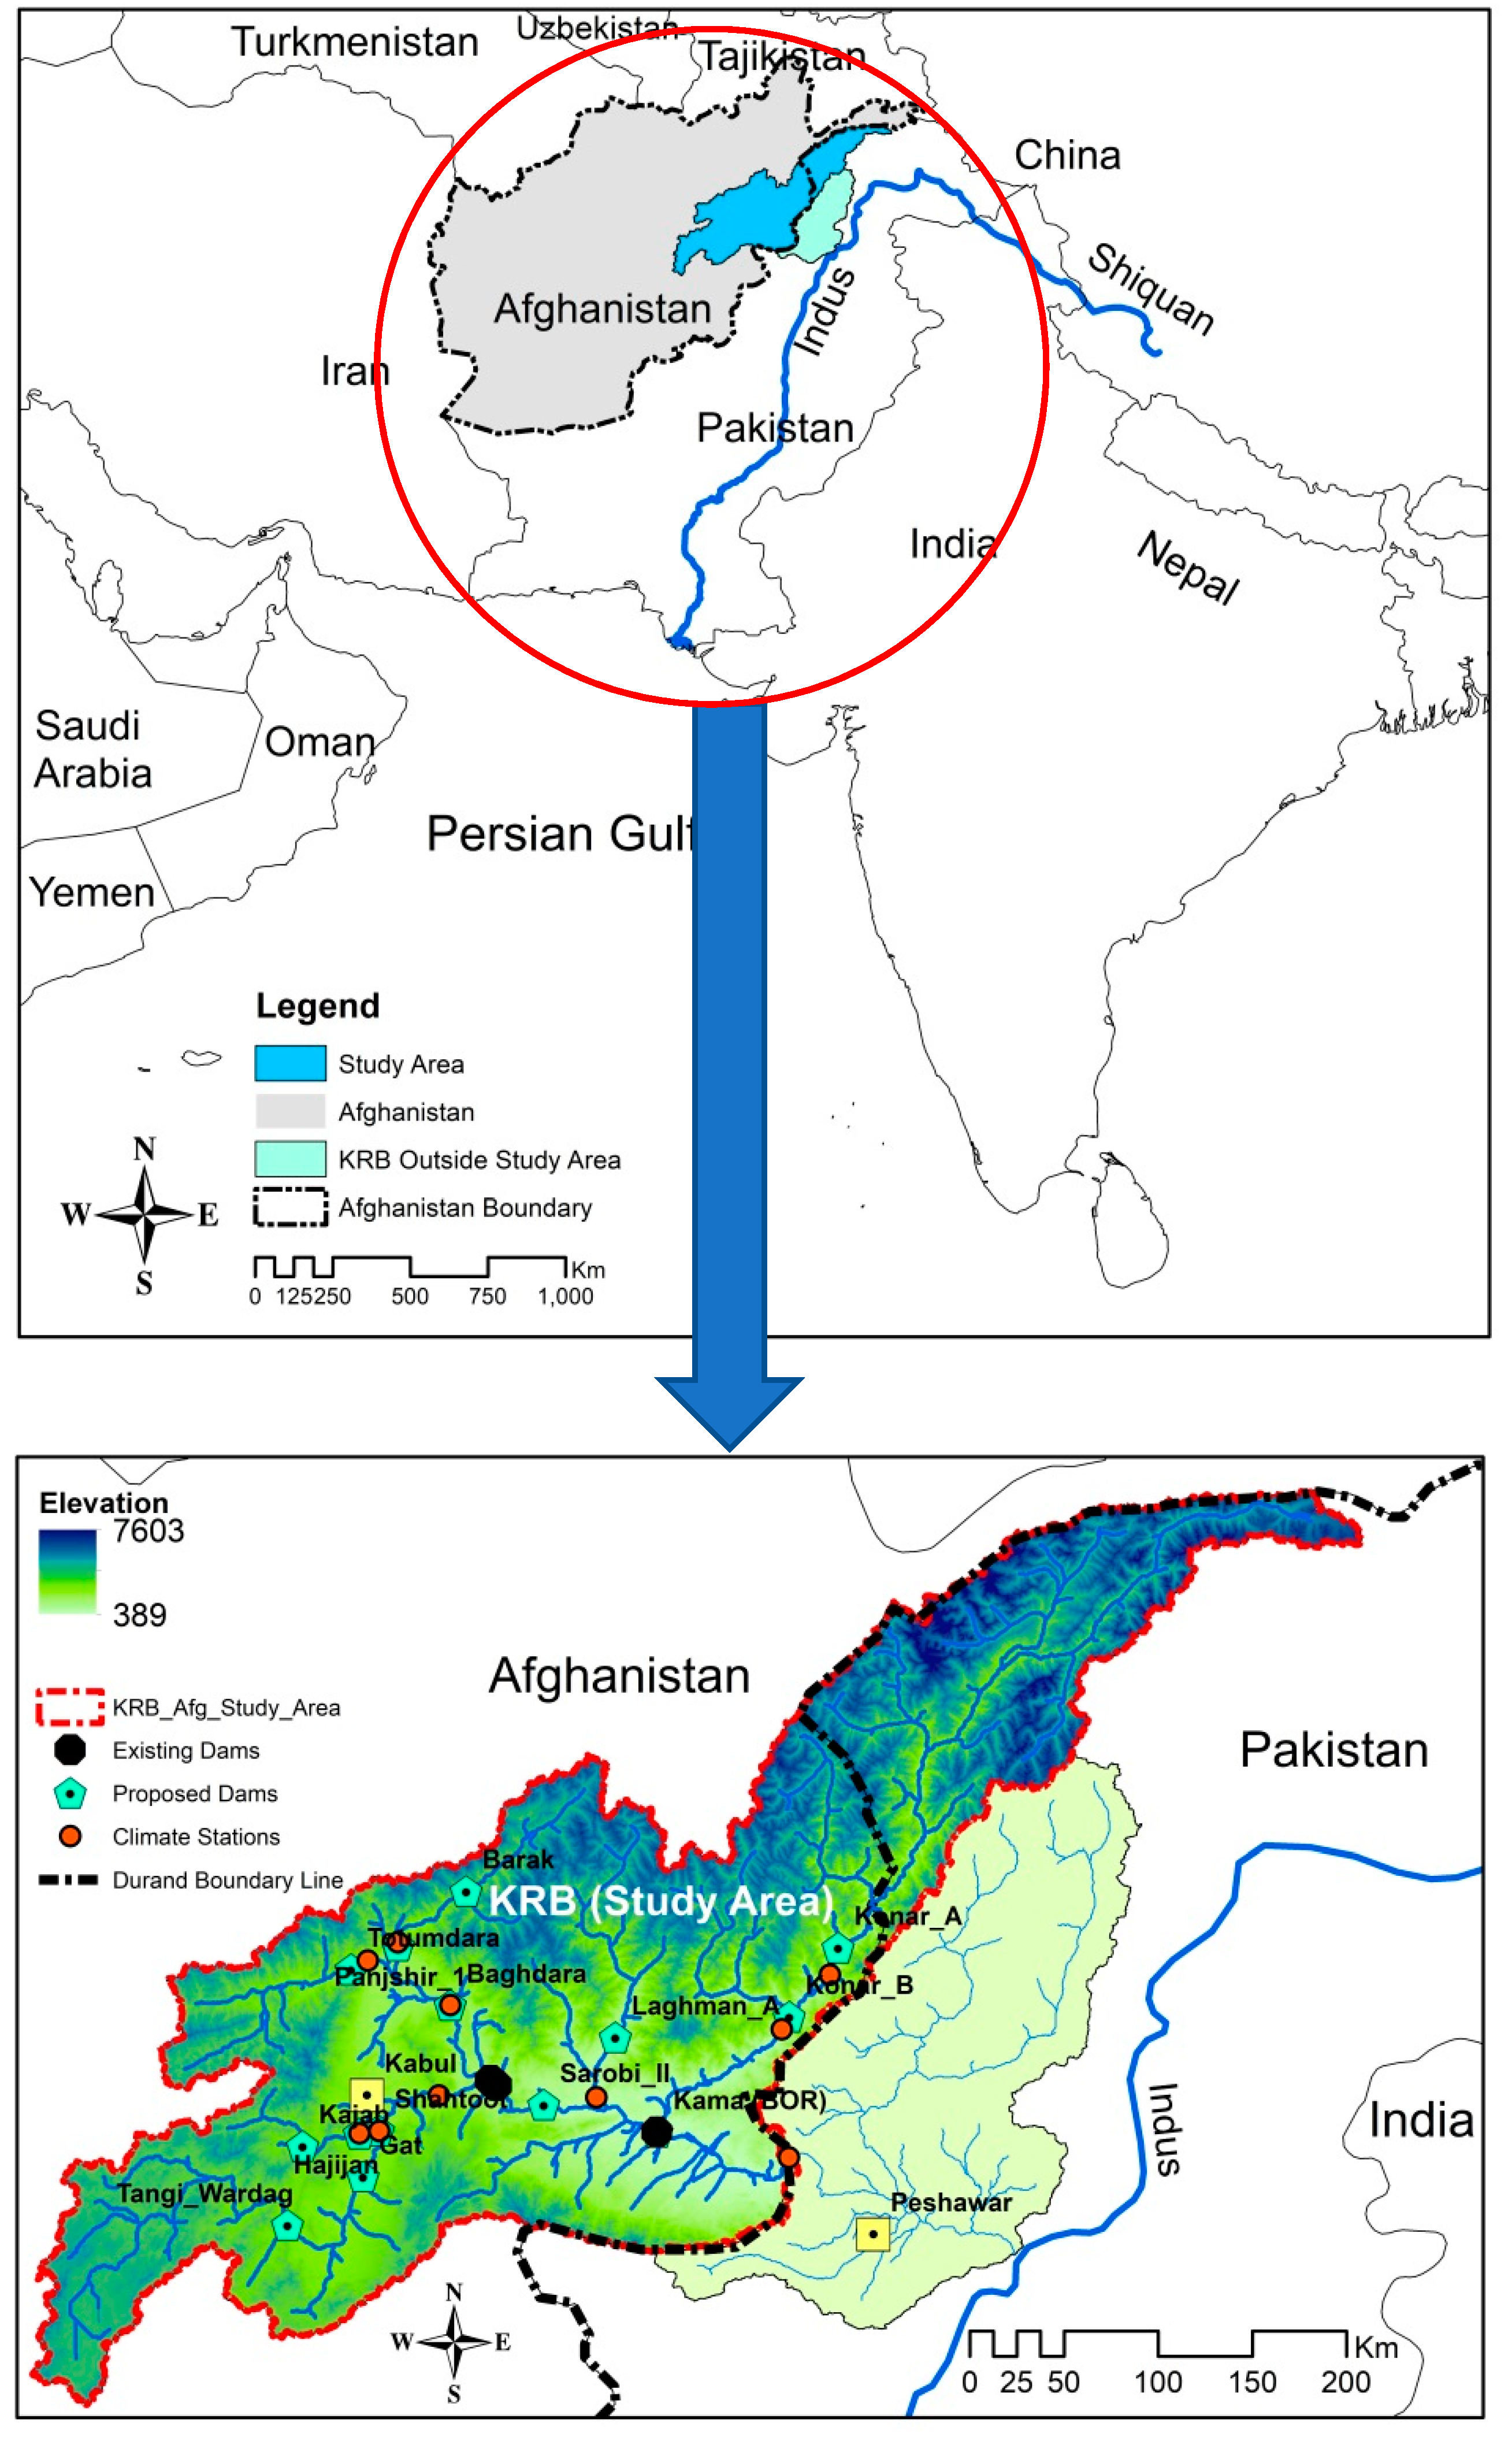
Article

The Role of Large Dams in a Transboundary Drought Management Co-Operation Framework—Case Study of the Kabul River Basin

1
School of Engineering, University of Guelph, Guelph, ON N1G 2W1, Canada
2
Department of Geography, Environmental & Geomatics, University of Guelph, Guelph, ON N1G 2W1, Canada
*
Author to whom correspondence should be addressed.
Water 2021, 13(19), 2628; https://doi.org/10.3390/w13192628
Submission received: 6 August 2021 / Revised: 18 September 2021 / Accepted: 19 September 2021 / Published: 24 September 2021
(This article belongs to the Section Water Resources Management, Policy and Governance)

Abstract

:
Hydrologic drought is a frequent phenomenon in the transboundary Kabul River Basin (KRB), the vital resource shared between the two nations of Afghanistan and Pakistan. While the KRB has vast water resources, these resources are subject to extreme hydrologic events and, as a result, are not adequately managed to deal with the stress during drought conditions in the transboundary setting with no formal agreement or treaty. Rapid population growth and increases in agricultural land will require balanced water distribution to meet the array of needs. The Soil and Water Assessment Tool (SWAT) is used to evaluate distribution options for flow frequencies under existing and proposed large dams in the headwaters of the KRB. The calibrated SWAT streamflow results are employed for statistical analyses of the Standardized Streamflow Index (SSI) and Annual Cumulative Deficit Volume (ACDV) to investigate hydrologic drought time series and identify the role of proposed dams to be used for drought mitigation. Based on the SSI, proposed dams can provide additional storage that will partially address hydrologic droughts in the future. At the same time, restrictions on agricultural land expansion and water intakes are other measures to facilitate balanced water resource availability. This study discusses the intricacies of transboundary conflict and cooperation, water rights, and drought risk management; as well, recommendations for a KRB transboundary Drought Task Force (DTF) between Afghanistan and Pakistan are provided, to develop a science-based policy for using the stored waters in large dams for drought relief, fairly and transparency.

1. Introduction

The Kabul River Basin (KRB), due to its geographical location, complex steep terrain, and aggregated population growth, is a basin that experiences extreme hydrologic events from catastrophic floods to extreme droughts [1]. Seasonal droughts directly impact the annual agricultural crop yield resulting in lower economic returns and loss of profit. The results of extended drought events for more than several months go beyond financial losses and impact human societies in terms of access to drinking and industrial water resources [2,3]. The KRB hydrologic regime is affected by ongoing climate change, as a complex and steep terrain with annual climate variations that range from extreme cold to extreme hot temperatures. An example of extreme climate variations can be seen by a ±15 °C difference in seasonal temperatures within a 200 km radius of Kabul City.
Hydrologic drought is a natural phenomenon that affects people, agriculture, and livelihoods. Drought is an occurrence when water availability is significantly below the accepted truncation period over a long period [4]. Due to the complexity of occurrence, duration, spatial extent, severity, and spatial characteristics, droughts are challenging to characterize [5,6]. There are four types of droughts, according to many scholars:
(a)
Climatic drought—an abnormal decrease in rainfall that may result in streamflow deficit;
(b)
Hydrologic drought—a phenomenon when the streamflow is below commonly identified levels;
(c)
Agricultural drought—seasonal drought that affects the seasonal agricultural crop yield;
(d)
Socioeconomic drought—a combination of two or more types of droughts that impact human society and livelihoods [7].
Since the KRB experienced many hydrologic droughts between 1940 and 1960 [8], this study puts emphasis on hydrologic drought. In basins such as KRB, the higher altitudes often experience cold weather and below zero temperatures. Even if there is no precipitation, below zero temperatures may also cause hydrologic drought due to snow accumulation, freezing soils and low percolation [9]. The International Panel on Climate Change (IPCC) predicts that high altitude areas within any basins will have a 10–40% increase in annual runoff. In the semi-arid and mid-altitude regions, according to the IPCC prediction, the annual runoff will decrease by 10–30%. Historical precipitation and streamflow indicate that the KRB will have increased runoff in high altitudes and severe hydrologic droughts in the mid and low altitudes. In response, a remedy for water conservation in the KRB should involve a series of actions, including the construction of an array of small and large dams, regulations and controls on land expansion, as well as management practices. Although constructing new dams can resolve the low flow and hydrologic drought issue, environmental and social impacts brought by the dam construction should not be overlooked. In the latter part of this paper, a discussion of benefits and potential impacts of dam construction is provided. Since hydrologic drought is related to the balance of accepted historical flows and flows during the drought period, the quantification of drought using computational and statistical analyses becomes possible, as described herein.
The Kabul River is a major tributary of the Indus River and plays a vital role in the lives of over 25 million people in Afghanistan and Pakistan [1]. The Kabul River contributes 9.2% of Indus flows for the annual average (19.35 billion m3) of the Indus River water at its Dakah outlet [10]. The KRB is a well-known basin with vast water resources as recognized by many scholars [11,12,13,14,15,16,17,18,19]. However, despite the vast water availability per capita, the KRB experiences regular seasonal and annual hydrologic droughts. This is mainly due to the steep terrain, temporal variations (causing flash floods) and extreme high flows in the peak flow which can leave the rest of the year with low flow.
The main goal of this paper is to study the impacts of climate change on the KRB flow regime and investigate the benefits of the proposed reservoirs to retain water for the purposes of low flow augmentation. The issue of ‘steady’ flow to Pakistan from the Dakah outlet is a transboundary matter and the low flow has always been a matter of contention between the two nations. These contentions and grievances are more visible during hydrologic drought events.
To assess the options, the role of several proposed dams in the KRB is evaluated in this research, based on a series of modeling and statistical tools coupled with the policy and economic applicability. The modeling results provide an opportunity to determine the role of climate change on flow regime and, in particular, the low flow and how the water retention in a series of proposed reservoirs can contribute to the mitigation of long-term hydrologic droughts. The results can assist the policy makers, economic development entities, and the governments to cooperatively manage the flow regimes and provide incentives for an equitable participation in the process. The issues of regulatory control on land expansion, permission to take water, and improving management practices are key components of a transboundary cooperative framework.

2. Materials and Methods

2.1. Study Area

The KRB is located between longitude 67°40′ to 71°42′ E and latitude 33°33′ to 36°02′ N. The area of interest of the KRB in this study drains through the Dakah outlet into Pakistan, including ~53,150 km2 of lands on the Afghanistan side [13] and ~16,119 km2 in the Konar-Pakistan area that drains into Afghanistan [16]. The study area is distributed among five major catchment areas with distinct geographical features: the Logar-Upper Kabul sub-basin, Panjshir sub-basin, Lower Kabul sub-basin, Konar (Afghanistan) sub-basin, and Konar (Pakistan) sub-basin [15,20]. The Kabul River extends ~700 km from the origin to the Indus River junction. The Kabul River originates from the Sanglakh Range and flows eastward and runs through Kabul City and Jalalabad City before crossing the Durand Boundary Line (DBL) near the Laalpur Nangarhar Province, Afghanistan. The Kabul River crosses the DBL near the Dakah flow station in Afghanistan and then flows ~140 km further to the Indus River at Attock.
The KRB is the most populous sub-basin of Afghanistan and Pakistan’s most urbanized regions [13]. There are six major cities in the KRB (Afghanistan) [21], namely Kabul, Jalalabad, Charikar, Mehtarlam, Pule Alam, and Jabal Saraj, with a ~6 million population that benefits from the basin waters [21]. There are also six major cities on the Pakistan side of the basin, with most of them being in the vicinity of the Kabul River and its main tributaries. There are three existing dams (Naghlu, Sarobi, and Darunta) in the study area of the KRB used for power generation, agriculture irrigation, and municipal water use (Figure 1).
The KRB has a semi-arid and continental climate with elevations ranging from 300 m (ab. MSL) at the outlet to over 7000 m (ab. MSL) in the Hindukush Himalaya (HKH) Mountains, which are to the north of the KRB. The HKH Mountains are mostly covered with bare rocks, permanent snow, and glaciers above the altitude of 5000 m [11]. Approximately 2.3% of the total KRB area is covered by glaciers [1]. The average annual precipitation in the KRB ranges from 200 mm in the lower elevation to 3000 mm in the HKH mountains [22,23]. Regions of Peshawar, Nowshera, and Charsaddah in Pakistan are mainly irrigated with Kabul River water on 80.0%, 47.4%, and 84.7% of its total irrigated land, respectively [14].
Over 80% of the area within Afghanistan is irrigated by river or rain, and the remainder is under groundwater-based irrigation [24]. Afghanistan’s annual renewable water resources are 2019 m3/capita on average [24]. Hydrologic droughts, even for short periods, can have a dire impact on the population and livelihood. Climate change, including variations of precipitation and streamflow, is real and undeniable [25,26,27,28]. Since the agricultural lands are located in the mid and lower elevations, the effects of reductions in flow during hydrologic drought are substantial. Additionally, the flow is a major component of the hydrologic cycle. Hence, mitigation measures are needed urgently. The report provided by the World Bank (WB) in 2010 concluded that water storage sites are required to store excess water in the KRB depending on economic justifications. Some existing and proposed dams are listed in Table 1 [29].
The scope of strategic options for the development of KRB from the WB recommends seven storage projects with hydropower options, four storage projects without hydropower options, and two barrages on the Panjshir, Logar, Ghorband, Maidan, Kabul, Alingar, and Konar Rivers to meet the need for hydropower, urban water supply, and irrigation water demand [29]. The locations of these WB proposed dams are shown in Figure 1, as well as the three existing dams.

2.2. Methods

Ahmadi et al. (2019) described two groups of drought identification methods: (a) a probability and statistical calculation-based method, and (b) a threshold-based method (constant percentile of annual long-term cumulative frequency distribution and variable threshold). Both of the Ahmadi et al. methods require long time series of hydro-meteorological data. The variable method requires the daily quantiles calculation for the streamflow duration curve over the entire observation period [30]. Another important aspect of drought identification and monitoring is the drought termination. The end of a drought is the critical time during which water resource managers urgently require information on the replenishment of supplies [31]. Drought termination is associated with notable hydro-meteorological events, making the end of drought far more critical than the drought itself [31]
The variable threshold considers the short-term drought identification and recovery, and the drought termination is looking at a specific timeline of a hydrologic events and are important knowledge for local managers and agricultural community.
This study is more focused on the longer hydrologic drought ignoring shorter events [32] and is concentrated on the policy formulation and transboundary efforts in drought management during the entirety of this hydrologic event, including occurrence, termination, and recovery.
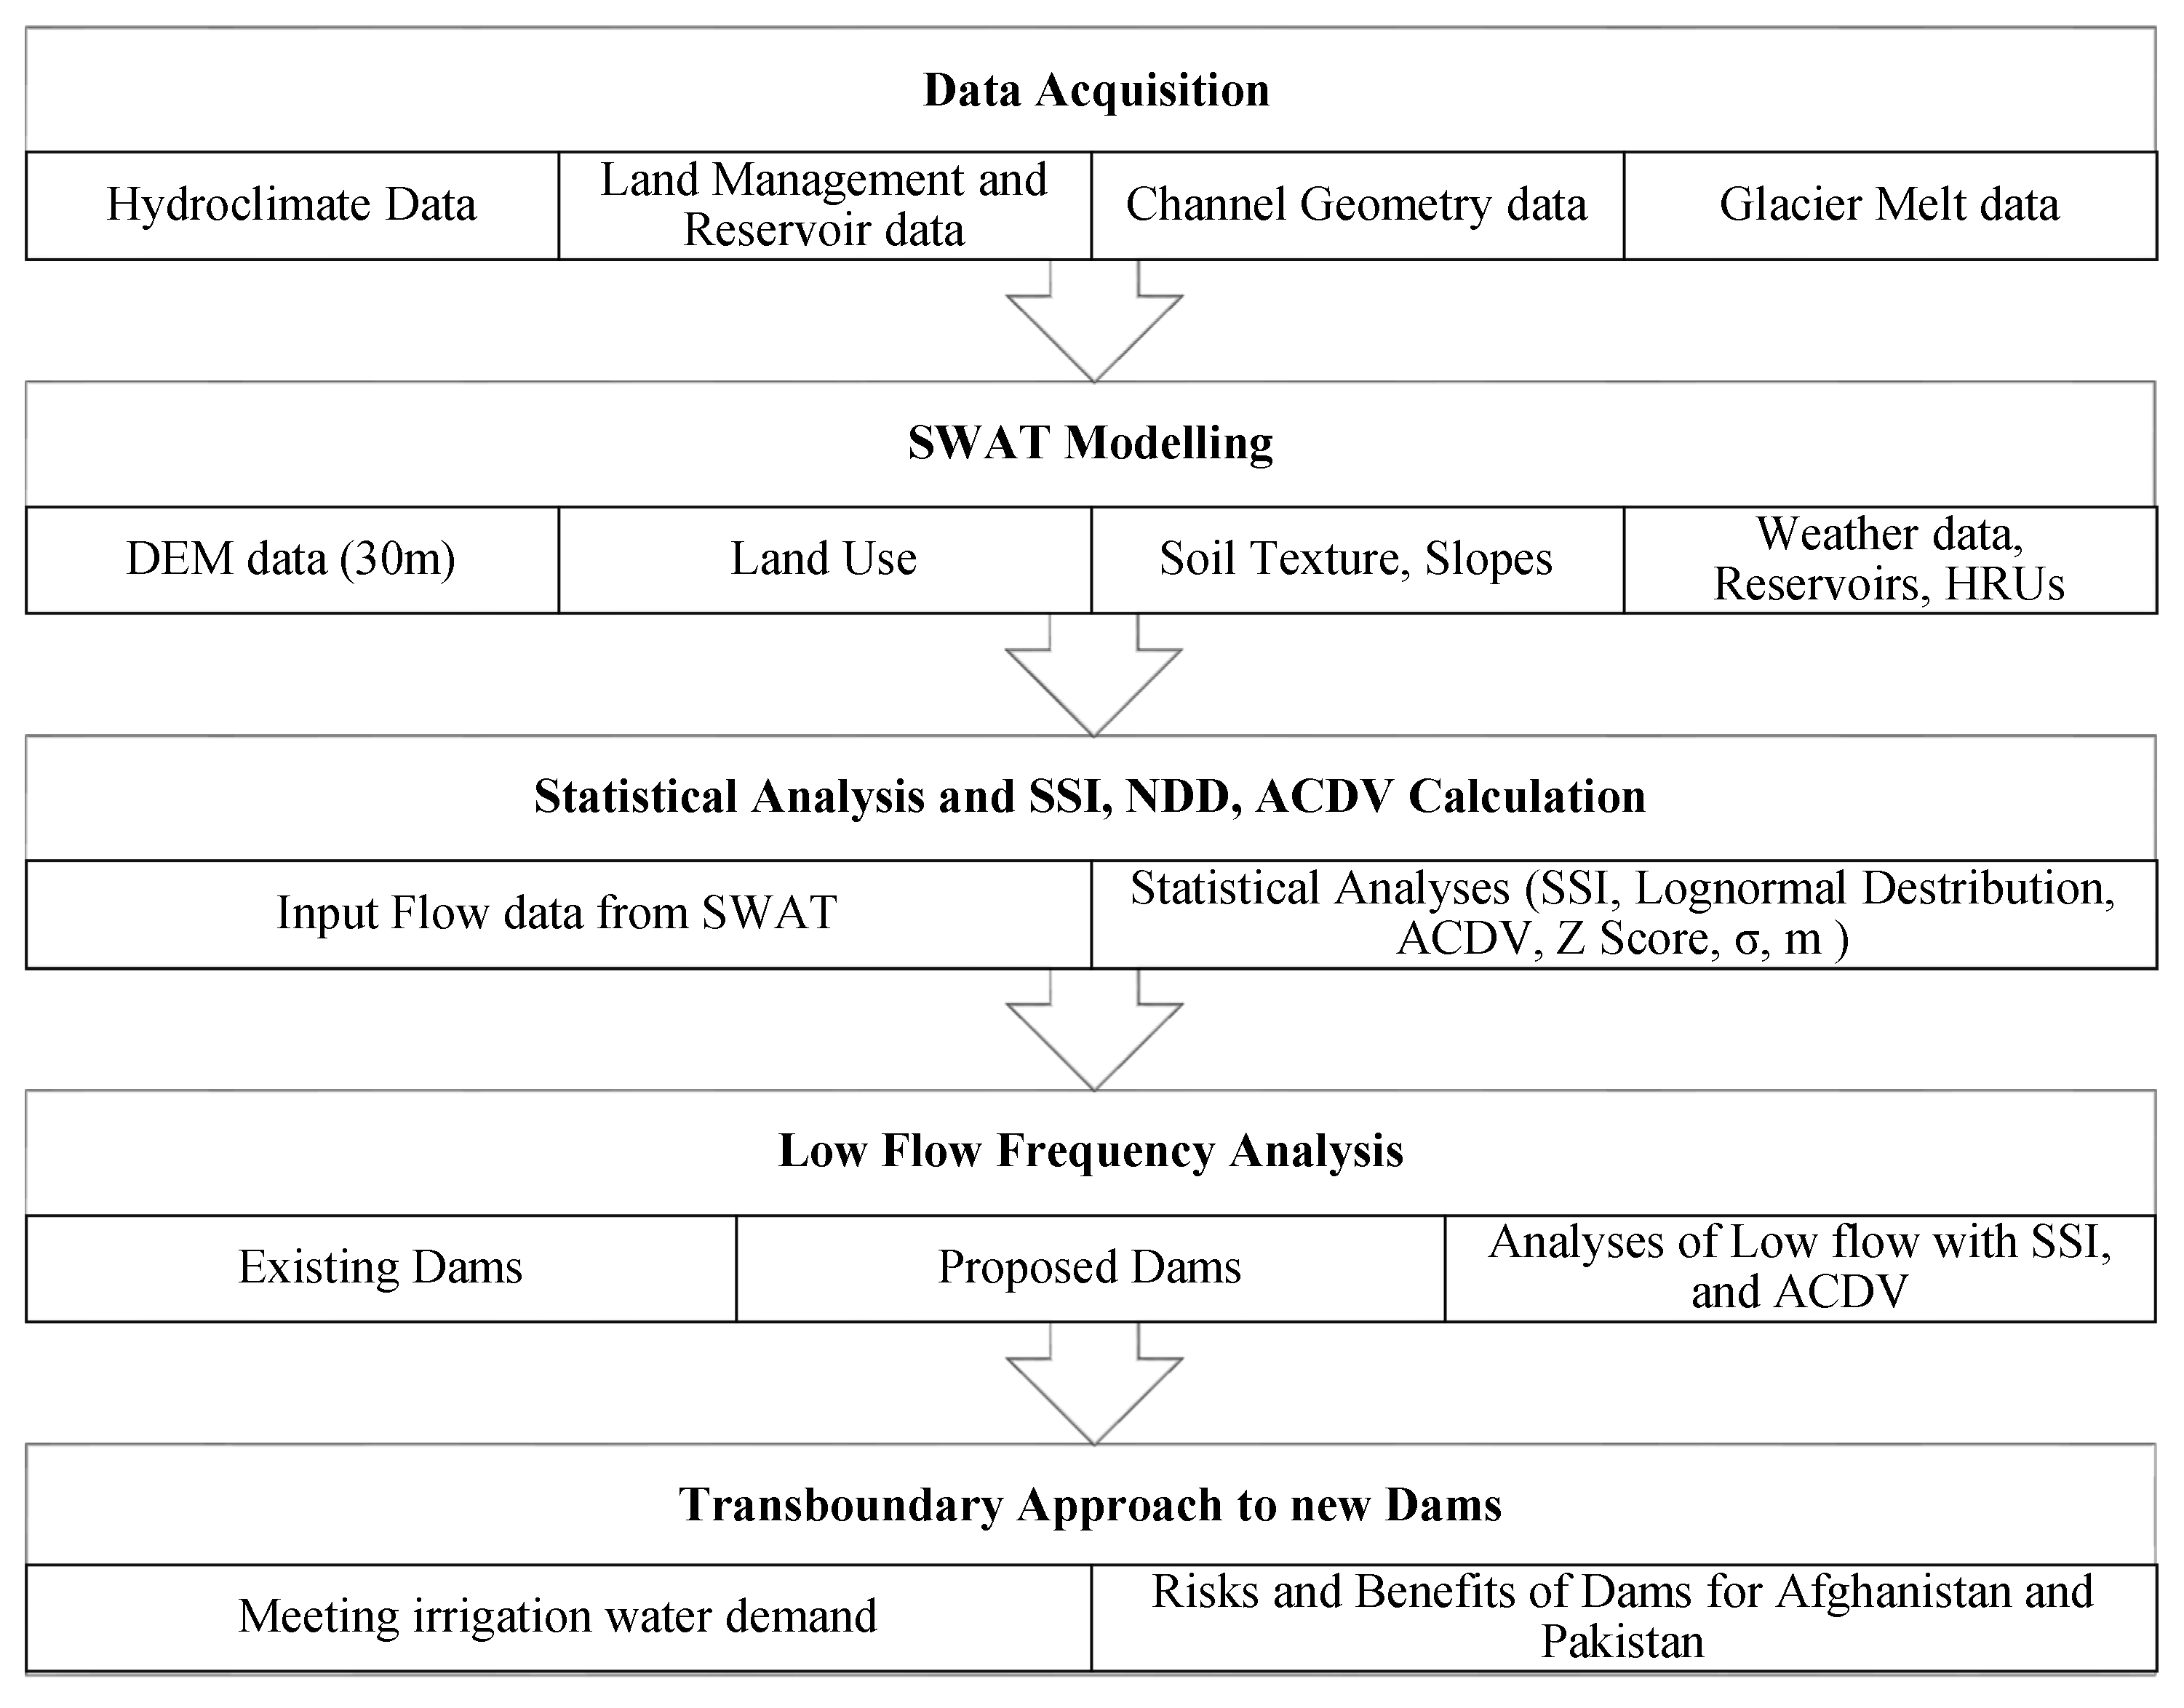
The basis for the technical evidence of this study involves the use of available spatial and temporal data for the KRB and utilization of the Soil and Water Assessment Tool (SWAT) model. The SWAT output flow data are used as inputs in the statistical calculation of the drought indices [32].
Several methods to quantify the drought index have been developed employing the Z-score, where the Z-score is a statistical measure of interest herein as the Standardized Streamflow Index (SSI) based on the principles of “Z” statistics and is directly related to any observed value, x, the mean of the data population and standard deviation as:
Z = x µ σ
where Z is the standard Z-score, x is observed value, µ is the sample mean, and σ is the sample standard deviation.
For a hydrologic period to be considered as drought, events are compared with truncation periods. To do so, they are compared with percentiles [5,33]. In statistical terms, there are benefits from the theory of runs that is a sequence of two or more types of numbers that symbolize the unbroken sequences.
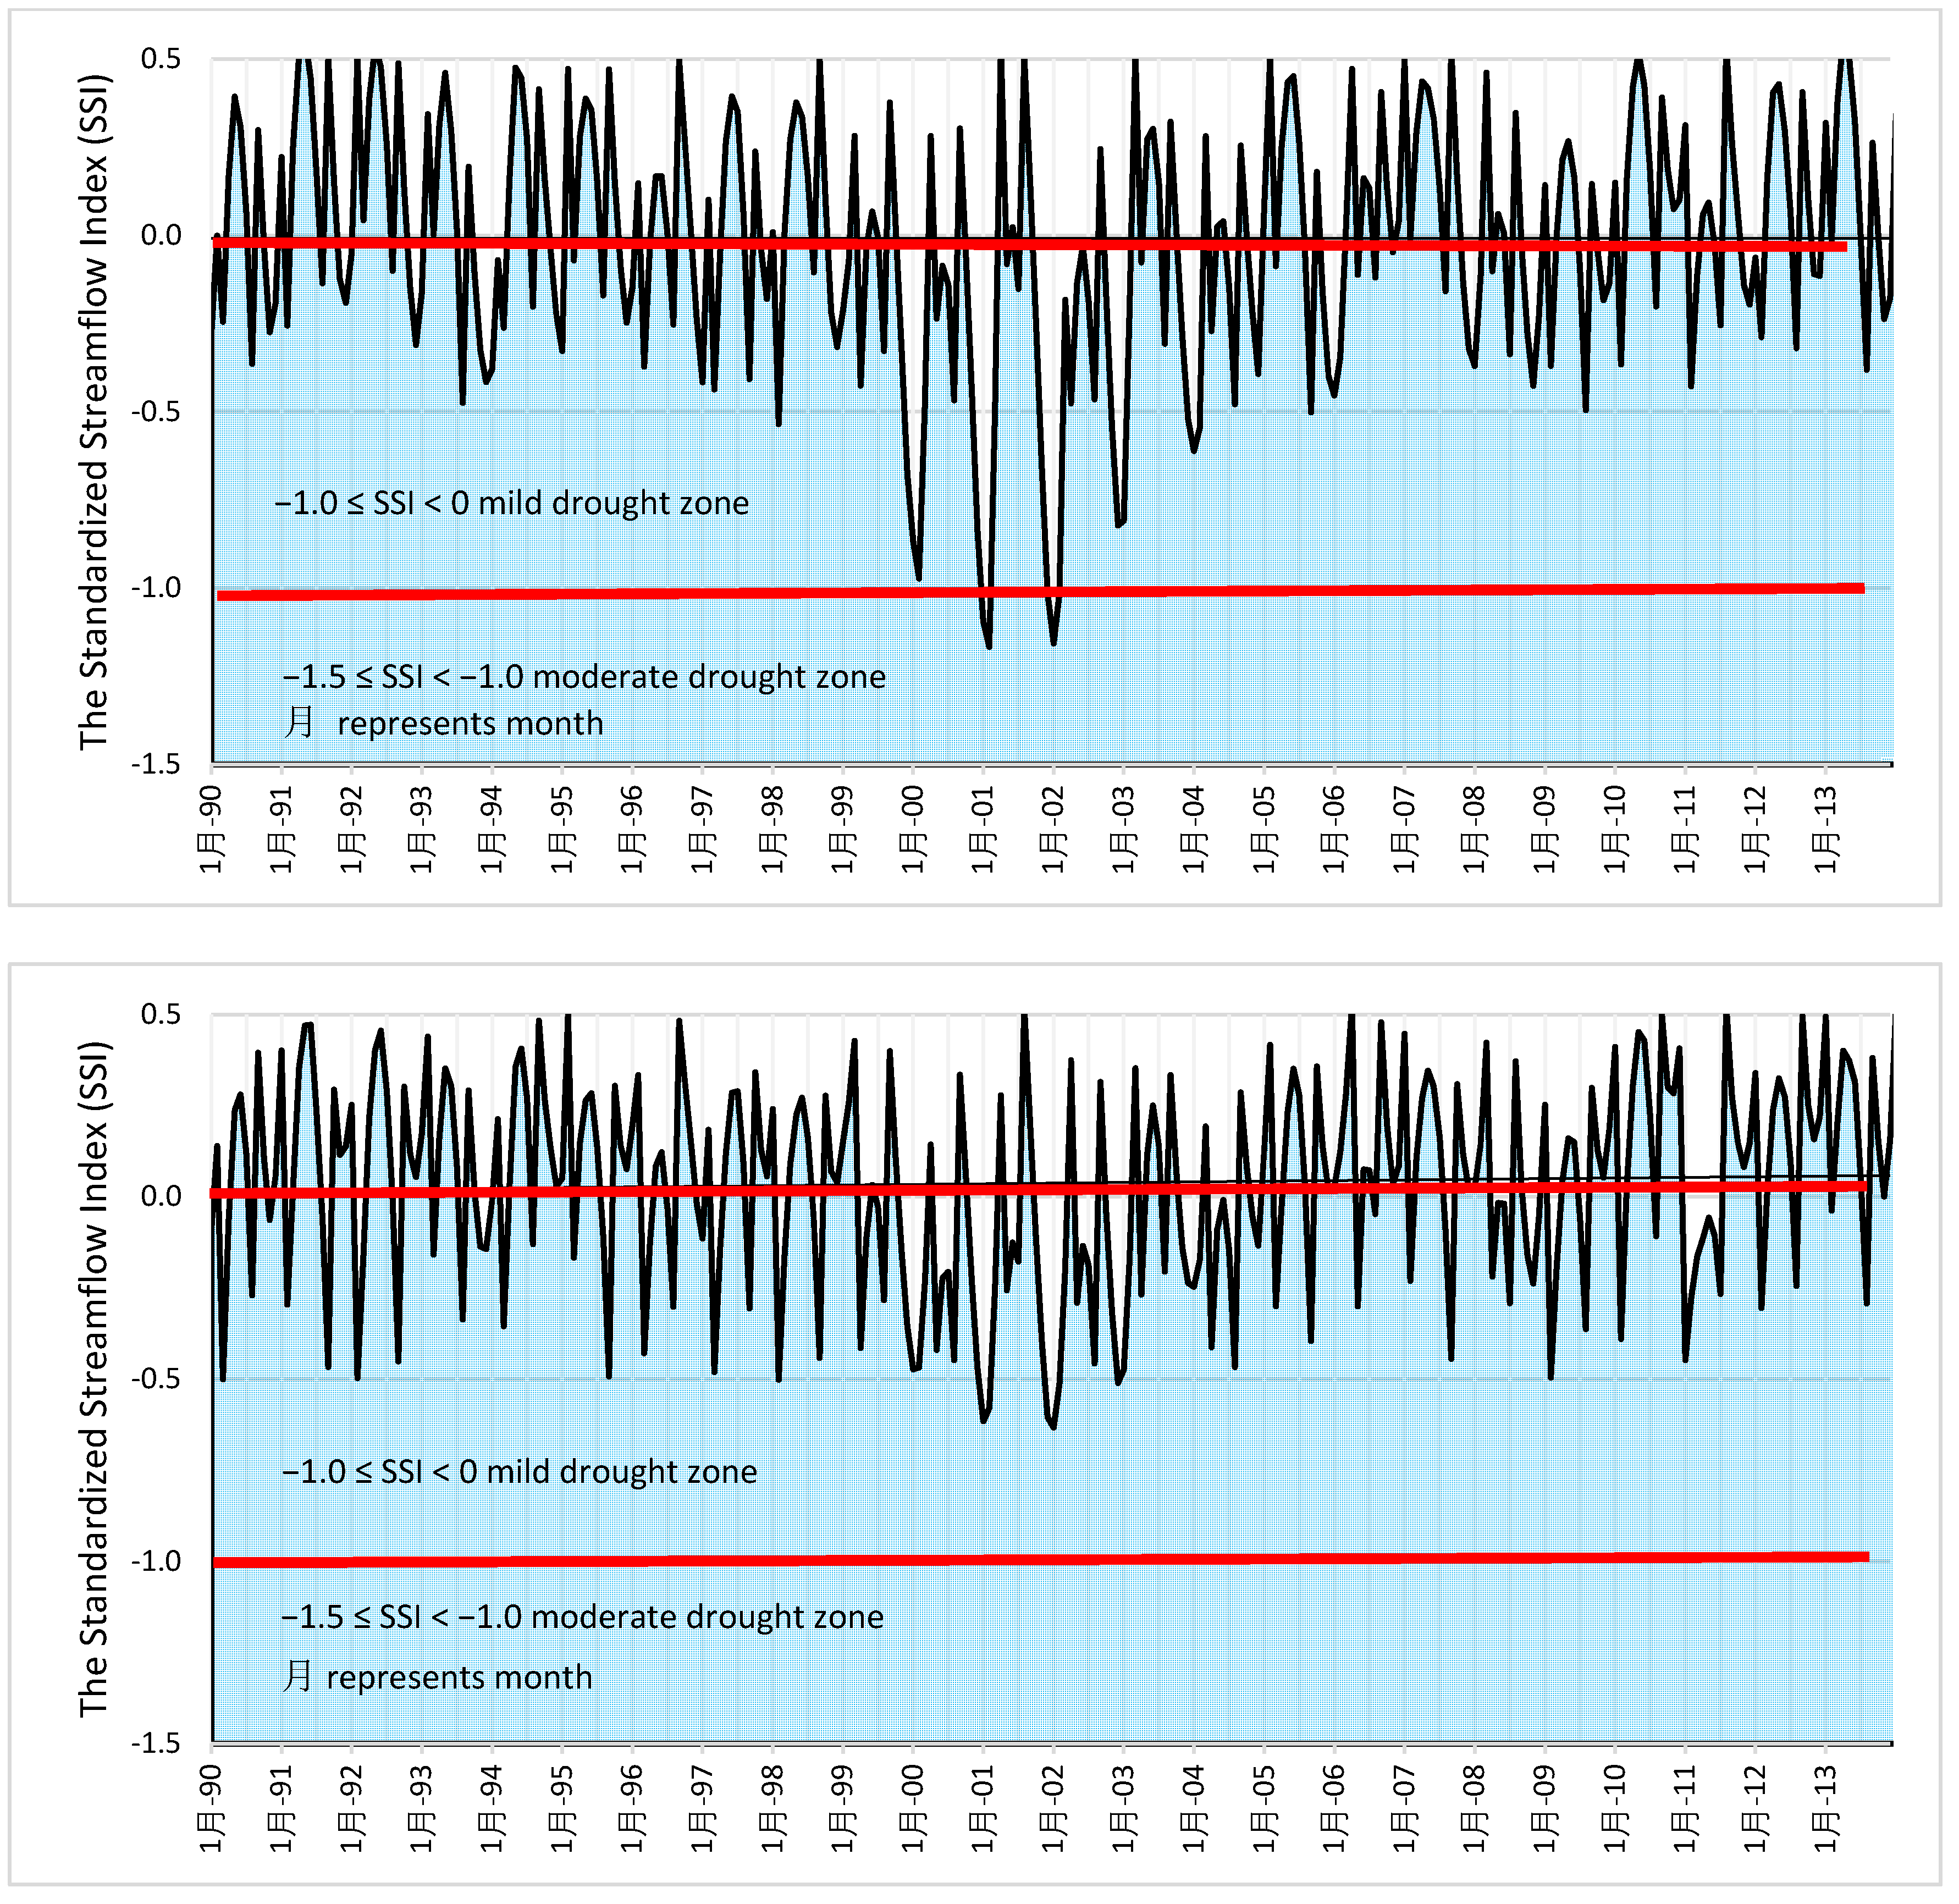
The Standardized Streamflow Index (SSI) is a popular probability distribution function to determine the hydrologic drought by transforming the time series streamflow into a Gaussian distribution. In this study, the SSI and the annual cumulative deficit volume standardized by the mean flow (ACDV) [33] are used to identify the patterns of drought events in the KRB and how the proposed dams will impact water shortages during droughts. The SSI parameter illustrates the streamflow water deficit concerning the standard deviation and long-term mean of flow samples at a specific location and specific time series [33].
SSI = W + C 0 + C 1 W + C 2 W 2 1 + d 1 W + d 2 W 2 + d 3 W 3
where
W = 2 ln ( 1 P ) , if P ≤ 0.5,
W = 2 ln ( P ) , if P ≥ 0.5,
Additionally,
P = 1 F ( Q ) , P is the function of lognormal distribution of flow data [5,34]
F   ( Q ) = 1 Q   σ   2 π e [ 1 2 ( ln ( Q ) µ σ ) 2 ]
P is the probability of exceeding a determined Flow (Q) value,
µ and σ are the mean and the standard deviation of the logarithmically transformed streamflow [34].
Moreover, in Equation (2):
C 0 = 2.515517 , C 1 = 0.802853 , C 2 = 0.010328 , d 1 = 1.432788 ,   d 2 = 0.189269 , d 3 = 0.001308
‘Drought severity’ can provide insights to decide on the amount of water to be released to mitigate drought severity. For example, the 70th percentile of the streamflow will set a threshold where the flows under the 70th percentile are to be considered as part of a drought event [33]
A C D V = i = 1 365 X ( i ) Q ¯
where
X i = i = 0 n Q T , i Q i
Q T , i —Streamflow at selected thresholds (70%, 80%, 90%) at day i (the 70% threshold is used in this study)
Q i —Daily flow at day (i = 1, 2, 3…)
Q ¯ —Mean annual flow at selected location.
The hydrologic drought is classified based on the SSI threshold. Any negative ranking of the SSI indicates a drought situation. The SSI drought classification is shown in Table 2 [35,36].
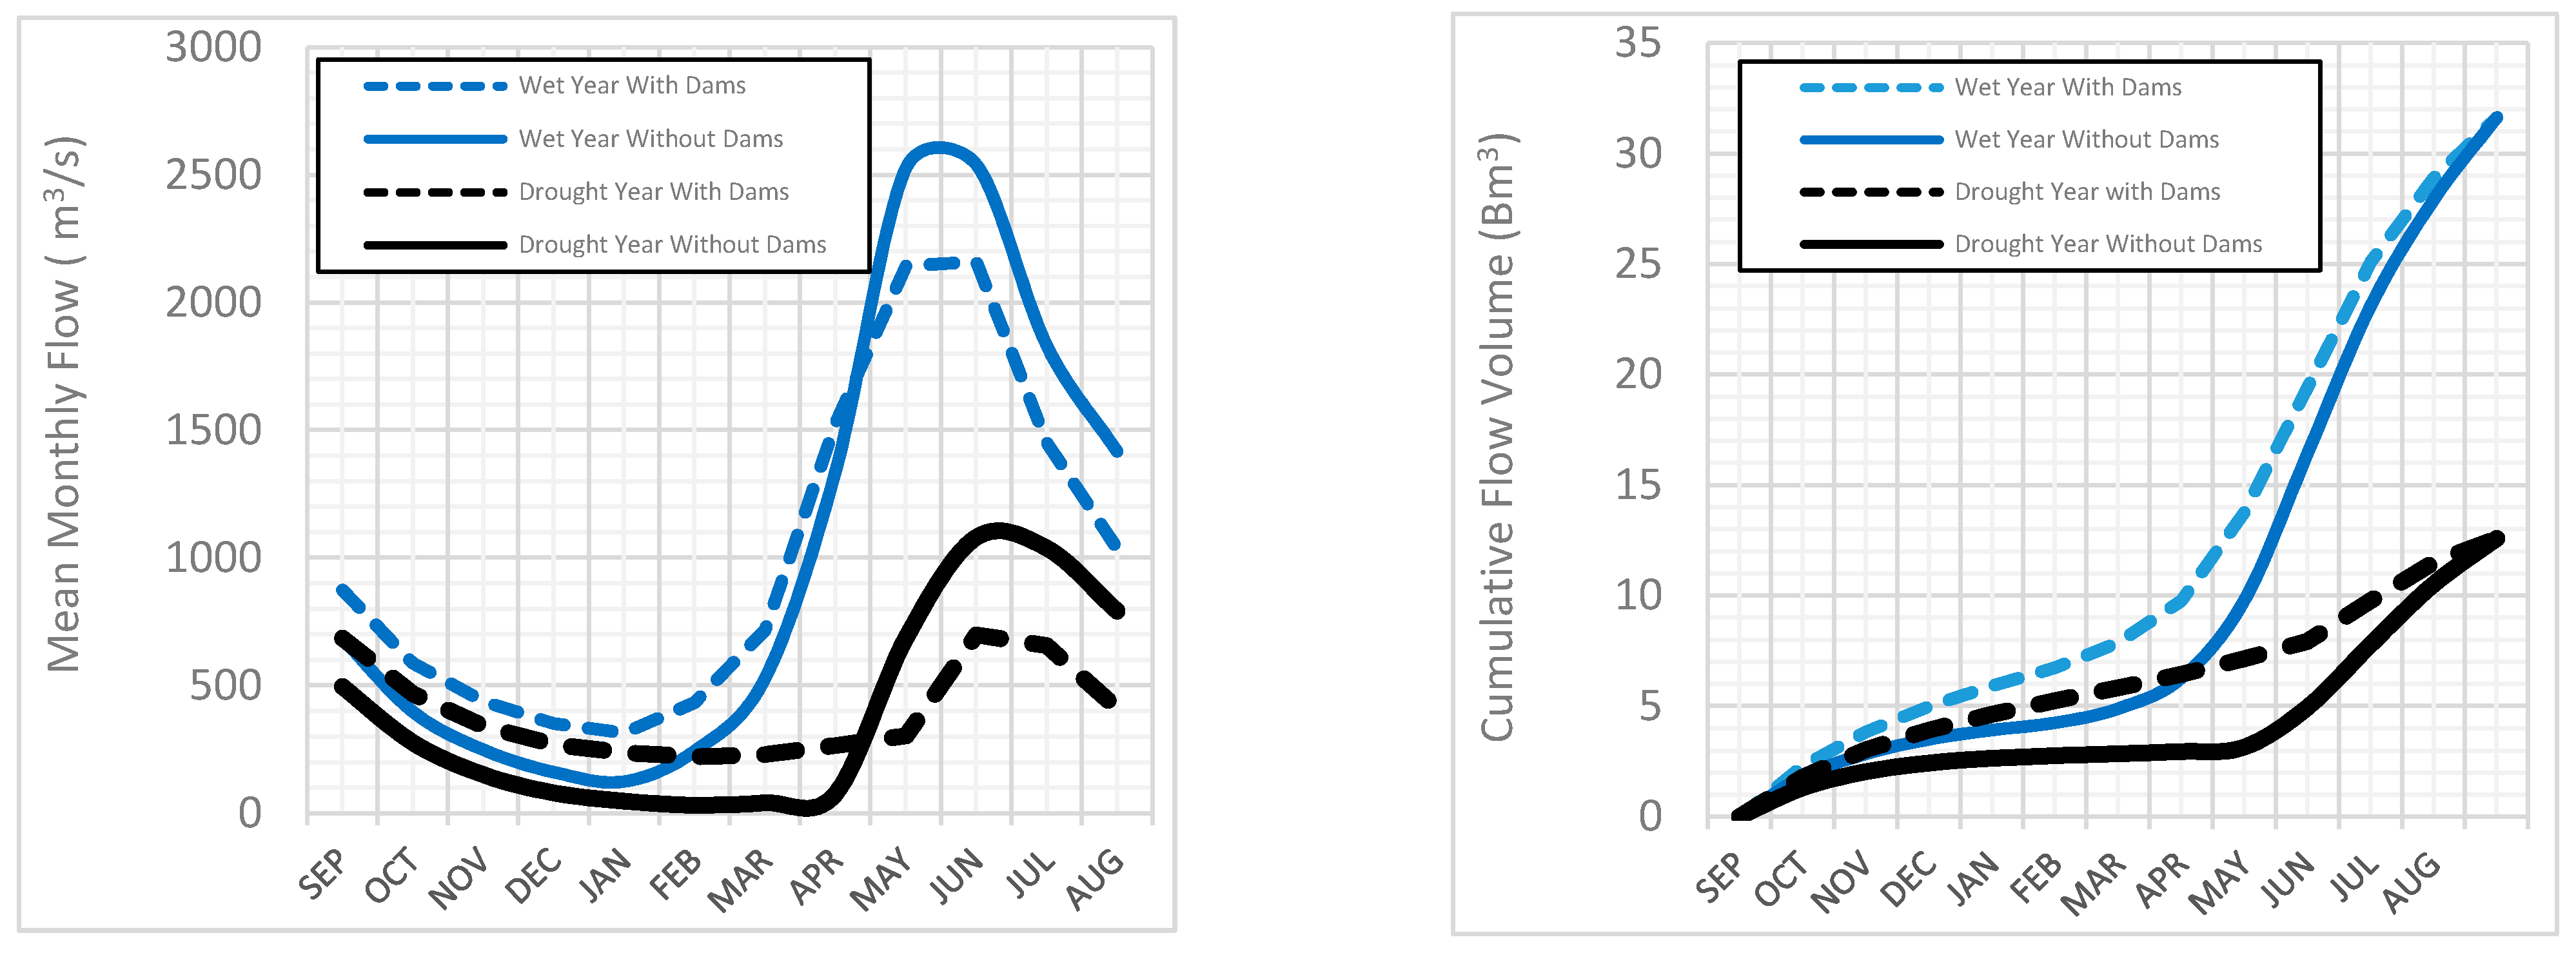
One additional aspect is the effect of hydrologic droughts on peak flows. Vicente-Serrano et al. [5] indicated that in basins with high seasonality, the hydrologic drought can also affect the streamflow during high flow periods, thereby impacting the water availability in reservoirs. This dimension is important for the KRB since it reflects the SSI for the entire basin, considering the spatial and time-specifics of the flow periods. The study results show how the proposed dams will address low flow intricacies and reduce the stress due to seasonal and annual hydrologic droughts.
Low frequency analysis is used to analyze the probability of water availability in a specific location under a specific threshold which can qualify the low flow as hydrologic drought [37]. It provides information about the magnitude and frequency of flow discharges based on records of the lowest annual discharges collected at stream gages. In this study, the seven-day average for 2, 5, 10, 25, 50, and 100-year return periods were used as the 70th percentile threshold.
Different scientific communities are using different types of distributions for flood and low flow (drought) frequency analysis. Great Britain and China use the generalized extreme value distribution and the log-normal distribution, respectively, while other countries commonly use other distributions such as log-Pearson and Gumbel [38]. Some popular distributions used to conduct frequency analyses are Generalized Extreme Value (GEV), Weibull (W2), Gamma (G2), Log-Normal with two parameters probability distribution functions (LN2), Weibull (W3), Gamma (G3), and Log-Normal with three parameters probability distribution functions (LN3).
Additional studies have evaluated the suitability of selecting distributional alternatives for flood frequency analysis, including [39,40,41,42,43]. Given findings reported by the World Meteorological Organization (WMO) (1989) wherein a survey was conducted and concluded that log-normal distribution is one of the widely used distributions for flood frequency analysis [44], this method was selected for flood frequency analyses in this study.
Based on the SWAT outputs, frequency analyses were conducted on low flows during the dry season. The SSI and ACDV were determined by employing outputs from SWAT. These findings were compared with flow outputs calculated for the post-reservoir scenarios to analyze the benefits of these dams on increasing low flow in downstream areas. Finally, mitigation measures to limit possible adverse effects of dams and limitations on water intake for irrigation are discussed. Figure 2 shows the schematic approach of this study.

2.3. The Soil and Water Assessment Tool (SWAT)

The Soil and Water Assessment Tool (SWAT) developed by the Department of Agriculture of the United States is used to model hydrologic processes across the globe and, in particular, in large river basins and data-poor regions [45,46]. SWAT is a semi-distributed model using the Digital Elevation Model (D.E.M.) that can divide watersheds into smaller sub-watersheds and then into Hydrologic Response Units (HRUs) based on unique combinations of land use, soil type, and surface slope for further hydrologic analyses [47]. SWAT provides a comprehensive picture of the watershed hydrologic cycle with the integration of climate data, flow, sediment, and nutrient loading at each reach outlet and their spatial distributions over the watershed. The volume and spatial extent of snowpack and subsequent snowmelt processes are considered in SWAT, which can be made to vary spatially using a maximum of 10 elevation bands in a sub-basin [48]. These features of SWAT allowed its use for simulating hydrologic processes in cold mountain areas such as the KRB.

2.4. Data Acquisition and Processing

Weather data including precipitation, temperature, solar radiation, wind speed, and relative air moisture from 1979 to 2014 were obtained from the National Centers for Environmental Prediction (NCEP) Climate Forecast System Reanalysis (CFSR) for the KRB. CFSR collects global, high-resolution climate data, coupled with the atmosphere–ocean–land surface–sea–ice system [
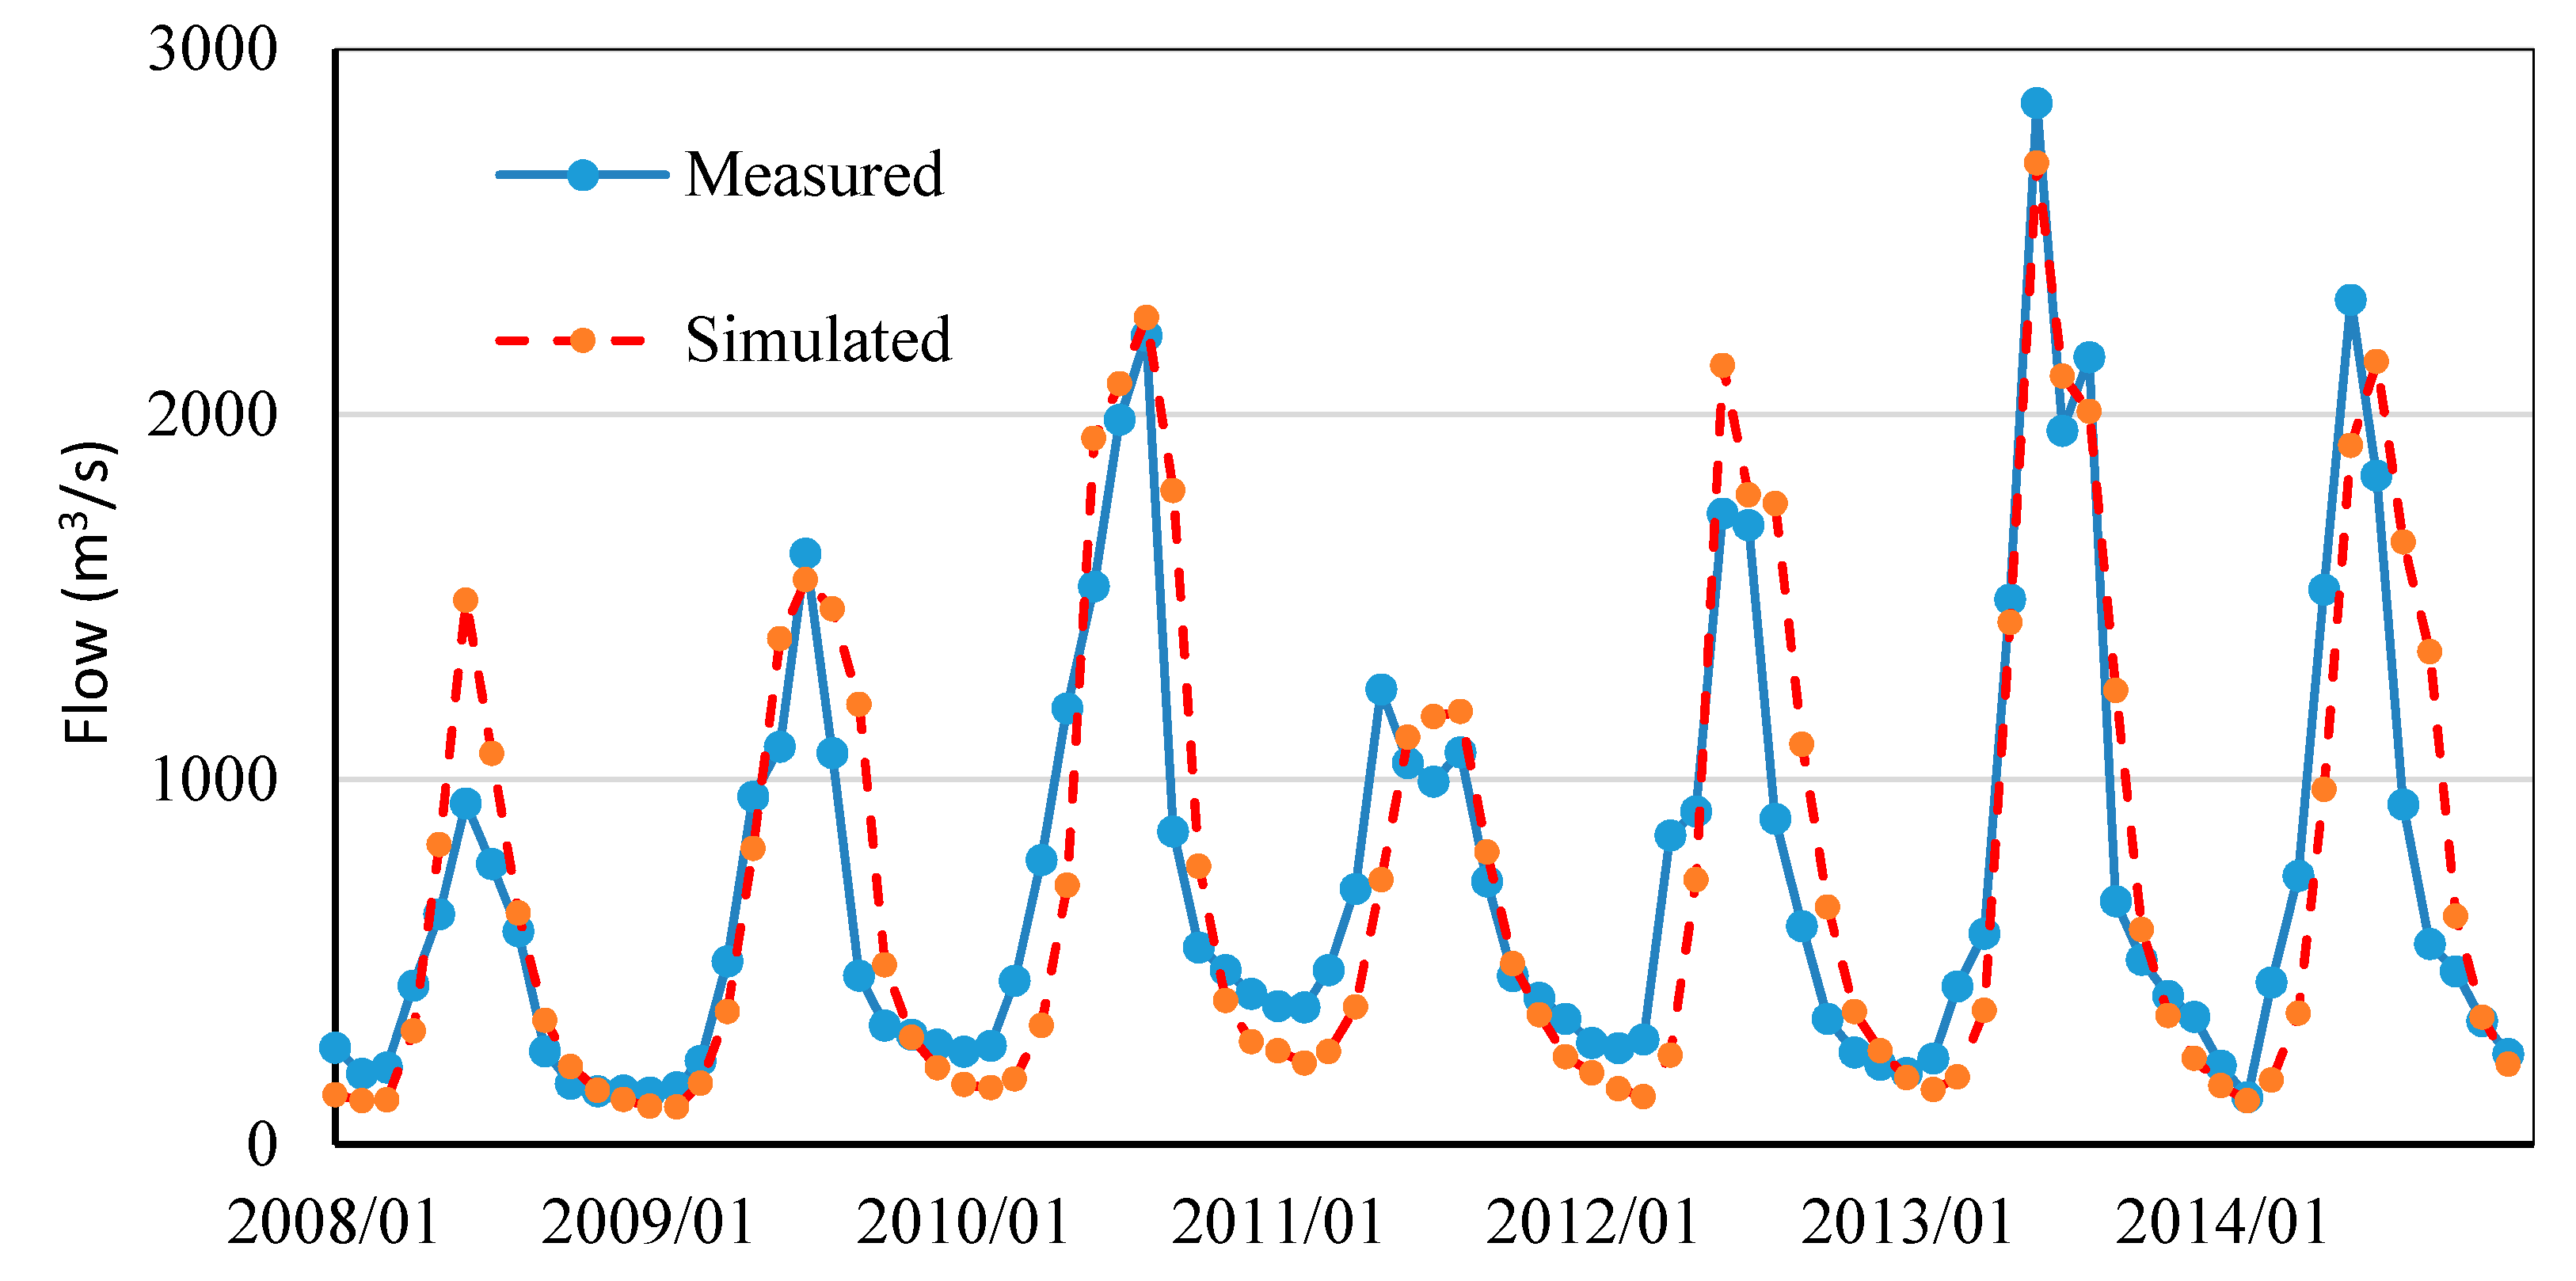
49]. The measured data from ten flow stations in the KRB from 2007 to 2015 were organized for calibration, while the global weather data of the same period was also collected. Regression analyses between the simulated and available measured climate data showed an average coefficient of determination of 0.71 for precipitation and 0.76 for the temperature at the selected ten climate stations.
The GCM (General Circulation Models) dataset is recommended for climate change-related studies as per the United Nations Intergovernmental Panel on Climate Change (IPCC) Panel in its Fifth Assessment Report [50]. These climate models were initially statistically downscaled using the Bias-Correction Spatial Disaggregation (BCSD) method, and gridded historical climate data by NASA Earth Exchange, NASA Ames Earth Center [51]. The performance of NEX-NASA BCSD GCMs is useful for the basins of southeast Asia such as the Lower Mekong, China, India, Africa and many other countries/regions [51,52,53]. Hence, high-accuracy projections of future climates are available for the KRB with the use of high-resolution GCMs, such as CANEM2 NEX CMIP5, CCSM4 NEX CMIP5, CNRM-CM5 NEX CMIP5, CSIRO-MK3-6-0 NEX CMIP5, GFDL-CM3 NEX CMIP5, and MRI-CGC M3 NEX CMIP5 Climate Projection. The datasets used in the study and their spatial and temporal resolution are shown in Table 3.
The selection of a particular GCM climate model depends on a number of factors such calibration results between the baseline data and the simulated data, as well as the comparative analysis with other studies in a particular watershed. Examples of different studies which used different datasets for the same basin are: CCSM4, MIROL4, and BCC-CSM.1 by [54]; BCC-CSM1 by [55]; BCC-CSM1, CESM1-BGC, and BNU-GDDP (Global Daily Downscaling Projections) NEX_GDDP models by [56]; GFDL and CanESM by [57]. This study, enlightened from all prior recommendations and experience, used six datasets for analyses. Datasets of all six models were compared against the baseline datasets for the KRB. The analysis included the average increase or decrease in percentages of both precipitation and temperature. Analyses also included the seasonal change of the models with the baseline data and with the findings of similar climate change studies reported in prior works [13,18,54,55,58,59,60,61,62,63].
Datasets in this study employed the daily time-series historical data of six GCMs during 1990–2014 as historical data and data of future periods (2025–2049; 2050–2074; 2075–2099). Further analyses included the change in precipitation rates and temperatures based on both the year and season. Comparing the results of several climate models with some existing studies for the KRB, the climate data from the CCSM4 were identified to be more representative under the KRB conditions and hence were used to investigate the climate change impacts of flow regimes in the KRB.
To use SWAT for the KRB, geospatial data were obtained, including a 30 m resolution DEM (Digital Elevation Map), soil data, and land use data. Global Information System (GIS) data of stream network, basin boundary, location of climate, flow monitoring stations, and existing and potential dam sites were collected. In addition, the existing and future amounts of water used for irrigation and municipal supply in the KRB were estimated based on literature values. Additionally, the hydraulic and geometric features of future dams were determined based on the reports from the Ministry of Energy and Water of Afghanistan (MoEW) and the World Bank.

2.5. Existing and Future Irrigated Land and Its Water Demand

Over 80% of the KRB irrigated area is supplied by surface water resources. This study assumed the irrigated land expansion based on WB reports and past trends, where 20%, 30%, and 50% increases per quarter century of irrigated lands were considered in cases where new reservoirs are constructed. However, increases in irrigation areas may still happen even if proposed reservoirs are not constructed. This increase was assumed to be 50%, 30%, and 20% less than the assumed increase, respectively. This means that the agricultural land expansion will happen regardless, but with no storage sites the pace of expansion will be reduced.
There is a total of 292,680 ha of existing irrigated land in the KRB (Afghanistan) and ~59,330 ha of potential irrigated land that may be added to the current area of irrigation [30]. The agricultural land expansion is an unpredicted process in most developing countries. Studies by Sidiqi [56] and Najmuddin [61] indicate an increase in agricultural land expansion beyond the predicted threshold in the KRB over the next 25 years. Since most studies predict that there will be up to 25% irrigated land area increases in KRB, in this study irrigated land areas in the model were increased by another 30% (compares to the 15–25% increase proposed by the WB) to account for unplanned agricultural land expansion, making it 77,129 ha. A similar trend was used in the Pakistan side of the KRB. After deducting the rain-fed and groundwater-fed irrigated lands, the potential and existing 337,309 ha of irrigated land will require an additional ~1100 Mm3 of water from the KRB flows (Table 3) in Afghanistan and Pakistan in addition to the currently utilized irrigation water of 4055 Mm3. This constitutes 4% of the total mean annual average flow volume of the KRB flow. Existing and future irrigation water demands in the KRB (Afghanistan and Pakistan) are shown in Table 4.
This study considered the increase in agricultural land beyond the official predictions as aforementioned. The potential future agricultural land irrigated from the Kabul River in Pakistan is calculated based on the total area of the Khyber Pakhtunkhwa province, total cultivated land in the province, and the land irrigated by surface water from the Kabul River as shown in (Table 3) The total irrigated land increase is assumed to be 22% of the existing irrigated land in Pakistan. However, this KRB-related study is under the influence of various uncertainties related to precipitation, temperature variability, and other knowledge gaps in technical information, management practices, and political uncertainties that should be considered in future studies.

2.6. The SWAT Model of the KRB Flows

The SWAT model used in this study (also referred to as ‘the model’) considered only the KRB (Afghanistan) portion and Konar (Pakistan) with the joint outlet located at Dakah, Nangarhar. The model delineated the main river channels in the KRB, which resulted in 301 sub-basins. With a land-use area threshold value of 10%, soil area threshold value of 10%, and four slope classes (0–4%, 4–12%, 12–33%, and >33%), a total of 1949 Hydrologic Response Units (HRUs) were created for the model with an average HRU area of 39.5 km
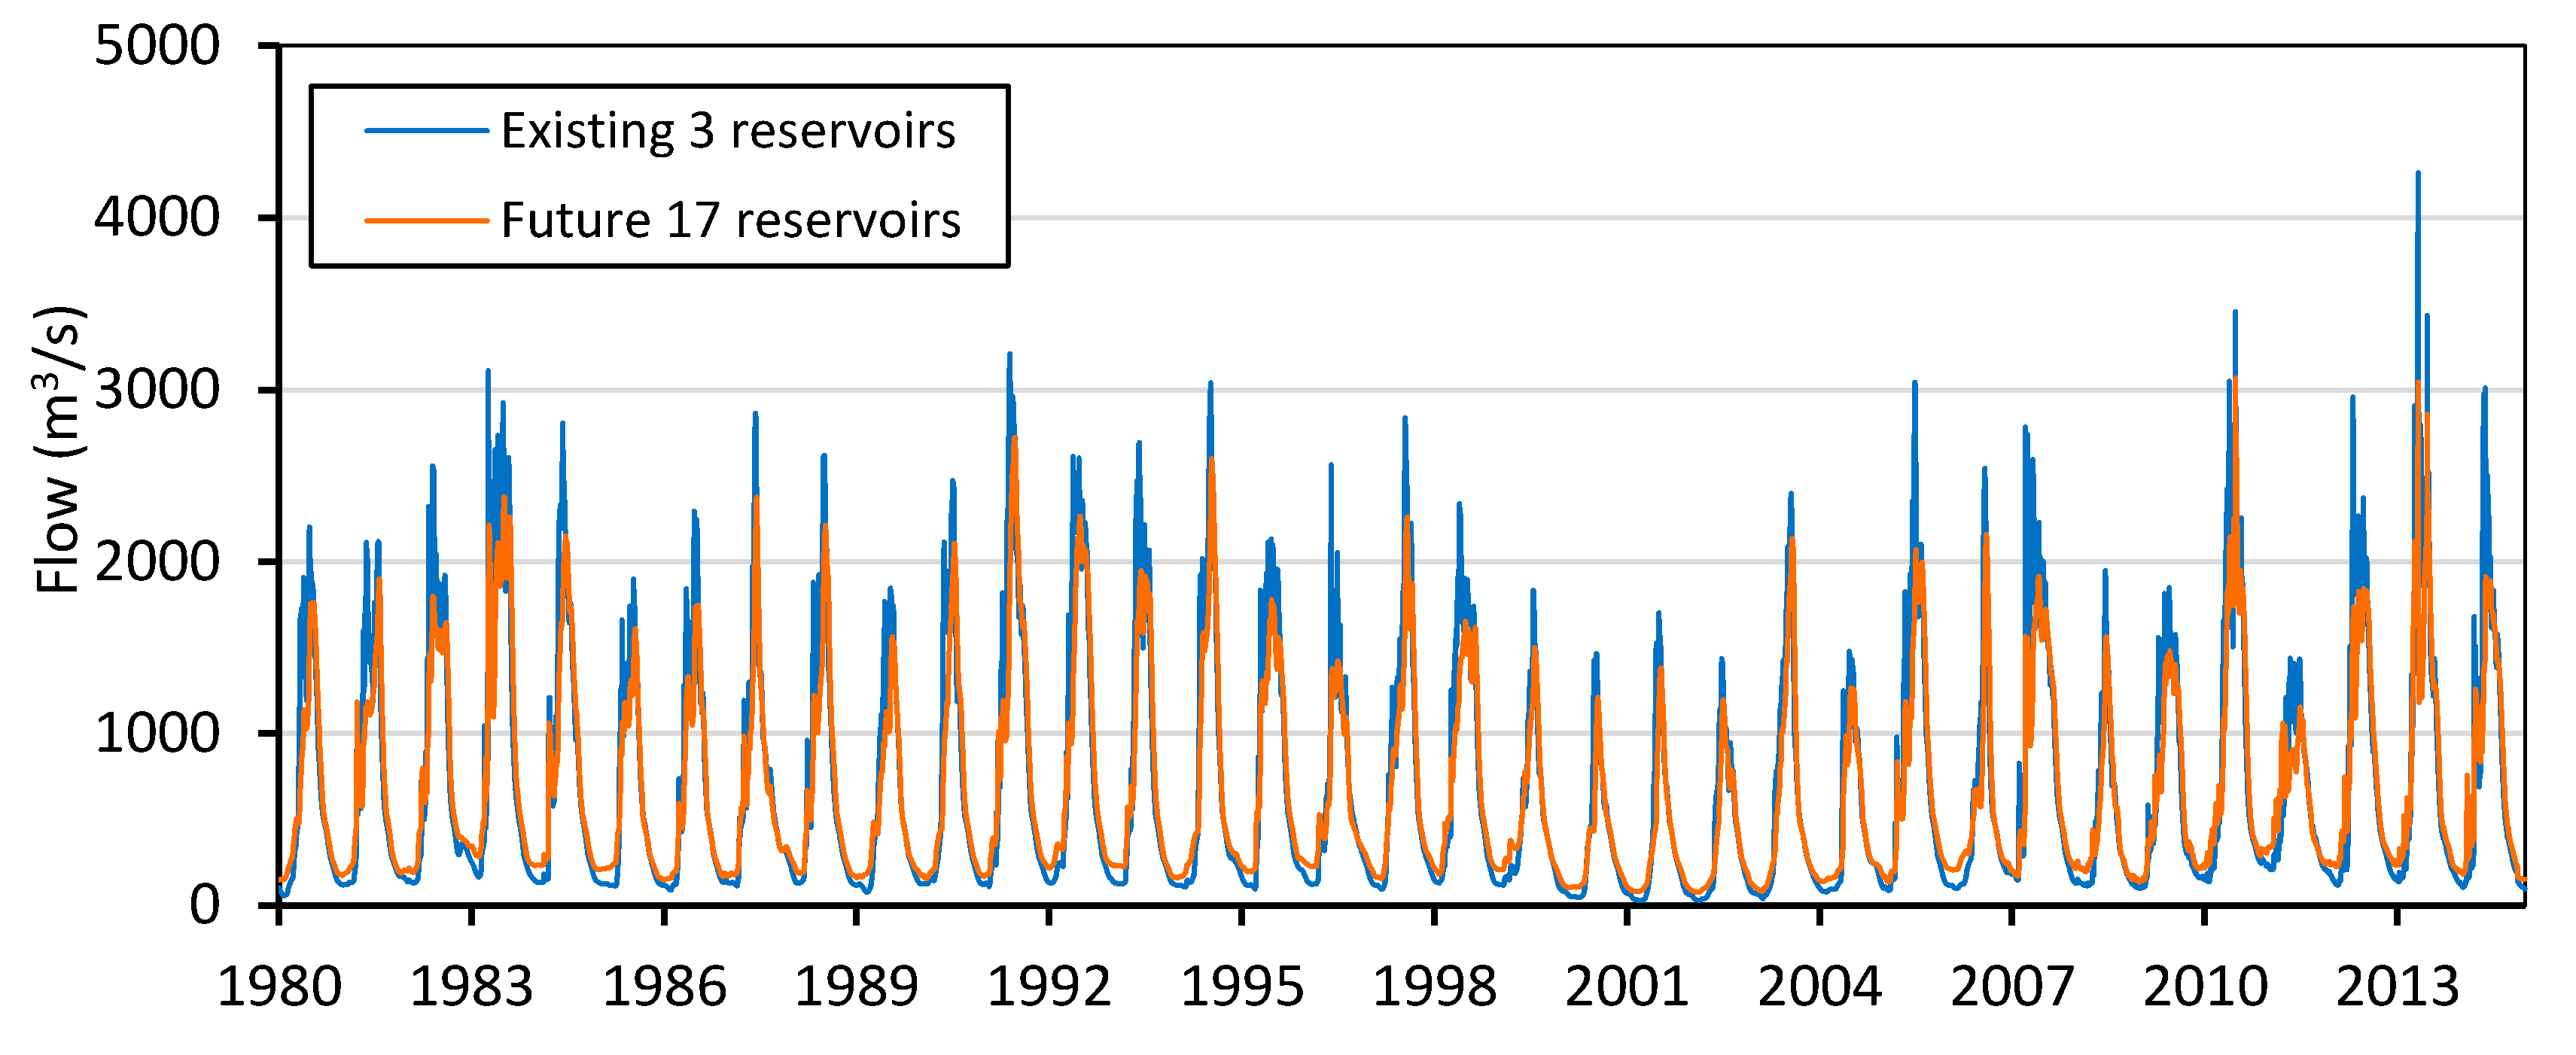
2. Five elevation bands were created in each sub-basin based on the DEM to account for the variations of climate in the mountains. Water intakes in the model were assumed as per existing conditions and a future 14 reservoir conditions [29].
Irrigation demand is high during April to August (12.7%, 17.1%, 25.1%, and 15.6% of annual water demand, respectively), followed by decreased demands from September to March (3.1%, 2.8%, 3.0%, 3.1%, 2.9%, and 5.3% of annual water demand, respectively) [24]. This temporal distribution was used to calculate the irrigation water requirements for existing agricultural lands in the Afghanistan portion of the KRB [10]. During the model setup, based on the available information, 80% of irrigation water was assumed from surface water (dams), while 20% was assumed from groundwater and precipitation.
Due to data limitations and the poor quality of available observed climate data in the KRB, additional data were needed. Hence, data from the Global Weather Data (GWD) including precipitation, temperature, solar radiation, wind speed, and relative air moisture from 1979 to 2014 were obtained from NCEP CFSR for the model calibration and reservoir assessment. Daily flow data from the Dakah station were used for comparison with the simulated daily flow.

3. Results

3.1. SWAT Calibration and Sensitivity Analyses

The SWAT Calibration and Uncertainty Procedures (SWAT-CUP) developed by Abbaspour et al. were used for parameter sensitivity analyses and model calibration of the model [62]. SWAT-CUP is an application that links various procedures to perform calibration and uncertainty analyses for the SWAT model. In this study, the sequential uncertainty fitting (SUFI2) algorithm was used for calibration. With global sensitivity analyses of 100 SWAT-CUP runs, the Nash–Sutcliffe Efficiency (NSE) was used as the objective function [64,65]. Twenty-nine major runoff and flow parameters (Table 2) were selected for the KRB SWAT model sensitivity analyses. ALPHA_BF, SMFMN, SOL_BD, SMTMP, TIMP, and TLAPS are the most sensitive parameters with p-values < 0.003 and absolute t-stat (relative significance of each parameter) values > 3. In contrast, parameters of CANMX, OV_N, PLAPS, and GWQMN are less sensitive, with p-values > 0.8 and absolute t-stat values < 0.2. These findings are in line with the sensitive parameters reported for similar watersheds [65,66]. Parameter values used in the model after the SWAT-CUP model calibration are listed in Table 5.
Three criteria, model bias, the NSE, and the determination coefficient (R2), were used to statistically evaluate the model performance at flow monitoring stations. Model performance was good at mainstream stations with daily NSE ranging from 0.28 to 0.69 and R2 from 0.35 to 0.75. Figure 3 shows the measured and simulated monthly flow at the Dakah station from 2008 to 2014 over the calibration period with the bias of 3.4%, NSE of 0.74, and R2 of 0.80, meaning the calibrated SWAT model predicted daily and monthly flow adequately at the Dakah station near the KRB Afghanistan outlet. This means it is feasible to further assess the impact of dams on flow regimes in downstream rivers.
The modelling results showed an annual mean precipitation of 459 mm in the KRB (Afghanistan) throughout 1980–2014, including 248 mm of snowfall and 217 mm rainfall. The simulated average surface runoff was 216 mm/yr with a surface runoff coefficient of 0.46. The simulated average groundwater flow was 90 mm/yr with a baseflow runoff coefficient of 0.19. The simulated average actual evapotranspiration (AET) varied from 0 mm/yr in the high northeastern mountains to 450 mm/yr in the downstream sub-basins close to the outlet, which resulted in an average AET of about 159 mm/yr over the KRB (Afghanistan). The simulated yearly average flow at the Dakah station was 653 m3/s (306 mm/yr) from 1980 to 2014. In other words, about 20.6 km3/yr of water were provided to the Indus River from the KRB (Afghanistan). The simulated historic daily flows are shown in Figure 4.

3.2. Low Flow Frequency Analysis with and without Large Dams

Constructing future dams is expected to increase low flows and mitigate hydrologic drought (less severe). For that reason, annual minimum flow frequency analyses were conducted based on simulated annual minimum daily flows (normally in December and January) at the KRB outlet throughout 1980–2014. The seven-day average results showed that the post-reservoir discharge during the low flow periods would increase by 58.0% for a 10-yr return period storm event, 73.8% for a 20-yr return period event, 97.0% for a 50-yr return period event, and 117% for a 100-yr return period event, as shown in Table 4. The low flow analyses were conducted based on results from a 35-year model simulation period (1980 to 2014), while the 50-yr and 100-yr return period estimates were obtained from the extended frequency regression lines (Table 6). The release of up to 50% of the reservoir active storage water as part of the reservoir-induced flow augmentation during the months with lowest flows will increase the low river flows by an additional 25% in a 10-year return period and 34% in a 20-year return period. Since KRB hydrologic droughts are not likely to be prolonged droughts, it is estimated that reservoirs will enable meeting some of the water demands during hydrologic droughts.
Reservoir management and operation during droughts are complex but essential tasks. The reservoir active storage volume, the dynamics of reservoir inflow and reservoir water releases are based on the drought duration and severity, which make this a complex and nonlinear problem [66].
The World Bank (2010) report identified the monthly water demand for the agricultural land in KRB [29]. The KRB low flow seasons are October to March where the water demand for agricultural lands is also low in the Afghanistan side of the KRB. The proposed reservoirs/dams are based on the variables (a) irrigation water demand, (b) hydropower water demand, (c) flood mitigation, and (d) environmental water demand. The SWAT modelling considered the reservoir operation schedule based on the above variables and has estimated the percentage of the reservoir’s water release and flood routing based on Reservoir Operation Volume targets. The proposed reservoirs being considered will have a total capacity of 7140 Mm3 [29], of which 50% is assumed to be ‘active’ storage and hence, water in the active storage for each reservoir is released by April, ahead of the flood season (as shown in Figure 5). The period of the water storage season is from April to August. The SWAT database was assigned with the target release percentage at each month based on the above variables. The modeling also considered that the minimum flow will always be equal or more compared to the historical low flows for recreational and environmental purposes.
Afghanistan is recovering from a long series of wars and technical institutions are in their infant stages. In order to catch up the late development, a simple method of quantifying the flow regimes under various climate and anthropogenic scenarios was used to make it accessible for a broader audience in Afghanistan and the region. Tennant (1976) developed a method to evaluate the minimum flows to sustain the ecological life for species and recreational uses [67]. This method was further used by the Fisheries and Oceans Canada (FOC) and the Canadian Science Advisory Secretariat (CSAS) to assess environmental flows. The Tennant method assumes that at least 30% to 40% of the average annual flow is required to sustain the biological integrity of a river ecosystem [67]. Figure 5 shows the mean monthly flows for the wet year of 1991 and a drought year, 2002.
For the purposes of analyzing a drought year, streamflow is assumed to drop below 10% of the Mean Annual Flow (MAF) for almost 5 months under existing reservoirs and future climate periods. Therefore, the future climate scenarios with existing reservoir conditions do not meet the Instream Flow Need (IFN). The future climate scenarios under the reservoir flow scenario described herein demonstrate a significant improvement during the drought periods. However, to meet the 10% and 30% IFN thresholds and the reservoir water release management, strict restrictions on agricultural irrigation water intakes must be considered. The average KRB flow volume is ~4500 Mm3 during the low flow season (October to March) and ~16,500 Mm3 during the high flow season (April to September). The total capacity of the 17 dams is ~7140 Mm3. As part of the reservoir management and preparation for the next season’s peak flows, up to ~3500 Mm3 (50%) of the dams’ active storage during the lowest season would be released during the low flow season. The proposed reservoir operation procedures were assumed based on the monthly reservoir operation targets. The reservoir routing in the SWAT model was conducted based on the storage assigned for different months in flood and non-flood seasons. The reservoir water release was also synchronized in the model based on the monthly water demand as per the 2010 WB report.

3.3. Effect of Climate Change on Low Flows

The low flow frequency analyses were conducted based on simulated annual minimum 7-day average low flows at the KRB outlet for both the RCP4.5 and RCP8.5 climate scenarios compared to historical records. The base model represents the existing climate conditions with three existing dams in operation. The SWAT model was run considering the operation of the existing dams over the simulation period of 1980–2014. The ‘future reservoir scenario’ represents all 17 large dams in operation (three existing dams and 14 future dams on the Afghanistan side of the KRB). The SWAT targeting storage method and the Tennant Ecological flow method were used to manage the reservoir water collection and release during drought periods. The results presented in Table 5 indicate that the low flow will further decrease by 17% under baseline (existing reservoirs) conditions for 25 years return period, while under the same climate period, the low flows will increase by 110% under the proposed new reservoirs scenario for RCP 4.5 (Table 7). This is caused by the combined effects of decreased winter precipitation, increased winter temperature, and increased winter water demands in the KRB.

3.4. Hydrologic Drought Duration and Standardized Streamflow Index

The SSI concept by Vicente-Serrano is based on other drought indices such as the SPI, Standardized Precipitation, and Evapotranspiration Index (SPEI) [5,33]. In this study the time-series SSI were developed to investigate if the drought is long-term or short-term as well as whether the low flow increase will impact the SSI plot trend line anomaly [66,68]. The SSI graph in Figure 6 highlights the severity of droughts for existing conditions. The release of water from future reservoirs will offset the drought status as per the SSI classification chart. The proposed water release from future dams can improve the SSI in all scenarios.
The KRB average annual temperature is around 8 °C. It is below the average in the surrounding basins. Most of the study area is mountainous with a higher snow storage capacity, higher runoff coefficient, and higher curve number. The milder drought graph can be explained by the above terrain and climatic conditions. However, in the steeper areas (eastern provinces of Afghanistan and in the KRB Pakistan), drought longevity is a serious matter. The results show that the KRB is not experiencing a +2 and ~−2 drought severity index, which are severe drought or wet climate. The KRB is more associated with mild and moderate drought that is hydrologic and seasonal in nature. This type of drought can deplete agricultural products in the economically weak regions. In areas with severe poverty and lack of access to services and resources, this type of drought can have devastating effects on the population.

4. Discussion

4.1. Transboundary KRB Water Sharing Risks and Benefits

The United Nations Convention on the Law of the non-navigational Uses of International Water Source (Doc A/151869, April 1997) stipulates that each state has the right to control territorial waters such as rivers, lakes, and aquifers equitably and reasonably. There is, however, no clear explanation of what ‘fair’ and ‘reasonable’ means [69]. Numerous international precedents interpret this law in different ways. There have been various solutions in cross-boundary water conflict resolution in other countries [70]. These include setting up regional water governance regimes [71], economic regulation of water services [72], and other measures to retain attention from riparian partners during negotiations.
The model considered the planned dams as proposed by the World Bank Scoping document in 2010. The SWAT model outputs show a flow volume reduction of 7.1% if all planned storage sites are constructed. This reduction is not large compared to the ~40% annual decrease in streamflow in the Tigris and Euphrates River basins [73] and the 20% decrease in streamflow in the Yellow River [74]. However, in developmental and economic terms, the significant reduction in peak flow is a substantial incentive available from reservoir augmentation. While reservoir augmentation in the KRB is seasonal, based on the historical and future dam scenarios, the KRB hydrologic drought also has short-term characteristics. Increases in low flow as indicated in the model will significantly reduce the negative impacts of droughts. Yet, this is not sufficient, and the governments should implement stricter regulatory measures to control agricultural land expansion, water intake, and crop selection. The construction of the planned dams will impact the natural and social environment in the KRB vicinity, which means the level of impact is multifaceted. While a separate Environmental Impact Assessment (EIA) is recommended for each site, a risk/benefits chart is presented in Table 8 indicating relevant points for parties to consider during their bilateral cooperation negotiations.
Table 8 is categorized as perceived risks to both sides, real potential risks to one or both sides, and benefits to both sides that should be evaluated and discussed during bilateral cooperation. The perceived and potential risks can be categorized into three groups:
(a)
All issues related to reservoir management, oversight, maintenance, and decommissioning.
(b)
Flow dependency, energy dependency, and use of dams as a proxy tool for geopolitical games.
(c)
Construction costs, environmental risks, displacement, and flow regime change.
Among all scenarios as presented in Table 8, issues related to reservoir management, oversight by parties, maintenance, and decommissioning may grow into potential risks. Afghanistan is recovering from several long wars, and institutional rebuilding for this country will be a long and painful process. It is envisaged that (a) donor(s) can contribute to the reservoir design, and construction will entail the capacity building to properly manage this enterprise. Bilateral cooperation may also result in better reservoir management and flow control. For Pakistan, the flow dependency, hydropower dependency, use of dams as a hegemony, and counter hegemony mediums may be categorized as perceived risks that can easily be mitigated. For all other perceived risks such as construction costs, environmental risks, and displacement, Environmental Impact Assessments (EIAs), and economic modelling studies need to be conducted to justify the monetary value and the environmental relevance of each project. Hydrology and water resources management scholarships have created roadmaps and recommendations for the Kabul water treaty [10,14,75,76]. The recommendation includes conflict transformation, agricultural co-dependence, flood management, drought management, and technical cooperation. The construction of dams has been highlighted as the best management practice for water resource management in this semi-arid region, where seasonal fluctuations heavily impact their inhabitants’ productivity. Several other cross-boundary issues may hinder the trustful water cooperation that should be carefully considered during a full-fledged water diplomacy.

4.2. Drought Management—A Transboundary Cooperation Framework

The United Nations Food Program (FAO) developed a drought risk management strategy that includes the following pillars:
(a)
improving risk assessment capacities;
(b)
strengthening drought risk governance;
(c)
improving investments in drought risk management and response.
The three areas of transboundary drought management strategy are important pillars in mitigating the long-term hydrologic drought implications. The first pillar is related to the science-based drought management framework development using computer modeling and statistical analysis to provide the essential information for an open and transparent transboundary management. The drought risk assessment capacities can only work if there are mechanisms for data exchange, mutual trust in cooperation, and providing long-term economic and social incentives to make the process of risk assessment a durable and sustainable endeavor.
These principles are part of the sustainable development strategy in Afghanistan and Pakistan. It is important to develop joint drought risk management strategies at the basin level similar to flood risk management. Therefore, a joint drought commission from Afghanistan and Pakistan is proposed to alleviate the impacts of hydrologic drought and the safe passage of food during the drought periods (Table 9).

5. Conclusions

The Kabul River is a transboundary river that has experienced rapid population growth and is desperately in need of fresh water for food production and domestic/industrial uses. This research assessed how much the future reservoir waters will mitigate hydrologic droughts, which are common natural disasters in this region. A joint Afghanistan and Pakistan Drought Commission (APDC) is proposed to set limits on agricultural land expansion, water intake, and regulating the flow regimes on both sides of the border. This study analyzed the potential of mitigating hydrologic droughts and provides guidance for safer access to citizens of the KRB from three major aspects: low flow analysis, irrigation water demand, and risk mitigation. The key findings are:
(1)
Low Flow Analysis: during a modeled seven-day average 20-year return period, the post-reservoir low flow at the KRB Afghanistan outlet would increase by ~73%. This is a significant improvement with the downstream irrigation water needs, enabling more water for the agricultural plains of Upper Logar, Jalalabad, Nowshera, and Charsaddah. This is proof that low flow augmentation (intentionally emptying the dams halfway) can be considered regularly to increase flows during the dry seasons and prepare the dams to receive the next season floodwaters.
(2)
Irrigation water demands: the potential increase in the KRB (Afghanistan) irrigated land will require ~1100 Mm3 of mean annual flow. While the post-reservoir flow augmentation will significantly improve the downstream streamflow during the dry season, the drought severity is expected to increase in the last quarter century under both RCP 4.5 and RCP 8.5 scenarios. It is indicated that agricultural land expansion must be regulated in the KRB in its entirety by a joint KRB commission. Any future developed agricultural lands on both sides of the DBL beyond the total of 25% of the current agricultural land per quarter century must be mutually agreed upon by both sides. Any water intake greater than 50 m3/d from the KRB should be subject to regulatory approvals and require permits to take water.
(3)
Risk Mitigation: the planning and construction of new dams in the headwaters will create perceivable potential risks for both riparian countries. Potential risks such as weak capacities in the Afghanistan side in reservoir management, oversight, maintenance, and decommissioning may be expected. Any funding and planning initiative must consider the capacity to build associated water resource management institutions. Other mentioned risks are mostly due to natural causes and may be solved during the design and implementation of the projects.
This study proposes a joint international drought commission to set limits on agricultural land expansion, water intake levels, and the need to regulate the flow regimes on both sides of the border. While the findings may promise some value for investment in both Afghanistan and Pakistan, it is important for policymakers to consider the adverse effects of reservoir construction, including potential risks to both countries, the natural environment, and the social fabric of communities. This research is significant because the proposed series of large dams planned by the Government of Afghanistan, while a controversial move, can potentially serve as an opportunity in resource utilization and the start of a new era of bilateral co-operation. Findings from this research can serve as a support document for policymakers, government institutions, and the donor community to develop a blueprint for trans-boundary collaboration in the KRB water resources management.

Author Contributions

Conceptualization, Y.M.T., E.M., B.G., P.D.; methodology, Y.M.T., E.M., P.D., Y.L., B.G., N.K.S.; modelling, Y.M.T., Y.L., formal analysis, Y.M.T., E.M., P.D., Y.L., B.G., A.J.; resources, E.M., B.G.; data curation, Y.M.T.; writing—original draft preparation, Y.M.T., E.M., P.D, Y.L., B.G.; writing—review and editing, Y.M.T., E.M., B.G., A.J.; visualization, Y.M.T.; supervision, E.M., P.D., Y.L., B.G.; funding acquisition, E.M. and B.G. All authors have read and agreed to the published version of the manuscript.

Funding

This research was funded by the Natural Science and Engineering Research Council of Canada Discovery Grant (#400675 and #400677).

Acknowledgments

The authors acknowledge the contribution of the following agencies that provided recent data for this study: Ministry of Energy and Water of Afghanistan. Ministry of Agriculture, Irrigation and Livestock of Afghanistan; International Centre for Integrated Mountain Development (ICIMOD)—Afghanistan office.

Conflicts of Interest

The authors declare there are no competing interests.

References

  1. Taraky, Y.M.; Liu, Y.; McBean, E.; Daggupati, P.; Gharabaghi, B. Flood Risk Management with Transboundary Conflict and Cooperation Dynamics in the Kabul River Basin. Water 2021, 13, 1513. [Google Scholar] [CrossRef]
  2. Ahn, S.R.; Jeong, J.H.; Kim, S.J. Assessing drought threats to agricultural water supplies under climate change by combining the SWAT and MODSIM models for the Geum River basin, South Korea. Hydrol. Sci. J. 2016, 61, 2740–2753. [Google Scholar] [CrossRef] [Green Version]
  3. Riahi-Madvar, H.; Dehghani, M.; Memarzadeh, R.; Gharabaghi, B. Short to Long-Term Forecasting of River Flows by Heuristic Optimization Algorithms Hybridized with ANFIS. Water Resour. Manag. 2021, 35, 1149–1166. [Google Scholar] [CrossRef]
  4. Redmond, K.T. The depiction of drought: A commentary. Bull. Am. Meteorol. Soc. 2002, 83, 1143–1147. [Google Scholar] [CrossRef] [Green Version]
  5. Vicente-Serrano, S.M.; Beguería, S.; Lorenzo-Lacruz, J.; Camarero, J.J.; López-Moreno, J.I.; Azorin-Molina, C.; Sanchez-Lorenzo, A. Performance of drought indices for ecological, agricultural, and hydrological applications. Earth Interact. 2012, 16, 1–27. [Google Scholar] [CrossRef] [Green Version]
  6. Tallaksen, L.M.; van Lanen, H.A. Key aspects of low flow and Drought. Low Flows Droughts 2007, 13–18. [Google Scholar]
  7. Wang, H.; Chen, Z.; Chen, Y.; Pan, Y.; Feng, R. Identification of the Space-Time Variability of Hydrological Drought in the Arid Region of Northwestern China. Water 2019, 11, 1051. [Google Scholar] [CrossRef] [Green Version]
  8. Tariq, N.; Rahim, A.; Aziz, F.; Yousaf, M. Space and Time Characteristics of Droughts in Kabul River Basin (No. EGU21-392). In Proceedings of the EGU General Assembly, Copernicus Meetings, Online. 19–30 April 2021. [Google Scholar]
  9. Van Loon, A.F.; Ploum, S.W.; Parajka, J.; Fleig, A.K.; Garnier, E.; Laaha, G.; Van Lanen, H.A.J. Hydrological drought types in cold climates: Quantitative analysis of causing factors and qualitative survey of impacts. Hydrol. Earth Syst. Sci. 2015, 19, 1993–2016. [Google Scholar] [CrossRef] [Green Version]
  10. Akhtar, S.M.; Iqbal, J. Assessment of emerging hydrological, water quality issues and policy discussion on water sharing of transboundary Kabul River. Water Policy 2017, 19, 650–672. [Google Scholar] [CrossRef] [Green Version]
  11. Qureshi, A.S. Water Resources Management in Afghanistan: The Issues and Options; IWMI: Colombo, Sri Lanka, 2002; Volume 49. [Google Scholar]
  12. Sadeqinazhad, F.; Atef, S.S.; Amatya, D. Benefit-sharing framework in transboundary river basins: The case of the Eastern Kabul River Basin-Afghanistan. Cent. Asian J. Water Res. 2018, 4, 1–18. [Google Scholar] [CrossRef]
  13. Lashkaripour, G.R.; Hussaini, S.A. Water resource management in Kabul river basin, eastern Afghanistan. Environmentalist 2008, 28, 253–260. [Google Scholar] [CrossRef]
  14. Nafees, M.; Shabir, A.; Zahid, U. Construction of dam on Kabul River and its socio-economic implication for Khyber Pukhtunkhwa, Pakistan. In Seminar on Pak–Afghan Water Sharing Issue; SASSI: Springville, IN, USA, 2016; Volume 23. [Google Scholar]
  15. Ahmadullah, R.; Dongshik, K. Construction of hydraulically balanced water distribution network. In Proceedings of the 2015 International Conference on Intelligent Informatics and Biomedical Sciences (ICIIBMS), Okinawa, Japan, 28–30 November 2015; pp. 96–98. [Google Scholar]
  16. Khan, H.F.; Yang, Y.E.; Wi, S. Case Study on Hydropolitics in Afghanistan and Pakistan: Energy and Water Impacts of Kunar River Development. J. Water Resour. Plan. Manag. 2020, 146, 05020015. [Google Scholar] [CrossRef]
  17. Azizi, A.H.; Asaoka, Y. Incorporating snow model and snowmelt runoff model for streamflow simulation in a snow-dominated mountainous basin in the western Hindukush-Himalaya region. Hydrol. Res. Lett. 2020, 14, 34–40. [Google Scholar] [CrossRef] [Green Version]
  18. Bokhari, S.A.A.; Ahmad, B.; Ali, J.; Ahmad, S.; Mushtaq, H.; Rasul, G. Future climate change projections of the Kabul River Basin using a multi-model ensemble of high-resolution statistically downscaled data. Earth Syst. Environ. 2018, 2, 477–497. [Google Scholar] [CrossRef]
  19. Masood, A.; Mushtaq, H. Spatio-temporal analysis of early twenty-first century areal changes in the Kabul River Basin cryosphere. Earth Syst. Environ. 2018, 2, 563–571. [Google Scholar] [CrossRef]
  20. RECS International Inc.; Yachiyo Engineering Co., Ltd.; CTI Engineering International Co., Ltd.; Sanyu Consultants Inc. The Study for the Development of the Master Plan for the Kabul Metropolitan Area in the Islamic Republic of Afghanistan; Japan International Cooperation Agency (JICA): Tokyo, Japan, 2009.
  21. Omrani, B. The Durand line: History and problems of the Afghan-Pakistan border. Asian Aff. 2009, 40, 177–195. [Google Scholar] [CrossRef]
  22. Rasooli, A.; Kang, D. Assessment of potential dam sites in the Kabul river basin using GIS. Assessment 2015, 6. [Google Scholar]
  23. Nafees, M.; Ahmad, F.; Butt, M.N.; Khurshed, M. Effects of water shortage in Kabul River network on the plain areas of Khyber Pakhtunkhwa, Pakistan. Environ. Monit. Assess. 2018, 190, 1–8. [Google Scholar] [CrossRef]
  24. Walters, S.A.; Groninger, J.W. Water distribution systems and on-farm irrigation practices: Limitations and consequences for Afghanistan’s agricultural productivity. Water Int. 2014, 39, 348–359. [Google Scholar] [CrossRef]
  25. Nalley, D.; Adamowski, J.; Biswas, A.; Gharabaghi, B.; Hu, W. A multiscale and multivariate analysis of precipitation and streamflow variability in relation to ENSO, NAO and PDO. J. Hydrol. 2019, 574, 288–307. [Google Scholar] [CrossRef]
  26. Zaji, A.H.; Bonakdari, H.; Gharabaghi, B. Developing an AI-based method for river discharge forecasting using satellite signals. Theor. Appl. Climatol. 2019, 138, 347–362. [Google Scholar] [CrossRef]
  27. Langridge, M.; Gharabaghi, B.; McBean, E.; Bonakdari, H.; Walton, R. Understanding the dynamic nature of Time-to-Peak in UK streams. J. Hydrol. 2020, 583, 124630. [Google Scholar] [CrossRef]
  28. Livingston, T.; McBean, E.; Marchildon, M.; Gharabaghi, B. Hydrologic Impacts of Climate Change in Relation to Ontario’s Source Water Protection Planning Program. Can. J. Civil Eng. 2020, 48, 1037–1045. [Google Scholar] [CrossRef]
  29. World Bank. Afghanistan—Scoping Strategic Options for Development of the Kabul River Basin: A Multisectoral Decision Support System Approach; World Bank©: Washington, DC, USA, 2010; Available online: https://openknowledge.worldbank.org/handle/10986/18422 (accessed on 15 December 2020).
  30. Ahmadi, B.; Ahmadalipour, A.; Moradkhani, H. Hydrological drought persistence and recovery over the CONUS: A multi-stage framework considering water quantity and quality. Water Res. 2019, 150, 97–110. [Google Scholar] [CrossRef]
  31. Parry, S.; Prudhomme, C.; Wilby, R.L.; Wood, P.J. Drought termination: Concept and characterisation. Prog. Phys. Geogr. 2016, 40, 743–767. [Google Scholar] [CrossRef] [Green Version]
  32. Hisdal, H.; Stahl, K.; Tallaksen, L.M.; Demuth, S. Have streamflow droughts in Europe become more severe or frequent? Int. J. Climatol. 2001, 21, 317–333. [Google Scholar] [CrossRef]
  33. Rivera, J.A.; Otta, S.; Lauro, C.; Zazulie, N. A decade of hydrological drought in Central-Western Argentina. Front. Water 2021, 3, 28. [Google Scholar] [CrossRef]
  34. Villalba, R.; Araneo, D.C.; Rivera, J.A.; Penalba, O.C. Spatio-Temporal Patterns of the 2010–2015 Extreme Hydrological Drought across the Central Andes, Argentina. Water 2017, 9, 20734441. [Google Scholar]
  35. Zorn, M.R.; Waylen, P.R. Seasonal response of mean monthly streamflow to El Nino/Southern Oscillation in north central Florida. Prof. Geogr. 1997, 49, 51–62. [Google Scholar] [CrossRef]
  36. Polong, F.; Chen, H.; Sun, S.; Ongoma, V. Temporal and spatial evolution of the standard precipitation evapotranspiration index (SPEI) in the Tana River Basin, Kenya. Theor. Appl. Climatol. 2019, 138, 777–792. [Google Scholar] [CrossRef]
  37. Balbo, F.; Wulandari, R.A.; Nugraha, M.R.R.; Dwiandani, A.; Syahputra, M.R.; Suwarman, R. The evaluation of drought indices: Standard Precipitation Index, Standard Precipitation Evapotranspiration Index, and Palmer Drought Severity Index in Cilacap-Central Java. In IOP Conference Series: Earth and Environmental Science; IOP Publishing: Bristol, UK, 2019; Volume 303, p. 012012. [Google Scholar]
  38. Eris, E.; Aksoy, H.; Onoz, B.; Cetin, M.; Yuce, M.I.; Selek, B.; Karakus, E.U. Frequency analysis of low flows in intermittent and non-intermittent rivers from hydro-logical basins in Turkey. Water Supply 2019, 19, 30–39. [Google Scholar] [CrossRef]
  39. Singh, V.P.; Strupczewski, W.G. On the status of flood frequency analysis. Hydrol. Process. 2002, 16, 3737–3740. [Google Scholar] [CrossRef]
  40. Cunnane, C. Statistical distributions for flood frequency analysis. Oper. Hydrol. Rep. 1989, 33, 118. [Google Scholar]
  41. Hosking, J.R.M.; Wallis, J.R. The effect of intersite dependence on regional flood frequency analysis. Water Resour. Res. 1988, 24, 588–600. [Google Scholar] [CrossRef] [Green Version]
  42. Nathan, R.J.; Weinmann, P.E. Application of At-Site and Regional Flood Frequency Analyses; National Conference Publication-Institute of Engineers: Sydney, Australia, 1991. [Google Scholar]
  43. Chowdhury, J.U.; Stedinger, J.R.; Lu, L.H. Goodness-of-fit tests for regional generalized extreme value flood distributions. Water Resour. Res. 1991, 27, 1765–1776. [Google Scholar] [CrossRef]
  44. Vogel, R.M.; Thomas, W.O., Jr.; McMahon, T.A. Flood-flow frequency model selection in southwestern United States. J. Water Resour. Plan. Manag. 1993, 119, 353–366. [Google Scholar] [CrossRef] [Green Version]
  45. Bobee, B.; Cavadias, G.; Ashkar, F.; Bernier, J.; Rasmussen, P. Towards a systematic approach to comparing distributions used in flood frequency analysis. J. Hydrol. 1993, 142, 121–136. [Google Scholar] [CrossRef]
  46. Arnold, J.G.; Moriasi, D.N.; Gassman, P.W.; Abbaspour, K.C.; White, M.J.; Srinivasan, R.; Jha, M.K. SWAT: Model use, calibration, and validation. Trans. ASABE 2012, 55, 1491–1508. [Google Scholar] [CrossRef]
  47. Daggupati, P.; Pai, N.; Ale, S.; Douglas-Mankin, K.R.; Zeckoski, R.W.; Jeong, J.; Youssef, M.A. A recommended calibration and validation strategy for hydrologic and water quality models. Trans. ASABE 2015, 58, 1705–1719. [Google Scholar]
  48. Neitsch, S.L.; Arnold, J.G.; Kiniry, J.R.; Williams, J.R. Soil and Water Assessment Tool Theoretical Documentation Version 2009; Texas Water Resources Institute: College Station, TX, USA, 2011. [Google Scholar]
  49. Dile, Y.T.; Srinivasan, R. Evaluation of CFSR climate data for hydrologic prediction in data-scarce watersheds: An application in the Blue Nile River Basin. J. Am. Water Resour. Assoc. 2014, 50, 1226–1241. [Google Scholar] [CrossRef]
  50. Kusangaya, S.; Warburton, M.L.; van Garderen, E.A.; Jewitt, G.P. Impacts of climate change on water resources in southern Africa: A review. Phys. Chem. Earth Parts A/B/C 2014, 67, 47–54. [Google Scholar] [CrossRef]
  51. Iqbal, M.S.; Dahri, Z.H.; Querner, E.P.; Khan, A.; Hofstra, N. Impact of climate change on flood frequency and intensity in the Kabul river basin. Geosciences 2018, 8, 114. [Google Scholar] [CrossRef] [Green Version]
  52. Thrasher, B.; Maurer, E.P.; McKellar, C.; Duffy, P.B. Bias correcting climate model simulated daily temperature extremes with quantile mapping. Hydrol. Earth Syst. Sci. 2012, 16, 3309–3314. [Google Scholar] [CrossRef] [Green Version]
  53. Thilakarathne, M.; Sridhar, V. Characterization of future drought conditions in the Lower Mekong River Basin. Weather Clim. Extrem. 2017, 17, 47–58. [Google Scholar] [CrossRef]
  54. Bao, Y.; Wen, X. Projection of China’s near-and long-term climate in a new high-resolution daily downscaled dataset NEX-GDDP. J. Meteorol. Res. 2017, 31, 236–249. [Google Scholar] [CrossRef]
  55. Sahany, S.; Mishra, S.K.; Salunke, P. Historical simulations and climate change projections over India by NCAR CCSM4: CMIP5 vs. NEX-GDDP. Theor. Appl. Climatol. 2019, 135, 1423–1433. [Google Scholar] [CrossRef]
  56. Sidiqi, M.; Shrestha, S.; Ninsawat, S. Projection of climate change scenarios in the Kabul River Basin, Afghanistan. Curr. Sci. India 2018, 114, 1304–1310. [Google Scholar] [CrossRef]
  57. Hassan, W.H.; Nile, B.K. Climate change and predicting future temperature in Iraq using CanESM2 and HadCM3 modeling. Modeling Earth Syst. Environ. 2021, 7, 737–748. [Google Scholar] [CrossRef]
  58. Jahangir, M.H.; Reineh, S.M.M.; Abolghasemi, M. Spatial predication of flood zonation mapping in Kan River Basin, Iran, using artificial neural network algorithm. Weather Clim. Extrem. 2019, 25, 100215. [Google Scholar] [CrossRef]
  59. DeFlorio, M.J.; Pierce, D.W.; Cayan, D.R.; Miller, A.J. Western US extreme precipitation events and their relation to ENSO and PDO in CCSM4. J. Clim. 2013, 26, 4231–4243. [Google Scholar] [CrossRef] [Green Version]
  60. Sayama, T.; Ozawa, G.; Kawakami, T.; Nabesaka, S.; Fukami, K. Rainfall–runoff–inundation analysis of the 2010 Pakistan flood in the Kabul River basin. Hydrol. Sci. J. 2012, 57, 298–312. [Google Scholar] [CrossRef]
  61. Najmuddin, O.; Deng, X.; Siqi, J. Scenario analysis of land use change in Kabul River Basin–a river basin with rapid socio-economic changes in Afghanistan. Phys. Chem. Earth Parts A/B/C 2017, 101, 121–136. [Google Scholar] [CrossRef]
  62. Abbaspour, K.C.; Johnson, C.A.; van Genuchten, M.T. Estimating uncertain flow and transport parameters using a sequential uncertainty fitting procedure. Vadose Zone J. 2004, 3, 1340–1352. [Google Scholar] [CrossRef]
  63. Nash, J.E. River flow forecasting through conceptual models, I: A discussion of principles. J. Hydrol. 1970, 10, 398–409. [Google Scholar] [CrossRef]
  64. Faramarzi, M.; Srinivasan, R.; Iravani, M.; Bladon, K.D.; Abbaspour, K.C.; Zehnder, A.J.; Goss, G.G. Setting up a hydrological model of Alberta: Data discrimination analyses prior to calibration. Environ. Model. Softw. 2015, 74, 48–65. [Google Scholar] [CrossRef]
  65. Grusson, Y.; Sun, X.; Gascoin, S.; Sauvage, S.; Raghavan, S.; Anctil, F.; Sáchez-Pérez, J.M. Assessing the capability of the SWAT model to simulate snow, snow melt and streamflow dynamics over an alpine watershed. J. Hydrol. 2015, 531, 574–588. [Google Scholar] [CrossRef]
  66. Ahmadianfar, I.; Kheyrandish, A.; Jamei, M.; Gharabaghi, B. Optimizing operating rules for multi-reservoir hydropower generation systems: An adaptive hybrid differential evolution algorithm. Renew. Energy 2021, 167, 774–790. [Google Scholar] [CrossRef]
  67. Tennant, D.L. Instream flow regimens for fish, wildlife, recreation and related environmental resources. Fisheries 1976, 1, 6–10. [Google Scholar] [CrossRef]
  68. Wu, J.; Chen, X.; Yu, Z.; Yao, H.; Li, W.; Zhang, D. Assessing the impact of human regulations on hydrological drought development and recovery based on a ‘simulated-observed’comparison of the SWAT model. J. Hydrol. 2019, 577, 123990. [Google Scholar] [CrossRef]
  69. Haftendorn, H. Water and international conflict. Third World Q. 2000, 21, 51–68. [Google Scholar] [CrossRef]
  70. Weinthal, E.; Troell, J.; Nakayama, M. Water and post-conflict peacebuilding: Introduction. Water Int. 2011, 36, 143–153. [Google Scholar] [CrossRef]
  71. Wiek, A.; Larson, K.L. Water, people, and sustainability—a systems framework for analyzing and assessing water governance regimes. Water Resour. Manag. 2012, 26, 3153–3171. [Google Scholar] [CrossRef]
  72. Gerlach, E.; Franceys, R. Regulating water services for all in developing economies. World Dev. 2010, 38, 1229–1240. [Google Scholar] [CrossRef]
  73. Daggupati, P.; Srinivasan, R.; Ahmadi, M.; Verma, D. Spatial and temporal patterns of precipitation and stream flow variations in Tigris-Euphrates river basin. Environ. Monit. Assess. 2017, 189, 50. [Google Scholar] [CrossRef]
  74. Zhao, G.; Tian, P.; Mu, X.; Jiao, J.; Wang, F.; Gao, P. Quantifying the impact of climate variability and human activities on streamflow in the middle reaches of the Yellow River basin, China. J. Hydrol. 2014, 519, 387–398. [Google Scholar] [CrossRef]
  75. Akhtar, F.; Awan, U.K.; Tischbein, B.; Liaqat, U.W. Assessment of irrigation performance in large river basins under data scarce environment—A case of Kabul river basin, Afghanistan. Remote Sens. 2018, 10, 972. [Google Scholar] [CrossRef] [Green Version]
  76. Atef, S.S.; Sadeqinazhad, F.; Farjaad, F.; Amatya, D.M. Water conflict management and cooperation between Afghanistan and Pakistan. J. Hydrol. 2019, 570, 875–892. [Google Scholar] [CrossRef]
Figure 1. Location of the Kabul River Basin and the study area (circled in red).
Water 13 02628 g001
Figure 2. Flowchart that visualizes the study of the KRB.
Water 13 02628 g002
Figure 3. Measured and simulated monthly flow at the Dakah station from 2008 to 2014 (bias of 3.4%, NSE of 0.74, and R2 of 0.80).
Water 13 02628 g003
Figure 4. Simulated daily flow at the outlet of KRB (Afghanistan) with and without future dams.
Water 13 02628 g004
Figure 5. Mean monthly flow (left) and cumulative flow volume (right) at the Dakah Station for sample wet year (1991) and dry year (2002) with and without dams.
Water 13 02628 g005
Figure 6. The Standardized Streamflow Index (SSI) for KRB flows at the Dakah Station without (top figure) and with (bottom figure) the low flow augmentation benefits of the proposed series of large dams.
Water 13 02628 g006
Table 1. Existing and proposed dams in the KRB (Afghanistan) (Source: WB, 2010; Vol 1, Chapter 4, Toosab and RCUWM 2006 mission estimates).
No.NameExisting/
Proposed
Height (m)Surface Area (km2)Gross Storage (Mm3)Live Capacity (Mm3)Installed Capacity (MW)Capital Cost (MUSD)
1BarakProposed1556.85303901001174
2Panjshir 1Proposed18016.6130011301001078
3Konar_AProposed7515.512121010366948
4TotumdaraProposed1355.241034075332
5BaghdaraProposed405.1400330210607
6Konar_BProposed750.9734881232
7Laghman_A 805.240528844125
8NaghluExisting1107.055037575302
9SarobiExisting520.6513311202
10Sarobi -IIProposed2002.5196128210442
11DaruntaExisting752.8220180100115
12KamaProposed230.973484087
13HaijanProposed502.8220200072
14GatProposed856.4500440051
15Tangi_WardagProposed204.53503000356
16ShatootProposed1131.42502250222
17KajabProposed855.14003650207
Table 2. SSI Classification Chart.
LevelSSIClassification
1SSI > 0Wet
2−1 ≤ SSI < 0Mild Drought
3−1.5 ≤ SSI < −1Moderate Drought
4−2.0 ≤ SSI < −1.5Severe Drought
5SSI < −2.0Extreme drought
Table 3. Datasets and their resolution employed in the study.
No.Dataset NameResolution
1CANESM2 global downscaled NEX CMIP5 Climate Projection(0.25°) GCMs from the 5th Coupled Model Inter-comparison Project (CMIP5)
2CCSM4 global downscaled NEX CMIP5 Climate Projection(0.25°) GCMs from the 5th Coupled Model Inter-comparison Project (CMIP5)
3CNRM-CM5 global downscaled NEX CMIP5 Climate Projection(0.25°) GCMs from the 5th Coupled Model Inter-comparison Project (CMIP5)
4CSIRO-MK 3-6-0 global downscaled NEX CMIP5 Climate Projection(0.25°) GCMs from the 5th Coupled Model Inter-comparison Project (CMIP5)
5GFDL-CM3 global downscaled NEX CMIP5 Climate Projection(0.25°) GCMs from the 5th Coupled Model Inter-comparison Project (CMIP5)
6MRI- C GCM3 global downscaled NEX CMIP5 Climate Projection(0.25°) GCMs from the 5th Coupled Model Inter-comparison Project (CMIP5)
7National Centers for Environmental Prediction (NCEP) Climate Forecast System Reanalysis (CFSR).~38 km (T382) with 64 levels 0.5° Resolution
8DEM Geospatial data from USGD National Elevation Datasets (NED)30 m
9Land Use Data from National Land Cover Database (NLCD)30 m
10User Soil from National Land Cover Database (NLCD)30 m
Table 4. Existing and future irrigation water demands in the KRB (Afghanistan and Pakistan).
KRB RegionsExisting Irrigated Land (ha)Existing Irrigation Water Demand (Mm3/y)Potential Irrigated Land (ha)Potential Irrigation Water Demand (Mm3/y)Total Irrigation Water Demand (Mm3/y)
Afghanistan292,680267277,1297043377
Pakistan151,488138343,3263961779
Table 5. Major runoff and flow parameters in the KRB SWAT model.
NoParameterDescriptionBest Value
1SFTMPSnowfall temperature (°C)−1.85
2SMTMPSnow melt base temperature (°C)2.75
3SMFMXMaximum melt rate for snow during year (mm/°C/day)5.70
4SMFMNMinimum melt rate for snow during the year (mm/°C/day)2.75
5TIMPSnowpack temperature lag factor0.05
6PLAPSPrecipitation lapse rate (mm/km)7.10
7TLAPSTemperature lapse rate (°C/km)6.25
8SNO_SUBInitial snow water content (mm)20.0
9ALPHA_BFBaseflow alpha-factor (days)0.35
10GW_DELAYGroundwater delay (days)265
11GWQMNThreshold depth of water required for return flow (mm)3050
12REVAPMNThreshold depth of water for “revap” to occur (mm)450
13GW_REVAPGroundwater “revap” coefficient0.10
14RCHRG_DPDeep aquifer percolation fraction0.05
15SOL_ZDepth from soil surface to bottom of layer (mm)−0.05 *
16SOL_BDMoist bulk density (m3/m3)0.10 *
17SOL_AWCAvailable water capacity of the soil layer (mm)0.03 *
18SOL_KSaturated hydraulic conductivity (mm/hr)0.06 *
19SOL_ALBMoist soil albedo0.15 *
20SOL_CRKCrack volume potential of soil0.05
21CANMXMaximum canopy storage (mm)9.65 *
22ESCOSoil evaporation compensation factor0.75
23EPCOPlant uptake compensation factor0.65
24SURLAGSurface runoff lag time (days)2.50
25OV_NManning’s “n” value for overland flow−0.10 *
26SLSUBBSNAverage slope length (m)−0.05 *
27CN2SCS runoff curve number−0.11 *
28CH_N2Manning’s “n” value for the main channel0.055
29CH_K2Effective hydraulic conductivity in the main channel (mm/hr)15.5
The * symbol indicates relative change from threshold.
Table 6. Seven-day average low flow statistics with and without the proposed new large dams.
Return Period
(Years)
Without DamsWith Dams
Low Flows (m3/s)Low Flows (m3/s)
2137173
589128
1064102
204681
503060
1002247
Table 7. Simulated low flows of future climate compared to the historical with and without reservoirs.
RCPReturn Period (Year)S0 (m3/s)S1 (m3/s)S2 (m3/s)
4.5213775143
58955106
10644487
25463880
50303475
100223170
8.5213772141
5895998
10645186
25464273
50303664
100223156
Note: Scenario S0—simulated 7-day average low flows based on historical climate and existing reservoir condition; Scenario S1—simulated 7-day average low flows based on CCSM4 future climate data, existing reservoirs, and associated future water demands; Scenario S2—simulated 7-day average low flows based on CCSM4 future climate data, proposed reservoirs, and associated water demands.
Table 8. KRB Risk/Benefit Chart for Afghanistan and Pakistan.
Afghanistan’s PerspectivePakistan’s Perspective
Perceived Risks
  • Dam construction costs (7.7 billion USD)
  • Maintaining the security of the dams
  • Environmental risks
  • Human displacement
  • Hazard creep and dam breach inundation
  • Seismic hazards for dam safety
  • Dam maintenance and decommission costs
  • Institutional weakness in dam management
  • Retaliatory measures by Pakistan if the bilateral cooperation is not reached (transit, trade, visa restrictions)
  • Environmental risks
  • Flow regime change
  • Possible energy dependency-Afghanistan may control the transmission of electricity and therefore be in the ruling position
  • Dam failure and downstream flooding
  • Use of dams as a political pressure instrument
  • Weak reservoir management mechanisms (inadequate reservoir operation capacities in Afghanistan)
  • Inadequate reservoir management oversight mechanisms (due to weak diplomatic relations)
Proven/Quantified Benefits
Water retention and conservation (3000 Mm3 of floodwaters stored and used in the dry season)
Flood risk reduction from 2-yr event to 10-yr event.
Hydropower generation (1400 MWh)
Food production from new irrigated land (~ USD 130 Mln. of Crop Yield)
Food exchange
Bilateral relations improvement
Transit and trade improvement
Data exchange and joint water management
Investment funds attraction for dam construction, food production and trade
Water retention and conservation (3000 Mm3 of floodwaters stored and used in the dry season)
Flood risk reduction from 2-yr event to 10-yr event.
Hydropower available for import (700 MWh)
Food production from new irrigated land (~ USD 74 million of Crop Yield)
Food exchange
Bilateral relations improvement
Transit and trade improvement
Data exchange and joint management
Investment funds attraction for dam construction, food production and trade
Table 9. Proposed Joint Drought Commission Action Plan Roadmap.
Action PlanInstitutional ArrangementsParticipants
Institutional arrangement
  • Develop a collective strategic framework
  • Develop drought warning mechanisms
  • Develop drought hazard exposure maps in KRB
  • Statistical analysis and predictions of Drought
  • Statistical analysis of the drought recovery
  • Drought vulnerability in the provinces adjacent to DBL
Afghanistan and Pakistan Joint Drought commission
Drought Recovery Fund
Establish transboundary drought recovery fund with donor support
Develop agricultural sector drought financial support mechanisms
Government quota for drought-affected agribusiness
Afghanistan/Pakistan/ Donor Agencies
Low Flow and Drought
  • Identify drought extensive regions and periods
  • Reservoir flow management based on SSI and ACDV
Afghanistan
Food exchange and Drought
Supplementary food exchange to areas with higher ACDV and longer SSI
Provision of food exchange support and establish tariff-free drought regions.
Increase agricultural water productivity through efficient irrigation systems
Afghanistan and Pakistan
Publisher’s Note: MDPI stays neutral with regard to jurisdictional claims in published maps and institutional affiliations.

