You are currently viewing a new version of our website. To view the old version click .
Water
  • Article
  • Open Access

17 September 2021

A Spatial Structure Variable Approach to Characterize Storm Events for Coastal Flood Hazard Assessment

,
and
ICEA Department, Padua University, v. Ognissanti 39, 35129 Padova, Italy
*
Authors to whom correspondence should be addressed.
This article belongs to the Special Issue Assessment of Current and Future Vulnerability of Coastal Flooding

Abstract

Over the last decades, the evaluation of hazards and risks associated with coastal flooding has become increasingly more important in order to protect population and assets. The general purpose of this research was to assess reliable coastal flooding hazard maps due to overflow and wave overtopping. This paper addresses the problem of defining credible joint statistics of significant wave heights Hs and water levels ζ, focusing on the selection of the sample pair that characterizes each sea storm, to evaluate the occurrence probability of extreme events. The pair is selected maximizing a spatial structure variable, i.e., a linear combination of Hs and ζ, specific to each point of the area at risk. The structure variable is defined by the sensitivity of the flooding process to Hs and ζ, as found by analyzing a set of inundation maps produced through a Simplified Shallow-Water numerical model (SSW). The proposed methodology is applied to a coastal stretch in the Venetian littoral (Italy), by means of a 30 year-long time series recorded at the “Acqua Alta” oceanographic research tower, located in the Northern Adriatic Sea in front of the Venetian lagoon. The critical combination of Hs and ζ forming the structure variable is presented in a map, and it can be related to the topography and the presence of mitigation measures. The return period associated with the two recent large storms that occurred in this area in 2018 and 2019 is also investigated. The proposed procedure gives credible occurrence probabilities for these events, whereas other approaches would consider them extremely unlikely.

1. Introduction

Coastal flooding is frequently associated with two mechanisms occurring during a sea storm: overflow and wave overtopping. In the first case, the freeboard of the local levee/defense structure is steadily below the water level, whereas in the second case the flood volumes depend on the oscillating nature of the waves. They are often threatened as separate mechanisms although waves and water levels clearly affect each other. The local water level in front of the coast is a combination of offshore sea level and wave setup, influenced by the breaking process. Similarly, the wave characteristics are affected by the water level during propagation, and hence these phenomena are interrelated.
The main motivation of this paper is related to the challenges posed by the appropriate definition of sample pairs to be used for bivariate (significant wave heights Hs − water levels ζ) statistical analysis, in the framework of coastal flooding hazard assessment.
Bivariate statistical methods are significantly affected by the approach used for the selection of just two lumped values (Hs, ζ) characterizing each stormy event.
Several authors (Coles and Tawn [], Zachary et al. [], Masina et al. [], Li et al. [], Hawkes et al. []) analyzed engineering problems considering a sample formed by the load maxima within the storm and assuming that these maxima are simultaneous. This procedure overlooks the correlation between wave heights and water levels within the event and systematically considers the worst possible scenario in terms of coastal flooding. Zachary et al. [] also examined the approach where one variable is considered of primary importance and the combination is formed by the maximum of this variable and the concomitant observation of the remaining variable. The results of this statistical approach can vary according to which variable is considered of primary importance. It may severely underestimate the probability of the events where both variables are high, but not maximum, in favor of those with only one variable at its maximum: the consequent joint distribution may inconsistently predict as extremely rare some combinations of (Hs, ζ) that are instead frequently observed in the same time-series from which the pairs are derived.
Recently, by simulating different 100-year scenarios, Lerma et al. [] showed that the choice of statistical method used to define the forcing conditions for the scenarios produces notable differences in the results.
The appropriate selection approach is reasonably related to the investigated failure mechanism. Hence an alternative procedure consists of generating a single structure variable that is a function of the constituent variables (Coles and Tawn []). The new variable represents the system response, for instance, the volume of overtopping that is a function of waves and sea levels. This procedure allows a dimension reduction and therefore the use of classical univariate statistics instead of a multivariate extreme value theory (i.e., performed on the constituent variables).
The single structure variable method, if accompanied with proper declustering, correctly accounts for correlation within the event but suffers from being site-specific (Zachary et al. [], Arnoux et al. []). In many coastal engineering problems, this is a significant limitation, for instance when dealing with the definition of design conditions for offshore or coastal structures, for which different designs imply different structure variables. Coastal flooding hazard is frequently analyzed with reference to large spatial scales, i.e., an entire coastal region, therefore a site-specific statistical analysis is not a true restraint.
The present study proposes therefore a spatial structure variable, where the term spatial means that it depends on a parameter specific for each area that is subject to flooding. Therefore, according to this approach, the hazard of each storm depends on the area under analysis, so that the combination of water levels and wave height with return period of, say, 100 years, is different for different locations. This makes sense since the critical combination is different for mild and steep shorefaces, high or low dunes, protected and unprotected beaches.
This approach was suggested by a critical reanalysis, in view of two events observed in 2018 and 2019, of the coastal flooding hazard assessment carried out by the Authors (Favaretto et al. []) for the Venetian littoral. In fact, due to the selected declustering scheme, the events of combined water levels and wave height observed in 2018 and 2019 appeared extremely rare in the predicted joint extreme statistics.
The objective of this paper is to propose a more reliable methodology to decluster the data, and to apply it to a stretch of coast in the Venetian littoral, which is a low-lying coastal area affected by relatively high storm surges and wind waves that may induce flooding and cause damages to the several high-value touristic cities (Venice, Jesolo, Caorle, etc.) and zones with environmental relevance (Po River Delta). This methodology can be useful to define appropriate mitigation measures and management strategies (Foti et al. [], Di Risio et al. []).
Section 2 presents the declustering scheme, the method to devise the new variable and the sampling procedure. In the third section, the methodology is applied to the Caorle coastline (Venice, Italy) and a comparison of the results of the statistical analysis carried out with the proposed methodology and with more traditional sampling procedures is also presented. Finally, conclusions are drawn.

3. Case Study

The Venetian littoral faces the North Adriatic Sea and is characterized by two main wind (and correspondingly wave) regimes, Bora and Scirocco, which blow from the Northeast and Southeast, respectively (Umgiesser et al. []). Waves up to 6 m and high storm surges are responsible for the flooding of this coastal area as well as Venice.
Recently, two extreme events occurred along the Venetian littoral in 2018 (Vaia storm described in [,]) and in 2019 ([,]). The first event was characterized by an extreme significant wave height of 5.92 m and a sea level of 1.56 m relative to the local tidal reference (named ZMPS, Zero Mareografico Punta Salute), conversely, the 2019 event was characterized by an extreme sea level of 1.82 m ZMPS and a wave height of 3.5 m. Both events caused localized erosion and marine ingression along the Venetian coast.
Caorle is a coastal town located on the Northeast side of the Venetian littoral and is one of the 20 coastal cells identified by Ruol et al. []. The Caorle coastline is 5 km long and is confined between the lagoon’s inlet of Falconera to the North and the mouth of the Livenza river to the South, both protected with jetties (Figure 6). The cell can be subdivided into three main parts: (i) “Spiaggia di Levante” to the Northeast; (ii) “Murazzi” in the central part; and (iii) “Spiaggia di Ponente” to the Southwest. The historic town is in the central part, protected by a sea wall that stabilizes the shoreline and mitigates the risk of flooding. North of this sea wall, there is a cusp, where the historic church named “Chiesa della Madonna dell’Angelo” is situated. The entire cell is urbanized and no system of dunes is present. The economy is mainly based on tourism (∼4,300,000 visitors in 2018, i.e., the 9th city in Italy for the number of presences) and fishing activities. Natural subsidence affects the area, with a rate of −2 to −4 mm/year [].
Figure 6. Location and orthophoto of the study site: the Caorle coastline.

Available Data

For the area under investigation, data and information were collected, harmonized and stored in a Coastal GIS []. The topographic data, useful for the present study, comprises Digital Elevation Model (DEM, 1 m resolution) from a Lidar survey (2013) and bathymetric surveys (2014).
Times series of sea levels and significant wave heights are available at the oceanographic tower “Acqua Alta” situated 8 miles offshore in a water depth of 16 m in the Gulf of Venice (Lat 45°18′51.27′′ N, Lon: 12°30′29.93′′ E). The Hs time series is available from October 1987 to December 2007 with a recording time step Δt of 3 h and from January 2008 to March 2017 with a Δt = 30 min. The sea levels are available from January 1980 to December 2018 with a Δt = 1 h. For the 2018 event, the Hs is available during October ([]) every 1 h. For the 2019 event (from 1 November to 1 December 2019), the Hs and ζ are available every 10 min and measured by the “Centro Previsioni e Segnalazioni Maree—CPSM, Venice” institution. To get a homogeneous bivariate series, the Hs dataset is firstly interpolated every 3 h and then the time step is re-set equal to 1 h as for the ζ dataset. Only the simultaneous recording period is taken into account, i.e., from October 1987 to March 2017. The two extreme events (2018 and 2019) are included in the statistical analysis and their representative values of Hs and ζ are taken every 1 h in accordance with the 1987–2017 dataset.
The annual mean sea levels ζMSL for the Venetian littoral [] are available from 1870 to 2017 measured at “Punta della Salute” station, situated approximately in front of the St. Mark square in the city of Venice. The ζMSL is the long-term trend, described as a function of time, whereas ζ* (defined as ζ* = ζ − ζMSL) is a stationary stochastic variable.

4. Results

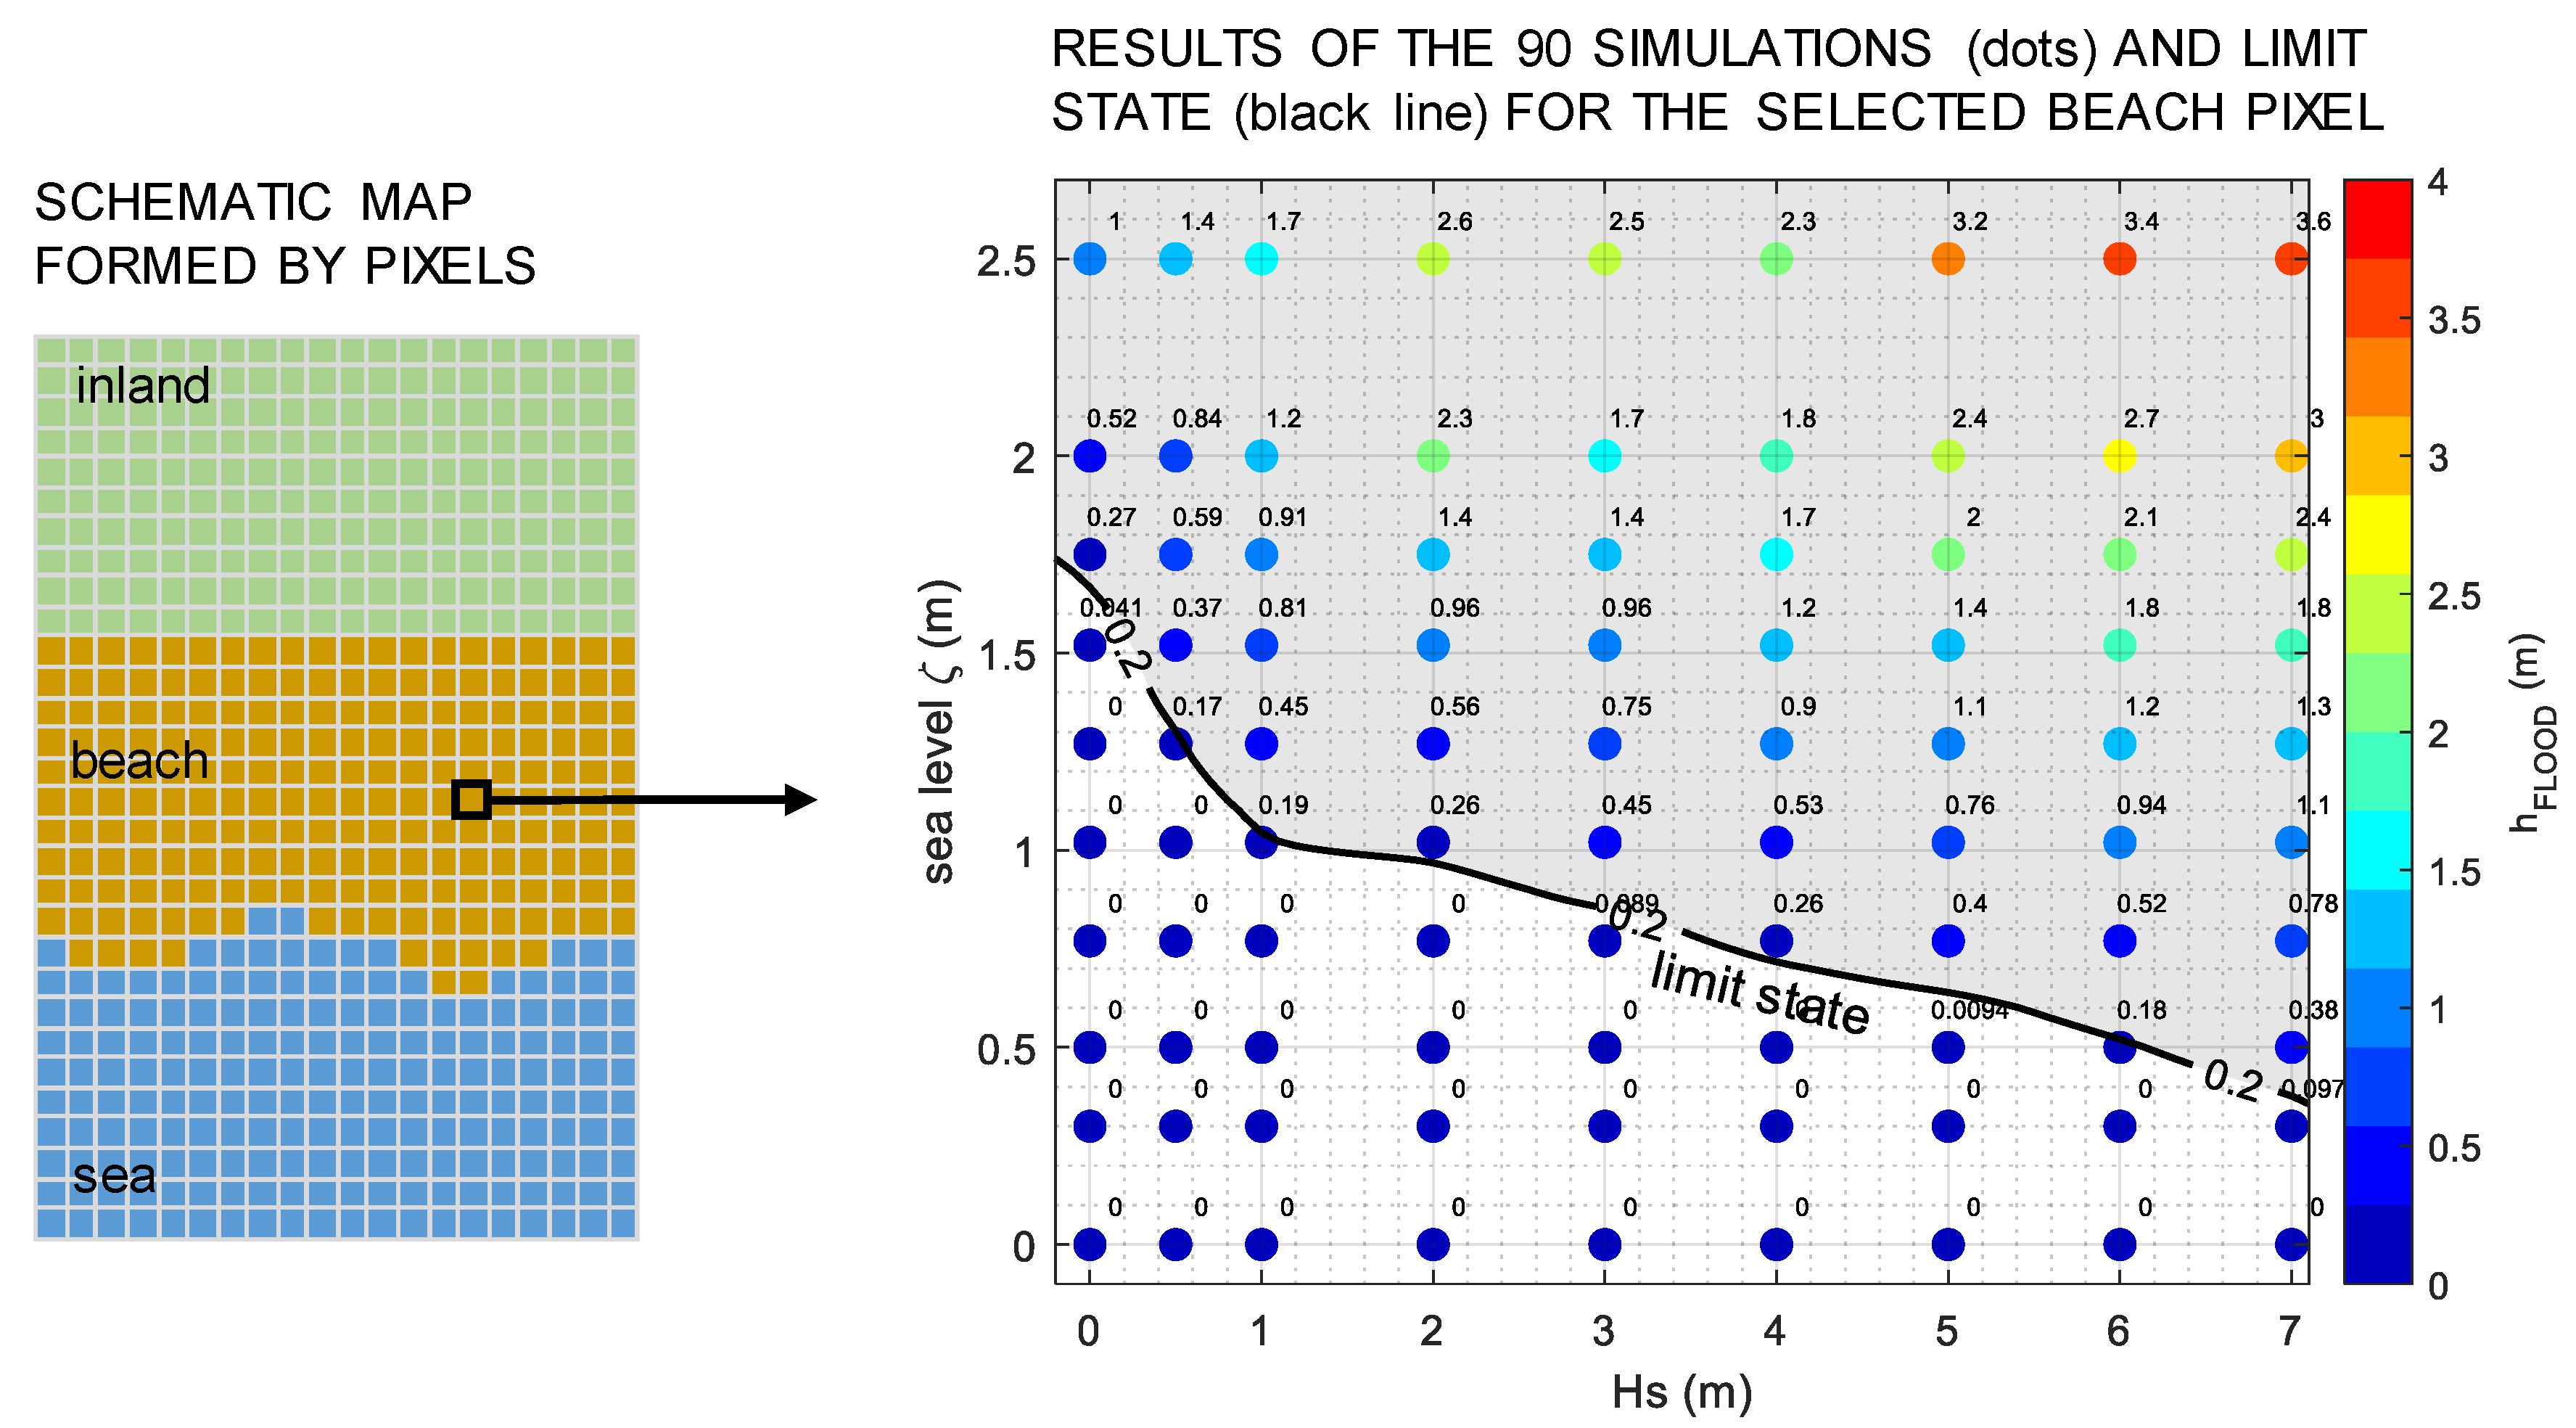
Following the proposed methodology, a dataset of 90 flooding maps is assessed, considering an offshore significant wave height Hs ranging from 0 m to 7 m and ζ* ranging from 0 m to 2.5 m.
The SSW model is used to evaluate each map. The grid is formed by regular cells (dx = dy = 1 m) and covers an area of ~1.5 km × 4.9 km (7.5 × 10⁶ cells); the Gauckler–Strickler coefficient Ks used is 50 m1/3/s. Two different boundary conditions were considered: one at the shoreline, i.e., sea levels and significant wave heights, and the other at the two mouths (Livenza and Falconera), i.e., only the sea levels. Each simulation covers only 6 h and the flooding maps include the maximum flooded depth reached during the simulations.
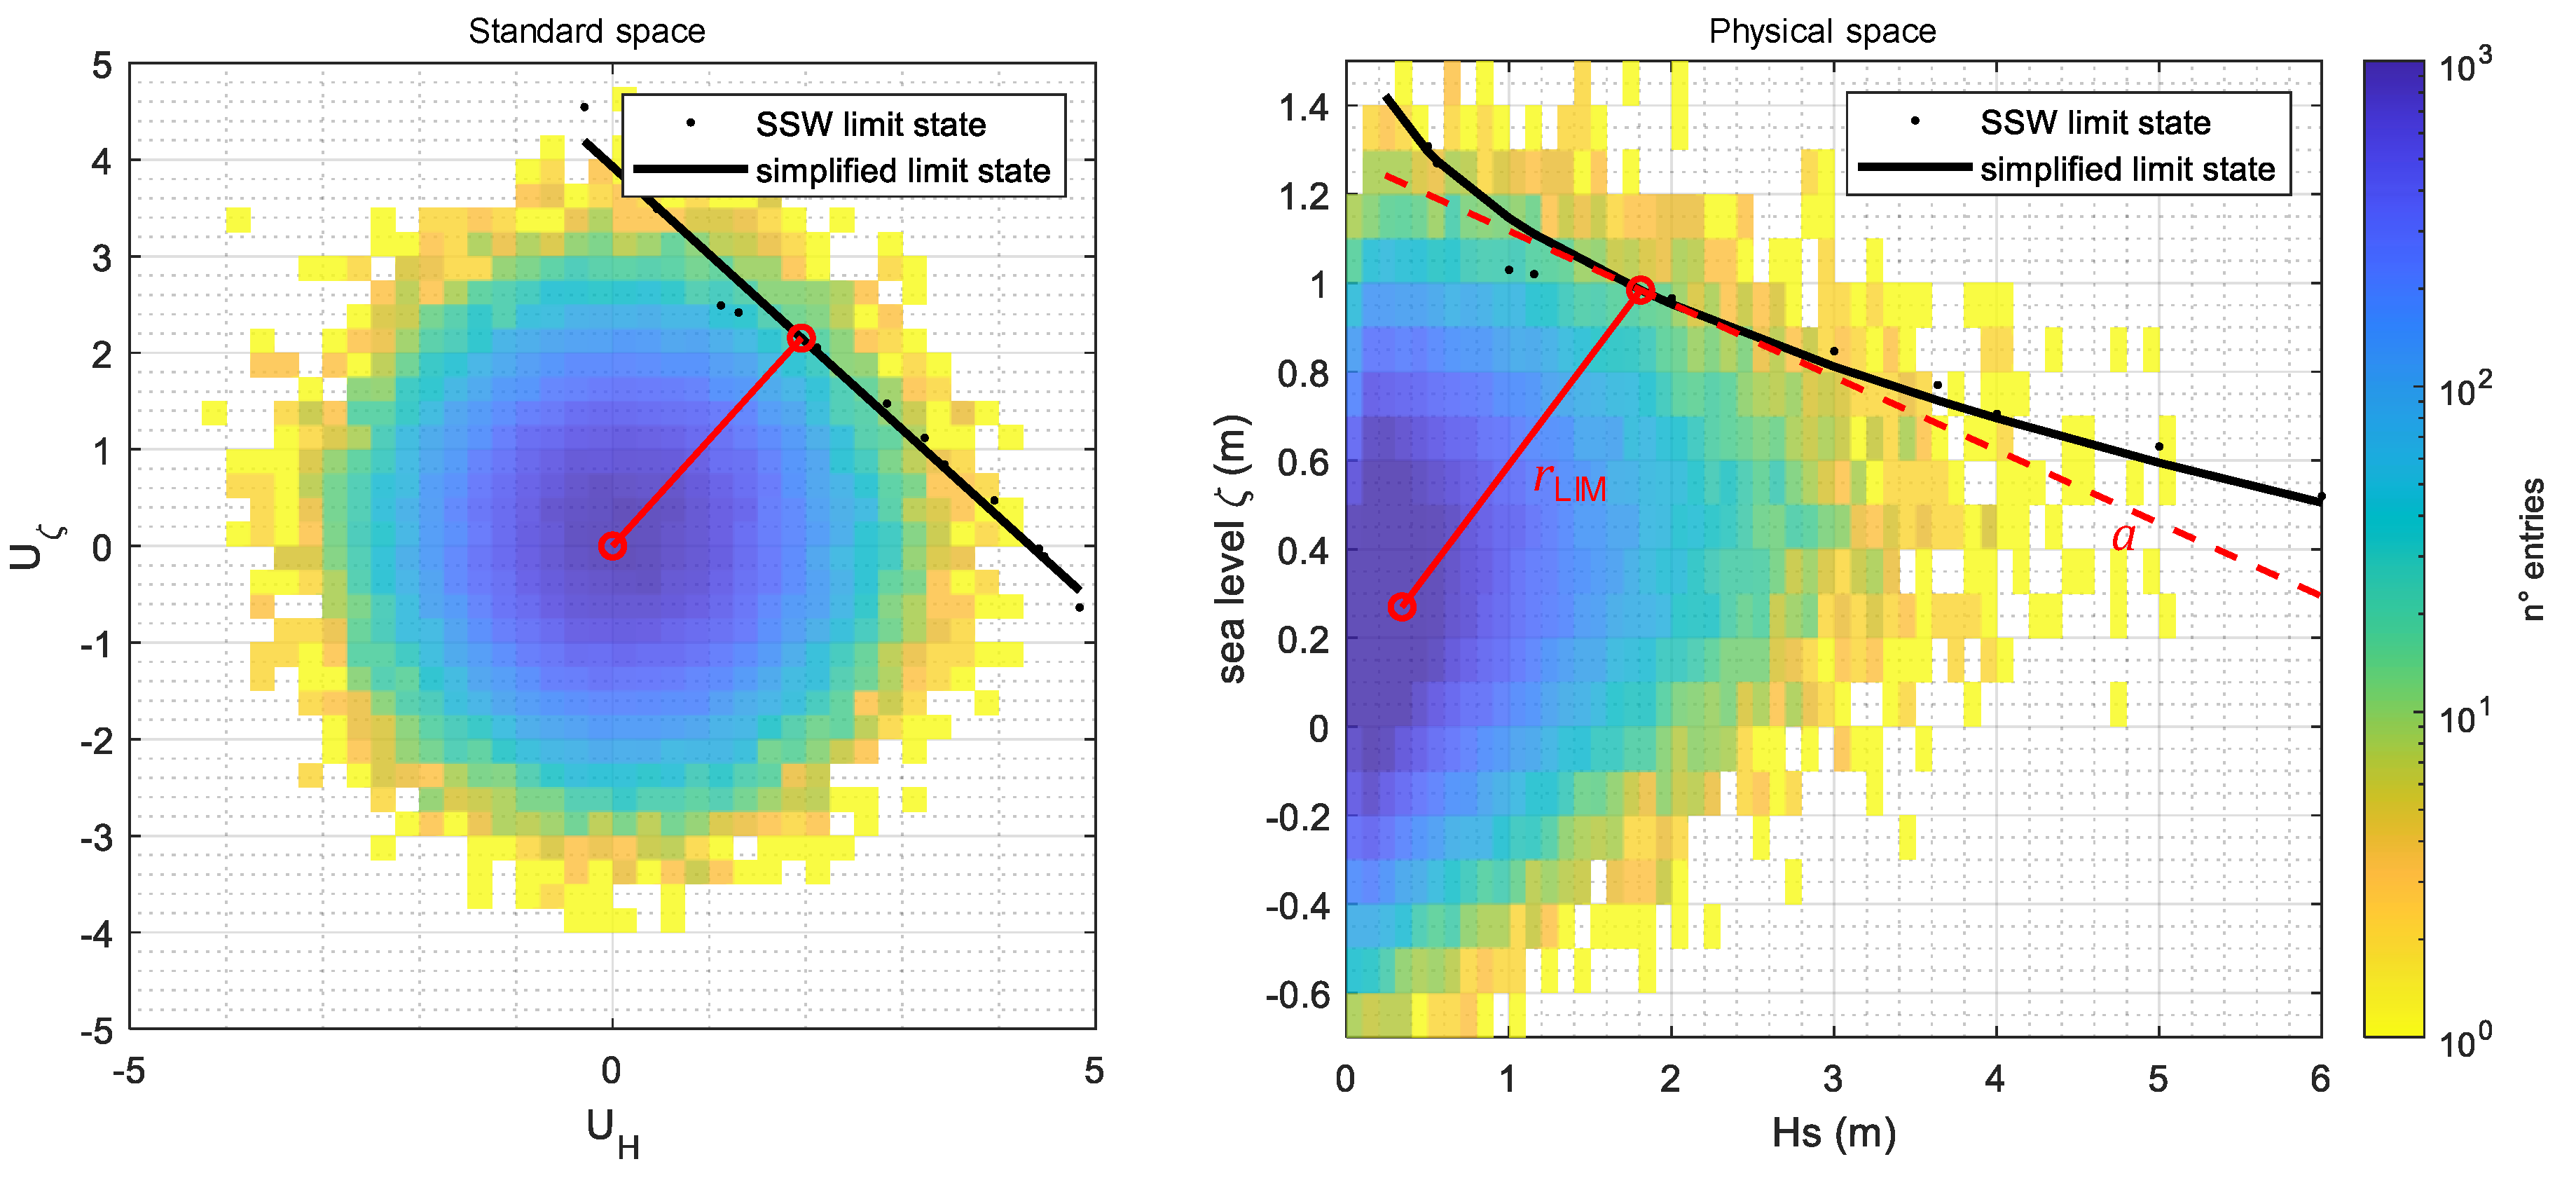
These resulting maps were used to evaluate the coefficient a and the rLIM value of the structure variable, considering hLIM = 0.2 m, i.e., a “nuisance flooding” (Moftakhari et al. []). This type of flooding refers to low levels of inundation that do not cause notable threats to people or extensive damages, but it can disturb daily activities, add strain on infrastructures (roads, sewers, drainage systems, etc.) and cause minor damages to private properties.
Figure 7 shows the distribution of the coefficient a in the Caorle area. Four areas can be detected: (i) a = 0.05 (blue): inland area with elevation above 0 m; (ii) a = 0.10 (light blue): inland area with elevation below 0 m; (iii) a = 0.15 (yellow): emerged beach and inland next to the river mouths; (iv) a = 0.20 (red): emerged beach.
Figure 7. Distribution of the coefficient a in the investigated area.
Figure 8 shows the distribution of the rLIM for the areas with a = 0.12 to 0.17, corresponding to the yellow area in Figure 7.
Figure 8. Distribution of the rLIM for the zones with a = 0.12 to 0.17.
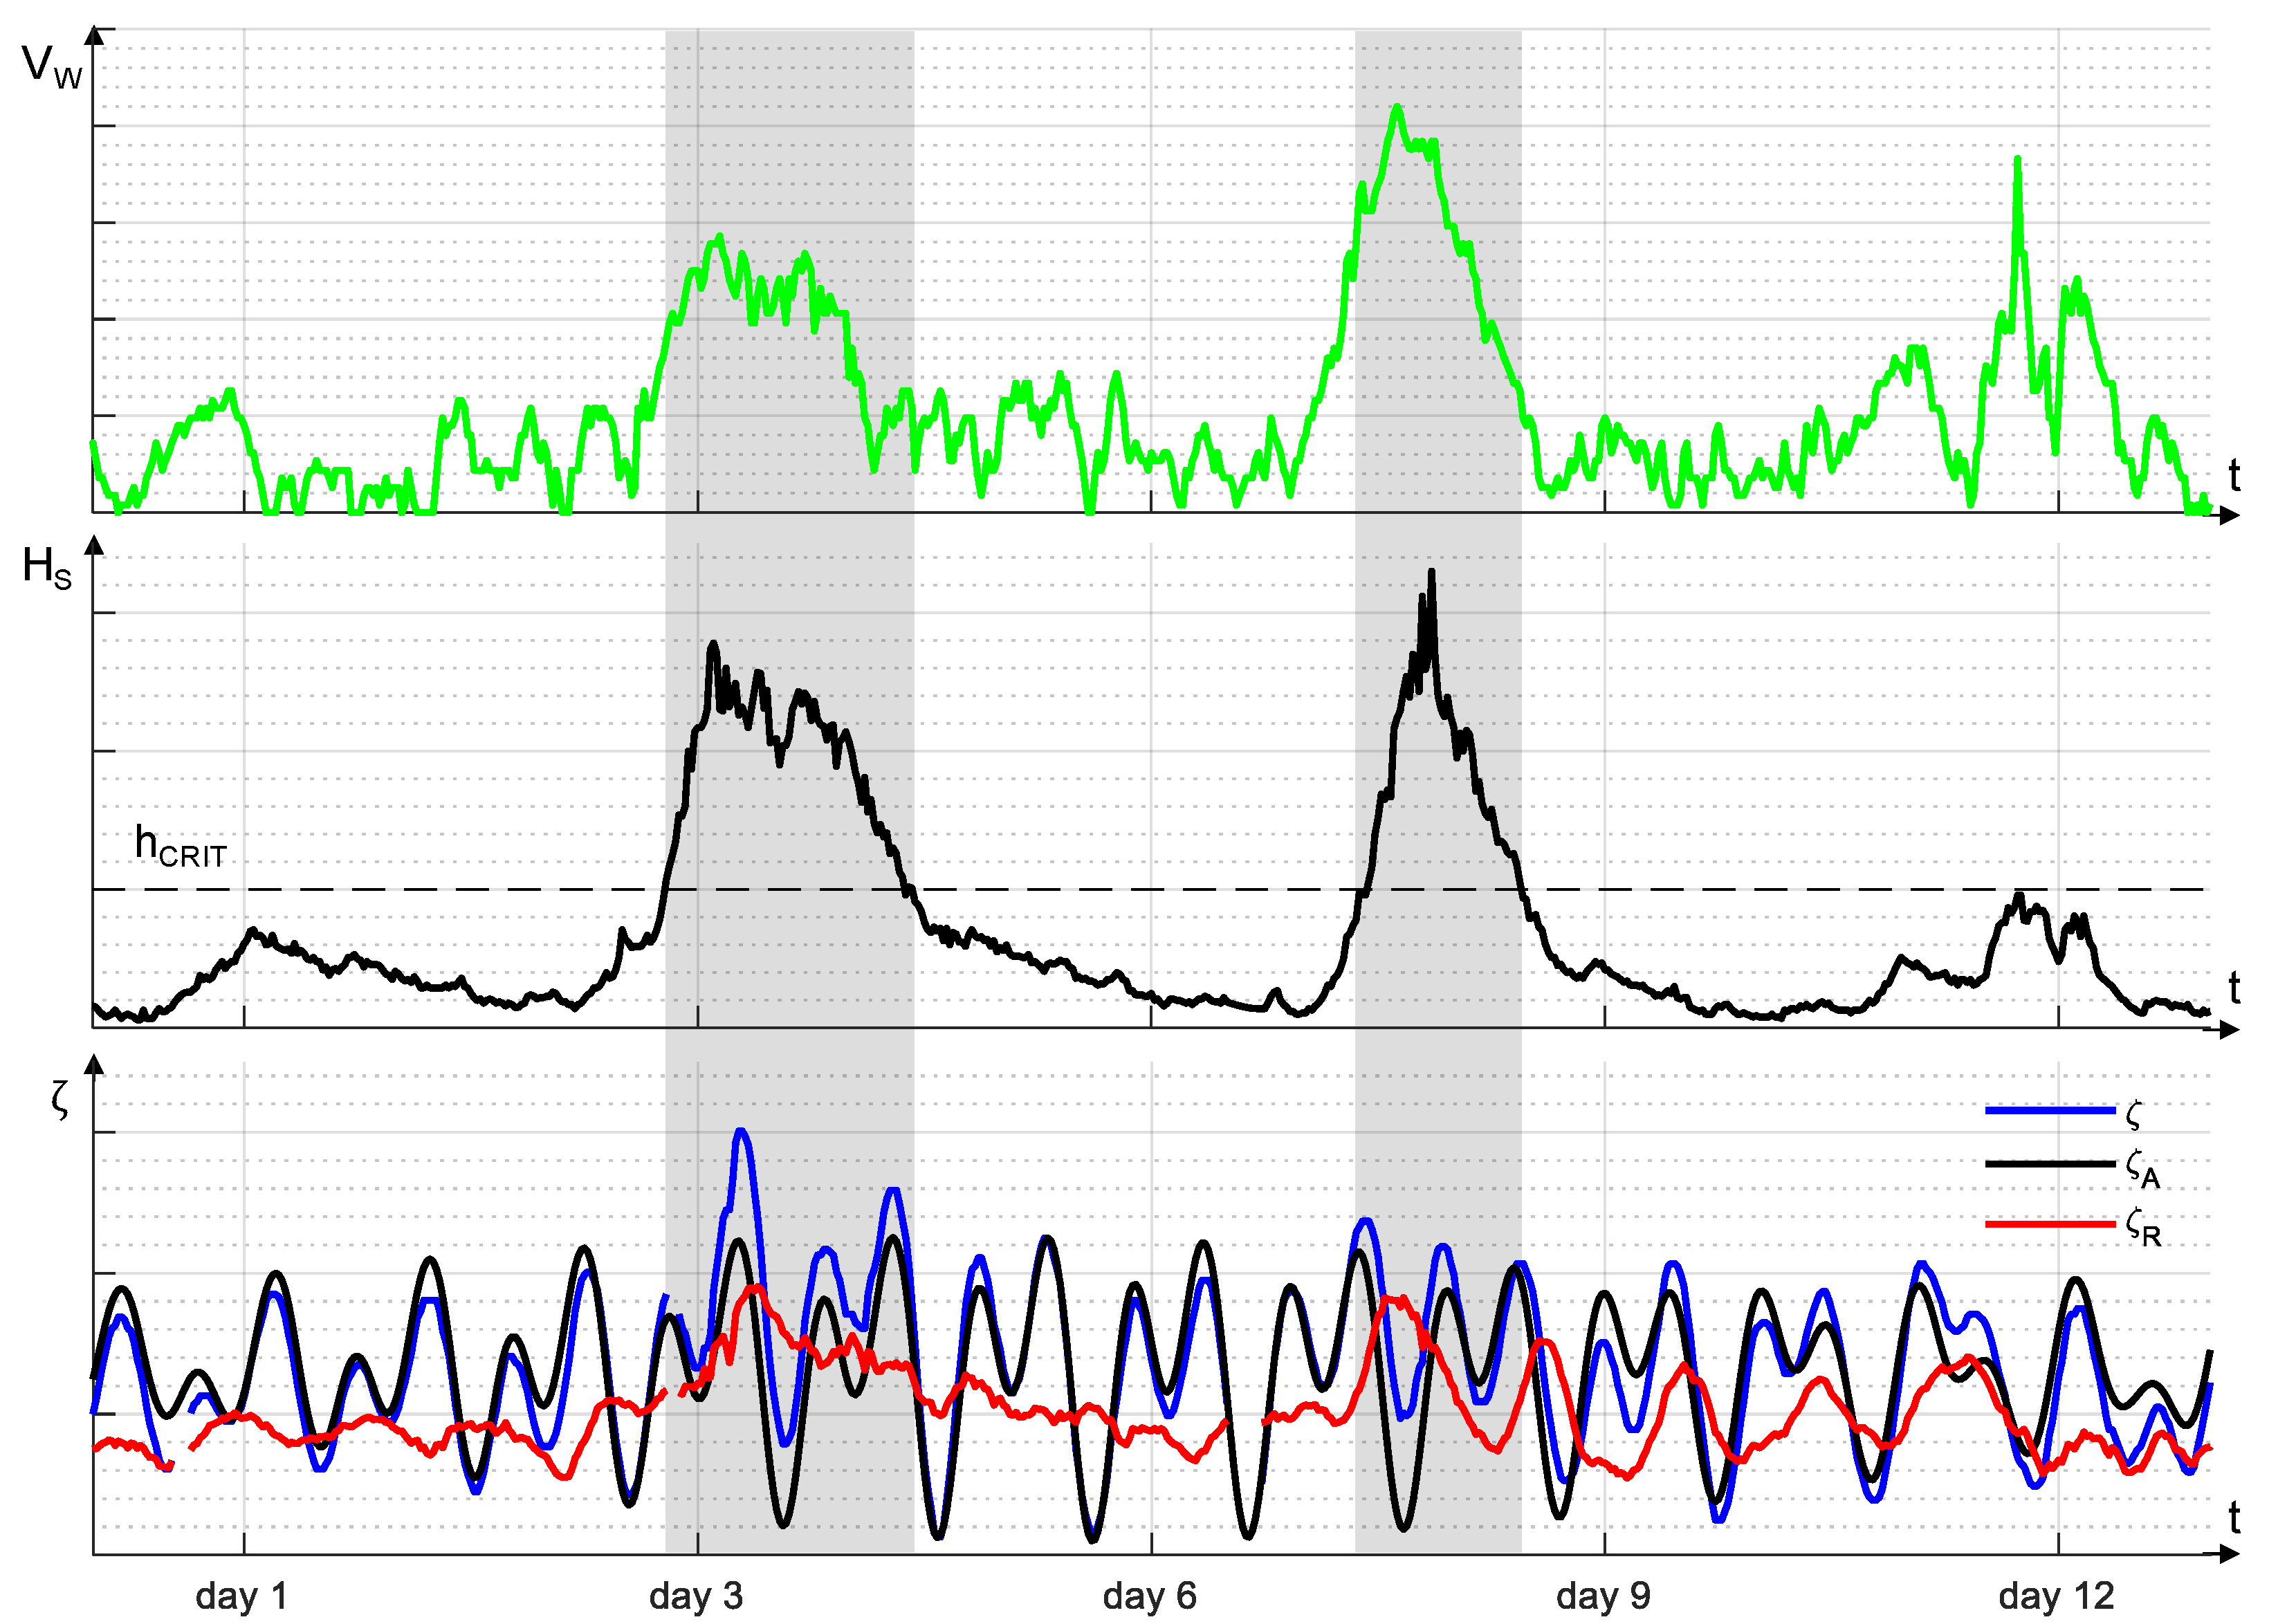
The time series of Hs and ζ* (introduced above) covers 31.5 years. From the time series of Hs, following the methodology described above, the storm identification is performed considering hCRIT equal to 1 m and selecting ΔtCRIT equal to 12 h from the analysis of the autocorrelation function. The total number of independent storms identified is 1057, i.e., ~34 events per year. Four samples r can be derived, corresponding to the different zones highlighted in Figure 7, in order to establish coastal hazard maps.
The samples, r, are analyzed with a univariate approach, fitting the data to a Generalized Pareto Distribution (GPD). The MLE procedure is used to select the probability density function parameters. The threshold is selected in order to have the same number of extremes for each coefficient a.
The evaluation of the four statistical analyses allows to assess the hazard map through the evaluation of the probability P{r > rLIM}, i.e., in this case the probability that a flooding level equal to 0.2 m is exceeded. Figure 9 shows the hazard map for the Caorle area, expressed as a function of the return period TR.
Figure 9. Hazard map for the Caorle coastline, i.e., the probability that a flooding level 0.2 m is exceeded, expressed as a function of the return period.

Discussion on the October 2018 and November 2019 Events

The stormy event that occurred on 28 October 2018 developed as a consequence of an explosive cyclogenesis in the Western Mediterranean Sea (Cavaleri et al. []). This led to intense winds blowing from the Southeast (Scirocco) that caused severe damages in the Dolomites area. Extreme waves and high-water levels were originated in the Northern Adriatic Sea, and the recorded significant wave height was up to 6 m.
On 12 November 2019, a severe stormy event occurred in the Venetian littoral, characterized by high waves (Hs up to 3.5 m) and an extreme sea level. The water level reached 1.82 m ZMPS at 22.50 UTC (measured at the oceanographic tower), the second-highest value ever measured in this area. This level was caused by a combination of an astronomical tidal peak with a severe storm surge generated by a strong wind (up to 30 m/s) and a sudden pressure drop down to 987 hPa. The wind direction quickly turned from 100° N to 230° N. During this event, several failures occurred along the Venetian littoral. Venice city was completely flooded, causing damages to historical heritage, houses, and boats. The Venetian coast was affected by localized erosions and even by coastal flooding phenomena that caused damages to many touristic and productive facilities.
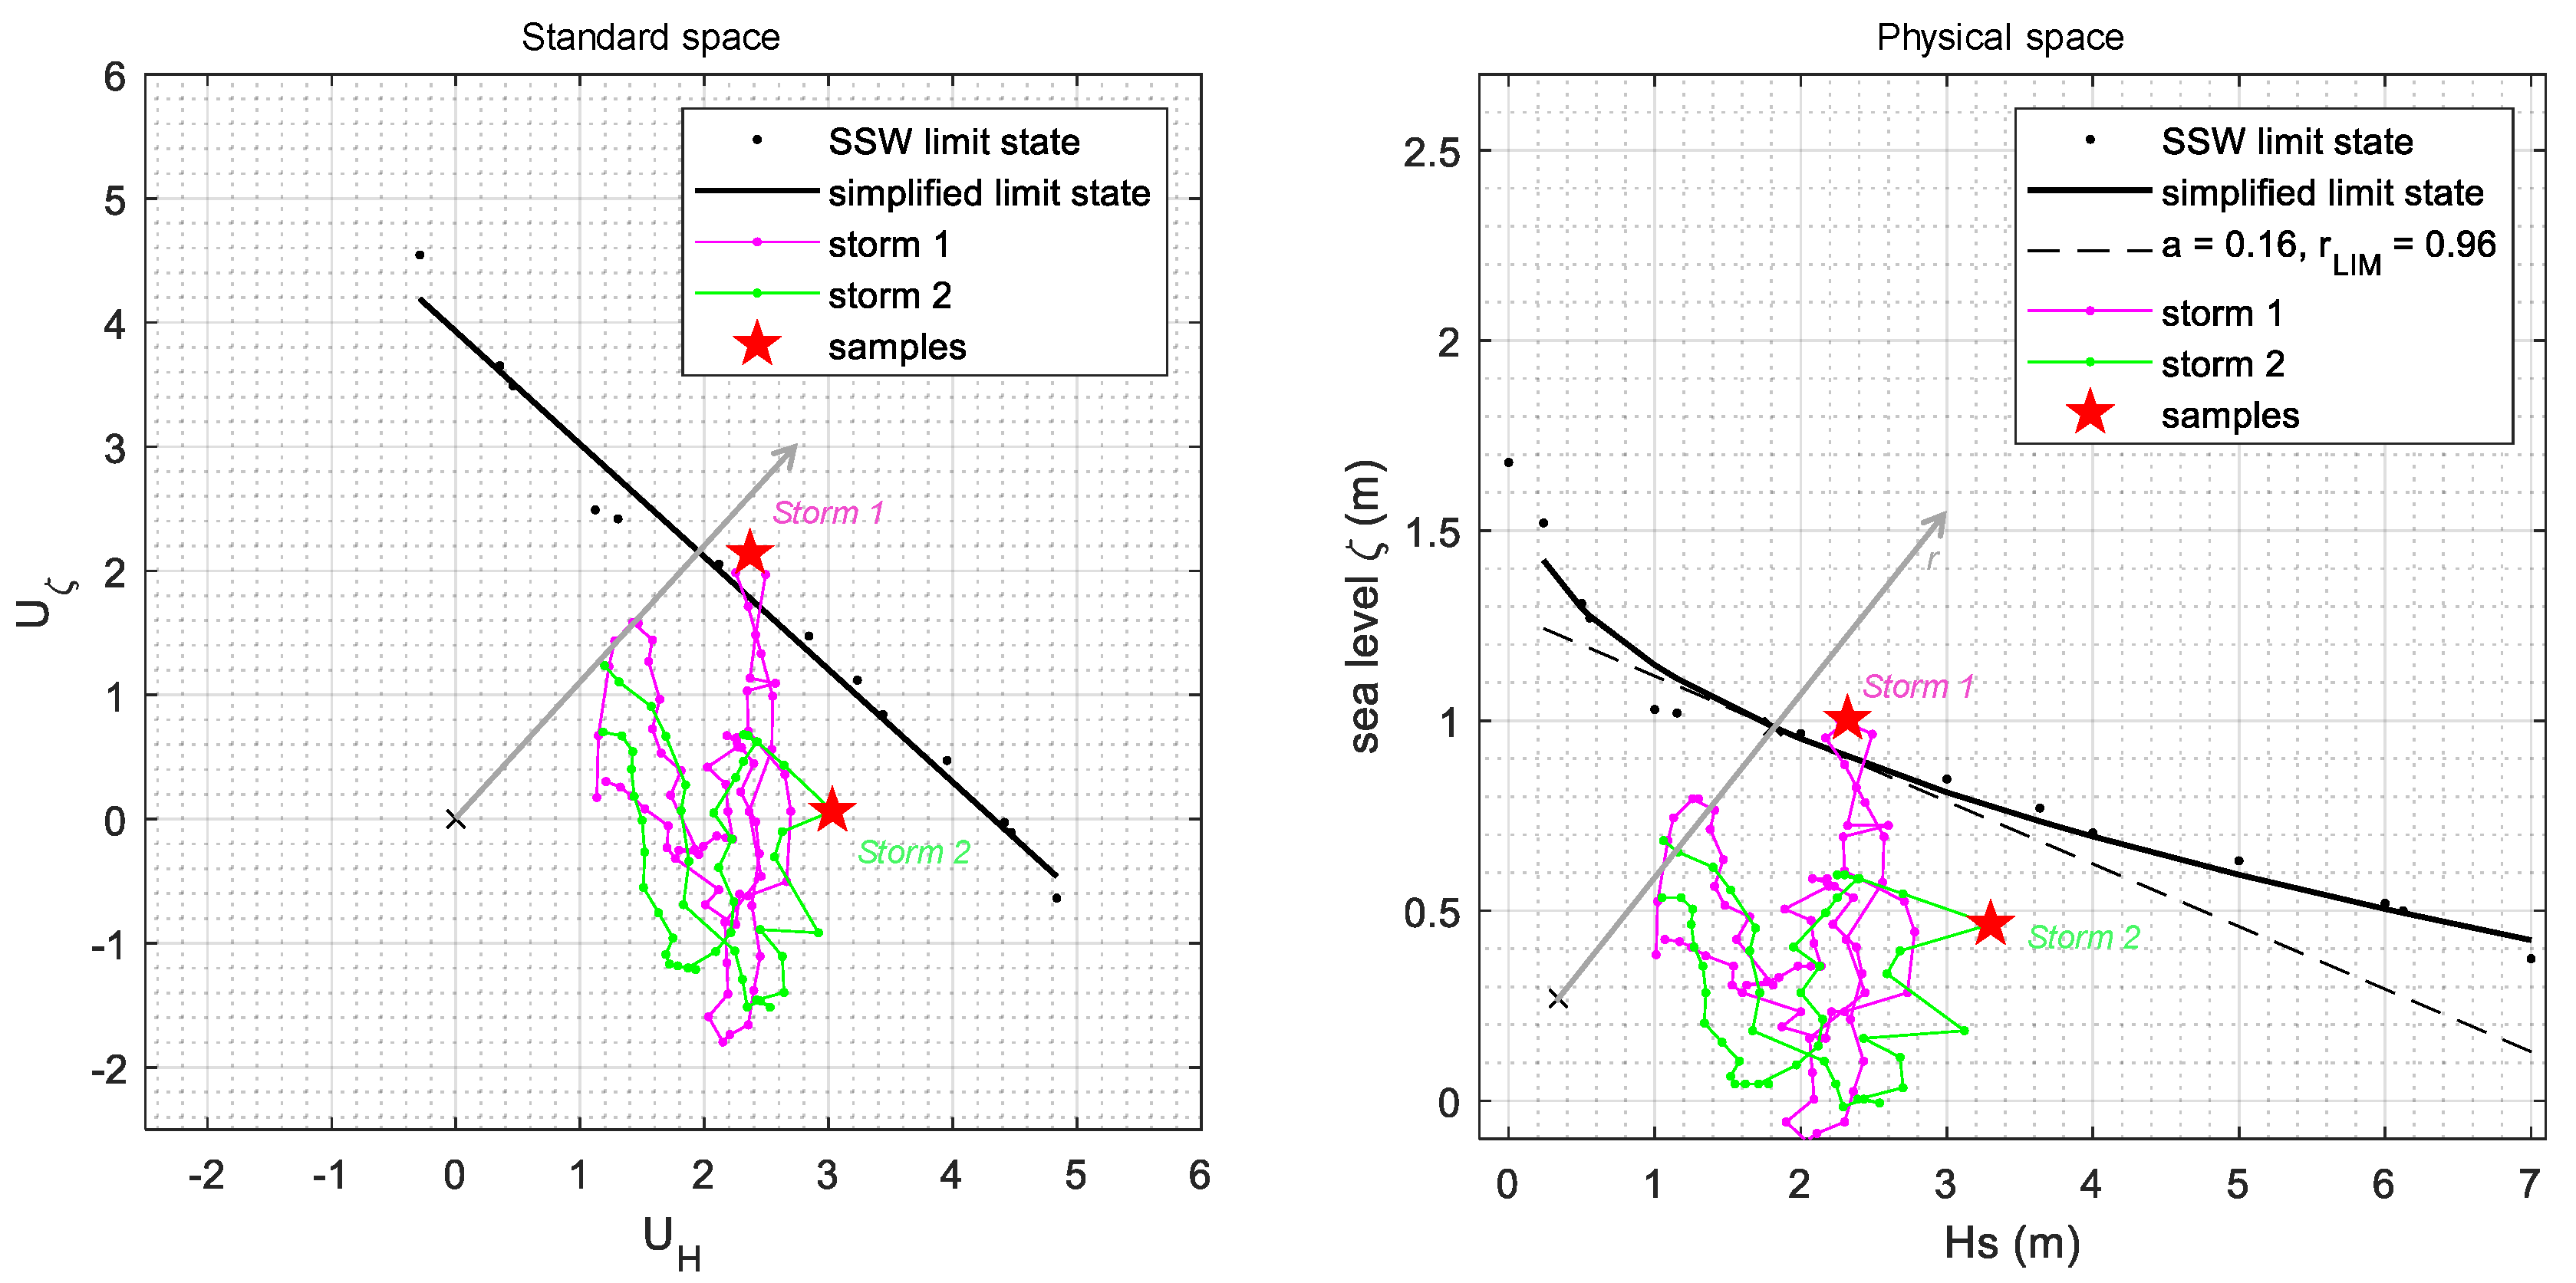
The left of Figure 10 shows the sea levels and the significant wave heights measured at the CNR oceanographic tower during these two extreme events. Two instants are highlighted with stars that indicate the chosen sample for an area with a equal to 0.17. The right of Figure 10 shows the development of the two events in the Hs- ζ plane and the limit state for a pixel characterized by a = 0.17 and rLIM = 1.1 m. The two events caused the failure since both exceeded the limit state.
Figure 10. Measurements of the 28 October 2018 and 12 November 2019 stormy events (left and right) and their evolution in the Hs- ζ plane.
The statistical analysis carried out on the structure variables, built with different a values and presented in the previous paragraph, allows for estimating the return period of the two events. The results are summarized in Table 1 in terms of chosen couples, values of the structure variable for the events (r0), exceedance probability P (r > r0), and return period TR (where λ is the number of events per year). Table 1 shows also, in the last three rows, the results carried out with three more traditional sampling procedures. In detail, the following samples were taken into account: (S1) Maximum Hs and simultaneous value of ζ*; (S2) Maximum ζ* and simultaneous value of Hs; (S3) Maxima of Hs and ζ* during the storm regardless of their concomitance. For these samples, copulas are used to describe the dependence structure associated with the joint distribution of the two variables. A thorough introduction to Copula modelling and a large selection of the most common families are provided in [,]. Similar to the analysis of De Michele et al. [], the Gumbel–Hougaard distribution, i.e., an Archimedean extreme value copula, is selected as the best candidate to model the data. To estimate the model parameters θ, the maximum likelihood estimation method (MLE) guarantees that the dataset is the most probable under the assumed statistical model. The 2018 event was characterized by extreme waves and high sea levels; conversely, the 2019 event was characterized by extreme sea levels and high waves. For the 2018 event, the return period (TR) based on sample S1 is very high. Analyzing the same event considering sample S2, the associated TR is low and the exceptionality is not confirmed. For the 2019 event, the TR based on sample S2 is very high and the TR based on sample S1 low. Both events appear to be very rare with the analysis on sample S3, assuming that the maxima occur at the same time in the event.
Table 1. Return periods for the two extreme events occurred along the Venetian littoral in 2018 and 2019 evaluated considering different types of samples.
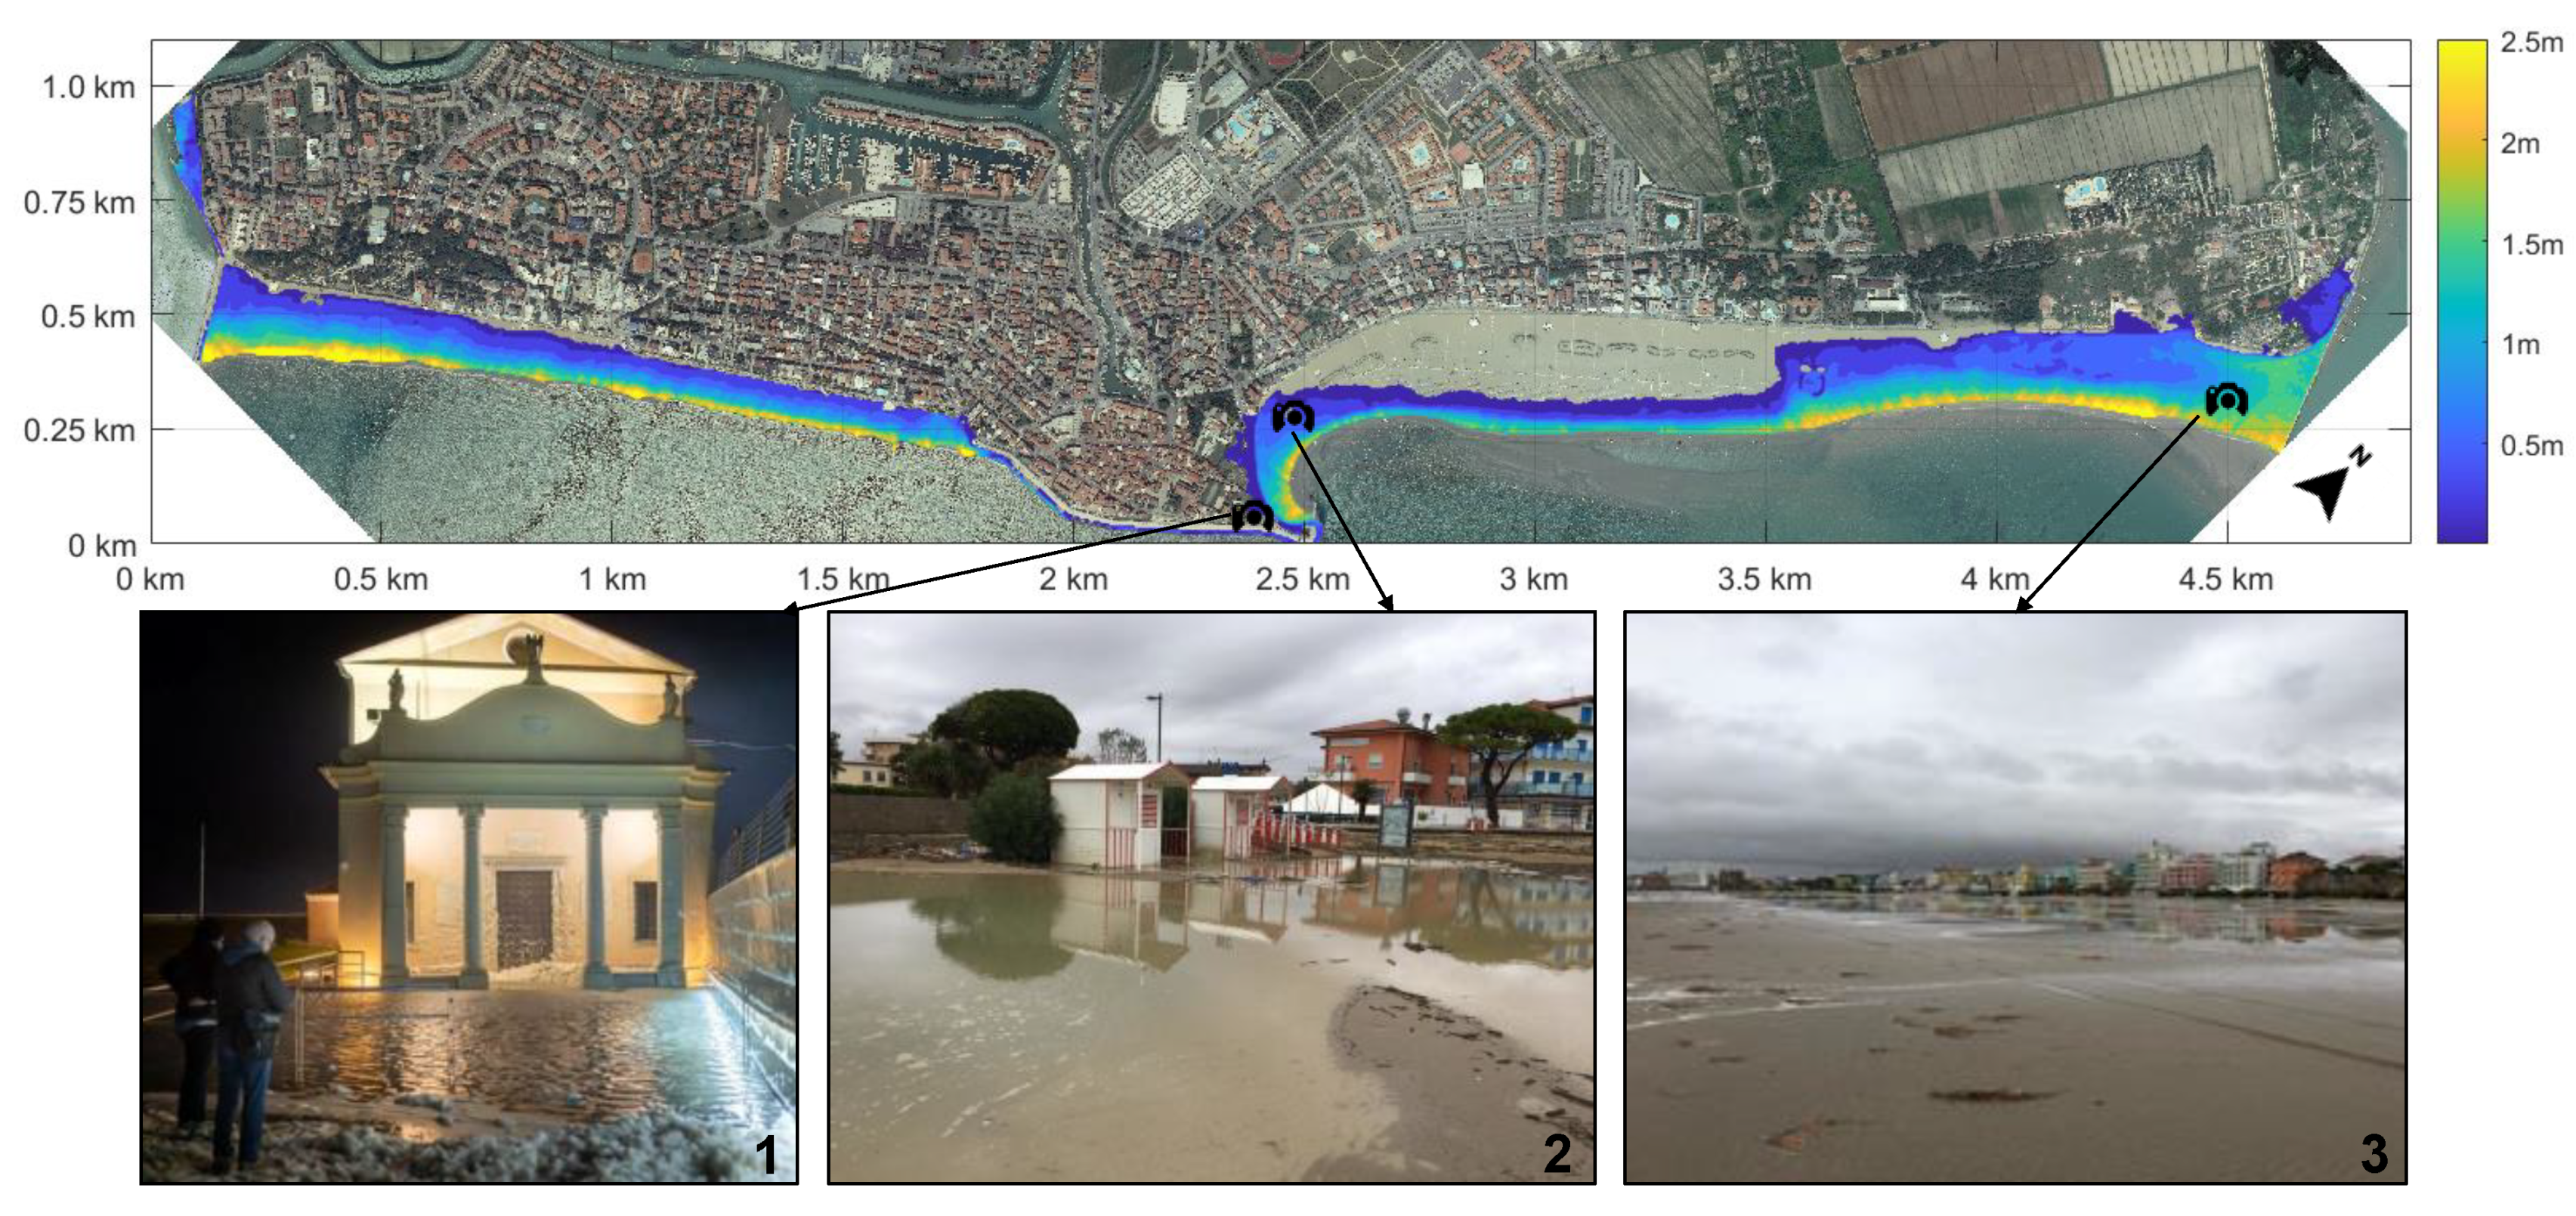
From the hazard map presented in Figure 9, the point x = 2.5 km, y = 0.3 km, i.e., the one corresponding to picture no. 2 of Figure 11, has a = 0.15 and rLIM = 1.4 m. From Table 1, the r0 of November 2019 is larger and therefore flooding is expected. The associated return period in this area is TR = 47 years. In fact, marine ingression occurred along the Caorle coastline during November 2019: both the beaches were completely flooded and the waves reached the church at the cusp (pictures in Figure 11).
Figure 11. SSW simulation results for the November 2019 event and photographs taken the day after.
The SSW model is used to simulate this event and it is initialized with the same grid and the same conditions described before. The simulation covers only 4 h around the peak of sea level. Figure 11 shows the maximum flooded level reached during the simulation. Since the flooding occurred during nighttime, only some qualitative information and some photographs, taken the morning after, are available (Figure 11). However, these photographs show the damages and the residual flooding on the beach and at the church. The simulation results are consistent with this information.

5. Conclusions

In many low-lying coastal regions, flooding hazard assessment is critically affected by the correct evaluation of the simultaneous occurrence of the significant wave height Hs and the water level ζ. In turn, the bivariate statistics is significantly affected by the methodology used for the selection of the independent sample pair Hs, ζ during a sea storm.
Following Mazas and Hamm [], the suggested sampling procedure is to define a structure variable that considers the combination of Hs and ζ that is the most critical for flooding. This study proposes a procedure to find a spatial structure variable, that is a linear combination of water level and wave height, specific for each location, based on the slope of the failure function at the design point.
As a consequence, the statistical analysis is specific to each point of the area at risk. For instance, for low-lying points located far from a coastal dune system, ζ is more important than Hs, and hence the relative flooding occurrence is mainly affected by the maximum water levels statistics. Conversely, for an area located just behind a seawall where overtopping is relevant, the role played by Hs is dominant, and the relative flooding occurrence is strongly affected by the maximum significant wave height statistics.
The proposed procedure was applied to a stretch of the Venetian littoral that was affected by marine ingression during two recent stormy events (occurred in 2018 and 2019). A map showing the chosen combination of the variables is presented together with the hazard map for the investigated coastline.
The paper draws attention to the (apparently trivial) need for a consistent procedure for sampling multivariate events from sea measurements. Based on real examples, it is shown that the method used to sample the bivariate event formed by Hs and ζ significantly affects the return period of the critical storm and the sampling method should therefore be considered as an important aspect for the evaluation of the flooding hazard. The comparison between traditional sampling methods and the proposed one highlights that the latter gives more consistent results in terms of return periods.
The method can be implemented to coastal stretches subject to rather uniform environmental conditions. For instance, for the Venetian littorals, it was assessed that the length of each stretch is of order 3–12 km.
As further work, it is envisaged that application of the procedure to many real and schematic cases could point out some a priori guidelines to select the proper combination of water level and significant wave height only based on the morphological characteristics of the site, thus defining a priori the proper structure variable for the location of interest.

Author Contributions

Conceptualization, C.F., L.M. and P.R.; methodology and formal analysis, L.M.; implementation and case study investigation, C.F.; writing—original draft preparation, C.F.; writing—review and editing, C.F. and L.M.; supervision, P.R. All authors have read and agreed to the published version of the manuscript.

Funding

The authors acknowledge support within the Venice 2021 research grant funded by Provveditorato for the Public Works of Veneto, Trentino Alto Adige, and Friuli Venezia Giulia, provided through the concessionary of State Consorzio Venezia Nuova and coordinated by CORILA (Consorzio per il coordinamento delle ricerche inerenti al sistema lagunare di Venezia).

Institutional Review Board Statement

Not applicable.

Acknowledgments

The Agreement between Regione Veneto and University of Padova entitled “Gestione Integrata della Zona Costiera. Progetto per lo studio ed il monitoraggio della linea di costa per la definizione degli interventi di difesa dei litorali dall’erosione nella Regione Veneto” is gratefully acknowledged. We thank the anonymous reviewer for the detailed work and precious suggestions.

Conflicts of Interest

The authors declare no conflict of interest.

References

  1. Coles, S.G.; Tawn, J.A. Statistical methods for multivariate extremes: An application to structural design. J. R. Stat. Soc. Ser. C Appl. Stat. 1994, 43, 1–48. [Google Scholar] [CrossRef]
  2. Zachary, S.; Feld, G.; Ward, G.; Wolfram, J. Multivariate extrapolation in the offshore environment. Appl. Ocean Res. 1998, 20, 273–295. [Google Scholar] [CrossRef]
  3. Masina, M.; Lamberti, A.; Archetti, R. Coastal flooding: A copula based approach for estimating the joint probability of water levels and waves. Coast. Eng. 2015, 97, 37–52. [Google Scholar] [CrossRef]
  4. Li, F.; Van Gelder, P.H.A.J.M.; Ranasinghe, R.; Callaghan, D.P.; Jongejan, R.B. Probabilistic modelling of extreme storms along the Dutch coast. Coast. Eng. 2014, 86, 1–13. [Google Scholar] [CrossRef]
  5. Hawkes, P.J.; Gouldby, B.P.; Tawn, J.A.; Owen, M.W. The joint probability of waves and water levels in coastal engineering design. J. Hydraul. Res. 2002, 40, 241–251. [Google Scholar] [CrossRef]
  6. Lerma, A.N.; Bulteau, T.; Elineau, S.; Paris, F.; Durand, P.; Anselme, B.; Pedreros, R. High-resolution marine flood modelling coupling overflow and overtopping processes: Framing the hazard based on historical and statistical approaches. Nat. Hazards Earth Syst. Sci. 2018, 18, 207–229. [Google Scholar] [CrossRef]
  7. Arnoux, F.; Abadie, S.; Bertin, X.; Kojadinovic, I. Coastal flooding event definition based on damages: Case study of Biarritz Grande Plage on the French Basque coast. Coast. Eng. 2021, 166, 103873. [Google Scholar] [CrossRef]
  8. Favaretto, C.; Martinelli, L.; Ruol, P. Coastal flooding hazard due to overflow using a level II method: Application to the Venetian littoral. Water 2019, 11, 134. [Google Scholar] [CrossRef]
  9. Foti, E.; Musumeci, R.E.; Stagnitti, M. Coastal defence techniques and climate change: A review. Rend. Lincei Sci. Fis. Nat. 2020, 31, 123–138. [Google Scholar] [CrossRef]
  10. Di Risio, M.; Bruschi, A.; Lisi, I.; Pesarino, V.; Pasquali, D. Comparative analysis of coastal flooding vulnerability and hazard assessment at national scale. J. Mar. Sci. Eng. 2017, 5, 51. [Google Scholar] [CrossRef]
  11. Wahl, T.; Plant, N.G.; Long, J.W. Probabilistic assessment of erosion and flooding risk in the northern Gulf of Mexico. J. Geophys. Res. Ocean. 2016, 121, 3029–3043. [Google Scholar] [CrossRef]
  12. Bruun, J.T.; Tawn, J.A. Comparison of approaches for estimating the probability of coastal flooding. J. R. Stat. Soc. Ser. C Appl. Stat. 1998, 47, 405–423. [Google Scholar] [CrossRef]
  13. Hawkes, P.J. Joint probability analysis for estimation of extremes. J. Hydraul. Res. 2008, 46, 246–256. [Google Scholar] [CrossRef]
  14. Mazas, F.; Hamm, L. An event-based approach for extreme joint probabilities of waves and sea levels. Coast. Eng. 2017, 122, 44–59. [Google Scholar] [CrossRef]
  15. Harley, M.D. Coastal storm definition. In Coastal Storms: Processes and Impacts; Ciavola, P., Coco, G., Eds.; John Wiley and Sons: Chichester, UK, 2017; pp. 1–21. [Google Scholar]
  16. Boccotti, P. On coastal and offshore structure risk analysis. Excerpta Ital. Contrib. Field Hydraul. Eng. 1986, 1, 19–36. [Google Scholar]
  17. Mendoza, E.T.; Jimenez, J.A.; Mateo, J.; Salat, J. A coastal storms intensity scale for the Catalan sea (NW Mediterranean). Nat. Hazards Earth Syst. Sci. 2011, 11, 2453–2462. [Google Scholar] [CrossRef]
  18. Taylor, G.I. Diffusion by continuous movements. Proc. Lond. Math. Soc. 1922, 2, 196–212. [Google Scholar] [CrossRef]
  19. Pasquali, D.; Bruno, M.F.; Celli, D.; Damiani, L.; Di Risio, M. A simplified hindcast method for the estimation of extreme storm surge events in semi-enclosed basins. Appl. Ocean. Res. 2019, 85, 45–52. [Google Scholar] [CrossRef]
  20. Bajo, M.; Međugorac, I.; Umgiesser, G.; Orlić, M. Storm surge and seiche modelling in the Adriatic Sea and the impact of data assimilation. Q. J. R. Meteorol. Soc. 2019, 145, 2070–2084. [Google Scholar] [CrossRef]
  21. Favaretto, C.; Martinelli, L.; Ruol, P. A Model of Coastal Flooding Using Linearized Bottom Friction and Its Application to a Case Study in Caorle, Venice, Italy. Int. J. Offshore Polar Eng. 2019, 29, 182–190. [Google Scholar] [CrossRef]
  22. Favaretto, C.; Martinelli, L.; Ruol, P. Run up on Beaches through Simplified Shallow Water Model. In Proceedings of the 29th International Ocean and Polar Engineering Conference, Honolulu, HI, USA, 16–21 June 2019. [Google Scholar]
  23. Hasofer, A.M.; Lind, N.C. Exact and invariant second-moment code format. J. Eng. Mech. Div. 1974, 100, 111–121. [Google Scholar] [CrossRef]
  24. Martinelli, L.; Zanuttigh, B.; Corbau, C. Assessment of coastal flooding hazard along the Emilia Romagna littoral, IT. Coast. Eng. 2010, 57, 1042–1058. [Google Scholar] [CrossRef]
  25. Boccotti, P. Wave Mechanics for Ocean Engineering; Elsevier: Amsterdam, The Netherlands, 2000. [Google Scholar]
  26. Goda, Y. Random Seas and Design of Maritime Structures; World Scientific: Singapore, 2010. [Google Scholar]
  27. Laface, V.; Arena, F. A new equivalent exponential storm model for long-term statistics of ocean waves. Coast. Eng. 2016, 116, 133–151. [Google Scholar] [CrossRef]
  28. Coles, S.; Bawa, J.; Trenner, L.; Dorazio, P. An Introduction to Statistical Modeling of Extreme Values; Springer: London, UK, 2001; Volume 208, p. 208. [Google Scholar]
  29. Umgiesser, G.; Bajo, M.; Ferrarin, C.; Cucco, A.; Lionello, P.; Zanchettin, D.; Papa, A.; Tosoni, A.; Ferla, M.; Coraci, E.; et al. The prediction of floods in Venice: Methods, models and uncertainty (review article). Nat. Hazards Earth Syst. Sci. 2021, 21, 2679–2704. [Google Scholar] [CrossRef]
  30. Biolchi, S.; Denamiel, C.; Devoto, S.; Korbar, T.; Macovaz, V.; Scicchitano, G.; Furlani, S. Impact of the October 2018 storm Vaia on coastal boulders in the northern Adriatic Sea. Water 2019, 11, 2229. [Google Scholar] [CrossRef]
  31. Cavaleri, L.; Bajo, M.; Barbariol, F.; Bastianini, M.; Benetazzo, A.; Bertotti, L.; Chiggiato, J.; Davolio, S.; Ferrarin, C.; Magnusson, L.; et al. The October 29, 2018 storm in Northern Italy—An exceptional event and its modeling. Prog. Oceanogr. 2019, 178, 102178. [Google Scholar] [CrossRef]
  32. Cavaleri, L.; Bajo, M.; Barbariol, F.; Bastianini, M.; Benetazzo, A.; Bertotti, L.; Umgiesser, G. The 2019 Flooding of Venice and its implications for future predictions. Oceanography 2020, 33, 42–49. [Google Scholar] [CrossRef]
  33. Ruol, P.; Favaretto, C.; Volpato, M.; Martinelli, L. Flooding of Piazza San Marco (Venice): Physical Model Tests to Evaluate the Overtopping Discharge. Water 2020, 12, 427. [Google Scholar] [CrossRef]
  34. Ruol, P.; Martinelli, L.; Favaretto, C. Vulnerability analysis of the Venetian littoral and adopted mitigation strategy. Water 2018, 10, 984. [Google Scholar] [CrossRef]
  35. Tosi, L.; Teatini, P.; Strozzi, T. Natural versus anthropogenic subsidence of Venice. Sci. Rep. 2013, 3, 1–9. [Google Scholar] [CrossRef]
  36. ISPRA. Available online: https://annuario.isprambiente.it/ada/basic/6972 (accessed on 18 March 2020).
  37. Moftakhari, H.R.; AghaKouchak, A.; Sanders, B.F.; Allaire, M.; Matthew, R.A. What is nuisance flooding? Defining and monitoring an emerging challenge. Water Resour. Res. 2018, 54, 4218–4227. [Google Scholar] [CrossRef]
  38. Joe, H. Multivariate Models and Multivariate Dependence Concepts; CRC Press: Boca Raton, FL, USA, 1997. [Google Scholar]
  39. Nelsen, R.B. An Introduction to Copulas; Springer Science & Business Media: Portland, OR, USA, 2007. [Google Scholar]
  40. De Michele, C.; Salvadori, G.; Passoni, G.; Vezzoli, R. A multivariate model of sea storms using copulas. Coast. Eng. 2007, 54, 734–751. [Google Scholar] [CrossRef]
Publisher’s Note: MDPI stays neutral with regard to jurisdictional claims in published maps and institutional affiliations.

Article Metrics

Citations

Article Access Statistics

Multiple requests from the same IP address are counted as one view.