1. Introduction
Extreme unevenness of water resources distribution is becoming a more and more serious worldwide problem, even affecting a country’s social and economic development strategy [
1]. China is a country that has a severe drought and water shortage. Many factors contribute to the shortage of water resources, such as uneven spatial distribution of water resources, rapid development of the economy, urbanization and population, as well as poor water resource management. During the process of economic development, there are serious water pollution problems in rural areas. Heavy use of pesticides in the rural industry and agriculture has threatened drinking water safety and human health [
2]. The contradiction between supply and demand of water resources is increasingly prominent, and even affect China’s trade policies [
3]. Meanwhile, water quality has also become a key issue for the balanced development between economy and ecology [
4].
China has adopted many policies to explore ways of water resources management, and many scholars have conducted a lot of research [
5,
6], but there are still some deficiencies [
7]. To balance the uneven distribution of water resources between the south and north, China’s South-to-North Water Diversion Project (SNWDP) began construction in 2002. The east line is one of the three main lines, aimed at relieving the contradiction between supply and demand of water resources in east China, supporting the national economic and social sustainable development in the region.
The SNWDP is an oversize cross-basin, long-distance, comprehensive water transfer project, which mainly provides water for industrial and domestic use, as well as agriculture and ecological use for the Jiaodong region of Shandong province and the Beijing-Tianjin-Hebei region. The water diversion project has produced huge economic, social and ecological benefits [
8]. Shandong section of SNWDP is composed of newly built channels, existing channels, lakes and reservoirs. The major water transmission lines are mostly open and intersected with several major roads. Moreover, the Nansi Lake and Liangji Canal both undertake shipping tasks. The areas surrounding the main trunk of the Shandong section have developed economies, high population densities, large traffic volumes and many main-canal and road intersections. Therefore, the Shandong section has a high risk of sudden water pollution accidents, such as sudden traffic accidents, ship oil spills and other sudden water pollution accidents. These sudden water pollution accidents can seriously pollute the water body, lead to water interruption in the downstream area and affect the normal life of residents. If the pollution is widespread and intense, it may also cause shutdown, and even affect social stability, resulting in a great impact on the economy and society of the downstream area. Since the construction of SNWDP, water delivery safety and water quality protection in the project have been a hot issue, which are addressed in many scientific papers focused on water environmental risk analysis [
9,
10,
11], water security evaluation [
12], water quality of reservoir and downstream [
13,
14], water pollution risk simulation and prediction [
15,
16] and emergency regulation and treatment of water quality [
17,
18]. However, there are few studies on the rapid prediction of sudden water pollution accidents in Shandong Section, and the methods, models and instruments used in the above studies need a large amount of basic data, while the operation of the model requires a lot of time [
19,
20,
21]. However, sudden water pollution accidents are often random and acute. Once a sudden water pollution accident occurs, it is urgent to make a decision, and there is no time to run the simulation model to predict the outcome. Therefore, only rapid water pollution prediction models can provide a decision basis for emergency treatment of sudden water pollution accidents. Rapid prediction is still an important issue for scholars to study the sudden water pollution events.
In this paper, the water quality rapid prediction of sudden water pollution accidents in the main section of Shandong section of SNWDP was proposed. Taking the typical channels of SNWDP as the study object, a one-dimensional hydrodynamic model and a water quality simulation model were established; considering factors such as pollutant release rate, channel geometry and hydraulic conditions, this study simulated the process of pollutant transport and diffusion in a series of open channels under normal water delivery conditions. Based on the simulation results, a rapid prediction model of pollutant concentration change in sudden water pollution accidents was set up, calibrated and tested. Using the model, one can rapidly determine pollutant impact time and range, providing decision support for rapid disposal of major water pollution accidents.
2. Materials and Methods
2.1. Study Area
According to the spatial distribution characteristics of water resources in China, the country established the SNWDP aiming to effectively alleviate the contradiction between the supply and demand of water resources in the northern region. Through the project, the upper, middle and lower reaches of the Yangtze River are transferred to connect with the Yangtze River, Yellow River, Huaihe River and Haihe River, forming a “four vertical and three horizontal” pattern of optimal allocation of water resources. SNWDP is an important part of the overall pattern.
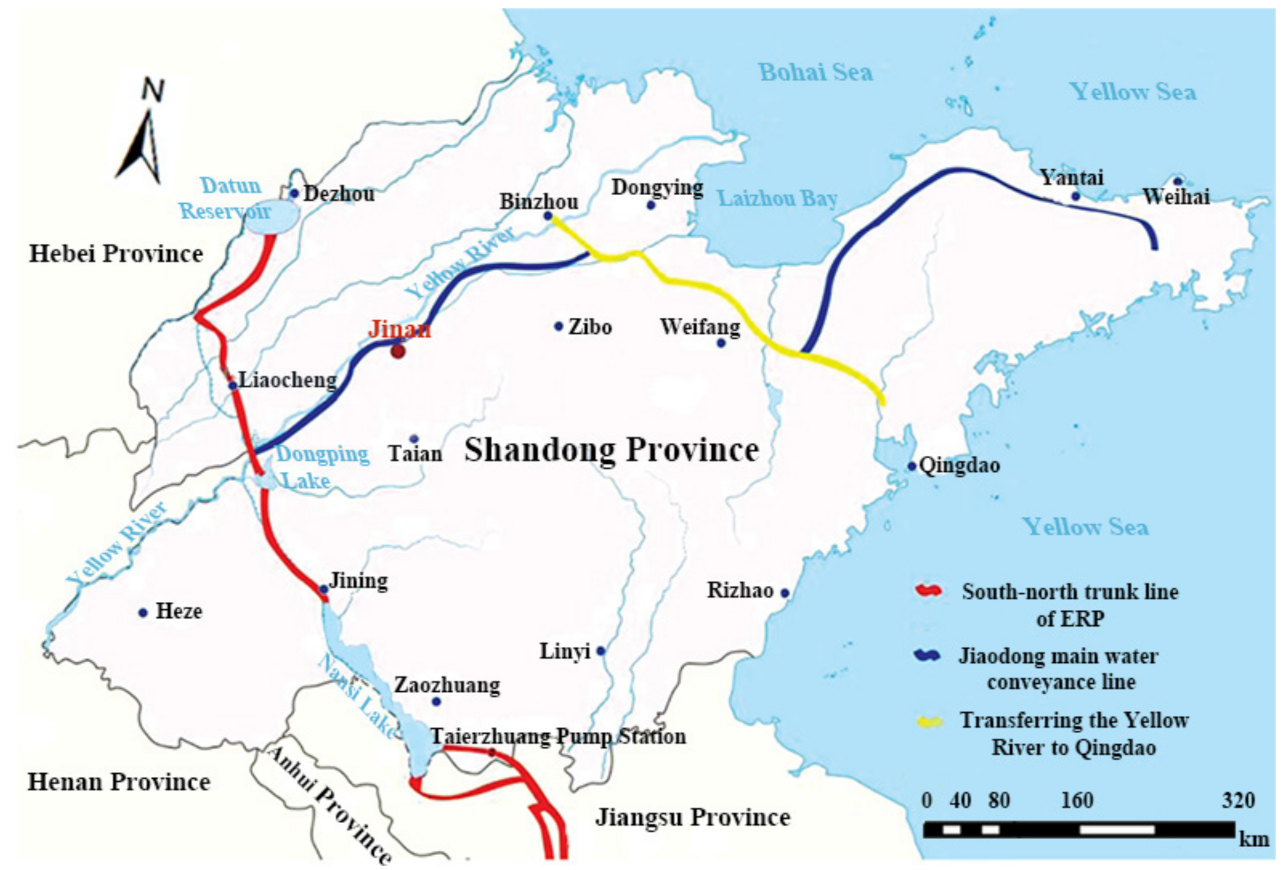
The East Route of South-to-North Water Diversion Project (ERP) is a national trans-provincial regional project that diverts water from the Jiangdu Water Control Project in Yangzhou, Jiangsu Province, and transports water to North China through the Jiangsu, Shandong and Hebei provinces. The Shandong section of SNWDP (SD-SNWDP) is divided into south-north and east-west water transmission trunk lines, with a total length of 1191 km. The south-north trunk line is 487 km long, and the east-west trunk line is 704 km long. The project forms a “T” shaped water delivery artery and a modern water network framework in Shandong Province, realizing the joint dispatching and optimal allocation of multiple water sources from Yangtze River, Yellow River and local water resources, which provides water resource support for the sustainable economic and social development of Shandong Province. The scope of water supply includes 13 cities and 61 counties (cities and districts) in Jinan, Qingdao, Yantai, Weihai, Weifang, Zibo, Dongying, Binzhou, Liaocheng, Dezhou, Zaozhuang, Jining and Heze (
Figure 1) [
22].
The first phase of SD-SNWDP consists of the Hanzhuang Canal Project, Lower Nansi Lake Water Level Elevation Affection Dealing Project, Nansi Lake Water Resource Controlling and Water Quality Monitoring Project, Nansi Lake-to-Dongping Lake Section Water Conveyance and Shipping Combination Project, Dongping Lake Water Storage Affection Dealing Project, Yellow River Crossing Project, Lubei section project (L-B), Water Conveyance Project of Jiping Main Canal, J-D from Jinan to “Transferring the Yellow River to Qingdao Project” Section Project, Shandong Section Sewage Interception Diversion Project and 11 individual projects as well as 54 design unit works of the Shandong Section Special Project.
2.2. Data Resource and the Affecting Factors
For the data of the trunks required by the model, including length, shape, side slope, lining, hydraulic structure, etc. from the design plan, section data are derived from the survey result of the survey team of Shandong Water Conservancy Survey and Design Institute (2003–2009). Some design parameters are shown in
Table 1, where PCRM refers to the pouch concrete revetment section and CCP refers to the cast-in-place concrete protected section.
Hydrodynamic and water quality transport are the main influence factors, including location, traffic accident, rainfall, wind speed, temperature, pH, evaporation and infiltration, as well as illumination. Considering the sudden water pollution accident emergency disposal and anti-seepage engineering actual situation, this study chose the accident location and traffic as the main influence factors.
2.3. Simulation of the Typical Accident of Water Pollution
2.3.1. Typical Accident
Based on the risk identification and evaluation of Shandong section of SNWDP [
23], this study selected canals interchanged with land traffic or bearing shipping tasks, such as the Lianghu Canal (L-H), L-B, J-D, and Nansi Lake. The main pollutants contained phenol and petroleum. We selected the high-risk accident points of risk source identification to simulate the transportation and transformation of typical pollutants, to determine the impact time, extent and so on of water pollution.
2.3.2. Simulation Model
If the pollutants can be completely mixed in the cross section before arriving the reach of the river, it is considered that the river reach can be generalized into one dimension [
24]. According to the situation of SD-SNWDP, the one-dimensional model of the river can be used to calculate the concentration change process.
The MIKE 11 HD model is a one-dimensional unsteady flow simulation based on Saint Venant equations to simulate the state of water in a river or estuary [
21]. The equation of the flow continuity is:
The momentum equation is:
where
Q is the flow rate;
A is the cross-sectional area;
x is the distance coordinate;
t is the time coordinate;
h is the cross-sectional water level;
R is the hydraulic radius of the cross-section;
C is the Chezy’s roughness coefficient;
g is the acceleration of gravity;
q is the side inflow;
α is the vertical velocity distribution coefficient.
According to the underlying surface conditions and hydraulic characteristics of the main canal, the typical section of the trunk canal in SD-SNWDP can be further subdivided as follows: L-H was divided into the Liangji Canal section (L-J) and the Liuchang River section (L-C); L-J was divided into the Landscape section (L
1), the front section of Changgou Pump (L
2) and the section between Changgou Pump and Denglou Pump (L
3); L-B was divided into two sections of 0–25 km (L
4) and 25–98 km (L
5). Based on the measured data of each section in trunk canal, simulations were performed using Mike11 HD, and the model input parameters were tested by the actual observation data since the test run in November 2013. The velocities of L-H (
VL-H), L-B (
VL-B) and J-D
(VJ-D) with different simulated flows are shown in
Table 2.
2.3.3. Water Quality Simulation
(1) Definition of the critical value (CR.V)
The CR.V refers to when the pollutants from the location of water pollution accident at a gate (or exit), while the concentration is the upper limit of III standard for the surface water environmental quality standard, the quality of pollutants getting into the water trunk canal in unit time g/s.
(2) Water quality simulation model
The basic equation of the non-constant flow convection diffusion in water transport is:
where
C is the water quality concentration simulated, mg/L;
C2 is the concentration of the source, mg/L;
D is the diffusion coefficient, m
2/s;
K is the integrated attenuation coefficient, d
−1:
where
u is the average velocity of section, m/s;
x is the distance between the upper and lower sections, m;
CA is the concentration of pollutants upstream, mg/L;
CB is the concentration of pollutants downstream, mg/L;
E is the longitudinal dispersion coefficient of pollutants, m
2/s;
m is the proportion of pollutants entering the upper cross section, which is dimensionless.
(3) Water quality simulation
Through investigation and analysis [
23], it is considered that the following places are most likely to have accidents: for the L-H section, the entrance with Pile number 0+000 (
A1), Pengying Road Bridge with mileage 35+000 (
A2), Wangfuji Road Bridge with mileage 3+850 (
A3) and the outlet (
A4); for the L-B section, the entrance (
B1), Liaowei Highway bridge with mileage 1+060 (
B2), Provincial 039 Highway Bridges with mileage 5+435 (
B3) and the outlet with mileage 61+080 (
B4); for the J-D section, Hehua Road Bridge with mileage 2+009)(
C1), Gaoli Road Bridge with mileage 29+130 (
C2), Weiqiaoshiji Road Bridge with mileage 51+570)(
C3) and the outlet (
C4).
Based on the hydrodynamic simulation results, typical water pollution accidents with different flow were simulated by using the convection diffusion model. The CR.V of the pollutant amount entered in a second in the typical pollution accidents can be obtained by the simulation of typical emergency water pollution accidents at the above 16 accident points. The results are shown in
Table 3.
2.4. Rapid Prediction Model of Water Pollution Accidents
2.4.1. Pollutant Transport and Transformation Equation
The basic equation of one-dimensional river water transfer and transformation is:
where
C is the concentration of a certain pollutant in the river;
t is the time;
x is the flow distance of the river;
u is the average velocity of the river;
E is the comprehensive diffusion coefficient of the river reach;
is the leakage source of water pollutants in the river.
For continuous homogeneous blowdown, taking the leakage source
, the basic equation of water transfer and transformation in the one-dimensional homogeneous river reach can be obtained:
where
, that is, the upper form becomes the following ordinary differential equations in the steady state:
Its steady-state solution:
For
x = 0, the mass conservation of water:
where
and
are the pollution concentrations of the upper and lower sections of
x = 0, respectively;
is the discharge intensity at
x = 0;
A is the sectional area of flow at
x = 0;
E is the discrete coefficient. Then, the steady-state solution is:
Generally, inland rivers are not affected by tides; therefore, the effects of diffusion and discrete are often very small compared to the displacement effect. Thus, if
, then Formula (12) can be changed into as following:
Thus, the downstream concentration
C can be calculated by Formula (14):
2.4.2. Rapid Prediction Model
Based on the transport and transformation equations above, a rapid prediction model for the sudden water pollution accidents in the East Route of SNWDP was established:
where
is the pollutants concentration of accident location after completely mixed, mg/L;
C is the predicted pollutants concentration when pollutants reach the predicted position, mg/L;
is the degradation coefficient of each segment pollutants passed;
is the of each segment pollutant passed, km;
is the average velocity for each segment pollutant passed, km/d.
2.5. Parameter Calibration and Test
2.5.1. Parameter Calibration
(1) Parameter calculation
This can be obtained by Formula (14):
where
C0 and
C are pollutant concentration at the inlet and outlet, respectively, which can be calculated by the critical value of pollutants obtained by the simulation of the water quality listed in
Table 3.
Assuming that the initial pollutant concentration at the entrance of any river segment is class III water standard with
, and the critical values of pollutants at the inlet and outlet are
and
, g/s, respectively, then:
Substituting the critical values of pollutants in typical pollution accidents obtained by the simulation of water quality into Equations (17) and (18), the corresponding concentration was calculated, as shown in
Table 4.
(2) Parameter calibration
Firstly, using the concentration of the pollutants at the entrances (accident points including
A1,
B1 and
C1) and outlets (accident points including
A4,
B4 and
C4) of L-H, L-B and J-D, the average degradation coefficient of each section was calculated by Equation (16); the results are listed in
Table 5.
Then, the pollutant concentrations (P.C) under different flows at the other accident points, such as
A2,
B2,
C2,
A3,
B3 and
C3, can be rapid predicted by Equation (15); the results are listed in
Table 6 and
Table 7.
2.5.2. Parameter Test
According to the accuracy evaluation method and the test grade standard of the hydrological intelligence forecast standard in China (GB/T 22482-2008) (short for HIFS 2008), the rapid prediction results were tested by the qualification rate calculation and the validity evaluation.
(1) Calculation of the qualification rate
Calculating the error of the predicted values and the simulation values that resulted from water quality simulation, and taking the error less than 5% as the qualified standard, the qualified rate
can be calculated according to the following formula:
where
m is the number of typical accident points with the error meeting qualified standard;
n is the total number of accidents. The calculated qualified rates are listed in
Table 6 and
Table 7.
(2) Effectiveness assessment
The coefficient of certainty
DC was calculated by the following formula:
where
y(
i) is the simulation value;
yc(
i) is the prediction value;
is the mean value of the simulation value;
n is the total number of typical accident points. The certainty coefficients are listed in
Table 6 and
Table 7.
(3) Accuracy assessment and inspection grading standards
According to HIFS 2008, the test grades for the qualification rate calculation and effectiveness evaluation are shown in
Table 8.
The results below grade C can be considered to be unacceptable.
(4) Test result
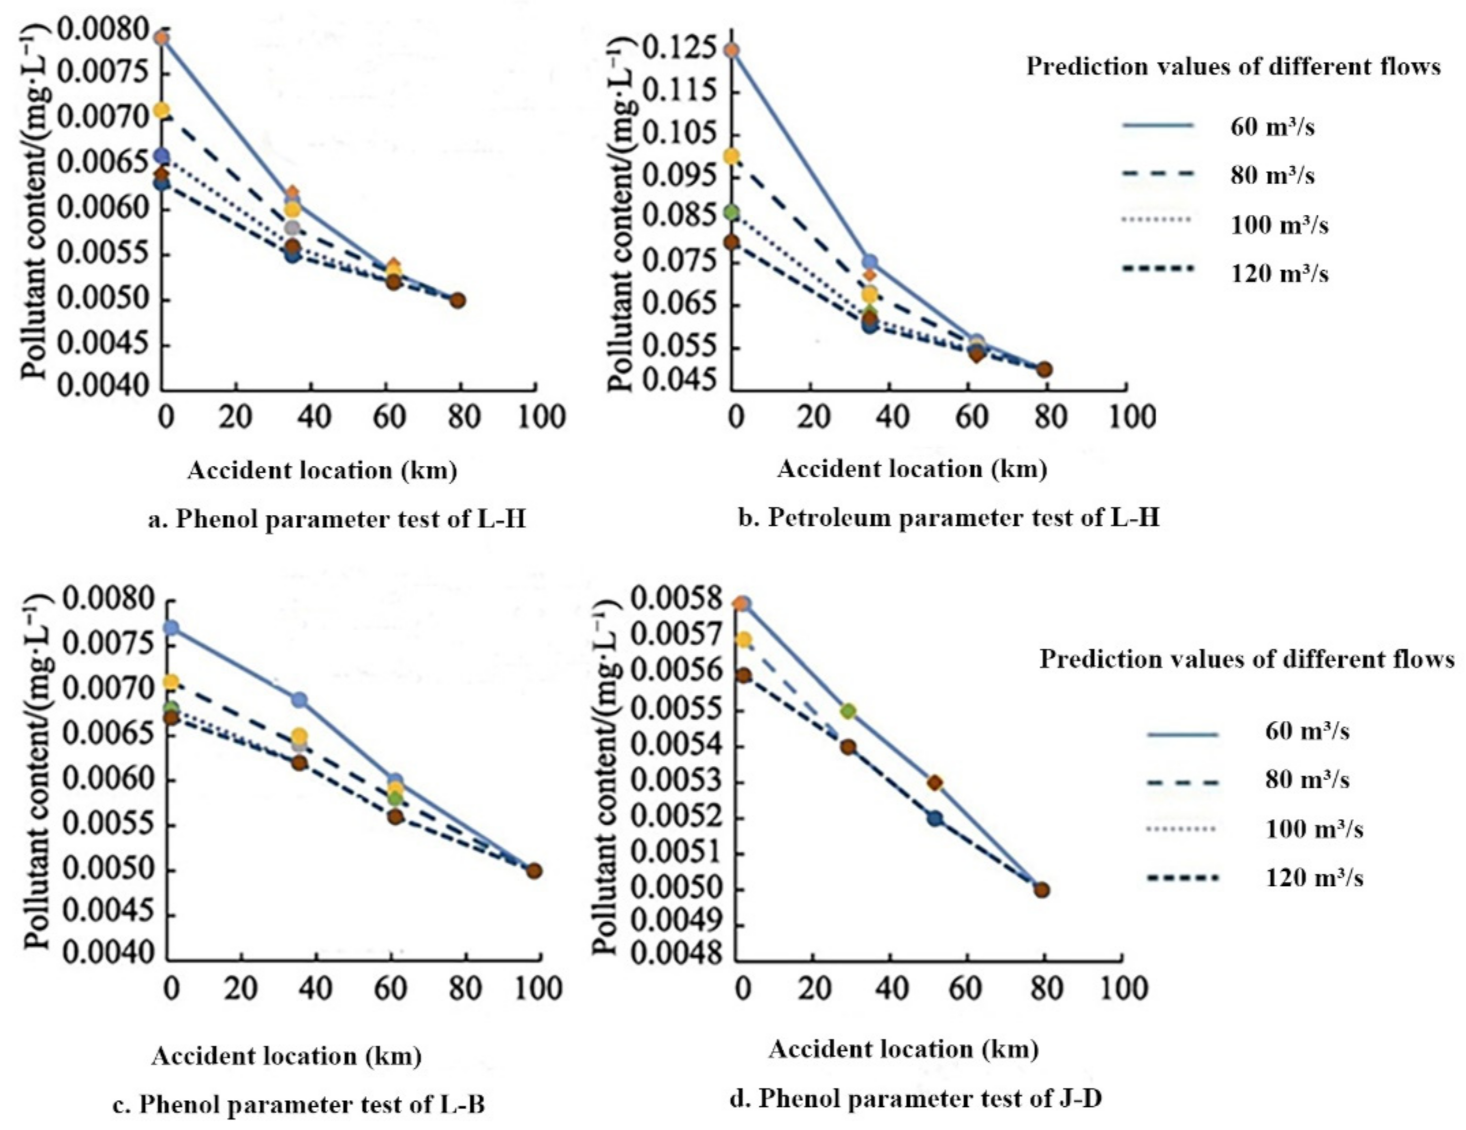
The test results showed that the error between the calculation obtained by the rapid prediction model and the simulation did not exceed 5%. Except for the 100 flow rate, the pass rate of L-H section is 75%, and the accuracy level is class B. The pass rates of the remaining points are all 100%, and the accuracy grades all reached class B or above. The process of the pollutant concentration change under different conditions for different pollutants is shown in
Figure 2, where the curves are the calculated pollutant concentration change process, and the scattered points are the typical accident simulation results.
From
Figure 2, it can be seen that most of the scattered points are distributed on the predicted concentration change curve. The above results showed that Formula (15) has a good application effect and can be used for the rapid prediction of sudden water pollution accidents in different typical sections of the SD-SNWDP.
2.6. Model Improvement
In order to improve the calculation accuracy of the model, according to the changes in the shape and size of the actual cross section of the main channel, and the distribution of hydraulic structures, considering the influence of different hydraulic characteristics on the degradation coefficient, the L-H canal was divided into three small sections, which were 0–26 km, 26–57 km and 57–79 km, respectively; the L-B canal was divided into three segments: 0–35 km, 35–61 km and 61–98 km; and the J-D canal was divided into three segments: 0–29 km, 29–51 km and 51–76 km.
According to the concentration change process in
Table 2 and Formula (16), the degradation coefficients of different representative pollutants in the main canal of Shandong Province were calculated. The degradation coefficients of phenol and petroleum in different typical sections of L-H section are shown in
Table 9, and the degradation coefficients of phenol in different typical sections of L-B and J-D are shown in
Table 10.
3. Results
3.1. Random Accident Selection
According to the actual situation of the accidental water pollution accident as far as possible, four sudden water pollution accidents were selected, as shown in columns 1 to 6 of
Table 11. The four types of sudden water pollution accidents are in different typical sections, with different typical pollutants, optional flow rates and optional pollutant inflow rates.
3.2. Rapid Prediction Results
Taking the location of the accident as a starting point without any measures, when the concentration of pollutants reaching the downstream section is just the surface water standard for class III, the required time will be taken as the impact time of the accident, and the distance traveled will be the scope of influence. Taking the influence time and scope as two comparative factors, the application effect of rapid prediction model was judged.
Substituting the parameters in
Table 7 and
Table 8 into the rapid prediction model (15), respectively, and using MATLAB software for calculation and programming, the influence time and scope of the abovementioned four types of sudden water pollution accidents can be predicted. The results are shown in the 7th and 8th column of
Table 11.
3.3. Verification of Forecast Results
Because there are no actual measured data for sudden water pollution accidents, in order to analyze the accuracy of the prediction results, MATLAB software was used to perform the numerical simulation for the sudden water pollution accidents above, and then the rapid prediction results were compared with the numerical simulation results.
The numerical simulation analysis used a cubic polynomial and a double-flat method to fit the equation:
where
C represents the critical value of the accident location to the exit, g/s;
D is the distance from the accident location to the section entrance;
Q is the section flow rate at the time of the accident, m/s;
are the parameters obtained by numerical simulation, as shown in
Table 12.
The database of sudden water pollution accidents (including location of accidents, flow rate, type of pollutants and pollutant inflow rate
vp) was imported into the MATLAB program, and numerical simulations were performed according to the fitting Equation (16) to calculate the pollutant impact time (
Tim) and range (
Tra), as shown in the 9th and 10th column of
Table 11.
3.4. Comparative Analysis
Calculating the relative error between the prediction and the numerical simulation, the result can be shown in the 11th and 12th column of
Table 11. The relative errors of the impact time between the prediction and the simulation are in the range of 0.52% to 4.83%, all less than 5%; the relative error of the impact ranges for the accidents of 1–4 are 0.23% to 7.15%, all less than 10%; the relative errors of the impact time and impact range of petroleum in the L-H section are 2.64% and 3.04%, respectively, while the errors of phenol are 0.92% and 0.23%, respectively.
4. Discussion
(1) L-H segment
Because of the volatilization and buoyancy of petroleum, the impact of wind speed during the process of transport and diffusion is large, causing an error in the rapid prediction results. Therefore, the relative error of the petroleum’s impact time and range between the rapid prediction and numerical simulation is greater than that of phenol.
(2) L-B segment
The relative errors of phenol’s impact time and range between rapid prediction and numerical simulation are both 0.52%, and thus, less than 1%. Because there is no shipping task in this canal segment, it can be considered that petroleum leakage accidents are not possible. Therefore, the rapid prediction model established can quickly predict possible sudden water pollution accidents.
(3) J-D segment
The relative error of phenol’s impact time and range between rapid prediction and numerical simulation are 4.83% and 7.15%, respectively, and relatively larger than those of the other two segment, but less than 10%. This is because in this canal section, the river section is long, and there are hidden culverts, reservoirs and other water control projects, which have a more obvious impact on the prediction results. Therefore, it is necessary to further study the influence of different types of water control projects in the canal section, and improve the model so that it can be better applied to this canal section.
In summary, the results of model test and comparative analysis showed that the relative errors are all less than 10%. Due to the timeliness of emergency treatment of sudden water pollution accidents, there is not enough time to run simulation models for accurate calculations in emergency situations. Therefore, the rapid forecast results can provide an emergency decision-making reference for the occurrence of a sudden water pollution accidents at the main channel of the eastern section of SD-SNWDP.
5. Conclusions
The rapid prediction of water quality is especially important for the SNWDP. Based on the results of Mike11 simulation and the empirical transfer formula of pollutant transport, the WQRP model was established for the main channel of SD-SNWDP. In the model, the parameters were calibrated and checked. In addition, four types of typical accidents were selected to further test and analyze the application of rapid prediction. The result showed that the relative errors of rapid prediction and numerical simulation are all less than 10%, demonstrating that the WQRP model has a better application effect in the SD-SNWDP.
The prediction model can quickly predict the spatiotemporal scope of sudden water pollution accident in SD-SNWDP, with high prediction accuracy. This rapid and accurate prediction model will play a technical support in the emergency treatment of sudden water pollution accidents in SD-SNWDP.
This prediction method can be used further onto other sections of SNWDP, which will provide an effective safety assurance for the water quality of water diversion project.
This study considered the common and transport pollutants of phenol and petroleum in the SD-SNWDP. With the economic development of the Shandong section, more dangerous water pollutants may appear. It is suggested to enrich the predictable pollutant types in the model, so that the model can more effectively deal with sudden water pollution accidents.
Author Contributions
Y.Z. and R.Z. designed this research. T.P. and H.Z. contributed to the data collection and analysis. T.P. developed the original manuscript. H.W. revised the article and proposed some helpful advice. All authors have read and agreed to the published version of the manuscript.
Funding
This work was supported by the National Science and technology support project of China under Grant No. 2015BAB07B02 in 12th Five-Year, Intellectual projects of Shandong Province (Grant No. 20199748), Water conservancy research and technology promotion projects of Shandong Province (Grant No. SDSLKY 201807, 201815, 201902, 24711).
Institutional Review Board Statement
Not applicable.
Informed Consent Statement
Not applicable.
Data Availability Statement
The data presented in this study are available on request from the corresponding author.
Conflicts of Interest
The authors declare no conflict of interest.
References
- Kosolapova, N.A.; Matveeva, L.G.; Nikitaeva, A.Y.; Molapisi, L. Modeling resource basis for social and economic development strategies: Water resource case. J. Hydrol. 2017, 553, 438–446. [Google Scholar] [CrossRef]
- Wang, M.; Webber, M.; Finlayson, B.; Barnett, J. Rural industries and water pollution in China. J. Environ. Manag. 2008, 86, 648–659. [Google Scholar] [CrossRef] [PubMed]
- Cai, B.M.; Chen, C.; Wang, B.Z. Worse than imagined: Unidentified virtual water flows in China. J. Environ. Manag. 2017, 196, 681–691. [Google Scholar] [CrossRef] [PubMed] [Green Version]
- Davidsen, C.; Liu, S.; Mo, X. Hydroeconomic optimization of reservoir management under downstream water quality constraints. J. Hydrol. 2015, 529, 1679–1689. [Google Scholar] [CrossRef] [Green Version]
- Li, Y.Y.; Cao, J.T.; Huang, H.J.; Xing, Z.Q. International progresses in integrated water resources management. Adv. Water Sci. 2018, 29, 127–137. (In Chinese) [Google Scholar]
- Wen, Z.G.; Di, J.H.; Zhang, X.Y. Uncertainty analysis of primary water pollutant control in China’s pulp and paper industry. J. Environ. Manag. 2016, 169, 67–77. [Google Scholar] [CrossRef] [PubMed]
- Cao, S.X.; Zhang, J.Z.; Chen, L.; Zhao, T.Y. Ecosystem water imbalances created during ecological restoration by afforestation in China, and lessons for other developing countries. J. Environ. Manag. 2016, 183, 843–849. [Google Scholar] [CrossRef]
- Akron, A.; Ghermandi, A.; Dayan, T.; Hershkovitz, Y. Interbasin water transfer for the rehabilitation of a transboundary mediterranean stream: An economic analysis. J. Environ. Manag. 2017, 202, 276–286. [Google Scholar] [CrossRef]
- Zhang, C.; Nong, X.Z.; Shao, D.G.; Zhong, H.; Shang, Y.M.; Liang, J.K. Multivariate water environmental risk analysis in long-distance water supply project: A case study in China. Ecol. Indic. 2021, 125, 107577. [Google Scholar] [CrossRef]
- Guo, C.B.; Chen, Y.S.; Liu, H.; Lu, Y.; Qu, X.; Yuan, H.; Lek, S.; Xie, S.G. Modelling fish communities in relation to water quality in the impounded lakes of China’s South-to-North Water Diversion Project. Ecol. Model. 2019, 397, 25–35. [Google Scholar] [CrossRef]
- Fu, H.; Yang, X.L. Effects of the South-North Water Diversion Project on the water dispatching pattern and ecological environment in the water receiving area: A case study of the Fuyang River Basin in Handan, China. Water 2019, 11, 845. [Google Scholar] [CrossRef] [Green Version]
- Huang, Z.; Liu, J.H.; Mei, C.; Wang, H.; Shao, W.W. Water security evaluation based on comprehensive index in Jing-Jin-Ji district, China. Water Sup. 2020, 20, 2698–2714. [Google Scholar] [CrossRef]
- Zhao, P.; Li, Z.G.; Zhang, R.Q.; Pan, J.F.; Liu, Y. Does water diversion project deteriorate the water quality of reservoir and downstream? A case-study in Danjiangkou reservoir. Glob. Ecol. Conserv. 2020, 24, e01235. [Google Scholar] [CrossRef]
- Kuo, Y.M.; Liu, W.W.; Zhao, E.M.; Li, R.; Munoz-Carpena, R. Water quality variability in the middle and down streams of Han River under the influence of the Middle Route of South-North Water diversion project, China. J. Hydrol. 2019, 569, 218–229. [Google Scholar] [CrossRef]
- Tang, C.H.; Yi, Y.J.; Yang, Z.F. Water pollution risk simulation and prediction in the main canal of the South-to-North Water Transfer Project. J. Hydrol. 2014, 519, 2111–2120. [Google Scholar] [CrossRef]
- Wei, Z.B. Simulation and Emergency Disposal Research on Sudden Water Pollution of Xiaoyun River for the Eastern Route of the South-to-North Water Diversion Project. Master’s Thesis, Shandong University, Jinan, China, 2014. (In Chinese). [Google Scholar]
- Pan, Y.; Yuan, Y.; Sun, T.; Wang, Y.X.; Xie, Y.J.; Fan, Z.Q. Are the water quality improvement measures of China’s South-to-North Water Diversion Project effective? A case study of Xuzhou section in the east route. Int. J. Environ. Res. Public Health 2020, 17, 6388. [Google Scholar] [CrossRef]
- Wang, H.; Zheng, H.Z.; Lei, X.H. Study on key technologies of emergency regulation and treatment to ensure water quality safety of the main canal of middle routes of South-to-North Water Diversion Project. J. Sichuan Univ. 2016, 48, 1–6. (In Chinese) [Google Scholar]
- Nong, X.; Shao, D.G.; Zhong, H.; Liang, J.K. Evaluation of water quality in the South-to-North Water Diversion Project of China using the water quality index (WQI) method. Water Res. 2020, 178, 115781. [Google Scholar] [CrossRef]
- Hou, W.; Sun, S.S.; Wang, M.Q.; Gu, B.H.; Li, X.; Zhang, C.X.; Jia, R.B. Variations in stable carbon and nitrogen isotopes of particulate organic matter in surface waters of water-receiving area of Eastern Route of South-to-North Water Transfer Project, China. Environ. Sci. R. 2020, 27, 2805–2818. [Google Scholar] [CrossRef]
- Doulgeris, C.; Georgiou, P.; Papadimos, D.; Papamichail, D. Ecosystem approach to water resources management using the MIKE 11 modeling system in the Strymonas River and Lake Kerkini. J. Environ. Manag. 2012, 94, 132–143. [Google Scholar] [CrossRef]
- Liu, Y.S.; Ji, G.D.; Luo, Z.X.; Luo, M. Pollution control effects of the east route of the South-to-North Water Diversion Project on the environment and economy of Shandong. China Popul. Resour. Environ. 2020, 30, 73–81. (In Chinese) [Google Scholar]
- Zhao, R.H.; Chen, C.; Li, Y.Q. Emergency risk assessment in Shandong section of South-to-North Water Transfer Project. South-North Water Transf. Water Sci. Technol. 2017, 15, 180–186. (In Chinese) [Google Scholar]
- Fischer, H.B.; List, E.J.; Koh, R.C.Y.; Imberger, J.; Brooks, N.H. Mixing in Inland and Coastal Water; Academic Press: Cambridge, MA, USA, 1979. [Google Scholar]
| Publisher’s Note: MDPI stays neutral with regard to jurisdictional claims in published maps and institutional affiliations. |
© 2021 by the authors. Licensee MDPI, Basel, Switzerland. This article is an open access article distributed under the terms and conditions of the Creative Commons Attribution (CC BY) license (https://creativecommons.org/licenses/by/4.0/).


