Article

Future Changes in Precipitation Extremes over East Africa Based on CMIP6 Models

1
Jiangsu Key Laboratory of Atmospheric Environment Monitoring and Pollution Control, Collaborative Innovation Center of Atmospheric Environment and Equipment Technology, School of Environmental Science and Engineering, Nanjing University of Information Science and Technology, Nanjing 210044, China
2
Key Laboratory of Meteorological Disaster, Ministry of Education (KLME)/Joint International Research Laboratory of Climate and Environment Change (ILCEC)/Collaborative Innovation Center on Forecast and Evaluation of Meteorological Disasters (CIC-FEMD), Nanjing University of Information Science and Technology, Nanjing 210044, China
3
Organization of African Academic Doctors (OAAD), Off Kamiti Road Nairobi, Nairobi P.O. Box 25305-00100, Kenya
4
International Center for Climate and Environment Sciences, Institute of Atmospheric Physics, Chinese Academy of Sciences, Beijing 100029, China
5
Energy, Climate, and Environment Science Group, Imo State Polytechnic Umuagwo, Ohaji, Owerri 1472, Imo State, Nigeria
6
Department of Geosciences, University of Connecticut, Storrs, CT 06269, USA
7
Binjiang College, Nanjing University of Information Science and Technology, Wuxi 214105, China
8
Department of Mathematics and Statistical Sciences, Botswana International University of Science and Technology, Private Bag 16, Palapye Plot 10071, Botswana
9
International Water Research Institute, Mohammed VI Polytechnic University, Lot 660, Hay Moulay Rachid, Ben Guerir 43150, Morocco
*
Author to whom correspondence should be addressed.
Water 2021, 13(17), 2358; https://doi.org/10.3390/w13172358
Submission received: 17 July 2021 / Revised: 22 August 2021 / Accepted: 23 August 2021 / Published: 27 August 2021

Abstract

:
This paper presents an analysis of projected precipitation extremes over the East African region. The study employs six indices defined by the Expert Team on Climate Change Detection Indices to evaluate extreme precipitation. Observed datasets and Coupled Model Intercomparison Project Phase six (CMIP6) simulations are employed to assess the changes during the two main rainfall seasons: March to May (MAM) and October to December (OND). The results show an increase in consecutive dry days (CDD) and decrease in consecutive wet days (CWD) towards the end of the 21st century (2081–2100) relative to the baseline period (1995–2014) in both seasons. Moreover, simple daily intensity (SDII), very wet days (R95 p), very heavy precipitation >20 mm (R20 mm), and total wet-day precipitation (PRCPTOT) demonstrate significant changes during OND compared to the MAM season. The spatial variation for extreme incidences shows likely intensification over Uganda and most parts of Kenya, while a reduction is observed over the Tanzania region. The increase in projected extremes may pose a serious threat to the sustainability of societal infrastructure and ecosystem wellbeing. The results from these analyses present an opportunity to understand the emergence of extreme events and the capability of model outputs from CMIP6 in estimating the projected changes. More studies are recommended to examine the underlying physical features modulating the occurrence of extreme incidences projected for relevant policies.

1. Introduction

The frequent occurrence of extreme weather and climate events such as heatwaves, droughts, and heavy rainfall over the recent years is evidence of climate change [1,2,3,4], which is linked to global warming. The recent special report of the Intergovernmental Panel on Climate Change (IPCC) on impacts of global warming of 1.5 °C estimates that global warming is likely to reach 1.5 °C between 2030 and 2052 relative to the pre-industrial levels under the “business as usual” scenario [5]. The resultant response of climate systems will be depicted by features such as increased intensity of precipitation extremes, a sharp decline in the number of wet spell lengths, and an increase in dry spell lengths [6]. The unprecedented impacts of climate extremes threaten human health, economic stability, and the stability of natural and built infrastructure [7]. Thus, characterizing the response of anthropogenic climate change, which results in extreme events at the regional or local level, is an imperative task. This is necessary for policy and decision-making, especially in developing effective adaptation strategies.
Global and regional precipitation changes have been noted with substantial upsurge detected over Europe [8,9], China [10,11,12,13] and the United States [9,14,15,16], among other regions. Consequently, much progress has been made to enhance the understanding of the recent changes and possible attributions to global warming even though the process is a challenge [2,8,17,18,19]. Overall, an increase in moisture as a result of shifts in the dynamical processes has been noted to drive amplification of precipitation intensity.
Africa is one of the most susceptible areas to climate variability and change [20]. Numerous studies agree that the continent is experiencing changes in climate patterns [21,22,23,24,25]. For instance, many sub-regions have experienced notable changes in precipitation over the recent decades [4,21,26]. Similarly, positive trajectories in temperature have been observed and are projected to increase significantly across the continent [20,27,28,29,30,31,32]. This will affect the broader population’s livelihoods that mainly rely on rainfed agriculture [33]. Further, the projected increase in temperature will intensify moisture loss through amplified evapotranspiration and strengthen the occurrence of drought hazards [34,35,36,37].
Despite the widespread occurrence of extreme climate events, regional variation is noted due to complex physiographical features and processes, resulting in varying responses to the global-scale change [38]. Using the global climate model outputs derived from the Coupled Intercomparison Project Phase 5 (CMIP5; [39]), various researchers have reported this large regional variability in the extent, duration, frequency, and intensity of extreme climate events [10,40,41,42]. A recent study by Weber et al. [43] observed that temperature projections in sub-Saharan Africa (SSA) will exceed the global mean temperature increase. To illustrate, the tropical region (15° S and 15° N) is projected to experience an amplification in hot nights, coupled with much longer and more frequent heat waves [44]. Thus, it is paramount to characterize the regional trends and future variations of extreme events for robust adaptation and risk management strategies.
Other than recording high spatiotemporal rainfall variability, the East Africa region witnesses unusual weather events such as droughts and floods [29,36,45,46,47,48]. The region’s socioeconomic development will be adversely affected if proper mechanisms are not put in place to address the impacts of weather and climate extremes. Several studies based mainly on CMIP5 or regional climate models (RCMs) have been conducted to examine the historical trends and future extremes events of the region [49,50,51,52,53,54]. Undoubtedly, these studies’ overall conclusion shows a varying trend of change, mainly attributed to the model datasets employed or period analyzed.
Essentially, temperature extremes (i.e., minimum and maximum temperature) show an overall upward tendency in many studies [3,29,50,51]. Conversely, projections in precipitation extremes using indices developed by the Expert Team on Climate Change Detection and Indices (ETCCDI; [40,55]) are marred by uncertainty and unclear patterns [51,52]. To demonstrate, Onyutha et al. [52] showed significant biases in RCMs employed in simulating maximum wet spell (MWS) over the region. Similar uncertainties in precipitation projections are noted across the Greater Horn of Africa (GHA), in a study that utilized a large, 25-member RCM and employed robust techniques for detecting climate change signals [51]. There remains a need for reliable projections of precipitation extremes over the EA region for appropriate measures to be put in place to cushion the population from unforeseeable devastating impacts.
Reliable projections are of great importance in projecting future climate change. The CMIP6 [56] presents the prospects to advance our understanding of climate change impacts resulting from compounded global warming. Relevant stakeholders are in urgent need of timely evidence that will enable them to deal with pertinent issues such as those that pinpoint the exact tendencies of historical changes, the magnitude of the shift, and future projections. However, to the best of our knowledge, there is still a lack of information regarding the projections of EA precipitation extremes under the new CMIP6 scenarios. The few existing studies have focused on examining historical performance in simulating climate extremes or value-addition of CMIP6 against the predecessor CMIP5 [57,58]. Consequently, this study seeks to add to the concerted efforts being undertaken to enhance the understanding of occurrence and variability of extreme precipitation. The study aims to provide a comprehensive picture of the magnitude of precipitation extremes over EA, and in particular examines the projected changes in EA’s extremes under Shared Socio-Economic Pathways (SSP2–4.5 and SSP5–8.5). These SSP-based scenarios consist of a set of baseline scenarios, which provide a description of future developments in the absence of climate change or new climate policies beyond those in place today, as well as mitigation scenarios which explore the implications of climate change mitigation policies applied to the baseline scenarios [59]. This will enable decision makers and policymakers to develop robust policies for sustainable socioeconomic development. The rest of the paper is structured as follows: Section 2 elaborates more on the data and methods used; Section 3 gives the analyses’ results; Section 4 presents a discussion of the results and the last section of this paper; Section 5 concludes.

2. Study Area, Materials, and Methods
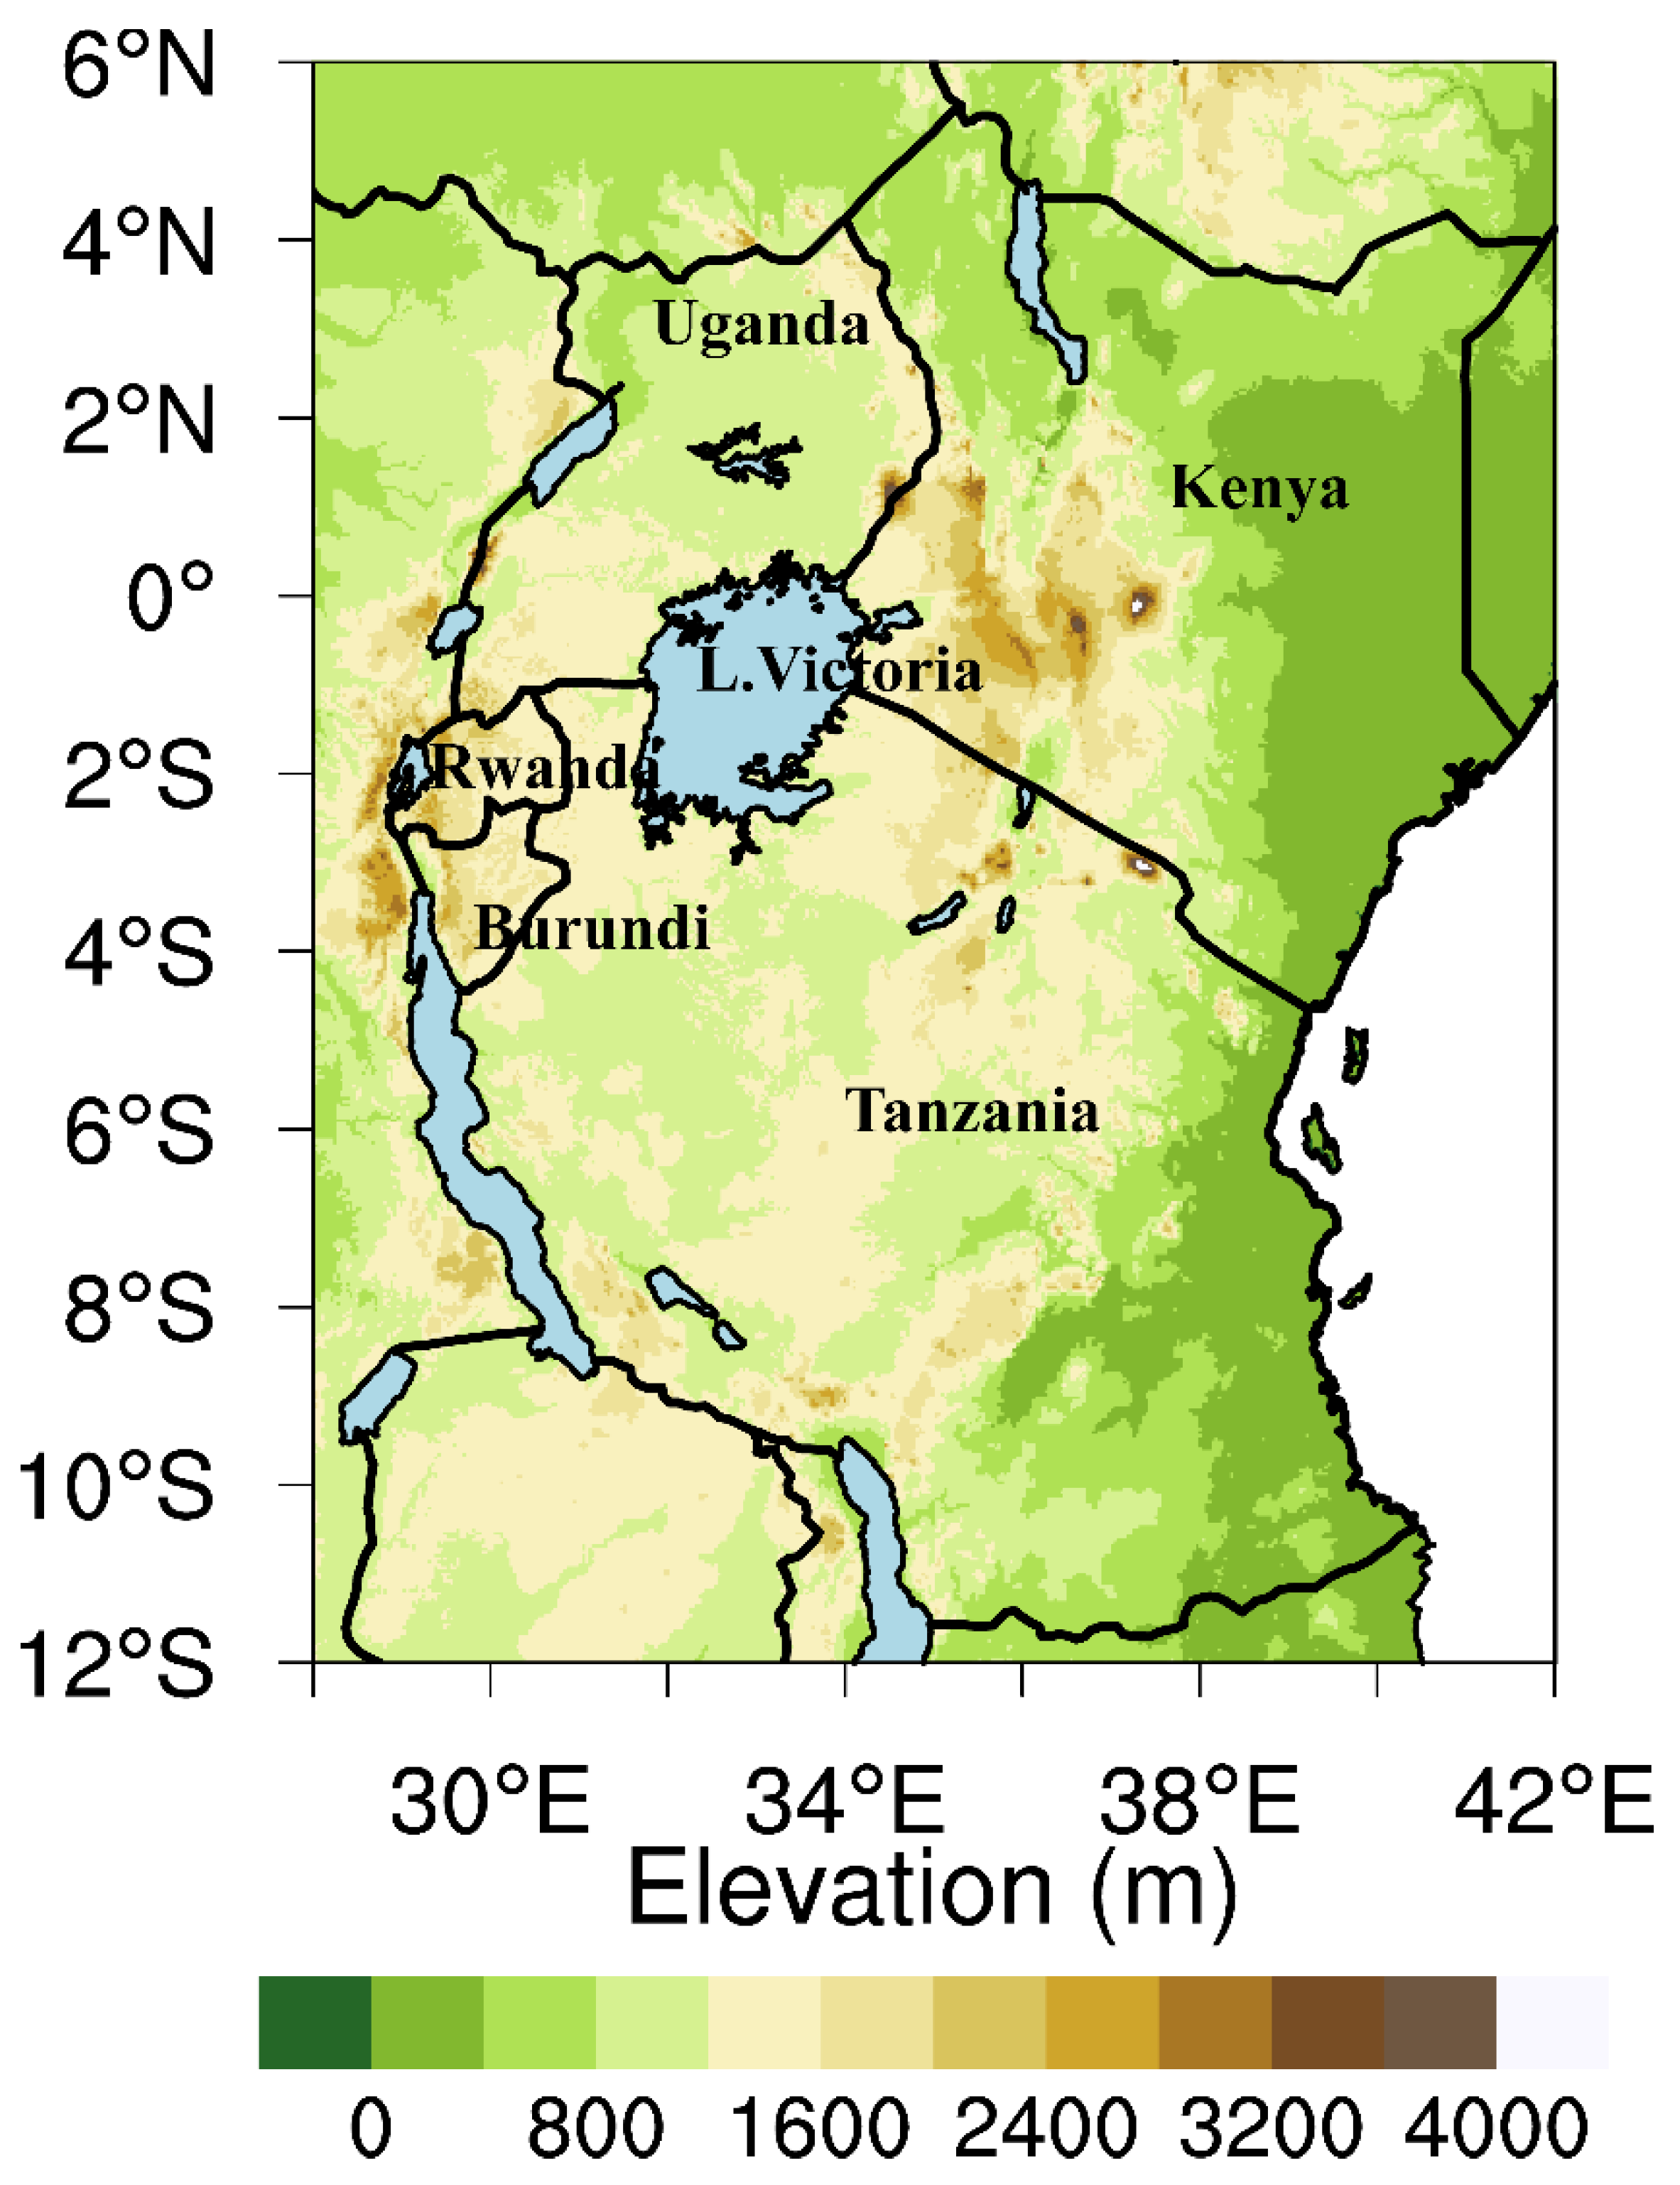
2.1. Study Area

The East Africa region consists of five countries, namely, Kenya, Uganda, Tanzania, Burundi, and Rwanda. The geographical identity entails longitude of 28 ° E–40° E and latitude of 12° S–5° N (Figure 1). The region is characterized by physiographical features such as Lake Victoria, which is shared amongst the three countries of Kenya (6%), Uganda (45%) and Tanzania (49%). Others include the Rift Valley and high elevation landmarks of Mount Kilimanjaro (~5885 m), Mount Kenya (~5199 m), and Mount Stanley (~5109 m). Such features influence regional weather and climate [60].
The region receives two main rainy seasons. The first occurs during the months of March, April, and May (MAM), locally referred as the “long-rains” season, while the second occurs during the months of October, November, and December (OND, “short-rains”) [60]. The peaks of MAM and OND are mostly associated with the tropical rain belt that oscillates from 15° S–15° N throughout the year [60]. Other factors that have a major influence on the regional weather and climate include the El-Nino Southern Oscillation (ENSO), Indian Ocean Dipole (IOD), Madden-Julian Oscillation (MJO), Quasi Biennial Oscillation (QBO), and sub-tropical high-pressure systems [61,62,63,64]. Nicholson et al. [65] and Camberlin et al. [66] elucidate more information regarding the East African climate.
The region is mainly dependent on agro-based economy, with 80% of the total population reliant on rainfed agriculture for survival [67,68]. The emergence of extreme events such as droughts and floods has an adverse impact on the already vulnerable population suffering from abject poverty due to prevailing economic turmoil [33].

2.2. Data

The study utilized General Circulation Model (GCM) datasets from the CMIP6 models [56]. The daily precipitation (pr) under SSP2–4.5 and SSP5–8.5 scenarios are used in the estimation of extreme precipitation events. The SSP2–4.5 (+4.5 Wm−2) represents medium forcing middle-of-the-road pathway while SSP5–8.5 (+8.5 Wm−2) denotes high-end forcing pathways [59]. The SSP2–4.5 scenario is considered as a more plausible outcome where modest mitigation implementation will curb the global warming to ~2.5 °C warming relative to pre-industrial period by the end of the 21st century [59]. On the other hand, SSP5–8.5 is also referred to as “business as usual”, implying a dystopian future that is fossil-fuel intensive, void of stringent climate mitigation, leading to nearly 5 °C of warming by the end of the century. The choice for the two radiative forcing scenarios from the available five possible frameworks was informed by the assumption that differences in climate outcomes produced by varying scenarios for the same global pathways are likely small relative to varying features of regional climate or/and inter-model uncertainties [59]. The framing of SSP provides a new opportunity to examine the future in terms of physical climate change and global socioeconomic pathways [59]. The historical experiment starts from 1850 to 2014 while forcing datasets under Scenario Model Intercomparison Project (Scenario MIP; [59]), which runs from 2015 to 2100. We selected 1995–2014 as the base period, along with two future time frames, referred to hereafter as near-future (2021–2040) and far-future (2081–2100). This study utilized the first realization (r1i1p1f1) from fifteen models that have relatively high spatial resolution (~1°). Moreover, only models that had complete outputs for the first run of ensemble at historical and two projections scenarios were retrieved from the Earth Systems Grid Federation (ESGF; https://esgf-node.llnl.gov/projects/esgf-llnl/ (accessed on 16 October 2020)) website at the time of the analysis. Table 1 presents the model description including the spatial resolution, the institute(s) possessing the intellectual property rights, and the abbreviation of the datasets used. It is important to note that this study used the models’ output in their native properties without employing post-processing of bias-correction technique. This is due to the fact that bias adjustment does not correct the models’ deficiencies in representing fundamental physical processes, and the projection of the models remains unreliable, even after bias adjustment. The study included a multi-model ensemble (MME) of the model datasets in its analyses. All datasets were re-gridded to 1° × 1° using a remapping technique.

2.3. Methods

Six indices obtained from ETCCDI are used to explore future changes in seasonal precipitation over the study region. They are as follows: the consecutive wet (dry) days (CWD (CDD)), very wet days expressed as percentile-based of R95 p, very heavy precipitation days exceeding 20 mm (R20 mm), simple daily intensity index (SDII), and seasonal precipitation total (PRCPTOT) [40]. The mentioned indices are selected to examine the future changes in regional precipitation intensity, frequency, and duration. A recent study over EA [57] employed the listed indices attempting to explore the ability of CMIP6 models to represent the present-day characteristics and spatial distribution of extreme precipitation. Key results from the study established the capability of MME in representing the observed precipitation and related extremes compared to individual models during the rainfall seasons. Moreover, the study established a better performance of MME in reproducing annual total precipitation as compared to the extremes [57]. Thus, this study equally utilizes the MME in examining the future changes in local precipitation extremes. Numerous studies (e.g., [69,70]) have employed the six indices (listed above) to examine changes in precipitation across various regions.
The robustness of the projected climate change and the associated uncertainty was determined quantitatively by establishing the credibility and strength of the climate signal in the MME projections of CMIP6 models using the signal-to-noise ratio (SNR). The SNR is expressed as a ratio of the absolute value of the anticipated changes by the MME to the model spread. Projections are considered to be reliable if SNR >1 or low credibility if SNR <1.

3. Results

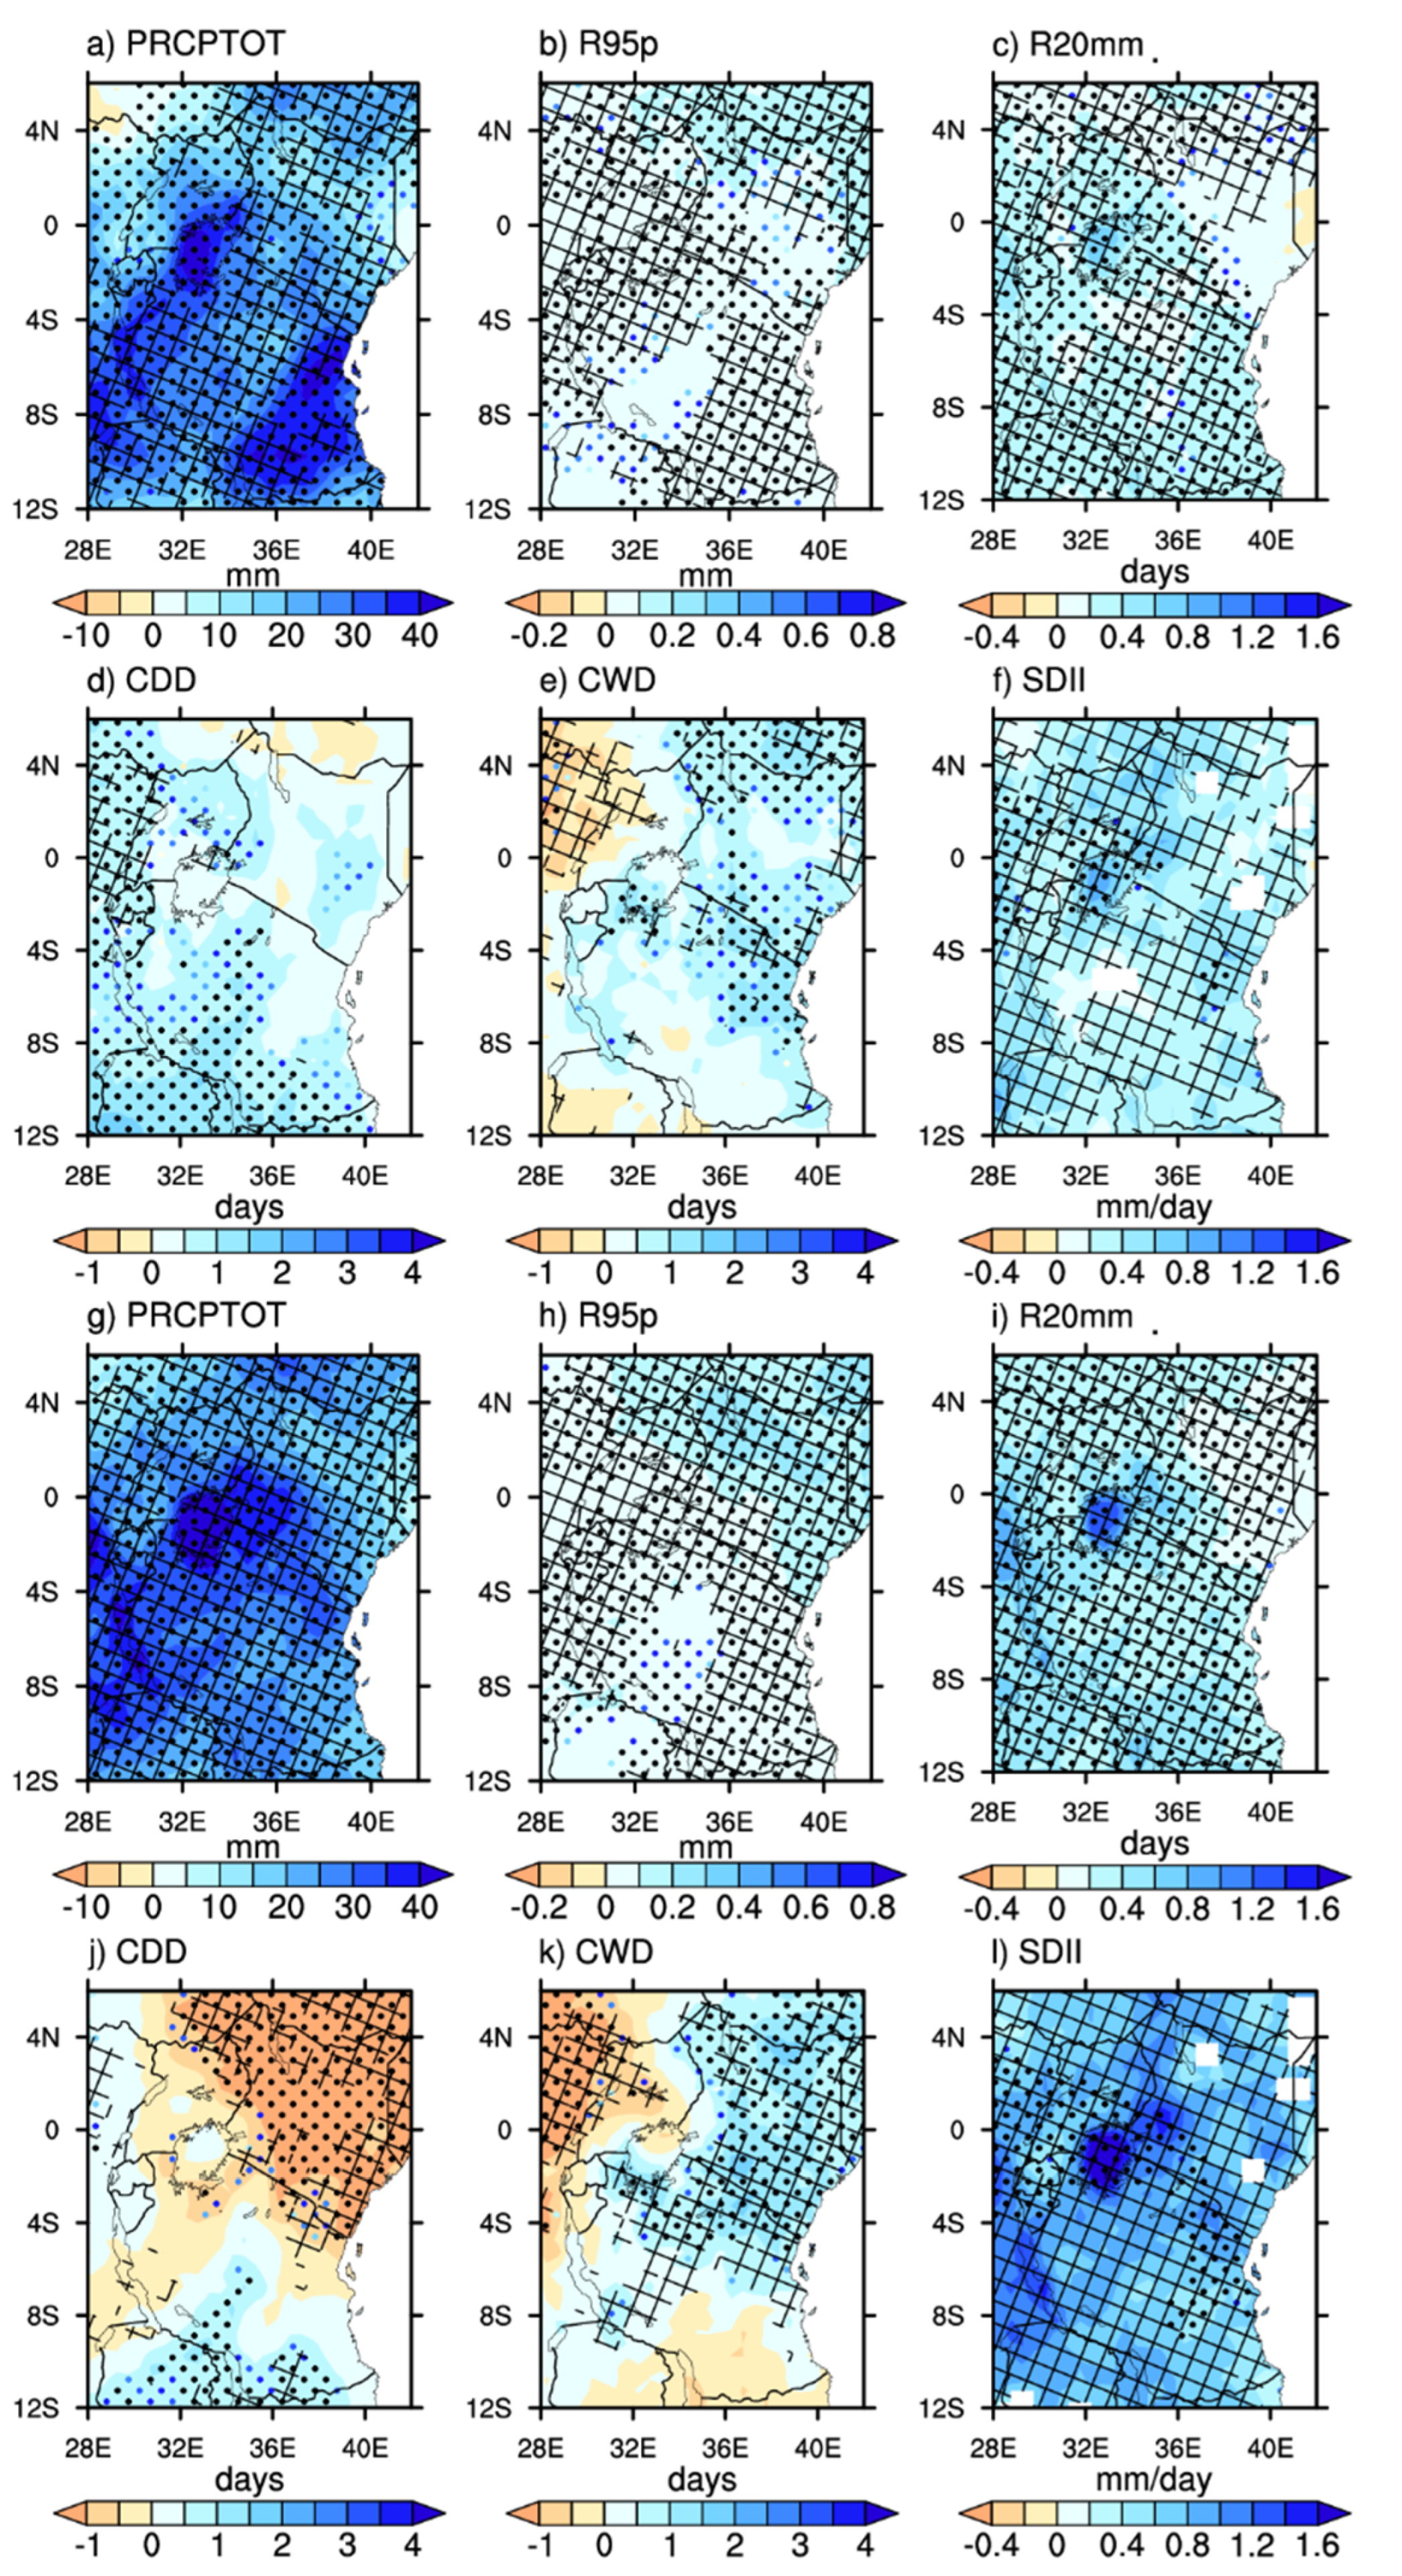
3.1. Future Changes in Long-Rain Season

This study considered relevant extreme indices suitable for examining the societal needs that are “user-relevant” for appraising possible future changes in extreme events. Figure 2a–l present spatial distribution of the projected changes in long-rain precipitation extremes under SSP2–4.5 and SSP5–8.5 for the near future relative to the baseline period. The region will experience varying changes in climate over the next few decades. For illustration, the results show that the area will experience a significant occurrence of R95 p that is projected to occur over the whole region. The projected increase ranges between 0.2 and 0.6 mm in both scenarios.
Further, the analysis shows an increase in PRCPTOT under the SSP5–8.5 scenario (Figure 2g) compared to the SSP2–4.5 scenario (Figure 2a). The projection under SSP2–4.5 (Figure 2a–f) demonstrates a downward trend over Kenya and Uganda while a noteworthy increase is noted over the Tanzania region, ranging from 10 mm to 20 mm. Notably, no significant differences are projected to occur in wet-day intensity index (SDII) in either scenario under investigation (Figure 2f,l). The projected change in SDII is −0.4 to 0.4 in both scenarios. Meanwhile, the CWD index, CDD, and R20 mm do not show significant changes under the two scenarios (Figure 2a–l). The occurrence of heavy precipitation days is likely to go upwards over the Tanzania region under SSP2–4.5 and further strengthen to cover other areas such as western Kenya and northwest Uganda in the SSP5–8.5 scenario (Figure 2i) at −0.4 to 0.8. In a related study, Mafuru and Tan [71] reported an increase in heavy rainfall events (HRE; defined as any amount above 50 mm/24 h) with a total of 822 cases, which were mostly concentrated over the northern section of Tanzania. The study further attributed the increase in HREs to several factors such as low-level westerly convergence, intensified advection of moisture from both the Indian Ocean and Congo Basin, and distinct tropospheric warm temperature anomaly. The findings herein suggest that the region will continue to experience changes in extreme weather and climate events. Most indices demonstrate the reduction in extreme incidences, except for total precipitation and the variability in very wet days (R95 p). Such changes are likely to affect most sectors such as agricultural productivity and societal infrastructure.
Projected changes towards the end of the century relative to baseline period for the long-rain season are presented in Figure 3. Because of the devastating impacts of extreme events, it is essential to examine their evolution both in the near future and towards the end of the century for adequate planning purposes. Moreover, the large-scale climate drivers regulating the interannual and decadal variability of precipitation over the region for the MAM season remain complex [63,64,72]. Assessment of the number of total seasonal precipitation and simple precipitation index are represented by PRCPTOT and SDII. The results (Figure 3) show a significant increase in PRCPTOT covering the entire area with a substantial magnitude of >40 mm expected in the southwestern parts of Tanzania, southern Uganda and along parts of western Kenya. Noticeably, under the SSP2–4.5 scenario, the spatial patterns of PRCPTOT (Figure 3a) depict the considerable impact over southwest and southeast Tanzania while in SSP5–8.5 (Figure 3g), a significant shift is noted towards the southwest section only in the range of 30 to 40 mm. Conversely, the intensity index depicts no remarkable change in both scenarios towards the end of the century. The spatial distribution shows distinct changes over Uganda and along the southeast stretch of Kenya and Tanzania, highlighting significant impact, with most models agreeing to the changes. The projected SDII change under the SSP5–4.5 scenario (Figure 3f) shows 0.4–1.6 mm, while SSP5–8.5 (Figure 3i) depicts a 0.8–1.6 mm increase towards the end of the century.
Further analyses on the duration indices, which define periods of excessive wetness/dryness such as CWD/CDD, show continuous drying/wetting patterns under the two scenarios examined. The CDD depicts significant drying patterns over Kenya and few areas along with southern parts of Tanzania under SSP2–4.5 for 2–3 days and−1 to 0 under SSP5–8.5 scenario (Figure 3d,j). Similar patterns are shown for CWD during the study period but for wetting patterns (Figure 3e,k). The study also considered R95 p and R20 mm to examine the evolution of the number of days with heavy precipitation and projected changes in total precipitation with >95th percentile. The two indices’ results depicted noteworthy positive trajectories over the whole region with values of 0.2–0.4 mm (R95 p) and 0.4–1.4 mm (R20 mm) during the two scenarios.
A summary of projected changes in precipitation extremes during MAM is presented in Figure 4. The time series is averaged over EA in future years under SSP2–4.5 and SSP5–8.5 scenarios relative to historical periods. Additionally, uncertainty in the model spread is shown based on the 25th to 75th interquartile range for SSP2–4.5 and SSP5–8.5 scenarios for the precipitation extremes. A similar approach has been used in a recent study that explored the future changes in precipitation over China based on CMIP6 models [73]. The precipitation indices of PRCPTOT, R20 mm, and SDII are projected to significantly increase under both scenarios (Figure 4a,c,d). By the end of the century, PRCPTOT, R20 mm, and SDII are projected to increase by approximately 23 mm, 0.5 d, and 0.6 d, respectively, under the SSP5–8.5 scenario. However, CDD shows a decreasing tendency and is projected to decline by approximately 2 to 4 days under high emission scenario (Figure 4d). The R95 p and CWD depict large variability across the time series with patterns of increase and decrease expected to occur (Figure 4b,e). Under the SSP2–4.5 (SSP5–8.5) scenario, a large increase in CWD is expected during 2020–2040 at 0.23 d (0.25 d). However, a sharp reduction is projected during mid-century and reverse patterns thereafter 2060 under the SSP5–8.5 scenario. The findings of this study show that the study area will experience varying extremes, such as a reduction in CDD under the SSP5–8.5 scenario whereas an upward trend is projected for PRCPTOT, R20 mm, and SDII. A decrease in MAM precipitation could be due to projected earlier onset/cessation dates relative to the baseline period, possibly impacting the long rain season [53]. Likewise, the persistent drying pattern is shown in CDD, which is likely to intensify under the SSP5–8.5 scenario. The resultant impact will likely reduce agricultural production, which mainly relies on rainfall and temperature. Precipitation intensity is likely to increase with cases of R95 p, R20 mm, and CWD, showing significant positive changes. The incidences of concurrent wetness/dryness projected agree with previous studies [23,46,72]. The region is prone to the occurrence of drought/flood incidences, which are mainly a result of anthropogenic influence and changes associated with internal variability, e.g., by ENSO and in Interdecadal Pacific Oscillation (IPO) [74,75,76].

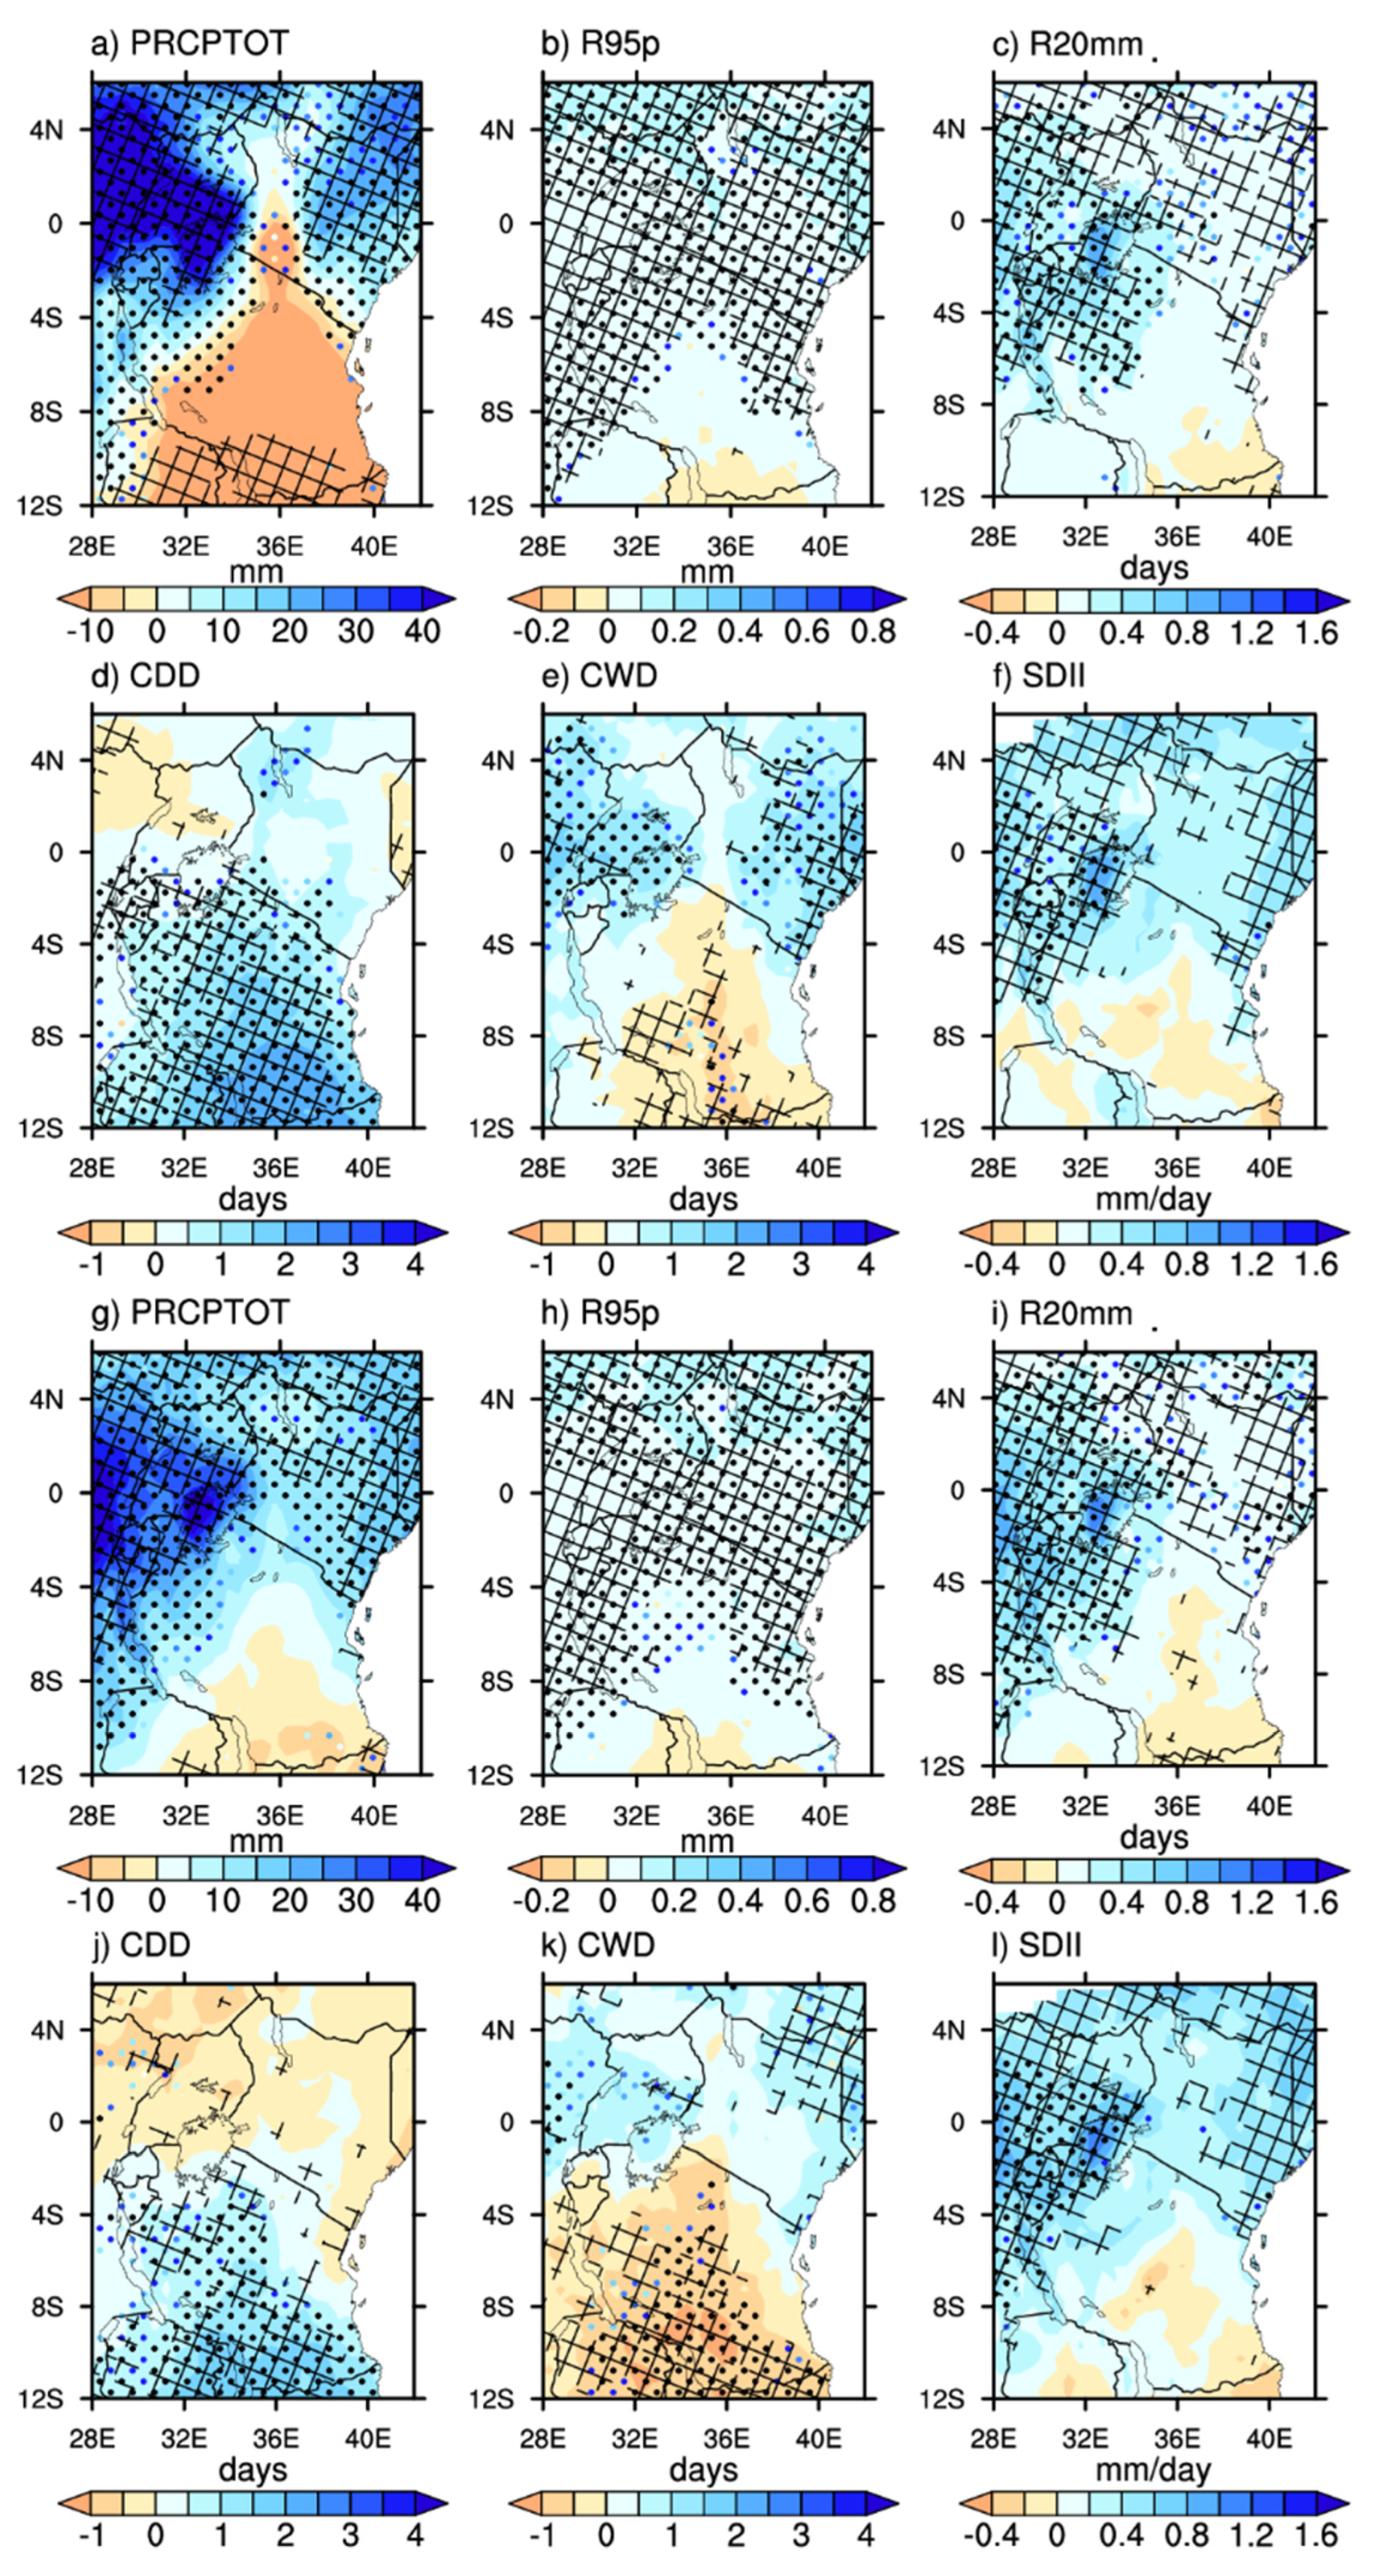
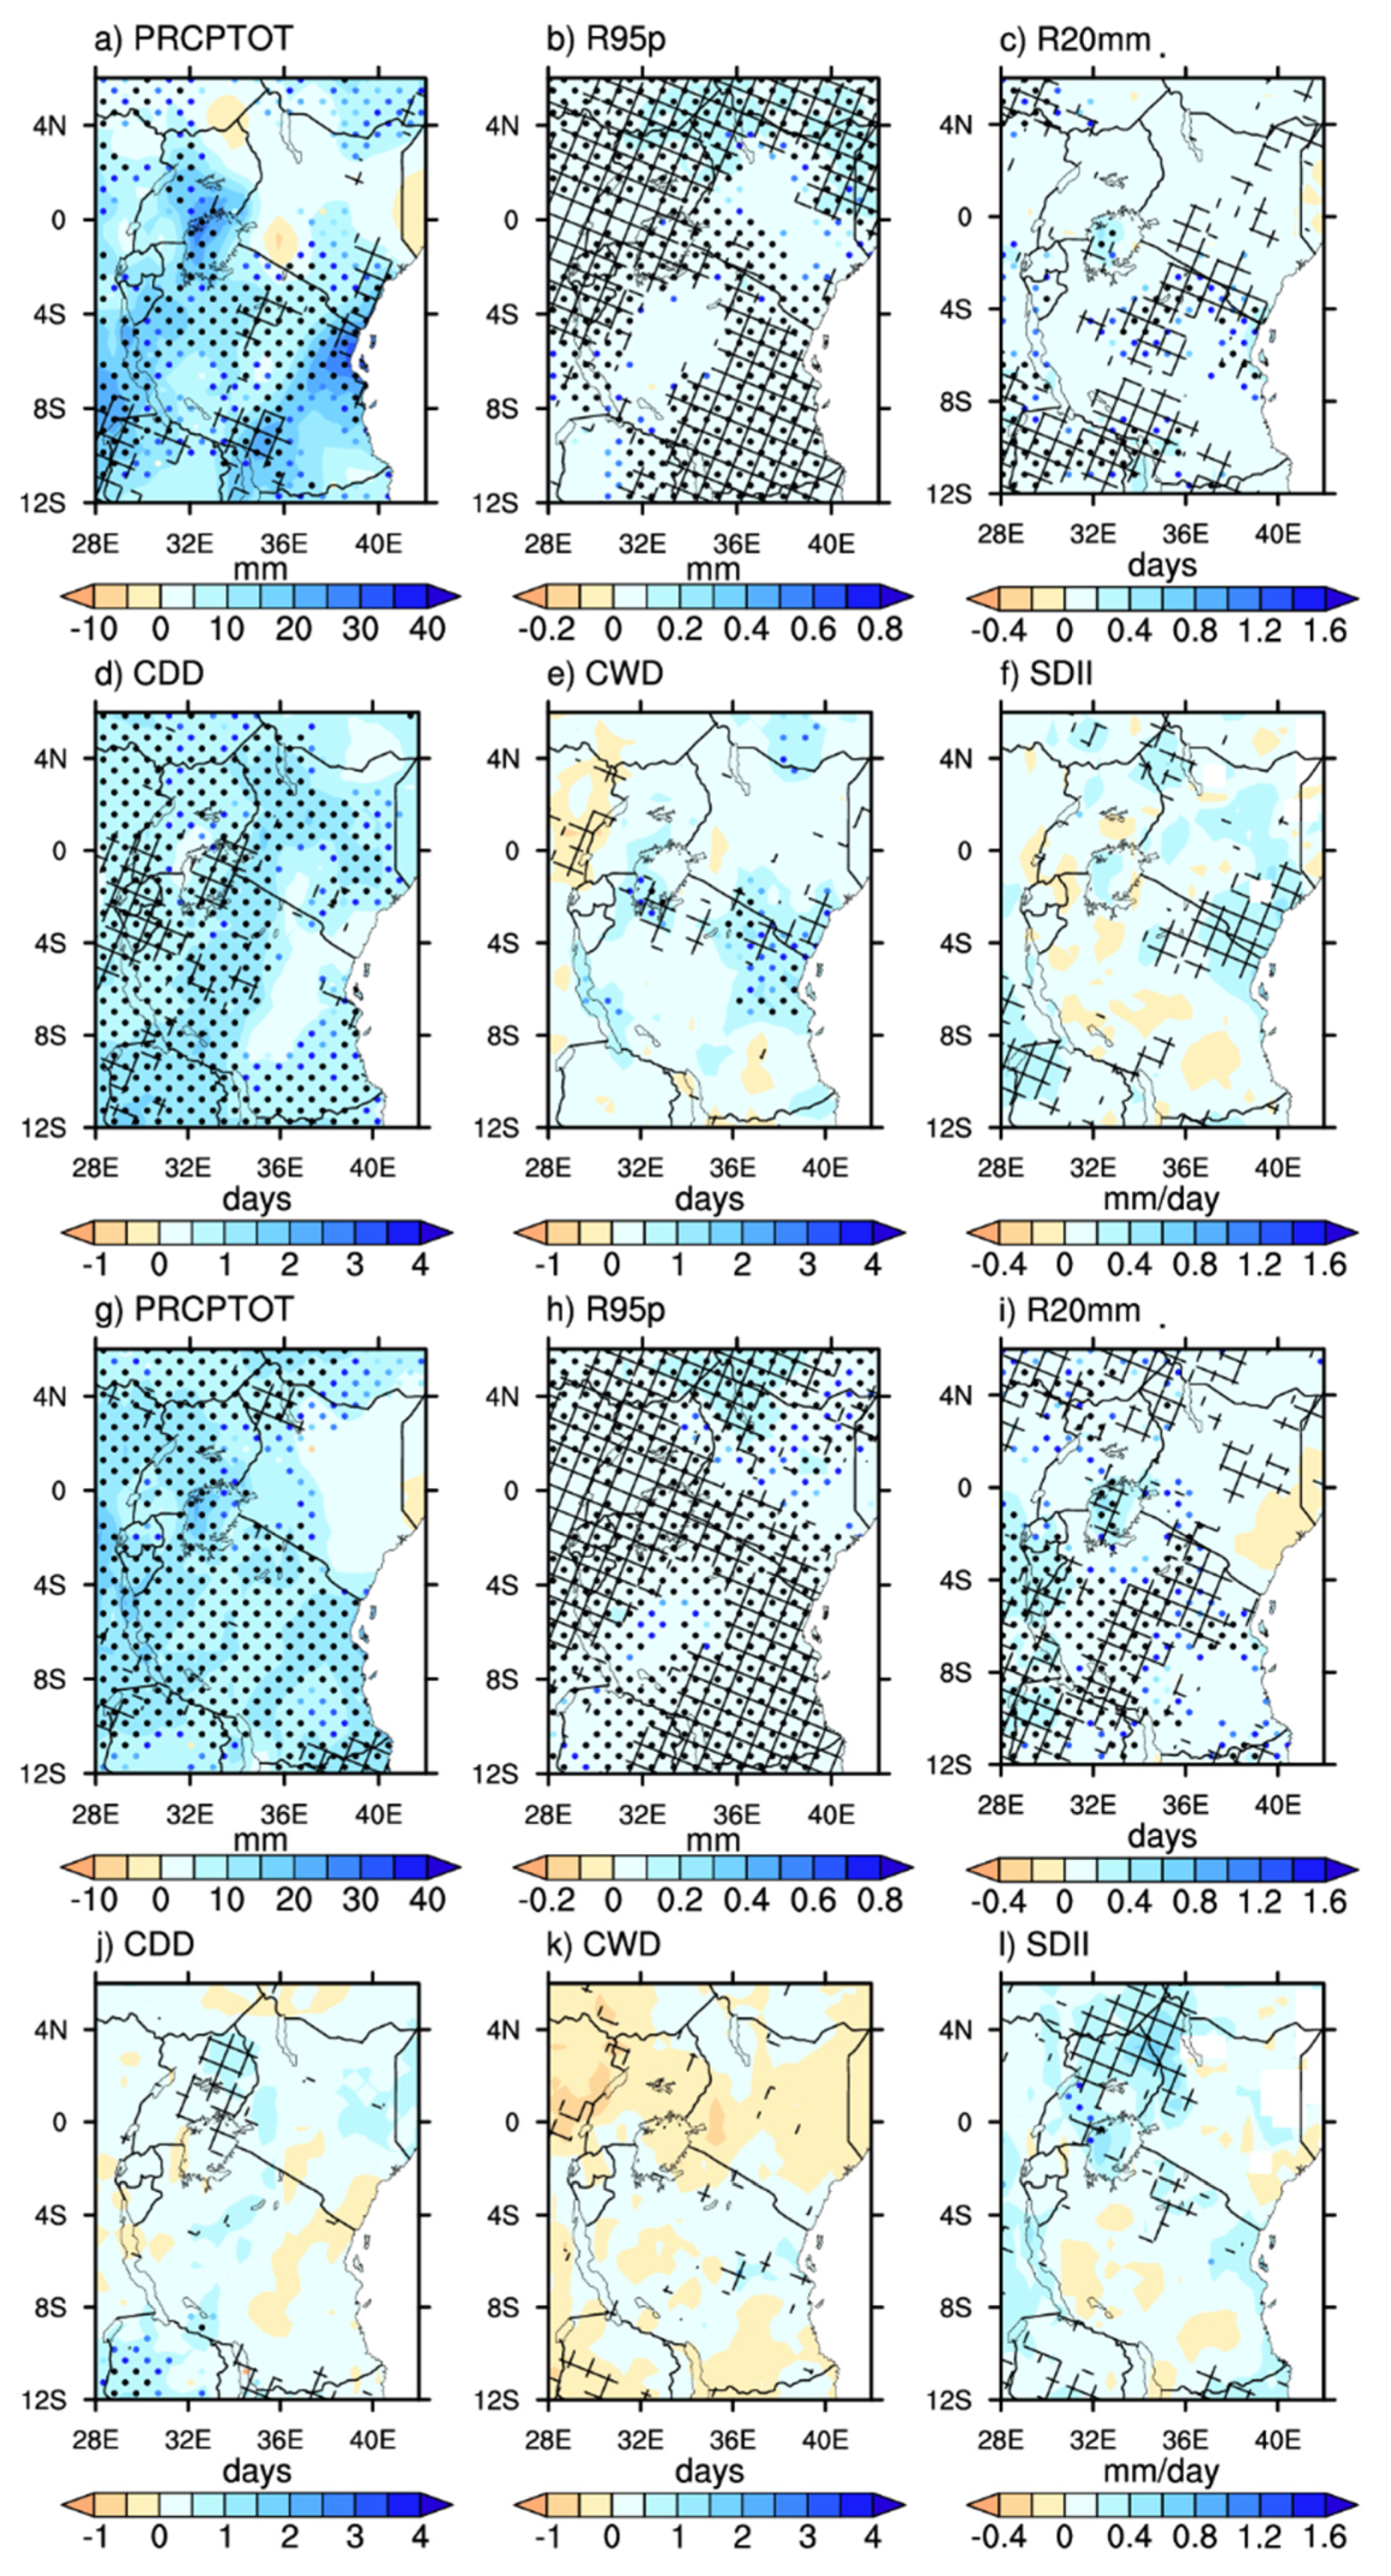
3.2. Future Changes in Short-Rain Season

Recent studies have shown that the EA region is likely to experience a significant increase in precipitation occurrence during the OND season as compared to the MAM season [37,77,78]. Understanding the evolution of extreme events in the wake of the projected increase in precipitation remains a crucial task. This study assessed the changes in extremes during the period 2021–2040 and towards the end of the century 2081–2100 for two scenarios SSP2–4.5 and 5–8.5. Figure 5a–l display the spatial distribution of the projected changes during OND under the two scenarios. The results for extreme indices show no significant change in the two scenarios employed. For instance, projections for PRCPTOT (Figure 5a) display intensification variations along with western Uganda with >40 mm while reduction trends (<−10 mm) are observed over the Tanzania region. Corresponding patterns are detected under SSP5–8.5 scenario (Figure 5g). Regarding the projected changes in R95 p, the MME demonstrates an agreement of 70% in likely changes over the entire EA region with reported changes of about 0.2–0.4 mm, as shown in Figure 5b,h. Notable increasing trends are recorded in CDD (Figure 5d,j) over Kenya while southern parts of Tanzania depict likelihood of a downward trend agreed upon by most models. Likewise, the CWD (Figure 5e,k) projections exhibit tendencies of intense occurrence around Lake Victoria, whereas no significant changes are observed over most parts, except for the southern parts of Tanzania, where a reduction of up to 4 days in a year is projected. The findings of the present study are in harmony with the recent studies that employed large ensemble members from RCMs models outputs to project changes in extreme precipitation over EA region [51,52,53,79]. Studies above noted an increase (decrease) in CDD (CWD) over the study domain, which is mainly associated with the alteration in the Hadley circulations and thermodynamic components such as IOD [61,62,80].
The projections showing probable changes towards the end of the 21st century is presented in Figure 6. The findings show likely deviations in OND precipitation extremes under the SSP2–4.5 scenario. Undoubtedly, the results show an intensification of SDII (0.4 to 0.8), PRCPTOT (20 to 30 mm), and CWD (1 to 3 days) over Kenya and Uganda. At the same time, the sharp decline is anticipated over southern parts of Tanzania (Figure 6f,g,k). Reverse trends are shown in CDD (Figure 6d,j), which indicate a significant drying scenario over Kenya and Uganda, while southern Tanzania exhibits fewer incidences of CDD. The rise in CDD, decline in CWD, and the general increase in SDII may suggest the likelihood of fewer rainy days with heavy rain events. These findings pose a challenge to farming activities and the socio-economic well-being of EA societies whose economy is heavily reliant on small-scale rainfed agriculture production [67,68]. The tendencies of R95 p and R20 mm indices show a remarkable increase in the projected precipitation. The observed rise in both parameters (Figure 6b,h) and (Figure 6c,i) are mainly centered around the inland lake region with values of 0.2–0.4 mm (0.4–1.6 days) for R95 p (R20 mm).
Overall projected changes in OND precipitation extremes averaged over EA are presented in Figure 7. Similar to MAM season, the precipitation indices of PRCPTOT, R20 mm, and SDII are projected to significantly increase under SSP2–4.5 and SSP5–8.5 scenarios during OND (Figure 7a,c,d). By the end of the 21st century, PRCPTOT, R20 mm, and SDII are projected to increase by approximately 20 mm, 0.6 d, and 0.8 d, respectively, under the SSP5–8.5 scenario relative to the baseline period. However, changes in CDD show an increasing trend at the start of the century until 2040, then the reverse is projected to occur until 2080 under SSP5–8.5 (Figure 7d). Unlike in the MAM season case, R95 p and CWD depict minimal variability across the time series under SSP2–4.5 and SSP5–8.5 scenarios (Figure 7b,e). For instance, R95 p shows similar changes of an increase under the two scenarios (Figure 7b). The CWD, on the other hand, shows higher frequency of occurrence during SSP5–8.5 as compared to SSP2–4.5, especially during the mid-century (Figure 7e). The findings of this study denote higher intensity occurrences of extreme events such as R20 mm and SDII as compared to other precipitation indexes. However, CDD shows higher uncertainty in the projections that are represented by the interquartile model spread between SSP2–4.5 and SSP5–8.5 (Figure 7d).

4. Discussions

This study investigates the future changes in seasonal precipitation extremes over the EA region using MME derived from fifteen models′ outputs of CMIP6. The research employed a subset of precipitation indices provided by ETCCDI to assess extreme incidences during two future timelines: near future (2021–2040) and far future (2081–2100). The two main projections utilized are drawn from Tier 1 ScenarioMIP: SSP2–4.5 and SSP5–8.5. Following the recommendations of previous studies (e.g., [57,81,82,83,84,85]), this employs MME of CMIP6 for projection of extreme events over the study area. Many studies have remarked on the robustness of MME as compared to individual models due to cancellation of intermodel biases [59]. Moreover, MME enables clear identification of signals of interest, since averaging the models also averages/spreads the natural variability. In the case of such variability, the members’ spread around the average is due to unforced internal variability [56,59]. Many studies equally remarked on the skillfulness of CMIP6-MME in replicating precipitation extremes as compared to the use of individual models across various domains [13,41,57].
Analysis of extreme estimations shows that the region will have more (less) consecutive dry (wet) days during 2081–2100 relative to the baseline period in both seasons. An increase in CDD indicates enhanced dryness and risk of seasonal droughts. Whereas the region has experienced historical drought events since 1990s that has prevailed recurrently over the years, projection studies show that wetting tendency will reoccur during mid-century (2060s) and later occurrence of drought events. The projected increase in dry events over the study region could be attributed to the increasing greenhouse gases that induce atmospheric warming, which results in rising equivalent potential temperature and specific humidity according to the Clausius–Clapeyron relationship [19,21]. Moreover, SDII, R95 p, R20 mm, and PRCPTOT demonstrate significant increases during OND compared to the MAM. It should be noted that MAM precipitation is crucial due to the fact that many farmers depend on it for crop growing, among many other socioeconomic activities [33,67,68]. Projected changes in PRCPTOT and CWD signifying an increase in mean seasonal precipitation and more wet days will likely be of great benefit to the various sectors that support the economy of the region (Figure 2 and Figure 3). For instance, the projected decline in PRCPTOT over southern parts of Tanzania under SSP2–4.5 scenario will have catastrophic impact on the ecosystem and the livelihoods of people who continue to face the impact of abrupt declines in seasonal precipitation leading to drought episodes since 1990s [32,34,45,46,76]. Meanwhile, R95 p shows large uncertainties over the study area during MAM season as compared to other indices, with larger interquartile model spread exhibited (Figure 4). Nevertheless, projected increase in R95 p indicates an intensification of very wet events such as floods and lake inundation that will significantly occur over Kenya and decline over Tanzania. The increase in R95 p over Kenya is in agreement with previous studies [51,52,53]. This will result in the displacement of communities in Kenya and destruction of properties. Moreover, the projected increase in very wet events will impact the already flooded Rift Valley Lakes such as Lake Naivasha, Baringo, Bogoria, Turkana, and Nakuru that continue to face unprecedented rises in water levels last experienced in 1932. Unless appropriate adaptation and mitigation measures are put in place to minimize loss of lives and destruction of properties, the impact of extreme events during early and mid-century will be catastrophic.
Simultaneously, the OND season shows likely intensification of PRCPTOT, R95 p, and CWD over Uganda and most parts of Kenya, while reduction is observed over the Tanzania region (Figure 5 and Figure 6). Presence of complex topography has considerable influence on the variation of extreme events and impacted regions [66,83]. For instance, the presence of large inland water bodies—i.e., Lake Victoria, which is the largest freshwater lake in Africa and second in the world, covering about 68,000 km2 and bordering three countries, Uganda (45%), Tanzania (49%), and Kenya (6%)—have a significant influence on the incidences of extreme events [84]. Additionally, high elevation areas (i.e., Mt. Kenya (5000 m); Mt. Kilimanjaro (5892 m); Mt. Elgon (4321 m); Mt. Ruwenzori (5109 m)), among others, hugely impact precipitation extremes. Remarkably, the shift in a projected increase in regions of northeastern Kenya, which is predominantly arid and semi-arid (ASAL), presents an excellent opportunity for agricultural activities that have been deprived due to unbearable climatic conditions. The increase in projected extremes during two main rainfall seasons poses a significant threat to the sustainability of societal infrastructure, ecosystem, and environment at large. On the other hand, it is imperative to note that the predominantly ASALs are estimated to experience wet conditions. This will provide a new opportunity for agricultural and other economic activities. The projected drying patterns over the Tanzanian belt call for a new policy formulation and possible mitigation measures to cushion the community from possible impacts of drought events that are likely to ravage the region.
Although the examination of the sources of the uncertainty in projections was out of scope of this study, numerous studies have indicated that internal variability in the model accounts for most sources of uncertainty as compared to scenario or inter-model uncertainty [86]. For instance, a recent study that examined future changes in precipitation extremes across China based on CMIP6 models noted that uncertainty in future projections were mainly sourced from the internal variability, which accounted for more than 50% of the total variance in the indices, except for the CDD [73].
The results from these analyses present an opportunity to understand the emergence of extreme events and the capability of model outputs from CMIP6 in estimating the projected changes. While this study is among the first few studies of its kind to employ the latest GCMs of CMIP6 over the region that is classified as a climate “paradox”, various limitations are noted, influencing the current results. Such limitations include few models employed at the time of the analysis, the limited statistical features used, limited number of indices, and lack of examination of physical mechanisms to aid in better understanding of phenomenon of extreme occurrence. However, the clear characterization of the possible extremes defining the intensity, frequency, and duration remains critical to various stakeholders to better make informed decisions. More studies are necessary to examine the underlying physical features modulating the occurrence of extreme incidences projected for relevant policies, along with the use of bias-corrected models as a way of minimizing inter-model biases.

5. Conclusions

The present study investigated future changes in precipitation extremes over the EA region under two scenarios using the latest GCMs of CMIP6. The results elucidate the latest information on the climate response of EA to the varying emission scenarios of the 21st century. The key findings can be itemized as follows:
  • During the MAM season, significant occurrence of R95 p is projected to occur over the entire domain under SSP2–4.5 and SSP5–8.5, respectively. PRCPTOT is projected to intensify under the SSP5–8.5 scenario compared to the SSP2–4.5 scenario.
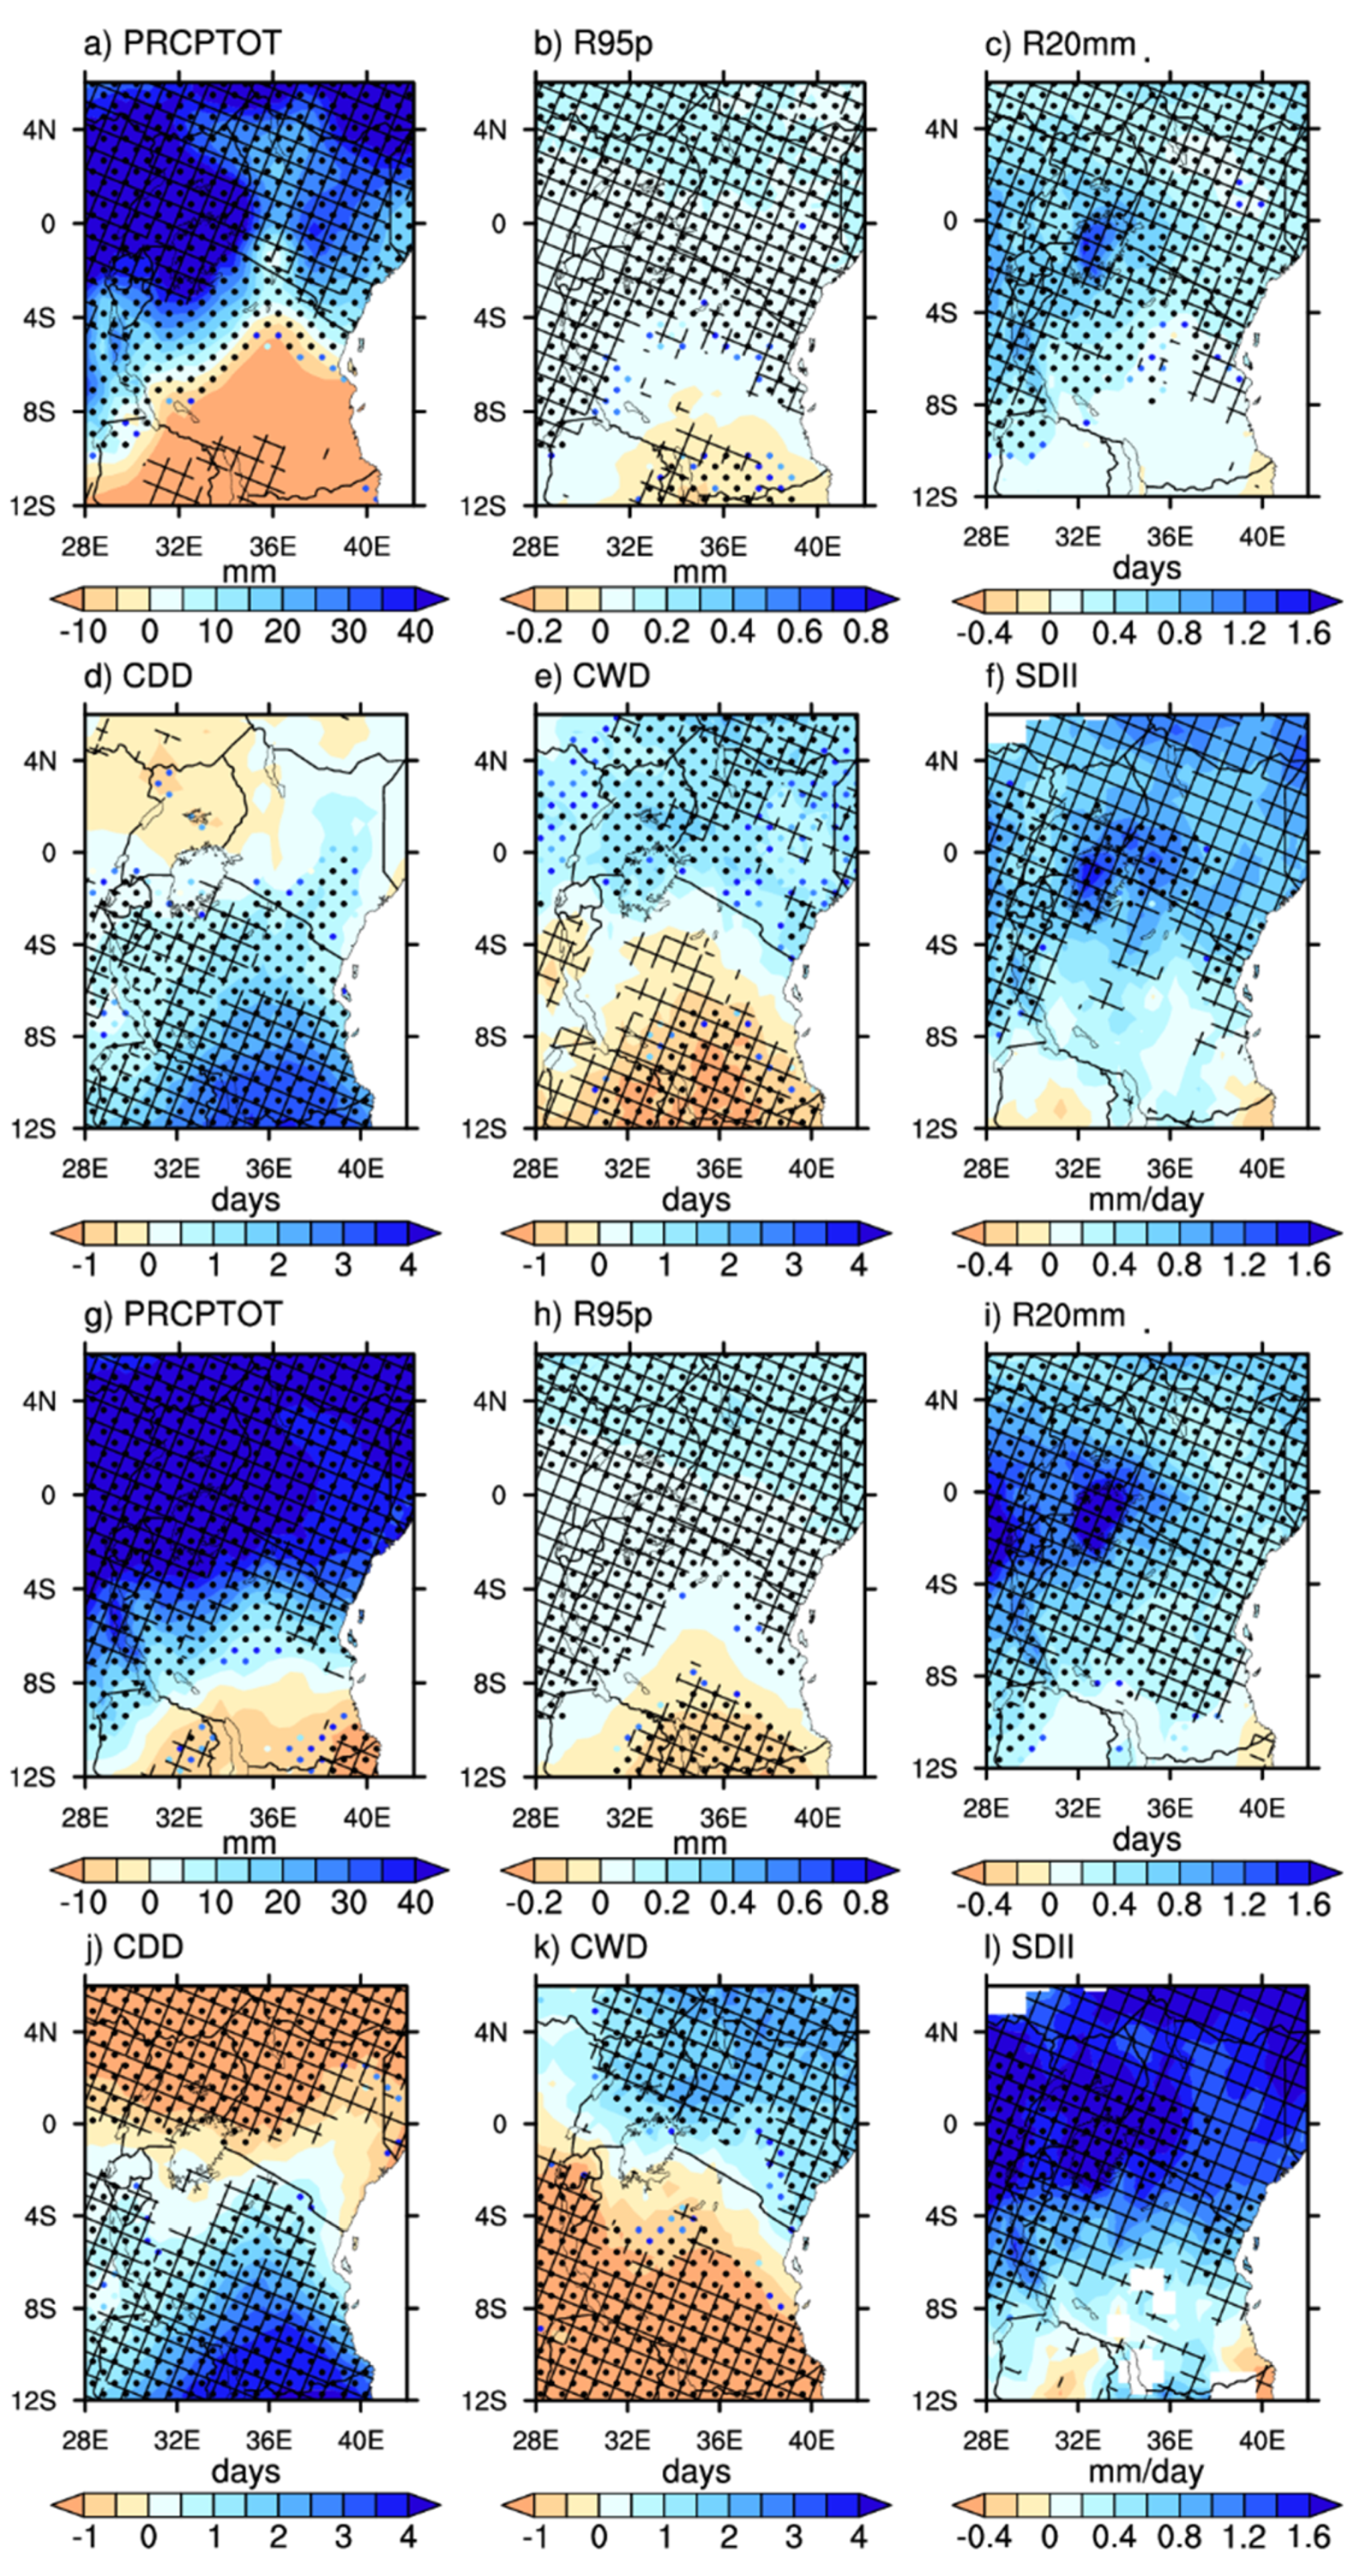
  • Spatial changes in PRCPTOT reveal a downward trend over Kenya and Uganda while a noteworthy increase is noted over the Tanzania region, ranging from 10 mm to 20 mm under the SSP2–4.5 scenario. Meanwhile, the CWD index, CDD, and R20 mm do not show significant changes under the two scenarios in the near future relative to the baseline period.
  • Projected changes towards the end of the century relative to the baseline period for the long-rain season demonstrate continuous drying (wetting) patterns for CDD (CWD) under the two scenarios utilized. The CDD depicts significant drying patterns over Kenya and few areas along with southern parts of Tanzania during the SSP2–4.5 scenarios for 2–3 days and −1 to 0 under SSP5–8.5 scenario. On the other hand, an upward trend is projected for PRCPTOT, R20 mm, and SDII.
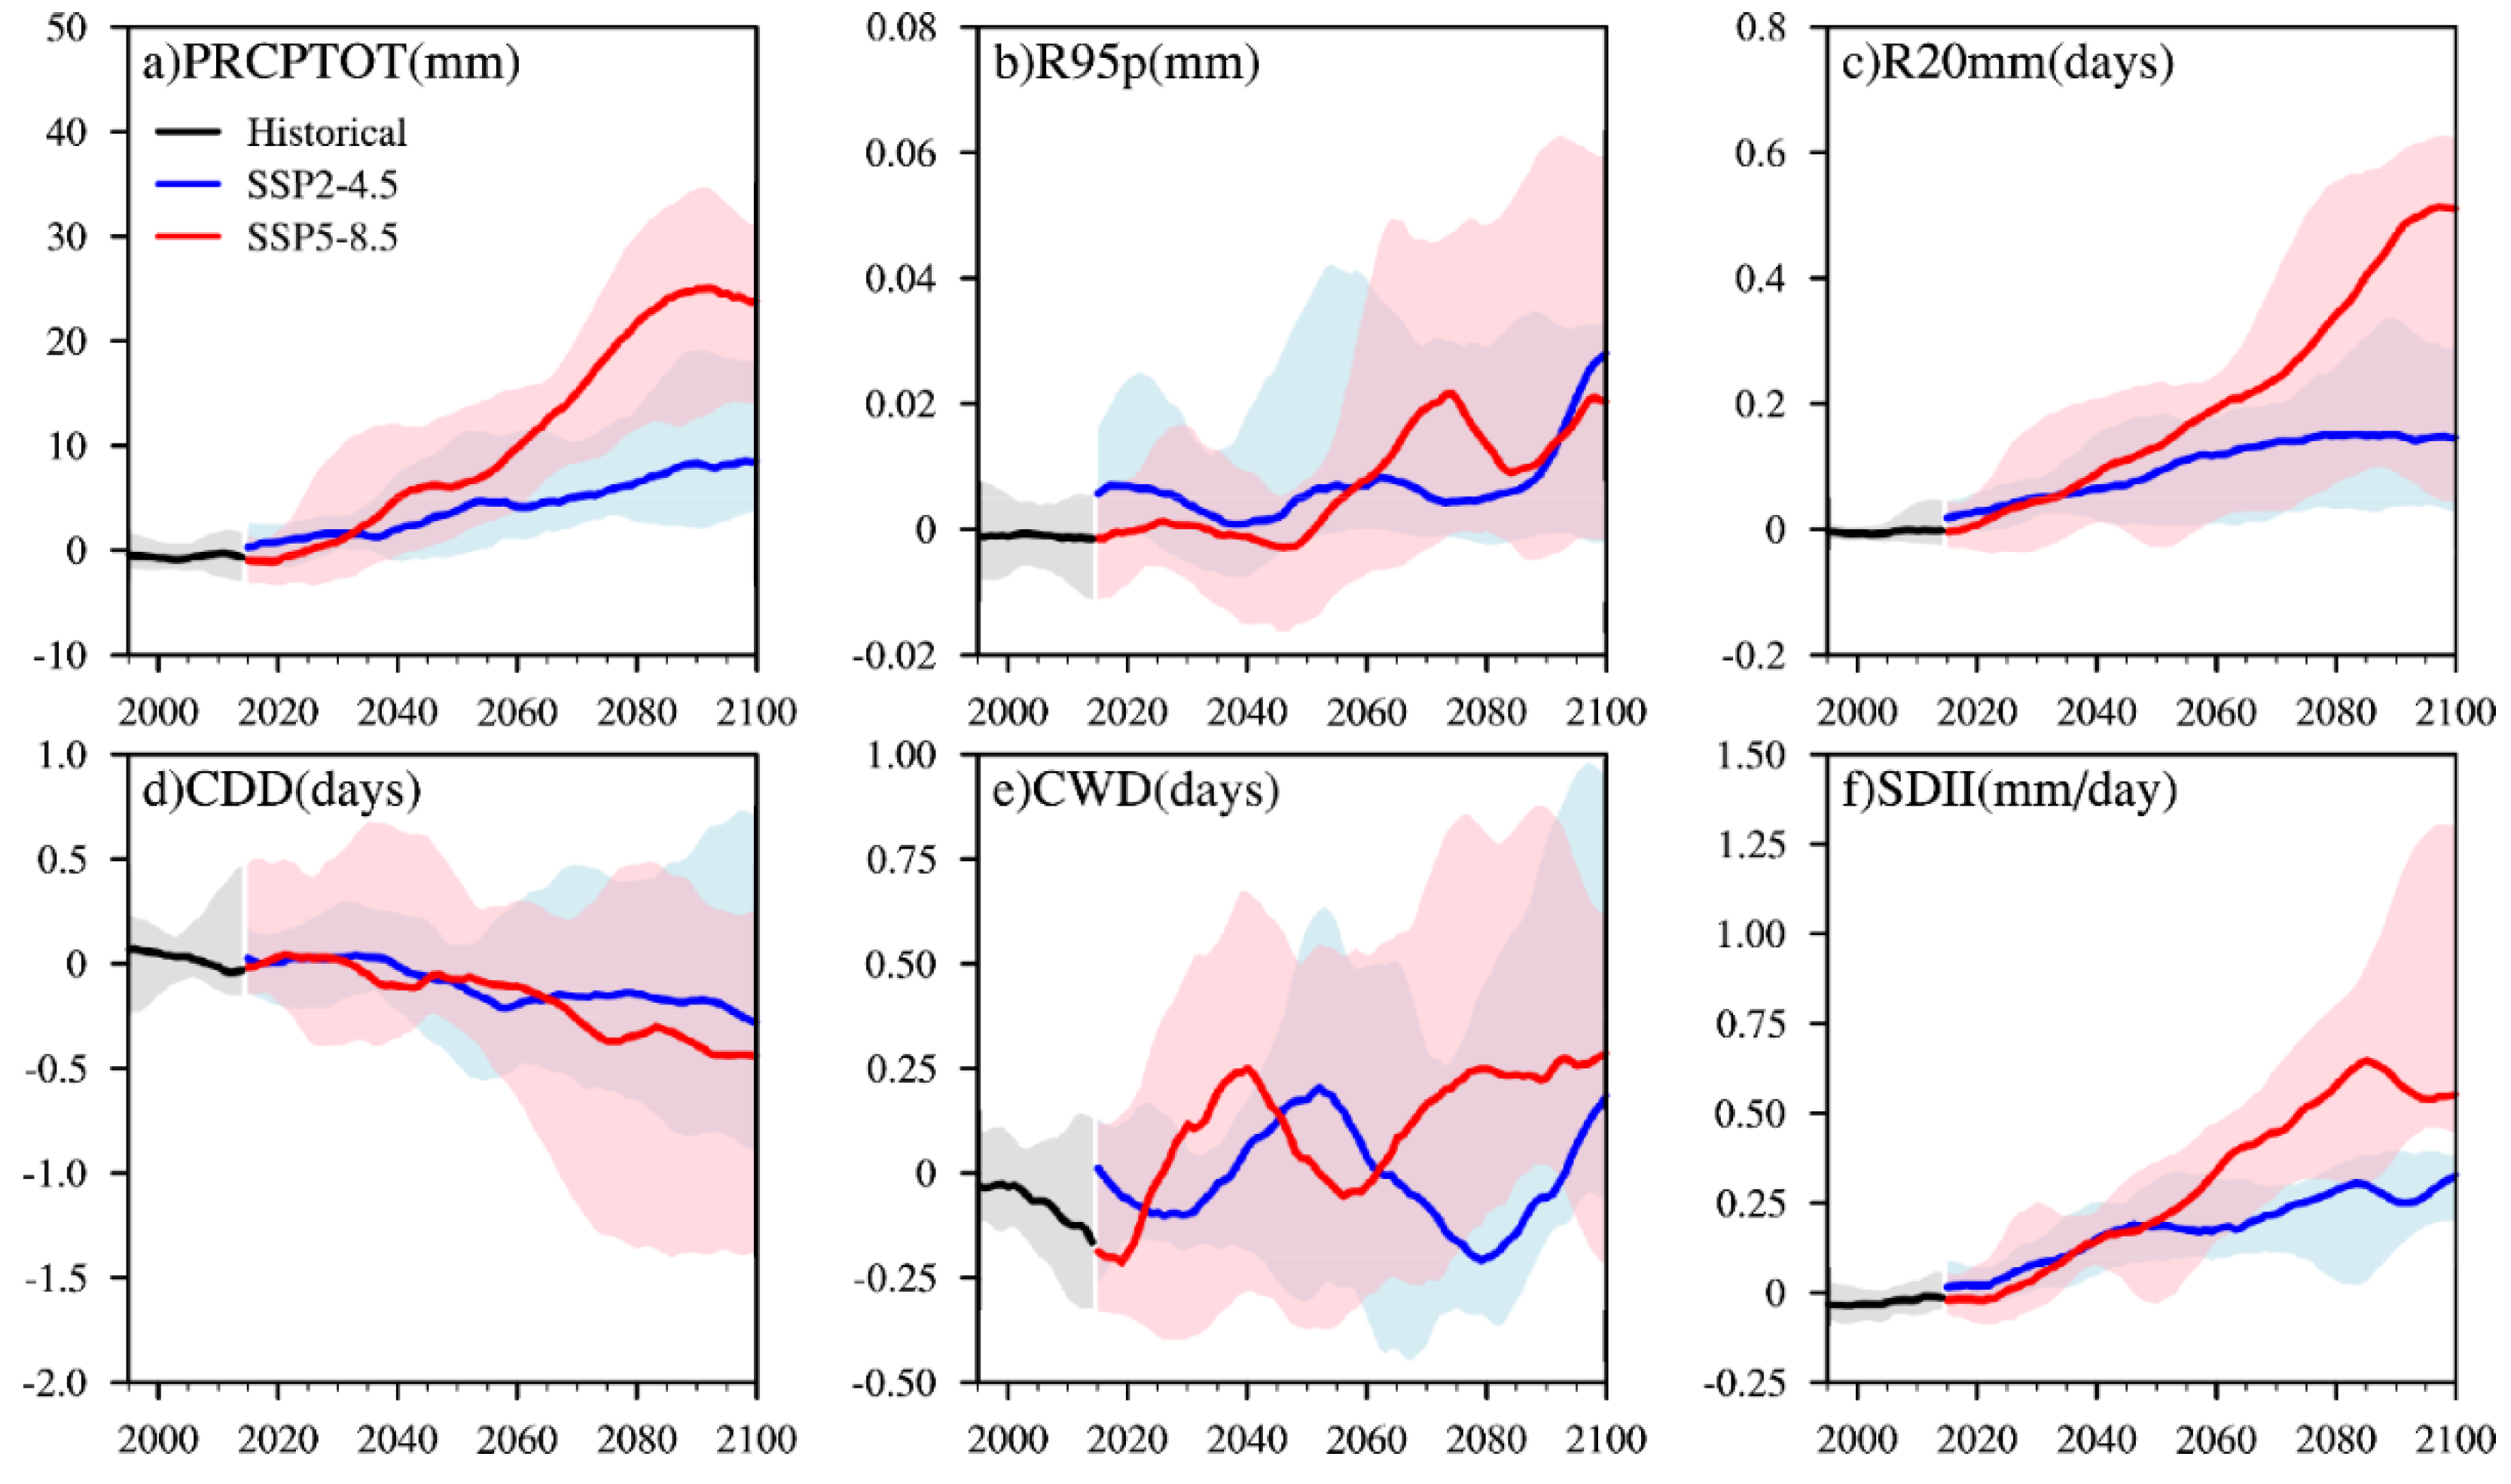
  • Similar to the MAM season, the OND season demonstrates robust changes in precipitation indices of PRCPTOT, R20 mm, and SDII that are projected to significantly increase under the SSP2–4.5 and SSP5–8.5 scenarios. However, changes in CDD show an increasing pattern at the start of the century until 2040, then the reverse is projected to occur until 2080 under the SSP5–8.5 scenario.
  • Unlike in the MAM season case, R95 p and CWD depict minimal variability across the time series under the SSP2–4.5 and SSP5–8.5 scenarios. For instance, R95 p shows similar changes of an increase under the two scenarios. CWD on the other hand show higher frequency of occurrence during SSP5–8.5 as compared to the SSP2–4.5 scenario, especially during the mid-century.
The EA climate is strongly affected by the recent intensification of the Indian Ocean Dipole and changes in the Walker Circulation [79]. Projections studies of precipitation extremes from CMIP3/5 equally depict more intense occurrences of OND precipitation extremes as compared to the MAM season [49,50,51,52,53,54]. Based on the results of the present study, it is imperative that urgent mitigation measures to limit human-induced global warming close to 1.5 °C should be implemented over the next twenty years in order to curb the impending unbearable impacts. Additionally, subsequent research should be conducted to quantify the possible population exposure to the projected precipitation extremes under two scenarios.

Author Contributions

All authors made an equal contribution to the manuscript′s development and consented to the submission for publication in the esteemed journal. Conceptualization, B.A. and V.D.; methodology, V.D.; software, V.D.; validation, V.O., R.M., and H.N.; formal analysis, B.A.; investigation, B.A.; resources, B.A.; data curation, V.D.; writing—original draft preparation, B.A.; writing—review and editing, H.N.; visualization, H.B.; supervision, V.O.; project administration, B.A.; funding acquisition, B.A. All authors have read and agreed to the published version of the manuscript.

Funding

Financial and material support received from National Key Research and Development Program of China, Grant No. 2017YFA0603804.

Institutional Review Board Statement

Not applicable.

Informed Consent Statement

Not applicable.

Data Availability Statement

Data and materials will be made available upon request.

Acknowledgments

The authors acknowledge the World Climate Research Program (WCRP) Working Group on Coupled Models (WGCM) for making the latest outputs from Coupled Model Intercomparison Project (CMIP) phase six. The three anonymous reviewers that worked tirelessly and timely to ensure that the quality of manuscript is improved are highly appreciated. Lead author acknowledge the conducive environment and infrastructural setup for research by Nanjing University of Information Science and Technology (NUIST).

Conflicts of Interest

The authors declare no conflict of interest.

References

  1. Alexander, L.V.; Zhang, X.; Peterson, T.C.; Caesar, J.; Gleason, B.; Tank, A.M.G.K.; Haylock, M.; Collins, D.; Trewin, B.; Rahimzadeh, F.; et al. Global observed changes in daily climate extremes of temperature and precipitation. J. Geophys. Res. Atmos. 2006, 111, D05109. [Google Scholar] [CrossRef] [Green Version]
  2. Sillmann, J.V.; Kharin, V.; Zhang, X.W.; Zwiers, F.; Bronaugh, D. Climate extremes indices in the CMIP5 multimodel ensemble: Part 2. Future climate projections. J. Geophys. Res. Atmos. 2013, 118, 2473–2493. [Google Scholar] [CrossRef]
  3. IPCC. Climate Change 2014: Synthesis Report. Contribution of Working Groups I, II, and III to the Fifth Assessment Report of the In-tergovernmental Panel on Climate Change; Pachauri, R.K., Meyer, L.A., Eds.; IPCC: Geneva, Switzerland, 2014. [Google Scholar]
  4. Alexander, L.V. Global observed long-term changes in temperature and precipitation extremes: A review of progress and limitations in IPCC assessments and beyond. Weather. Clim. Extremes 2016, 11, 4–16. [Google Scholar] [CrossRef] [Green Version]
  5. IPCC. Summary for Policymakers. In Global Warming of 1.5 °C. An IPCC Special Report on the Impacts of Global Warming of 1.5 °C above Pre-Industrial Levels and Related Global Greenhouse Gas Emission Pathways, in the Context of Strengthening the Global Response to the Threat of Climate Change, Sustainable Development, and Efforts to Eradicate Poverty; Masson-Delmotte, V., Zhai, P., Pörtner, H.-O., Roberts, D., Skea, J., Shukla, P.R., Pirani, A., Moufouma-Okia, W., Péan, C., Pidcock, R., et al., Eds.; World Meteorological Organization: Geneva, Switzerland, 2018; Available online: https://www.ipcc.ch/site/assets/uploads/sites/2/2019/05/SR15_SPM_version_report_LR.pdf (accessed on 1 June 2021).
  6. Giorgi, F.; Raffaele, F.; Coppola, E. The response of precipitation characteristics to global warming from climate projections. Earth Syst. Dyn. 2019, 10, 73–89. [Google Scholar] [CrossRef] [Green Version]
  7. AghaKouchak, A.; Chiang, F.; Huning, L.S.; Love, C.A.; Mallakpour, I.; Mazdiyasni, O.; Moftakhari, H.; Papalexiou, S.M.; Ragno, E.; Sadegh, M. Climate Extremes and Compound Hazards in a Warming World. Annu. Rev. Earth Planet. Sci. 2020, 48, 519–548. [Google Scholar] [CrossRef] [Green Version]
  8. Fischer, E.M.; Knutti, R. Anthropogenic contribution to global occurrence of heavy-precipitation and high-temperature extremes. Nat. Clim. Chang. 2015, 5, 560–564. [Google Scholar] [CrossRef]
  9. Papalexiou, S.M.; Montanari, A. Global and Regional Increase of Precipitation Extremes under Global Warming. Water Resour. Res. 2019, 55, 4901–4914. [Google Scholar] [CrossRef]
  10. Jiang, Z.; Song, J.; Li, L.; Chen, W.; Wang, Z.; Wang, J. Extreme climate events in China: IPCC-AR4 model evaluation and projection. Clim. Chang. 2011, 110, 385–401. [Google Scholar] [CrossRef]
  11. Yuan, Z.; Yang, Z.; Yan, D.; Yin, J. Historical changes and future projection of extreme precipitation in China. Theor. Appl. Clim. 2015, 127, 393–407. [Google Scholar] [CrossRef]
  12. Chen, H.; Sun, J. Projected changes in climate extremes in China in a 1.5 °C warmer world. Int. J. Clim. 2018, 38, 3607–3617. [Google Scholar] [CrossRef]
  13. Zhu, H.; Jiang, Z.; Li, J.; Li, W.; Sun, C.; Li, L. Does CMIP6 Inspire More Confidence in Simulating Climate Extremes over China? Adv. Atmospheric Sci. 2020, 37, 1119–1132. [Google Scholar] [CrossRef]
  14. Janssen, E.; Wuebbles, D.J.; Kunkel, K.; Olsen, S.C.; Goodman, A. Observational- and model-based trends and projections of extreme precipitation over the contiguous United States. Earth’s Future 2014, 2, 99–113. [Google Scholar] [CrossRef]
  15. Kunkel, K.E.; Bromirski, P.D.; Brooks, H.E.; Cavazos, T.; Douglas, A.V.; Easterling, D.R.; Emanuel, K.A.; Groisman, P.Y.; Holland, G.J.; Knutson, T.R.; et al. Observed changes in weather and climate extremes. In Weather and Climate Extremes in a Changing Climate: Regions of Focus: North America, Hawaii, Caribbean, and U.S. Pacific Islands; Karl, T.R., Meehl, G.A., Miller, C.D., Hassol, S.J., Waple, A.M., Murray, W.L., Eds.; Synthesis and Assessment Product 3.U.S. Climate Change Science Program: Washington, DC, USA, 2008; pp. 35–80. [Google Scholar]
  16. Akinsanola, A.A.; Zhou, W. Projections of West African summer monsoon rainfall extremes from two CORDEX models. Clim. Dyn. 2019, 52, 2017–2028. [Google Scholar] [CrossRef]
  17. Myhre, G.; Alterskjær, K.; Stjern, C.W.; Hodnebrog, Ø.; Marelle, L.; Samset, B.H.; Sillmann, J.; Schaller, N.; Fischer, E.; Schulz, M.; et al. Frequency of extreme precipitation increases extensively with event rareness under global warming. Sci. Rep. 2019, 9, 16063. [Google Scholar] [CrossRef] [Green Version]
  18. Kunkel, K.E.; Andsher, K.; Easterling, D.R. Long-Term in Extreme Precipitation Events over the Conterminous United States and Canada. J. Climate. 1999, 12, 2515–2527. [Google Scholar] [CrossRef] [Green Version]
  19. Ferguson, J. Maternal microbial molecules affect offspring health. Science 2020, 367, 978–979. [Google Scholar] [CrossRef]
  20. Niang, I.; Ruppel, O.C.; Abdrabo, M.A.; Essel, A.; Lennard, C.; Padgham, J.; Urquhart, P. Africa. In Climate Change 2014: Impacts, Adaptation, and Vulnerability. Part B: Regional Aspects. Contribution of Working Group II to the Fifth As-sessment Report of the Intergovernmental Panel on Climate Change; Barros, V.R., Field, C.B., Dokken, D.J., Mastrandrea, M.D., Mach, K.J., Bilir, T.E., Chatterjee, M., Ebi, K.L., Estrada, Y.O., Genova, R.C., et al., Eds.; Cambridge University Press: Cambridge, UK; New York, NY, USA, 2014; pp. 1199–1265. [Google Scholar]
  21. Trenberth, K. Changes in precipitation with climate change. Clim. Res. 2011, 47, 123–138. [Google Scholar] [CrossRef] [Green Version]
  22. Aguilar, E.; Barry, A.A.; Brunet, M.; Ekang, A.; Fernandes, A.; Massoukina, M.; Mbah, J.; Mhanda, D.; Nascimento, J.; Peter-son, T.C.; et al. Changes in temperature and precipitation extremes in western central Af-rica, Guinea Conakry, and Zimbabwe, 1955–2006. J. Geophys. Res. Atmos. 2009, 114, D02115. [Google Scholar] [CrossRef]
  23. Shongwe, M.E.; Van Oldenborgh, G.J.; van den Hurk, B.; Van Aalst, M. Projected Changes in Mean and Extreme Precipitation in Africa under Global Warming. Part II: East Africa. J. Clim. 2011, 24, 3718–3733. [Google Scholar] [CrossRef] [Green Version]
  24. Omondi, P.A.; Awange, J.L.; Forootan, E.; Ogallo, L.A.; Barakiza, R.; Girmaw, G.B.; Fesseha, I.; Kululetera, V.; Kilembe, C.; Mbati, M.M.; et al. Changes in temperature and precipitation extremes over the Greater Horn of Africa region from 1961 to 2010. Int. J. Clim. 2014, 34, 1262–1277. [Google Scholar] [CrossRef]
  25. Taylor, C.; Belušić, D.; Guichard, F.; Parker, D.; Vischel, T.; Bock, O.; Harris, P.; Janicot, S.; Klein, C.; Panthou, G. Frequency of extreme Sahelian storms tripled since 1982 in satellite observations. Nat. Cell Biol. 2017, 544, 475–478. [Google Scholar] [CrossRef] [Green Version]
  26. Donat, M.G.; Alexander, L.; Yang, H.; Durre, I.; Vose, R.; Dunn, R.; Willett, K.M.; Aguilar, E.; Brunet, M.; Caesar, J.; et al. Updated analyses of temperature and precipitation extreme indices since the beginning of the twentieth century: The HadEX2 dataset. J. Geophys. Res. 2013, 118, 2098–2118. [Google Scholar] [CrossRef]
  27. Collins, M.; Knutti, R.; Arblaster, J.; Dufresne, J.-L.; Fichefet, T.; Friedlingstein, P.; Gao, X.; Gutowski, W.J.; Johns, T.; Krinner, G.; et al. Long-term climate change: Projections, commitments and irreversibility. Available online: https://www.ipcc.ch/site/assets/uploads/2018/02/WG1AR5_Chapter12_FINAL.pdf (accessed on 22 August 2021).
  28. Seneviratne, S.I.; Nicholls, N.; Easterling, D.; Goodess, C.M.; Kanae, S.; Kossin, J.; Luo, Y.; Marengo, J.; McInnes, K.; Rahimi, M.; et al. Changes in climate extremes and their impacts on the natural physical environment. In Managing the Risks of Extreme Events and Disasters to Advance Climate Change Adaptation. A Special Report of Working Groups I and II of the Intergovernmental Panel on Climate Change (IPCC); Field, C.B., Barros, V., Stocker, T.F., Qin, D., Dokken, D.J., Ebi, K.L., Mastrandrea, M.D., Mach, K.J., Plattner, G.K., Allen, et al., Eds.; Cambridge University Press: Cambridge, UK; New York, NY, USA, 2012; pp. 109–230. [Google Scholar]
  29. Ongoma, V.; Chen, H.; Omony, G.W. Variability of extreme weather events over the equatorial East Africa, a case study of rainfall in Kenya and Uganda. Theor. Appl. Clim. 2018, 131, 295–308. [Google Scholar] [CrossRef]
  30. Iyakaremye, V.; Zeng, G.; Siebert, A.; Yang, Y. Contribution of external forcings to the observed trend in surface temperature over Africa during 1901–2014 and its future projection from CMIP6 simulations. Atmospheric Res. 2021, 254, 105512. [Google Scholar] [CrossRef]
  31. Iyakaremye, V.; Zeng, G.; Yang, X.; Zhang, G.; Ullah, I.; Gahigi, A.; Vuguziga, F.; Asfaw, T.G.; Ayugi, B. Increased high-temperature extremes and associated population exposure in Africa by the mid-21st century. Sci. Total. Environ. 2021, 790, 148162. [Google Scholar] [CrossRef]
  32. Ayugi, B.; Ngoma, H.; Babaousmail, H.; Karim, R.; Iyakaremye, V.; Lim Kam Sian, K.T.C.; Ongoma, V. Evaluation and projection of mean surface temperature using CMIP6 models over East Africa. J. Afr. Earth Sci. 2021, 181, 104226. [Google Scholar] [CrossRef]
  33. FAO. The state of Food Security and Nutrition in the World. In Safeguarding against Economic Slowdowns and Downturns; FAO: Rome, Italy, 2019. [Google Scholar]
  34. Peterson, T.C.; Stott, P.; Herring, S. Explaining Extreme Events of 2011 from a Climate Perspective. Bull. Am. Meteorol. Soc. 2012, 93, 1041–1067. [Google Scholar] [CrossRef] [Green Version]
  35. Van Loon, A.F.; Stahl, K.; Di Baldassarre, G.; Clark, J.; Rangecroft, S.; Wanders, N.; Gleeson, T.; Van Dijk, A.I.J.M.; Tallaksen, L.M.; Hannaford, J.; et al. Drought in a human-modified world: Reframing drought definitions, understanding, and analysis approaches. Hydrol. Earth Syst. Sci. 2016, 20, 3631–3650. [Google Scholar] [CrossRef] [Green Version]
  36. Ayugi, B.; Tan, G.; Gnitou, G.T.; Ojara, M.; Ongoma, V. Historical evaluations and simulations of precipitation over Eastern Africa from Rossby Centre Regional Climate Model. Atmos. Res. 2020, 232. [Google Scholar] [CrossRef]
  37. Tan, G.; Ayugi, B.; Ngoma, H.; Ongoma, V. Projections of future meteorological drought events under representative concentration pathways (RCPs) of CMIP5 over Kenya, East Africa. Atmospheric Res. 2020, 246, 105112. [Google Scholar] [CrossRef]
  38. IPCC. Available online: https://www.ipcc.ch/report/ar5/wg1/ (accessed on 22 August 2021).
  39. Taylor, K.E.; Stouffer, R.J.; Meehl, G.A. An Overview of CMIP5 and the Experiment Design. Bull. Am. Meteorol. Soc. 2012, 93, 485–498. [Google Scholar] [CrossRef] [Green Version]
  40. Zhang, X.; Alexander, L.; Hegerl, G.; Jones, P.; Tank, A.K.; Peterson, T.C.; Trewin, B.; Zwiers, F.W. Indices for monitoring changes in extremes based on daily temperature and precipitation data. Wiley Interdiscip. Rev. Clim. Chang. 2011, 2, 851–870. [Google Scholar] [CrossRef]
  41. Jiang, Z.; Li, W.; Xu, J.; Li, L. Extreme Precipitation Indices over China in CMIP5 Models. Part I: Model Evaluation. J. Clim. 2015, 28, 8603–8619. [Google Scholar] [CrossRef]
  42. Fischer, E.M.; Sipel, S.; Knutti, R. Increasing probability of record-shattering climate extremes. Nat. Clim. Chang. 2021, 11, 689–695. [Google Scholar] [CrossRef]
  43. Weber, T.; Haensler, A.; Rechid, D.; Pfeifer, S.; Eggert, B.; Jacob, D. Analyzing Regional Climate Change in Africa in a 1.5, 2, and 3 °C Global Warming World. Earth’s Future 2018, 6, 643–655. [Google Scholar] [CrossRef]
  44. Kharin, V.V.; Flato, G.M.; Zhang, X.; Gillett, N.P.; Zwiers, F.; Anderson, K.J. Risks from Climate Extremes Change Differently from 1.5 °C to 2.0 °C Depending on Rarity. Earth’s Future 2018, 6, 704–715. [Google Scholar] [CrossRef]
  45. Viste, E.; Korecha, D.; Sorteberg, A. Recent drought and precipitation tendencies in Ethiopia. Theor. Appl. Clim. 2013, 112, 535–551. [Google Scholar] [CrossRef] [Green Version]
  46. Liebmann, B.; Hoerling, M.P.; Funk, C.; Bladé, I.; Dole, R.M.; Allured, D.; Quan, X.; Pegion, P.; Eischeid, J.K. Understanding Recent Eastern Horn of Africa Rainfall Variability and Change. J. Clim. 2014, 27, 8630–8645. [Google Scholar] [CrossRef]
  47. Kilavi, M.; MacLeod, D.; Ambani, M.; Robbins, J.; Dankers, R.; Graham, R.; Helen, T.; Salih, A.A.M.; Todd, M.C. Extreme Rainfall and Flooding over Central Kenya Including Nairobi City during the Long-Rains Season 2018: Causes, Predictability, and Potential for Early Warning and Actions. Atmosphere 2018, 9, 472. [Google Scholar] [CrossRef] [Green Version]
  48. Ongoma, V.; Chen, H.; Gao, C. Projected changes in mean rainfall and temperature over East Africa based on CMIP5 models. Int. J. Clim. 2017, 38, 1375–1392. [Google Scholar] [CrossRef]
  49. Ongoma, V.; Chen, H.; Gao, C.; Nyongesa, A.M.; Polong, F. Future changes in climate extremes over Equatorial East Africa based on CMIP5 multimodel ensemble. Nat. Hazards 2017, 90, 901–920. [Google Scholar] [CrossRef]
  50. Gebrechorkos, S.H.; Hülsmann, S.; Bernhofer, C. Evaluation of Multiple Climate Data Sources for Managing Environmental Resources in East Africa. Hydro. Earth Syst. Sci. 2017, 22, 4547–4564. [Google Scholar] [CrossRef] [Green Version]
  51. Osima, S.; Indasi, V.S.; Zaroug, M.; Endris, H.S.; Gudoshava, M.; Misiani, H.O.; Dosio, A. Projected Climate over Greater Horn of Africa under 1.5 °C and 2 °C global warming. Environ. Res. Lett. 2018, 13, 6. [Google Scholar] [CrossRef]
  52. Onyutha, C. Analyses of rainfall extremes in East Africa based on observations from rain gauges and climate change simulations by CORDEX RCMs. Clim. Dyn. 2020, 54, 4841–4864. [Google Scholar] [CrossRef]
  53. Ogega, O.M.; Koske, J.; Kung’U, J.B.; Scoccimarro, E.; Endris, H.S.; Mistry, M.N. Heavy precipitation events over East Africa in a changing climate: Results from CORDEX RCMs. Clim. Dyn. 2020, 55, 993–1009. [Google Scholar] [CrossRef]
  54. Tegegne, G.; Melesse, A.M.; Alamirew, T. Projected changes in extreme precipitation indices from CORDEX simulations over Ethiopia, East Africa. Atmospheric Res. 2021, 247, 105156. [Google Scholar] [CrossRef]
  55. Klein Tank, A.M.G.; Zwiers, F.W.; Zhang, X. Guidelines on analysis of extremes in a changing climate in support of informed decisions for adaptation. In Climate Data and Monitoring WCDMP-No. 72; Royal Netherlands Meteorological Institute: Niagara-on-the-Lake, Canada, 2009; Volume 1500, p. 56. [Google Scholar]
  56. Eyring, V.; Bony, S.; Meehl, G.A.; Senior, C.A.; Stevens, B.; Stouffer, R.J.; Taylor, K.E. Overview of the Coupled Model Intercomparison Project Phase 6 (CMIP6) experimental design and organization. Geosci. Model Dev. 2016, 9, 1937–1958. [Google Scholar] [CrossRef] [Green Version]
  57. Akinsanola, A.A.; Ongoma, V.; Kooperman, G.J. Evaluation of CMIP6 models in simulating the statistics of extreme precipitation over Eastern Africa. Atmospheric Res. 2021, 254, 105509. [Google Scholar] [CrossRef]
  58. Ayugi, B.; Jiang, V.; Zhu, H.; Ngoma, H.; Babaousmail, H.; Karim, R. Comparison of CMIP6 and CMIP5 models in simulating mean and extreme precipitation over East Africa. Int. J. Clim. 2021. [Google Scholar] [CrossRef]
  59. O’Neill, B.C.; Kriegler, E.; Ebi, K.L.; Kemp-Benedict, E.; Riahi, K.; Rothman, D.S.; van Ruijven, B.; van Vuuren, D.; Birkmann, J.; Kok, K.; et al. The roads ahead: Narratives for shared socioeconomic pathways describing world futures in the 21st century. Glob. Environ. Chang. 2017, 42, 169–180. [Google Scholar] [CrossRef] [Green Version]
  60. Ongoma, V.; Chen, H. Temporal and spatial variability of temperature and precipitation over East Africa from 1951 to 2010. Theor. Appl. Clim. 2017, 129, 131–144. [Google Scholar] [CrossRef]
  61. Hastenrath, S.; Polzin, D.; Mutai, C. Circulation Mechanisms of Kenya Rainfall Anomalies. J. Clim. 2011, 24, 404–412. [Google Scholar] [CrossRef]
  62. Endris, H.S.; Lennard, C.; Hewitson, B.; Dosio, A.; Nikulin, G.; Panitz, H.-J. Teleconnection responses in multi-GCM driven CORDEX RCMs over Eastern Africa. Clim. Dyn. 2016, 46, 2821–2846. [Google Scholar] [CrossRef]
  63. Yang, W.; Seager, R.; Cane, M.A.; Lyon, B. The East African Long Rains in Observations and Models. J. Clim. 2014, 27, 7185–7202. [Google Scholar] [CrossRef]
  64. Lyon, B.; DeWitt, D.G. A recent and abrupt decline in the East African long rains. Geophys. Res. Lett. 2012, 39, 02702. [Google Scholar] [CrossRef] [Green Version]
  65. Nicholson, S.E. Climate and climatic variability of rainfall over eastern Africa. Rev. Geophys. 2017, 55, 590–635. [Google Scholar] [CrossRef] [Green Version]
  66. Camberlin, P. Climate of Eastern Africa. In Oxford Research Encyclopedia of Climate Science; Oxford University Press (OUP): New York, NY, USA, 2018; Volume 1. [Google Scholar]
  67. Adhikari, U.; Nejadhashemi, A.P.; Woznicki, S.A. Climate change and eastern Africa: A review of impact on major crops. Food Energy Secur. 2015, 4, 110–132. [Google Scholar] [CrossRef]
  68. Mumo, L.; Yu, J.; Fang, K. Assessing Impacts of Seasonal Climate Variability on Maize Yield in Kenya. Int. J. Plant Prod. 2018, 12, 297–307. [Google Scholar] [CrossRef]
  69. Dike, V.; Lin, Z.-H.; Ibe, C. Intensification of Summer Rainfall Extremes over Nigeria during Recent Decades. Atmosphere 2020, 11, 1084. [Google Scholar] [CrossRef]
  70. Dosio, A.; Jury, M.W.; Almazroui, M.; Ashfaq, M.; Diallo, I.; Engelbrecht, F.A.; Klutse, N.A.B.; Lennard, C.; Pinto, I.; Sylla, M.B.; et al. Projected future daily characteristics of African precipitation based on global (CMIP5, CMIP6) and regional (CORDEX, CORDEX-CORE) climate models. Clim. Dyn. 2021, 1–24. [Google Scholar] [CrossRef]
  71. Mafuru, B.K.; Tan, G. The influence of ENSO on the upper warm temperature anomaly formation associated with the March–May heavy rainfall events in Tanzania. Int. J. Clim. 2020, 40, 2745–2763. [Google Scholar] [CrossRef] [Green Version]
  72. Maidment, R.I.; Allan, R.; Black, E. Recent observed and simulated changes in precipitation over Africa. Geophys. Res. Lett. 2015, 42, 8155–8164. [Google Scholar] [CrossRef]
  73. Xu, H.; Chen, H.; Wang, H. Future changes in precipitation extremes across China based on CMIP6 models. Int. J. Clim. 2021. [Google Scholar] [CrossRef]
  74. Gu, G.; Adler, R.F. Interdecadal variability/long-term changes in global precipitation patterns during the past three decades: Global warming and/or pacific decadal variability? Clim. Dyn. 2013, 40, 3009–3022. [Google Scholar] [CrossRef]
  75. Dai, A. Future Warming Patterns Linked to Today’s Climate Variability. Sci. Rep. 2016, 6, 6–11. [Google Scholar] [CrossRef] [Green Version]
  76. Hua, W.; Zhou, L.; Chen, H.; Nicholson, S.E.; Raghavendra, A.; Jiang, Y. Possible causes of the Central Equatorial Af-rican long-term drought. Environ. Res. Lett. 2016, 11, 124002. [Google Scholar] [CrossRef]
  77. Ongoma, V.; Chen, H.; Gao, C. Evaluation of CMIP5 twentieth century rainfall simulation over the equatorial East Africa. Theor. Appl. Clim. 2019, 135, 893–910. [Google Scholar] [CrossRef]
  78. Onyutha, C.; Asiimwe, A.; Ayugi, B.; Ngoma, H.; Ongoma, V.; Tabari, H. Observed and Future Precipitation and Evapotranspiration in Water Management Zones of Uganda: CMIP6 Projections. Atmosphere 2021, 12, 887. [Google Scholar] [CrossRef]
  79. Cattani, E.; Merino, A.; Guijarro, J.A.; Levizzani, V. East Africa Rainfall Trends and Variability 1983–2015 Using Three Long-Term Satellite Products. Remote Sens. 2018, 10, 931. [Google Scholar] [CrossRef] [Green Version]
  80. Endris, H.S.; Lennard, C.; Hewitson, B.; Dosio, A.; Nikulin, G.; Artan, G.A. Future changes in rainfall associated with ENSO, IOD and changes in the mean state over Eastern Africa. Clim. Dyn. 2018, 52, 2029–2053. [Google Scholar] [CrossRef] [Green Version]
  81. Ayugi, B.; Tan, G.; Niu, R.; Babaousmail, H.; Ojara, M.; Wido, H.; Mumo, L.; Nooni, I.; Ongoma, V. Quantile Mapping Bias Correction on Rossby Centre Regional Climate Models for Precipitation Analysis over Kenya, East Africa. Water 2020, 12, 801. [Google Scholar] [CrossRef] [Green Version]
  82. Karim, R.; Tan, G.; Ayugi, B.; Babaousmail, H.; Liu, F. Evaluation of Historical CMIP6 Model Simulations of Seasonal Mean temperature over Pakistan during 1970–2014. Atmosphere 2020, 11, 1005. [Google Scholar] [CrossRef]
  83. Sian, K.L.K.; Wang, J.; Ayugi, B.; Nooni, I.; Ongoma, V. Multi-Decadal Variability and Future Changes in Precipitation over Southern Africa. Atmosphere 2021, 12, 742. [Google Scholar] [CrossRef]
  84. Ngoma, H.; Wen, W.; Ayugi, B.; Babaousmail, H.; Karim, R.; Ongoma, V. Evaluation of precipitation simulations in CMIP6 models over Uganda. Int. J. Clim. 2021. [Google Scholar] [CrossRef]
  85. Babaousmail, H.; Hou, R.; Ayugi, B.; Ojara, M.; Ngoma, H.; Karim, R.; Rajasekar, A.; Ongoma, V. Evaluation of the Performance of CMIP6 Models in Reproducing Rainfall Patterns over North Africa. Atmosphere 2021, 12, 475. [Google Scholar] [CrossRef]
  86. Knutti, R.; Sedlacek, J. Robustness and uncertainties in the new CMIP5 climate model projections. Nat. Clim. Chang. 2013, 3, 369–373. [Google Scholar] [CrossRef]
Figure 1. The map of East Africa (EA) delineating different countries. Local features such as lakes and high mountains are highlighted. The digital elevation model (DEM) datasets were retrieved from shuttle radar topography Mission (SRTM) 90 m spatial resolution http://dds.cr.usgs.gov/srtm/ (accessed on 14 April 2021).
Water 13 02358 g001
Figure 2. Spatial distribution of the projected changes in March-April-May (MAM) precipitation extremes under the SSP2–4.5 (panels (af)) and SSP5–8.5 (panels (gl)) scenarios for the near future (2021–2040) relative to 1995–2014. The black dots indicate statistically significant changes at the 95% confidence level, while areas where 70% of models agree on the projected changes are marked with sloped black boxes.
Water 13 02358 g002
Figure 3. Spatial distribution of the projected changes in March-April-May (MAM) precipitation extremes under the SSP2–4.5 and SSP5–8.5 scenarios for the far future (2081–2100) relative to 1995–2014. The black dots indicate statistically significant changes at the 95% confidence level, while areas where 70% of models agree on the projected changes are marked with sloped black boxes. Panels (af) represent SSP2–4.5 and (gi) show SSP5–8.5 scenarios.
Water 13 02358 g003
Figure 4. Temporal evolution of the projected changes in March to May (MAM) precipitation extremes for (a) PRCPTOT, (b) R95 p, (c) R20 mm, (d) CDD, (e) CWD, and (f) SDII for CMIP6 models over East Africa under SSP2–4.5 and SSP5–8.5 scenarios for the future years relative to the reference period 1995–2014. The shading signifies the interquartile model spread ranging from 25th to 75th quartile. The time series are smoothed by Butterworth low-pass filtering with a 21-year window.
Water 13 02358 g004
Figure 5. Spatial distribution of the projected changes in October-November-December (OND) precipitation extremes under the SSP2–4.5 and SSP5–8.5 scenarios for the near future (2021–2040) relative to 1995–2014. The black dots indicate statistically significant changes at the 95% confidence level, while areas where 70% of models agree on the projected changes are marked with sloped black boxes. Panels (af) represent SSP2–4.5 and (gl) show SSP5–8.5 scenarios.
Water 13 02358 g005
Figure 6. Spatial distribution of the projected changes in October-November-December (OND) precipitation extremes under the SSP2–4.5 and SSP5–8.5 scenarios for the far future (2081–2100) relative to 1995–2014. The black dots indicate statistically significant changes at the 95% confidence level, while areas where 70% of models agree on the projected changes are marked with sloped black boxes. Panels (af) represent SSP2–4.5 and (gl) show SSP5–8.5 scenarios.
Water 13 02358 g006
Figure 7. Temporal evolution of the projected changes in October to December (OND) precipitation extremes for (a) PRCPTOT, (b) R95 p, (c) R20 mm, (d) CDD, (e) CWD, and (f) SDII for CMIP6 models over East Africa under SSP2–4.5 and SSP5–8.5 scenarios for the future years relative to the reference period 1995–2014. The shading signifies the interquartile model spread ranging from 25th to 75th quartile. The time series are smoothed by Butterworth low-pass filtering with a 21-year window.
Water 13 02358 g007
Table 1. Information of the Nine CMIP6 climate models used in this study.
S/NModels InstitutionResolution
1BCC-CSM2-MRBeijing Climate Center and China Meteorological Administration, China1.13° × 1.13°
2EC-EARTH3EC-EARTH consortium, Sweden0.70° × 0.70°
3EC-EARTH3-VegEC-EARTH consortium, Sweden0.70° × 0.70°
4GFDL-ESM4Geophysical Fluid Dynamics Laboratory (GFDL), USA1.25° × 1.00°
5INM-CM4-8Institute for Numerical Mathematics, Russian Academy of Science, Moscow, Russia2.00° × 1.50°
6INM-CM5-0Institute for Numerical Mathematics, Russian Academy of Science, Moscow, Russia2.00° × 1.50°
7MPI-ESM1-2-HRMax Planck Institute, Germany0.90° × 1.30°
8MRI-ESM2-0Meteorological Research Institute (MRI), Japan1.13° × 1.13°
9NorESM2-MMClimate modeling Consortium, Norway0.90° × 1.25°
10CESMNational Centre for Atmospheric Research (USA)0.94° × 1.25°
11CESM-WACCMNational Centre for Atmospheric Research (USA)0.94° × 1.25°
12FGOALS-G3LASG, Institute of Atmospheric Physics, Chinese Academy of Sciences (China)1.25° × 2.0°
13NESM3Nanjing University of Information Science and Technology, China1.125°× 1.125°
14KACE-1-0-GNational Institute of Meteorological Sciences/Korea Meteorological Administration, Korea1.25° × 1.875°
15CMCC-CM2-SR5Fondazione Centro Euro-Mediterraneo sui Cambiamenti Climatici, Italy1.0° × 1.0°
Publisher’s Note: MDPI stays neutral with regard to jurisdictional claims in published maps and institutional affiliations.

