Article

Multiple-Facet Diversity Patterns of Aquatic Vegetation in Lakes along a Trophic Gradient

1
Department of Botany, School of Biology, Aristotle University of Thessaloniki, GR-54124 Thessaloniki, Greece
2
The Goulandris Natural History Museum—Greek Biotope/Wetland Centre, 14th km Thessaloniki-Mihaniona, P.O. Box 60394, GR-57001 Thermi, Greece
3
Department of Ecology, School of Biology, Aristotle University of Thessaloniki, GR-54124 Thessaloniki, Greece
4
Department of Plant Biology, School of Biology, University of Patras, GR-26504 Patras, Greece
5
Department of Vegetation and Phytodiversity Analysis, University of Göttingen, Untere Karspüle 2, 37073 Göttingen, Germany
*
Author to whom correspondence should be addressed.
Water 2021, 13(16), 2281; https://doi.org/10.3390/w13162281
Submission received: 17 July 2021 / Revised: 18 August 2021 / Accepted: 19 August 2021 / Published: 20 August 2021

Abstract

:
The EU Water Framework Directive foresees the ecological assessment of surface waters against identified pressures. Nutrient loading is the main pressure impairing the ecological quality of lake ecosystems, and aquatic macrophytes are considered good indicators of ecological response. In this study, we statistically assessed different aspects of aquatic plant (macrophyte) diversity in response to different trophic levels in Mediterranean lakes. We used 5690 relevés of aquatic vegetation, distributed over 305 transects, sampled in 18 freshwater lake ecosystems during 2013–2016. Our results show a significant decrease in taxonomic alpha diversity in lakes with a total phosphorus content above 100 μg/L. Syntaxonomic diversity followed the species richness pattern as well. Functional richness decreased along the trophic gradient, while functional dispersion was higher in lakes with high trophic levels. Taxonomic and functional beta partitioning presented changes in assembly processes leading to greater community homogeneity in lakes with higher trophic levels. In summary, we found no redundancy between taxonomic and functional diversity indices. These results provide novel insights into aquatic plant assembly processes of impacted freshwater lakes needed to forward conservation and restoration practices.

1. Introduction

The importance of freshwater ecosystems as biodiversity hotspots around the globe is well established [1,2]. However, human-induced changes have been impacting the integrity and biodiversity of these ecosystems through increasing nutrient, sediment and contaminant loads, water abstraction, and biotic exchanges [1,3,4]. Effective conservation and restoration measures to address biodiversity decline are needed, and, in this respect, increased efforts have been made to identify ecosystem diversity changes in order to allow for ecological predictions [5,6]. In Europe, the Water Framework Directive (WFD; [7]) necessitates the ecological assessment of the structure and functioning of surface water ecosystems, and therefore holistic ecosystem assessment approaches are required [8,9]. However, most WFD compliant monitoring and assessment methods focus on the taxonomic aspect of freshwater ecosystems [10]. Metrics taking into consideration all attributes of diversity, including its functional component, failed to find a place in most biomonitoring protocols of freshwater ecosystems [11,12,13]. It has been emphasized that in order to evaluate and quantify ecosystem functioning, new assessment tools should be developed [10].
Following Noss [14], who proposed the exploration of biodiversity’s three main facets (compositional, structural, and functional), research started to focus on multiple-facet diversity approaches [15,16]. These approaches aim to evaluate biodiversity changes by using various diversity indices. Taxonomic diversity (TD), the local or regional species pool [15,17], constitutes the most commonly used. TD is further divided into taxonomic alpha diversity, i.e., species richness in a specific site, and taxonomic beta diversity, i.e., variation in species composition among sites [18,19]. Changes in taxonomic beta diversity reflect two different phenomena: one is the species turnover from one site to another, and the other is species absence when comparing sites, known as nestedness [17,18,20,21]. Another important component of biodiversity is functional diversity (FD), which suggests that the species are not equivalent regarding ecosystem processes [16,22]. Likewise, FD consists of an alpha component, which contains the functional richness in a site, and a beta one, which stands for the variation in functional trait composition among sites of a region, further divided into functional turnover (i.e., functional replacement) and functional nestedness (i.e., functional loss) [20,23,24]. Finally, another level of biodiversity is community or syntaxonomic diversity (SD), using plant communities (syntaxa) [25,26].
Aquatic macrophyte diversity, especially species richness, and its relation with environmental conditions in freshwater ecosystems has been previously examined in several lake ecosystems [27,28,29]). Studies proved that they respond well to eutrophication pressure [30,31,32], which had, as a consequence, to classify them as bioindicators in WFD-compliant assessment systems. However, there was not enough focus on multi-scale patterns and community diversity in relation to eutrophication pressure [11,12,13,33]. Furthermore, aquatic macrophyte diversity has not received proper attention in the Mediterranean region, and research gaps reflecting different monitoring traditions in southern, central and northern European countries, in the context of WFD, are still profound [11,33,34,35,36].
In this study, we aimed to identify and describe different aspects of aquatic plant diversity in Mediterranean lakes in response to different trophic levels. More specifically, our first objective was to explore the patterns of the taxonomic, syntaxonomic and functional diversity of aquatic vegetation along the trophic gradient, by means of calculating a number of diversity indices for lakes in different trophic levels. Then, the resulting diversity patterns were used for our second objective, which was to infer the changes in aquatic plant assembly rules among the different lake trophic levels.

2. Materials and Methods

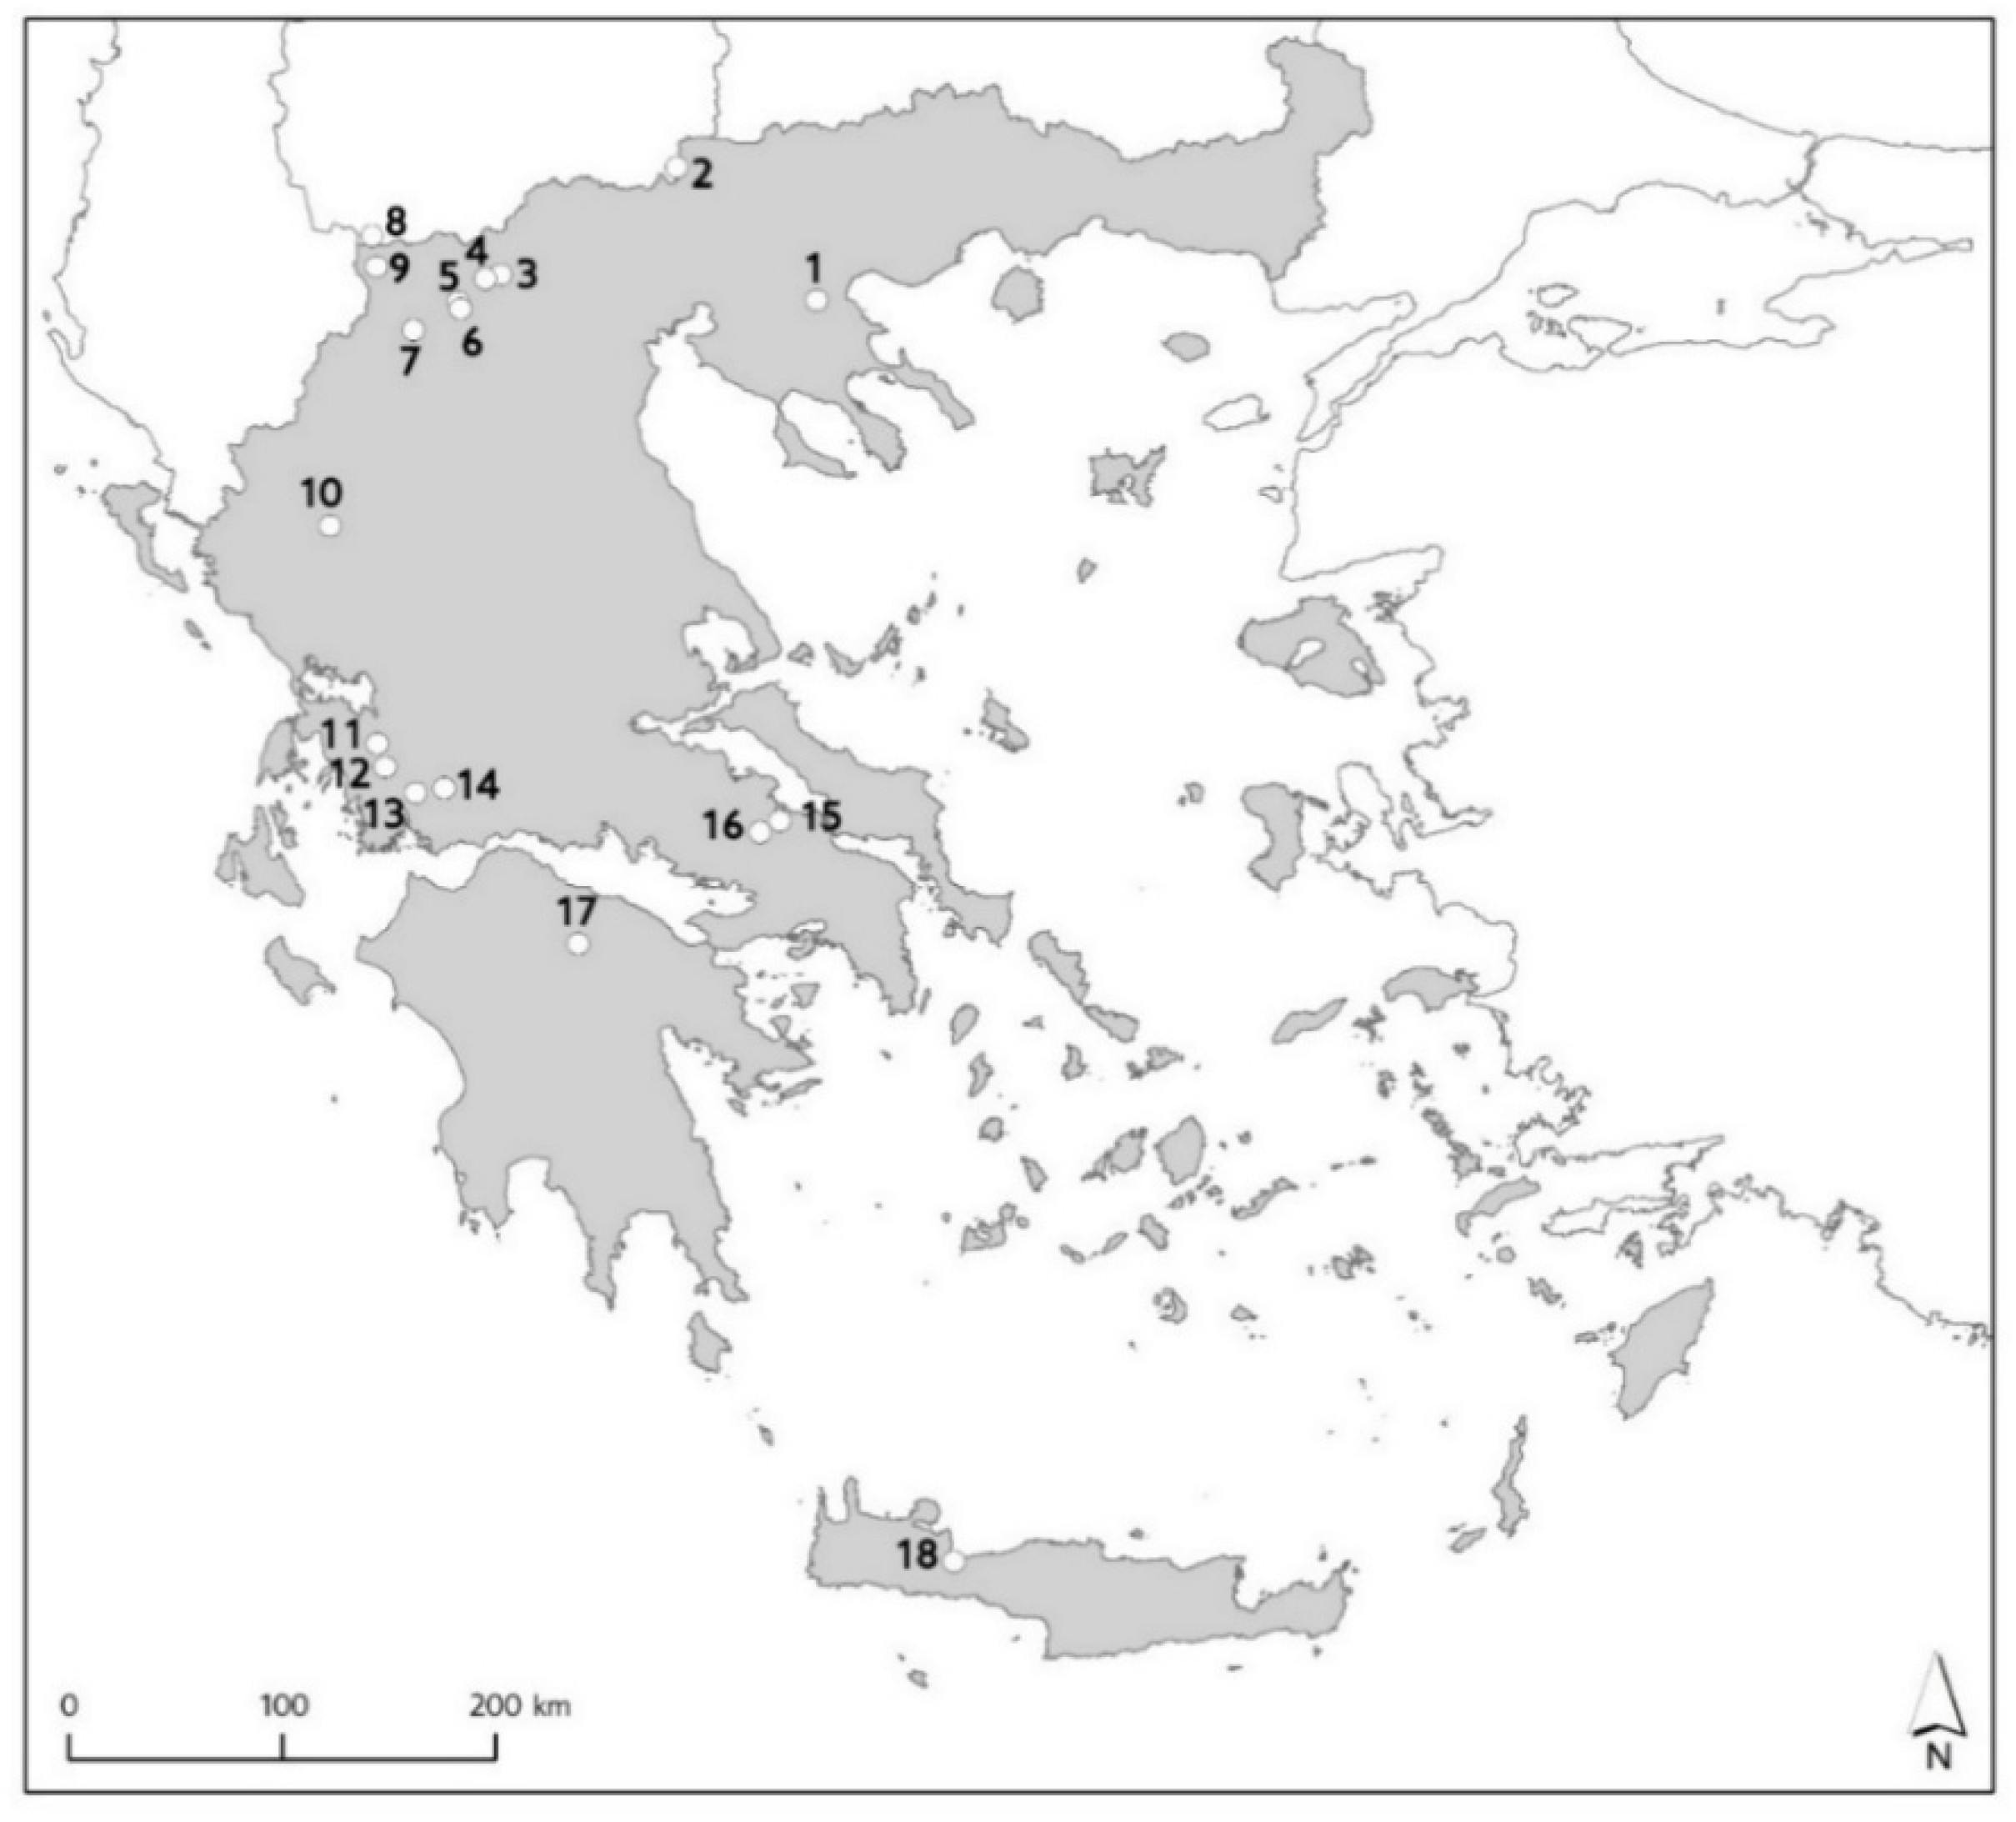
2.1. Study Area and Vegetation Data

Aquatic and littoral vegetation data were collected from 18 lakes (Figure 1 and Table 1) belonging to the Greek National Water Monitoring Network (GNWMN) [37].
All 18 lakes belong to Mediterranean lake types [39] and are distributed throughout Greece. They are subject to a wide range of pressures, including different nutrient loads and land use in the catchment areas [40,41]. Each lake was surveyed once in May to September 2013–2016 during the main growing season of aquatic and riparian plants (Table 1), by applying the belt transect-mapping method (for more details see [37]). We collected 5690 vegetation relevés of 4 m2, distributed among 305 transects along lake depth gradients (Table 1). All macrophytes (angiosperms, pteridophytes, bryophytes, charophytes and filamentous green algae) were recorded and determined to (sub-)species level (except filamentous green algae). Their abundance at plot level was estimated using the semi-quantitative five-point DAFOR scale [42], transformed to percentage cover values as follows: Dominant = 87.5%, Abundant = 50%, Frequent = 17.5%, Occasional = 5.5% and Rare = 0.5%.

2.2. Lake Trophic Status Parameters

Environmental data (e.g., seasonal total phosphorus concentration in the water column) were collected from each lake in the context of GNWMN (see Zervas et al. [41] for more details). Based on these data, we calculated annual mean total phosphorus (TP) concentration in the water column of each lake. We considered TP concentration as proxy to eutrophication pressure [43,44], and we used it in order to assess the relationships between aquatic vegetation and lake trophic level.
Various trophic status classification schemes have been developed in order to connect the eutrophication levels of water bodies and nutrient concentrations [45]. In the context of this study, the lakes were grouped into four categories according to their TP content as follows: low trophic group, with TP < 20 μg/L, which is considered a threshold value for reference lakes [43,46]; moderate trophic group, with TP 20–50 μg/L, which is the range used to derive the good/moderate boundaries for Mediterranean lakes in WFD assessment systems [47,48]; very high trophic group, TP > 100 μg/L, which responds to hyper-eutrophic lakes according to the OECD classification scheme [49]; and the in-between range, of the high trophic group, with TP 50–100 μg/L.

2.3. Diversity Analysis
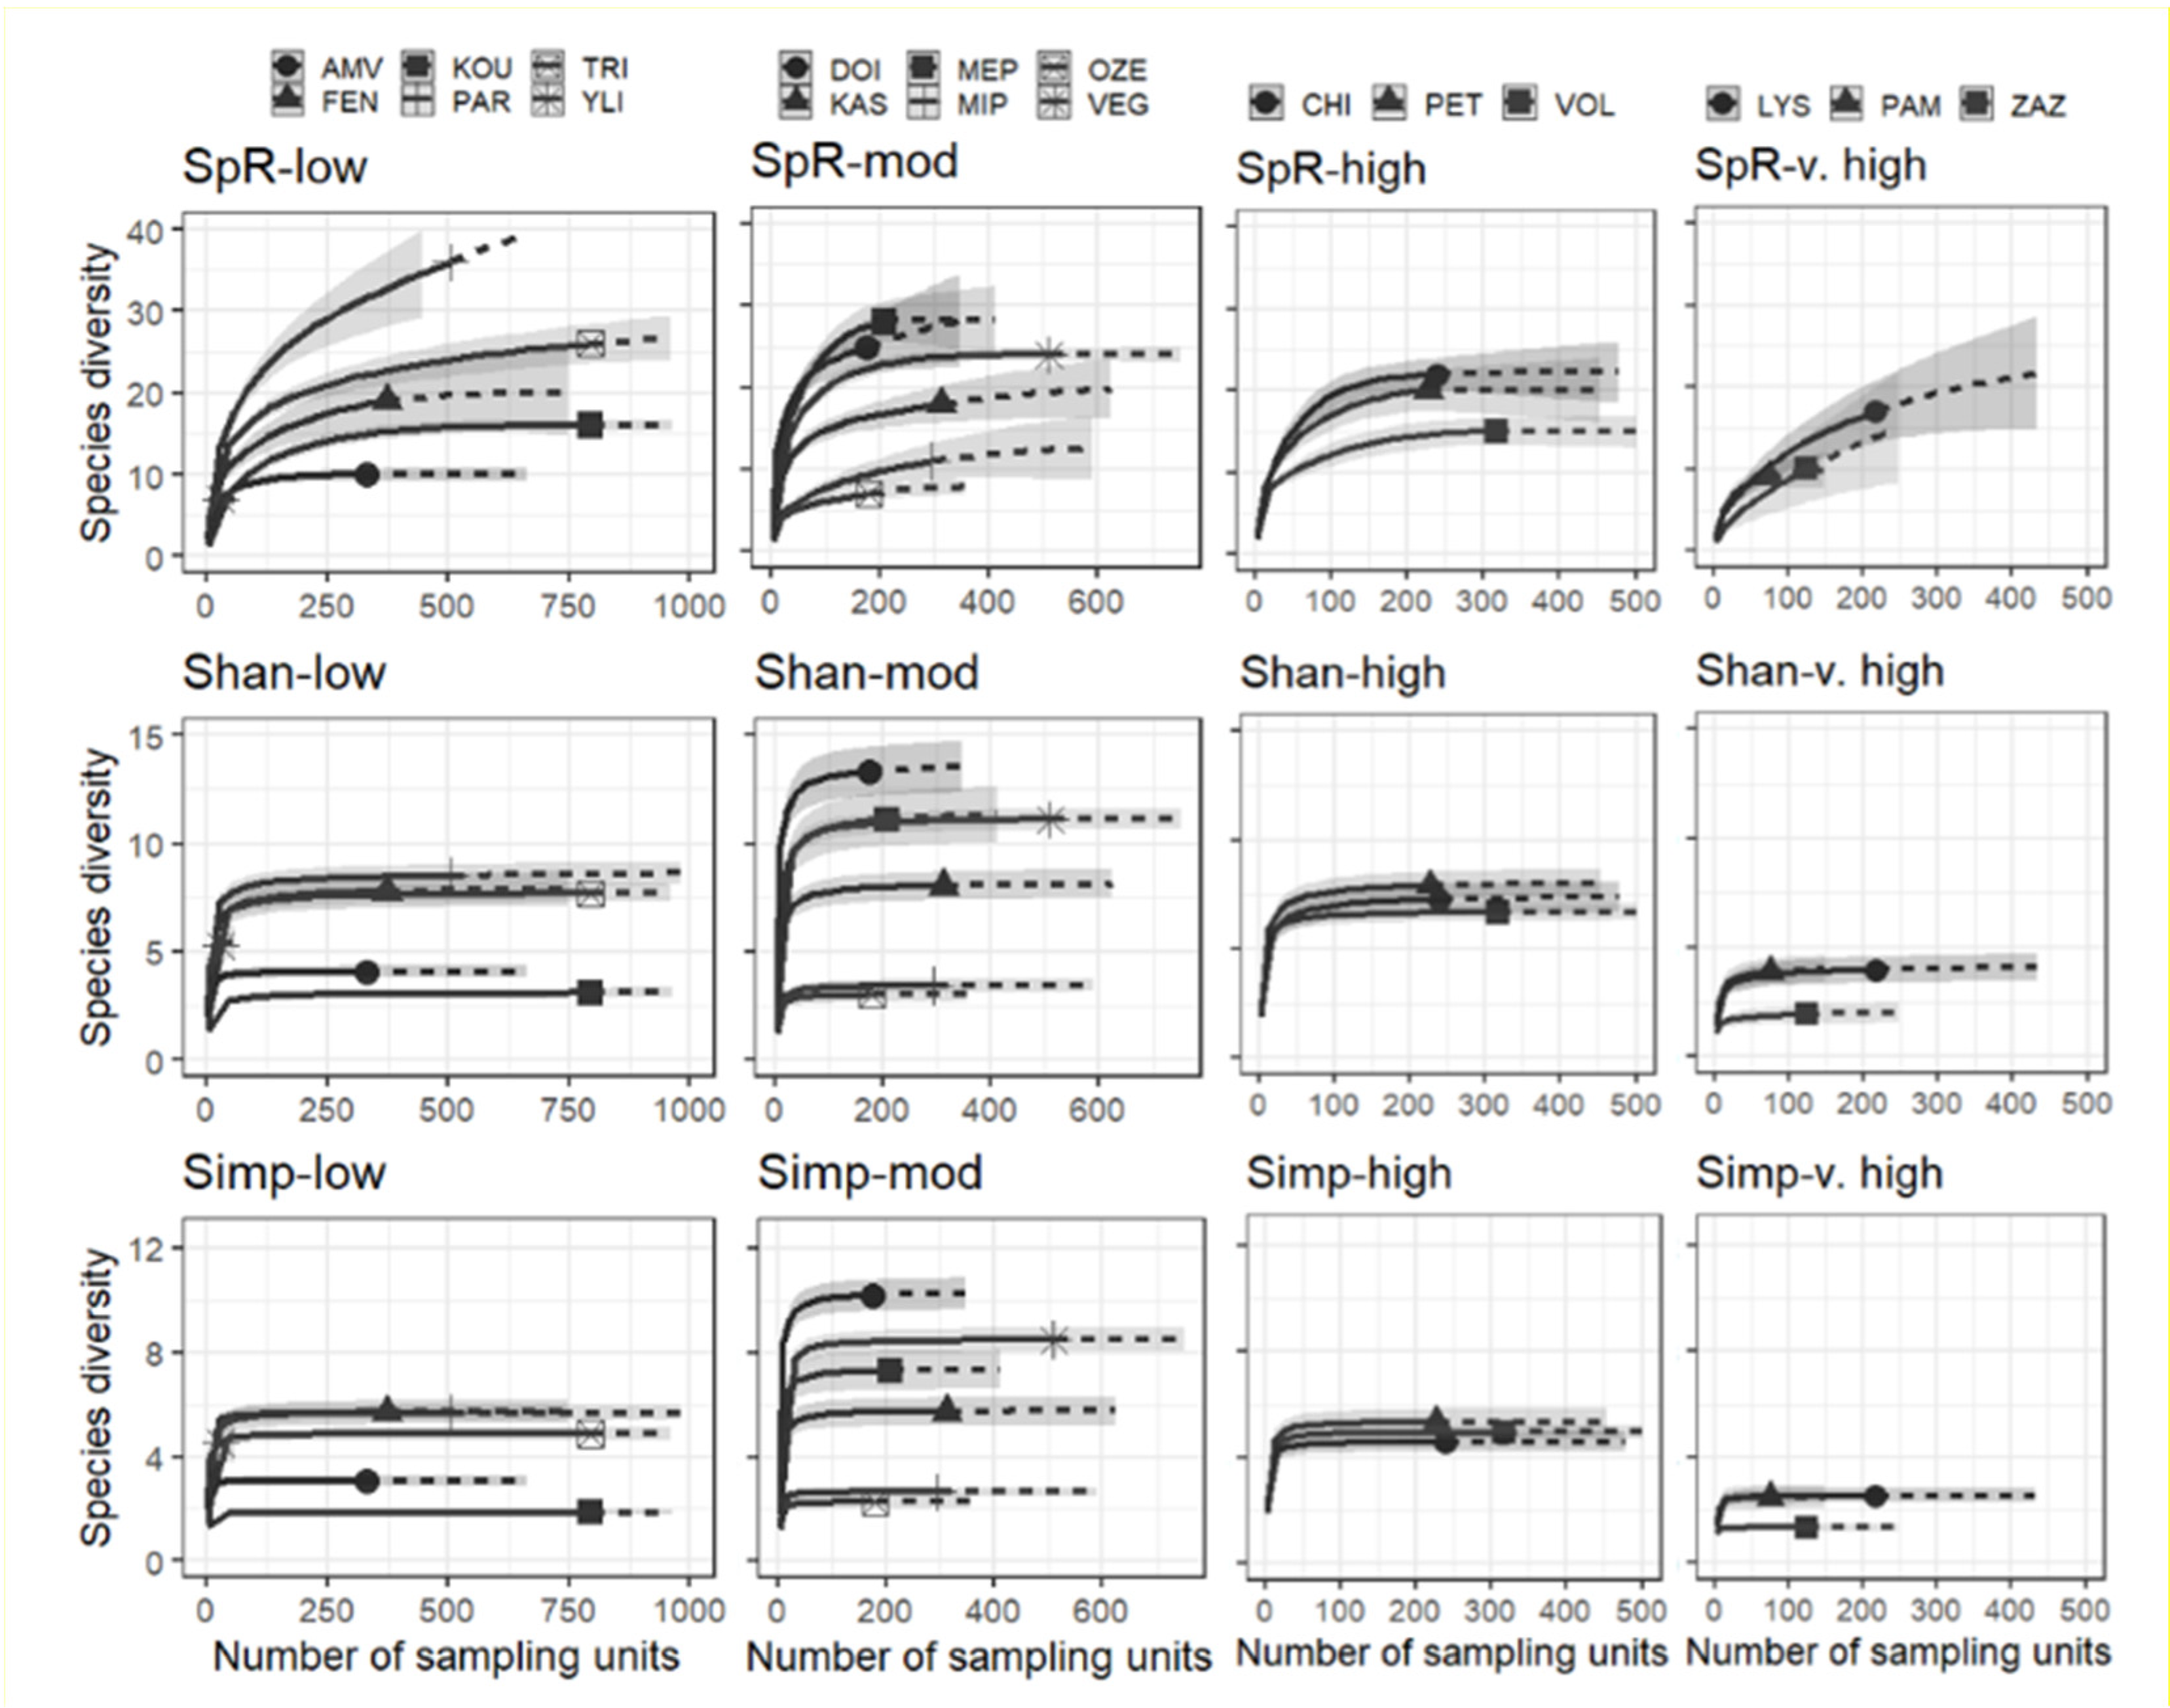
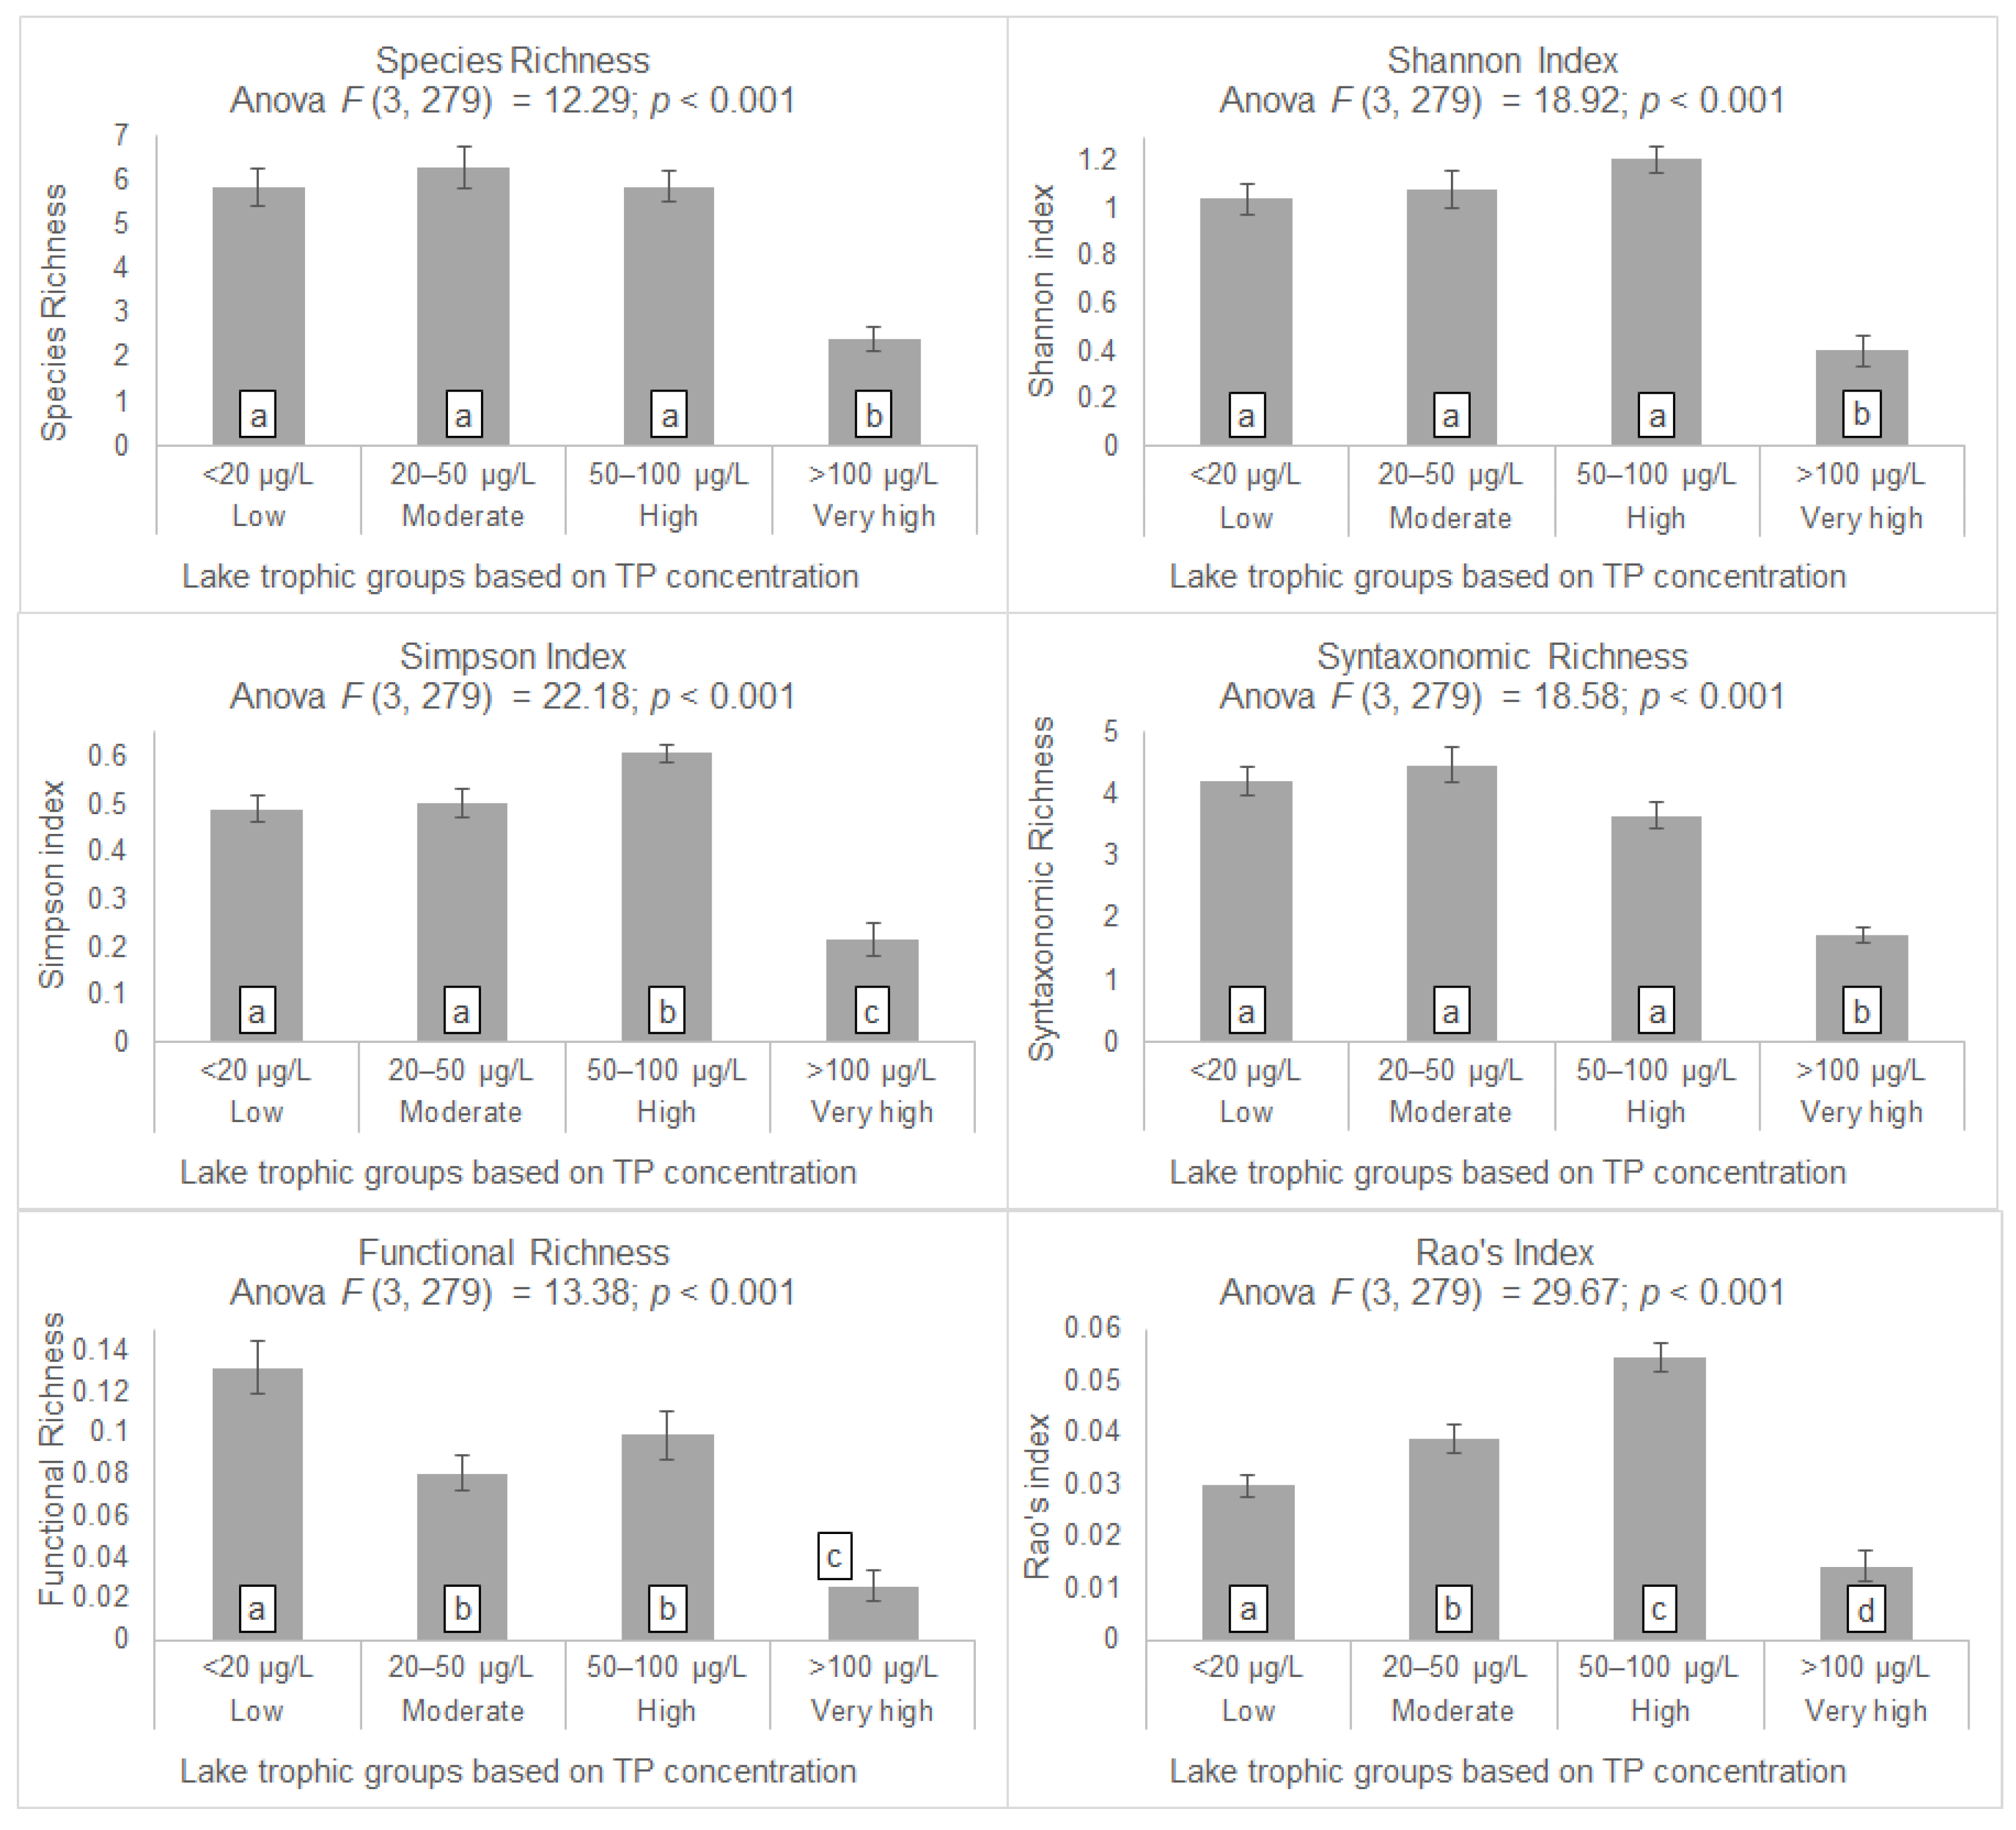
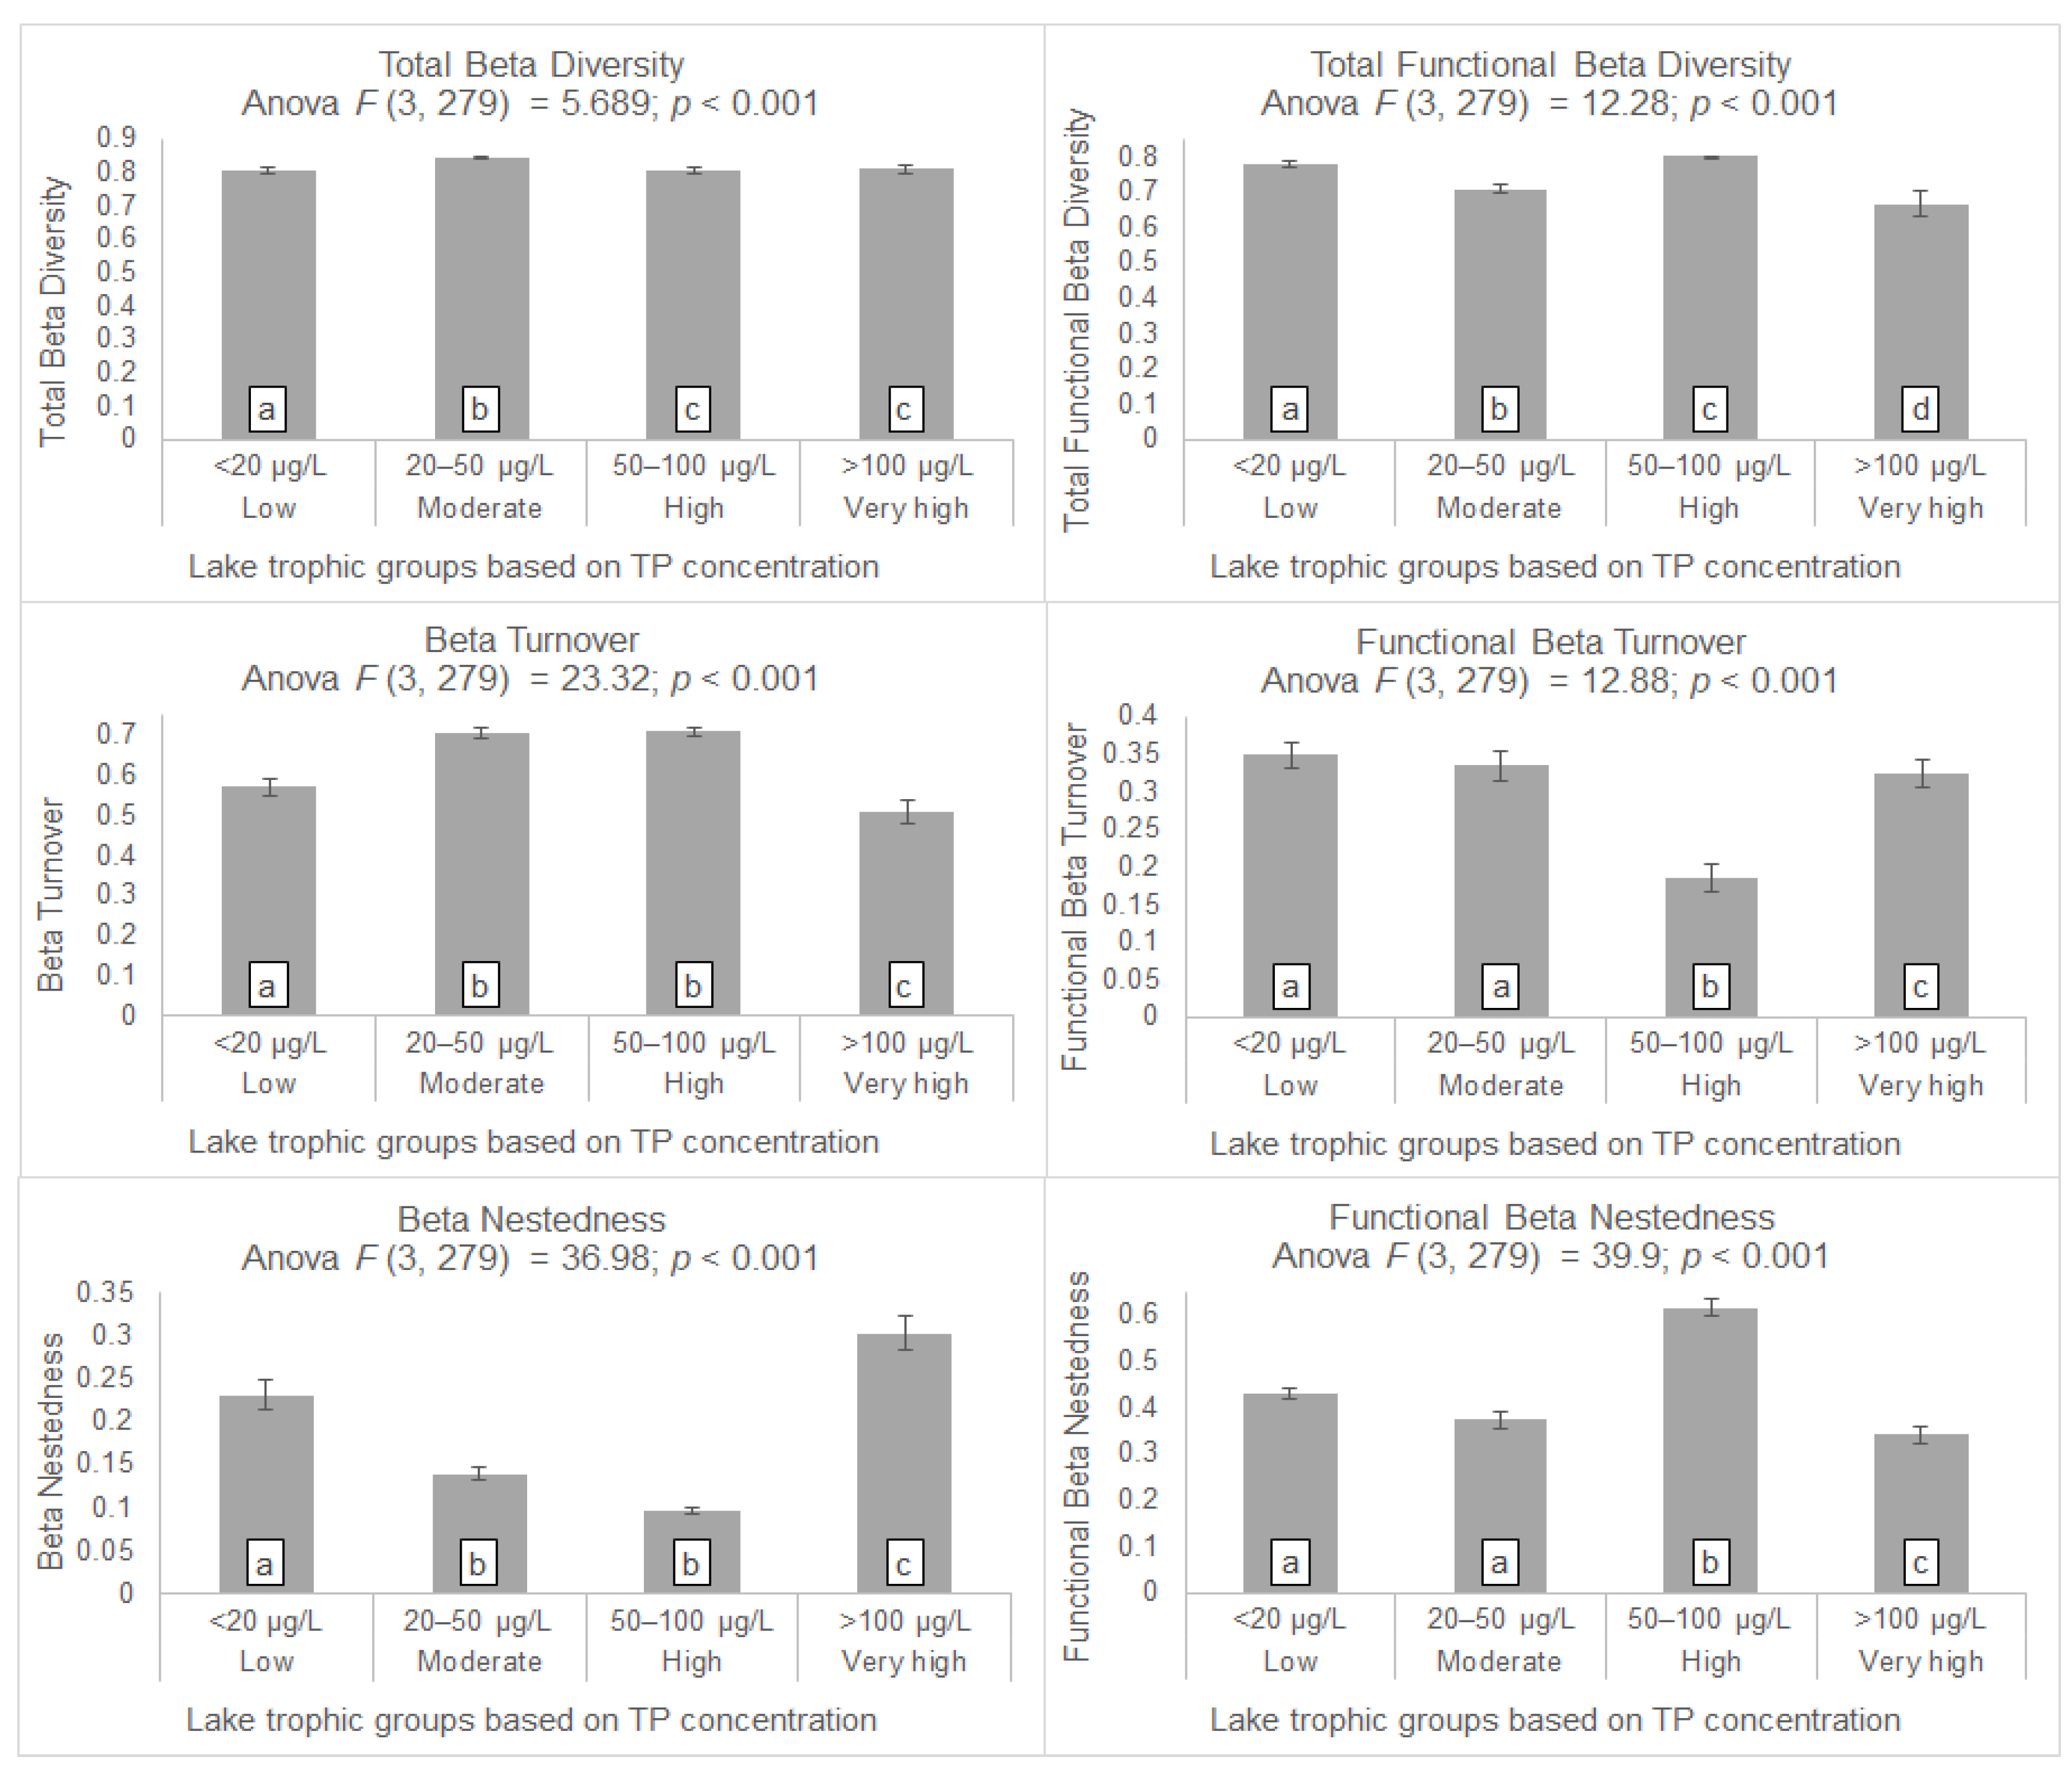
Several diversity indices (i.e., taxonomic alpha and beta diversity, syntaxonomic diversity, functional alpha and beta diversity) were calculated for the aquatic and littoral vegetation recorded in each lake. For the purpose of visualizing the diversity patterns and turning points, these indices were plotted against the lake trophic gradient. In order to acquire diversity values with respect to different lake sizes, calculations of diversity indices (besides rarefaction curves) were performed on a transect level. This approach was also favored in order to overcome species number restrictions when calculating functional diversity indices [50,51]. Same-transect relevés were integrated, transect sizes were standardized in order to equalize the number of their relevés, and macrophyte taxa cover values were calculated for each lake transect.
For taxonomic alpha diversity, rarefaction curves and diversity profiles based on the accumulation of relevés (sampling-unit-based incidence data) for each lake were created with interpolation/extrapolation analysis in the iNEXT package for R [52] using Hill numbers, as proposed by Chao et al. [53]. Species richness, the Shannon diversity index, and the Simpson diversity index were also calculated for each transect using the vegan package for R [54].
In order to calculate syntaxonomic diversity, i.e., the richness of plant communities in each transect, we used the results of the phytosociological analysis in Zervas et al. [55]. Each relevé was coded according to its community affiliation, and syntaxa richness in each transect was calculated using vegan package for R [54].
For functional alpha diversity, we calculated the multidimensional Functional Richness index (FRic: amount of niche space occupied by taxa) of Villéger et al. [51] and Rao’s quadratic entropy (FDQ: dispersion of taxa in trait niche space) [56], as proposed by Laliberté and Legendre [57]. Calculations were based on a multiple-trait dataset with traits covering life forms, growth morphology, survival characteristics, ecological preferences, reproduction and dispersal attributes (for more details, see Zervas et al. [41]). The trait dataset was transformed into a species distance matrix using Gower dissimilarity [58] for categorical and ordinal trait values, and was analyzed by principal coordinates analysis (PCoA) in order to reduce the trait dimensions to two axes. The resulting PCoA axes were used in calculating FRic and FDQ diversity indices for each transect of the study. All above-mentioned analysis was executed using the FD package for R [59].
Taxonomic beta diversity in each lake was computed by applying the multiple-site extension to pairwise partitioned beta diversity, as proposed by Ensing and Pither [60]. Abundance community data of all transects in each lake were analyzed by using the betapart package for R [61]. This process calculates the variation in species composition among those transects and partitions the variation in species replacement (turnover) and species loss (nestedness) from transect to transect in each lake.
Functional beta diversity in each lake was computed accordingly, by applying the multiple-site beta diversity extension on the abundance community data of all transects in each lake. For the required trait input, we used the same minimized dimension matrix we received from the PCoA analysis of the trait data in the functional diversity calculations. Transect functional beta diversity values, and their partitioning to functional turnover and functional nestedness, were calculated by using the betapart package for R [61].
For each diversity index, one-way ANOVA (analysis of variance, [62]) was applied on the average diversity values of transects belonging to lakes in the different trophic groups, in order to evaluate the diversity differences along the trophic gradient. The Tukey Honest Significant Differences post-hoc test (TukeyHSD; [63]), with a 95% family-wise confidence level, was used to explore significant differences of diversity values between different lake trophic levels. ANOVAs and TukeyHSD tests were made using the stats core-package for R [64]. Furthermore, correlations among all diversity metrics and TP were assessed in order to (i) investigate the strength of the relation of each diversity metric independently with TP as an indicator of lake trophic level and (ii) explore the redundancy in calculating different diversity metrics. Taking into consideration the nonlinearity of diversity responses to environmental gradients, a non-linear correlation analysis [65] was applied among all the estimated transect diversity values and the lake TP values by using the nlcor function for R [64].
All calculations were performed in R environment version 3.5.3 [64].

3. Results

Regarding the lake classification in trophic groups, six out of the 18 lakes (Amvrakia, Kourna, Trichonida, Feneos, Paralimni, and Yliki) were grouped into the low trophic group (<20 μg/L TP). Another six lakes (Doirani, Megali Prespa, Ozeros, Kastoria, Mikri Prespa, and Vegoritida) were assigned to the moderate trophic level (20–50 μg/L TP). Three lakes (Chimaditida, Petres, and Volvi) were placed in the high trophic group (50–100 μg/L TP), and the remaining three (Lysimachia, Pamvotida, and Zazari) in the very high trophic group (>100 μg/L TP). The mean depth of low trophic group lakes fluctuated between 5 and 29 m, between 4 and 26 m for moderate trophic group lakes, between 1 and 13 m for high trophic group lakes, and between 4 and 5 m for very high trophic group lakes.
Rarefaction curves (Figure 2) provided a diversity profile for each lake, as well as the four trophic groups they belong to. Diversity indices for most lakes reached a plateau during the interpolation of their relevés sampled, except for Yliki (low trophic) in all three indices, and Paralimni (low trophic), Lysimachia (very high trophic), Pamvotida (very high trophic) and Zazari (very high trophic) for species richness. Variance in the diversity values of lakes in the low and moderate trophic groups was greater than that observed in lakes in the high and very high trophic groups. Paralimni in the low trophic group was the most species-rich lake, followed by Megali Prespa and Doirani in the moderate trophic group, and Trichonida also in the low trophic one. Despite the great variation, lakes belonging to low and moderate trophic groups combined had higher species richness than those in the high and very high trophic groups. Shannon and Simpson diversity indices showed a clearer image of the diversity differences between the lakes representing different trophic groups. Doirani, Vegoritida and Megali Prespa of the moderate trophic group were the most diverse lakes, followed by lakes in the low and high trophic groups. Lakes belonging in the very high trophic group presented the lowest diversity values.
Alpha diversity patterns along the lake trophic gradient are summarized in Figure 3. Each bar represents the mean diversity value of all transects belonging to lakes within the same trophic group. One-way ANOVA showed that there were statistically significant (p < 0.001) differences among all three alpha diversity values of transects belonging to the different trophic lake groups. Greater values of species richness were calculated in lakes with a moderate trophic level, while greater values of Shannon and Simpson diversity values were calculated in lakes with a high trophic level. Lower values for all three alpha diversity metrics were found in very high trophic level lakes. However, the TukeyHSD test showed significant differences only between the lakes in the very high trophic group and the rest of them for the species richness and Shannon indices, while it showed significant differences between the lakes in the very high trophic group and those in the high trophic group, as well as those in the moderate and low trophic groups combined for the Simpson index.
Syntaxonomic diversity (number of distinct plant communities) followed the same pattern with species richness (Figure 3), peaking in the moderate trophic group. One-way ANOVA showed that there was also a statistically significant (p < 0.001) difference among the values belonging to lakes of different trophic levels, but TukeyHSD differentiated statistically only the very high trophic group from the others.
Functional diversity indices, Functional Richness and Rao’s quadratic entropy revealed a different pattern (Figure 3). According to one-way ANOVA, there were statistically significant (p < 0.001) differences among the functional diversity values of lakes belonging to different trophic groups. Significant higher values of functional richness were calculated for lakes belonging to the low trophic group, moderate values were calculated for moderate and high trophic groups, and lower values were calculated for those in the very high trophic group. The TukeyHSD test verified this differentiation among the trophic groups (low, moderate and high combined, and very high groups). On the other hand, Rao’s quadratic entropy was found to receive higher values for lakes in the high trophic group and lower ones for the lakes in the low and very high trophic groups. The TukeyHSD test revealed significant differences in Rao’s values for all trophic groups.
The summary of the results regarding taxonomic and functional beta diversity and their partitions, turnover and nestedness, are shown in Figure 4. Both one-way ANOVAs for taxonomic and functional beta values showed that there were statistically significant (p < 0.001) differences among the mean beta diversity values of lakes belonging to different trophic groups. For taxonomic beta diversity, TukeyHSD showed that differences between low and moderate trophic groups, and moderate and high–very high trophic groups were statistically significant. For functional beta diversity, TukeyHSD showed significant differences among all consecutive trophic groups. Beta partitioning showed more clear patterns along the trophic gradient. Taxonomic beta turnover received higher values in lakes with moderate and high trophic levels, and lower ones in those of low and very high trophic levels, while taxonomic beta nestedness followed the reverse pattern. For both partitions, ANOVA showed statistically significant (p < 0.001) differences among the mean diversity values, and TukeyHSD recognized significant differences between the values of low and moderate–high trophic groups and between those of moderate–high and very high trophic groups. Moreover, taxonomic beta turnover values were higher (>0.5) than those of taxonomic beta nestedness (<0.3) for all trophic groups. Functional beta turnover was significantly lower in the high trophic group, where functional beta nestedness peaked. ANOVA showed statistically significant (p < 0.001) differences among the mean index values for both functional beta partitions along the trophic gradient, and TukeyHSD recognized significant differences among the diversity values in lakes with low–moderate trophic levels together, as compared to those in the high trophic group, and to those in the very high trophic group. Moreover, functional beta turnover values were found to be lower (<0.35) than those of functional beta nestedness (>0.35) for all trophic groups.
With respect to the relationships between all diversity metrics and TP (Table 2), all paired-metric correlations were statistically significant according to non-linear correlation analysis (adjusted p < 0.05). However, low (<0.8) correlation coefficients were calculated for most relationships. None of the individual diversity metrics showed a high correlation with TP. Between the different diversity metrics, species richness was highly correlated with the Shannon index and syntaxonomic richness, while the Shannon index was also highly correlated with the Simpson index and syntaxonomic richness. Furthermore, high correlations were also found between the different beta diversity metrics. On the other hand, no high correlations were found between taxonomic and functional diversity metrics.

4. Discussion

4.1. Taxonomic Alpha Diversity Patterns

Grime [66] described the “hump-back” model of diversity, in which high biodiversity is observed at intermediate intensities of disturbance due to the retardation of competitive exclusion. This “hump-back” model was also discovered governing the relationship between aquatic plant species richness and trophic level, recording higher species richness in mesotrophic lakes, and lower in nutrient-poor and nutrient-rich ones [27,29,67]. In this intermediate range of nutrient loads, an increase in emergent macrophyte richness and abundance due to lower levels of competitive exclusion overcompensates for the decrease in submerged macrophyte richness and abundance due to elevated water turbidity [67,68,69]. Jeppesen et al. [70] placed this intermediate range of nutrient loads between 50 and 150 μg/L TP for northern temperate lakes, while Romo et al. [71] suggested 50 μg/L TP as a critical threshold for Mediterranean lakes to avoid the shift to a turbid-water phase and preserve macrophyte dominance.
Our results indicate that there is a similar but less obvious pattern for the taxonomic alpha diversity of aquatic plant species in Mediterranean lakes, with higher species richness in lakes with moderate trophic levels (20–50 μg/L TP) and higher Shannon and Simpson index values for lakes with high trophic levels (50–100 μg/L TP). However, only the Simpson index was able to reveal a statistically significant peak of diversity in lakes with a high trophic level, while species richness and the Shannon index revealed significant diversity changes only between lakes below and above the 100 μg/L TP threshold (high–very high lake trophic boundary). The “hump-back” pattern might have been more profound in our study if data concerning very low trophic level lakes (<10 μg/L TP), which are commonly used in other studies (e.g., [30,69]), were available in our dataset. Parts of the “hump-back” diversity pattern were described recently by García-Girón et al. [36] for macrophytes in Mediterranean ponds, as well as in studies of other aquatic organisms, such as phytoplankton, zooplankton, fish and macroinvertebrates [72,73,74].
Penning et al. [30] and Kolada et al. [69] were also able to find the same “hump-back” response, with macrophyte species richness peaking at 20–50 μg/L TP, when testing its indicator value for a great number of northern and central European lakes. However, great variation in their dataset and the resulting weak relation to TP content led to the conclusion that species richness alone is of limited explanatory power. Similarly, we found great variation in the values of species richness, Shannon and Simpson indices, especially for low and moderate trophic level lakes, leading to uncertainty in the assessment results. Moreover, neither of these three alpha diversity metrics independently showed a high correlation with TP lake content. Similar results presented by García-Girón et al. [36] strengthened their suggestions for the complementary use of several diversity metrics. Diversity metrics for aquatic vegetation are considered sensitive to environmental “noise” associated with a number of different environmental drivers related to habitat conditions, habitat heterogeneity and other water physico-chemical characteristics [29,33,34,35]. Therefore, our results concerning alpha diversity metrics can be attributed to two different scenarios. The first scenario is that perhaps nutrient loading was not the most important driver of the spatial variation of macrophyte communities within a lake, and other drivers such as habitat heterogeneity or other local disturbance factors should be taken into consideration [75,76]. The second scenario is that nutrient loading could be the most important driver of macrophyte spatial variation but it does not affect the whole lake body homogenously, having in mind that many lakes may be impacted by point-source nutrient loadings and diverse water quality conditions prevail among distant shoreline habitats [76,77,78].

4.2. Taxonomic Beta Diversity Patterns

Another important aspect when analyzing diversity patterns for conservation purposes is the spatial variation of species composition among different communities, known as taxonomic beta diversity [18,19,79]. Its two components, species turnover (or species replacement) and nestedness (species loss), can reflect the drivers behind spatial variation, such as the natural and life history of species (e.g., distribution dynamics, dispersal strategies and evolution), species interactions (e.g., competition, mutualism and parasitism), and other ecological factors (e.g., environmental conditions, habitat heterogeneity and disturbance) [79,80,81].
According to our results, the spatial variation of species composition (total beta diversity), calculated among multiple sites within each lake, remains high at all trophic levels, following the results of similar studies [36,82,83]). Partitioning beta diversity revealed two distinct patterns of species turnover and nestedness along the trophic gradient. Species turnover among sites in lakes with moderate and high trophic levels was higher than that in lakes with low and very high trophic levels, where nestedness increased. This indicates that spatial variation in moderate and high trophic level lakes is attributed mainly to species replacement from site to site, maintaining high species richness in those lakes. On the other hand, spatial variation in lakes with a low trophic level with slightly lower species richness, and in lakes with a very high trophic level with significantly lower species richness, is attributed to a mix of species replacement and species loss from site to site. Taking into consideration that species turnover is often connected with environmental filtering and competition, while nestedness indicates other ecological processes, such as human disturbance [21,79,81,84], we conclude that ecological factors other than nutrient enrichment are also playing a significant role in macrophyte spatial distribution patterns within lakes (scenario 1), and local site nutrient profiles are important (scenario 2) in order to disentangle and quantify the relative contribution of each ecological process to these spatial distribution patterns.

4.3. Syntaxonomic Diversity Patterns

Syntaxonomic (or community) diversity is another way to express vegetation diversity by presenting at the same time plant diversity and their specific habitat features, thus acting as an indicator for ecological heterogeneity [25,26]. Plant species are the basis for describing syntaxonomic (phytosociological) units; therefore, syntaxonomic richness may be greatly affected by species richness. However, the number of plant communities in a habitat does not always imply the same number of species (species richness), since plant species are not equally distributed in communities, and disturbance may result in an increase/decrease in companion taxa without affecting the number of their communities [25,26].
In our results, however, we found that syntaxonomic richness followed a similar pattern to that of species richness (highly correlated), i.e., slightly higher numbers of plant communities were observed in lakes with moderate trophic levels, slightly lower numbers in lakes with low and high trophic levels, and significantly lower numbers in lakes with very high trophic levels. This result may be attributed to the fact that macrophyte communities contain a small number of taxa [55] and reinforces the “hump-back” model of diversity of macrophyte communities in lakes in the middle of the trophic gradient. However, variation in syntaxonomic richness values was also an issue for lakes with low and moderate trophic levels, reinforcing the need for the identification of parameters other than nutrient loading.

4.4. Functional Alpha Diversity Patterns

It has been extensively discussed that ecosystem functioning often depends on the richness and distribution of species, taking into consideration their functional role in the ecosystem [6,85,86]). High species richness does not always imply high ecosystem resilience (e.g., nuisance species) and it is not always the most desired target for conservation and restoration purposes [5,87,88]. Functional diversity is another facet of biodiversity adopted in order to evaluate diversity responses to ecosystem disturbance [87,88,89].
A number of different indices have emerged in order to quantify functional diversity, by assessing the value and range of organismal traits in ecosystems [50,51,90]. Functional richness, i.e., the functional niche space occupied by a species assemblage, and functional divergence, i.e., the distance of high species abundances from the center of the functional niche space, have been suggested as the best solution in analyzing community assembly processes under stress gradients [90]. Functional richness is increasing when present species occupy a larger functional niche space [50,51,90]. Therefore, functional richness is usually positively correlated with species richness (having more species leads to a bigger functional space) but not always, as the functional traits of some community assemblies may be more closely clustered than others [50]. Functional divergence is increasing when the majority of the community (species present and their abundance) is occupying the edges of the functional niche space [50,90,91]. Rao’s quadratic entropy is an index that measures both functional richness and divergence (conceptually similar to functional dispersion), increasing when either the functional niche space occupied by species increases and/or when these species are displaced further from the functional niche center [57,90,91].
In our results, we witnessed a drop in functional richness in the lakes of the moderate and high trophic groups, in relation to those in the low trophic group, while maintaining similar levels of species richness. This indicates that macrophyte species found in low trophic level lakes are being replaced in moderate and high trophic level ones by species that occupy a smaller functional niche space; thus, such species are defined by more homogenous trait patterns. Lakes with very high trophic levels present simultaneously lower functional and lower species richness, indicating both species and functional loss. This result of ours only partly follows the findings of previous studies [92,93,94]) that suggested species loss as the primal driver for functional changes along trophic gradients. On the other hand, Rao’s quadratic entropy revealed the similar “hump-back” response, much like the taxonomic indices, concurring with the results of García-Girón et al. [36]. This indicates that functional richness in low trophic level lakes is inflated by rare species with extreme trait values, while the majority of the community occupies a much smaller functional niche space. The highest Rao index values in high trophic level lakes show that their macrophyte communities are more dispersed in the functional niche space, following the evenness pattern presented by the Simpson index. Therefore, while low trophic level lakes present a greater amount of functional richness, they are characterized by lower functional differentiation than needed to ensure ecosystem resilience to changing environmental conditions [88,89,95].

4.5. Functional Beta Diversity Patterns

Much like taxonomic beta diversity, the spatial variation of functional trait compositions can be analyzed by functional beta diversity and its two analogous components, functional turnover (i.e., functional replacement) and functional nestedness (i.e., functional loss) [20,23,24]. Functional beta diversity metrics attempt to detect patterns in niche-based assembly processes, reflecting the responses of traits rather than species to the same ecological drivers that taxonomic beta diversity attempts to investigate [20,96].
According to our results, there were changes in spatial variation in trait composition (total functional beta diversity) along the trophic gradient, but we were not able to detect the profound downgrading pattern presented by Fu et al. [97]. The same factors that were suggested for taxonomic beta diversity, i.e., factors other than nutrient loading environmental drivers of macrophyte assemblages’ variation (scenario 1), and differentiated local trophic conditions inside the lakes (scenario 2), should be taken into consideration in order to quantify beta diversities. Partitioning functional beta diversity showed that there is an increase in spatial variation due to functional loss in high trophic level lakes, indicating that species-rich macrophyte communities in some sites (transects) of those lakes are losing parts of their functional niche space. Concurring with the results of Fu et al. [97], the overall functional beta diversity in all trophic levels was primarily attributed to the functional nestedness component (functional loss), while taxonomic beta diversity was mostly attributed to species turnover (species replacement). This indicates that along the trophic gradient, regardless of changes in species richness, species replacement among sites is the dominating factor of spatial variation, accompanied at the same time by functional loss. This concept agrees with a number of previous studies [98,99,100]) suggesting that nutrient loads lead to increased homogeneity in freshwater biotic assemblages.

5. Conclusions

The response of different aspects of aquatic plant diversity along a trophic gradient found in 18 Mediterranean lakes was assessed. A number of different taxonomic, syntaxonomic, and functional indices were applied and their patterns of change along different trophic levels were investigated. Higher values of species richness and the Shannon and Simpson diversity indices were recorded in lakes with TP levels up to 100 μg/L TP, and significantly lower values were recorded in lakes with TP levels higher than 100 μg/L. The “hump-back” diversity pattern was identified statistically only for the Simpson diversity index, perhaps due to the lack of lakes with very low trophic levels. Syntaxonomic richness followed the species richness pattern. Great variations in diversity values were found probably due to environmental drivers other than nutrient loading. Functional richness followed a decreasing pattern along the trophic gradient, while Rao’s index showed a “hump-back” pattern peaking in lakes with high trophic levels, indicating that low trophic level lakes contain rare species with extreme trait values, while the majority of the community abundance occupies a much smaller functional niche space. The partitions of taxonomic and functional beta diversity, turnover and nestedness described changes in assembly processes leading to greater community homogeneity in lakes with higher trophic levels. None of the diversity indices independently were highly correlated with lake trophic content, and no high correlation (redundancy) was found among taxonomic alpha or beta diversity indices and functional alpha or beta diversity indices. In conclusion, the complementary use of several diversity metrics is recommended in order to identify changes in community assembly processes as a response to eutrophication pressure.

Author Contributions

Conceptualization, D.Z. and I.T.; methodology, D.Z., I.T., A.S.K. and E.B.; software, D.Z.; validation, D.Z., I.T., V.T., A.S.K. and P.D.; formal analysis, D.Z., I.T. and A.S.K.; investigation, D.Z., V.T. and I.T.; resources, D.Z., V.T. and I.T.; data curation, D.Z.; writing—original draft preparation, D.Z.; writing—review and editing, D.Z., I.T., V.T., A.S.K., E.B. and P.D.; visualization, D.Z.; supervision, I.T. and V.T.; project administration, I.T. and V.T.; funding acquisition, V.T. All authors have read and agreed to the published version of the manuscript.

Funding

This research was funded by Act MIS 5001204 financed by the European Union Cohesion Fund (Partnership Agreement 2014–2020), and from Acts MIS 371010, 371138, 371140, 371144, 371145 financed by the European Regional Development Fund (National Strategic Reference Framework 2007–2013).

Institutional Review Board Statement

Not applicable.

Informed Consent Statement

Not applicable.

Data Availability Statement

The data that support the reported results of this study were used under license from The Goulandris Natural History Museum, Greek Biotope/Wetland Centre (EKBY). They are available upon reasonable request from DZ and with permission of The Goulandris Natural History Museum, Greek Biotope/Wetland Centre (EKBY).

Acknowledgments

The present study was conducted in the frame of the Greek National Water Monitoring Network, according to the JMD 140384/2011, implemented by The Goulandris Natural History Museum, Greek Biotope/Wetland Centre (EKBY). The network is supervised by the General Directorate for Waters of the Ministry of Environment and Energy. EKBY’s personnel conducted samplings and contributed to sample analysis.

Conflicts of Interest

The authors declare no conflict of interest.

References

  1. Dudgeon, D.; Arthington, A.H.; Gessner, M.O.; Kawabata, Z.-I.; Knowler, D.J.; Lévêque, C.; Naiman, R.J.; Prieur-Richard, A.-H.; Soto, D.; Stiassny, M.L. Freshwater biodiversity: Importance, threats, status and conservation challenges. Biol. Rev. 2006, 81, 163–182. [Google Scholar] [CrossRef]
  2. Reid, A.J.; Carlson, A.K.; Creed, I.F.; Eliason, E.J.; Gell, P.A.; Johnson, P.T.; Kidd, K.A.; MacCormack, T.J.; Olden, J.D.; Ormerod, S.J. Emerging threats and persistent conservation challenges for freshwater biodiversity. Biol. Rev. 2019, 94, 849–873. [Google Scholar] [CrossRef] [Green Version]
  3. Sala, O.E.; Chapin, F.S.; Armesto, J.J.; Berlow, E.; Bloomfield, J.; Dirzo, R.; Huber-Sanwald, E.; Huenneke, L.F.; Jackson, R.B.; Kinzig, A. Global biodiversity scenarios for the year 2100. Science 2000, 287, 1770–1774. [Google Scholar] [CrossRef]
  4. Vörösmarty, C.J.; McIntyre, P.B.; Gessner, M.O.; Dudgeon, D.; Prusevich, A.; Green, P.; Glidden, S.; Bunn, S.E.; Sullivan, C.A.; Liermann, C.R. Global threats to human water security and river biodiversity. Nature 2010, 467, 555–561. [Google Scholar] [CrossRef] [PubMed]
  5. Geist, J. Integrative freshwater ecology and biodiversity conservation. Ecol. Indic. 2011, 11, 1507–1516. [Google Scholar] [CrossRef]
  6. Strayer, D.L.; Dudgeon, D. Freshwater biodiversity conservation: Recent progress and future challenges. J. N. Am. Benthol. Soc. 2010, 29, 344–358. [Google Scholar] [CrossRef] [Green Version]
  7. European Community. Directive 2000/60/EC of the European Parliament and of the Council of 23 October 2000 establishing a framework for Community action in the field of water policy. Off. J. Eur. Communities 2000, 327, 1–72. [Google Scholar]
  8. Moss, B. The Water Framework Directive: Total environment or political compromise? Sci. Total Environ. 2008, 400, 32–41. [Google Scholar] [CrossRef] [PubMed]
  9. Voulvoulis, N.; Arpon, K.D.; Giakoumis, T. The EU Water Framework Directive: From great expectations to problems with implementation. Sci. Total Environ. 2017, 575, 358–366. [Google Scholar] [CrossRef] [PubMed] [Green Version]
  10. Reyjol, Y.; Argillier, C.; Bonne, W.; Borja, A.; Buijse, A.D.; Cardoso, A.C.; Daufresne, M.; Kernan, M.; Ferreira, M.T.; Poikane, S. Assessing the ecological status in the context of the European Water Framework Directive: Where do we go now? Sci. Total Environ. 2014, 497, 332–344. [Google Scholar] [CrossRef]
  11. Birk, S.; Bonne, W.; Borja, A.; Brucet, S.; Courrat, A.; Poikane, S.; Solimini, A.; Van De Bund, W.; Zampoukas, N.; Hering, D. Three hundred ways to assess Europe’s surface waters: An almost complete overview of biological methods to implement the Water Framework Directive. Ecol. Indic. 2012, 18, 31–41. [Google Scholar] [CrossRef]
  12. Poikane, S.; Birk, S.; Böhmer, J.; Carvalho, L.; de Hoyos, C.; Gassner, H.; Hellsten, S.; Kelly, M.; Solheim, A.L.; Olin, M. A hitchhiker’s guide to European lake ecological assessment and intercalibration. Ecol. Indic. 2015, 52, 533–544. [Google Scholar] [CrossRef]
  13. Poikane, S.; van den Berg, M.; Hellsten, S.; de Hoyos, C.; Ortiz-Casas, J.; Pall, K.; Portielje, R.; Phillips, G.; Solheim, A.L.; Tierney, D. Lake ecological assessment systems and intercalibration for the European Water Framework Directive: Aims, achievements and further challenges. Procedia Environ. Sci. 2011, 9, 153–168. [Google Scholar] [CrossRef] [Green Version]
  14. Noss, R.F. Indicators for monitoring biodiversity: A hierarchical approach. Conserv. Biol. 1990, 4, 355–364. [Google Scholar] [CrossRef]
  15. Jarzyna, M.A.; Jetz, W. Detecting the multiple facets of biodiversity. Trends Ecol. Evol. 2016, 31, 527–538. [Google Scholar] [CrossRef]
  16. Petchey, O.L.; Gaston, K.J. Functional diversity (FD), species richness and community composition. Ecol. Lett. 2002, 5, 402–411. [Google Scholar] [CrossRef]
  17. Cardoso, P.; Rigal, F.; Borges, P.A.; Carvalho, J.C. A new frontier in biodiversity inventory: A proposal for estimators of phylogenetic and functional diversity. Methods Ecol. Evol. 2014, 5, 452–461. [Google Scholar] [CrossRef] [Green Version]
  18. Baselga, A. Partitioning the turnover and nestedness components of beta diversity. Glob. Ecol. Biogeogr. 2010, 19, 134–143. [Google Scholar] [CrossRef]
  19. Epele, L.B.; Brand, C.; Miserendino, M.L. Ecological drivers of alpha and beta diversity of freshwater invertebrates in arid and semiarid Patagonia (Argentina). Sci. Total Environ. 2019, 678, 62–73. [Google Scholar] [CrossRef]
  20. Cardoso, P.; Rigal, F.; Carvalho, J.C.; Fortelius, M.; Borges, P.A.; Podani, J.; Schmera, D. Partitioning taxon, phylogenetic and functional beta diversity into replacement and richness difference components. J. Biogeogr. 2014, 41, 749–761. [Google Scholar] [CrossRef] [Green Version]
  21. Legendre, P. Interpreting the replacement and richness difference components of beta diversity. Glob. Ecol. Biogeogr. 2014, 23, 1324–1334. [Google Scholar] [CrossRef]
  22. Dίaz, S.; Cabido, M. Vive la différence: Plant functional diversity matters to ecosystem processes. Trends Ecol. Evol. 2001, 16, 646–655. [Google Scholar] [CrossRef]
  23. Villéger, S.; Grenouillet, G.; Brosse, S. Decomposing functional β-diversity reveals that low functional β-diversity is driven by low functional turnover in E uropean fish assemblages. Glob. Ecol. Biogeogr. 2013, 22, 671–681. [Google Scholar] [CrossRef]
  24. Villéger, S.; Novack-Gottshall, P.M.; Mouillot, D. The multidimensionality of the niche reveals functional diversity changes in benthic marine biotas across geological time. Ecol. Lett. 2011, 14, 561–568. [Google Scholar] [CrossRef]
  25. Izco, J.; Amigo, J. Syntaxonomical diversity: Relationships between syntaxa richness and area. Plant Biosyst. Int. J. Deal. Asp. Plant. Biol. 2011, 145, 38–45. [Google Scholar] [CrossRef]
  26. Redžić, S. Syntaxonomic diversity as an indicator of ecological diversity—case study Vranica Mts in the Central Bosnia. Biologia 2007, 62, 173–184. [Google Scholar] [CrossRef]
  27. Lachavanne, J.-B. The influence of accelerated eutrophication on the macrophytes of Swiss lakes: Abundance and distribution: With 2 figures in the text. Int. Ver. Theor. Angew. Limnol. Verh. 1985, 22, 2950–2955. [Google Scholar] [CrossRef]
  28. Murphy, K. Plant communities and plant diversity in softwater lakes of northern Europe. Aquat. Bot. 2002, 73, 287–324. [Google Scholar] [CrossRef]
  29. Rørslett, B. Principal determinants of aquatic macrophyte richness in northern European lakes. Aquat. Bot. 1991, 39, 173–193. [Google Scholar] [CrossRef]
  30. Penning, W.E.; Dudley, B.; Mjelde, M.; Hellsten, S.; Hanganu, J.; Kolada, A.; van den Berg, M.; Poikane, S.; Phillips, G.; Willby, N. Using aquatic macrophyte community indices to define the ecological status of European lakes. Aquat. Ecol. 2008, 42, 253–264. [Google Scholar] [CrossRef]
  31. Penning, W.E.; Mjelde, M.; Dudley, B.; Hellsten, S.; Hanganu, J.; Kolada, A.; Van Den Berg, M.; Poikane, S.; Phillips, G.; Willby, N. Classifying aquatic macrophytes as indicators of eutrophication in European lakes. Aquat. Ecol. 2008, 42, 237–251. [Google Scholar] [CrossRef]
  32. Søndergaard, M.; Johansson, L.S.; Lauridsen, T.L.; Jørgensen, T.B.; Liboriussen, L.; Jeppesen, E. Submerged macrophytes as indicators of the ecological quality of lakes. Freshw. Biol. 2010, 55, 893–908. [Google Scholar] [CrossRef]
  33. Chappuis, E.; Ballesteros, E.; Gacia, E. Distribution and richness of aquatic plants across E urope and M editerranean countries: Patterns, environmental driving factors and comparison with total plant richness. J. Veg. Sci. 2012, 23, 985–997. [Google Scholar] [CrossRef]
  34. Bolpagni, R.; Laini, A.; Stanzani, C.; Chiarucci, A. Aquatic plant diversity in Italy: Distribution, drivers and strategic conservation actions. Front. Plant Sci. 2018, 9, 116. [Google Scholar] [CrossRef] [Green Version]
  35. Chappuis, E.; Gacia, E.; Ballesteros, E. Environmental factors explaining the distribution and diversity of vascular aquatic macrophytes in a highly heterogeneous Mediterranean region. Aquat. Bot. 2014, 113, 72–82. [Google Scholar] [CrossRef]
  36. García-Girón, J.; Fernández-Aláez, M.; Fernández-Aláez, C. Redundant or complementary? Evaluation of different metrics as surrogates of macrophyte biodiversity patterns in Mediterranean ponds. Ecol. Indic. 2019, 101, 614–622. [Google Scholar] [CrossRef]
  37. Zervas, D.; Tsiaoussi, V.; Tsiripidis, I. HeLM: A macrophyte-based method for monitoring and assessment of Greek lakes. Environ. Monit. Assess. 2018, 190, 326. [Google Scholar] [CrossRef] [PubMed] [Green Version]
  38. Klein Tank, A.; Wijngaard, J.; Können, G.; Böhm, R.; Demarée, G.; Gocheva, A.; Mileta, M.; Pashiardis, S.; Hejkrlik, L.; Kern-Hansen, C. Daily dataset of 20th-century surface air temperature and precipitation series for the European Climate Assessment. Int. J. Climatol. J. R. Meteorol. Soc. 2002, 22, 1441–1453. [Google Scholar] [CrossRef]
  39. Lyche Solheim, A.; Persson, J.; Austnes, K.; Moe, J.; Kampa, E.; Stein, U.; Feher, J.; Kristensen, P. European Freshwater Ecosystem Assessment: Cross-Walk between the Water Framework Directive and Habitats Directive Types, Status and Pressures. ETC 2015, 176. Available online: http://icm.eionet.europa.eu/ETC_Reports/FreshwaterEcosystemAssessmentReport_201509 (accessed on 21 October 2019).
  40. Mavromati, E.; Kagalou, I.; Kemitzoglou, D.; Apostolakis, A.; Seferlis, M.; Tsiaoussi, V. Relationships among land use patterns, hydromorphological features and physicochemical parameters of surface waters: WFD lake monitoring in Greece. Environ. Process. 2018, 5, 139–151. [Google Scholar] [CrossRef]
  41. Zervas, D.; Tsiaoussi, V.; Kallimanis, A.S.; Dimopoulos, P.; Tsiripidis, I. Exploring the relationships between aquatic macrophyte functional traits and anthropogenic pressures in freshwater lakes. Acta Oecologica 2019, 99, 103443. [Google Scholar] [CrossRef]
  42. Palmer, M.; Bell, S.; Butterfield, I. A botanical classification of standing waters in Britain: Applications for conservation and monitoring. Aquat. Conserv. Mar. Freshw. Ecosyst. 1992, 2, 125–143. [Google Scholar] [CrossRef]
  43. Cardoso, A.; Solimini, A.; Premazzi, G.; Carvalho, L.; Lyche, A.; Rekolainen, S. Phosphorus reference concentrations in European lakes. In Shallow Lakes in a Changing World; Springer: Berlin/Heidelberg, Germany, 2007; pp. 3–12. [Google Scholar]
  44. Kagalou, I.; Ntislidou, C.; Latinopoulos, D.; Kemitzoglou, D.; Tsiaoussi, V.; Bobori, D.C. Setting the Phosphorus Boundaries for Greek Natural Shallow and Deep Lakes for Water Framework Directive Compliance. Water 2021, 13, 739. [Google Scholar] [CrossRef]
  45. Wetzel, R.G. Limnology: Lake and River Ecosystems; Elsevier Academic Press: Amsterdam, The Netherlands, 2001. [Google Scholar]
  46. Ntislidou, C.; Lazaridou, M.; Tsiaoussi, V.; Bobori, D.C. A new multimetric macroinvertebrate index for the ecological assessment of Mediterranean lakes. Ecol. Indic. 2018, 93, 1020–1033. [Google Scholar] [CrossRef]
  47. De Hoyos, C.; Catalan, J.; Dörflinger, G.; Ferreira, J.; Kemitzoglou, D.; Laplace-Treyture, C.; López, P.; Marchetto, A.; Mihail, O.; Morabito, G. Mediterranean Lake Phytoplankton Ecological Assessment Methods; Water Framework Directive Intercalibration Technical Report; Joint Research Centre Technical Reports; Joint Research Centre: Ispra, Italy, 2014. [Google Scholar]
  48. Pahissa, J.; Catalan, J.; Morabito, G.; Dörflinger, G.; Ferreira, J.; Laplace-Treyture, C.; Gîrbea, R.; Marchetto, A.; Polykarpou, P.; de Hoyos, C. Benefits and limitations of an intercalibration of phytoplankton assessment methods based on the Mediterranean GIG reservoir experience. Sci. Total Environ. 2015, 538, 169–179. [Google Scholar] [CrossRef] [PubMed]
  49. Vollenweider, R.; Kerekes, J. Eutrophication of Waters. In Monitoring, Assessment and Control; Organization for Economic Co-Operation and Development (OECD): Paris, France, 1982; Volume 156. [Google Scholar]
  50. Schleuter, D.; Daufresne, M.; Massol, F.; Argillier, C. A user’s guide to functional diversity indices. Ecol. Monogr. 2010, 80, 469–484. [Google Scholar] [CrossRef] [Green Version]
  51. Villéger, S.; Mason, N.W.; Mouillot, D. New multidimensional functional diversity indices for a multifaceted framework in functional ecology. Ecology 2008, 89, 2290–2301. [Google Scholar] [CrossRef] [PubMed] [Green Version]
  52. Hsieh, T.; Ma, K.; Chao, A. iNEXT: An R package for rarefaction and extrapolation of species diversity (Hill numbers). Methods Ecol. Evol. 2016, 7, 1451–1456. [Google Scholar] [CrossRef]
  53. Chao, A.; Chiu, C.-H.; Jost, L. Unifying species diversity, phylogenetic diversity, functional diversity, and related similarity and differentiation measures through Hill numbers. Annu. Rev. Ecol. Evol. Syst. 2014, 45, 297–324. [Google Scholar] [CrossRef] [Green Version]
  54. Oksanen, J.; Blanchet, F.; Friendly, M.; Kindt, R.; Legendre, P.; McGlinn, D.; Minchin, P.; O’Hara, R.; Simpson, G.; Solymos, P.; et al. Vegan: Community Ecology Package. R Package Version 2.4–6. 2018. Available online: http://cran.nexr.com/web/packages/vegan/vegan.pdf (accessed on 9 October 2019).
  55. Zervas, D.; Tsiripidis, I.; Bergmeier, E.; Tsiaoussi, V. A phytosociological survey of aquatic vegetation in the main freshwater lakes of Greece. Veg. Classif. Surv. 2020, 1, 53. [Google Scholar] [CrossRef]
  56. Botta-Dukát, Z. Rao’s quadratic entropy as a measure of functional diversity based on multiple traits. J. Veg. Sci. 2005, 16, 533–540. [Google Scholar] [CrossRef]
  57. Laliberté, E.; Legendre, P. A distance-based framework for measuring functional diversity from multiple traits. Ecology 2010, 91, 299–305. [Google Scholar] [CrossRef] [PubMed]
  58. Podani, J. Extending Gower’s general coefficient of similarity to ordinal characters. Taxon 1999, 48, 331–340. [Google Scholar] [CrossRef]
  59. Laliberté, E.; Legendre, P.; Shipley, B.; Laliberté, M.E. Package ‘FD’. Measuring Functional Diversity from Multiple Traits, and Other Tools for Functional Ecology. 2014. Available online: https://cran.r-project.org/web/packages/FD/FD.pdf (accessed on 9 October 2019).
  60. Ensing, D.J.; Pither, J. A novel multiple-site extension to pairwise partitioned taxonomic beta diversity. Ecol. Complex. 2015, 21, 62–69. [Google Scholar] [CrossRef]
  61. Baselga, A.; Orme, C.D.L. betapart: An R package for the study of beta diversity. Methods Ecol. Evol. 2012, 3, 808–812. [Google Scholar] [CrossRef]
  62. Chambers, J.M.; Freeny, A.E.; Heiberger, R.M. Analysis of variance; designed experiments. In Statistical Models in S; Routledge: London, UK, 2017; pp. 145–193. [Google Scholar]
  63. Tukey, J.W. Comparing individual means in the analysis of variance. Biometrics 1949, 5, 99–114. [Google Scholar] [CrossRef]
  64. R Core Team. R: A Language and Environment for Statistical Computing; R Foundation for Statistical Computing: Vienna, Austria, 2019. [Google Scholar]
  65. Ting, W.; Shiqiang, Z. Study on linear correlation coefficient and nonlinear correlation coefficient in mathematical statistics. Stud. Math. Sci. 2011, 3, 58–63. [Google Scholar]
  66. Grime, J.P. Plant Strategies, Vegetation Processes, and Ecosystem Properties; John Wiley & Sons: Hoboken, NJ, USA, 2006. [Google Scholar]
  67. Toivonen, H.; Huttunen, P. Aquatic macrophytes and ecological gradients in 57 small lakes in southern Finland. Aquat. Bot. 1995, 51, 197–221. [Google Scholar] [CrossRef]
  68. Alahuhta, J.; Kanninen, A.; Vuori, K.-M. Response of macrophyte communities and status metrics to natural gradients and land use in boreal lakes. Aquat. Bot. 2012, 103, 106–114. [Google Scholar] [CrossRef]
  69. Kolada, A.; Hellsten, S.; Søndergaard, M.; Mjelde, M.; Dudley, B.; Van Geest, G.; Goldsmith, B.; Davidson, T.; Bennion, H.; Noges, P. Report on the Most Suitable Lake Macrophyte Based Assessment Methods for Impacts of Eutrophication and Water Level Fluctuations; Wiser Deliverable D3.2-3; Institute of Environmental Protection: Warsaw, Poland, 2011. [Google Scholar]
  70. Jeppesen, E.; Søndergaard, M.; Jensen, J.P.; Lauridsen, T.L.; Howard-Williams, C.; Kelly, D. Recovery from eutrophication. In Freshwater Management; Springer: Berlin/Heidelberg, Germany, 2003; pp. 135–175. [Google Scholar]
  71. Romo, S.; Miracle, M.R.; Villena, M.J.; Rueda, J.; Ferriol, C.; Vicente, E. Mesocosm experiments on nutrient and fish effects on shallow lake food webs in a Mediterranean climate. Freshw. Biol. 2004, 49, 1593–1607. [Google Scholar] [CrossRef] [Green Version]
  72. Badosa, A.; Boix, D.; Brucet, S.; López-Flores, R.; Gascón, S.; Quintana, X.D. Zooplankton taxonomic and size diversity in Mediterranean coastal lagoons (NE Iberian Peninsula): Influence of hydrology, nutrient composition, food resource availability and predation. Estuar. Coast. Shelf Sci. 2007, 71, 335–346. [Google Scholar] [CrossRef]
  73. Romo, S.; Villena, M.-J. Phytoplankton strategies and diversity under different nutrient levels and planktivorous fish densities in a shallow Mediterranean lake. J. Plankton Res. 2005, 27, 1273–1286. [Google Scholar] [CrossRef] [Green Version]
  74. Townsend, C.R.; Scarsbrook, M.R.; Dolédec, S. The intermediate disturbance hypothesis, refugia, and biodiversity in streams. Limnol. Oceanogr. 1997, 42, 938–949. [Google Scholar] [CrossRef] [Green Version]
  75. Alahuhta, J.; Heino, J. Spatial extent, regional specificity and metacommunity structuring in lake macrophytes. J. Biogeogr. 2013, 40, 1572–1582. [Google Scholar] [CrossRef]
  76. Mikulyuk, A.; Sharma, S.; Van Egeren, S.; Erdmann, E.; Nault, M.E.; Hauxwell, J. The relative role of environmental, spatial, and land-use patterns in explaining aquatic macrophyte community composition. Can. J. Fish. Aquat. Sci. 2011, 68, 1778–1789. [Google Scholar] [CrossRef]
  77. Depew, D.C.; Houben, A.J.; Guildford, S.J.; Hecky, R.E. Distribution of nuisance Cladophora in the lower Great Lakes: Patterns with land use, near shore water quality and dreissenid abundance. J. Great Lakes Res. 2011, 37, 656–671. [Google Scholar] [CrossRef]
  78. Kane, D.D.; Conroy, J.D.; Richards, R.P.; Baker, D.B.; Culver, D.A. Re-eutrophication of Lake Erie: Correlations between tributary nutrient loads and phytoplankton biomass. J. Great Lakes Res. 2014, 40, 496–501. [Google Scholar] [CrossRef]
  79. Alahuhta, J.; Kosten, S.; Akasaka, M.; Auderset, D.; Azzella, M.M.; Bolpagni, R.; Bove, C.P.; Chambers, P.A.; Chappuis, E.; Clayton, J. Global variation in the beta diversity of lake macrophytes is driven by environmental heterogeneity rather than latitude. J. Biogeogr. 2017, 44, 1758–1769. [Google Scholar] [CrossRef]
  80. Qian, H.; Ricklefs, R.E. A latitudinal gradient in large-scale beta diversity for vascular plants in North America. Ecol. Lett. 2007, 10, 737–744. [Google Scholar] [CrossRef]
  81. Soininen, J.; Lennon, J.J.; Hillebrand, H. A multivariate analysis of beta diversity across organisms and environments. Ecology 2007, 88, 2830–2838. [Google Scholar] [CrossRef]
  82. Pereira, S.A.; Trindade, C.R.T.; Albertoni, E.F.; Palma-Silva, C. Aquatic macrophytes as indicators of water quality in subtropical shallow lakes, Southern Brazil. Acta Limnol. Bras. 2012, 24, 52–63. [Google Scholar] [CrossRef] [Green Version]
  83. Pereto, S.S.; Cervi, A.C.; Bona, C.; Padial, A.A. Aquatic macrophyte community varies in urban reservoirs with different degrees of eutrophication. Acta Limnol. Bras. 2014, 26, 129–142. [Google Scholar]
  84. Kraft, N.J.; Comita, L.S.; Chase, J.M.; Sanders, N.J.; Swenson, N.G.; Crist, T.O.; Stegen, J.C.; Vellend, M.; Boyle, B.; Anderson, M.J. Disentangling the drivers of β diversity along latitudinal and elevational gradients. Science 2011, 333, 1755–1758. [Google Scholar] [CrossRef] [Green Version]
  85. Cardinale, B.J.; Palmer, M.A.; Collins, S.L. Species diversity enhances ecosystem functioning through interspecific facilitation. Nature 2002, 415, 426–429. [Google Scholar] [CrossRef]
  86. Hooper, D.U.; Chapin, F., III; Ewel, J.J.; Hector, A.; Inchausti, P.; Lavorel, S.; Lawton, J.H.; Lodge, D.; Loreau, M.; Naeem, S. Effects of biodiversity on ecosystem functioning: A consensus of current knowledge. Ecol. Monogr. 2005, 75, 3–35. [Google Scholar] [CrossRef]
  87. Elmqvist, T.; Folke, C.; Nyström, M.; Peterson, G.; Bengtsson, J.; Walker, B.; Norberg, J. Response diversity, ecosystem change, and resilience. Front. Ecol. Environ. 2003, 1, 488–494. [Google Scholar] [CrossRef]
  88. Mori, A.S.; Furukawa, T.; Sasaki, T. Response diversity determines the resilience of ecosystems to environmental change. Biol. Rev. 2013, 88, 349–364. [Google Scholar] [CrossRef] [PubMed]
  89. Lavorel, S. Ecological diversity and resilience of Mediterranean vegetation to disturbance. Divers. Distrib. 1999, 5, 3–13. [Google Scholar] [CrossRef]
  90. Mason, N.W.; de Bello, F.; Mouillot, D.; Pavoine, S.; Dray, S. A guide for using functional diversity indices to reveal changes in assembly processes along ecological gradients. J. Veg. Sci. 2013, 24, 794–806. [Google Scholar] [CrossRef]
  91. Mouchet, M.A.; Villéger, S.; Mason, N.W.; Mouillot, D. Functional diversity measures: An overview of their redundancy and their ability to discriminate community assembly rules. Funct. Ecol. 2010, 24, 867–876. [Google Scholar] [CrossRef]
  92. Arthaud, F.; Vallod, D.; Robin, J.; Bornette, G. Eutrophication and drought disturbance shape functional diversity and life-history traits of aquatic plants in shallow lakes. Aquat. Sci. 2012, 74, 471–481. [Google Scholar] [CrossRef]
  93. Fu, H.; Zhong, J.; Fang, S.; Hu, J.; Guo, C.; Lou, Q.; Yuan, G.; Dai, T.; Li, Z.; Zhang, M. Scale-dependent changes in the functional diversity of macrophytes in subtropical freshwater lakes in south China. Sci. Rep. 2017, 7, 1–12. [Google Scholar] [CrossRef]
  94. Zhang, M.; García Molinos, J.; Zhang, X.; Xu, J. Functional and taxonomic differentiation of macrophyte assemblages across the Yangtze River floodplain under human impacts. Front. Plant Sci. 2018, 9, 387. [Google Scholar] [CrossRef] [PubMed] [Green Version]
  95. Walker, B.; Kinzig, A.; Langridge, J. Plant attribute diversity, resilience, and ecosystem function: The nature and significance of dominant and minor species. Ecosystems 1999, 2, 95–113. [Google Scholar] [CrossRef]
  96. Siefert, A.; Ravenscroft, C.; Weiser, M.D.; Swenson, N.G. Functional beta-diversity patterns reveal deterministic community assembly processes in eastern N orth A merican trees. Glob. Ecol. Biogeogr. 2013, 22, 682–691. [Google Scholar] [CrossRef]
  97. Fu, H.; Yuan, G.; Jeppesen, E.; Ge, D.; Li, W.; Zou, D.; Huang, Z.; Wu, A.; Liu, Q. Local and regional drivers of turnover and nestedness components of species and functional beta diversity in lake macrophyte communities in China. Sci. Total Environ. 2019, 687, 206–217. [Google Scholar] [CrossRef]
  98. Elo, M.; Alahuhta, J.; Kanninen, A.; Meissner, K.K.; Seppälä, K.; Mönkkönen, M. Environmental characteristics and anthropogenic impact jointly modify aquatic macrophyte species diversity. Front. Plant Sci. 2018, 9, 1001. [Google Scholar] [CrossRef]
  99. Salgado, J.; Sayer, C.D.; Brooks, S.J.; Davidson, T.A.; Goldsmith, B.; Patmore, I.R.; Baker, A.G.; Okamura, B. Eutrophication homogenizes shallow lake macrophyte assemblages over space and time. Ecosphere 2018, 9, e02406. [Google Scholar] [CrossRef]
  100. Salgado, J.; Sayer, C.D.; Brooks, S.J.; Davidson, T.A.; Okamura, B. Eutrophication erodes inter-basin variation in macrophytes and co-occurring invertebrates in a shallow lake: Combining ecology and palaeoecology. J. Paleolimnol. 2018, 60, 311–328. [Google Scholar] [CrossRef] [Green Version]
Figure 1. Map of the surveyed freshwater lakes in Greece. See Table 1 for lake names.
Water 13 02281 g001
Figure 2. Rarefaction curves of species richness (SpR), Shannon index values (Shan), and Simpson index values (Simp) for the 18 lakes (see Table 1 for lake codes) divided into four trophic groups (low: low trophic group; mod: moderate trophic group; high: high trophic group; v. high: very high trophic group). The solid part of the lines predicts the rate of accumulation of the diversity metric values in each lake with increasing number of sampling units (relevés) by interpolation of data, while the dashed part of the lines continues the same predictions by extrapolation. The curve of the Yliki lake (low trophic group) is hardly visible because of its small length (small number of relevés) and its overlap with the curves of other lakes.
Water 13 02281 g002
Figure 3. Mean species richness, Shannon index values, Simpson index values, syntaxonomic richness, functional richness, and Rao’s quadratic entropy in lake transects, grouped according to annual mean total phosphorus (TP) content in each lake’s water column (low, moderate, high and very high trophic groups). Standard error bars for all mean values are given. One-way ANOVA results (degrees of freedom, F statistic, and p-value) for each diversity metric are presented in each graph’s headline. Statistically significant differences of diversity means in consecutive trophic levels, according to TukeyHSD multiple comparison for 95% family-wise confidence level, are indicated by different alphabet letters among a, b, c and d.
Water 13 02281 g003
Figure 4. Mean taxonomic and functional beta diversity values and their partitions, turnover and nestedness, in lake transects, grouped according to annual mean total phosphorus (TP) content in each lake’s water column (low, moderate, high and very high trophic groups). Standard error bars for all mean values are given. One-way ANOVA results (degrees of freedom, F statistic, and p-value) for each diversity metric are presented in each graph’s headline. Statistically significant differences of diversity means in consecutive trophic levels, according to TukeyHSD multiple comparison for 95% family-wise confidence level, are indicated by different alphabet letters among a, b, c and d.
Water 13 02281 g004
Table 1. Overview of the geographical, morphological and climatic characteristics of the studied lakes, their survey period and number of records. Asterisks (*) mark transboundary lakes, for which the characteristics refer to their part on Greek territory. Climatic characteristics have been collected by the European Climate Assessment & Dataset [38]. Average annual temperature and annual precipitation values have been calculated on the basis of available data during the period 1995–2005. Climate zone codes according to Köppen-Geiger climate classification system: Csa, Mediterranean hot summer climate; Csb, Mediterranean warm/cool summer climate; Cfa, Warm temperate humid hot summer climate; Cfb, Warm temperate humid warm/cool summer climate.
NoLakeCodeCentroid LongitudeCentroid LatitudeMean Altitude (masl)Area (km2)Mean-Max Depth (m)Aver. Annual Temp. (°C)Annual Precipitation (mm)Climate ZoneSurvey PeriodNo of Transects/Relevés Recorded
1VolviVOL23.4736840.677403775.513–2815.6458CsaAugust 201620/317
2Doirani *DOI22.7648721.2385314630.74–814.3453CfaAugust 201610/173
3VegoritidaVEG21.7844240.7446451746.525–5211.5530CfbJune 201620/509
4PetresPET21.6961240.72604573123–611.5562CfbJune 201616/227
5ZazariZAZ21.54690406250760035–811.5595CfbJuly 201612/124
6ChimaditidaCHI21.5658540.592585929.11–511.5595CfbJuly 201616/239
7KastoriaKAS21.3008040.5226962731.24–911.4697CfbAugust 201420/312
8Megali Prespa *MEP20.9887540.8505784539.4~16–2610.2750CfbAugust 201512/206
9Mikri Prespa *MIP21.1012840.7703185046.74–1010.2728CfbAugust 201515/294
10PamvotidaPAM20.8851839.6627046922.65–1213.21081CsaSeptember 201320/74
11AmvrakiaAMV21.1794138.751132013.522–5417.3930CsaJune 201420/331
12OzerosOZE21.2229438.653582410.54–717.2931CsaJune 201420/178
13LysimachiaLYS21.3766538.5623415134–817.1909CsaJune 201420/215
14TrichonidaTRI21.5481338.573091693.430–5617.1902CsaJuly 201520/792
15ParalimniPAR23.3528538.458623710.65–817.5527CsaJuly 201420/503
16YlikiYLI23.2797338.397647522.522–3417.5527CsaJuly 201420/29
17FeneosFEN22.2851337.928618720.510–2911.5862CsbAugust 201410/373
18KournaKOU24.2777635.33180160.6~15–2218.2831CsaMay 201414/794
Table 2. Overview of the non-linear correlation analysis results among all diversity metrics (SpeRich: Species richness; Shan: Shannon index; Simp: Simpson index; Syntax: Syntaxonomic richness; FunRich: Functional richness; Rao: Rao’s quadratic entropy; BetOver: Overall taxonomic beta diversity index; BetTurn: Taxonomic beta turnover; BetNest: Taxonomic beta nestedness; FunBeta: Overall functional beta diversity index; FunTurn: Functional beta turnover; FunNest: Functional beta nestedness) and total phosphorus content (TP) in lakes. All paired-metric correlations were found statistically significant (adjusted p < 0.05). Table cells contain the nonlinear correlation coefficient (R) of each metric-pair and gray cells indicate pair-relations with estimated correlations above 0.8.
TPSpeRichShanSimpSyntaxFunRichRaoBetOverBetTurnBetNestFunBetaFunTurnFunNest
TP1
SpeRich0.331
Shan0.380.861
Simp0.410.730.961
Syntax0.340.800.810.741
FunRich0.390.730.630.50.541
Rao0.580.490.700.780.430.331
BetOver0.520.120.260.290.240.210.311
BetTurn0.710.290.440.440.370.330.390.871
BetNest0.790.340.440.450.360.360.460.730.961
FunBeta0.710.230.340.400.290.170.310.720.750.631
FunTurn0.790.270.320.280.410.150.380.820.680.580.721
FunNest0.750.130.310.330.300.180.390.650.760.680.710.771
Publisher’s Note: MDPI stays neutral with regard to jurisdictional claims in published maps and institutional affiliations.

