Article

Membrane Filtration Opportunities for the Treatment of Black Liquor in the Paper and Pulp Industry

by
Olenka Jibaja Valderrama
1,
Karina Listiarini Zedda
2 and
Svetlozar Velizarov
1,*
1
LAQV-REQUIMTE, Department of Chemistry, NOVA School of Science and Technology, Universidade Nova de Lisboa, P-2829-516 Caparica, Portugal
2
SUEZ Water Technologies and Solutions, D-06731 Bitterfeld-Wolfen, Germany
*
Author to whom correspondence should be addressed.
Water 2021, 13(16), 2270; https://doi.org/10.3390/w13162270
Submission received: 7 July 2021 / Revised: 12 August 2021 / Accepted: 17 August 2021 / Published: 19 August 2021

Abstract

:
Black liquor is a highly alkaline liquid by-product of the kraft pulping process, rich in organic molecules (hemicelluloses, lignin, and organic acids) and inorganic pulping chemicals such as sodium salts and sulphur-containing compounds. The release of this wastewater without further treatment could have serious environmental and financial implications. Therefore, a costly treatment process is used nowadays. Nanofiltration has been studied in the last few years as a promising alternative to recycle the cooking chemicals required for the separation of lignin and cellulose, but the development of pH-stable membranes with the potential to operate at industrial scales is fundamental in order to make this possible. In this study, the filtration performance of two in-house made membranes is evaluated and compared with a commercial NF membrane to determine the viability of their use for the treatment of black liquor. For this purpose, filtration experiments with simulated black liquor were performed. We identified that Membrane A has the higher potential for this application due to its competitive permeate flux (ca. 24 L m−2 h−1 at a trans-membrane pressure of 21.5 bar), and high rejection of organic components and salts from the cooking liquor (on average, 92.50% for the TOC, 84.10% for the CO32−, 88.70% for the sulphates, 73.21% for the Na+, and 99.99% for the Mg2+).

1. Introduction

Membrane technology is a promising approach for the improvement of process sustainability due to its potential use in the complete or partial replacement of conventional energy-intensive and highly contaminant separation processes, thereby making industrial operations cheaper and more ecofriendly. Nanofiltration (NF) is a membrane process that is gaining attention by virtue of its properties in between ultrafiltration (UF) and reverse osmosis (RO), offering advantages from both technologies. When compared with RO, higher permeate fluxes are possible at lower trans-membrane pressure gradients, which makes NF an attractive alternative from an industrial point of view. Additionally, the retention of multivalent salts and high molecular weight (MW) compounds is higher than in UF. For this reason, NF is already used in applications where a high level of selective separation between monovalent and divalent ions is required. There are numerous NF membranes available in the market, but only some of them can resist harsh operating conditions (such as extreme pH).
In the alkaline domain, the potential industrial applications for pH-stable NF membranes include wastewater from the textile industry, the Bayer process, the cleaning of the production equipment, and the paper and pulp industry. In all the cases, the objective is to separate NaOH from the solvents and recover it for its recirculation in the process. In the specific case of the paper and pulp industry, NF could be used to recover the caustic solution required for chemical pulping. The present study addresses this particular application, given the significant freshwater demand of this industry and the large ecological footprint of the methods currently available to treat black liquors.
The objective of the kraft pulping process is to dissolve lignin, which acts as a glue for the wood fibers. The wood chips and the pulping chemicals are placed together in a digester at high pressures and temperatures to promote the chemical reactions that solve the lignin in order to remove the cellulose-rich pulp, which is then used for the production of paper [1,2,3]. The waste stream generated in the digester is black liquor; it is formed by pulping liquors, lignin, and hemicelluloses. The black liquor exits the digester at temperatures of 80–95 °C and with a pH of around 12 [4]. The kraft pulping process generates ca. 10 tons of “weak” black liquor (15–17% of solids) for each ton of pulp produced [5].
Black liquor is a highly alkaline and viscous by-product of the kraft pulping process, rich in organic molecules (hemicelluloses, lignin, and organic acids) and inorganic pulping chemicals (sodium salts, sulphur compounds). Its characteristic black color is caused by the high content of kraft lignin [3,4]. Pulp and paper production is one of the most intensive industry in the world when it comes to freshwater consumption In order to minimize the continuous use of freshwater required to prepare the white liquors for the pulping process, black liquor can be recycled. Almost 99% of black liquor is used to produce energy through incineration. However, a highly energy-consuming concentration process is required. The remaining 1% is used to produce low-value products, such as wetting agents and glue. Nevertheless, lignin can be potentially utilized as a raw material to produce valuable products such as vanillin, vanillic acid, synthetic tannins, and polymer filters [4].
The conventional process to treat black liquor is represented in Figure 1a. It starts with a “weak” black liquor entering into the evaporators, where it is concentrated to obtain 80% of solids. The resulting “strong” black liquor is a slurry than can then be burned in a recovery boiler to obtain heat from the oxidation of the organic matter (lignin and hemicelluloses). This energy is recovered and the inorganic smelt is taken to a dissolving tank, adding water to obtain green liquor. Finally, the green liquor is pumped to a causticizer to obtain recycled white liquor, which contains NaOH, Na2S, and small amounts of Na2SO4 and Na2CO3. The main drawbacks of this method are the high energy costs and the generation of harmful substances.
On the other hand, filtration technologies are already used after the addition of an acid to precipitate the lignin in the black liquor. There is also evidence that hemicelluloses can be successfully extracted from black liquor using methanol, ethanol, or a precipitating agent made of dioxane and acetic acid. However, the acid precipitation of lignin or hemicelluloses requires the use of chemicals that are not necessary if membranes with lower molecular weight cut-off (MWCO) are considered; pressure-driven membrane processes do not require the addition of these chemicals [6,7,8,9,10,11].
The increasing interest in membrane processes in wastewater treatment is also partially due to the fact that they can potentially provide the opportunity to obtain a water quality that meets environmental regulations. The separation of valuable organic and inorganic compounds in black liquor has proven to be successful and energy-efficient in several studies using pressure driven membrane processes. More specifically, UF/NF combinations are a promising solution in wastewater with high amounts of organic material such as black liquor. In these cases, UF is used as a pre-treatment for NF [12]. A study determined that UF successfully retained 80% of the hemicellulose, 15% of the lignin, and 10% of the inorganic compounds. Membranes with an MWCO between 5 and 20 kDa are typically used for the separation of lignin and hemicelluloses [13]. Regardless of the MWCO of the membrane, the retention of the main inorganic elements that form the white liquor is almost zero during UF. Even though the specific MW of the hemicelluloses in the black liquor is hard to predict, they always take up more volume per molecule than lignin due to their tendency to entangle (making them easier to be removed using UF) [4]. The hemicelluloses in the UF retentate can be recovered and used to produce oxygen barrier films for food packaging [14].
The UF permeate, which mainly contains NaOH, water, low MW lignin, and low molecular mass sugars, was assumed as the feed for NF in the present study. A diagram of the process using membrane technologies is presented in Figure 1b. Nanofiltration can separate the remaining lignin from the white liquor, and the lignin-rich retentate can be treated for its revalorization [1,15]. The NF permeate is the recovered white liquor, which can be reused in the pulping process. Authors report better results when the feed of the NF is the permeate from UF instead of untreated black liquor (including higher permeate fluxes) [4,8,16]. High-performance membranes offer the flexibility to treat black liquor without major adjustment of the pH or temperature and to control the MW of the lignin with the membrane cut-off. The production cost per ton of lignin is approximately 33 euros [13,17].
In the present work, we propose an alternative to the conventional treatment of black liquor using membrane technologies. After evaluating the technical feasibility of using pH-stable NF membranes for this industrial application, we performed an economic evaluation study comparing the treatment of the black liquor using the conventional treatment (Scenario 1) with its partial replacement using membrane technologies (Scenario 2). For Scenario 2, we considered replacing 10% of the total plant production capacity of the recovery boilers and the evaporators by UF and NF treatment.
To determine the feasibility of using alkaline pH-stable NF membranes for this application, we performed filtration experiments with simulated black liquor prepared in-house assuming a UF pretreatment process. The objective was to obtain a permeate with a high concentration of white liquor which could be reused in the cooking process, and a low concentration of organics and salts that would otherwise make the process inefficient. On the other hand, the concentrated organics in the NF retentate (mainly lignin) could also be a valuable by-product used either as a biofuel or in the specialty chemicals market.

2. Materials and Methods

2.1. Membranes

Three nanofiltration membranes referred to as A, B, and C, respectively, were used in the nanofiltration experiments. Membranes A and B were both in-house made asymmetric membranes with high pH stability and a selective layer of hydrophilized polysulfone, supported on non-woven fabric. The selective layer was prepared by phase inversion, and its crosslinking was achieved using a recently patented thermal treatment procedure (Patent N° WO2020/002185) [18]. Membrane A was coated by hand and has a MWCO between 600 and 800 Da, while Membrane B was coated by machine and had a MWCO around 500 Da. The MWCO of these membranes was determined using a protocol described in the previous work of Hegoburu et al., in which a mixture of probe PEG molecules at MW different fractions was used [19]. Membrane C was a commercial polyethersulfone membrane with a MWCO in the range of 500–600 Da, which can be used in the entire pH range of 0–14 [14,20]. The thickness of Membrane A was 247 ± 6 μm and the thickness of Membrane B was 263 ± 3 μm. The average thickness was obtained by measuring the thickness of each membrane at 12 different points using a handheld digital thickness measurement device (Käfer, Germany). The difference in thickness between Membrane A and Membrane B can be explained based on the coagulation time. As Membrane A was manually coated, the coagulation time was higher and penetration of the membrane into the non-woven fabric is possible. On the other hand, Membrane B is coated with a machine and the coagulation time is not enough for penetration.
The micrographs of Membrane A and Membrane B obtained by SEM are presented in Figure 2 and Figure 3, respectively. Figure 2a–d presents the top section of Membrane A, revealing a homogeneous surface. Figure 2e–h are micrograms of the cross section of Membrane A that show the asymmetric structure of the membrane; the top thin layer is clearly denser, while the membrane bulk presents macrovoids. Figure 3a–d present the top section of Membrane B, revealing a more homogeneous surface and smaller pores compared to those of Membrane A. Figure 3e–h are micrograms of the cross section of Membrane B that show the denser top thin layer and the membrane bulk with its characteristic macrovoids.

2.2. Chemicals and Solutions

The different solutions used in this study were prepared by the addition of the required solutes in deionized water. The mass of the solutes was measured with a laboratory scale Mettler Toledo XS6002S. The list of chemicals required for the experiments is presented in Table 1.

2.3. Filtration Tests

2.3.1. Formulation of the Simulated Black Liquor

The composition of the black liquor is strongly dependent on many different factors, the most relevant being the source of the wood and the cooking conditions. The formulation of the simulated black liquor used for the experiments was determined as the average of the composition of black liquor from kraft pulping reported in the literature, as presented in Table 2.
Most of the inorganic components of the black liquor permeate through the pores of the UF membranes, regardless of the MWCO. The opposite happens to the hemicelluloses, which are mainly rejected independently of the MWCO. In contrast, given the size of the lignin molecules, the MWCO of the UF membranes has an important impact on the lignin concentration in the permeate. For this reason, the average composition of the lignin was initially considered as the one in the UF feed. After that, the concentration of lignin in the UF permeate could be calculated considering the size of the molecules and the pore size of the UF membrane. The size distribution of the lignin in an effluent at pH 11 is presented in Table 3.
If a MWCO of 10 kDa is used, the amount of lignin in the UF permeate would be approximately 15.20% of the lignin in the feed stream. Using this percentage and the average concentration of lignin calculated in Table 3, the amount of lignin in the UF permeate was 8.65 g L−1. Table 4 shows the composition of the simulated black liquor. In order to avoid risking the integrity of the pilot equipment due to the use of Na2S at high pH, the sulphate contribution of the feed was replaced by MgSO4.

2.3.2. Description of the Coupon Tester

The equipment used for the experiments was a custom-made in-house flat sheet crossflow filtration membrane coupon tester (CT), which was able to test 12 coupons simultaneously. The 12 cells were located in 2 benches, with 6 cells at each level. The set-up also had a plastic feed tank of 60 L, a high-pressure piston pump to generate the driving force, and a heat exchanger to fix the temperature of the system. The 12 filtration cells were arranged in a series configuration, so the feed of one cell was the retentate of the upstream adjacent cell. The retentate from the last cell and the permeate that have not been collected were then recirculated to the feed tank and mixed with the feed solution. The active area of each membrane coupon was 26.55 cm2. For each experiment, the solutes were added to the deionized water in the feed tank and recirculated to assure homogeneous mixing. Before the start of each experiment, the conductivity and the pH of the feed was measured and adjusted if needed. In operation, the concentration of each component was considered constant as the volume loss during the collection of permeate was negligible if compared to the feed volume. The feed flow rate was fixed using three valves and measured using a flow meter after the last filtration cell. A pressure gauge located in the retentate of the third cell of each bench, and the pressure drop across the coupons (below 0.05 bar) was considered irrelevant for the calculations. The coupon tester set-up is schematically represented in Figure 4.
For each set of experiments, new membrane coupons were used. A standard test took place before and after the filtration of black liquor in order to evaluate whether the performance of a tested membrane was affected by the black liquor filtration or not. In these standard tests, the feed solution was MgSO4 in a concentration of 4.30 g L−1. The pH of the feed was adjusted to seven using either 10% (w/w) NaOH or 10% (w/w) HCl. The operating pressure of the system at these standard test conditions was 10 bars and the temperature of the feed was 25 °C. The feed flow rate was 4 L min−1. The first permeate collection took place after 2 h running the system at full feed recirculation mode for stabilization and membrane compaction. The permeate samples were collected for one hour from each filtration cell during three successive experimental runs. Between each run there was a period of 30 min for stabilization of the system in which the permeate was not collected but recirculated. The total time for each experiment was at least 6 h. At the end of each standard test, the system was rinsed with deionized water several times until the conductivity washing solution was 5 μS cm−1 or lower.
The filtration experiments with simulated black liquor took place at conditions similar to those demanded in real operation. The feed temperature was 40 °C, the feed flow 4 L min−1 and the operating pressure 35 bars. After the experiments using black liquor, the system was cleaned in two steps. First, letting the coupon tester (CT) run using a solution of NaOH (pH 11) at 40 °C for one hour, and rinsing afterwards with deionized water several times until the conductivity was 5 μS cm−1 or lower. Then, running the system for 30 min with 30 L of a citric acid (2.5 % v/v) solution, and finally, rinsing the system until neutral pH was reached and the conductivity was 5 μS cm−1 or lower.

2.3.3. Membrane Performance Calculations

The permeate flux, J v , was calculated using Equation (S1). From the weighted mass of the permeate samples and with the assumption that the density of the permeate was equal to the density of water, the volume of the permeate sample, V, collected in a period of time, t, was determined. The area of each membrane coupon, A m , is 26.55 cm2. Additionally, the transmembrane pressure (TMP), the osmotic pressure difference, Δπ, and the osmotic pressure, were calculated using Equations (S2)–(S4).

2.3.4. Characterization of the Samples

Measurement of TOC: The determination of total organic carbon (TOC) in the feed and permeate samples was performed using analyzer multi N/C 3100 (Anatylik Jena, Jena. Germany) and the MultiWin software.
Determination of TIC: The determination of total inorganic carbon (TIC) in the feed and permeate samples was performed using analyzer multi N/C 3100 (Anatylik Jena, Jena. Germany) and the MultiWin software. The presence of inorganic carbon in the recycled white liquor decreases its efficiency in the cooking process. The total inorganic carbon is the sum of the concentrations of bicarbonate (HCO3) and carbonate (CO32) anions, carbon dioxide and carbonic acid (H2CO3). The concentration of each of these species depends on the pH of the solution. As the pH of the feed and the permeate samples is always between 11.5 to 12.5, the carbonate ion is the dominant specie. For this reason, the accurate determination of carbonate ions in the permeate was critical.
Measurement of sulphates: The measurement of sulphate anions in the feed and permeate samples was performed using a UV spectrophotometer (Hach Lange DR3900, Düsseldorf, Germany) able to measure wavelengths between 320 and 1100 nm. For this analytical method, ready-to-use cuvettes (LCK 153 Kits, Hach Lange Düsseldorf, Germany) were employed. The samples were diluted to reach a concentration between 40 and 150 mg L−1, and neutralized to a pH between 3 and 10 to be suitable for the equipment.
Measurement of Na+ and Mg2+: Mg2+ and Na+ in the feed and permeate samples were determined using ICP-OES (Varian Inc., Vista Pro, CA, USA) following standard ISO 11885:2007 (E).
Measurement of pH and conductivity: The rejection of MgSO4 and the overall salts rejection were calculated from the ratio of conductivities of permeate to feed samples instead of concentrations for calculating rejection (SI, Equation (S2)). For this purpose, a multimeter Schott Prolab 4000 (Schott Prolab 4000, Schott AG, Mainz, Germany) was used. The pH was measured to calculate the amount of OH and carbonates. The concentrations of OH in the feed and in the permeate were calculated from the pH of the samples. Subsequently, Equations (S5) and (S6) were used.

2.4. Economic Assessment

After studying the feasibility of using the in-house made Membranes A and B for the treatment of black liquor and the environmental impacts of the proposal, an economic assessment was required to evaluate the profitability of investing in replacing 10% of the total capacity of the evaporators and recovery boilers with UF and NF. To carry out these calculations, it is assumed that the project would be installed by a company in Sweden, given the high production of pulp in this country. For the currency conversion, 1 euro (EUR) was considered equivalent to 10.55 Swedish krona (SEK). The investment for the proposal is constituted of required fixed, tangible and intangible assets, and additional working capital needed to operate the membrane process. With the economic assessment developed in this study, it was possible to assess the project in financial terms and know the possibilities of success by investing in it. Capital expenditures (CAPEX) are all of the investments required to create benefits in the future by the implementation or upgrade of physical assets with a useful life longer than one year. They cover the design and construction of the infrastructure, including facilities and equipment [25,26]. The capital expenditures of this project consisted of the initial investment to implement the UF/NF membrane process that covered 10% of the total capacity of the factory to treat black liquor. In this case, this required capacity was 15 m3 of black liquor per hour. This study aimed to evaluate the profitability of investing in membranes compared to the profitability of staying in the current situation of the company, so the CAPEX were estimated only for the Scenario 2. The starting point were estimations made by Samco, a company that provides specialized engineering services for industrial applications [27,28]. For the final calculations, the estimation was adjusted to the required capacity of the membrane process and the quality of the feed to be treated. As black liquor is a highly alkaline wastewater with elevated temperatures, the system had to be designed to stand these rough operating conditions. Therefore, the CAPEX was three times the value of the capital cost of a membrane system designed for mild conditions. In addition to that, the lifetime of the membranes was assumed to be 1.5 years and the cost of their replacement was also reflected in the capital cost. Finally, the depreciation per year was 10% of the CAPEX.
An operating expenditure (OPEX) is the ongoing cost for running a product, business, or system. They include salaries and wages, accounting and office expenses, maintenance, repairs, supplies, and insurance [29]. The operational expenditures in Scenario 1 and Scenario 2 covered all of the costs involved in keeping the factory running (that is to say, both the direct and indirect manufacturing costs). The direct manufacturing costs are those strictly related to the production volume; they normally include the raw materials, chemicals and agents, energy, and maintenance. As the raw material was the black liquor produced and owned by the pulp industry, this cost was zero. In the case of the chemicals, the total cost was calculated considering the required amounts to process 1 m3 of black liquor. Table 5 presents the requirement of chemicals and their cost for the two scenarios subject of the study; these values were obtained from literature review and a chemical supplier. For Scenario 1, the cleaning chemicals would not be required.
In terms of the energy required for operation, the electricity consumption by the conventional system was obtained from the literature. The estimation was that 13 kWh is required to process 1 m3 of black liquor, which covered the evaporators, recovery boilers, causticizers, and lime kiln. This meant that the treatment of 100% of the black liquor in Scenario 1 would consume 13 kWh per m3 of wastewater. For Scenario 2, 135 m3 of black liquor would require the same energy to be processed. However, the remaining 15 m3 that are treated using membranes demanded a different amount of energy and it was calculated using Equations (S7) and (S8). The total energy requirement was then the sum of Wfeed and Wrecirc. It was assumed that each step (UF and NF) required one feed pump and eight recirculation pumps [21]. It was also considered for the calculations that the electricity cost in Sweden for industrial purposes is 0.0706 EUR/kWh. Finally, it was assumed that the energy consumption during maintenance is 10% of the one at regular operating conditions.
The indirect manufacturing costs normally refer to the distribution costs, rent, marketing, utilities, supplies, travel, communications, research and development and salaries and wages. As this study focused only on black liquor treatment, only salaries, wages, utilities, and supplies were considered for the economic analysis. An average wage of 31,800 SEK was taken into account for the operators and 41,900 SEK for the production supervisor. For the currency conversion, the exchange rate was 1 EUR = 10.55 SEK. From the wages, the legal benefits of each employee were calculated as 38.22% of their wage. These benefits included pension, health, workplace and unemployment insurances, and general salary tax.
For Scenario 1, the source of income was in the savings of electricity generated by the black liquor processed by the conventional wastewater treatment. For Scenario 2, the source of income was the sale of lignin recovered in the retentate of the membrane processes, assuming that the lignin rejection of the UF process using a 10 kDa membrane is 84.80% [33].
High-quality lignin can be used as a raw material for specialty chemicals, including pharmaceuticals [34]. In order to evaluate the profitability of the investment that Scenario 2 represented, three financial indicators were quantified: the net present value (NPV), the internal rate of return (IRR), and the payback period. The NPV was measured to study the increase of the company’s value resulting from the investment. It was calculated by the sum of the discounted cash flows of the investment. When the economic feasibility of only one investment at a particular rate of interest is studied, the project is profitable if the NPV ≥0. In case many alternatives of investment are compared, the most attractive option is the one with a higher NPV value at a previously defined interest rate [35,36]. The IRR of the investment was the rate which made the NPV equal zero. IRR was handy tool for the evaluation of this potential investment project: If the IRR is higher than the opportunity cost of capital, it is recommended to invest in that project [3,33,37].

3. Results and Discussion

3.1. Stability Tests

These experiments aimed at evaluating the feasibility of using NF membranes under the harsh operating conditions of black liquor treatment. Membranes A and B were designed to maintain their performance during operation in alkaline conditions, but filtration tests were required to validate if they were suitable for this specific application. The filtration tests in the coupon tester allowed the evaluation of the performance of the membranes under operation at a maximum pH of 12 and a maximum temperature of 40 °C. The stability of Membranes A, B, and C was studied performing standard tests with the MgSO4 solution before and after the filtration of black liquor and comparing the results. To carry out experiments with black liquor at higher pH and temperatures, static tests were necessary. After the first set of experiments with black liquor in the coupon tester, the used membranes were immersed for 16 h in a simulated black liquor at pH 14 and at 60 °C. The purpose of this experiment was to evaluate the performance of the membranes before and after the static test to determine if they kept their rejection and permeability.

3.1.1. Stability Tests before and after the Filtration of Black Liquor

The first important parameter to compare was the MgSO4 rejection of the membranes, which was calculated from the difference of the conductivities in the feed and the permeate samples before and after the filtration of black liquor. Figure 5a–c present the values obtained for the three membranes tested in the experiment. In the three cases, the MgSO4 rejection of the membrane increased after the permeation of black liquor. This phenomenon could be attributed to membrane fouling after the filtration of the simulated black liquor, where the organic particles accumulated in the surface of the membranes may have partially blocked the pores. However, since all possible foulants were not considered for the preparation of the simulated black liquor, experiments with a real black liquor will be performed in our future work in order to evaluate in detail their effect on fouling.
In Figure 5a, the high standard deviation of the MgSO4 rejection observed for Membrane A is caused by the distinctive low rejection (48.6%) measured in the second replicate trial. We attribute this difference to the fact that some coupons might need some extra time of compaction.
Figure 6a–c present the average permeate volumetric fluxes of the three membranes tested in the experiment. For Membranes A and C, the permeate flux decreased after the filtration of black liquor. This phenomenon could be attributed to membrane fouling, as the lignin can block the permeate entrance into the pores and limit the permeation of both MgSO4 and water. It is noticeable that, even though the flux decreases for Membranes A and C, the drop is more abrupt for Membrane C. This might be an indication that the in-house made Membrane A is more resistant to fouling than Membrane C. On the other hand, the permeate flux was increased for Membrane B after the filtration of black liquor. This was an interesting result, especially when combined with a higher rejection observed for this membrane in all the replicate trials. Membrane B is denser, which would mean a lower permeability and higher rejection to MgSO4 (>90%). However, its pores might have opened (increasing the permeate flux), when exposed to alkaline pH, but possibly not enough to compromise the MgSO4 rejection performance. In other words, water could have more easily permeated the membrane while bigger ions not. Even with the occurrence of fouling, this effect would be not as significant as for Membranes A and C due to their more open polymeric structure. Membranes with bigger pores are, in general, more prone to internal fouling since penetration/accumulation of more and greater particles can occur.

3.1.2. Stability Tests before and after Soaking the Coupons in Black Liquor

Figure 7 shows the rejection of MgSO4 for Membranes A, B, and C before and after immersion in black liquor at pH 14 and 60 °C. For Membrane A, the rejection decreased in all the cases. This result shows the obvious impact of high pH on the membrane’s pore size. However, the decrease of rejection was not the same in all the observations. In three of the six replicate trials, the overall rejection of the membrane remained over 80% after the immersion. In the rest of the coupons, the rejection of MgSO4 decreased to 60–80%. This could be attributed to the possible variability linked to the handmade coating. In contrast to that, the decrease in the MgSO4 rejection for Membrane B was not significant as can be observed in Figure 7b. The rejection after the immersion of the membranes in black liquor was always higher than 88% and the experimental points are much less spread compared to those for Membrane A. It could be assumed that this was due to the higher uniformity and reproducibility in the preparation of membrane B provided by machine coating.
Figure 8a shows that, in most of the cases, the average permeate flux of Membrane A increased after the immersion in black liquor at pH 14 and 60 °C in most of the replicate trials. This could be attributed to the fact that the pores of the membrane may have expanded at highly alkaline pH, thus allowing the permeation of more solution. Figure 8b presents an increase in the permeate flux of Membrane B after the immersion in black liquor at pH 14 and 60 °C. The average permeate flux for membrane B was lower and less affected, remaining almost unchanged after immersion in black liquor, which indicates its better stability to highly alkaline conditions.

3.2. Filtration Experiments

The following results correspond the filtration of the black liquor at 35 bars as the operating pressure. The first important parameter to compare was the overall rejection provided by the membranes (Figure 9), which was calculated from the difference of the conductivities in the feed and the permeate samples. The second important parameter to compare is the permeate flux of the membranes (Figure 10), which is an especially relevant indicator for industrial-scale applications, like the one considered in this case study. Membrane B always exhibited the lowest flux, which is on average 15.71 L m−2 h−1. Even the average permeate flux in Membrane A and Membrane C were lower if compared to what has been already reported in the literature, so our future work will focus on the filtration of real black liquor and at higher pressures [13,16].
In Figure 11, the pH of the permeate samples is presented. Considering the initial feed pH of 11.857, the first observation was that the permeate pH was higher than the one of the feed in all the replicates. The implications of these results are discussed in Section 3.4.

3.3. Rejection

The permeate samples were characterized to determine the contents of organic carbon (TOC), CO32, SO42, magnesium, sodium and OH. The average rejections of Membranes A, B, and C are shown in Table 6.
  • TOC: Taking into account that the feed TOC concentration was in average 4226.67 mg L−1, the average rejections of Membranes A, B, and C are shown in 
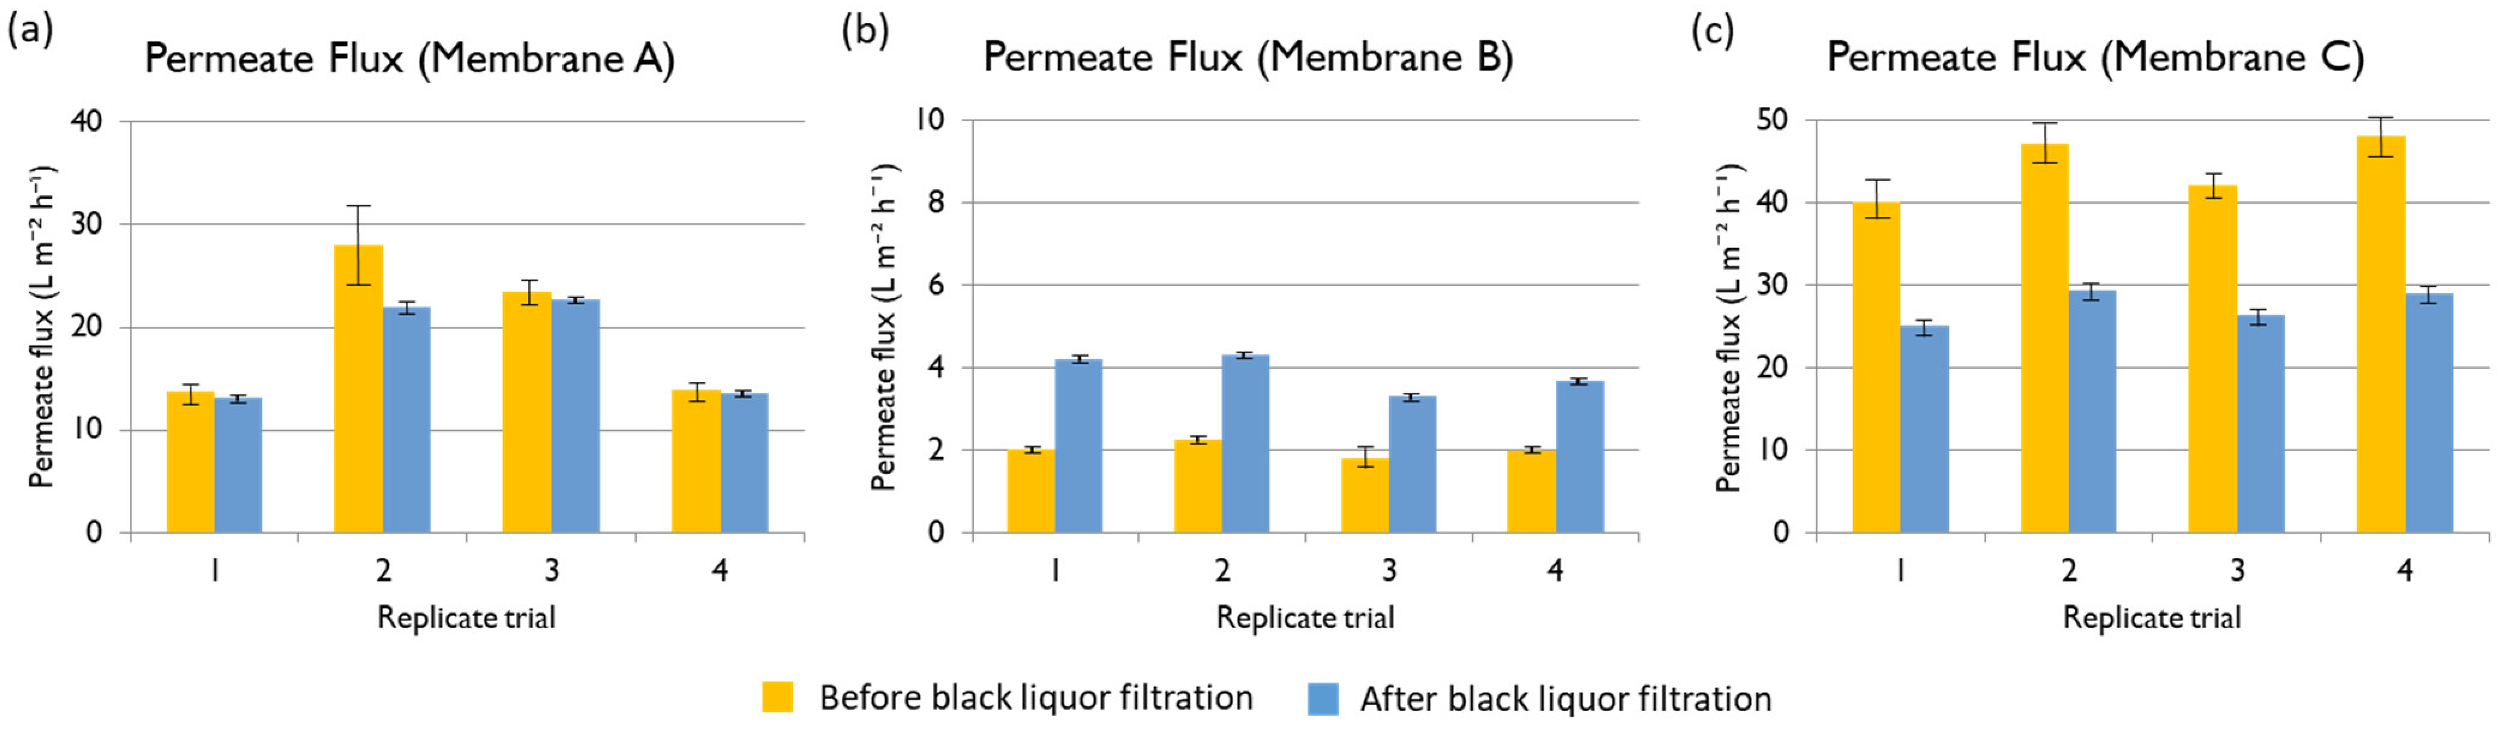
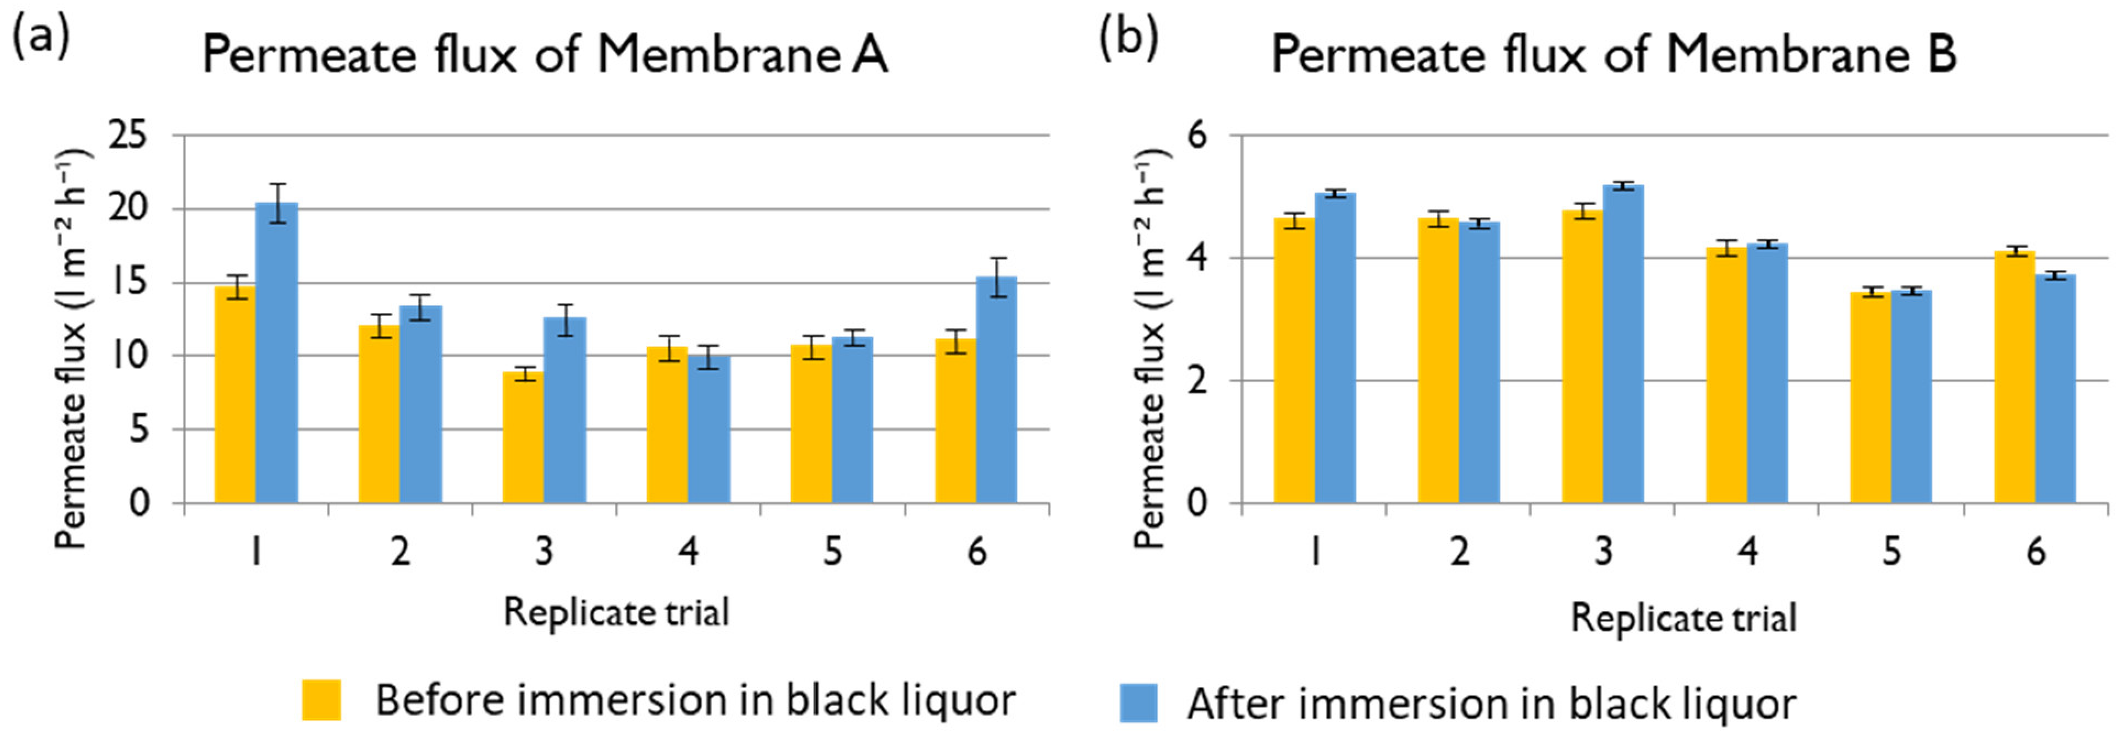
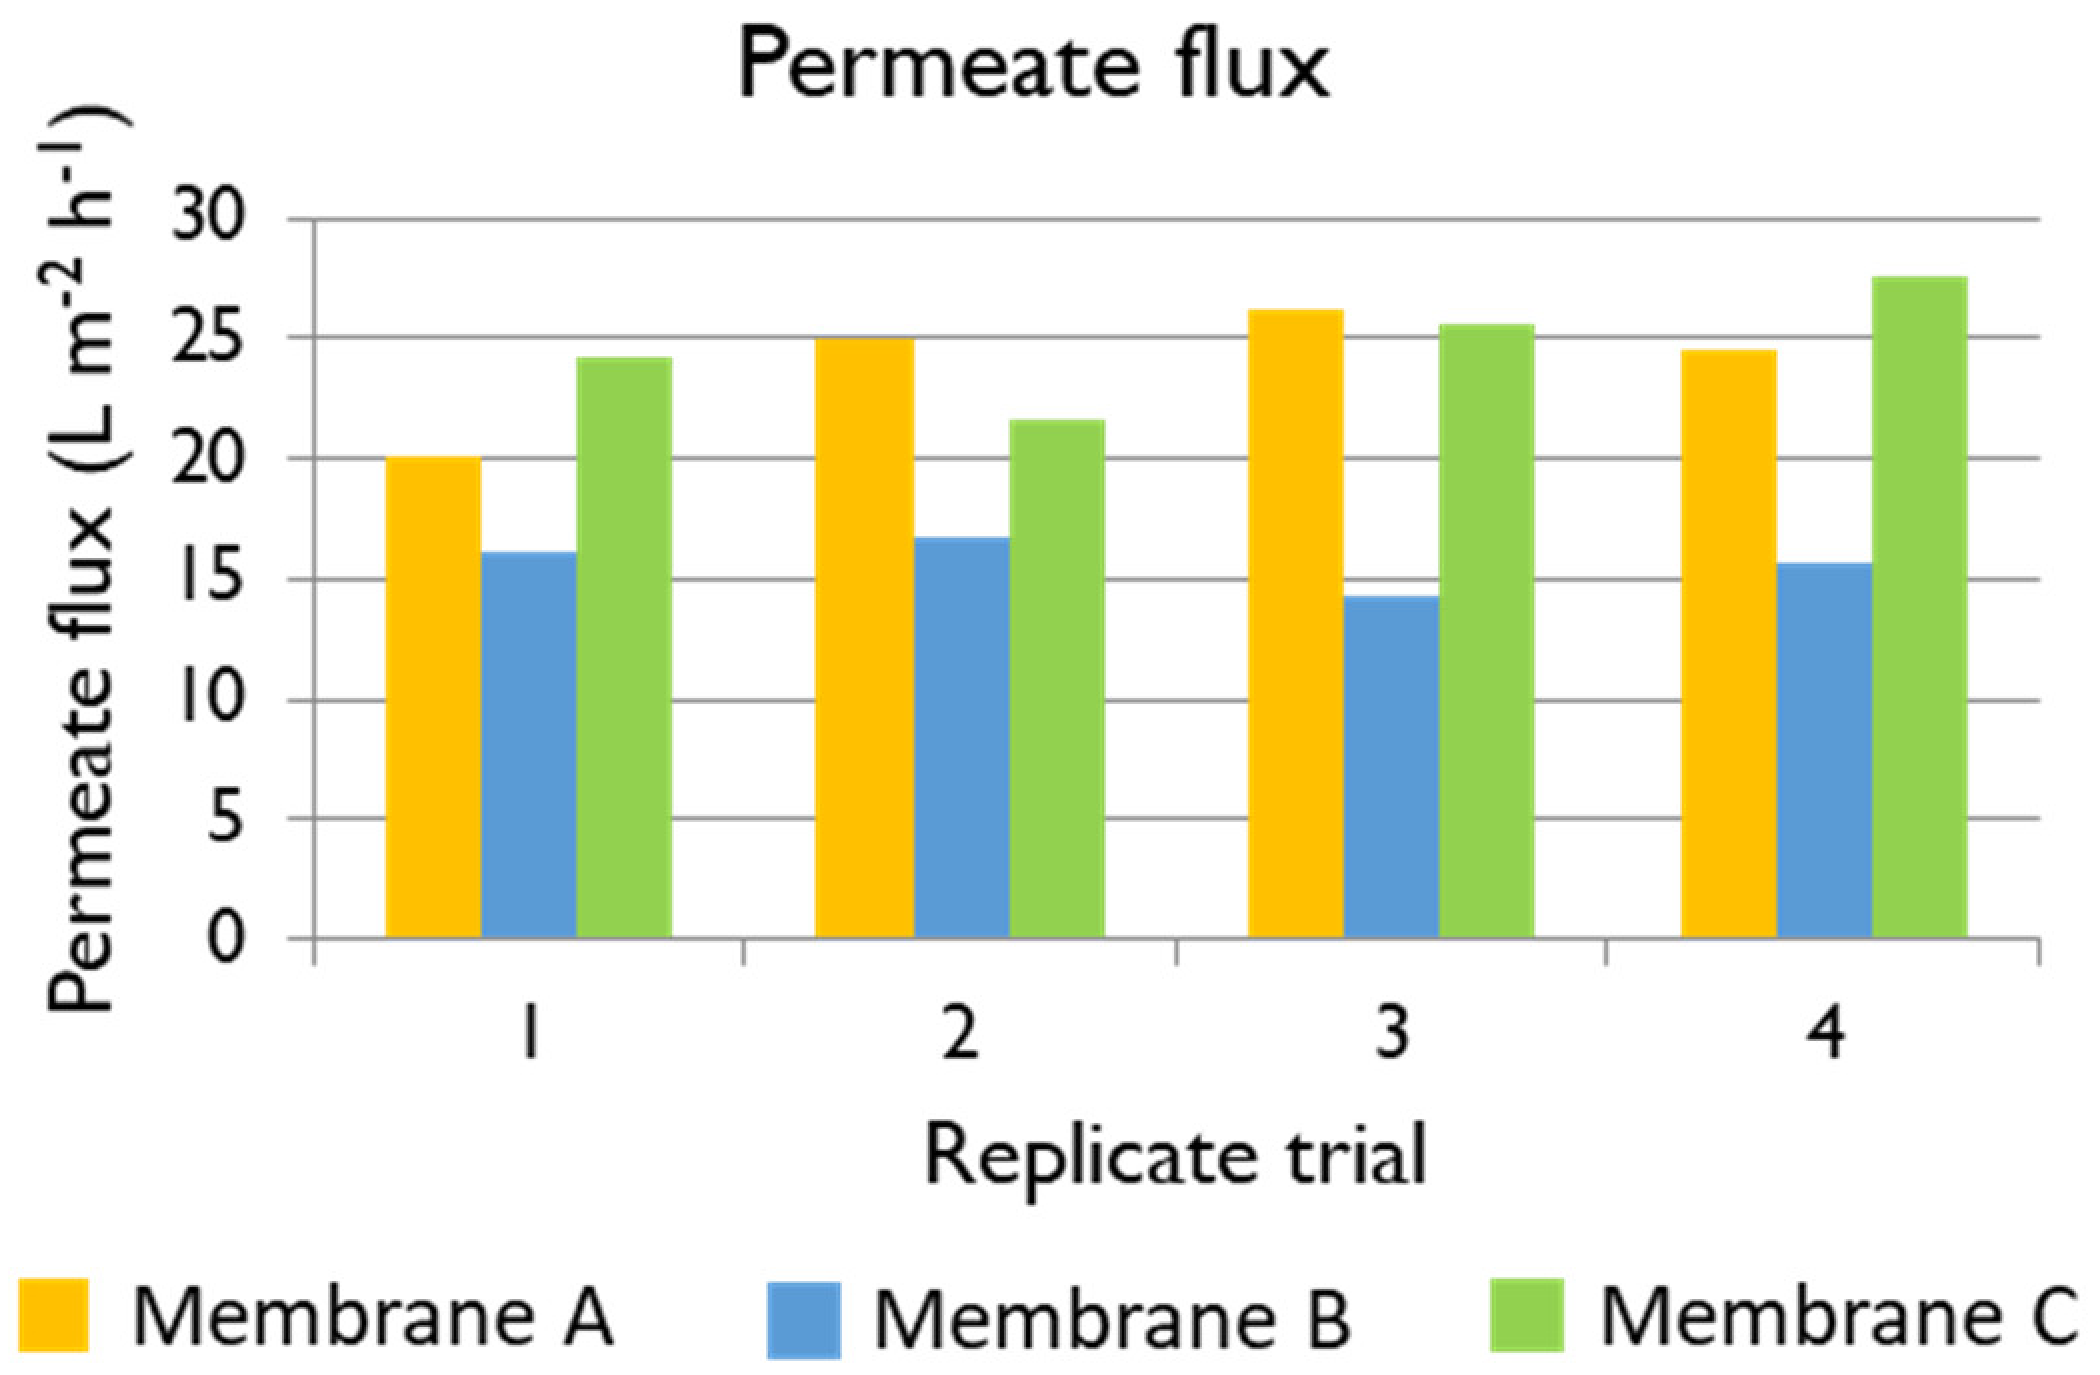
Table 6. The best membrane for the treatment of black liquor at an industrial scale would be such providing high permeate flux, which would result in more recycled white liquor, albeit containing a low TOC concentration. The three membranes under evaluation showed very good performance in terms of TOC rejection, higher than 90% in all the cases. Membrane B was the one that provided the permeate with the lowest TOC concentration, but the permeate flux was compromised. In contrast, the permeate flux using Membrane A at 35 bars was 23.93 L m−2 h−1 on average (only 0.82 L m−2 h−1 less than the flux with the Membrane C), while the TOC rejection was 92.5% on average. Therefore, Membrane A would be the most suitable for the process in terms of TOC rejection. The main contributors to the TOC in the black liquor are the lignin and hemicelluloses. Even though the exact concentration of each component was not accessible due to its wide MW distribution, it is known that xylans have a higher MW than other hemicelluloses by virtue of their higher resistance to degradation [4]. For this reason, they are generally easier to remove through NF than lignin, leading to the conclusion that most of the TOC detected the NF permeate is lignin. The obtained results are competitive compared to those reported by other authors [13,16,21].
  • CO32−: Taking into consideration that the feed CO32− concentration is 4120 mg/L, the average rejections of Membranes A, B, and C are shown in Table 6. The best membrane for the treatment of black liquor at industrial scale would be a membrane with high permeate flux and low CO32− concentration. Membrane B would not be a good choice given its low permeate flux, while Membrane C was the one with the lower CO32− rejection. Therefore, Membrane A would be the best option.
  • Sulphates: With a feed sulphate concentration of 5272 mg L−1. the average rejections of Membranes A, B, and C are shown in Table 6. The best membrane for the treatment of black liquor at industrial scale would be a membrane with high permeate flux and low sulphate concentration in the permeate. Membrane B would not be a good choice despite its higher rejection given its low permeate flux, while Membrane C was the one with the lower sulphate rejection. In contrast, Membrane A provided high flux with 88.7% rejection of sulphate. Membrane A would be the best option, having very high sulphate rejections in comparison to other studies [10].
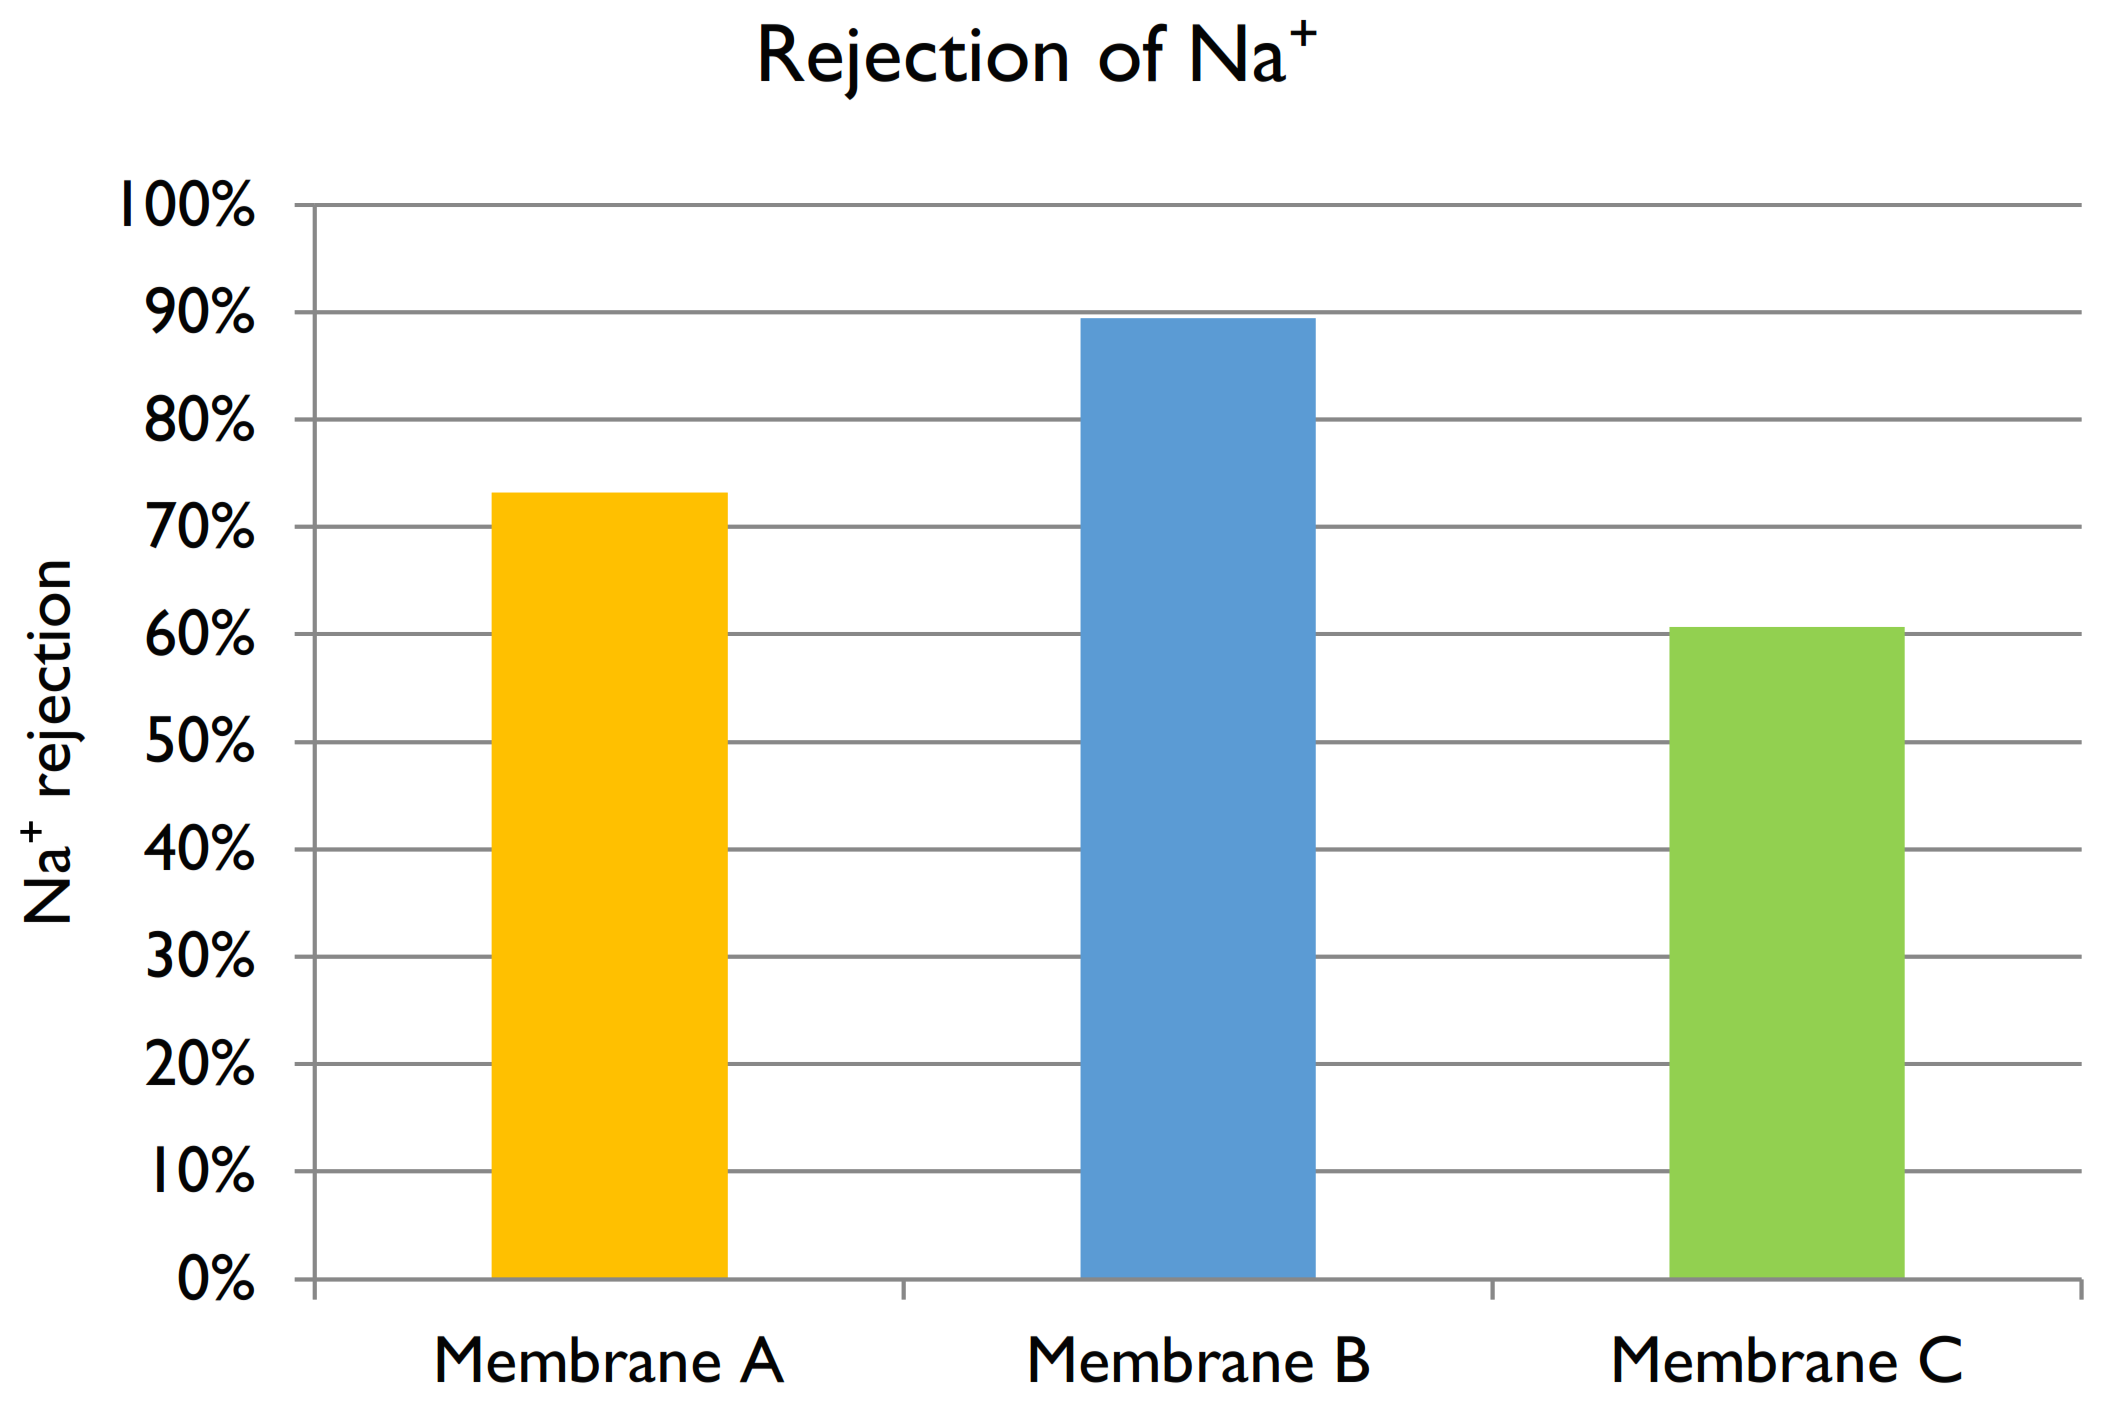
  • Sodium ion: Given a feed Na+ concentration of 5600 mg L−1, the rejections of Membranes A, B, and C are shown in Figure 12. The best membrane for the treatment of black liquor at industrial scale would be one with high permeate flux and that allows the permeation of Na+ to form NaOH. The membranes used for the filtration of black liquor were negatively charged, so the positive ions (including Na+) accumulated in the surface. However, due to their relatively small size and positive charge, the permeation of Na+ ions through the NF membrane is preferred in comparison to other larger counter-ions. This is discussed in more details in Section Charge Balance. Membrane C showed 60.7% of Na+ rejection, which was the lowest value observed. Membrane B provided the highest rejection, but at the cost of a lower permeate flux. Hence, Membrane A would be the best option given its high flux and relatively good rejection (73.2%). The obtained results agree with those found in the literature in regards to high sodium hydroxide permeation [38].
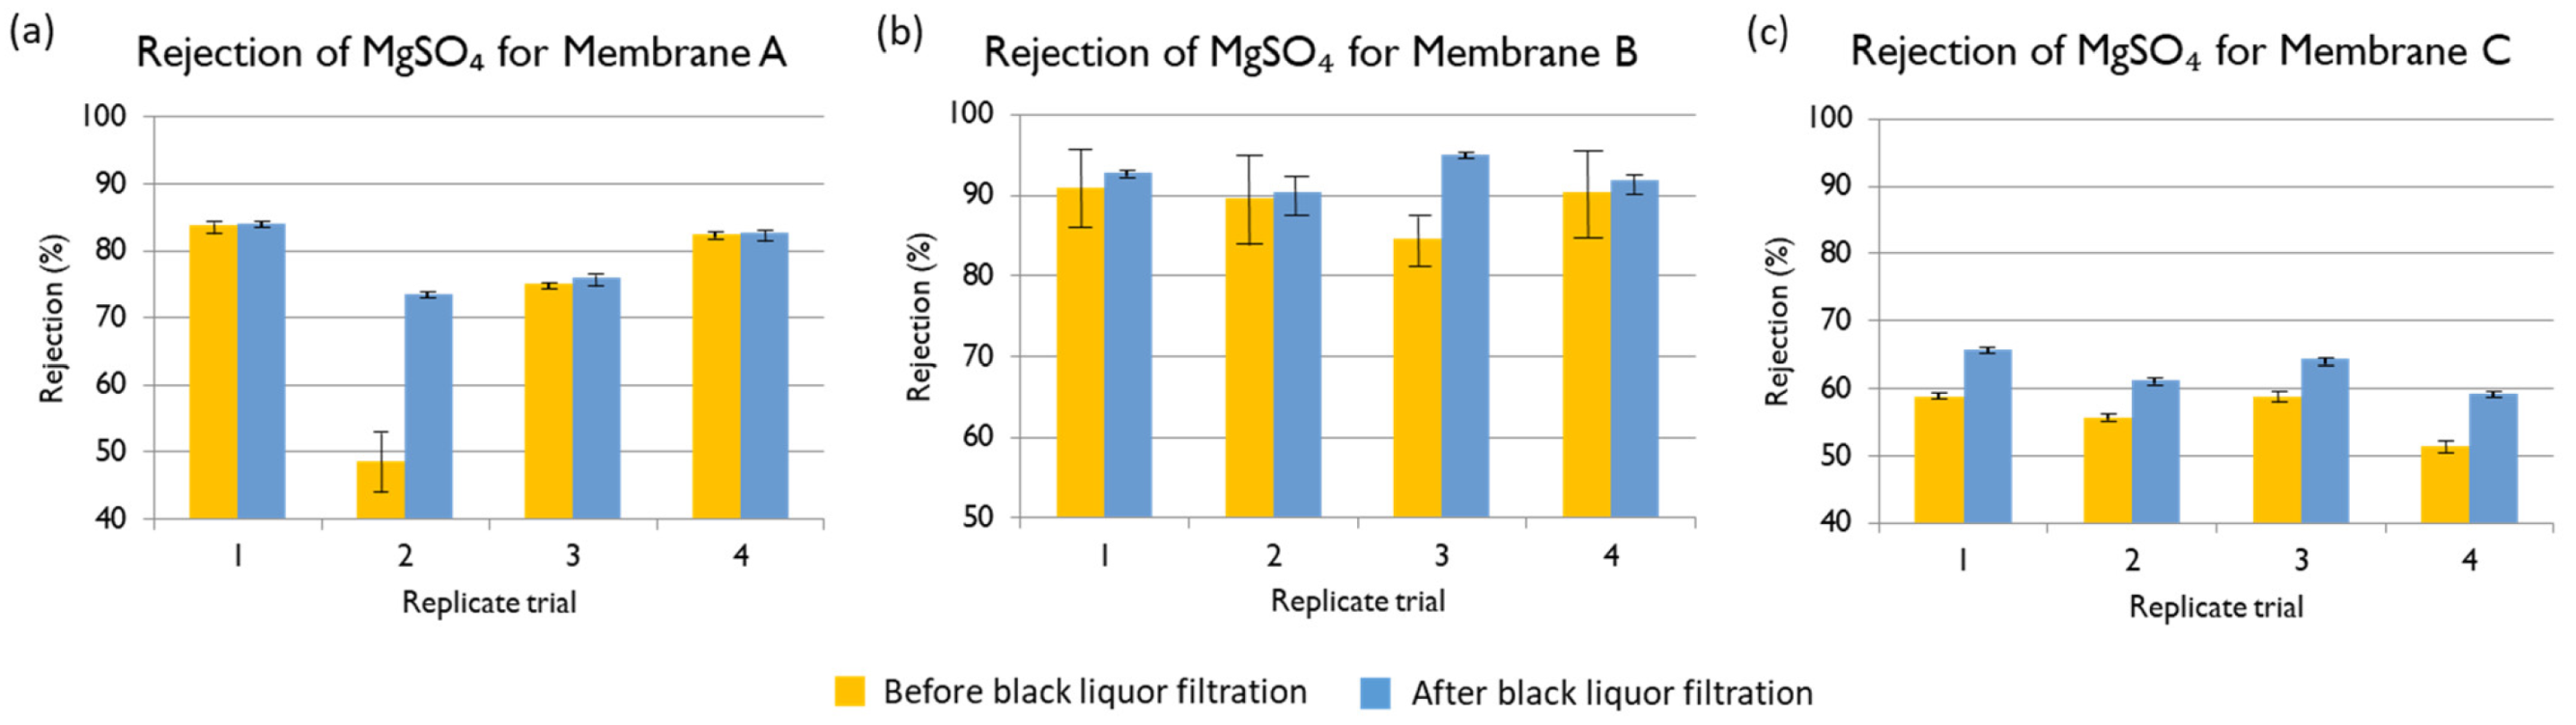
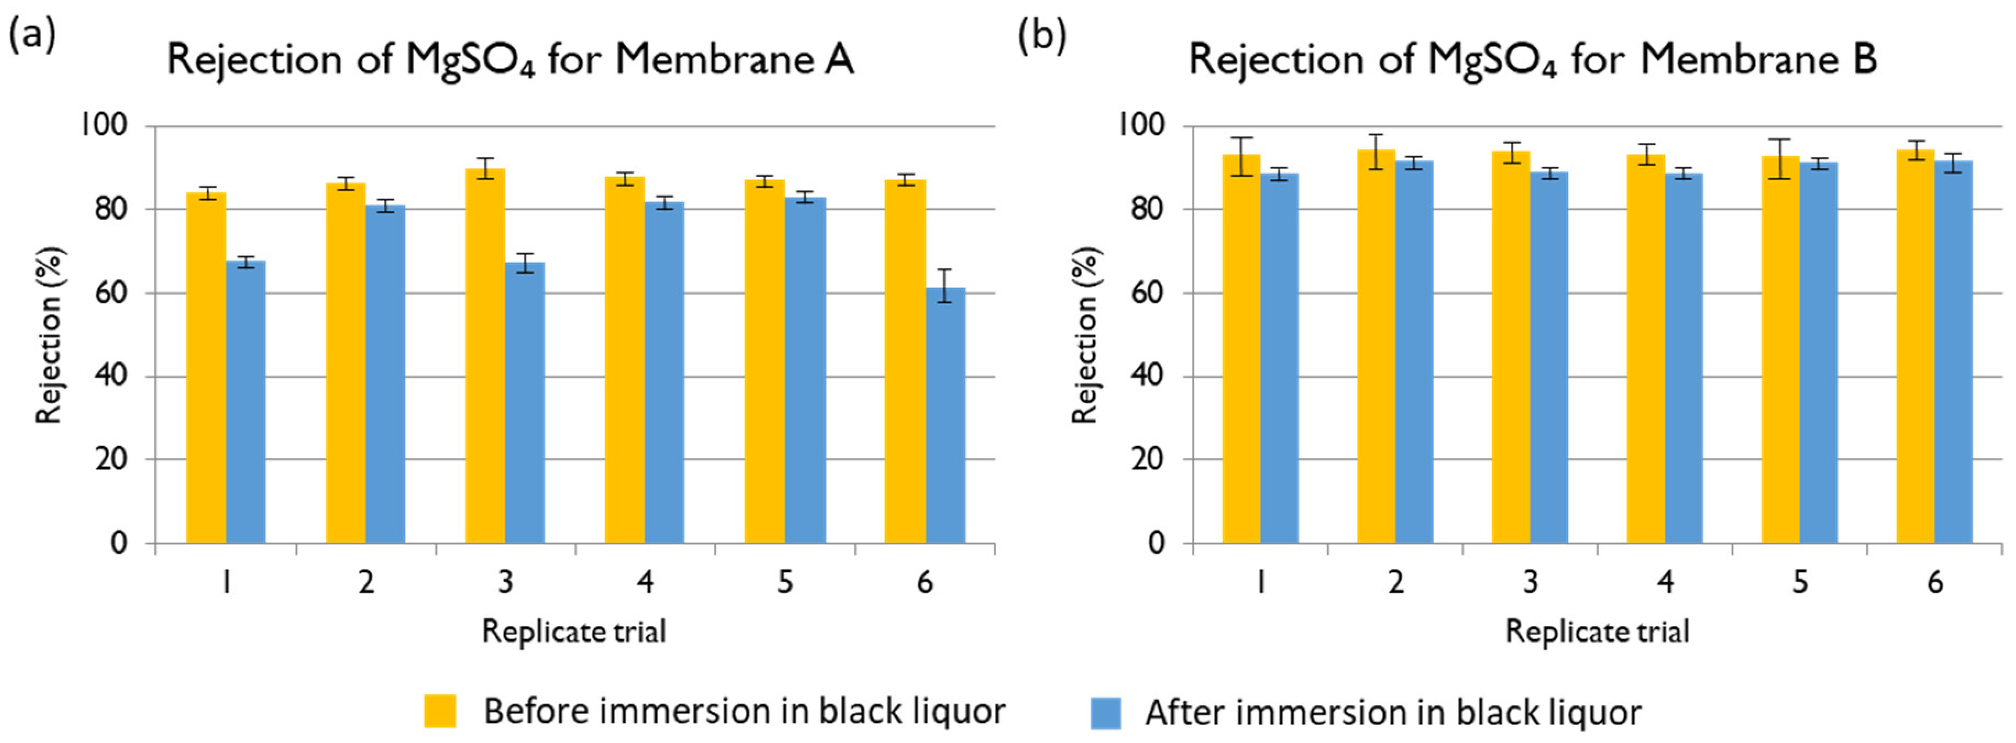
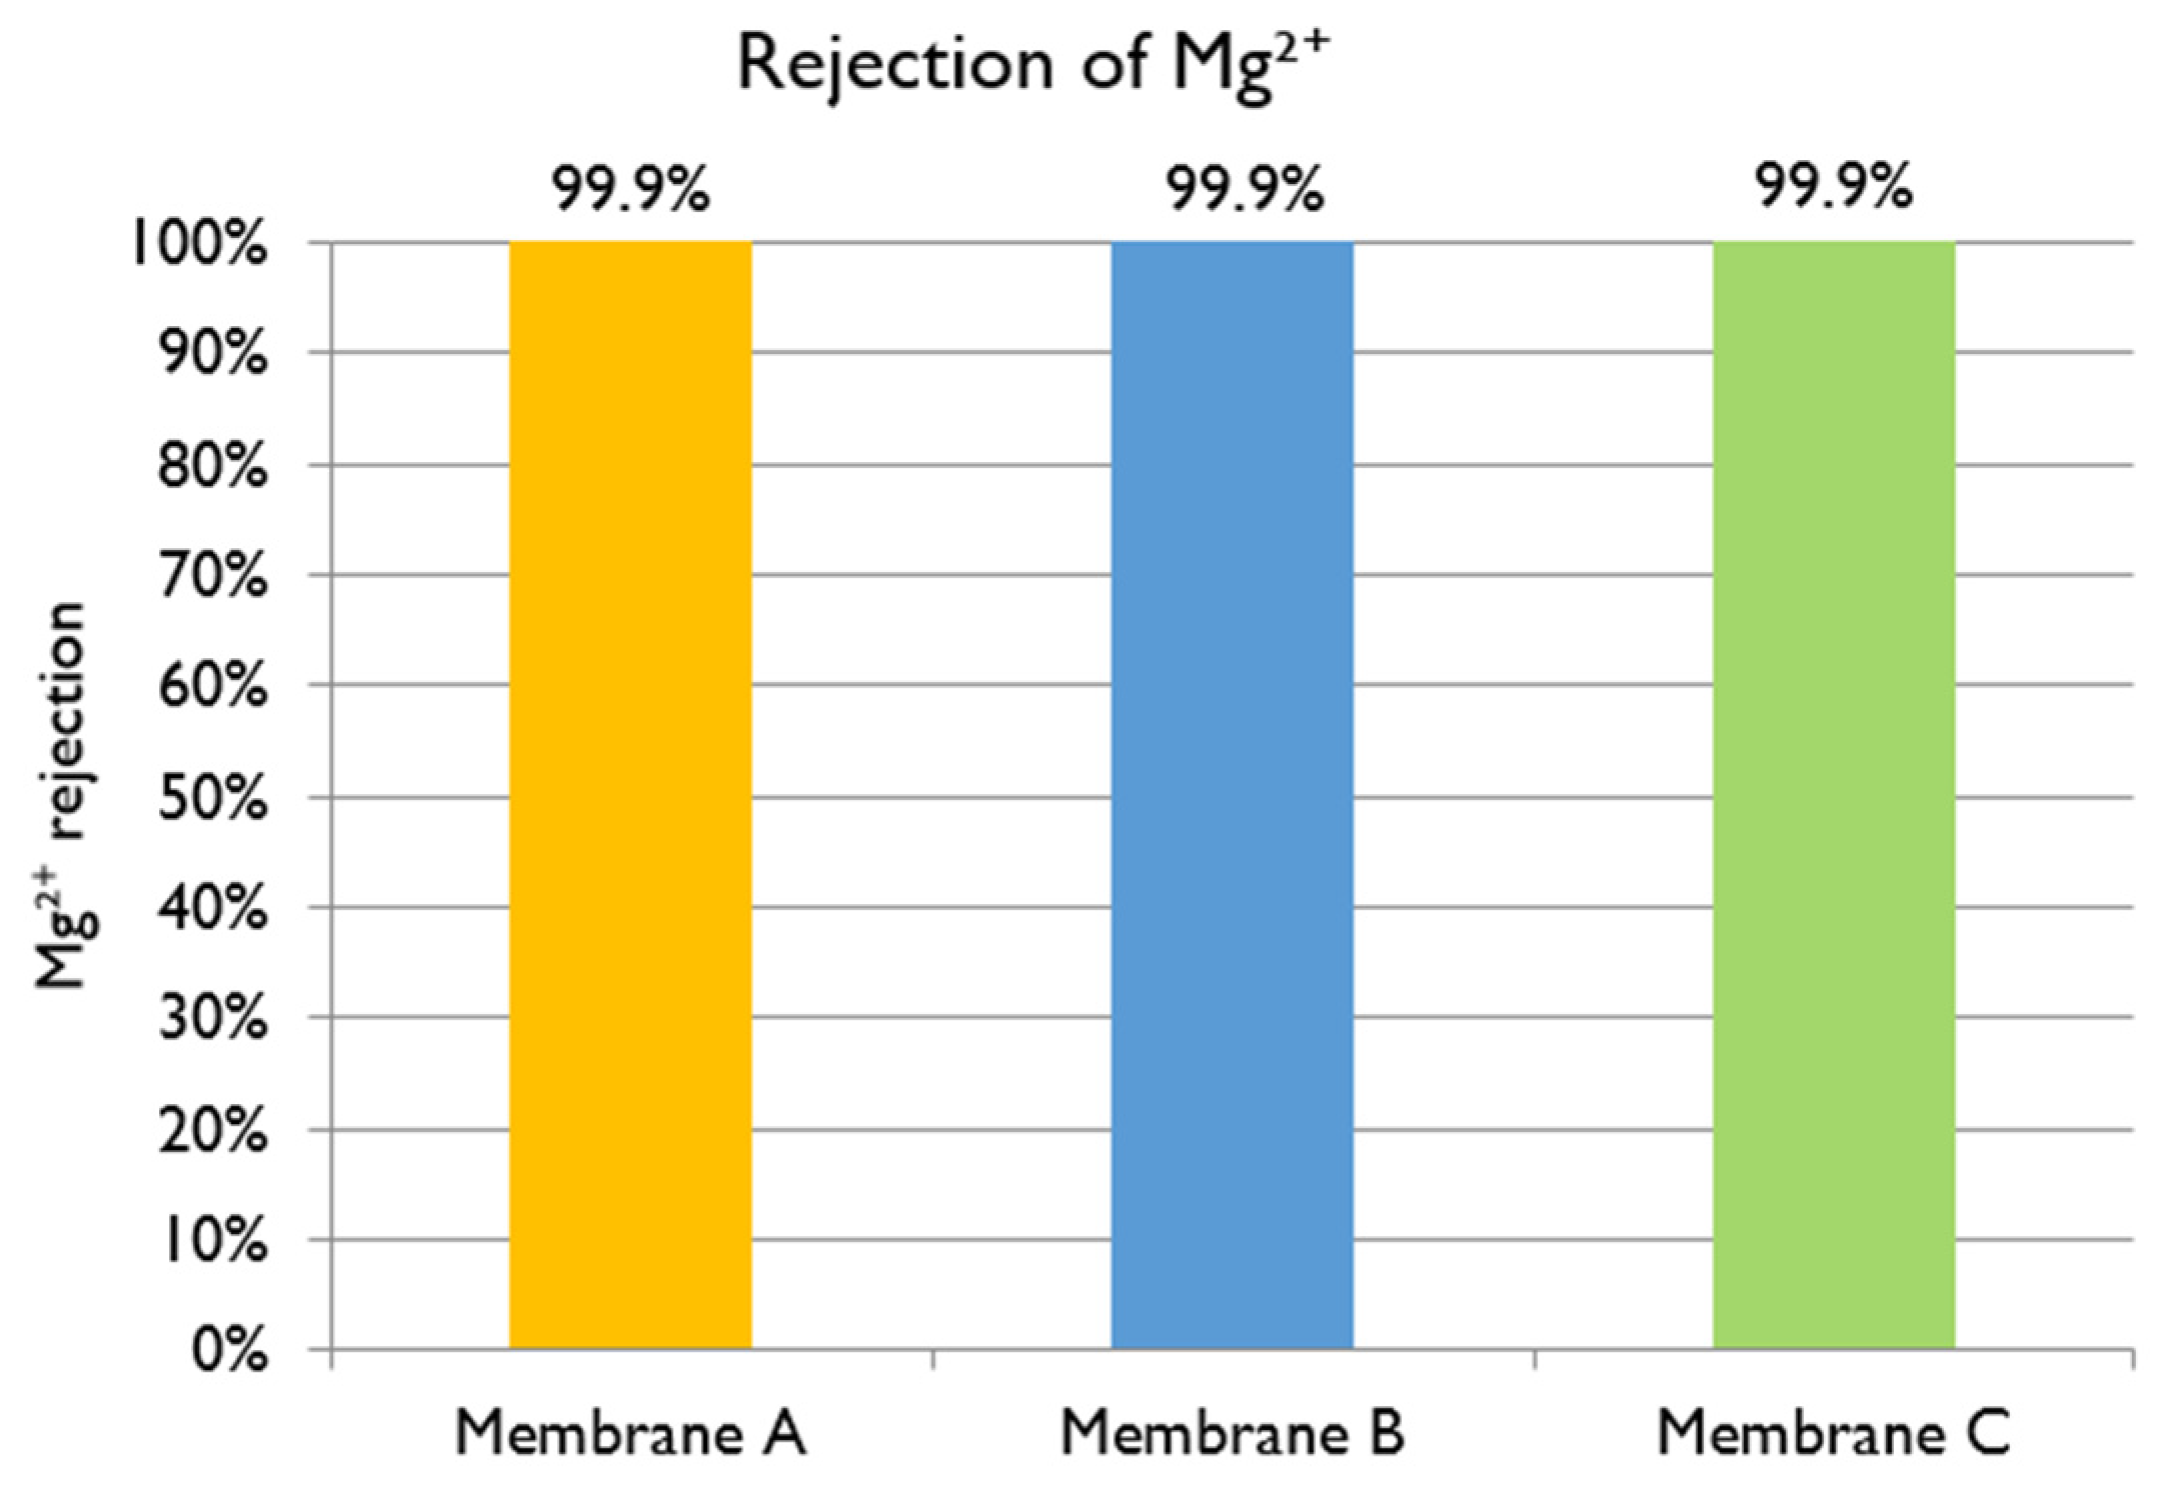
  • Magnesium ion: With a feed Mg2+ concentration of 1300 mg L−1, the rejections of Membranes A, B, and C are shown in Figure 13. The best membrane for the treatment of black liquor at industrial scale would be one with high permeate flux and low Mg2+ concentration in the permeate. The three membranes in evaluation offered very high rejection of Mg2+ (higher than 99.9% in all the cases), offering results that agree with those already reported in the literature [10]. The main criteriium to select the best membrane was the obtained permeate flux, so Membranes A and C would both be good options.
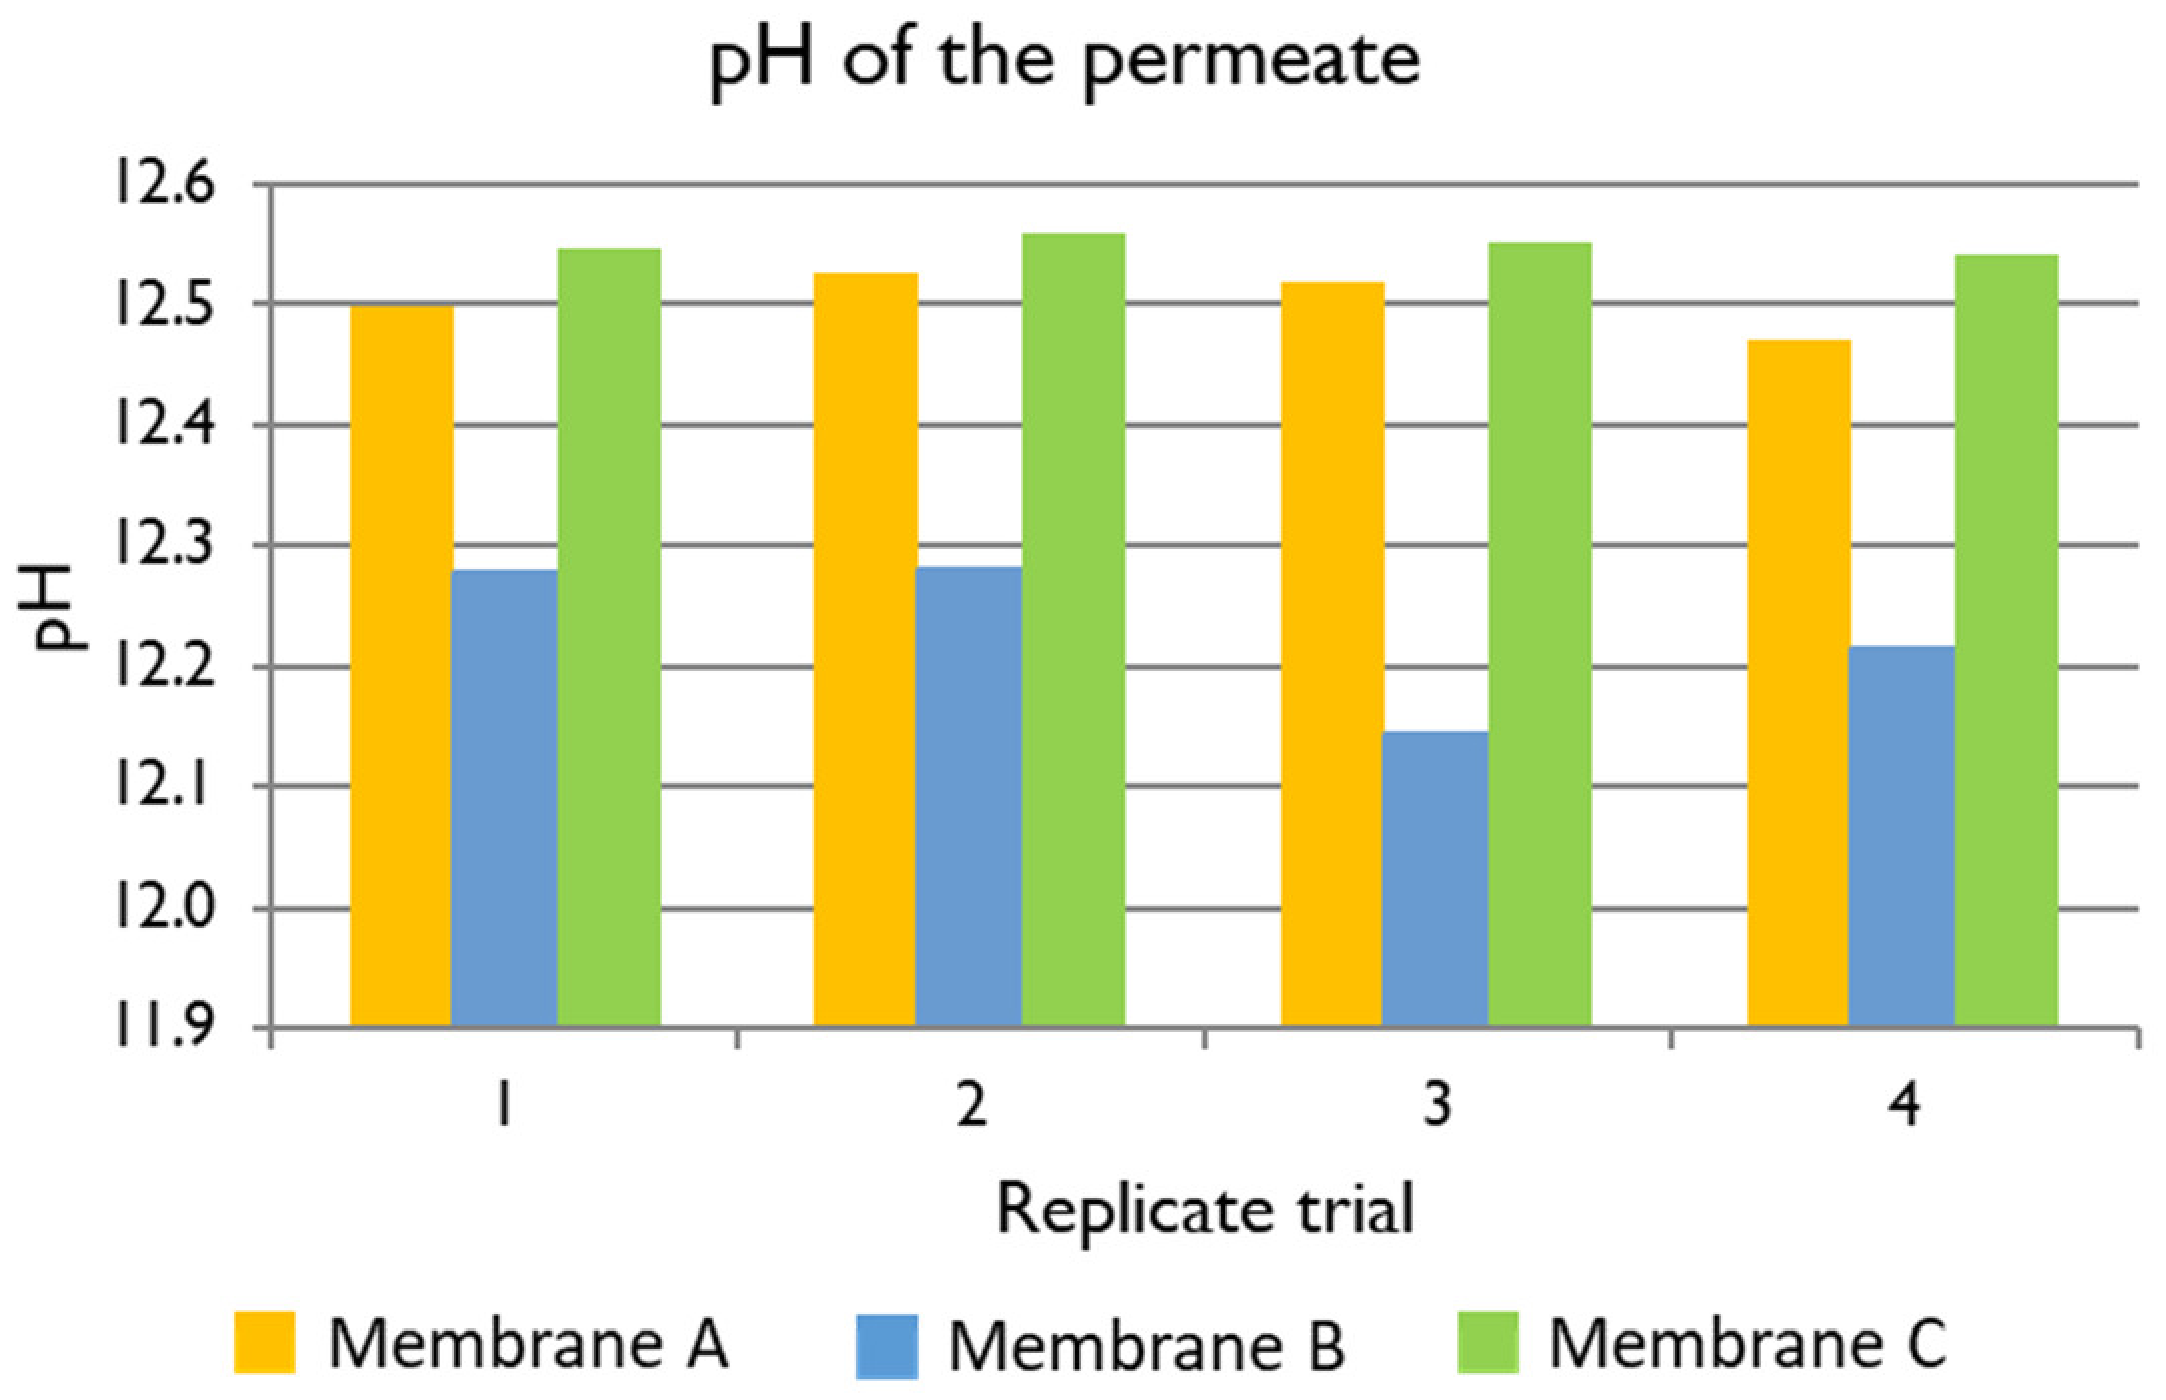
Hydroxide ion: The content of OH in the feed and the permeate was measured taking into account the pH of the samples and a feed pH of 11.857. The average rejections of Membranes A, B, and C are shown in Table 7. In the case of OH, a negative rejection of hydroxide was observed. This point is explained in more deeply in Section 3.4, where the charge balance is discussed. The best membrane for the treatment of black liquor at industrial scale would be a membrane with high permeate flux and high OH concentration in the permeate, as OH is one of the required components of white liquor. Membrane B showed a high negative rejection, but it was the lowest among the three membranes and it had the lowest permeate flux. Membranes A and C had high flux and high negative rejection to OH (−317.9% and −365.2% in average, respectively), so they could both have a good performance in terms of providing OH permeability.

3.4. Charge Balance

At the high pH of the black liquor, the surfaces of Membranes A, B, and C were negatively charged. Given the presence of charged species in the feed, the mechanisms of solute rejection that occurred at the membrane-solution interface were not limited to steric exclusion. The repulsion or attraction forces between the membrane and the solutes due to their electric charges, caused by the Donnan effect, were also be taken into account for the analysis. As a negatively charged membrane was used for the filtration of the simulated black liquor, the counter-ions (in this case, the positive ions) tended to accumulate in the surface of the membrane while co-ions (negative ions) did not. As a result, a Donnan potential was created. The Mg2+ and Na+ ions were attracted to the surface of the membrane due to their charges, but the permeation of Na+ was preferred due to its smaller size. For this reason, the rejection of Na+ shown in Figure 7 was lower than the rejection of Mg2+, which was higher than 99.99%. In order to maintain the electroneutrality, the permeation of co-ions was necessary to balance the positive charges in the permeate. In the presence of two different co-ions with the same charge, there was a preferred rejection of divalent to monovalent ions. Therefore, the rejection of CO32− and SO42− was greater than the rejection of OH due to the strong electrostatic repulsion caused by the higher valency. The passage of OH was attributed to the presence of Na+, which shielded the negative charge of the membrane causing a negative rejection of OH. As a result of high negative rejection OH, the pH of the permeate was higher than the pH of the feed. This was a very positive result since the recovered permeate would be more concentrated in the cooking liquors required for the pulping process. Table 7 presents the results of the charge balance developed for Membranes A, B, and C. As seen in the table, the charge contributions of the cations and anions analyzed did not completely satisfy the balance. In all of the cases, there was an unknown contribution that could be attributed to the organics that were not measured with the methods used or the analytical error during the measurements. This analytical error was higher when the concentration of ions is too low, as in the permeate samples. The unknown contribution was higher for the feed, which was coherent because the feed had higher concentrations of organic compounds that were the potential contributors of the unknown charges.
As a compliment, the calculations of the osmotic pressures and transmembrane pressures (TMP) are presented as Supplementary Materials. For the evaluations performed in the following economical assessment, the energy requirements to operate Membrane A were considered. The calculated TMP for Membrane A was 21.5 bars, which is in the reported range for the NF of black liquor [4,13].

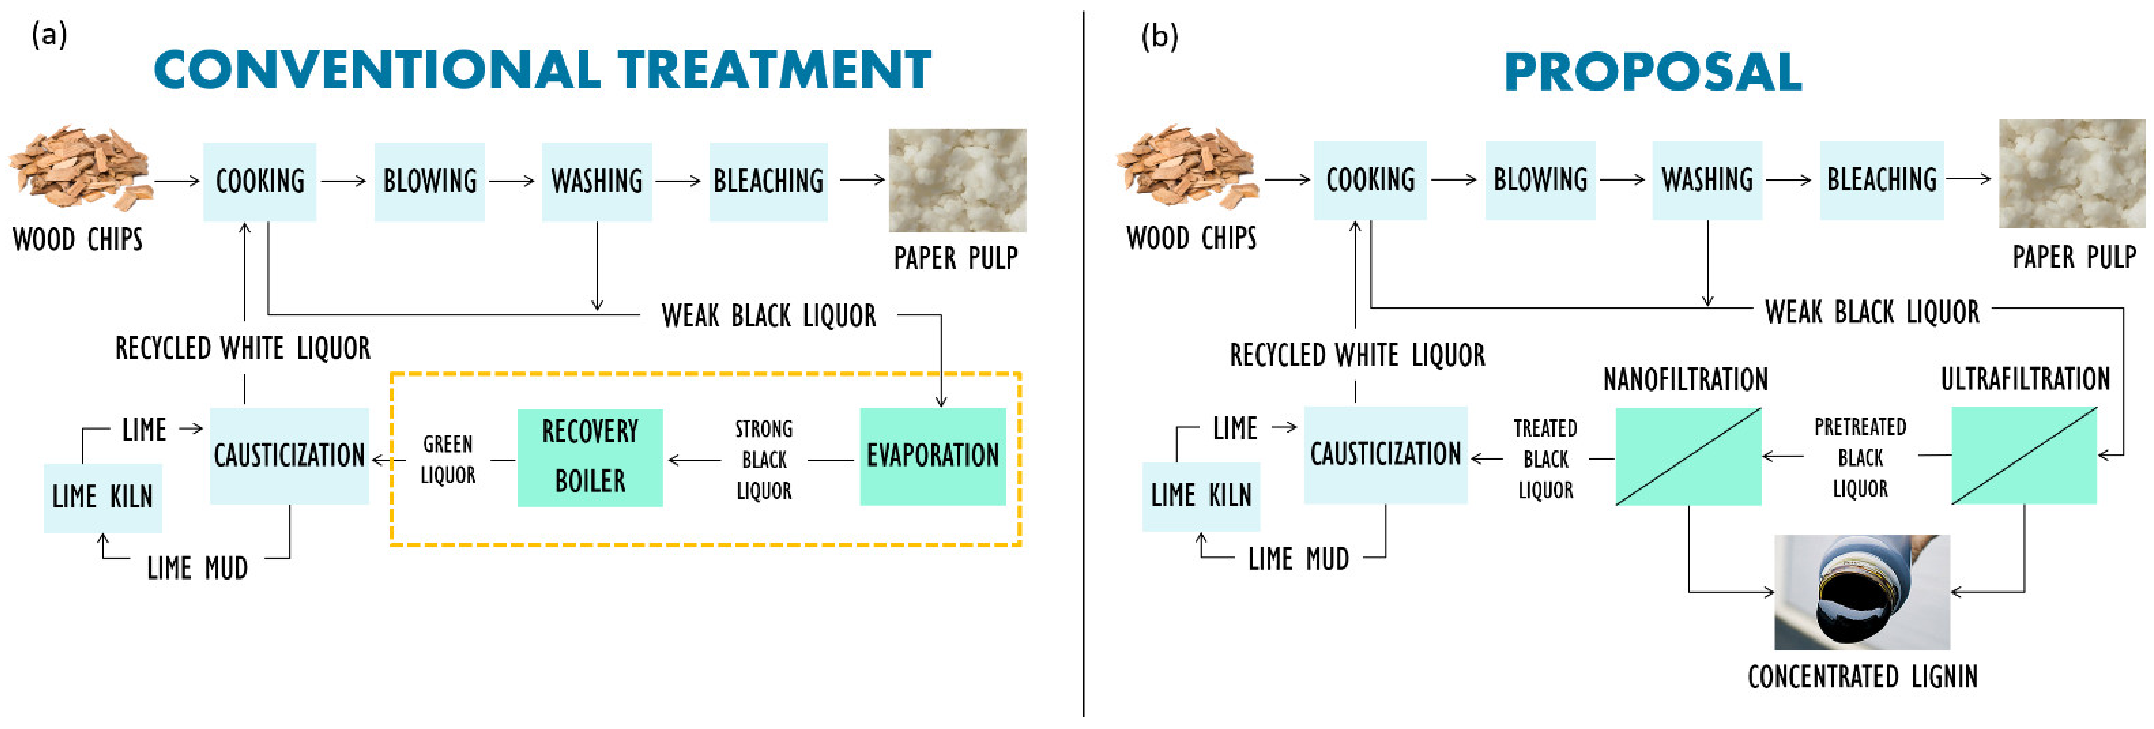
3.5. Economic Assessment

Our economic analysis had the goal of assessing the economic viability of both proposals in order to find out which of them was more profitable. This study included information on the capital expenditures (CAPEX), operating expenditures (OPEX) and revenues or savings. According to data provided by a Swedish paper and pulp industry, the recovery boiler cost represents approximately half of the total capital expenditures. The capacity of a pulp manufacturer is then limited by the amount of black liquor that can be burned in the recovery boiler. For this reason, reducing the load of the recovery boiler using other alternatives is an attractive option. As mentioned in previous sections, the lignin is normally burned to obtain energy that is used in the paper making process. However, lignin itself is potentially valuable as a specialty chemical and its recovery can provide an additional income to the company. Lignin can be sold as low-quality lignin or high-quality lignin. Low-quality lignin may be used, for instance, to manufacture phenolic resin substitutes or asphalt conditioner. Digitalization is reducing the dependency on paper, which is decreasing its demand. Therefore, the paper and pulp industries need to diversify their product offering in order to make their business more profitable in the following years.
The implementation of the proposal considered in this study was a capital project that required an initial investment, and its capacity to earn net benefits over time was evaluated in this section. For Scenario 1, which consisted in treating 100% of the black liquor using the conventional process, no capital cost was required. For Scenario 2, the investment was destined to the portion of the capacity that would be replaced by membrane technologies. The estimations of the capital costs in machinery, equipment, and installment took into the account the required capacity and the assumption that the investment was three times higher when resistance to extreme pH was necessary. The total CAPEX for the implementation of the membrane system with 15 m3 h−1 of capacity is 842,048.20 EUR. Additionally, considering that the membrane life is assumed to be 1.5 years [4], the capital cost would be periodically increased during operation to replace the UF and NF membranes. Taking into account the capacity, the number of modules required are one for ultrafiltration and twenty-two for nanofiltration. Assuming that the price per module is 1200.00 EUR, the additional cost is 26,400.00 EUR.
The operational costs considered in this study corresponded to the consumption of chemicals and energy during for the production and the maintenance. As in other big industries, it was assumed that the maintenance would be scheduled once a year and that the energy consumption was 10% of the one in regular operating conditions.
For Scenario 1, the calculation of the total energy consumption considered that the conventional process (which includes the evaporators, recovery boilers, and causticizers) demanded 13 kWh m−3 to operate. With a feed of 150 m3 h−1 and with 8760 h of operation per year, the total energy cost was 1,205,989.20 EUR per year. The maintenance cost was 10,963.54 EUR per year. Finally, the cost of the chemicals was 7851.00 EUR per year. These costs were considered starting from the first year of operation. The calculation of the indirect manufacturing costs took into account the office supplies and communications, which was assumed as a fixed cost of 20,000.00 EUR per year, and the salaries and wages, which sum 1,397,155.70 EUR per year.
For Scenario 2, the calculation of the total energy consumption considered that the conventional process demanded 13 kWh m−3 to process 135 m3 of black liquor per hour and the membrane process required 1.763 kWh m−3 to process 15 m3 of black liquor per hour. In this case, it was also assumed that the pulp producer would operate 8760 h in a year. As a result, the total energy cost was 1,101,748.60 EUR per year. The maintenance cost was 10,015.90 EUR per year. Finally, the cost of the chemicals was 19,452.30 EUR per year. These costs were considered since the first year of operation. Therefore, the total direct manufacturing costs of Scenario 2 is 1,131,216.80 EUR per year. The calculation of the indirect manufacturing cost took into account the office supplies and communications, which was assumed as a fixed cost of 20,000.00 EUR per year, and the salaries and wages, which sum 947,312.20 EUR per year.
To conclude with the input data for the economic assessment, the income from both scenarios was quantified. For Scenario 1, the source of income was in the savings of electricity generated by the black liquor processed by the conventional wastewater treatment. This amount of energy could be calculated taking into account that 1500 tons of black liquor solids generate 25 to 35 MW of electricity [5]. For this study, 30 MW were considered. The amount of electricity produced was then multiplied by the cost of electricity for industrial customers in Sweden, which is 0.0706 EUR/kWh. The assumption is that all the black liquor solids were burned. If the energy of the 100% of the black liquor solids was recovered, that amount would be 9,184,860 kWh per year. Considering this very optimistic assumption, the total savings would be 648,451.10 EUR per year. For Scenario 2, the source of income was the sale of lignin recovered in the retentate of the membrane processes, assuming that the lignin rejection of the UF process using a 10 kDa membrane is 84.80% [33]. The prices of lignin obtained from the kraft process varies between 260 and 500 EUR/ton. For this study, the price was assumed to be 380 EUR/ton [34]. The annual benefits were calculated with the income in each of the studied scenarios and the operational costs.
Using all of the data, the profit after taxes in both scenarios could be calculated and it is shown in Table 8. In Scenario 1, the profit was negative because the savings in electricity costs generated from the energy recovery were not higher than the operational costs. However, the savings covered more than half of the total electricity consumption cost of the process (53.77%, to be more specific), which was compatible to the reality of paper and pulp industries.
In Scenario 2, UF and NF would allow a recovery of lignin that can be sold to other industries. This additional income generated an attractive profit of 106,580.80 after taxes. In Table 9 the project financial indicators are presented. The conclusion from these results was that the project is also feasible from a financial point of view given the considered assumptions for the study. The NPV value was >0; this number represented that the company’s value would increase 51,033.80 EUR in 10 years as a result from the investment. The IRR of the investment was higher than the opportunity cost of capital considered for the calculation, so it is recommended to invest in the project. Finally, the cumulative cash flow from the economic evaluation indicated that the payback period was of five years, assuming that the 100% of the recovered lignin can be sold in the market. It is important to mention that these calculations did not take into account the potential penalties that companies may be forced to pay if their toxic emissions are over the maximum permissible limit. In addition to this technical and economic study, a preliminary simplified life cycle assessment was performed to highlight the potential relevance of this proposal from an environmental point of view (in Supplementary Materials).

4. Conclusions

This research project has successfully analyzed the feasibility of using pH stable in-house made NF membranes to treat highly alkaline black liquor from the paper and pulp industry, concluding in the suitability of Membrane A from a technical point of view.
Using simulated black liquor at pH 12 and pH 14, the stability of the membranes in alkaline conditions was tested during filtration and in static tests. The filtration experiments demonstrated that Membrane A had a higher potential for this application since it had a high permeate flux (23.93 L m−2 h−1 in average) and high rejection of organic components and salts that may affect the efficiency of the recycled cooking liquor. In average, the rejections were 92.50% for the TOC, 84.10% for the CO32−, 88.70% for the sulphates, 73.21% for the Na+, and 99.99% for the Mg2+. In the case of the OH, the negative rejection was −317.90% on average. As expected, a good recovery of NaOH in the permeate would be achieved. Therefore, Membrane A is suitable for the treatment of black liquor when combined with a previous UF pretreatment, a least to reduce the load on the evaporators and recovery boilers used in the conventional treatment process. The permeate from NF may still require causticization, but a critical part of the chemical recovery process would be already optimized.
The profitability of the investment project was evaluated as a comparison between the conventional process vs. the replacement of 10% of the total capacity with membrane technologies. In the second scenario, the CAPEX in Year 0 would be 842,048.24 EUR and 27,600 EUR every two years for the replacement of the membranes. Assuming that 6104 tons of lignin rich retentate would be sold every year with a price of 380 EUR/ton, the IRR was estimated in 16.59% and a payback period would be five years. Thus, the proposal is also feasible from an economic perspective. The conventional process burns the lignin, so an extra income from the sales does not exist.
In terms of the membrane itself, future investigations may focus on modifying its chemical structure or the preparation procedure to obtain higher permeate fluxes without compromising the good membrane rejection. Future work will include experiments using real black liquor previously treated by UF in order to evaluate the treatment process under such conditions.

Supplementary Materials

The following are available online at https://www.mdpi.com/article/10.3390/w13162270/s1, Figure S1: Goal and scope of the LCA study, Figure S2: Impact assessment results, Table S2: Transmembrane pressures (bar), Table S3: Outputs using the conventional process, Table S4: Emissions in each environmental category, Table S5: Activity data in the chemical recovery unit for the calculation of the emissions, Table S6: Emission factors in the chemical recovery unit from Kraft pulp production, Table S7: Emission factors in the energy generation unit from Kraft pulp production, Table S8: Classification factors used for emissions for 1 kg of pollutants, Table S9: Comparison between the impact assessment results for Scenario 1 and Scenario 2.

Author Contributions

Conceptualization, K.L.Z., S.V. and O.J.V.; methodology, K.L.Z. and O.J.V.; validation, K.L.Z. and S.V.; formal analysis, O.J.V.; investigation, O.J.V.; resources, K.L.Z.; data curation, O.J.V.; writing—original draft preparation, O.J.V.; writing—review and editing, K.L.Z. and S.V.; visualization, O.J.V.; supervision, K.L.Z. and S.V.; project administration, K.L.Z.; funding acquisition, K.L.Z. All authors have read and agreed to the published version of the manuscript.

Funding

This research was funded by LANXESS-IAB Ionenaustauscher GmbH (Bitterfeld, Germany). Olenka Jibaja Valderrama acknowledges her scholarship granted by the European Commission-Education, Audiovisual, and Culture Executive Agency (EACEA), which allowed her to be part of the Erasmus Mundus Master in Membrane Engineering for a Sustainable World (EM3E-4SW).

Acknowledgments

The authors would like to thank LANXESS-IAB Ionenaustauscher GmbH (Bitterfeld-Wolfen, Germany) for the financial support for this research. This work was supported by the Associate Laboratory for Green Chemistry—LAQV, which is financed by national funds from FCT/MCTES (UIDB/50006/2020 and UIDP/50006/2020). Olenka Jibaja Valderrama acknowledges her scholarship grant provided by the European Commission—Education, Audiovisual, and Culture Executive Agency (EACEA), under the program: Erasmus Mundus Master in Membrane Engineering for a Sustainable World-EM3E-4SW (Ed. I, http://em3e-4sw.eu (accessed on 18 August 2021)).

Conflicts of Interest

The authors declare no conflict of interest.

Abbreviations

(Abbreviations are listed alphabetically)
CAPEXCapital Expenditures
CTCoupon tester
EBITDAEarnings before interest, taxes, depreciation and amortization
ICP-OESInductively Coupled Plasma—Optical Emission Spectroscopy
IRRInternal rate of return
MWMolecular weight
MWCOMolecular weight cut-off
NFNanofiltration
PESPolyethersulfone
ROReverse Osmosis
TICTotal Inorganic Carbon
TMPTransmembrane pressure
TOCTotal Organic Carbon
UFUltrafiltration
UVUltraviolet

References

  1. Toledano, A.; Garcia, A.; Mondragon, I.; Labidi, J. Lignin separation and fractionation by ultrafiltration. Sep. Purif. Technol. 2010, 71, 38–43. [Google Scholar] [CrossRef]
  2. Yang, S.-T. Bioprocessing for value-added products from renewable resources. In Bioprocessing for Value-Added Products from Renewable Resources; Yang, S.-T., Ed.; Elsevier: Amsterdam, The Netherlands, 2007. [Google Scholar]
  3. Manttari, M.; Lahti, J.; Hatakka, H.; Louhi-Kultanen, M.; Kallioinen, M. Separation phenomena in uf and nf in the recovery of organic acids from kraft black liquor. J. Membr. Sci. 2015, 490, 84–91. [Google Scholar] [CrossRef]
  4. Kevlich, N.S.; Shofner, M.L.; Nair, S. Membranes for kraft black liquor concentration and chemical recovery: Current progress, challenges, and opportunities. Sep. Sci. Technol. 2017, 52, 1070–1094. [Google Scholar] [CrossRef]
  5. Berk, Z. Food Process Engineering and Technology, 3rd ed.; Academic Press: Cambridge, MA, USA, 2018. [Google Scholar]
  6. Alipour, Z.; Azari, A. Cod removal from industrial spent caustic wastewater: A review. J. Environ. Chem. Eng. 2020, 8, 103678. [Google Scholar] [CrossRef]
  7. Ng, A.S.N. Characterization of Recovered Black Liquor and Isolated Lignin from Oil Palm Empty Fruit Bunch Soda Pulping for Semichemical and Chemical Pulps. Master’s Thesis, Universiti Sains, Gelugor, Penang, Malaysia, 2008. [Google Scholar]
  8. Gonder, Z.B.; Arayici, S.; Barles, H. Advanced treatment of pulp and paper mill wastewater by nanofiltration process: Effects of operating conditions on membrane fouling. Sep. Purif. Technol. 2011, 76, 292–302. [Google Scholar] [CrossRef]
  9. Bajpai, P. Pulp and paper industry. In Pulp and Paper Industry; Bajpai, P., Ed.; Elsevier: Amsterdam, The Netherlands, 2016. [Google Scholar]
  10. Wallberg, O.; Jonsson, A.S.; Wimmerstedt, R. Fractionation and concentration of kraft black liquor lignin with ultrafiltration. Desalination 2003, 154, 187–199. [Google Scholar] [CrossRef]
  11. University, Å.A. Introduction to Kraft Process—Black Liquor and Black Liquor Recovery Boiler. Available online: https://fdocuments.in/document/introduction-to-kraft-process-black-liquor-and-the-black-usersabofimaengblofpkii20175introkraftprocessfpkii2017.html (accessed on 18 August 2021).
  12. Schäfer, A.; Fane, A.G.; Waite, T.D. Nanofiltration: Principles and Applications; Elsevier Science: Amsterdam, The Netherlands, 2005. [Google Scholar]
  13. Jonsson, A.S.; Nordin, A.K.; Wallberg, O. Concentration and purification of lignin in hardwood kraft pulping liquor by ultrafiltration and nanofiltration. Chem. Eng. Res. Des. 2008, 86, 1271–1280. [Google Scholar] [CrossRef]
  14. Arkell, A.; Krawczyk, H.; Thuvander, J.; Jonsson, A.S. Evaluation of membrane performance and cost estimates during recovery of sodium hydroxide in a hemicellulose extraction process by nanofiltration. Sep. Purif. Technol. 2013, 118, 387–393. [Google Scholar] [CrossRef]
  15. Ladewig, B.; Al-Shaeli, M.N.Z. Fundamentals of Membrane Bioreactors: Materials, Systems and Membrane Fouling; Springer: Singapore, 2016. [Google Scholar]
  16. Olsson, J. In Separation of lignin and hemicelluloses from black liquor and pretreated black liquor by nanofiltration. Dep. Chem. Eng. 2013, 2, 1–6. [Google Scholar]
  17. Wallberg, O.; Holmqvist, A.; Jonsson, A.S. Ultrafiltration of kraft cooking liquors from a continuous cooking process. Desalination 2005, 180, 109–118. [Google Scholar] [CrossRef]
  18. WIPO. Wo2020002185—Alkali-Stable Nanofiltration Composite Membrane and Method of Manufacture Thereof. Available online: https://patentscope.wipo.int/search/de/detail.jsf?docId=WO2020002185&_cid=P21-KRHPKJ-42166-1 (accessed on 24 July 2021).
  19. Hegoburu, I.; Zedda, K.L.; Velizarov, S. Treatment of electroplating wastewater using nf ph-stable membranes: Characterization and application. Membranes 2020, 10, 399. [Google Scholar] [CrossRef] [PubMed]
  20. Lee, K.P.; Zheng, J.M.; Bargeman, G.; Kemperman, A.J.B.; Benes, N.E. Ph stable thin film composite polyamine nanofiltration membranes by interfacial polymerisation. J. Membr. Sci. 2015, 478, 75–84. [Google Scholar] [CrossRef]
  21. Arkell, A.; Olsson, J.; Wallberg, O. Process performance in lignin separation from softwood black liquor by membrane filtration. Chem. Eng. Res. Des. 2014, 92, 1792–1800. [Google Scholar] [CrossRef]
  22. Jonsson, A.S.; Wallberg, O. Cost estimates of kraft lignin recovery by ultrafiltration. Desalination 2009, 237, 254–267. [Google Scholar] [CrossRef]
  23. Alekhina, M.; Ershova, O.; Ebert, A.; Heikkinen, S.; Sixta, H. Softwood kraft lignin for value-added applications: Fractionation and structural characterization. Ind. Crop. Prod. 2015, 66, 220–228. [Google Scholar] [CrossRef]
  24. Liu, G.L.; Liu, Y.S.; Ni, J.R.; Shi, H.C.; Qian, Y. Treatability of kraft spent liquor by microfiltration and ultrafiltration. Desalination 2004, 160, 131–141. [Google Scholar] [CrossRef]
  25. Jonker, G.; Harmsen, J. Engineering for Sustainability: A Practical Guide for Sustainable Design; Elsevier Science: Amsterdam, The Netherlands, 2012. [Google Scholar]
  26. Brusseau, M.L.; Pepper, I.L.; Gerba, C.P. Environmental and Pollution Science; Elsevier: Amsterdam, The Netherlands, 2019. [Google Scholar]
  27. SAMCO. How Much do Microfiltration and Ultrafiltration Membrane Systems Cost? Available online: https://www.samcotech.com/how-much-do-microfiltration-and-ultrafiltration-membrane-systems-cost/ (accessed on 5 February 2021).
  28. SAMCO. How Much Do Reverse Osmosis and Nanofiltration Systems Cost? Available online: https://www.samcotech.com/much-reverse-osmosis-nanofiltration-membrane-systems-cost/ (accessed on 5 February 2021).
  29. Kaiser, M.J. Decommissioning Forecasting and Operating Cost Estimation; Kaiser, M.J., Ed.; Gulf Professional Publishing: Houston, TX, USA, 2019. [Google Scholar]
  30. Culbertson, C. Commercialization of Sustainable Bio-Refinery Projects for the Pulp & Paper Industry. Ph.D. Thesis, North Carolina State University, Raleigh, NC, USA, 2017. [Google Scholar]
  31. Ribera, G.; Clarens, F.; Martinez-Llado, X.; Jubany, I.; Marti, V.; Rovira, M. Life cycle and human health risk assessments as tools for decision making in the design and implementation of nanofiltration in drinking water treatment plants. Sci. Total Environ. 2014, 466, 377–386. [Google Scholar] [CrossRef] [PubMed]
  32. Merck | Germany—Sigma-Aldrich. Available online: https://www.sigmaaldrich.com/germany.html (accessed on 1 February 2021).
  33. Garrett, S.J. Introduction to the mathematics of finance. In Introduction to the Mathematics of Finance, 2nd ed.; Garrett, S.J., Ed.; Butterworth-Heinemann: San Diego, CA, USA, 2013. [Google Scholar]
  34. Bajwa, D.S.; Pourhashem, G.; Ullah, A.H.; Bajwa, S.G. A concise review of current lignin production, applications, products and their environmental impact. Ind Crop. Prod. 2019, 139, 111526. [Google Scholar] [CrossRef]
  35. Lea, J.F.; Nickens, H.V.; Wells, M.R. Gas well deliquification (second edition). In Gas Well Deliquification, 2nd ed.; Lea, J.F., Nickens, H.V., Wells, M.R., Eds.; Gulf Professional Publishing: Houston, TX, USA, 2008. [Google Scholar]
  36. Maguire, D.J.; Kouyoumjian, V.; Smith, R. The Business Benefits of GIS: An Roi Approach; ESRI Press; Bennett Books Ltd.: San Diego, CA, USA, 2008. [Google Scholar]
  37. Arnaboldi, M.; Azzone, G.; Giorgino, M. Performance Measurement and Management for Engineers; Academic Press: San Diego, CA, USA, 2015; pp. 1–18. [Google Scholar]
  38. Schlesinger, R.; Götzinger, G.; Sixta, H.; Friedl, A.; Harasek, M. Evaluation of alkali resistant nanofiltration membranes for the separation of hemicellulose from concentrated alkaline process liquors. Desalination 2006, 192, 303–314. [Google Scholar] [CrossRef]
Figure 1. Scenario 1, conventional treatment of black liquor using evaporators (a) and recovery boilers and Scenario 2, Proposal of this study using membrane technologies (b).
Water 13 02270 g001
Figure 2. SEM micrographs of Membrane A. (ad) top view of the membrane surface with different magnifications; (eh) cross sections at different locations.
Water 13 02270 g002
Figure 3. SEM micrographs of Membrane B. (ad) top view of the membrane surface with different magnifications; (eh) cross sections at different locations.
Water 13 02270 g003
Figure 4. NF membrane coupons tester set-up.
Water 13 02270 g004
Figure 5. Rejection of MgSO₄ for membranes A (a), B (b), and C (c) at standard conditions before and after the permeation of black liquor.
Water 13 02270 g005
Figure 6. Permeate flux of Membranes A (a), B (b) and C (c) at standard conditions before and after the permeation of black liquor.
Water 13 02270 g006
Figure 7. Rejection of MgSO4 for Membranes A (a) and B (b) before and after the static test.
Water 13 02270 g007
Figure 8. Permeate flux of Membranes A (a) and B (b) before and after the static test.
Water 13 02270 g008
Figure 9. Overall rejection based on conductivity in experiments with black liquor with membranes A, B and C.
Water 13 02270 g009
Figure 10. Permeate fluxes in experiments with black liquor with membranes A, B, and C.
Water 13 02270 g010
Figure 11. Permeate pH in experiments with black liquor with membranes A, B, and C.
Water 13 02270 g011
Figure 12. Rejection of Na⁺ for membranes A, B, and C in the second experiment.
Water 13 02270 g012
Figure 13. Rejection of Mg2⁺ for membranes A, B, and C in the second experiment.
Water 13 02270 g013
Table 1. List of Chemicals used in the experiments.
ChemicalSupplierPurity
MgSO4, 7H2OSigma Aldrich99.5%
Kraft ligninSigma AldrichN.A.
XylanCarbosynthN.A.
NaOHMerck50%
Na2CO3Alfa Aesar99.5%
Citric acidSigma Aldrich99.5%
N.A., not applicable. The molecular weight of the xylan used for the experiments was 300–900 Da.
Table 2. Examples of compositions of black liquor reported in literature.
References
[13][13][13][21][21][21][21][22][22][22][22][23]Average
Content
(g L−1)
Before UFLignin85.0056.3033.7026.0059.0062.0057.0058.0069.0063.8056.00-56.89
After UFXylan-1.680.33-1.50----1.17--1.17
NaOH--41.00----13.0013.00---22.33
Na2CO3-----------3.503.50
Na2S2O3-----------5.805.80
Na2S-----------1.111.11
Mg-----12.009.20---43.70-21.63
Table 3. Size distribution of alkali lignin at pH 11. Reproduced with permission from [24].
Molecular Weight (kDa)Percentage (%)
>6061.8
60–3021.8
30–101.2
10–61.8
6–32.4
<311.0
Table 4. Composition of the simulated black liquor used in the experiments.
ComponentContent (g L−1 of Black Liquor)
Lignin8.65
Xylan1.17
NaOH12.00
Na2CO33.50
MgSO413.24
Table 5. Requirement of chemicals.
ProcessMaterialRequirementCostReference
CausticizationLime0.0616 kg m−30.0810 EUR kg−1[30]
CausticizationNatural gas0.2310 MJ m30.0040 EUR MJ−1[30]
CleaningNaOH9 × 10−5 kg m337.5000 EUR kg−1[31,32]
CleaningEDTA8.5000 × 10−6 L m3180 EUR L−1[31,32]
CleaningNaOH9 × 10−5 kg m337.5000 EUR kg−1[31,32]
CleaningEDTA8.5000 × 10−6 L m3180 EUR L−1[31,32]
Table 6. Average permeate concentration and rejection of TOC, CO32, SO42, and OH for Membranes A, B, and C.
Membrane AMembrane BMembrane C
TOC concentration (mg L−1)314.5 ± 73.590.5 ± 12.7373.1 ± 11.2
TOC rejection (%)92.5 ± 2.097.9 ± 0.391.2 ± 0.3
CO32- concentration (mg L−1)882.8 ± 96.8533.2 ± 26.11075.7 ± 29.5
CO32− rejection (%)84.1 ± 21.590.4 ± 1.080.7 ± 1.0
SO42− concentration (mg L−1)598.5 ± 135.871.7 ± 16.9892.8 ± 52.5
SO42− rejection (%)88.7 ± 2.698.6 ± 0.383.1 ± 1.0
OH concentration (mg L−1)511.4 ± 30.7294.5 ± 34.1569.3 ± 24.6
OH rejection (%)−318 ± 25.0−141 ± 28.0−365 ± 20.0
Table 7. Charge balance of the feed and the permeate from Membranes A, B, and C.
ContributionCharge (Feed)
meq L−1
ABC
Cations+350.6+65.2+25.7+95.7
Anions−299.3−71.5−36.3−87.3
Unknown−51.3−6.2−10.6+8.4
Table 8. Income data in Scenarios 1 and 2.
Scenario 1 (EUR per Year)Scenario 2 (EUR per Year)
Gross Profit (Savings—Operational costs)−576,352.701,188,159.10
Indirect Manufacturing Costs817,364.30967,312.20
EBITDA (Earnings before interest, taxes, depreciation and amortization)−1,393,717.0220,846.90
Depreciation0.0084,204.80
Pretax profit−1,393,717.00136,642.10
Income tax306,617.8030,061.30
Profit after taxes−1,087,099.20106,580.90
Table 9. Evaluation of the investment project—Scenario 2.
Project EvaluationResult
Discount rate/Opportunity cost of capital15.00%
NPV (Net Present Value)51,033.80 EUR
IRR (Internal Rate of Return)16.59%
Payback period5 years
Publisher’s Note: MDPI stays neutral with regard to jurisdictional claims in published maps and institutional affiliations.

