
3D GIS Platform for Flood Wargame: A Case Study of New Taipei City, Taiwan


Abstract
:1. Introduction
1.1. Educational Flooding Wargame
1.2. Flooding Wargame System Using Modeling Scenarios
1.3. Other Flood Game Tools
1.4. Comparison of Flooding Games
1.5. Flooded Area Assessment Using Elevation Data
2. Methods
The Flood Wargame Assistance Platform (FWGAP)
- Analysis of user needs.
- (1)
- Assessments of flooded areas:
- (2)
- Assessments of affected populations.
- (3)
- Estimations of vulnerable residents.
- (4)
- Selecting evacuation shelters.
- (5)
- Assessments of disaster relief resources.
- 2.
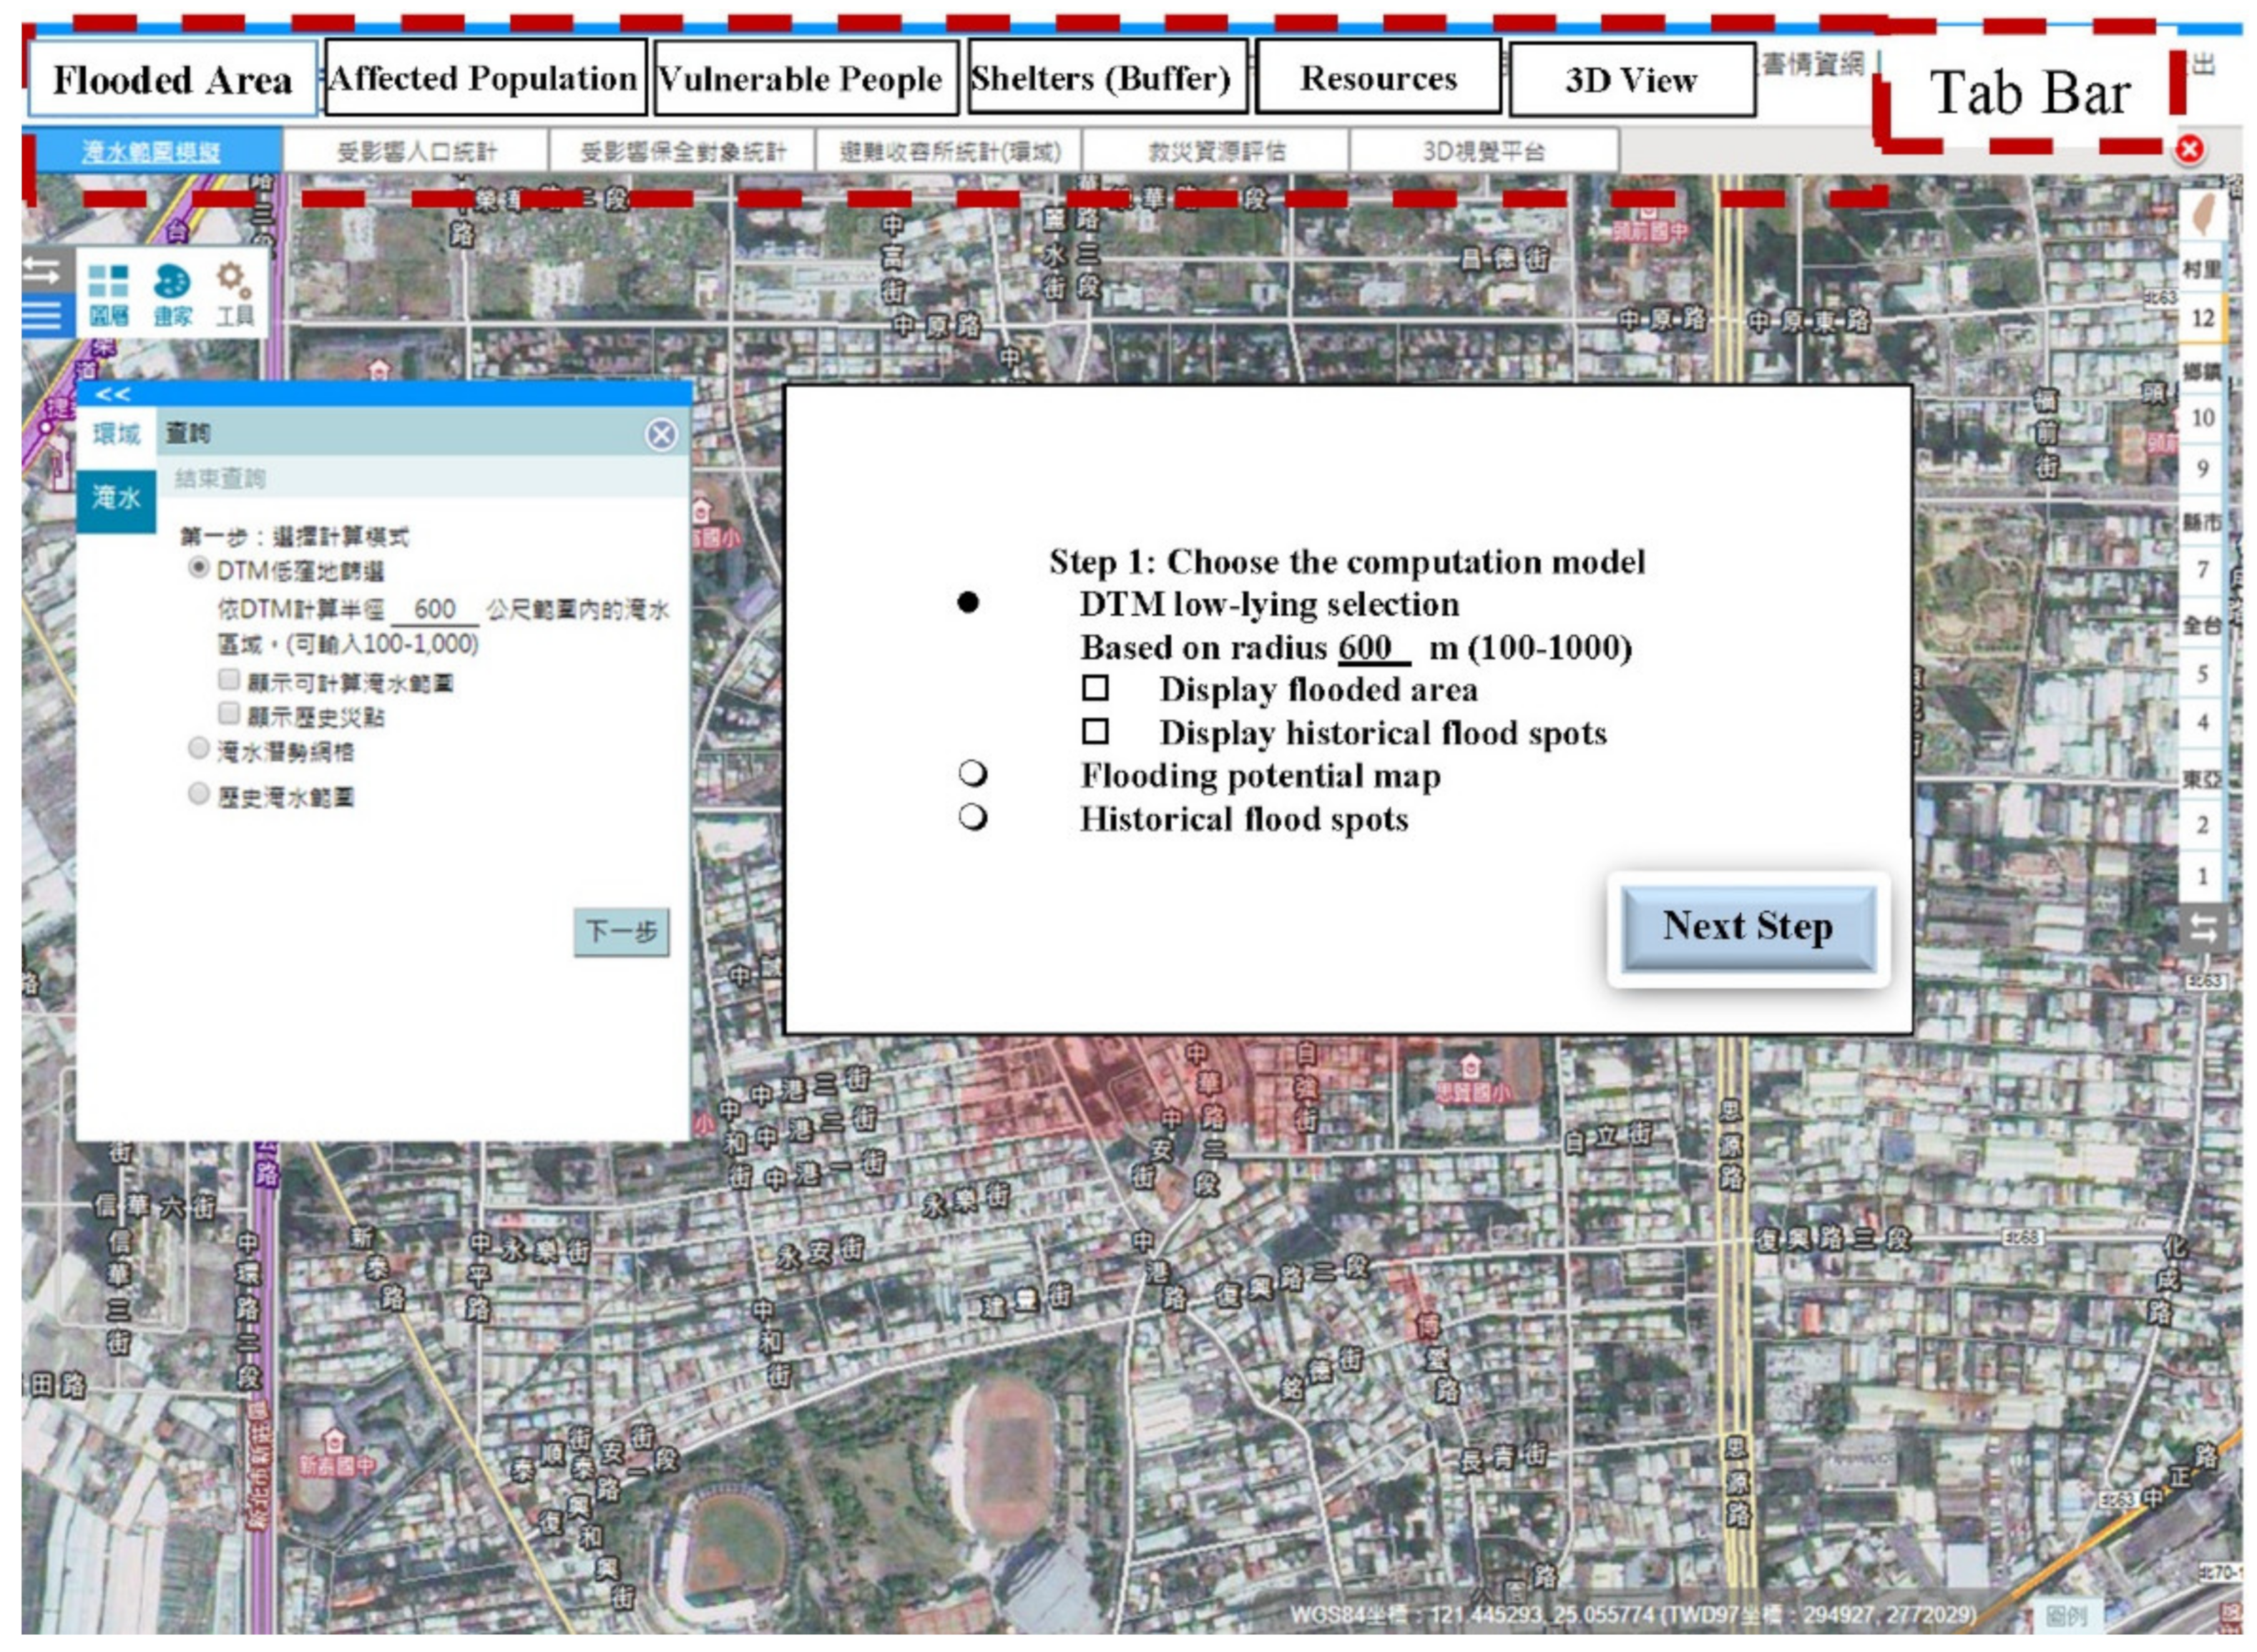
- Function Development
- (1)
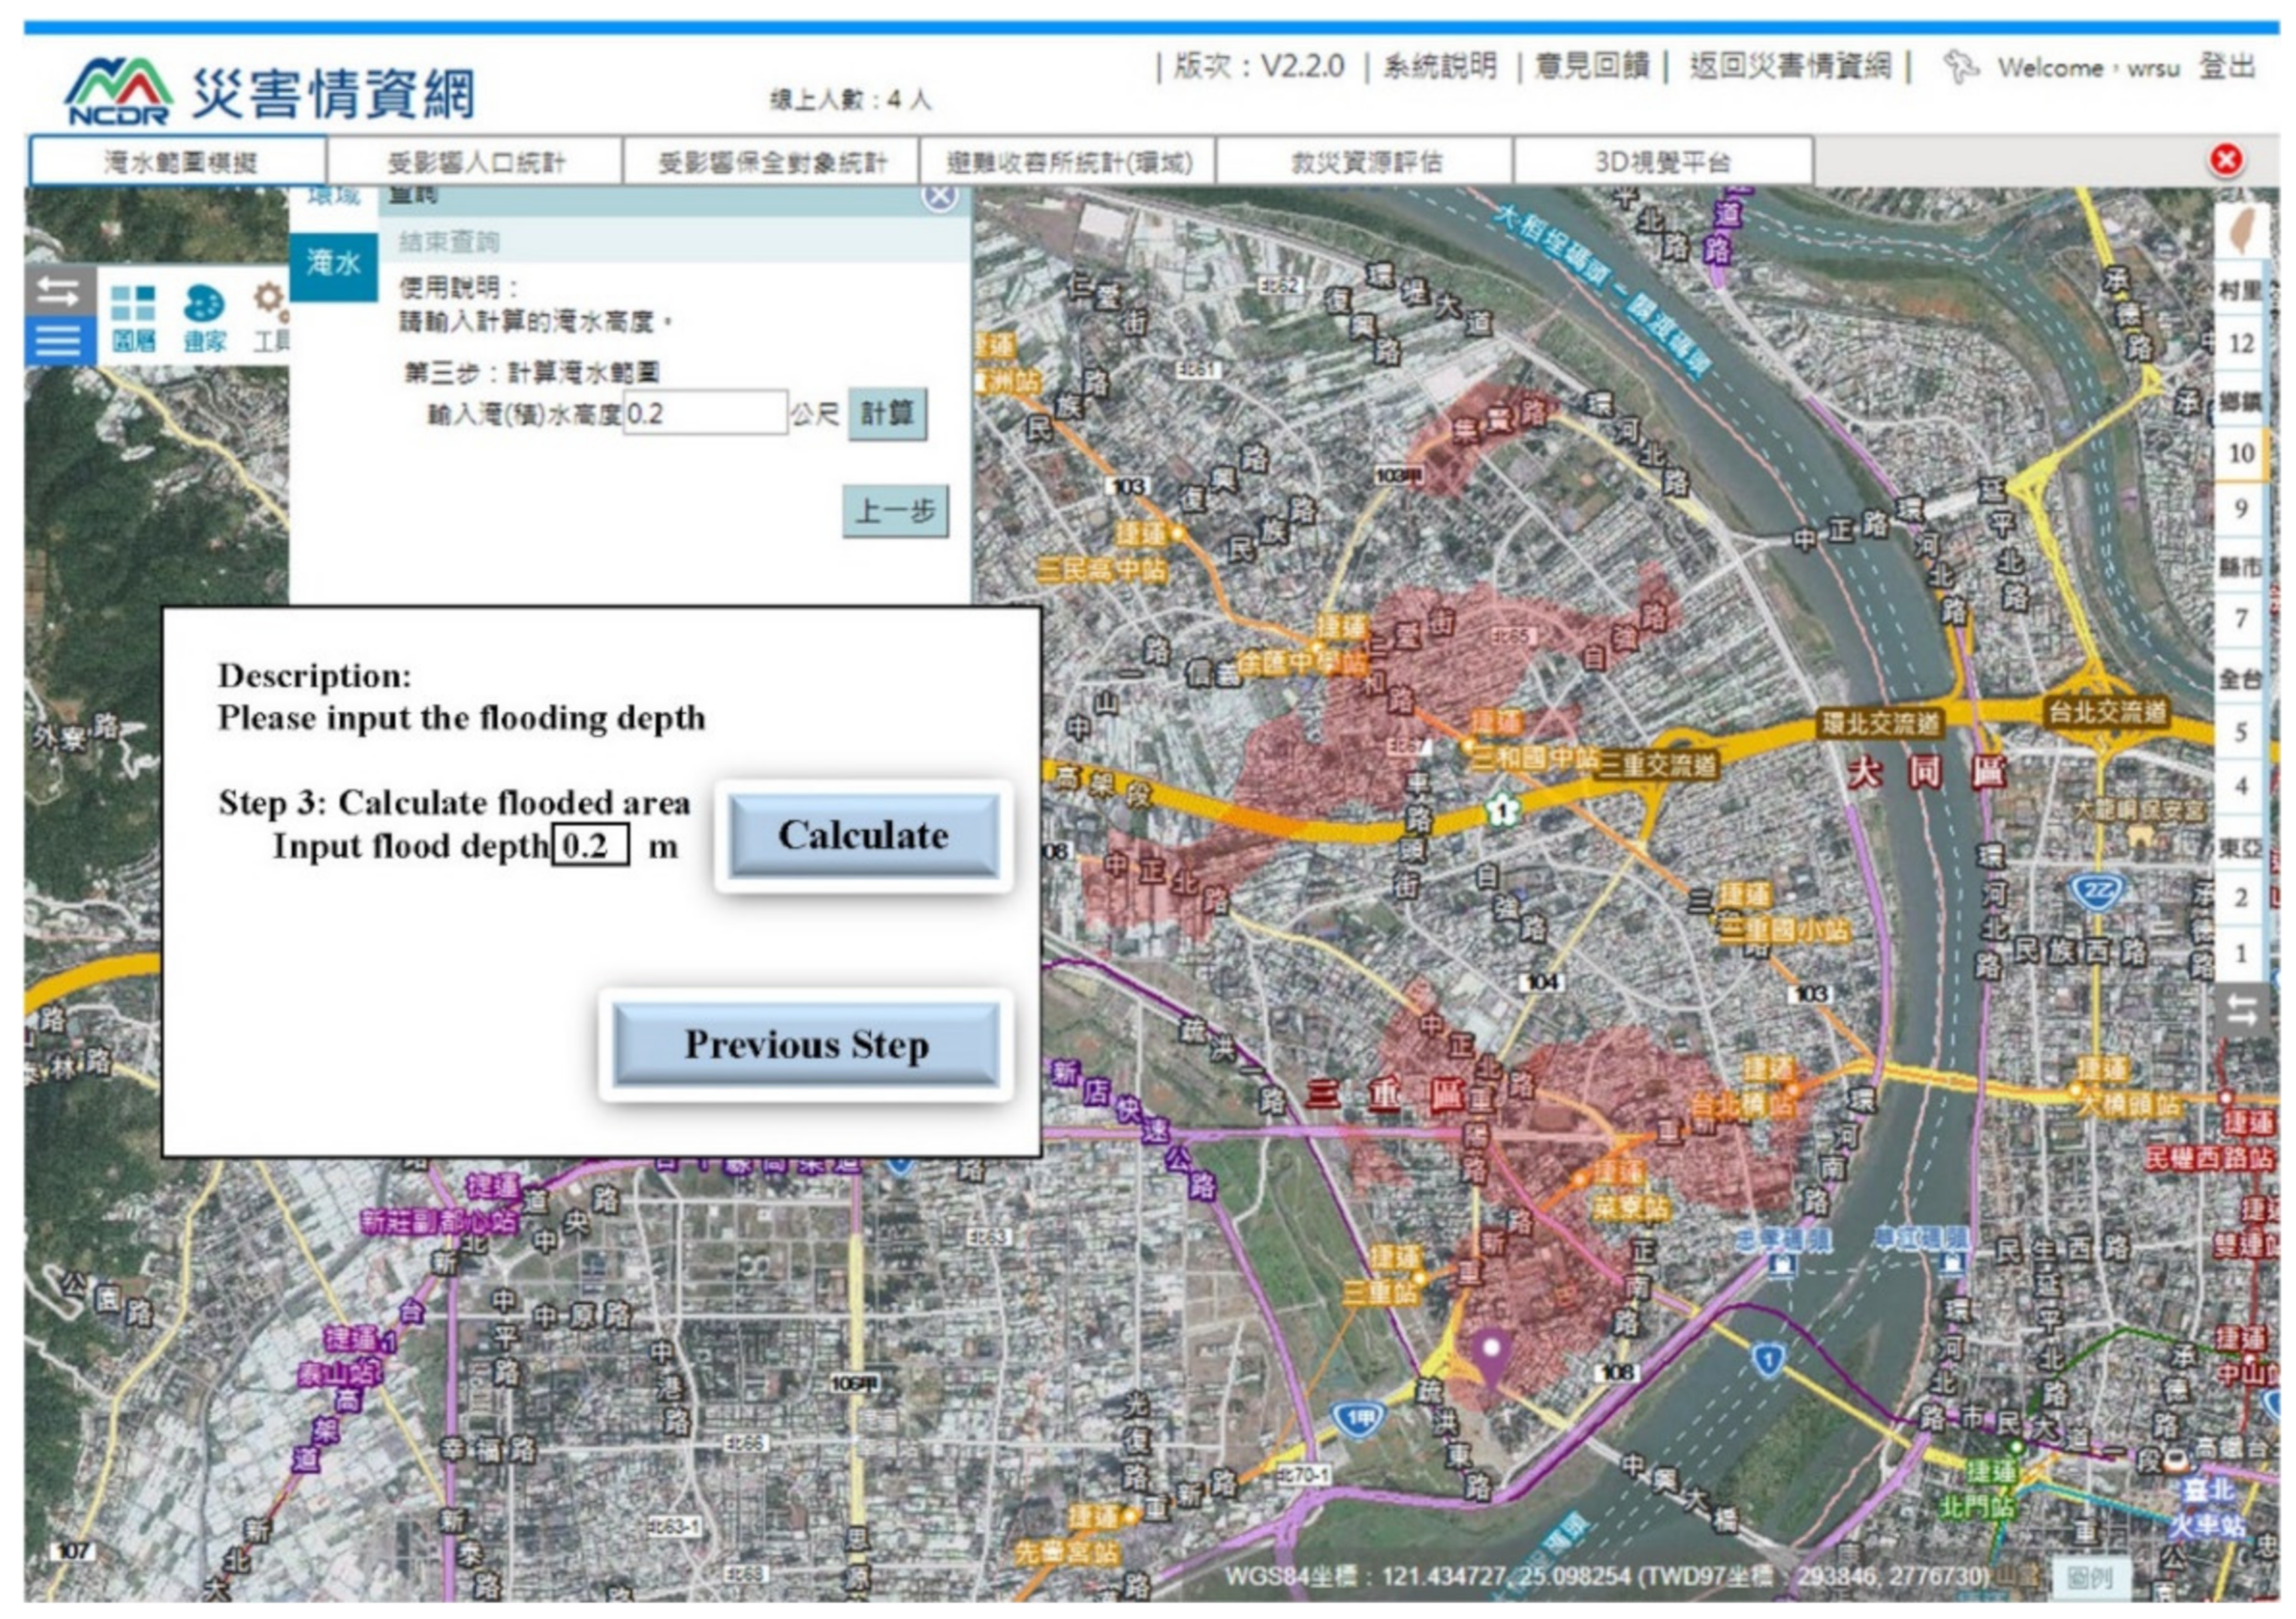
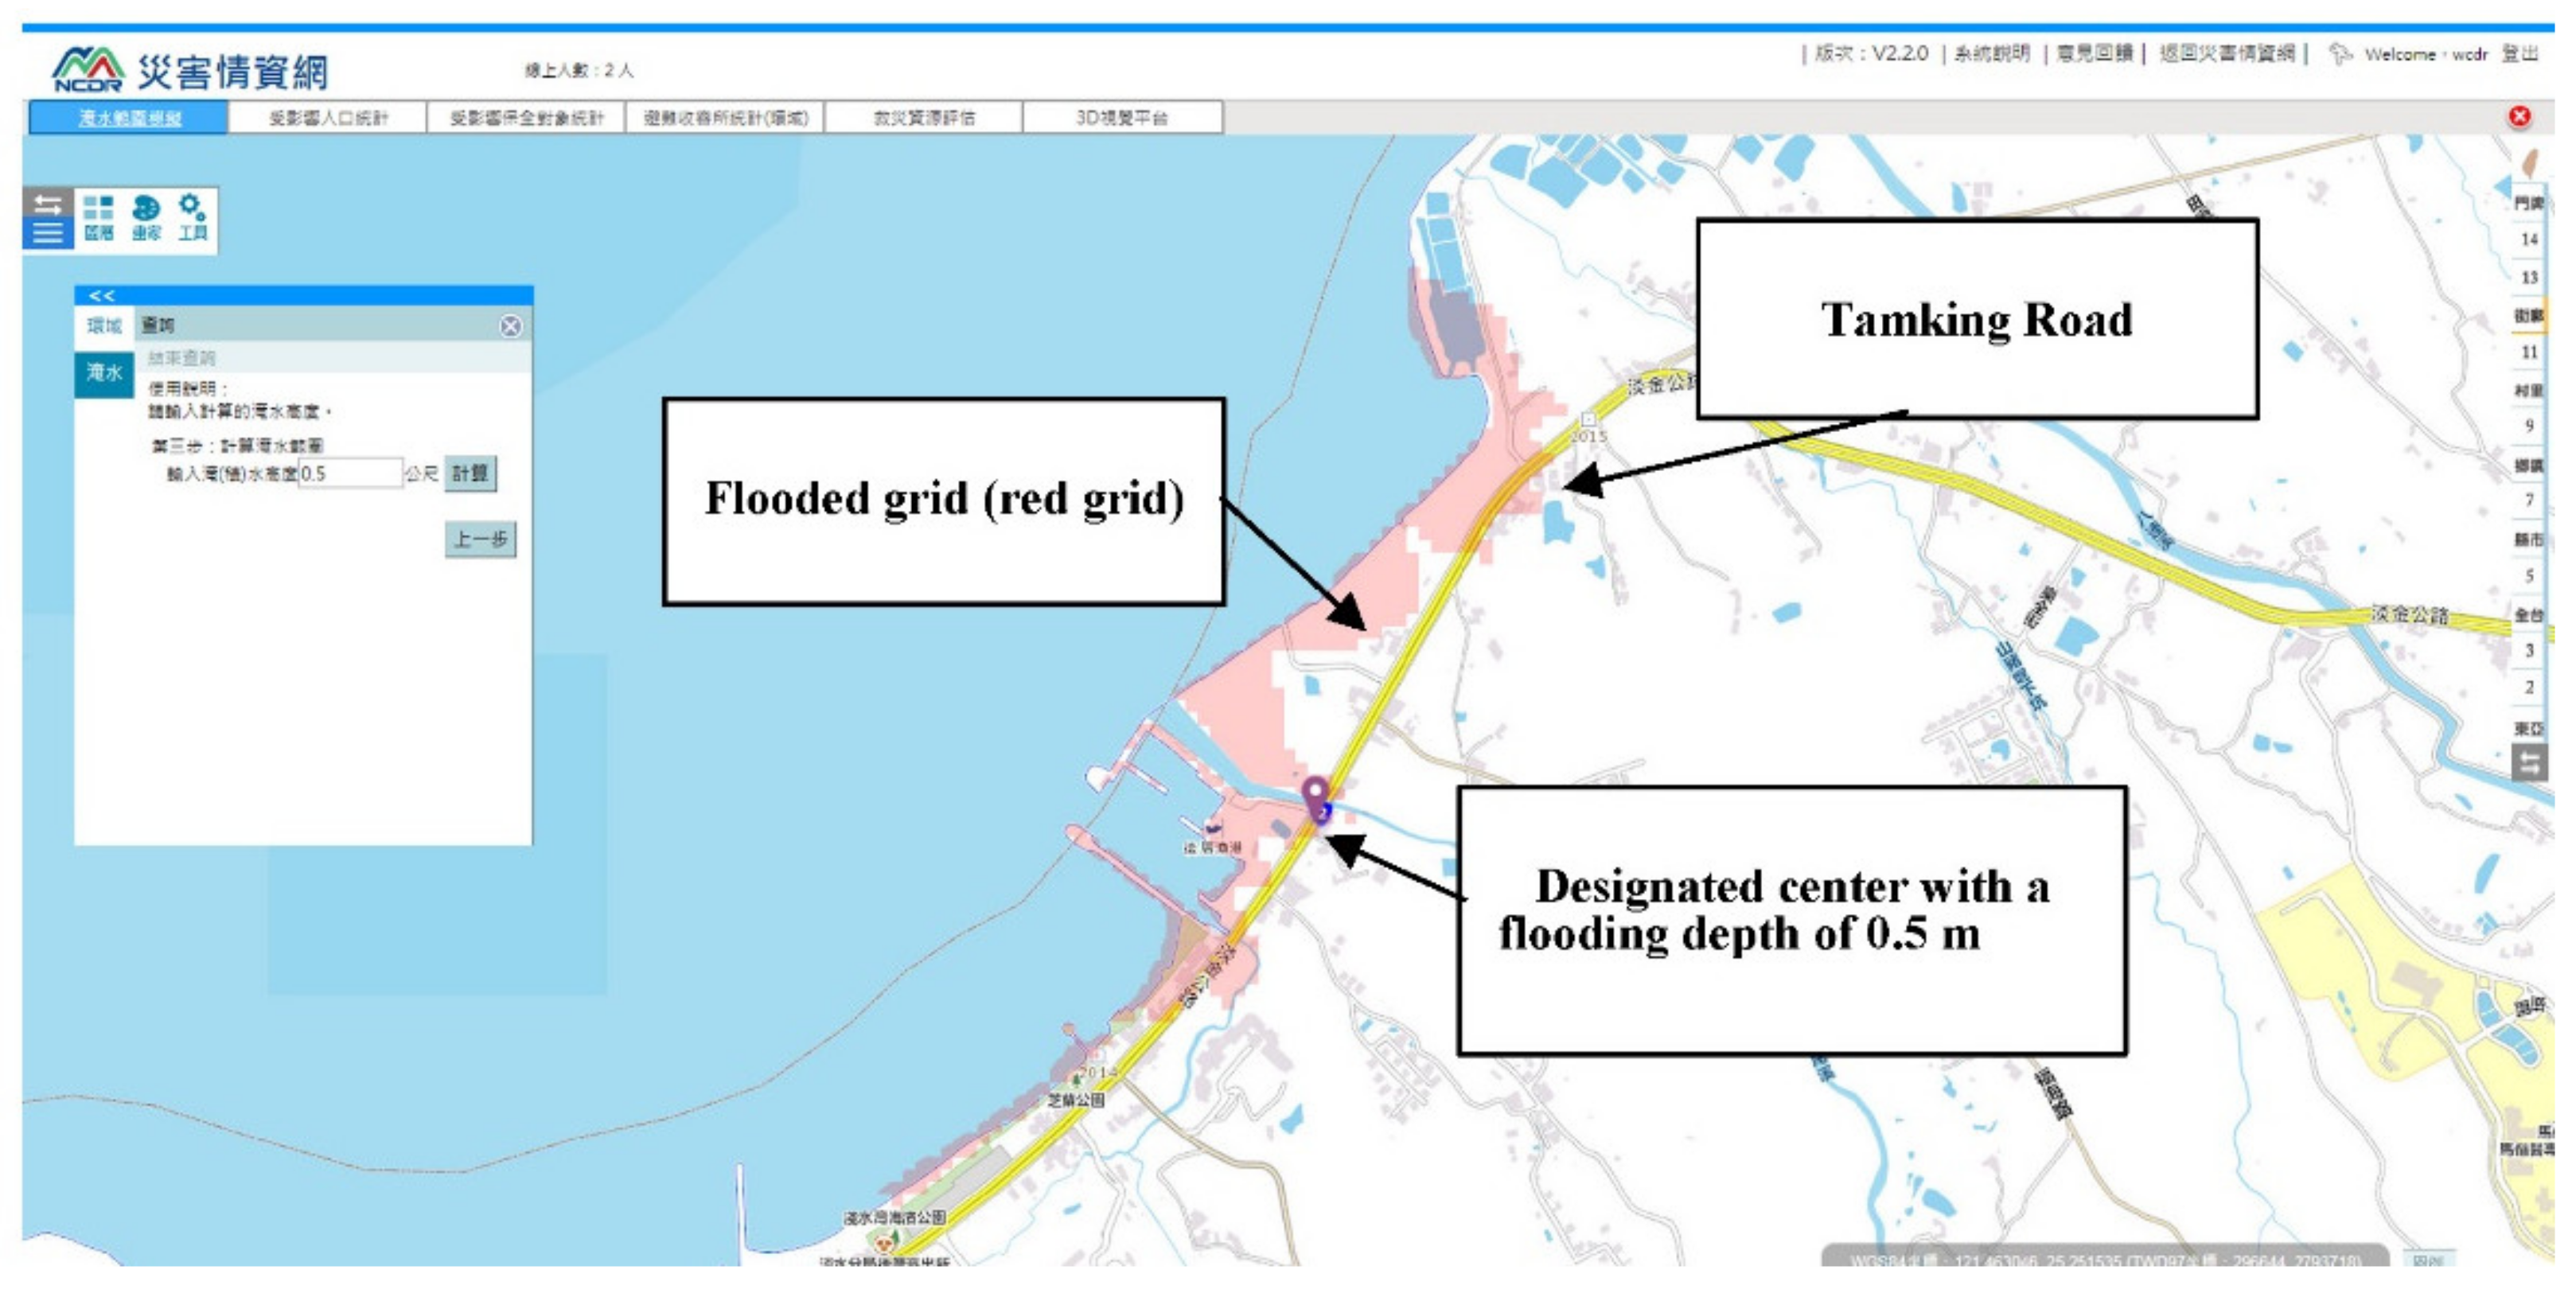
- Tab 1: Calculation of the flooded area.
- (2)
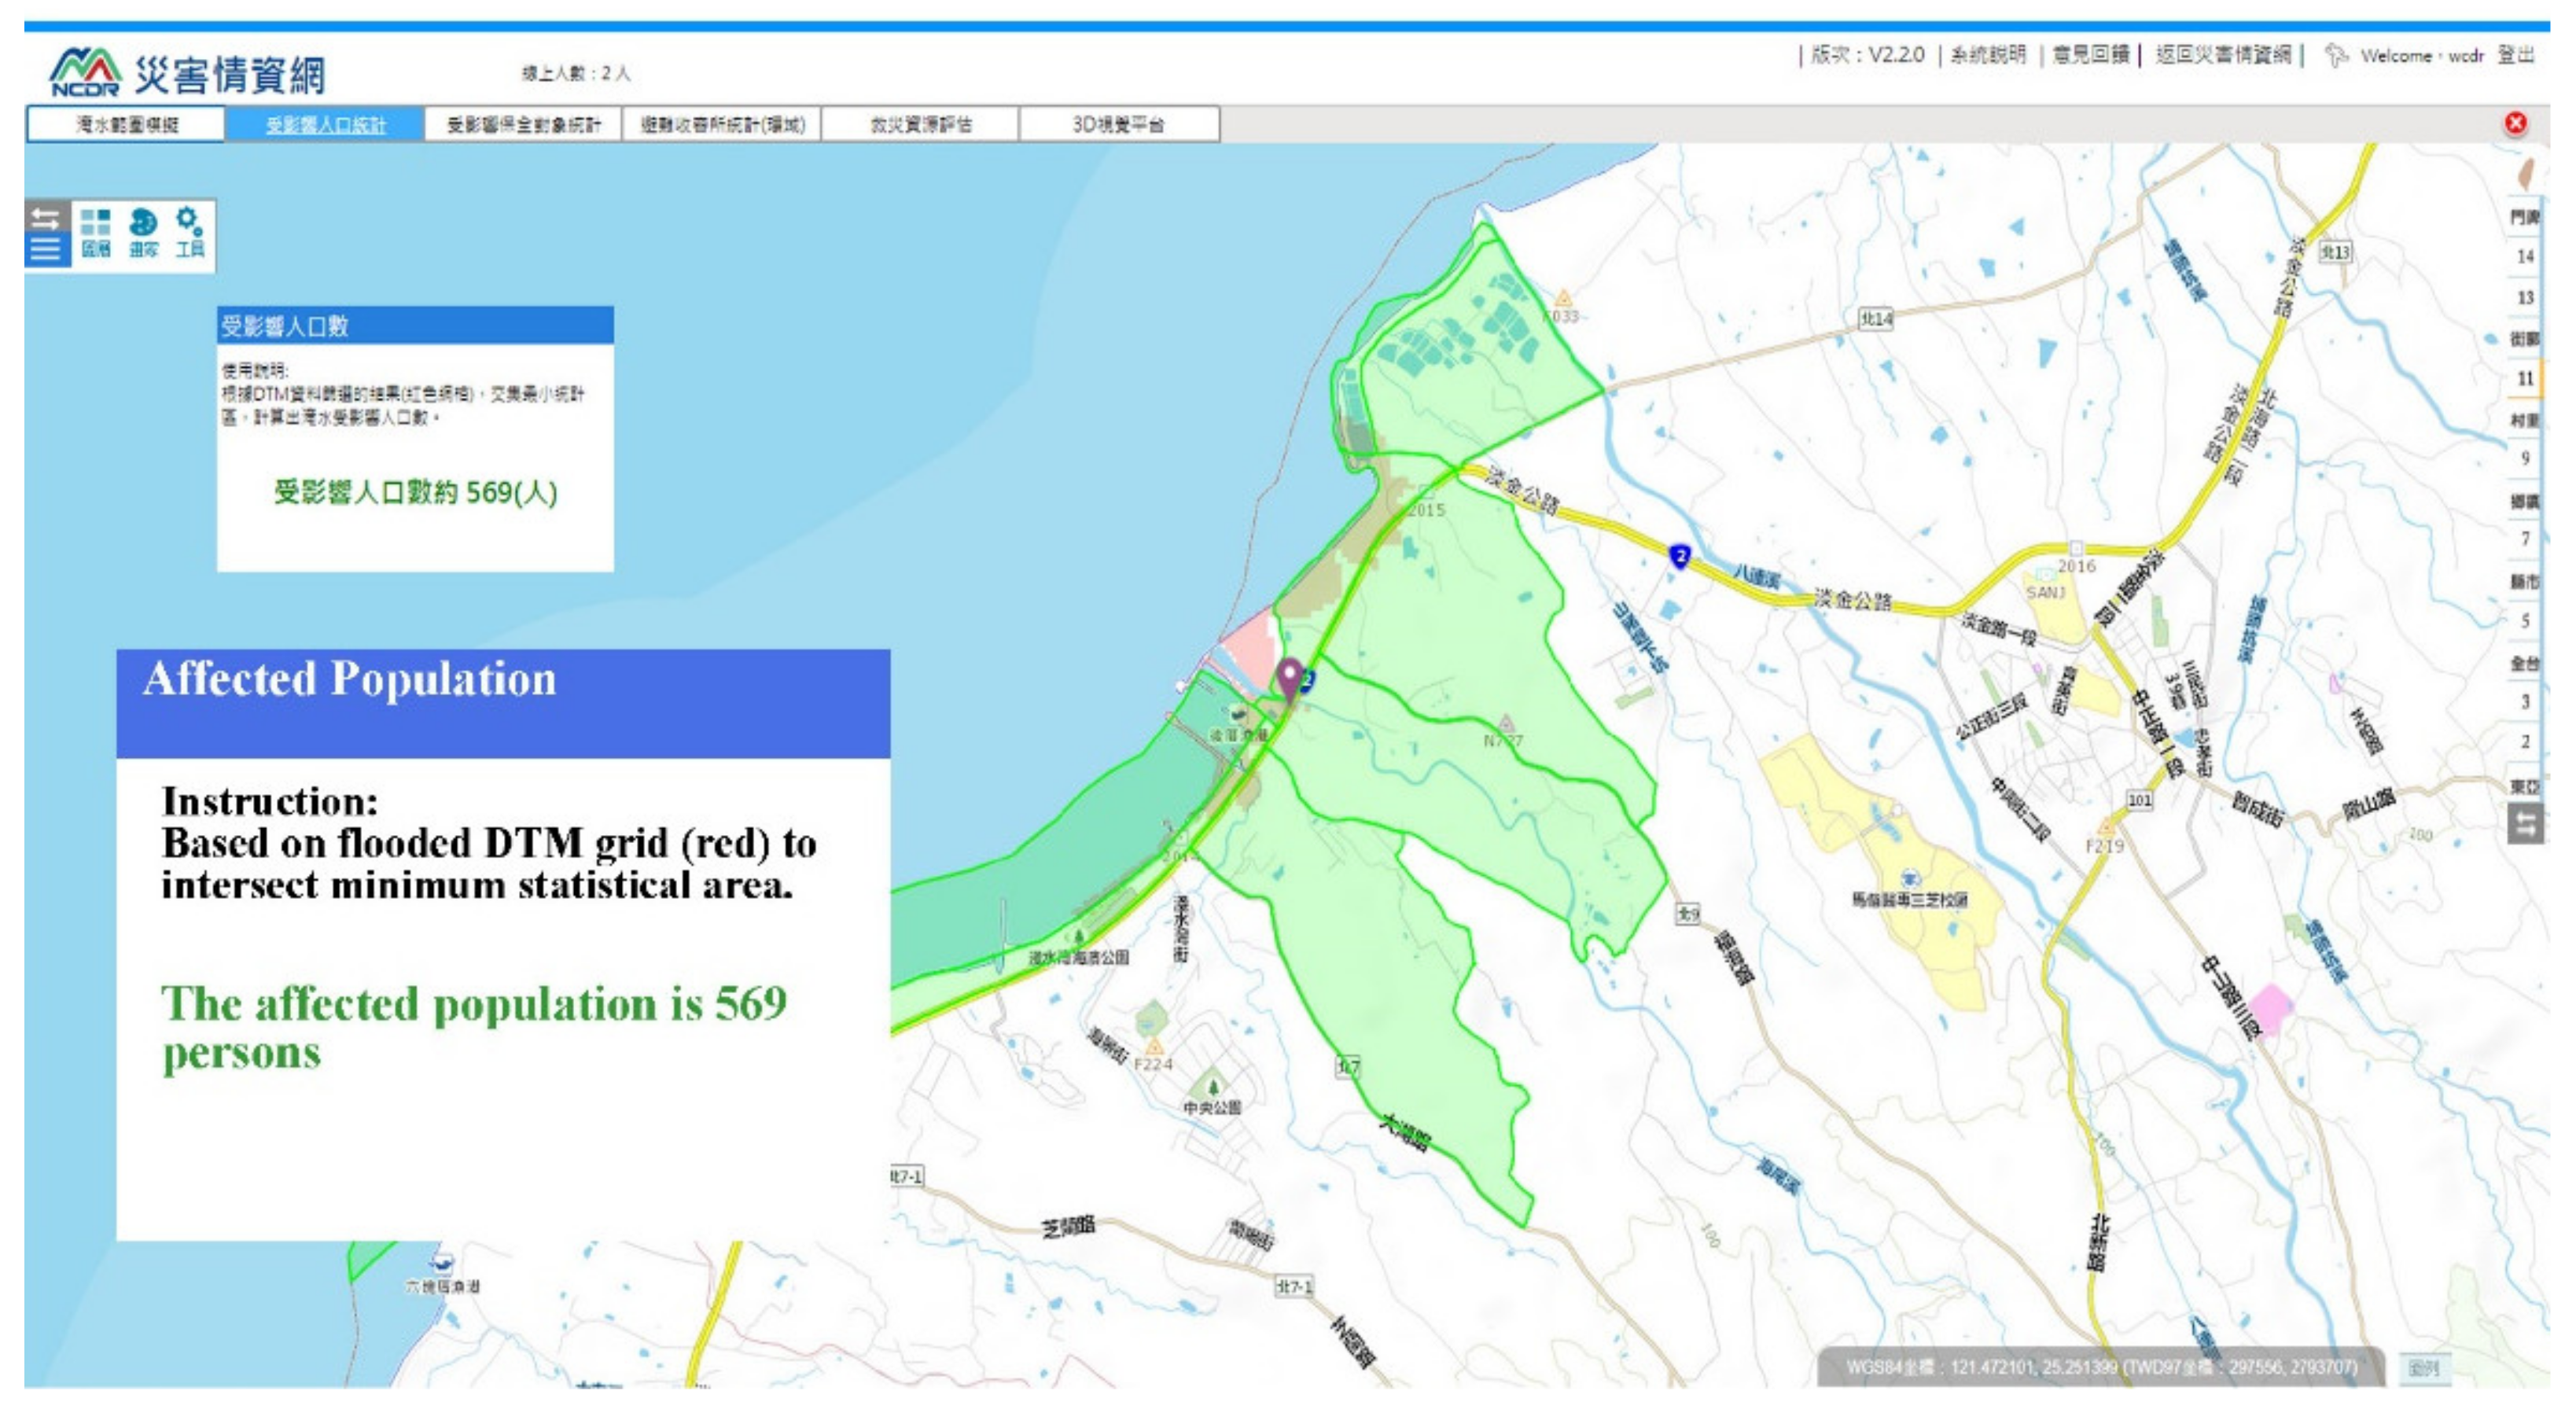
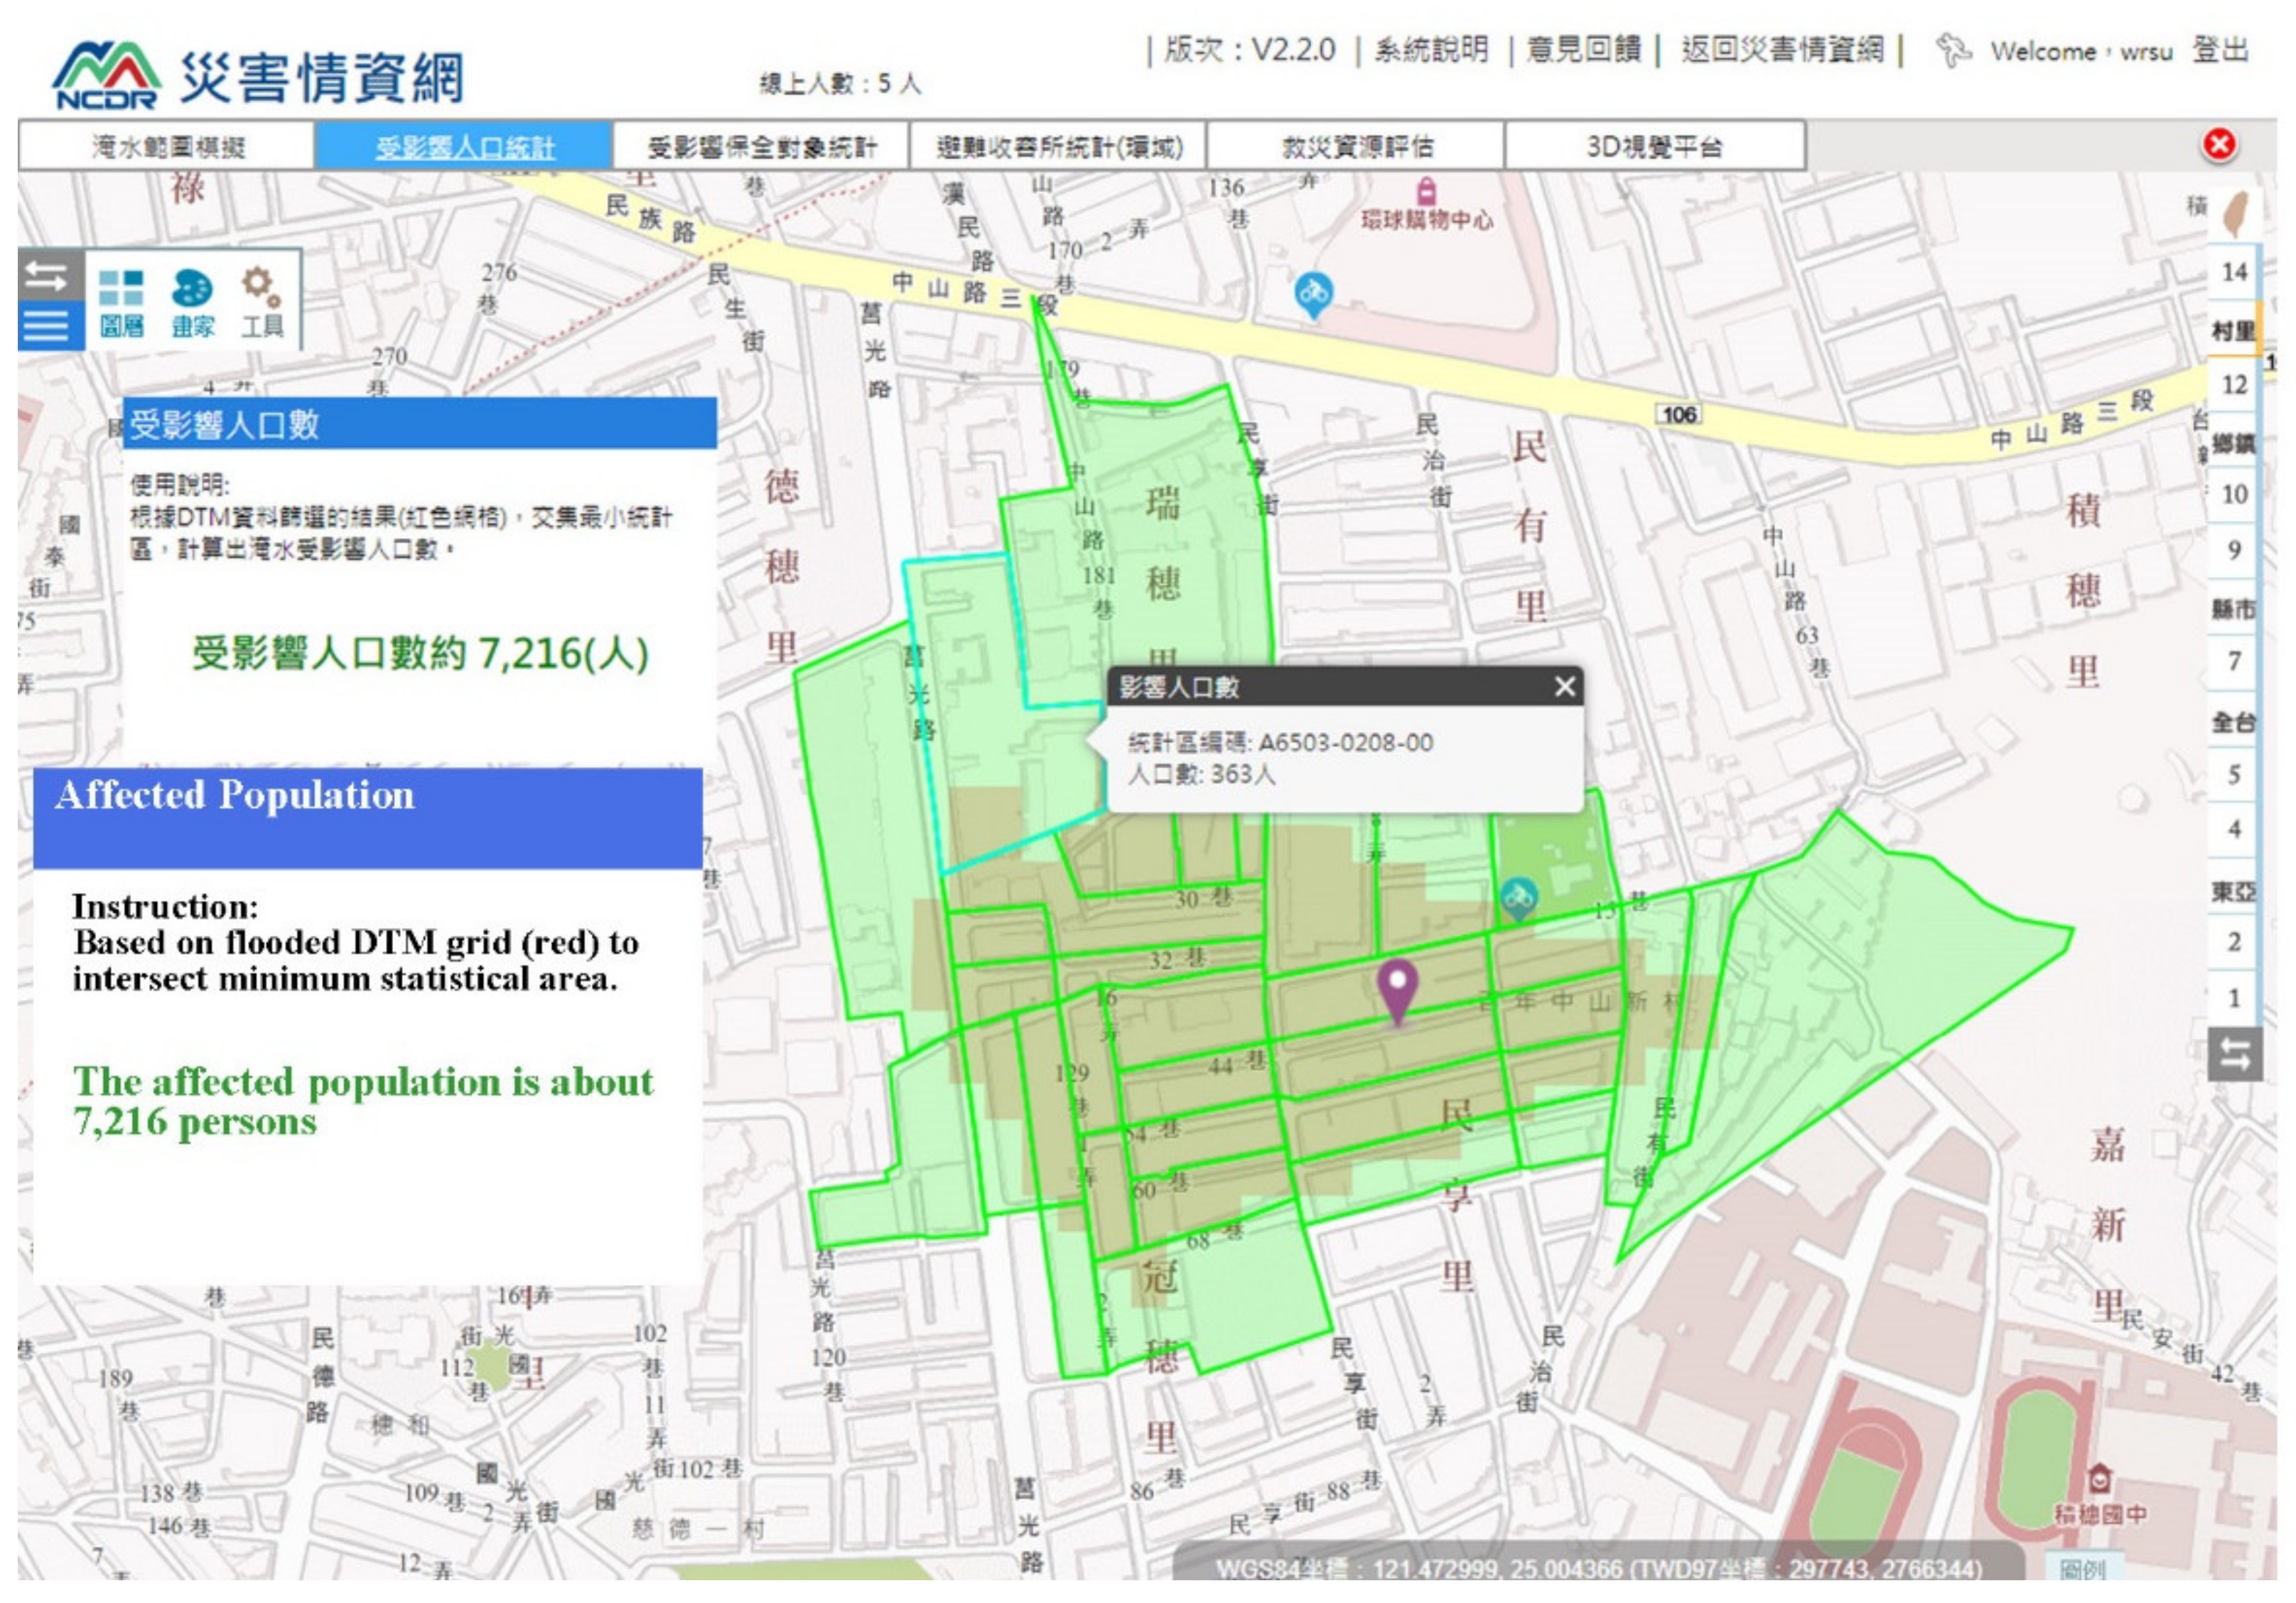
- Tab 2: Computation of the affected population.Following the spatial calculation of the flooded grid using Tab 1, the affected population data are filtered using the GP service, resulting in the number of affected people displayed on the map screen. The filtering criteria are based on population statistic units that are colored light green in Figure 8. In this example, the affected population comprised 7216 persons.
- (3)
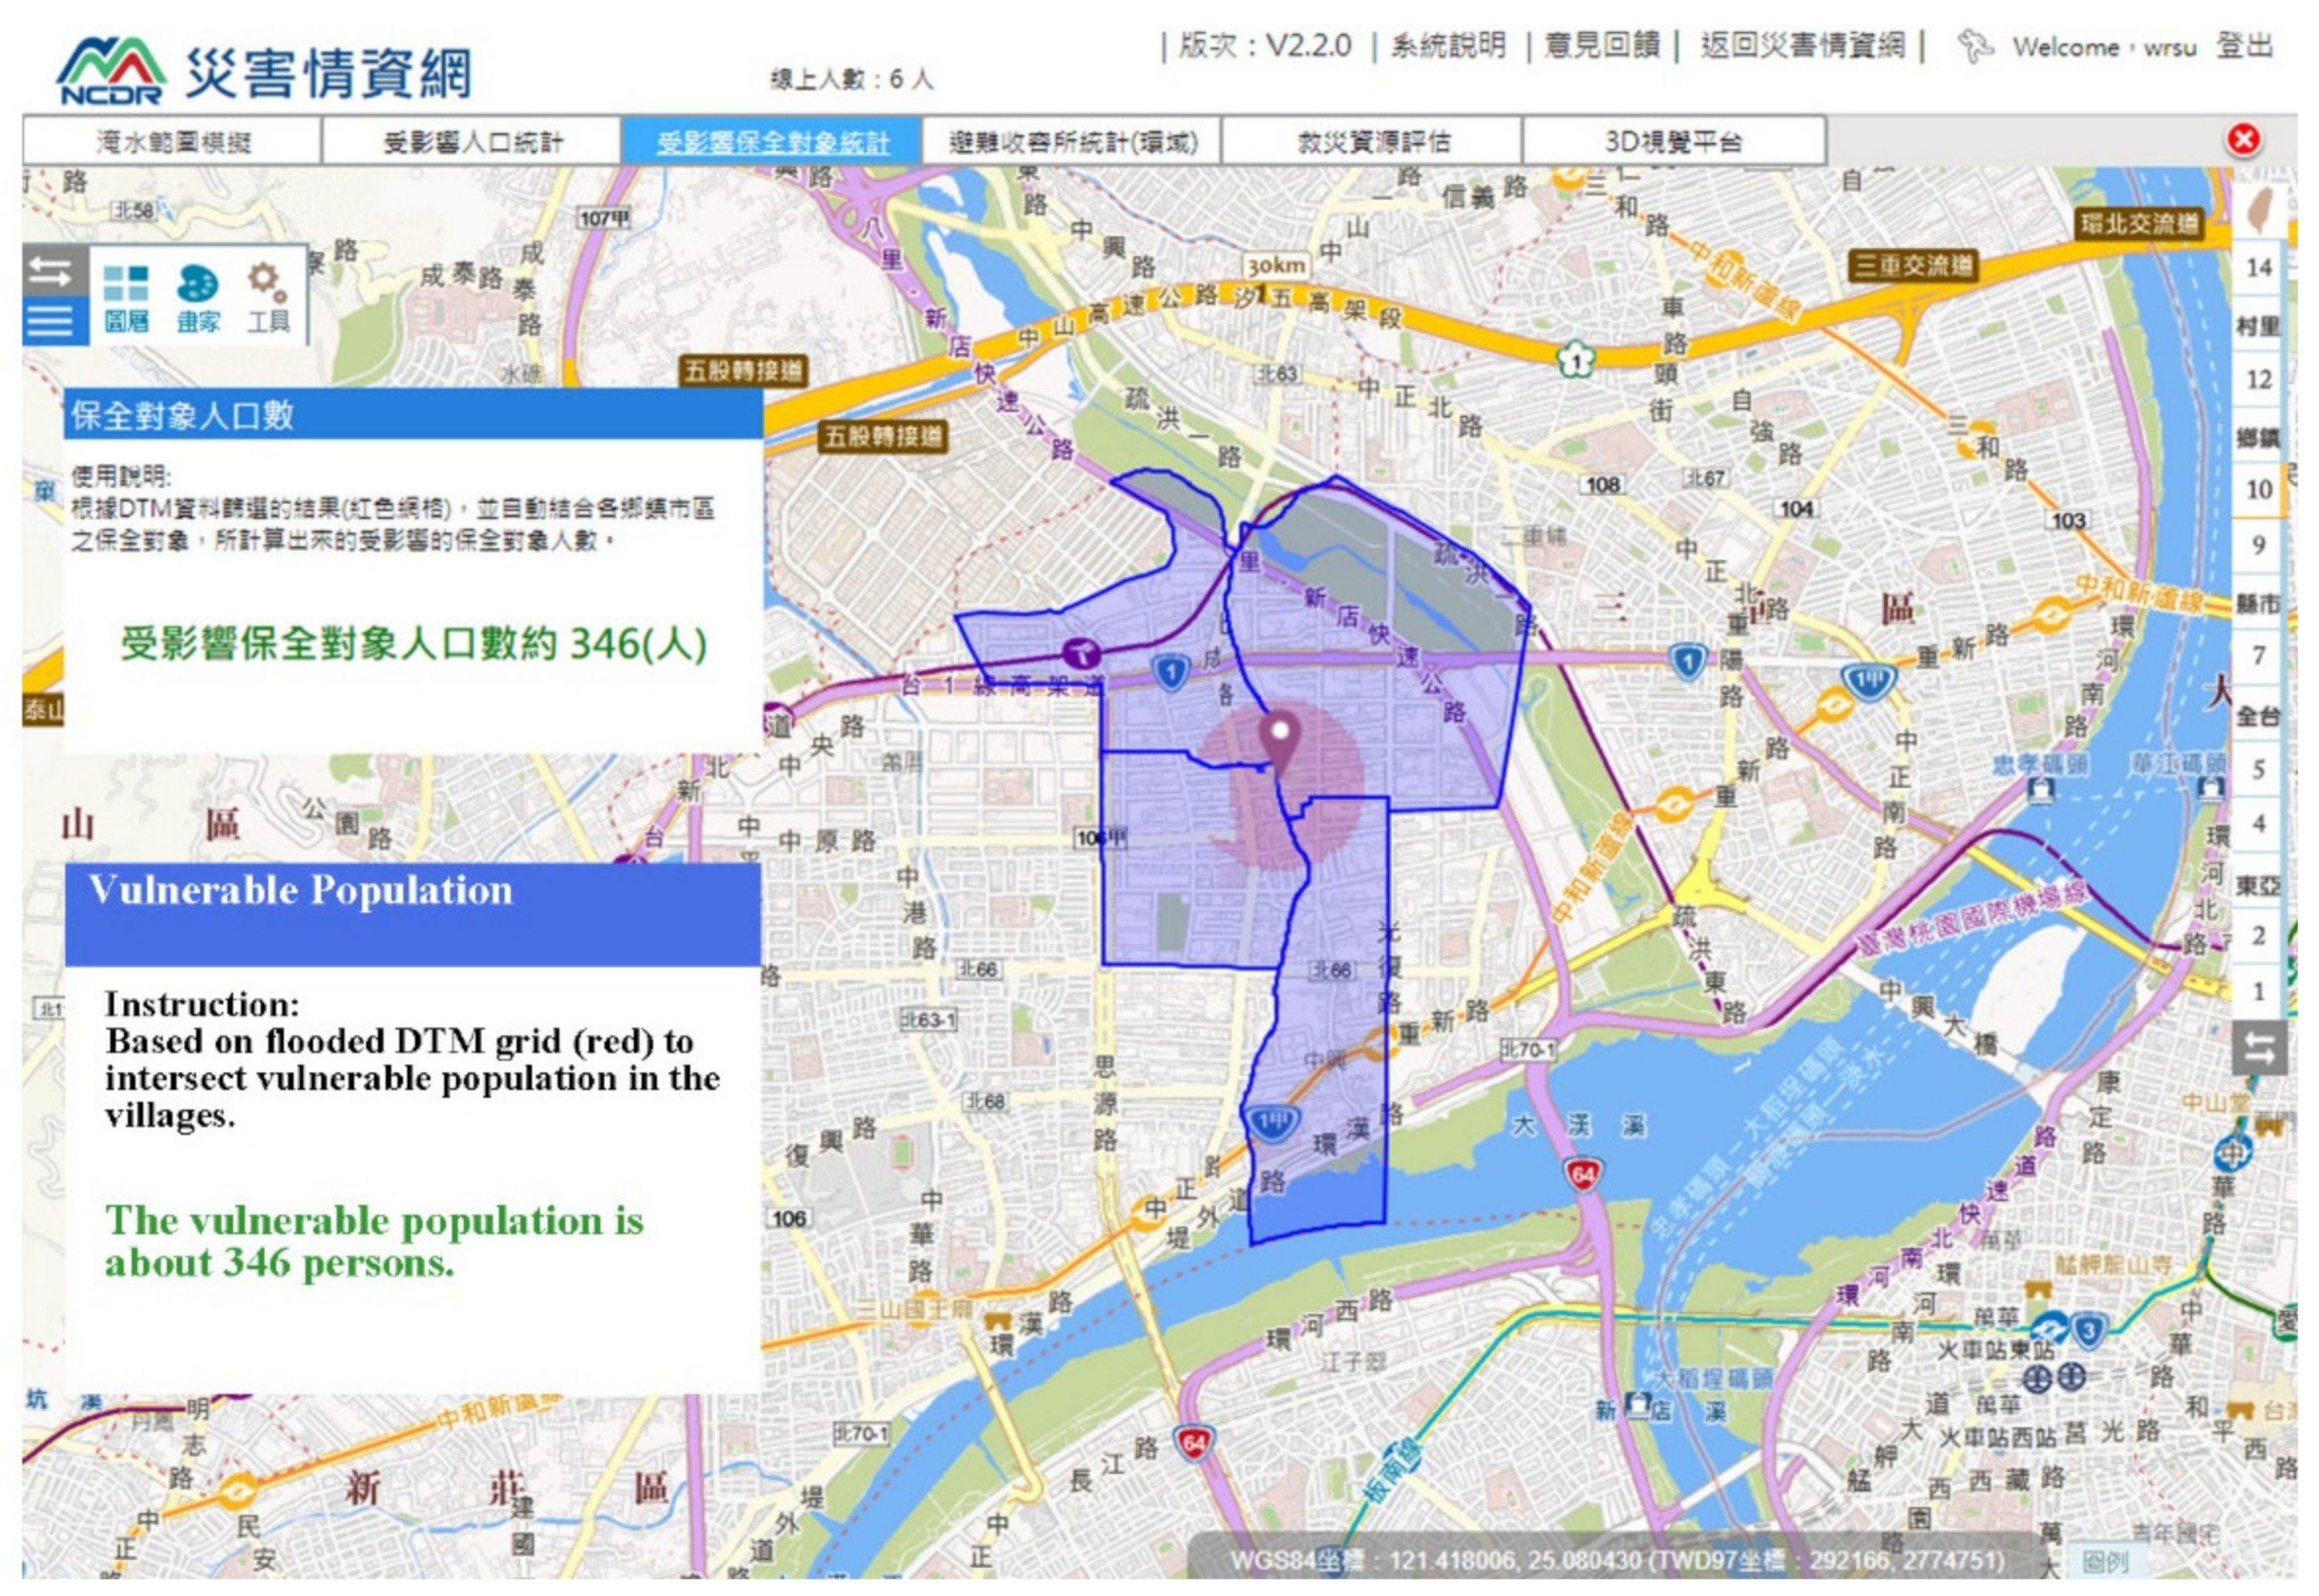
- Tab 3: Estimating the vulnerable population.The vulnerable population can be estimated using spatial analysis according to the flooded grids. Figure 9 shows the result of an illustrative scenario with 346 vulnerable persons, including elderly or disabled individuals.
- (4)
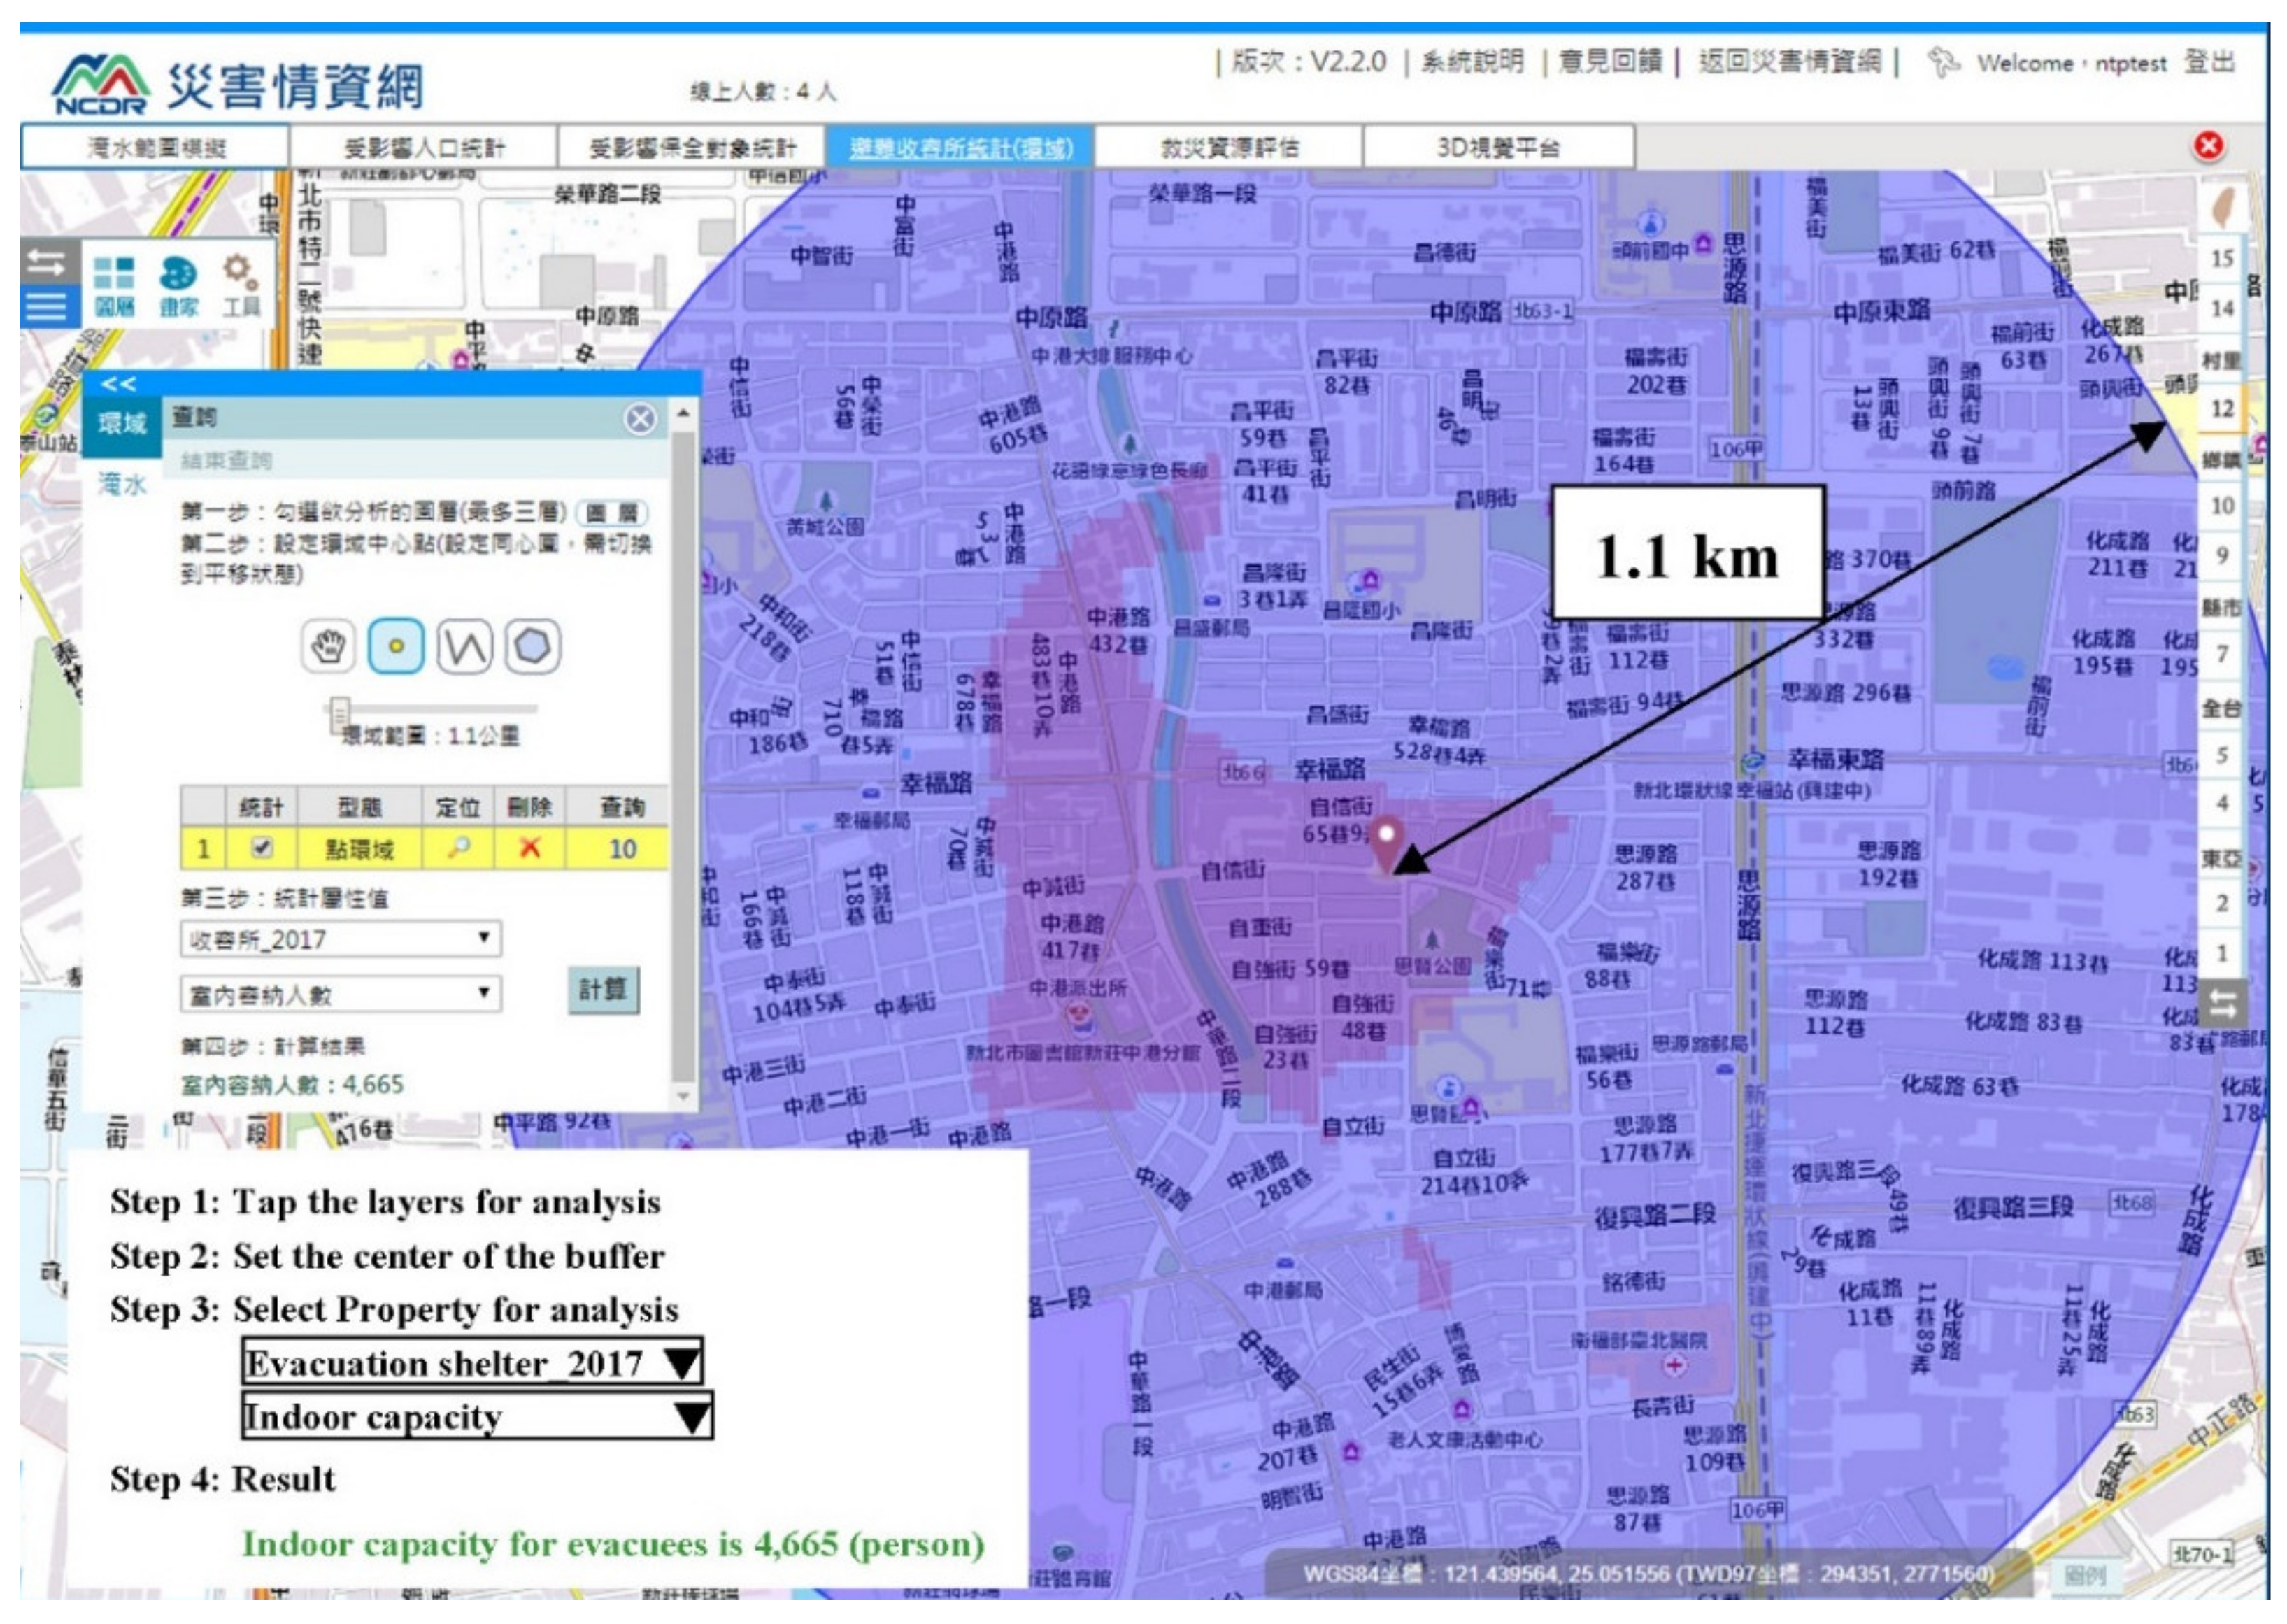
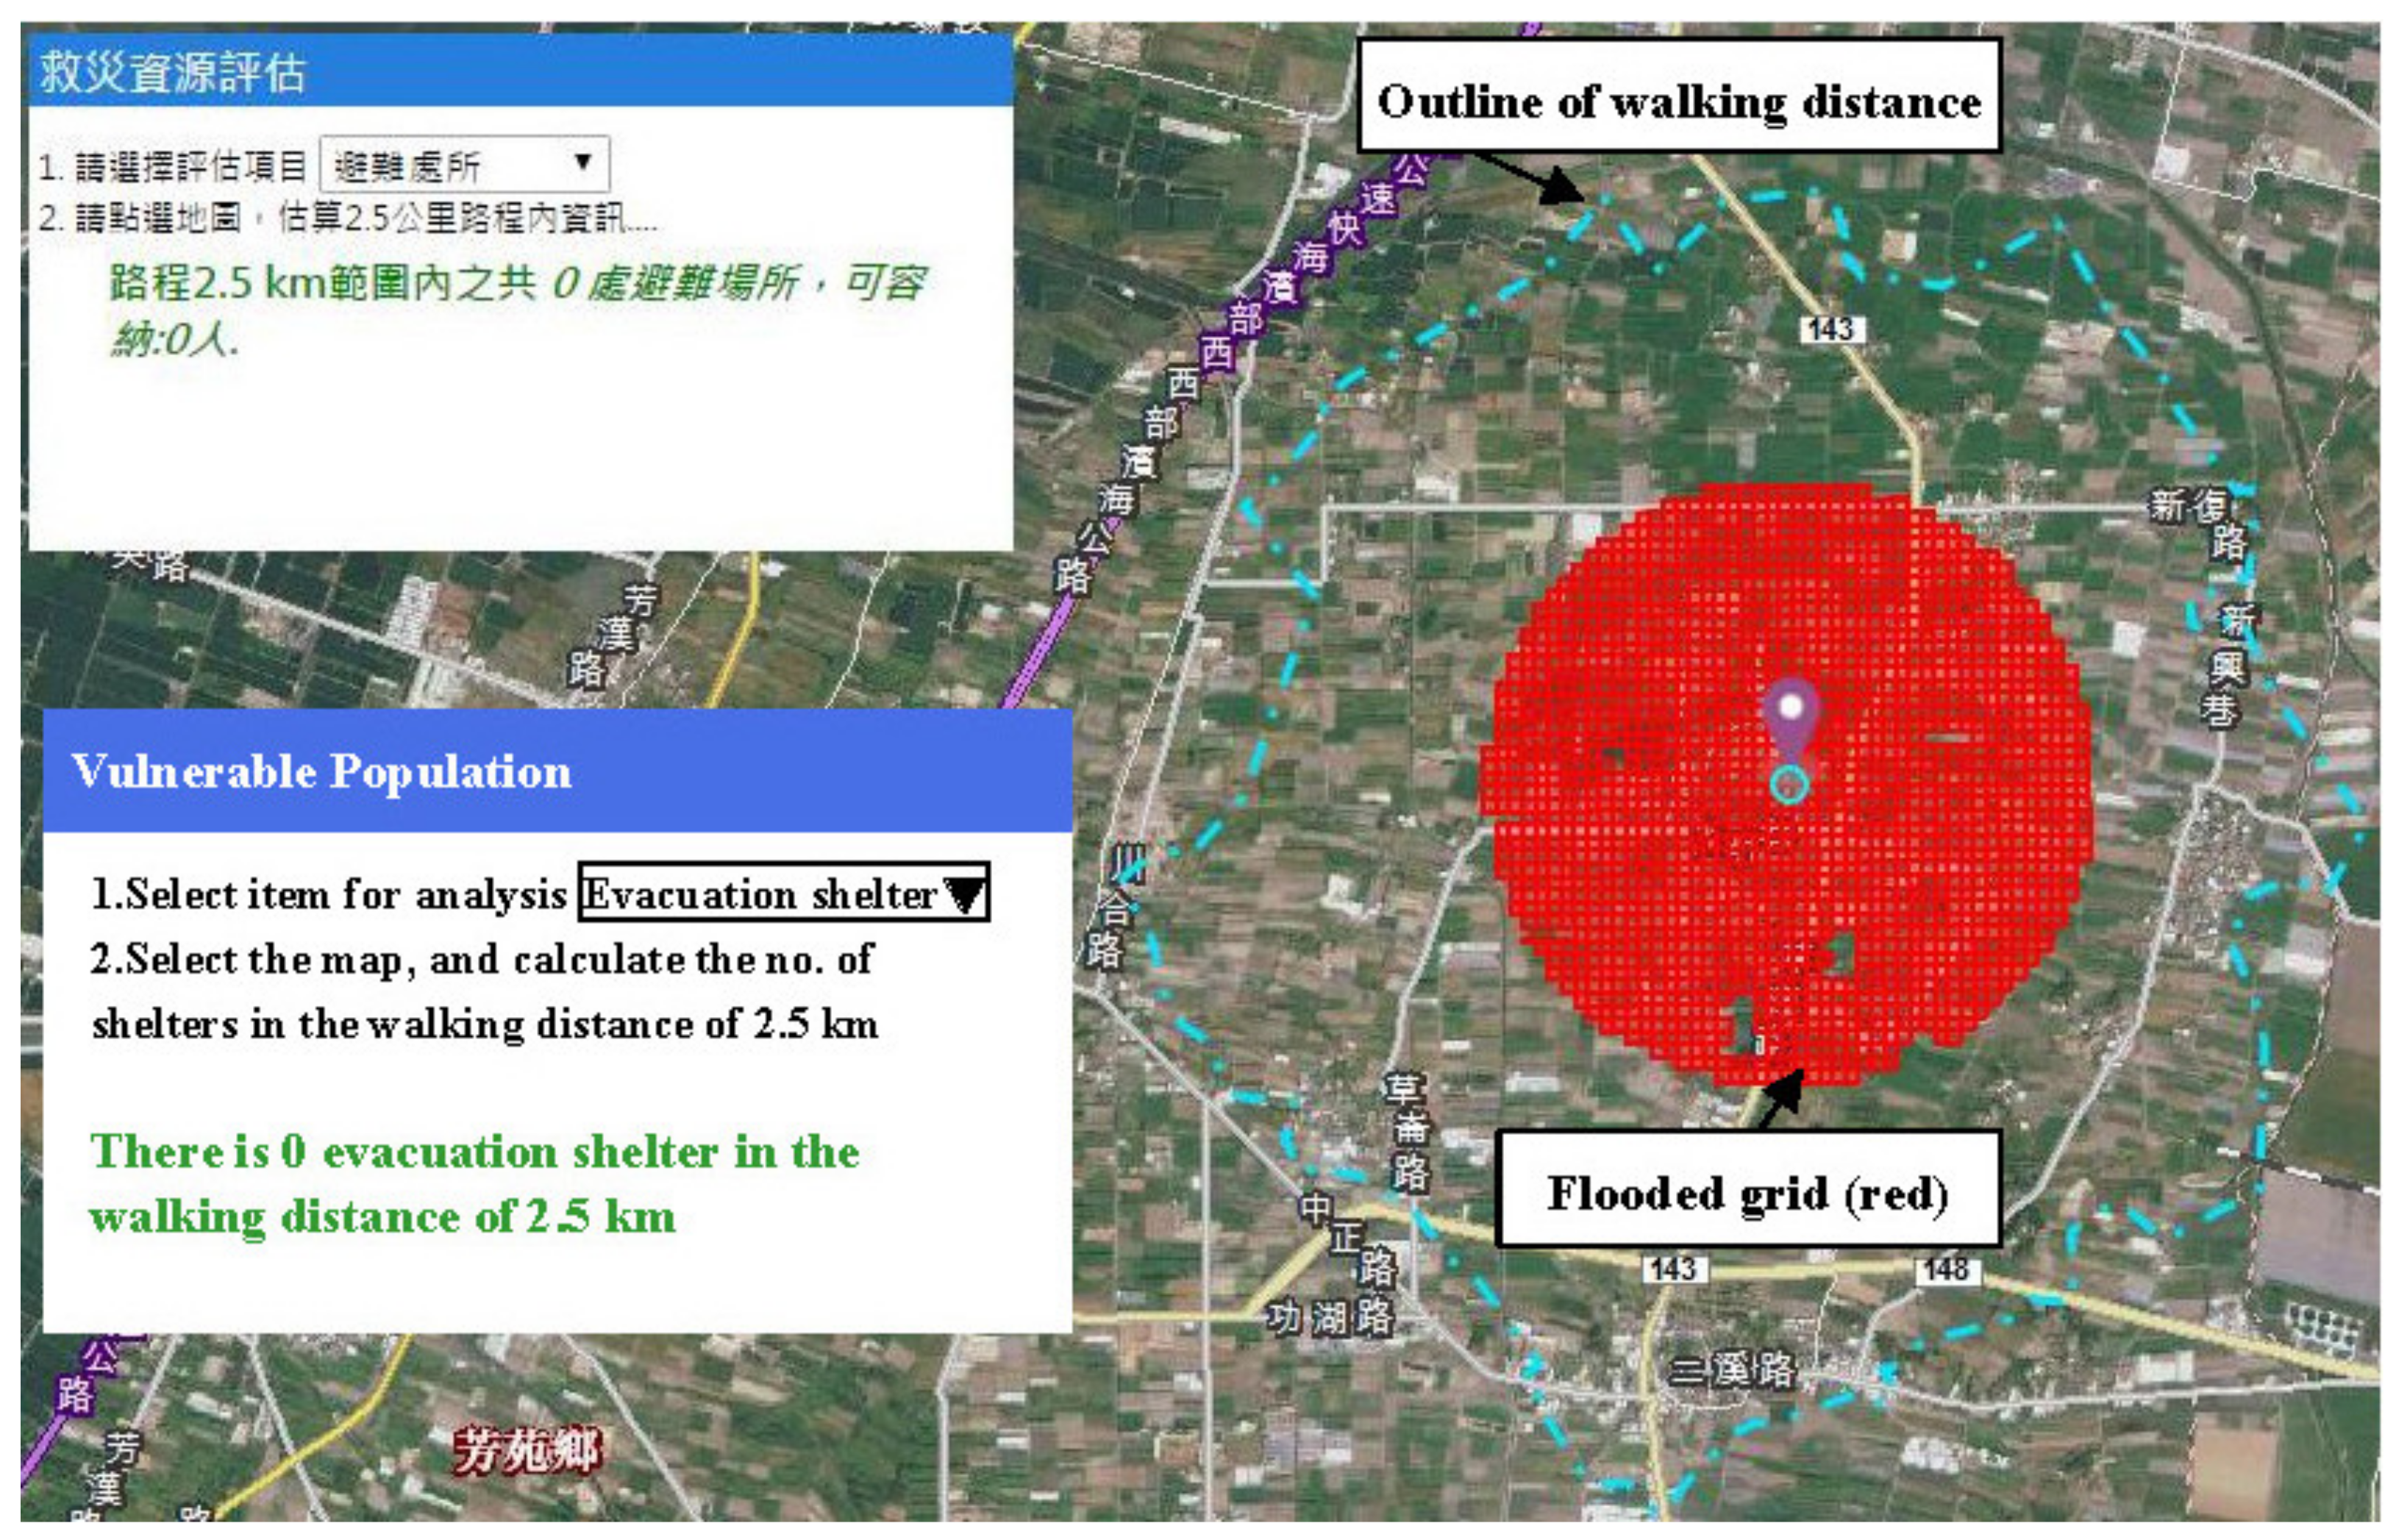
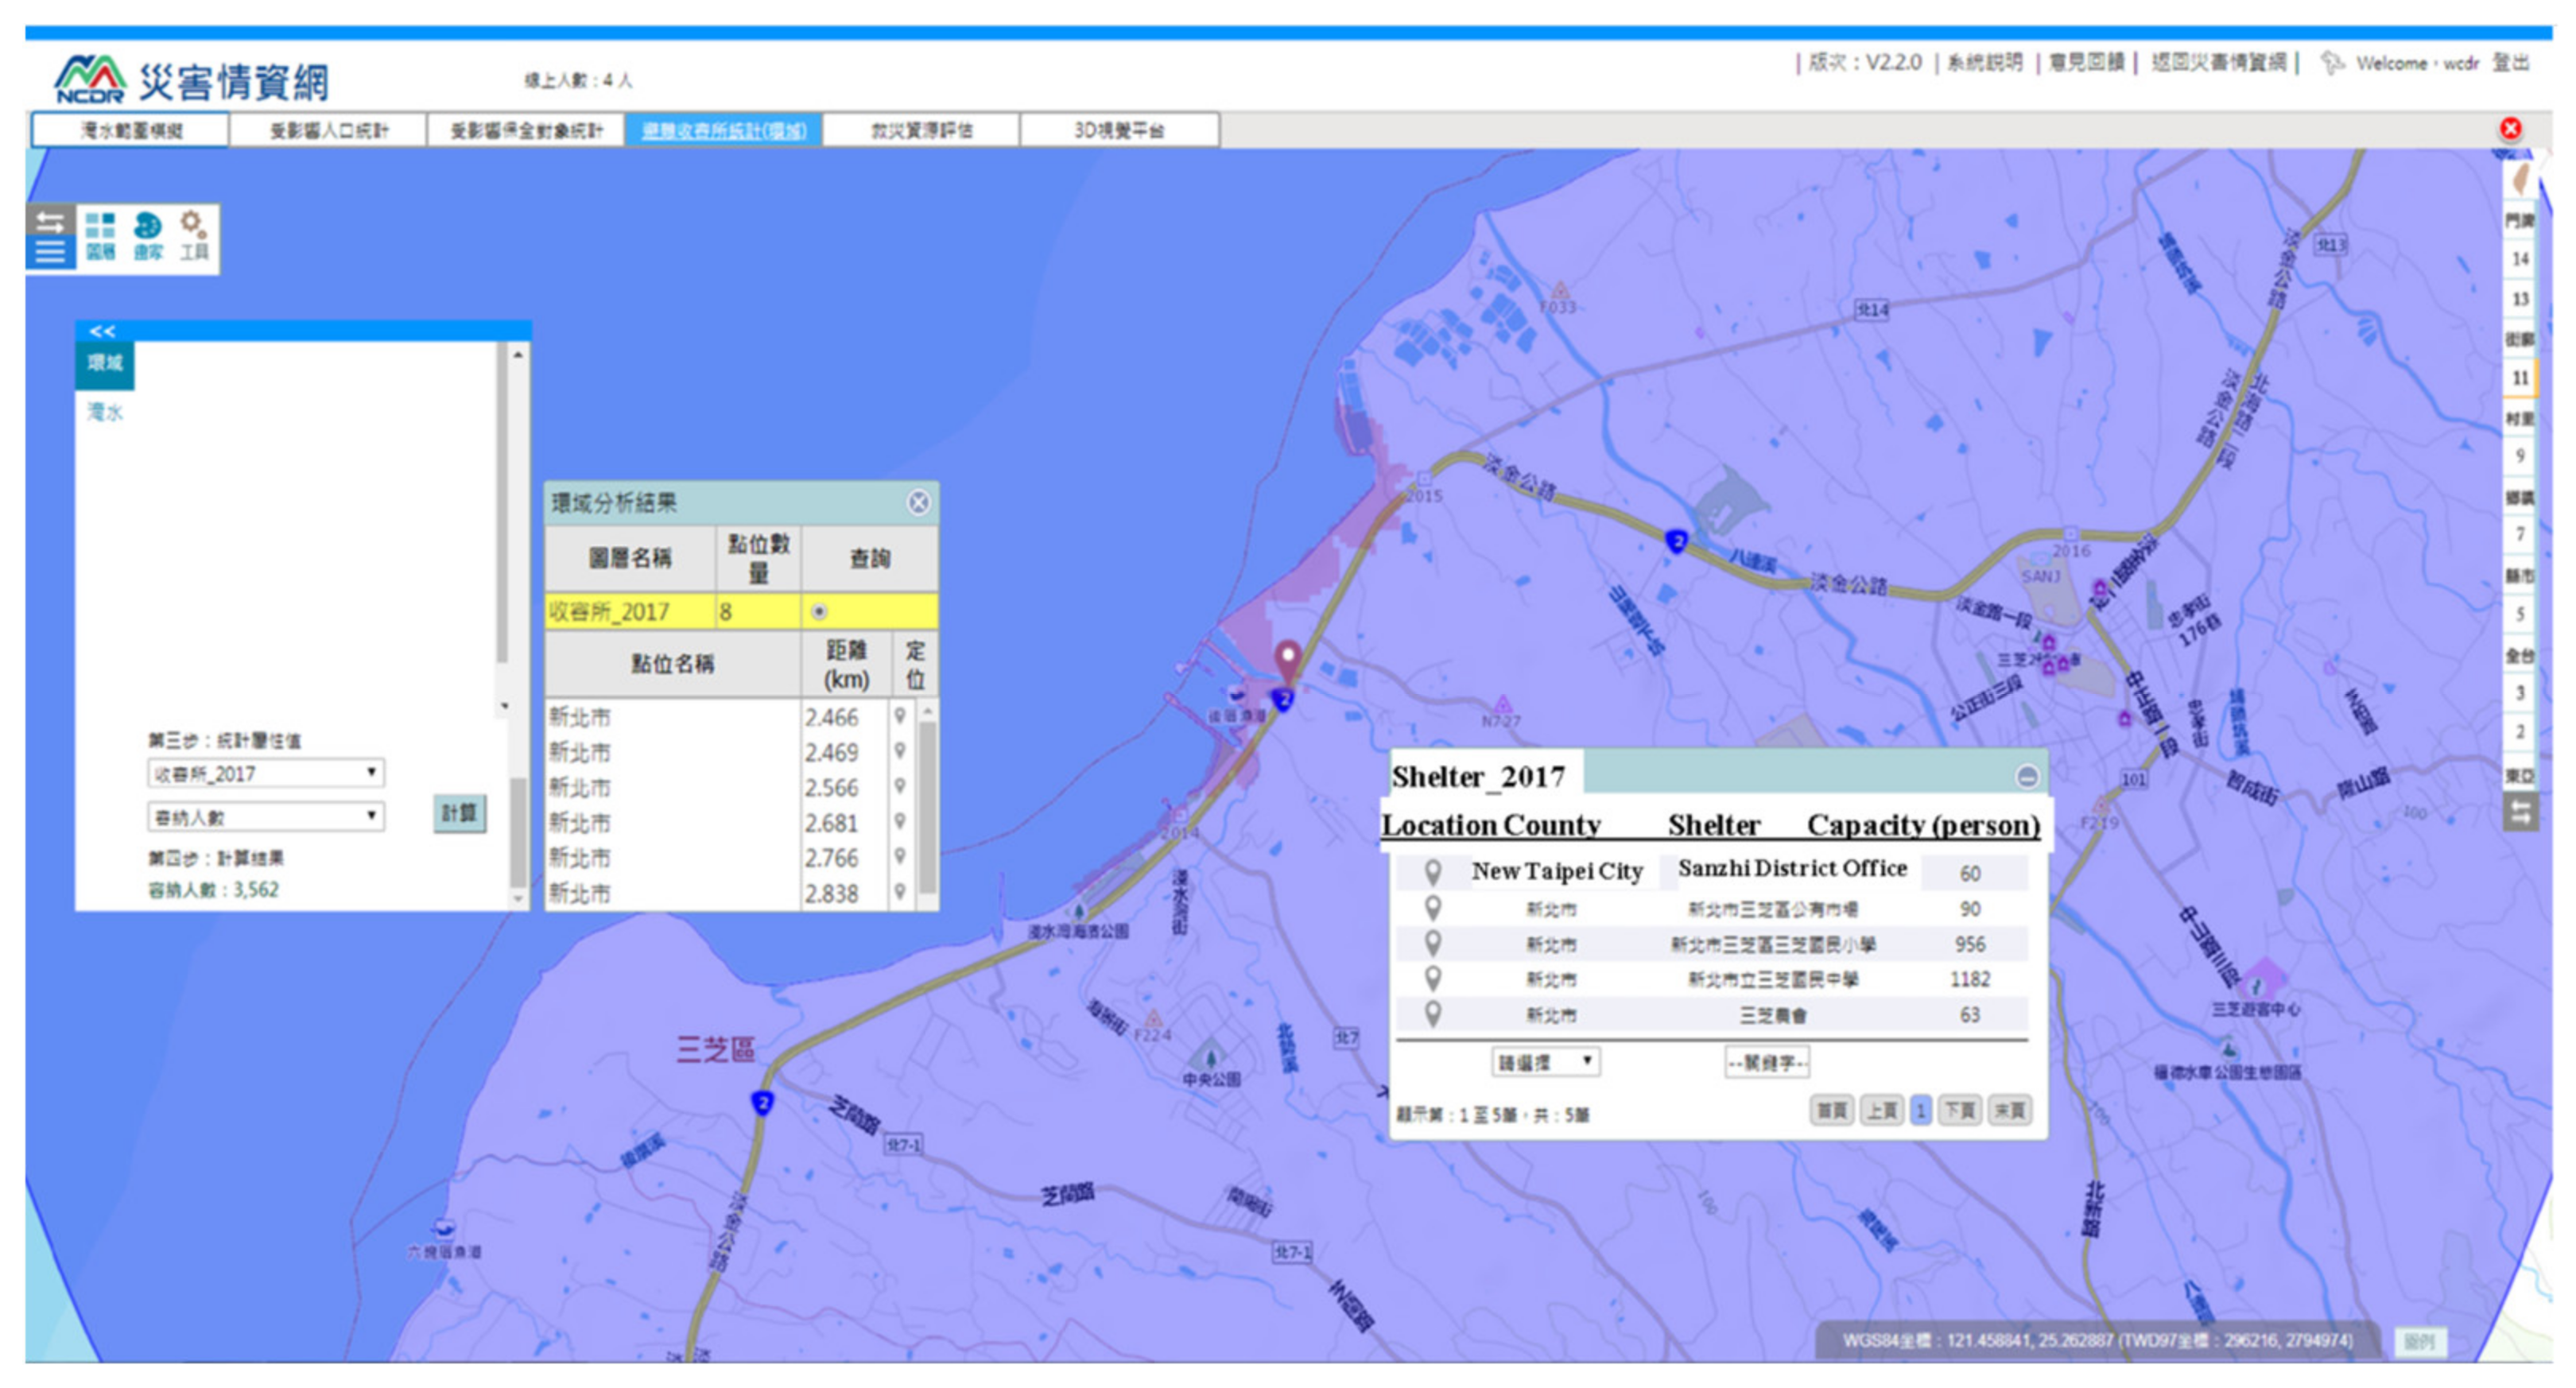
- Tab 4 and Tab 5: Buffer and routing analysis.Following the estimates of the affected and vulnerable populations, the next task was to decide how to evacuate these people to nearby shelters. This was determined through point domain analysis, which can be performed using Tab 4 of the FWGAP, as shown in Figure 10. The system automatically used the center point set using Tab 1 and selected the shelters located within the specified radius, showing their respective capacities. The decision makers could then authorize the distribution of evacuees to the nearest shelter.Tab 5 was used for the routing analysis and also served as a tool for screening shelters or other resources. This tab uses the ESRI routing analysis module to calculate the resources available within a traveling distance of 2.5 km. This distance measurement, based on the routing analysis, is depicted as a light blue dashed line in Figure 11. The absence of shelters within the delineated area indicates that the shelter was more than 2.5 km away.
3. Results-A Case Study of New Taipei City
3.1. City-Level Flood Wargame
- Assessment of the flood impact in Sanzhi District
- 2.
- Flood impact assessment of Sanchong District
- 3.
- An assessment of the flood impacts in Wugu District
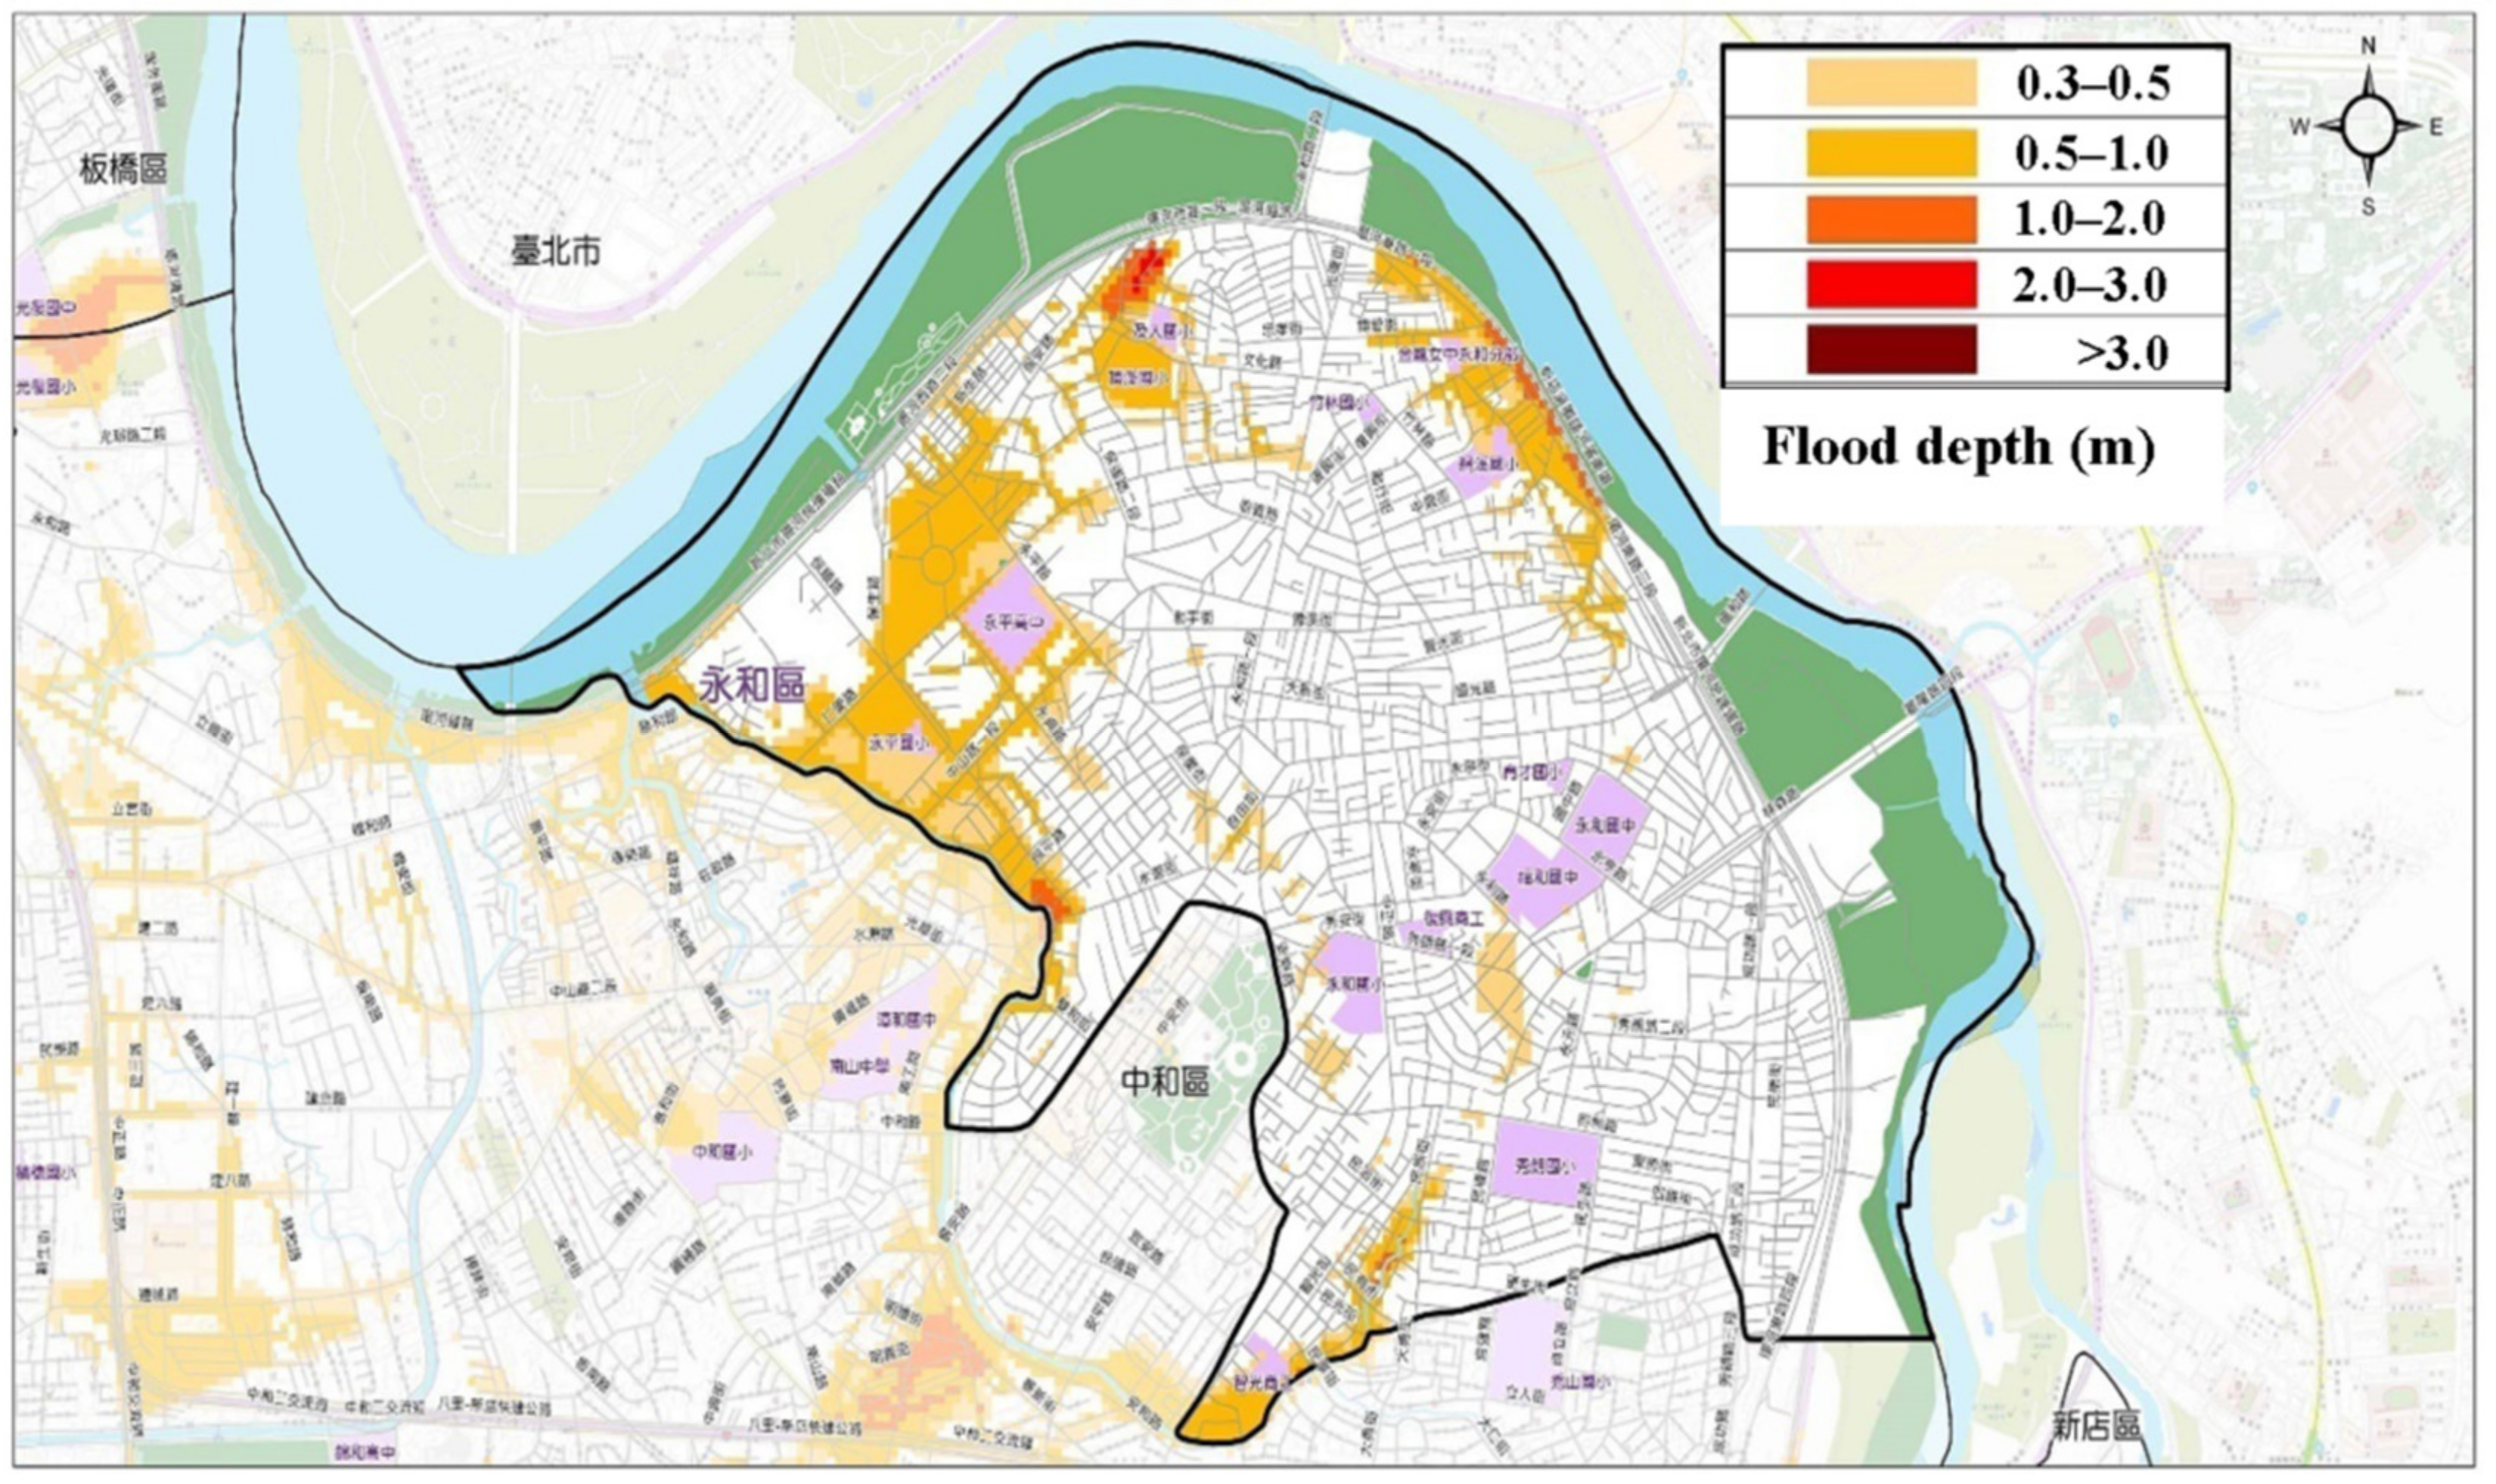
3.2. District-Level Flood Wargame: Yonghe District
- The participants used the FWGAP to estimate the flooded area during events F and H and Special Scenarios 1 and 2. The affected population was estimated to be very large, but the entire population did not need to be evacuated. Vertical evacuation of residents on the lower floors was the first priority. The response team needed to think about how food could be delivered to those stranded on the upper floors.
- The response team used the FWGAP to obtain information about the care center for the elderly and nearby evacuation shelters. The capacity of the shelters should normally be evaluated annually, and the district office must issue orders for the shelters operations. In practice, the district office may open a high-priority shelter first, but it may not be the one nearest to the disaster spots. The FWGAP can provide information or inputs in this regard.
- Considering the extent of the flooding, the district does not have sufficient capacity to handle all of the events. Therefore, it could outsource some of this work to the New Taipei City government. The total requirement of human resources for handling the scenarios should be calculated during the process. For example, there were many flooded areas in this wargame and if each area required two police officers, the demand for police officers would exceed the supply capacity of the district office. In the observers opinions, this scenario was well beyond the capacities of the district.
- The pipe supplying tap water burst in Special Scenario 2. The response of the water company was that the pipe could be temporarily blocked for repair and the tap water diverted using alternative pipes. The participants tended to solve the problem immediately, but in reality, it could take days to repair such a large pipe that supplied water to thousands of residents not only in Yonghe District. In a worst-case scenario, the district office should establish some tap water supply stations to which water transported in water tanks could be delivered when needed.
3.3. The Survey of the FWGAP
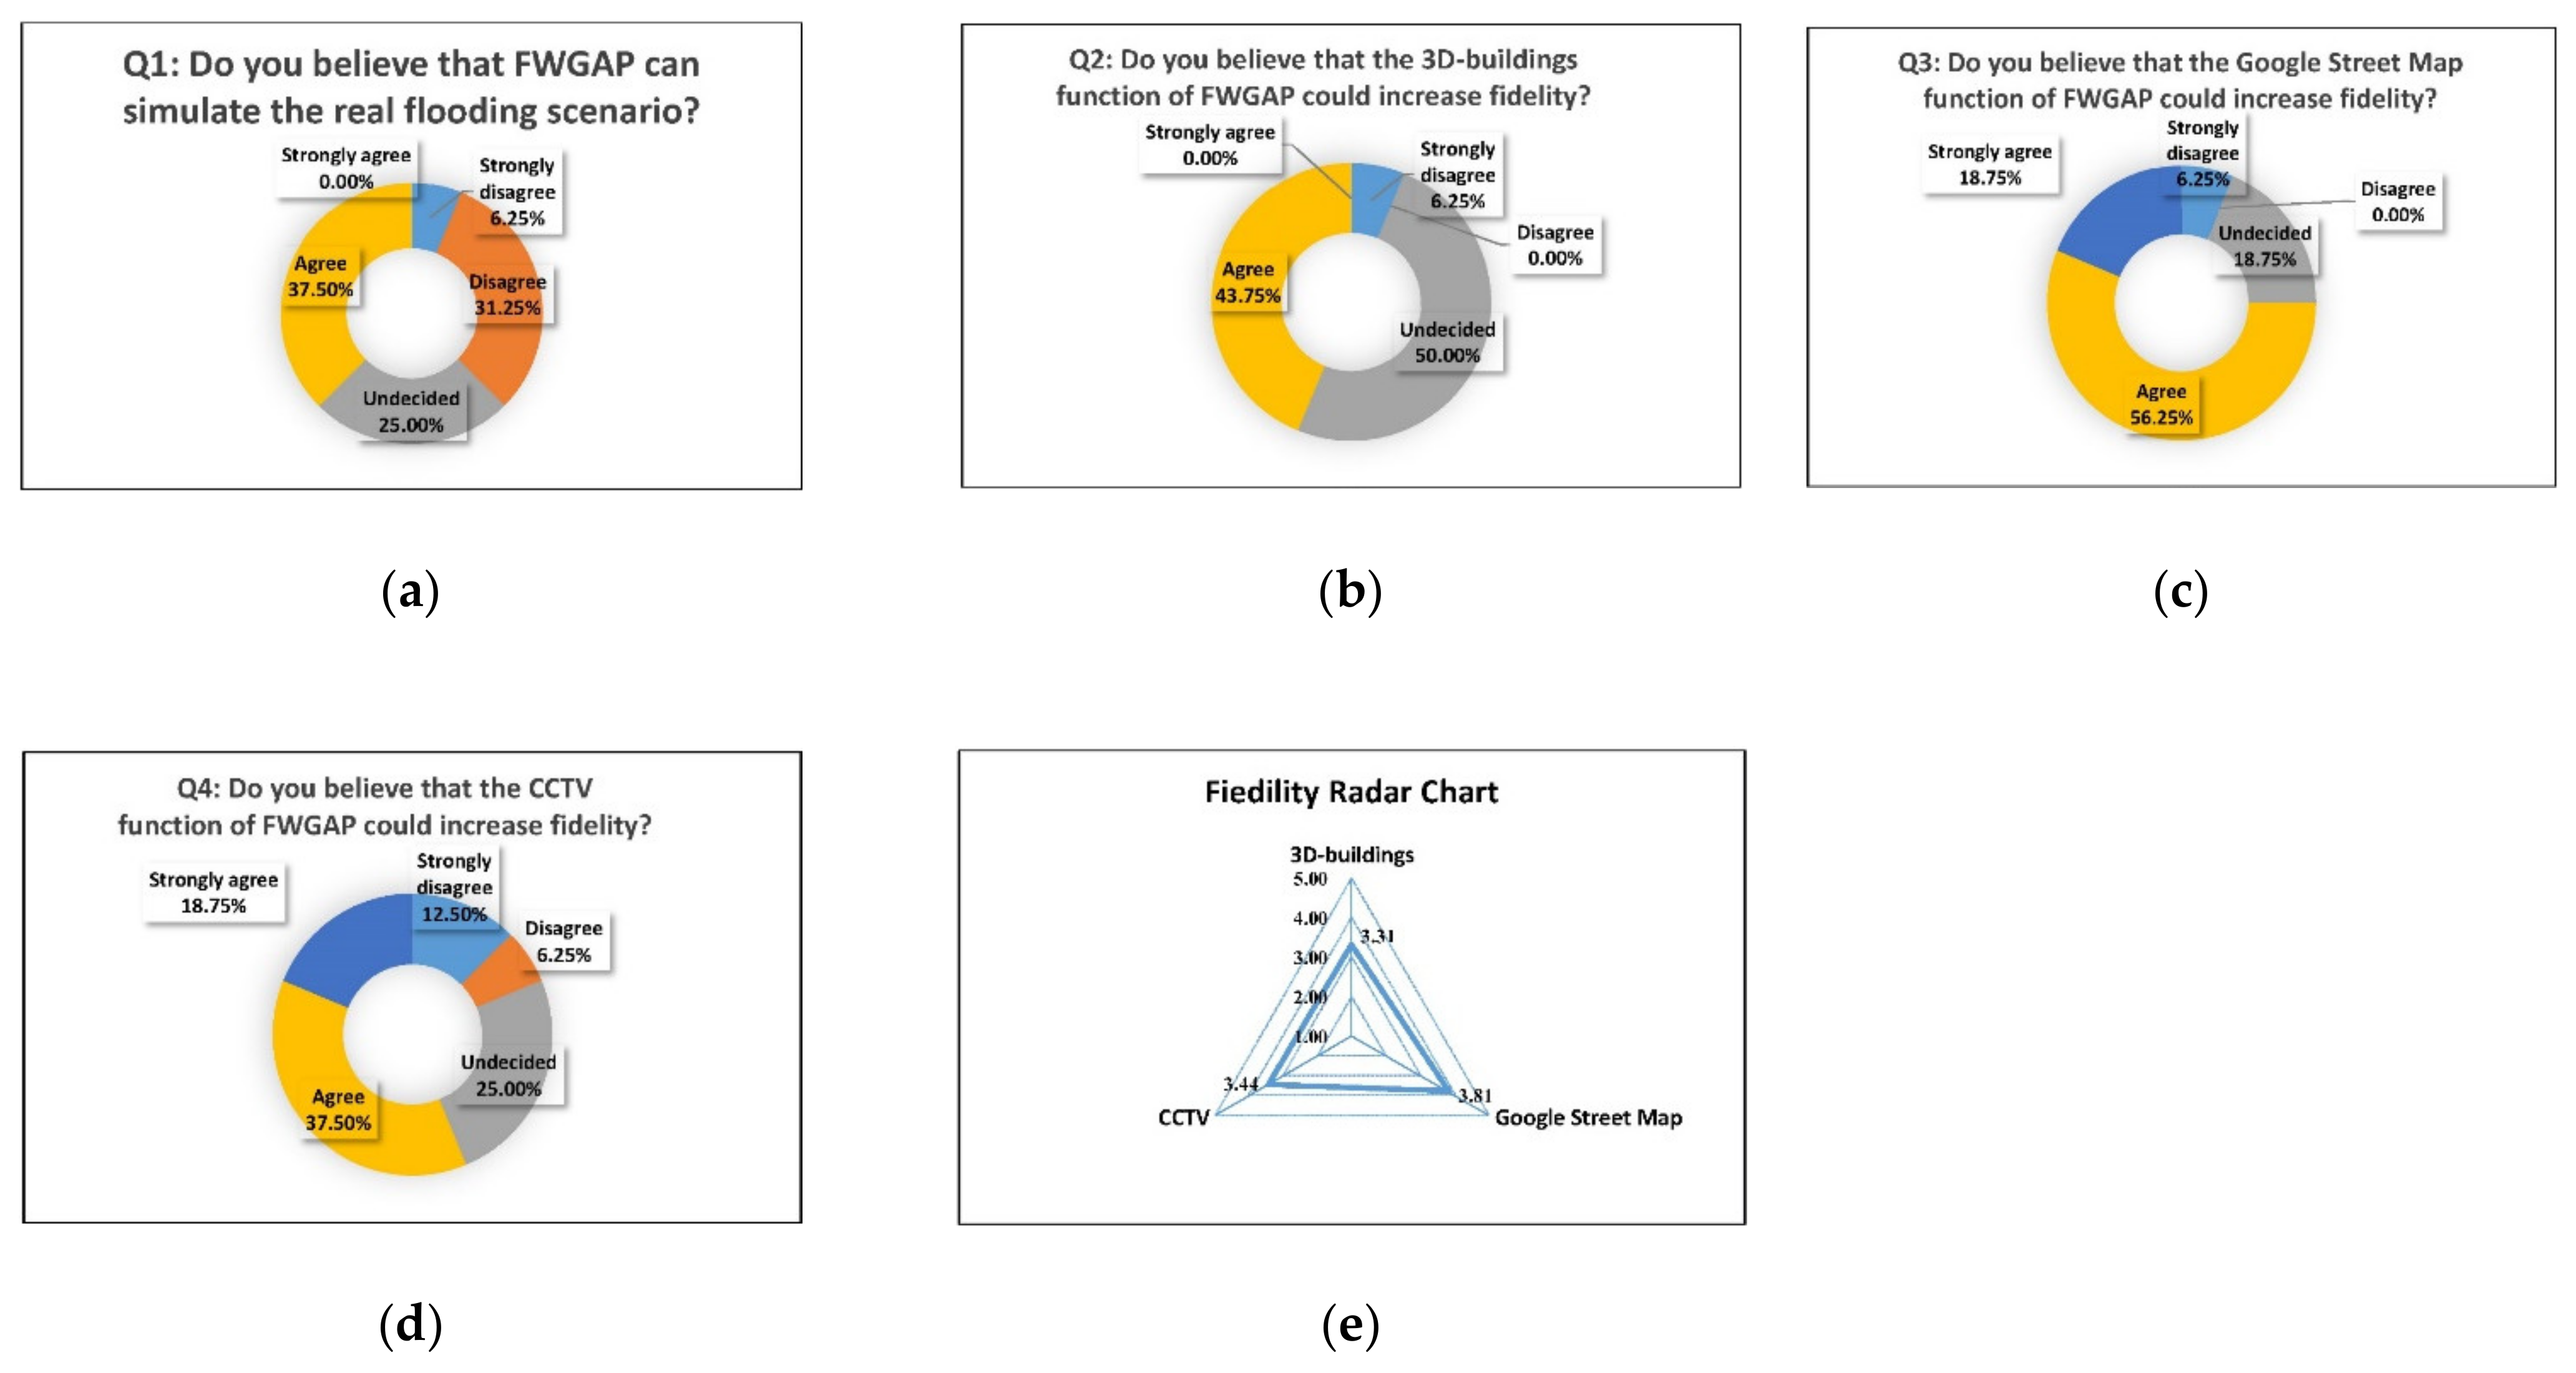
3.3.1. Fidelity
3.3.2. Functionality
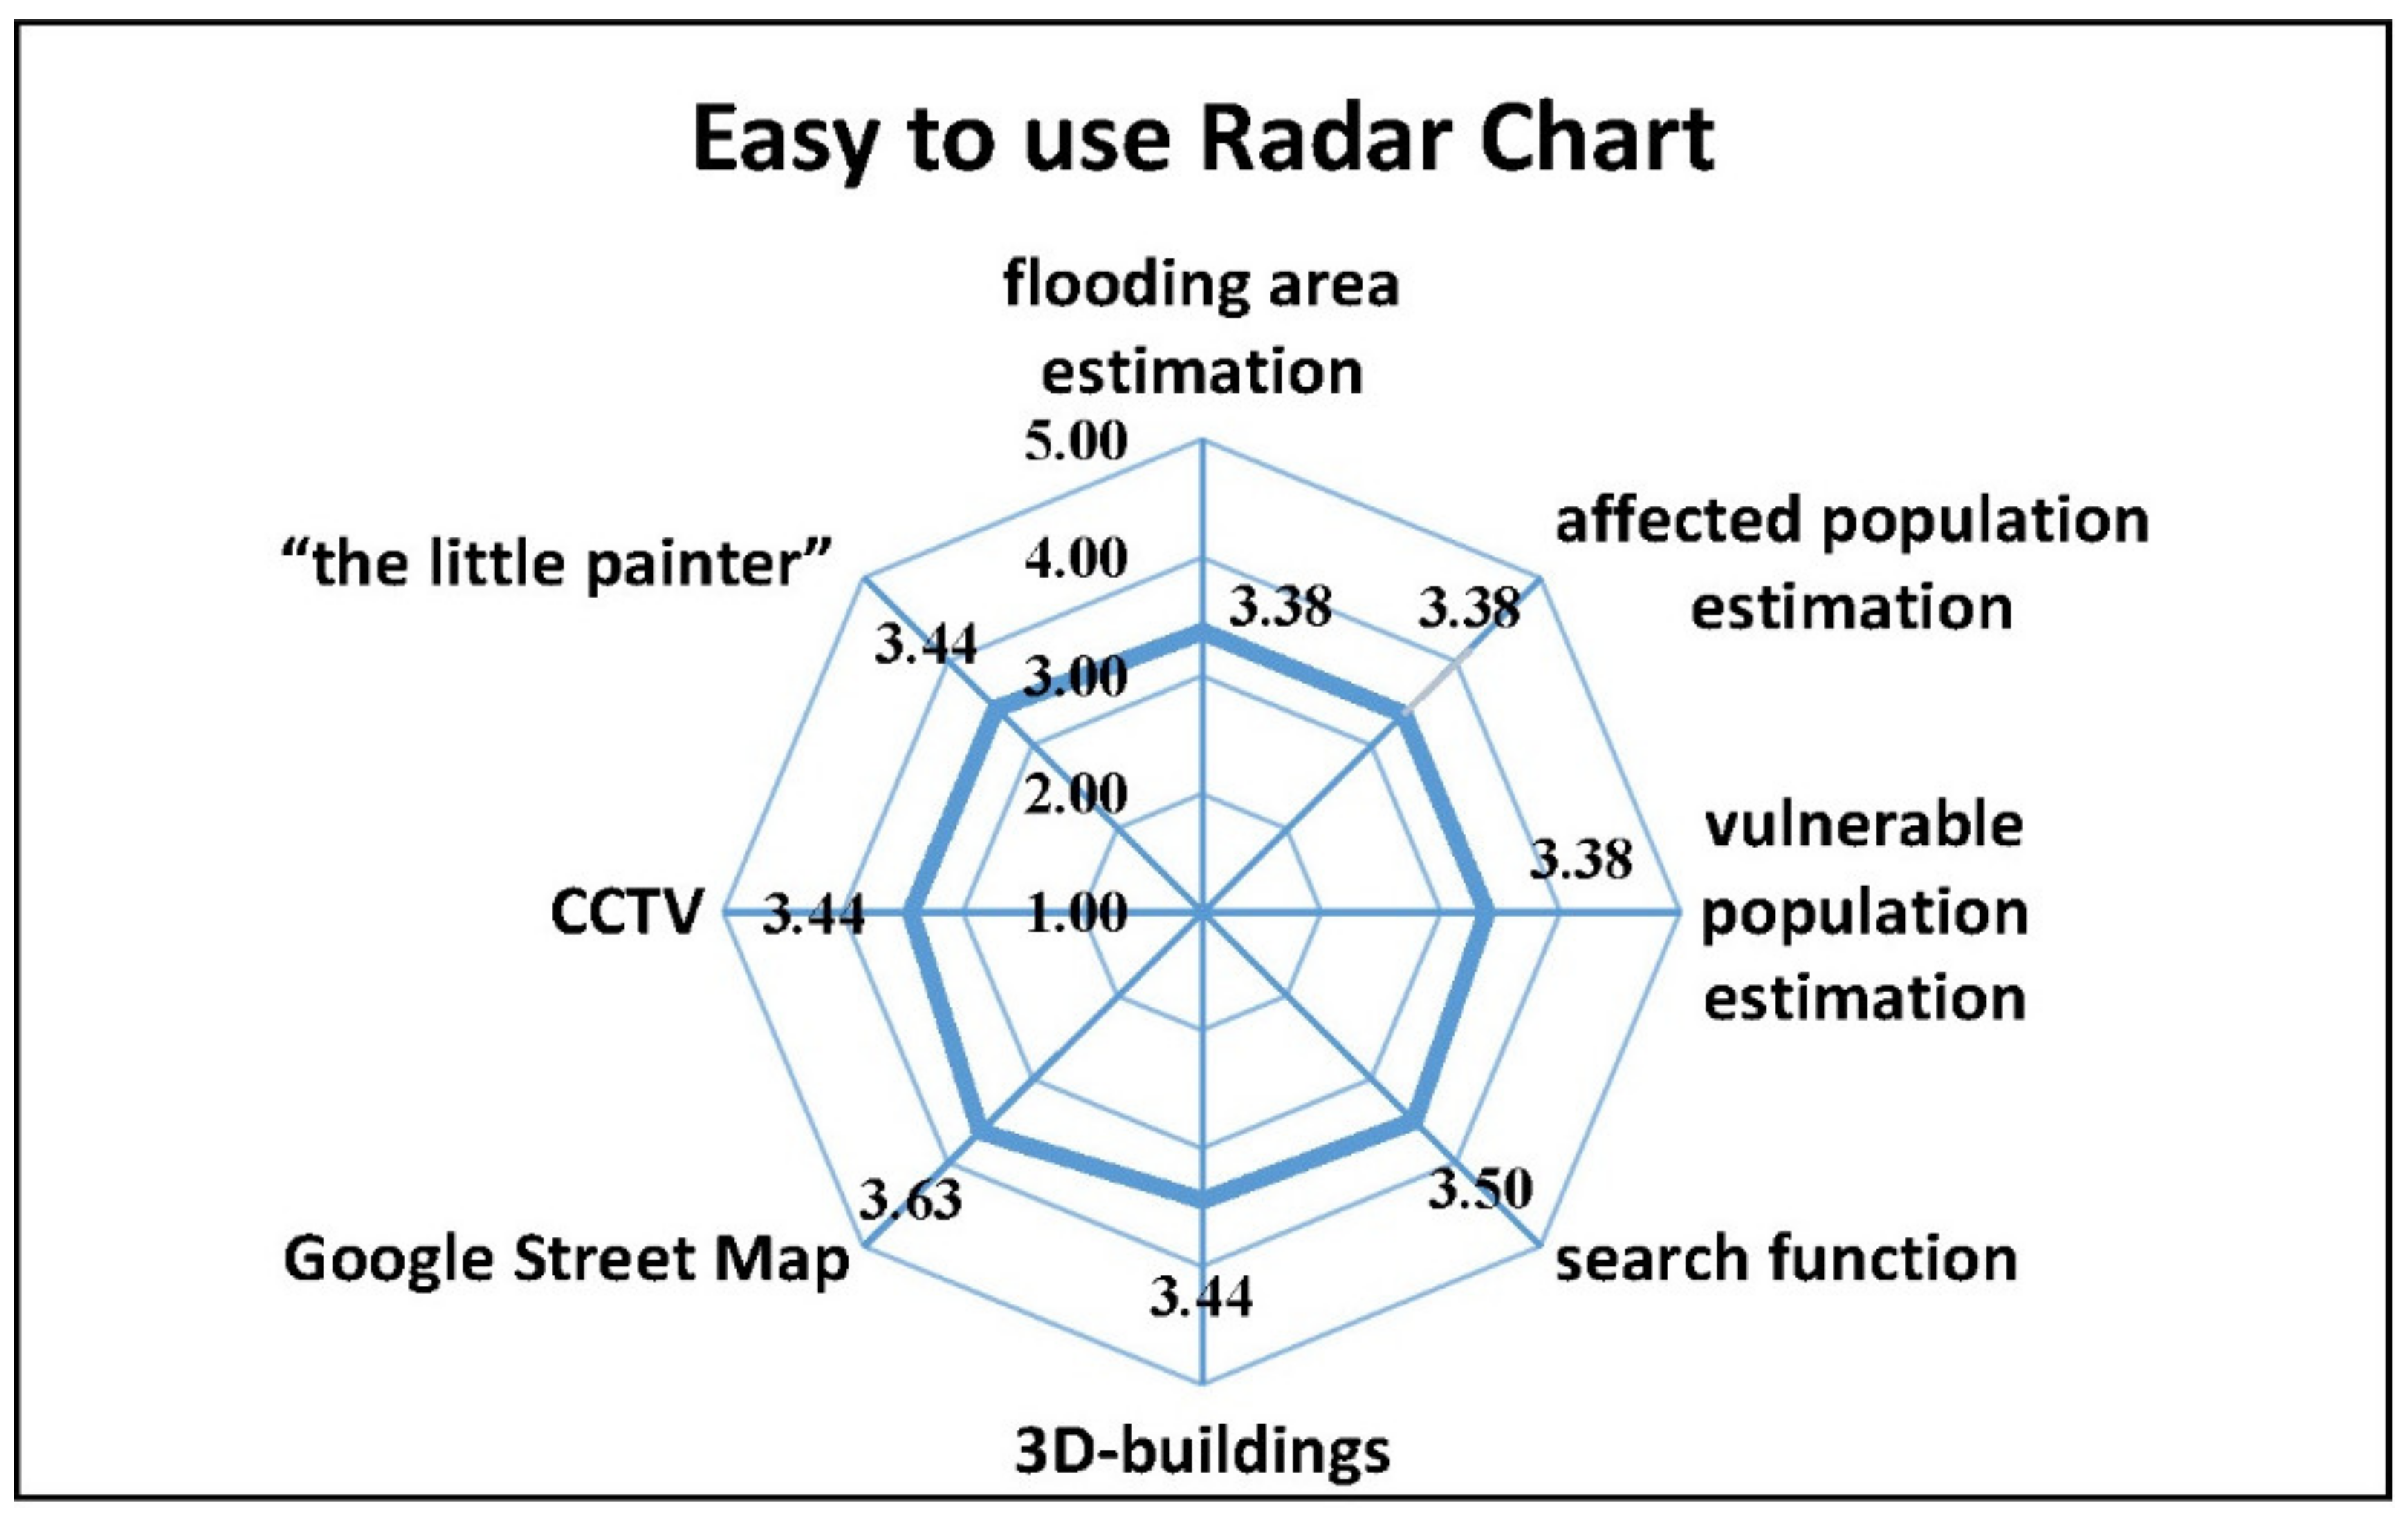
3.3.3. Ease of Use
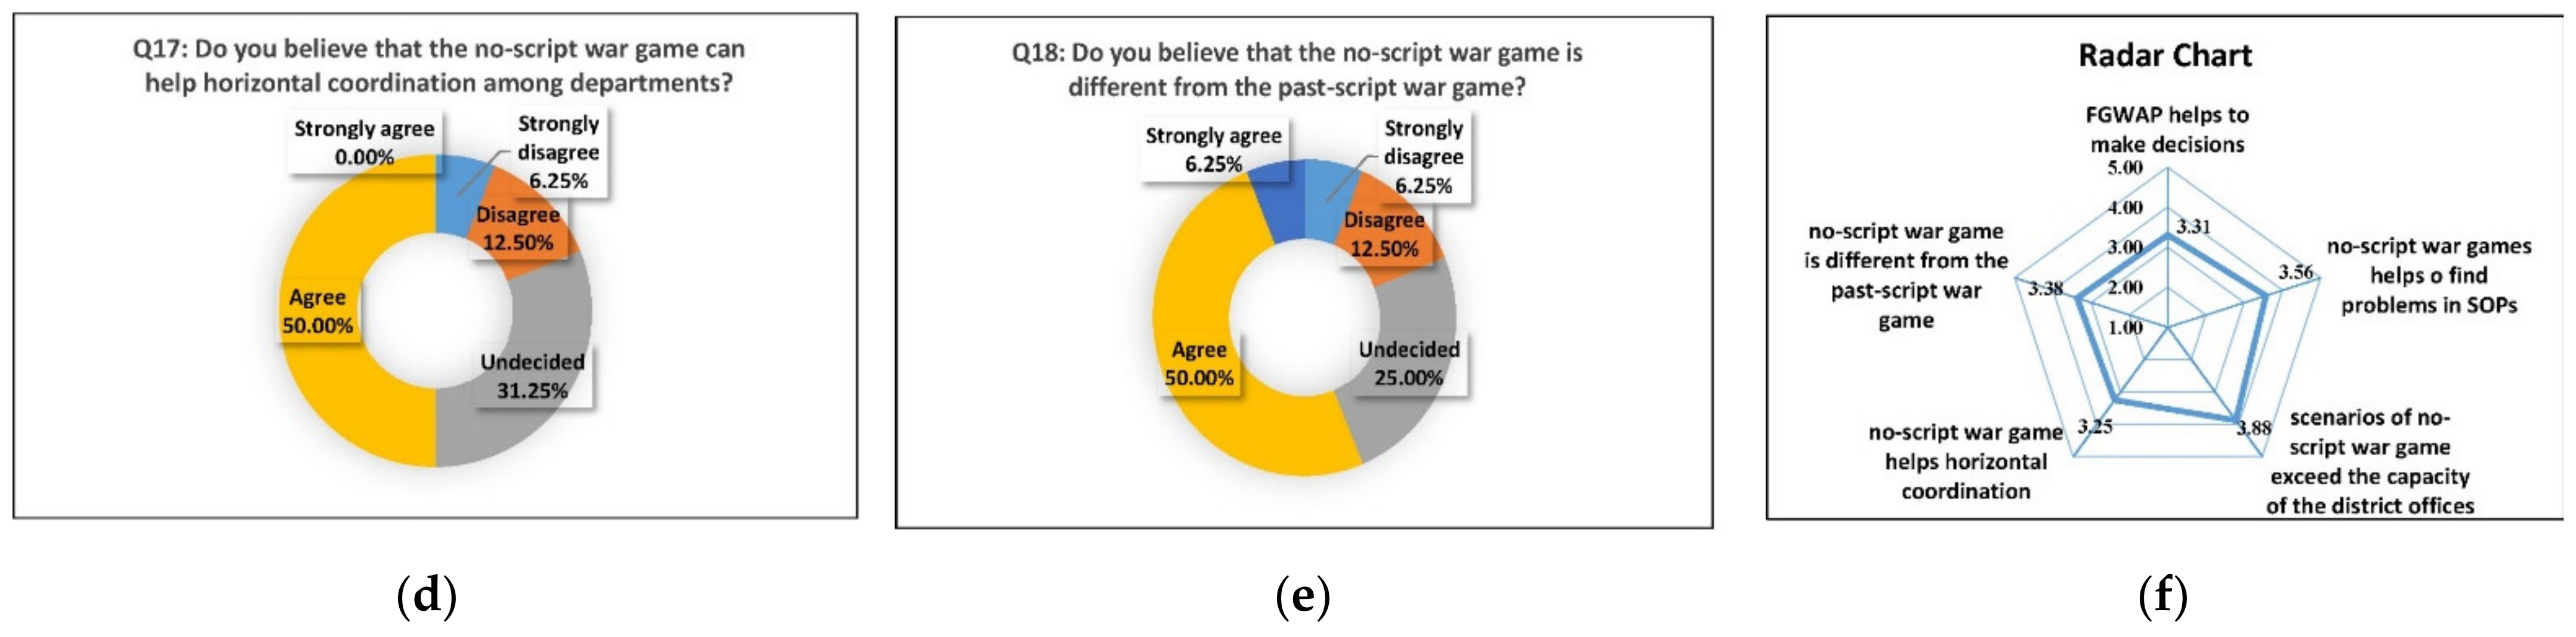
3.3.4. The Difference between No-Script and Previously Scripted Wargames
3.3.5. Discussion
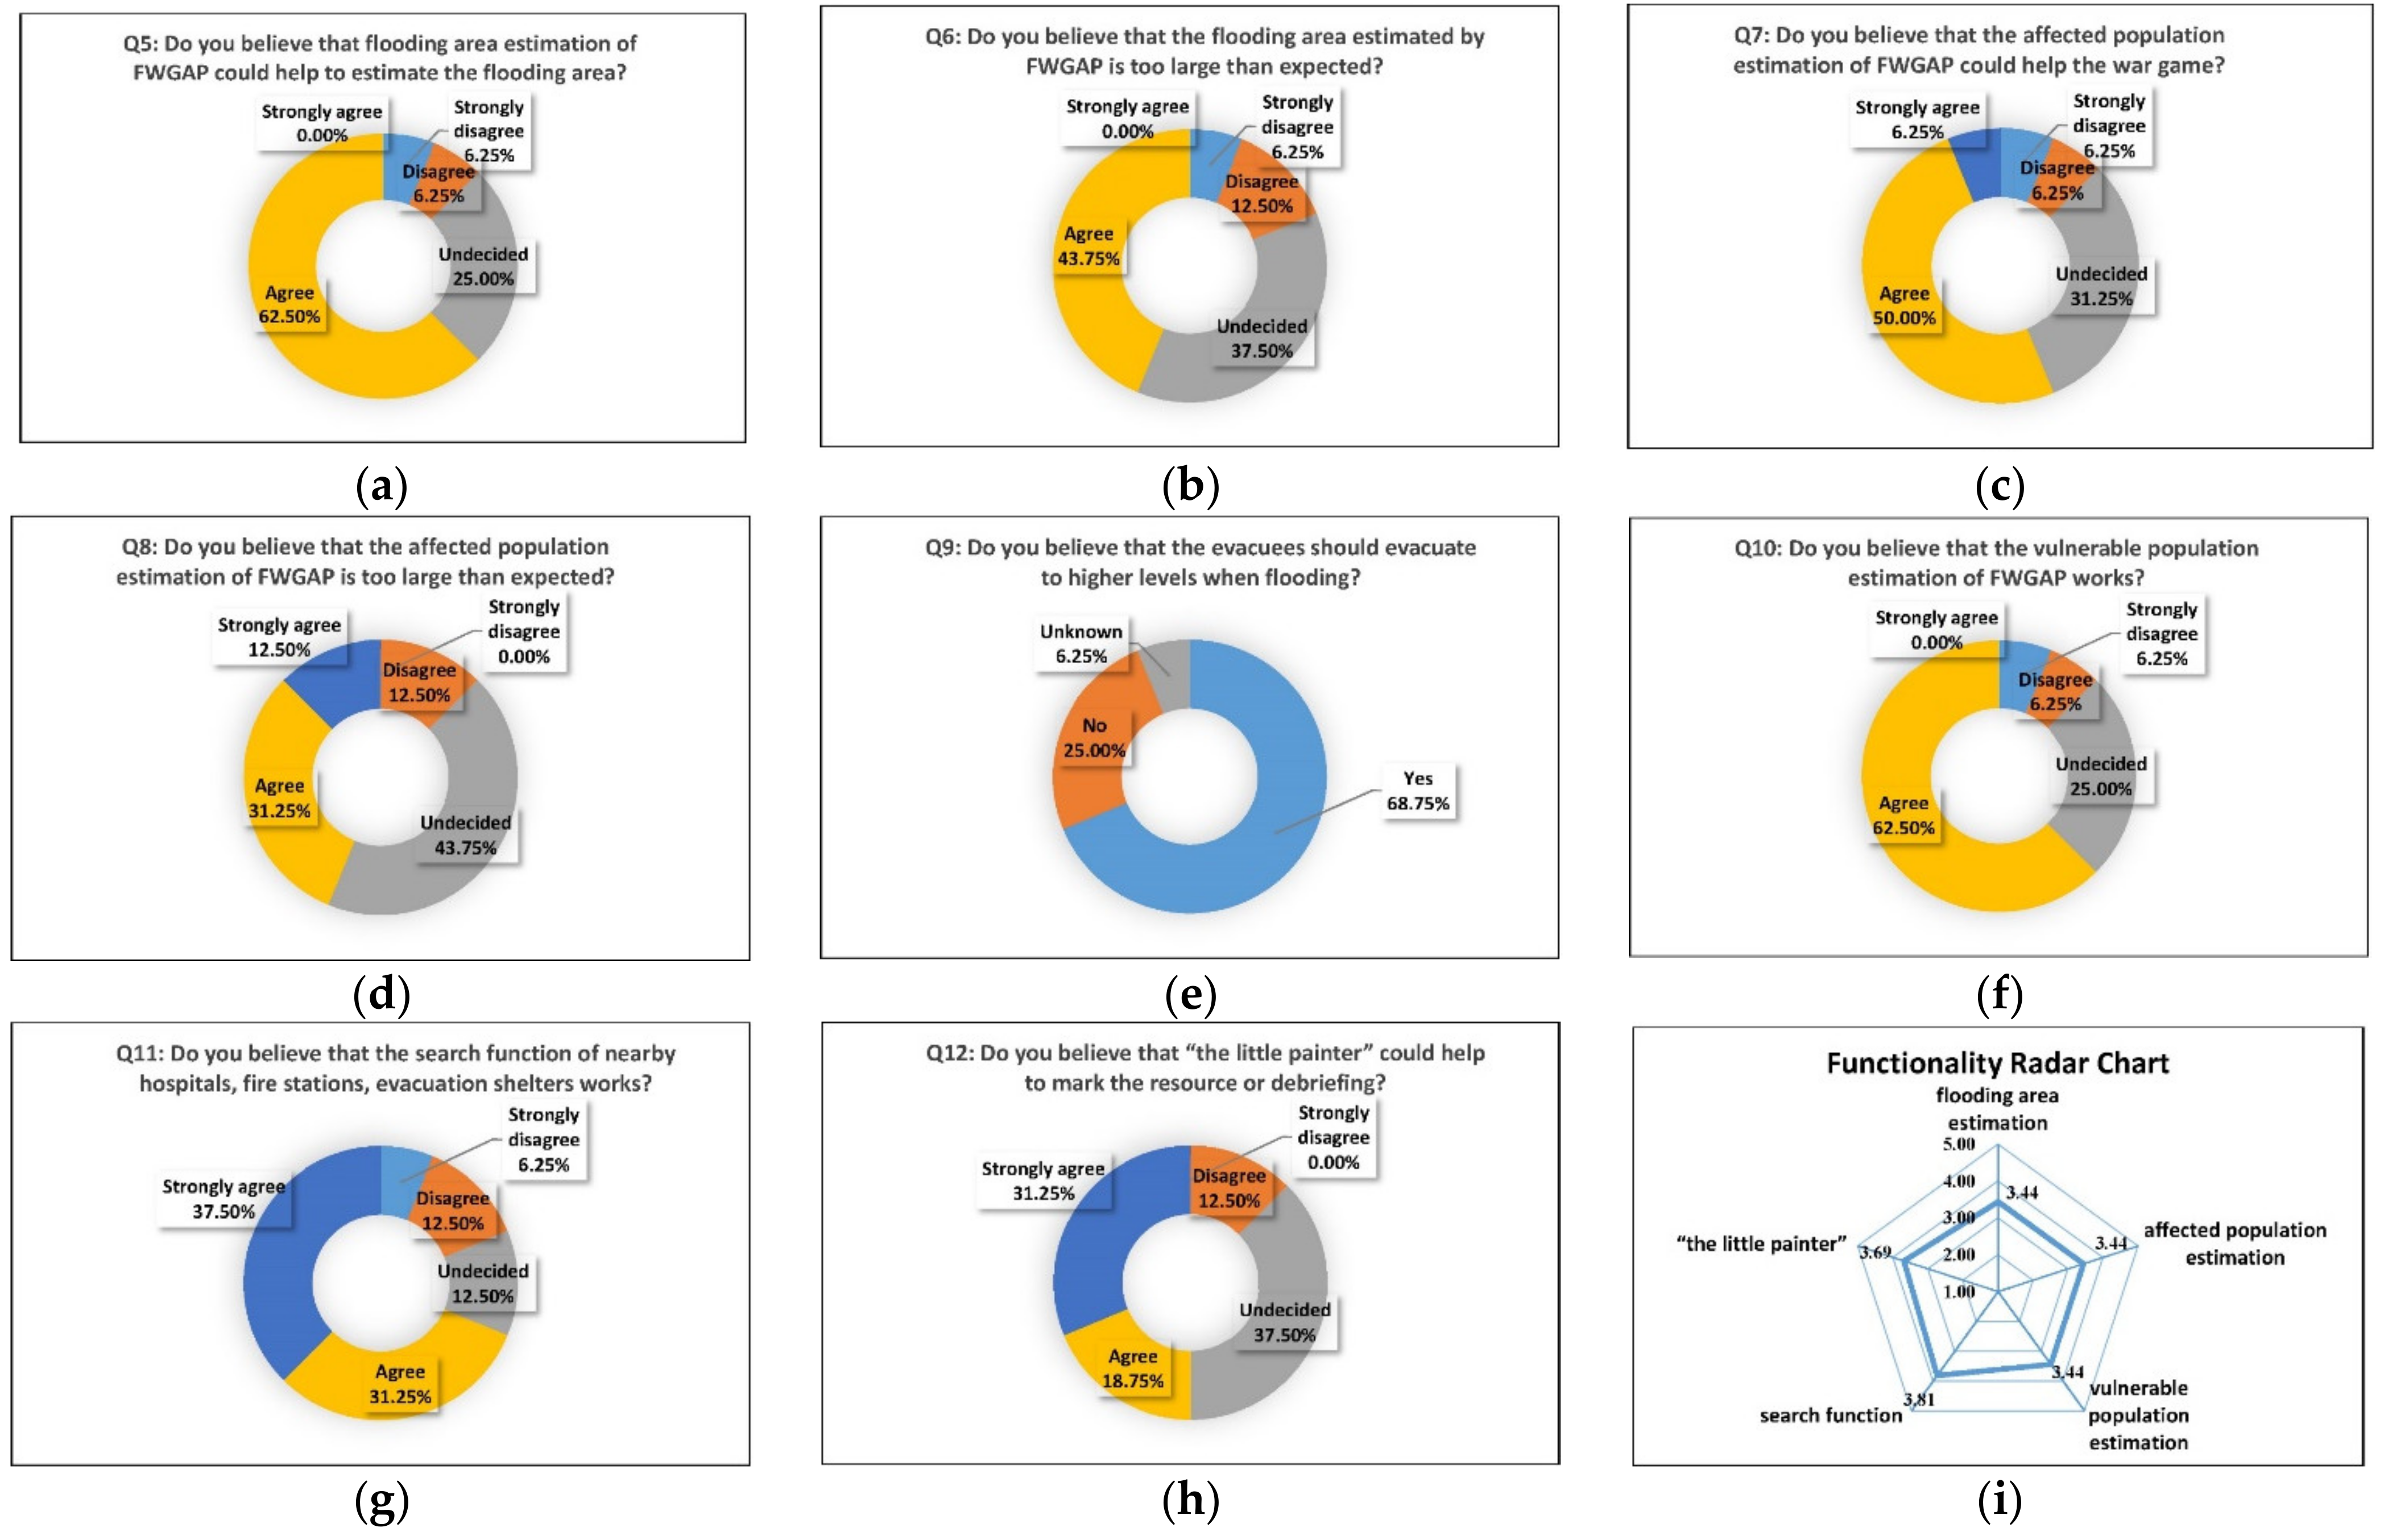
- A few individuals stated that the estimate for the affected population was larger than expected. The survey results show that about 56% of the participants considered the estimation of the affected population using the FWGAP to be much larger than expected (Q7, Figure 21c). The estimate was based on the minimum statistical unit, which sometimes resulted in the platform-estimated population being more significant than that of the estimated flood-affected area. The minimum statistical unit is used in Taiwan to ensure accurate population estimates. The rationale is that if one minimum statistical unit intersects with a flooded grid unit, the total population of that minimum statistical unit would be added to the total population of the affected area.A possible solution is to calculate the proportion of flooded grids to that of the area of the minimum statistical unit. Another solution is to apply big data analysis to cellular users signals to estimate the population at different times, such as during the day and at night. However, obtaining operational data for all cellular phones is challenging. Moreover, some people do not use cellular phones at all. During the COVID-19 pandemic in 2020, the NCDR used data obtained from the largest cellular phone operator to estimate the population at the sighting spots for man flow control. Our findings indicate that some of the wargame participants assumed that all of the affected people needed to be evacuated. The number of affected people usually exceeds the number requiring evacuation. In flooded areas, building residents should be evacuated vertically to higher levels. Only disabled or elderly residents on the first floors of buildings in the flooded area should be evacuated first with the assistance of the rescue teams. For others, vertical evacuation is a better option, and it is hazardous to perform horizontal evacuations when floodwaters are still rising.
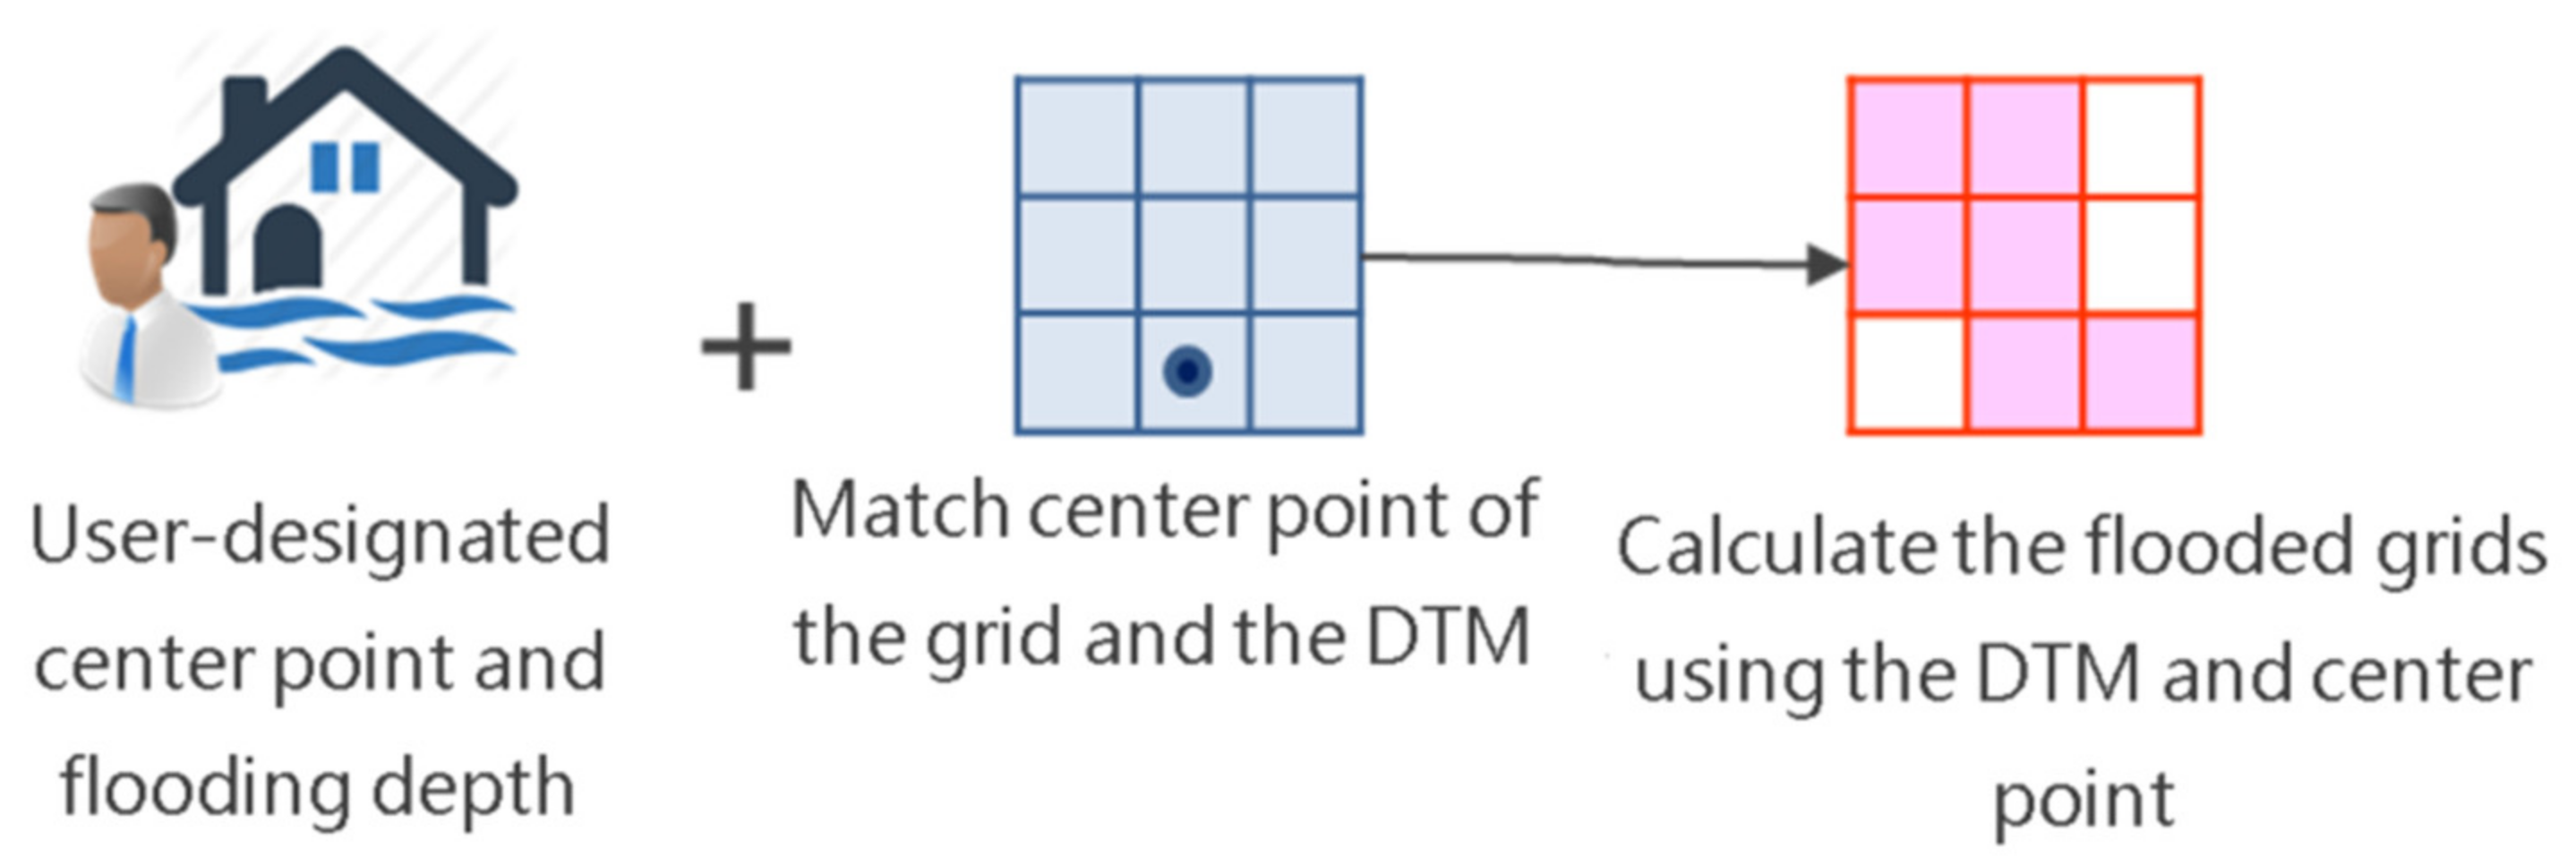
- The survey results revealed that 44% of participants believed that the flooded area estimated with the FWGAP was larger than expected. Such an estimation could be made after determining the center, flooding depth, and distance of impact using the platform. Because the water level at the center usually spreads horizontally to nearby elevation grids, the flooding area can be determined. This method is effective for simulating large-scale flooding events with water depths greater than 1 m. In this situation, the drainage system does not drain the floodwater efficiently, leaving the conduits full of water. Gravity then causes an overland flow of the water to low-lying areas. The platform enables a rapid estimation of the population affected by such massive flooding. Chen et al. [39], argued that most flood simulations focus on regular events. Therefore, simulations should attend more to crisis flooding events [40,41,42].In addition to its use in estimations, the platform also provides information with a high degree of accuracy about the flooded areas during historical flooding events and the flooding potential within different scenarios, using a hydraulic model to simulate the drainage system. Observations of the wargame revealed that given the ease of use of the depth-setting method, the participants seldom used the two types of information mentioned above. Moreover, hydraulic modeling of overland flow using fine grids takes hours to complete.In the future, massive volumes of pre-run overland flow simulations with multiple rainfall scenarios and artificial intelligence technology may need to be used to develop rapid and accurate estimates of flooded areas. Data on flooded areas during historical events are also essential for the calibration of overland flow simulations. In recent years, some historical flooding spots have been compiled by the NTC. However, only information on flood locations and depth is available, with the areas flooded only available for a few spots. Different flooding areas during various events may have the same flooding depth. Consequently, following the adoption of this platform for conducting flooding wargames, the authorities should request more information about the flooded area from citizens calling to report floods.
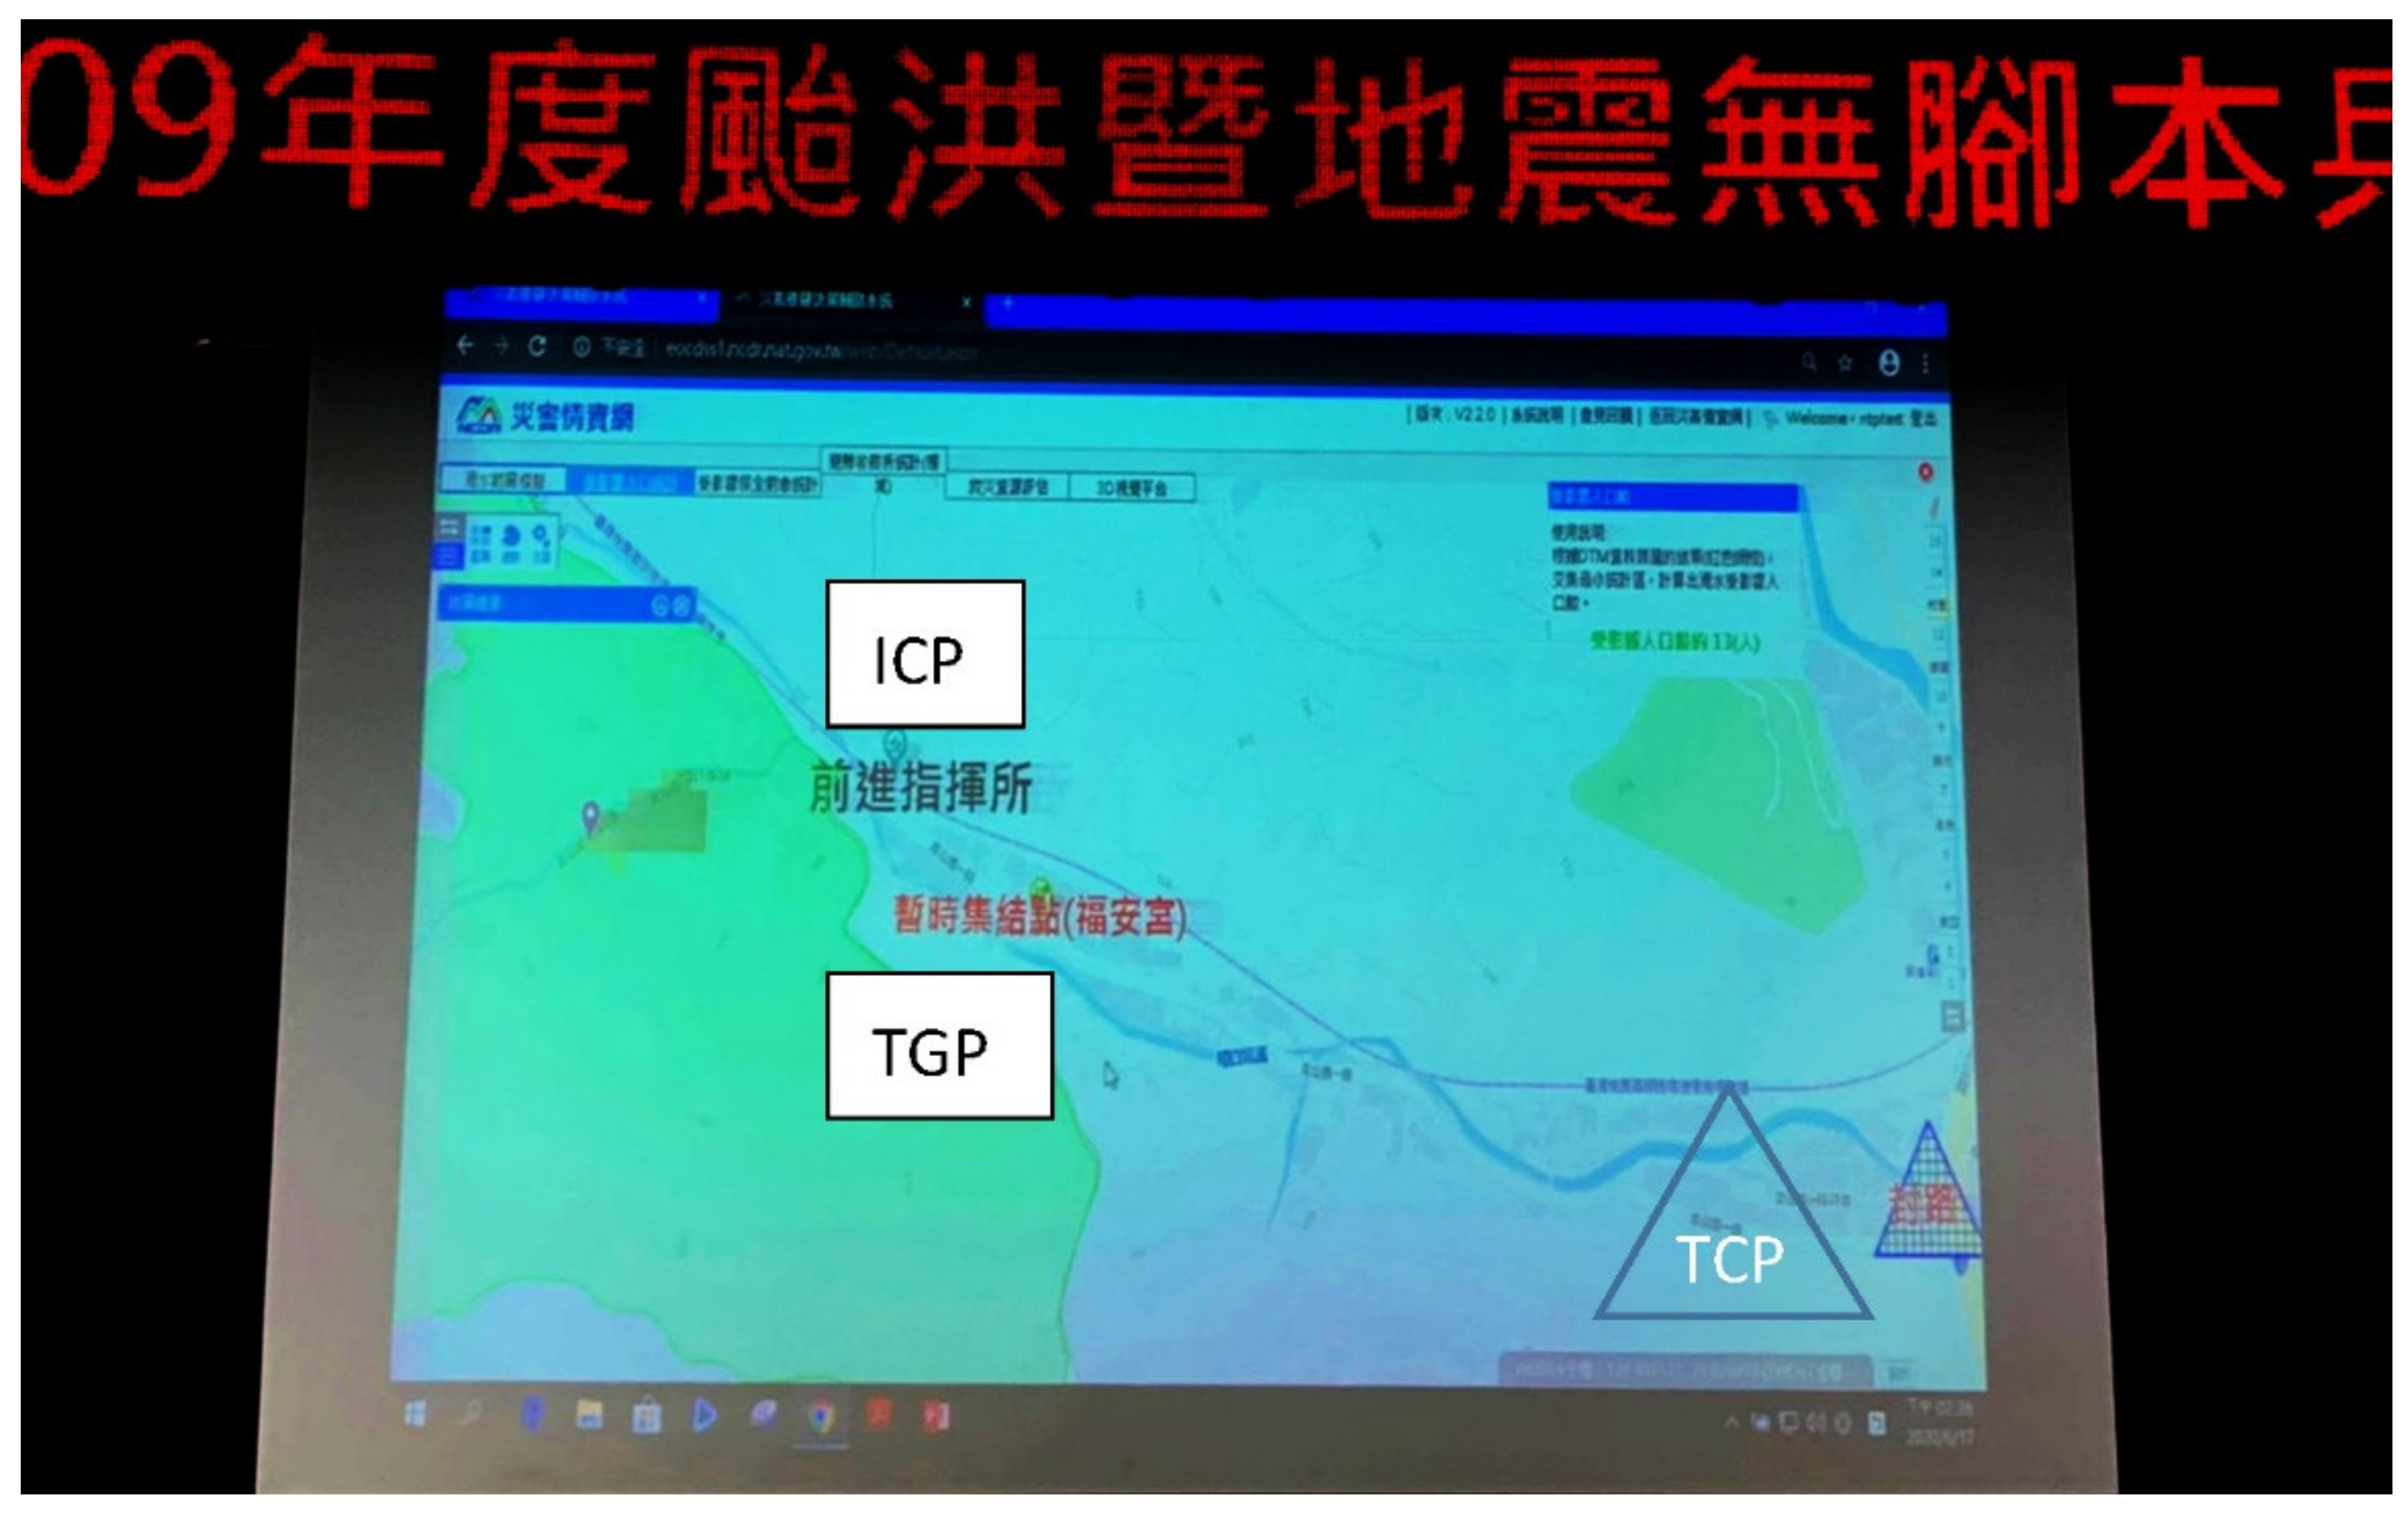
- To facilitate the dispatch of available resources, the participants hope to be able to add frequently used icons, such as the incident command post (ICP), the traffic control point (TCP), the evacuation area and the deployed personnel. Accordingly, a new function called the “little painter” has been incorporated into the platform, allowing users to draw and label objects on the platform. Figure 25 illustrates the labeling of an ICP, a temporary gathering point (TGP) and a TCP for facilitating reporting in a wargame.These functions enable the participants to visualize the distribution of resources. In the past, participants appeared to have unlimited resources at hand that they could dispatch as they pleased within a short time. In reality however, resources are limited and flooded roads may impede their dispatch. Following the recommendation of one of the surveyed respondents to “add the frequently used icons, such as the field command post, to the little painter function”, this function will be added to an updated version of the FWGAP.
- Another recommendation from the users was to categorize the flooding depth into different levels, using different colors to facilitate reading. This function has been added in the latest version of the platform. Moreover, the flooding depth meets the regulations of the Water Resources Agency, Taiwan.
4. Conclusions and Future Work
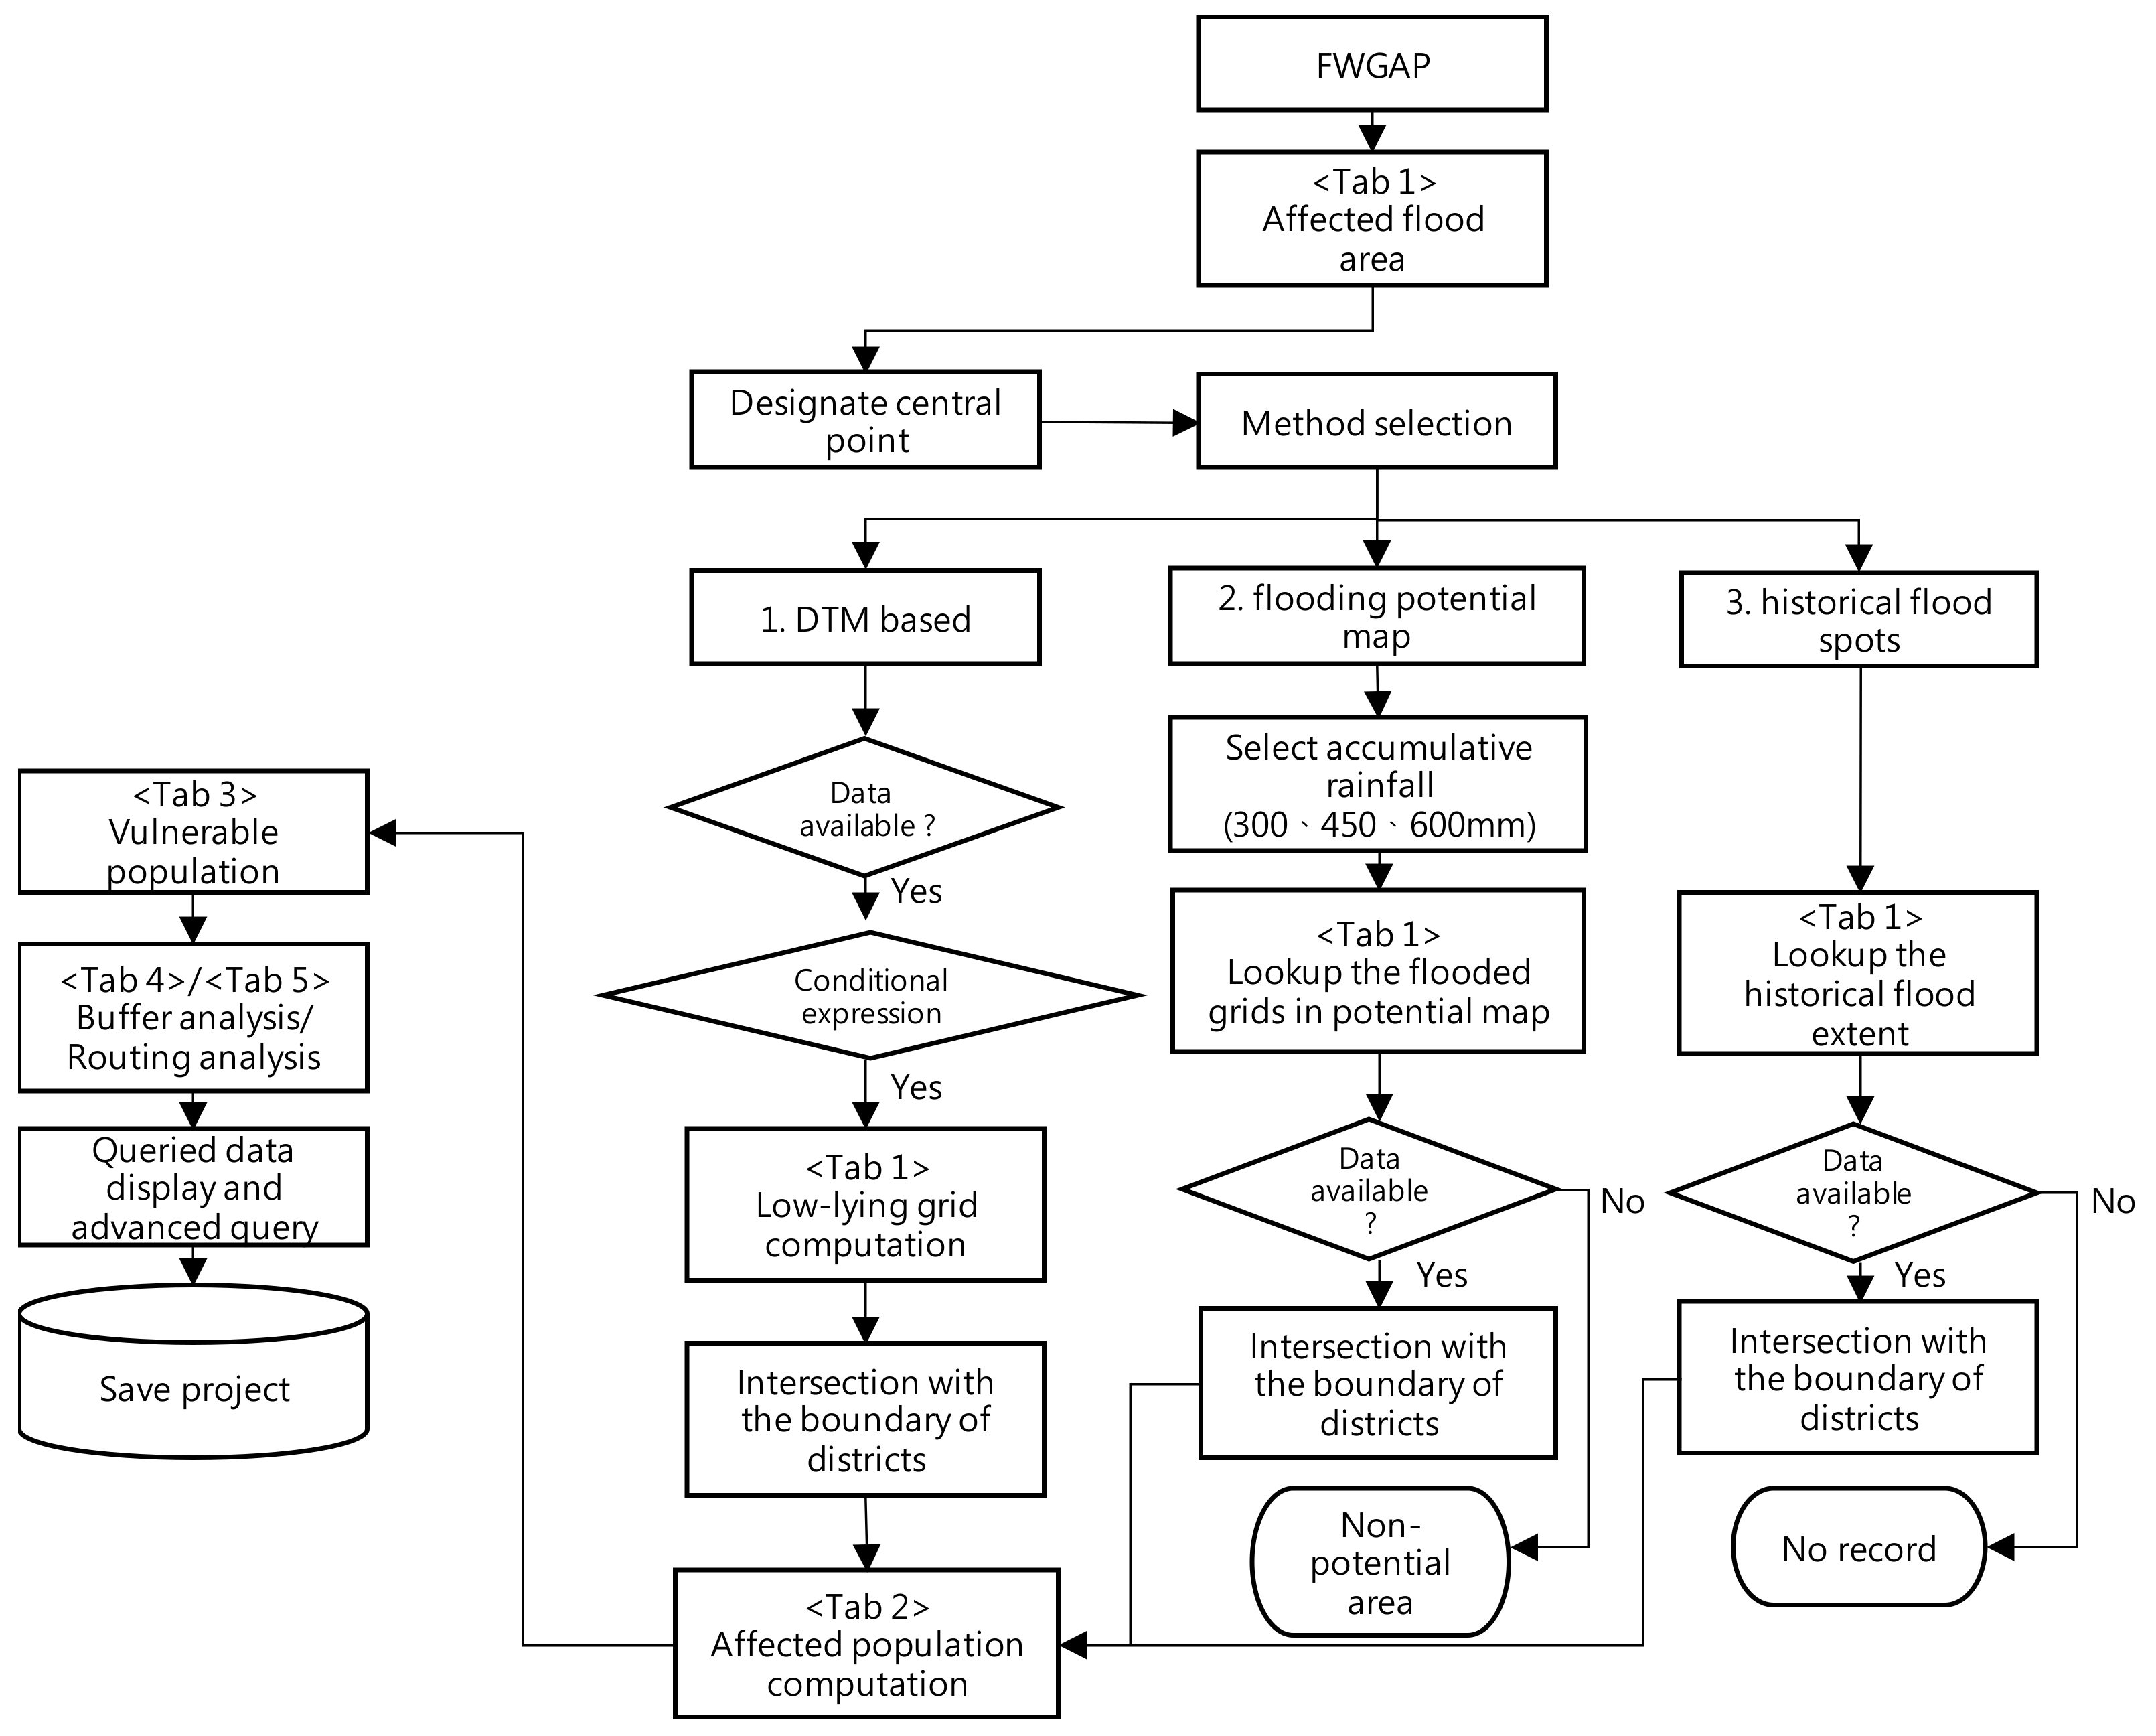
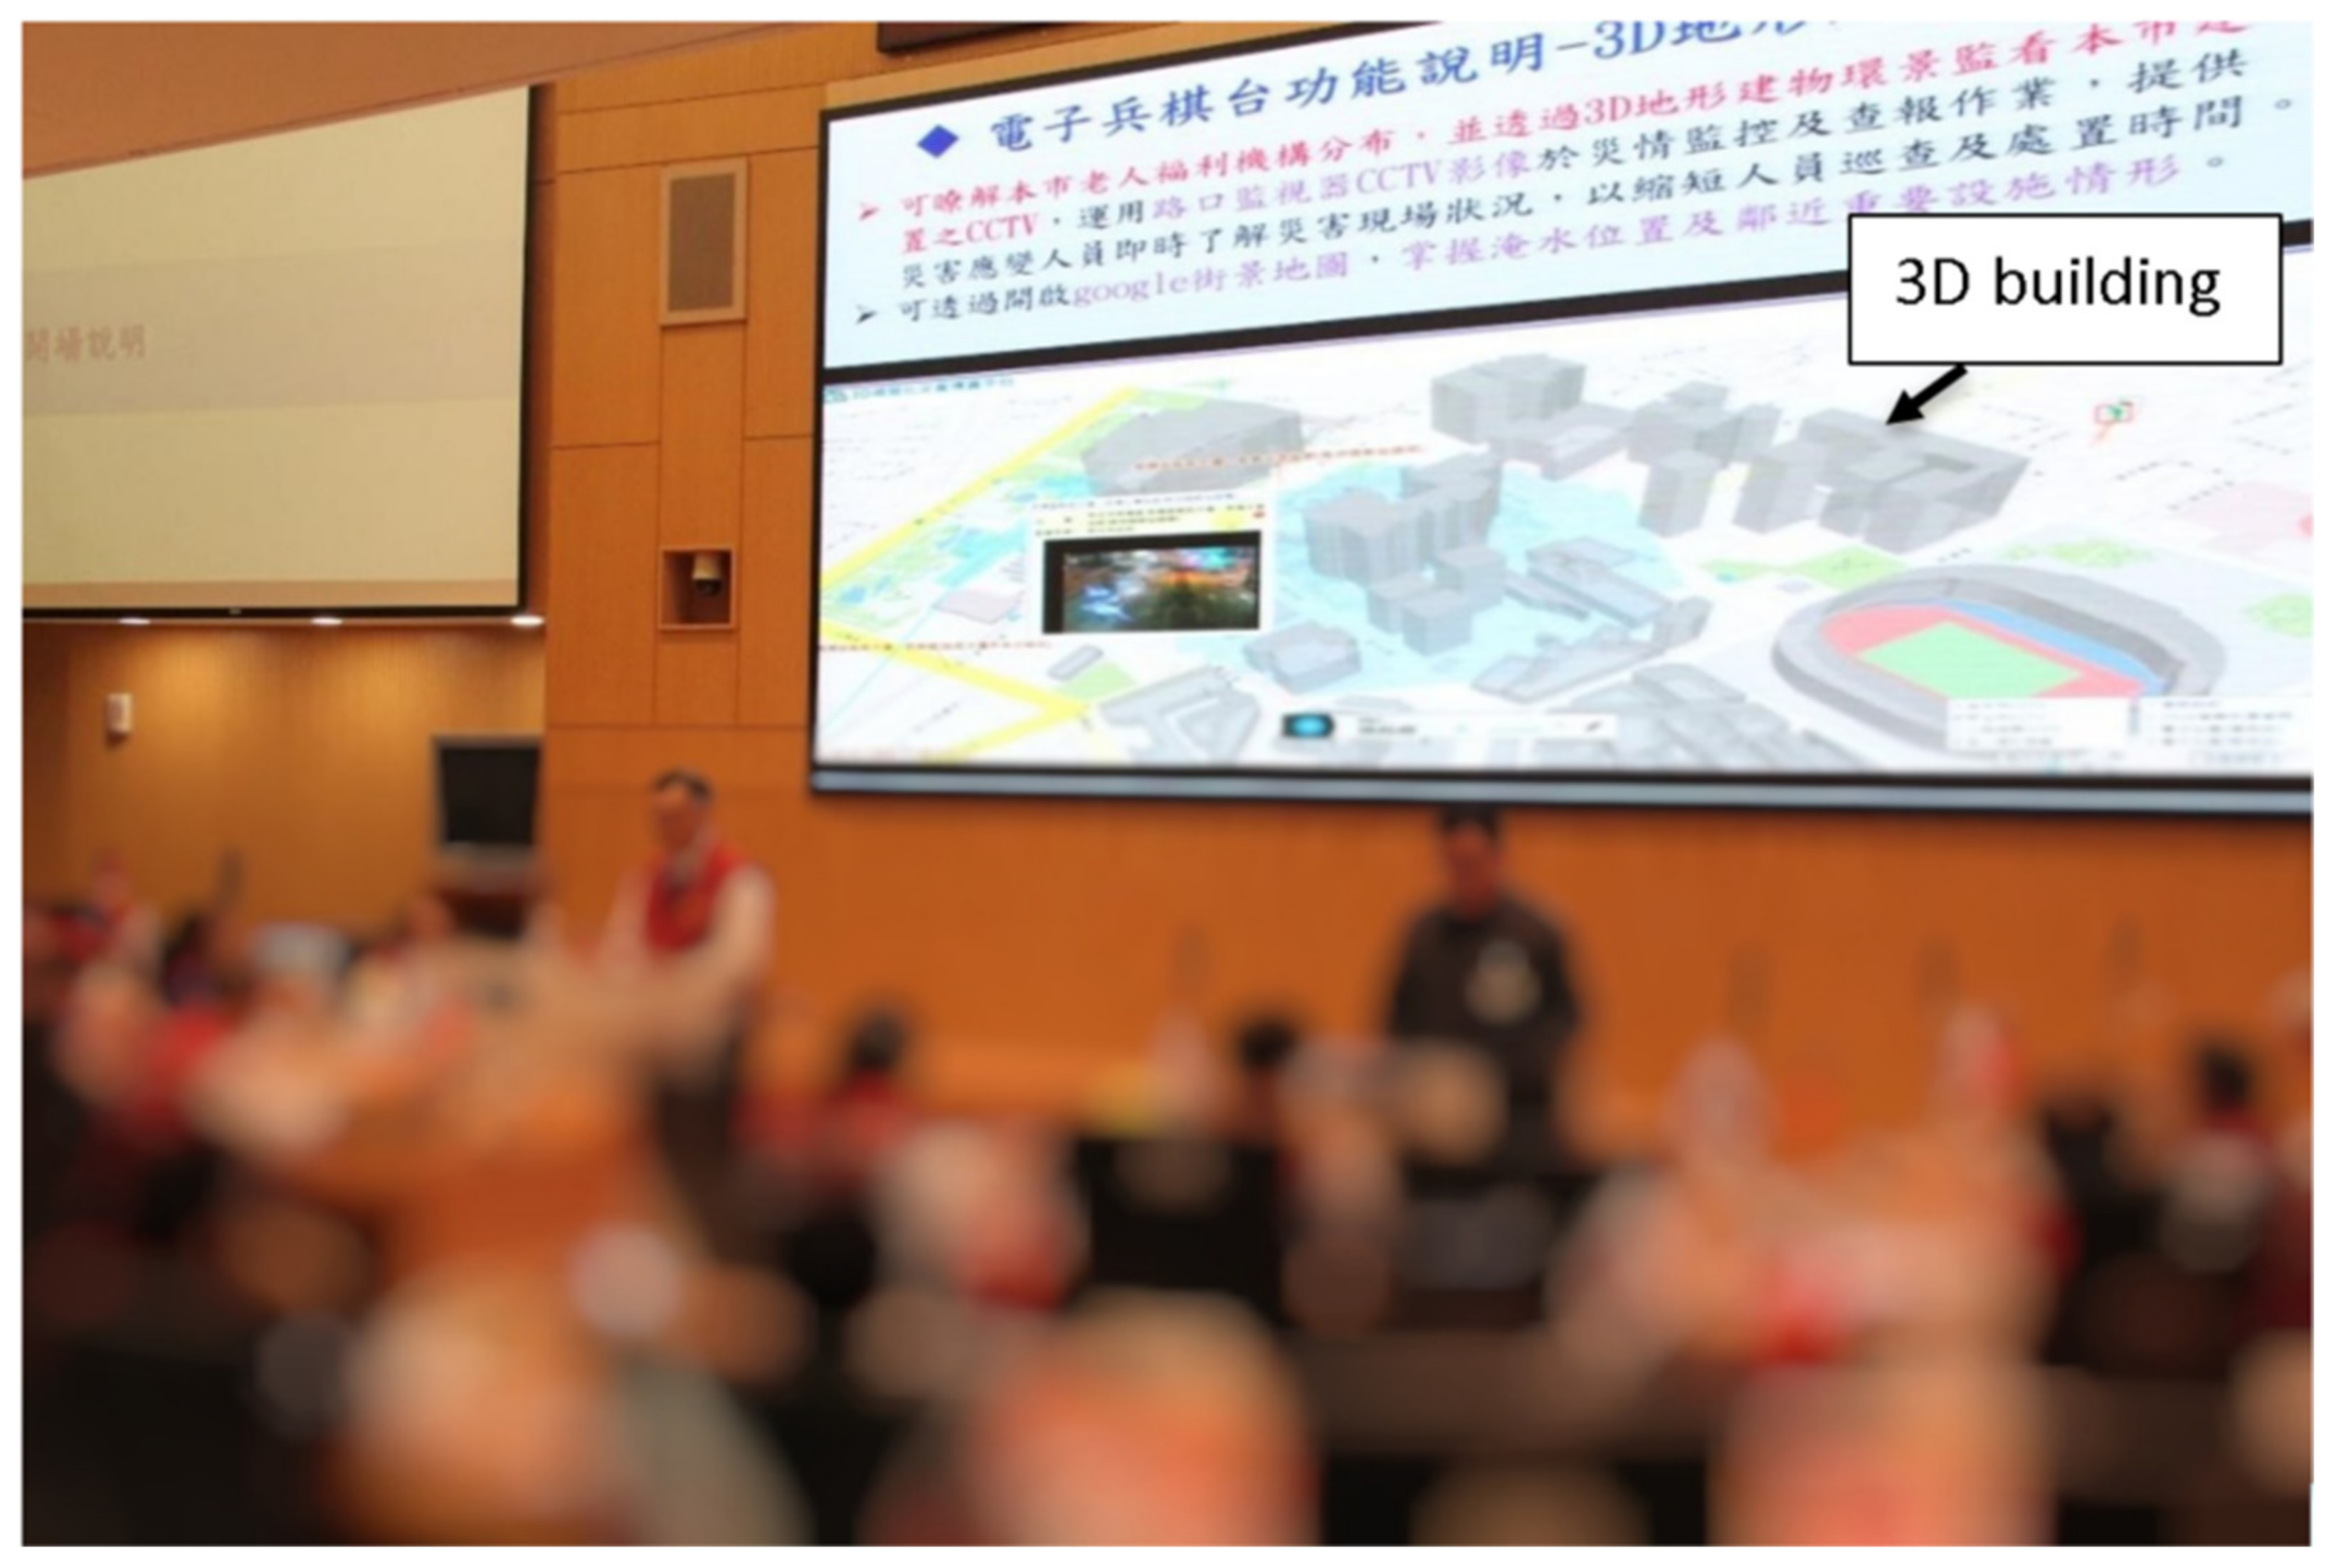
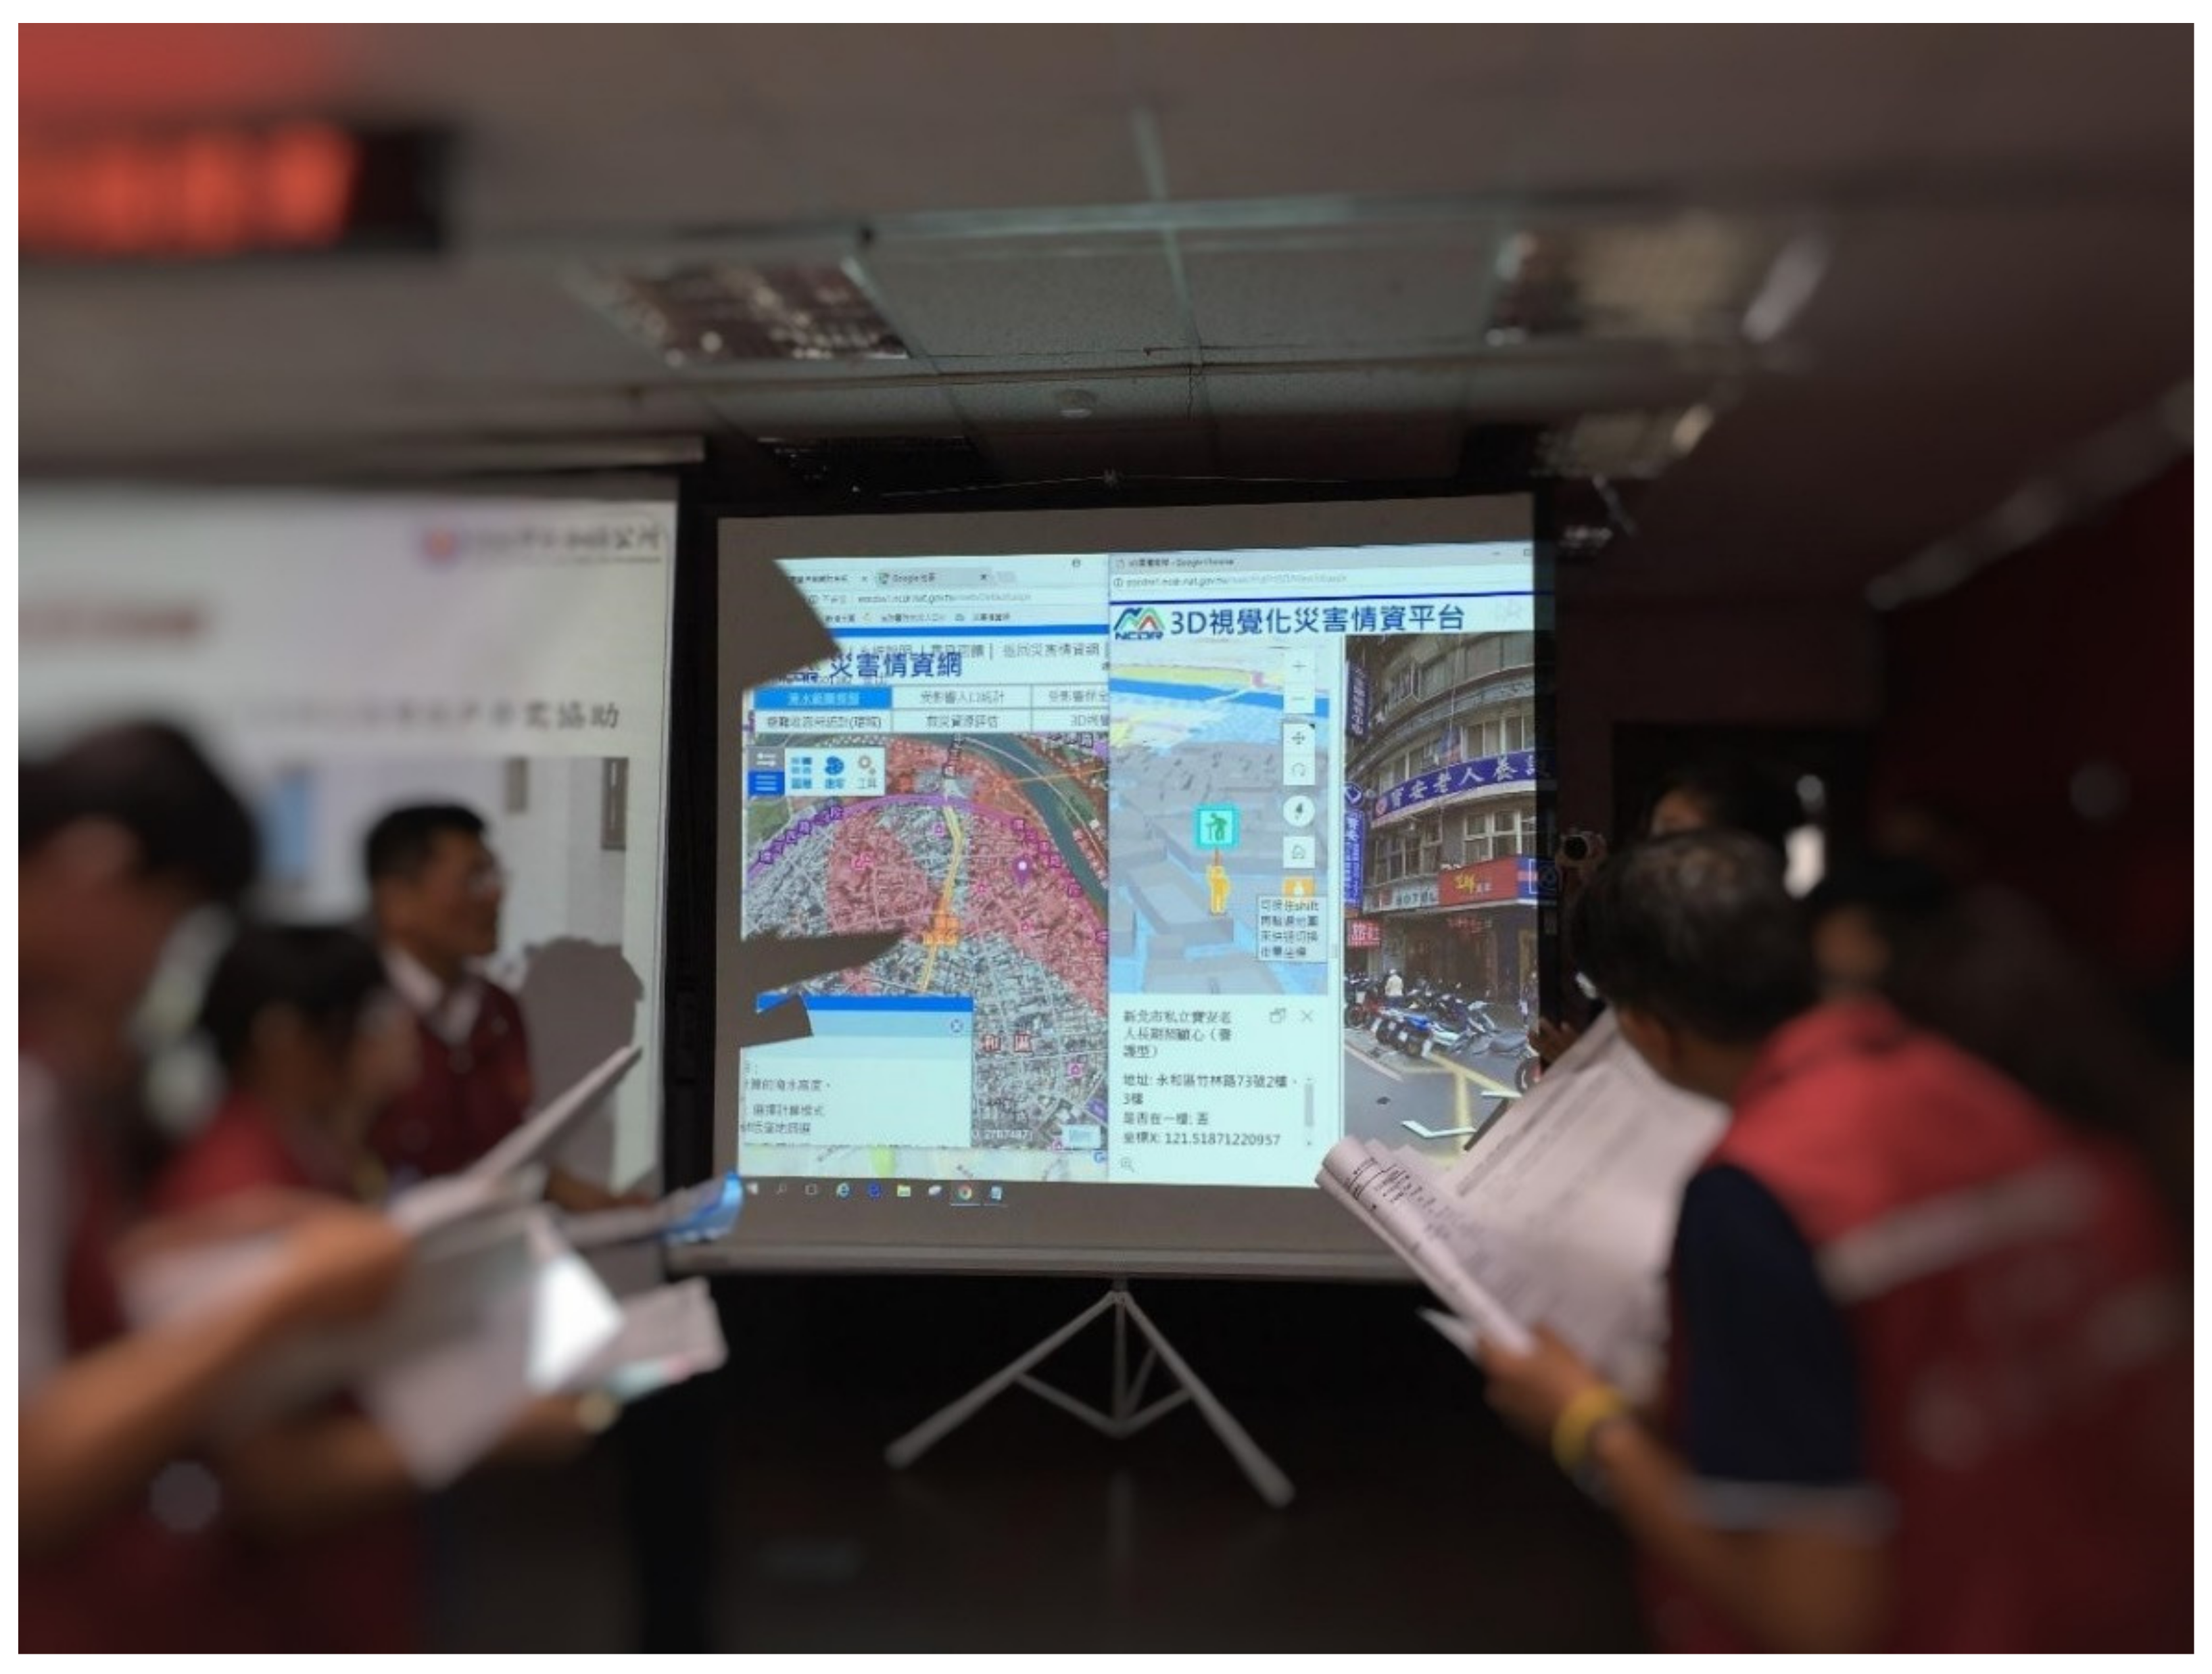
- GIS, CCTV images, 3D buildings, and Google Street View functions have been incorporated within the FWGAP. Three methods can be used to estimate the flooded area: (1) the flooding center and depth with a DTM, (2) historical flooding spots and (3) potential flooding maps.
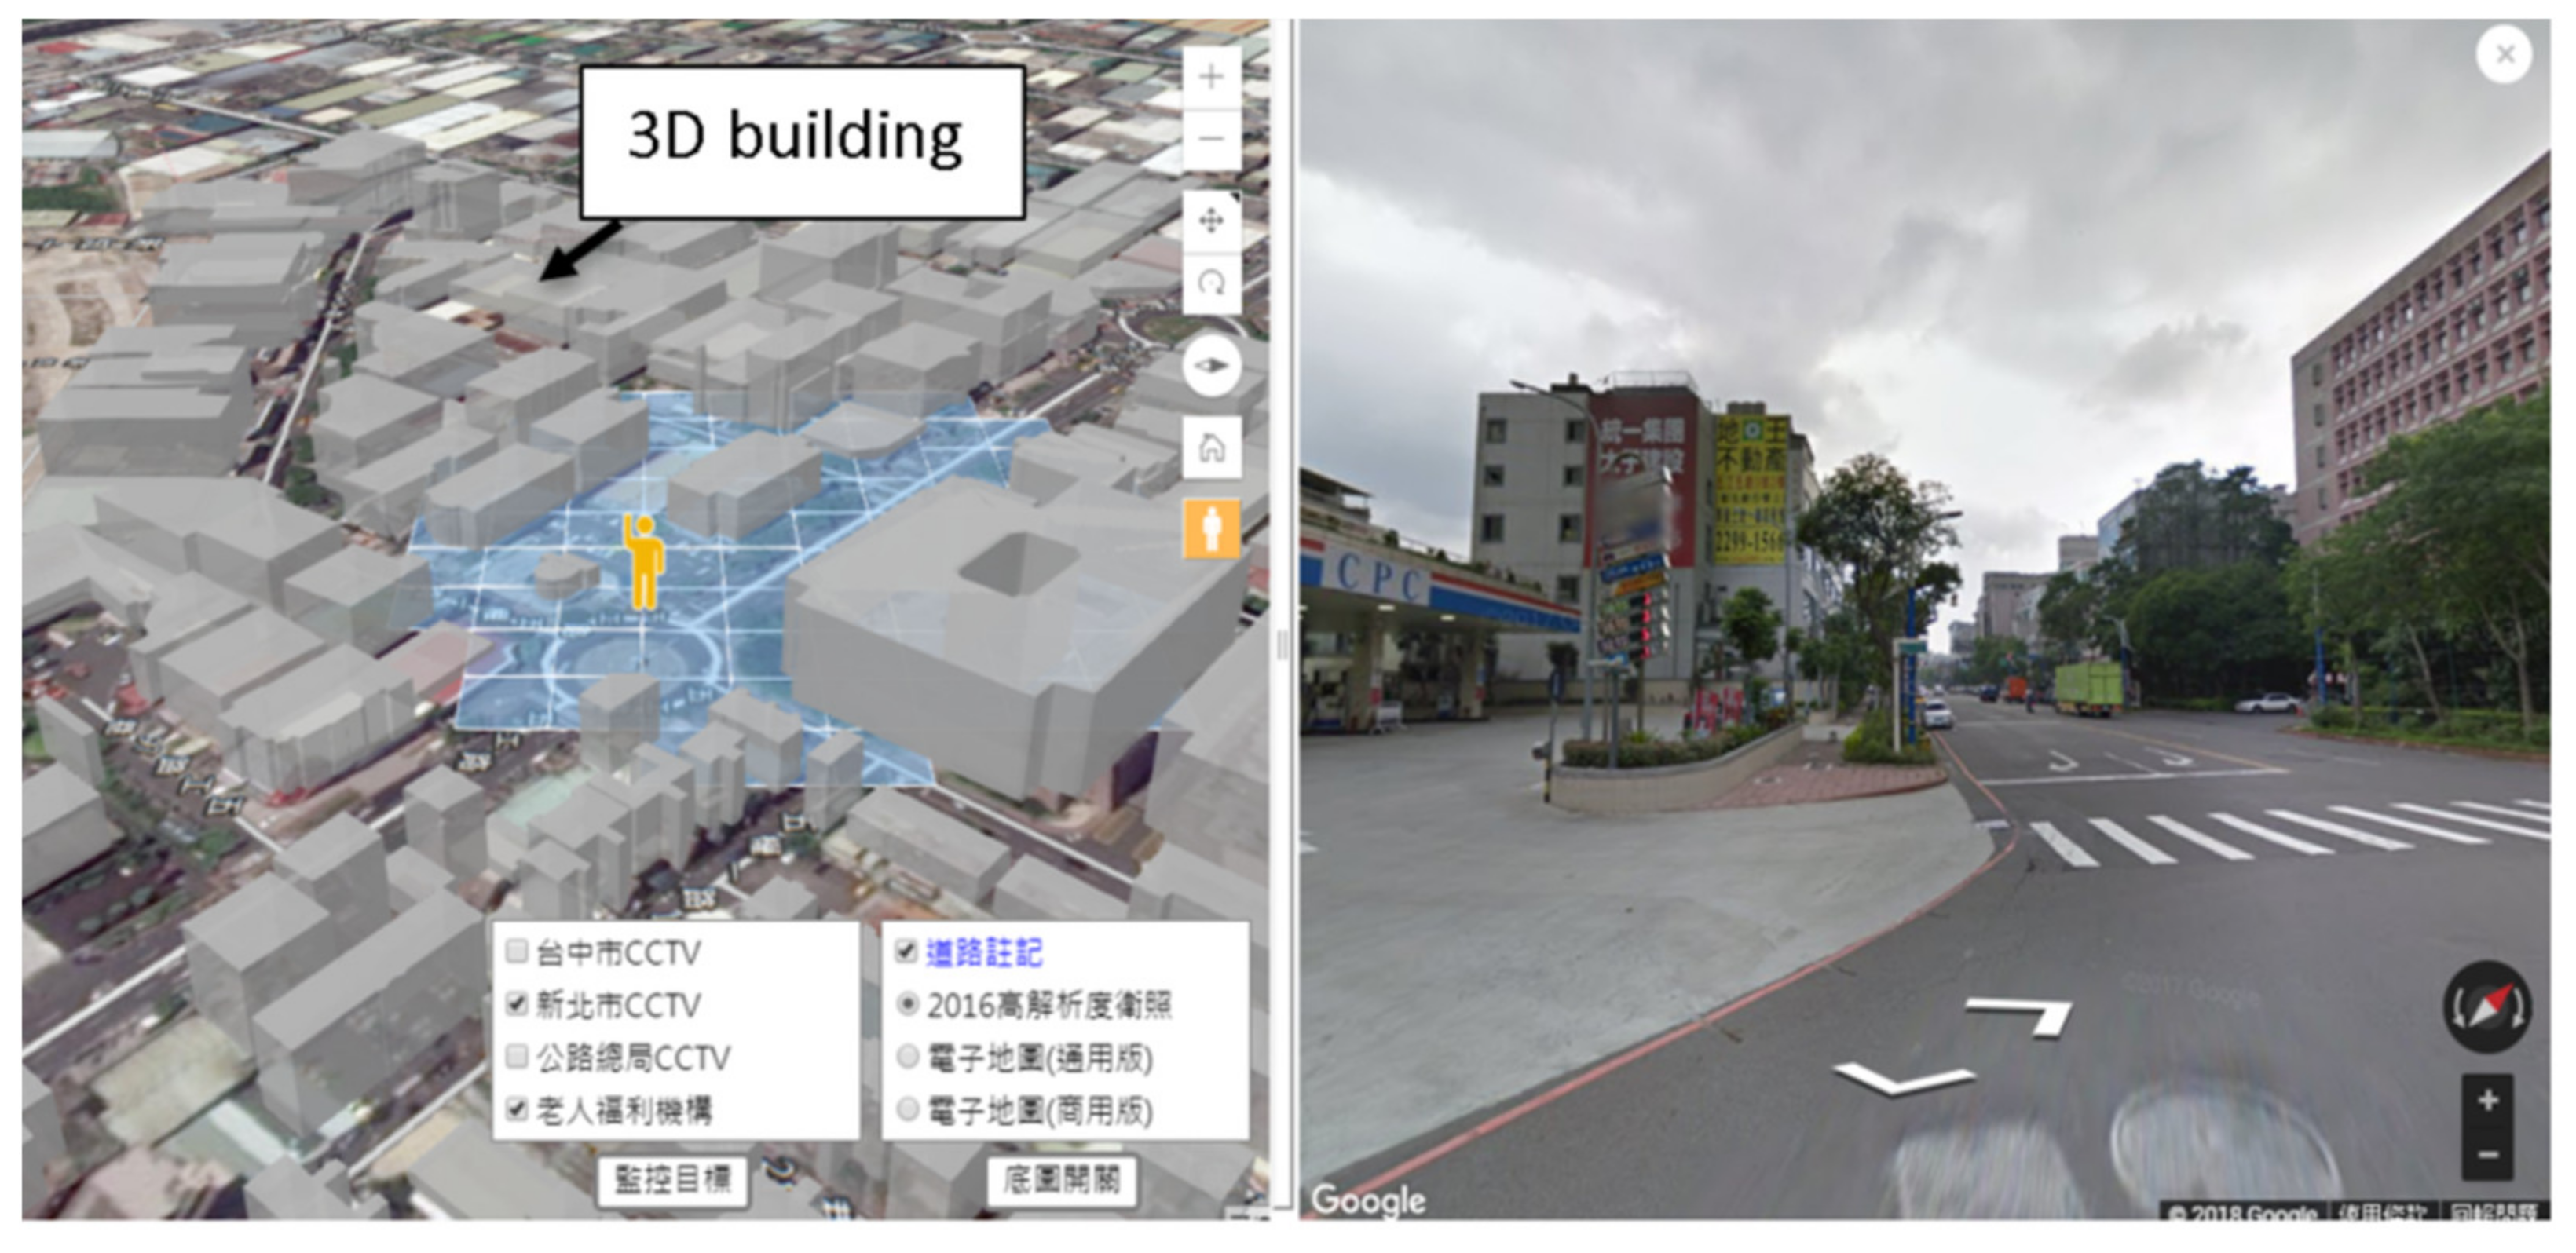
- The estimated affected areas can provide the basis for a spatial analysis to locate nearby resources such as shelters, disaster relief resources, hospitals, and care centers for the elderly, as well as the affected population. The three-dimensional building and street view functions provide the response team with an immersive experience: for example, they can view the floors of a care center for the elderly. The CCTV’s real-time images enable instant surveillance of the flooding situation. The FWGAP can be used not only in wargames, but also during disasters.
- New layers and modules can easily be added to the platform given its flexibility. The participants can use the standard platform when discussing the response plan. The survey results revealed that the primary users of the platform are relatively young. Over half of the participants thought that three-dimensional buildings, Google Street View maps, and CCTV images could increase the fidelity of the simulation. However, 44% and 56% of the participants, respectively, felt that the estimates of flooded areas and affected populations were too large. The search function for locating resources near the flooded area was considered the most useful function. There is considerable scope for improving these two functions. The “little painter” function, which enabled participants to label the ICP, control area, and traffic control spots, was ranked second for functionality.
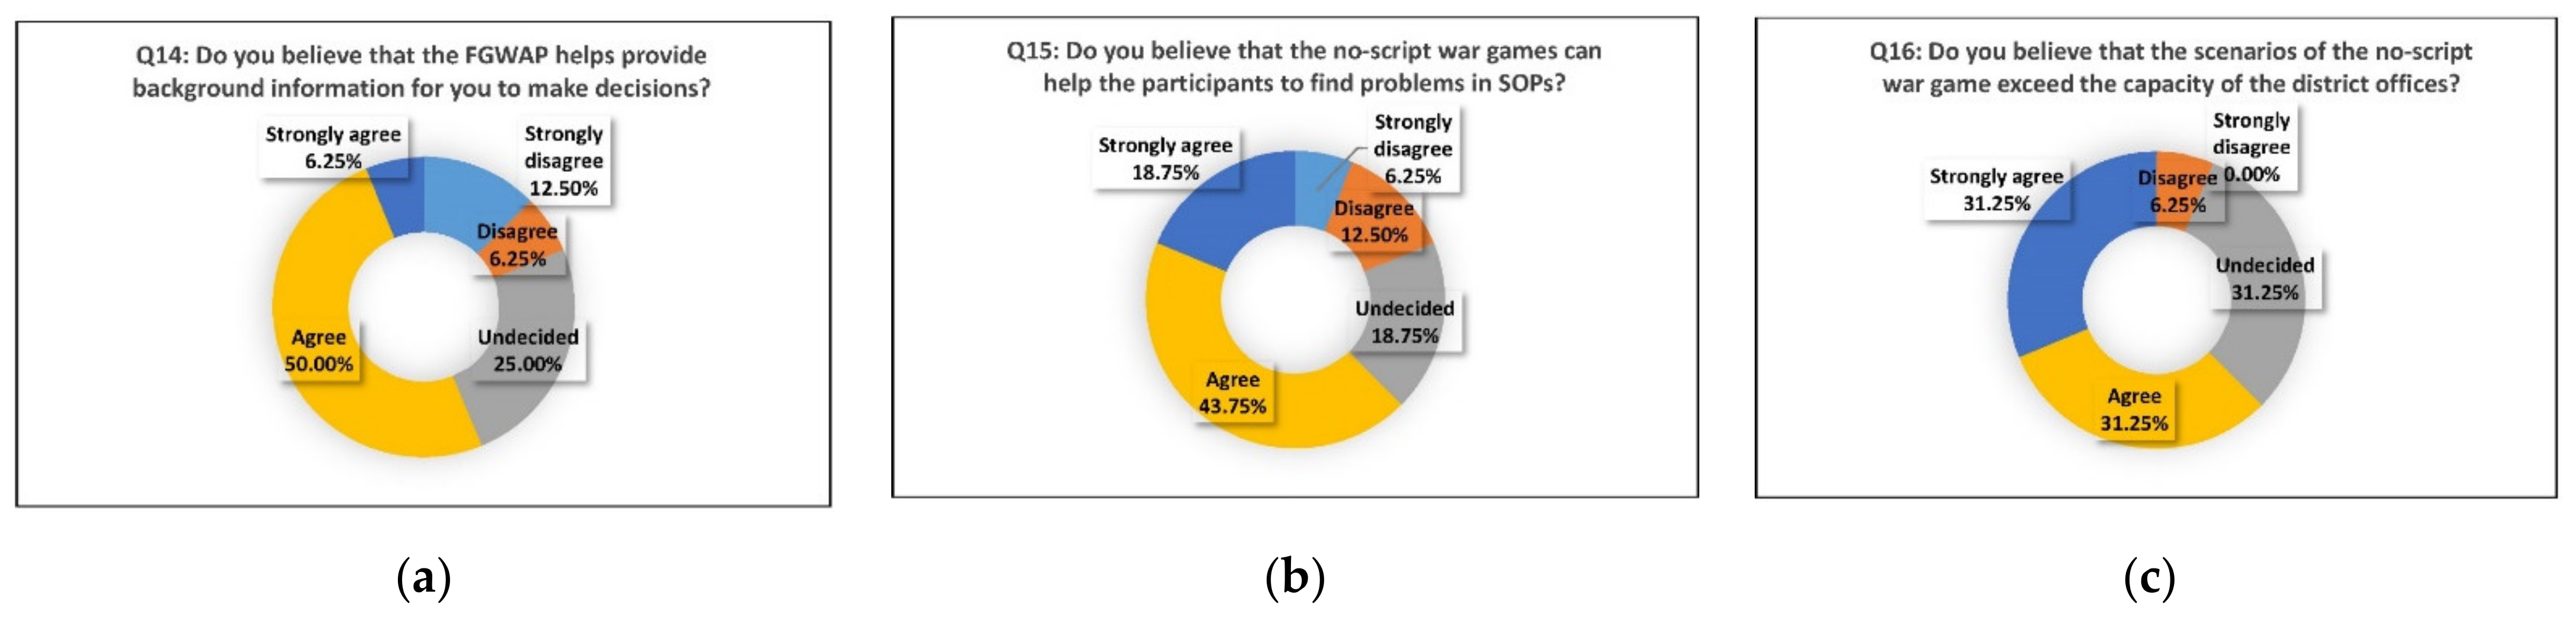
- About 56% of the participants felt that the FGWAP would provide useful background information during wargames. About half of the participants believed that a no-script flooding wargame using the FWGAP could facilitate the identification of issues relating to the SOPs and promote horizontal coordination among departments. In conclusion, the FWGAP was found to be a useful platform for a no-script flooding wargame.
- Currently, the system can only be applied with pre-set scenarios that have been constructed based on 24-h quantitative rainfall flooding, potential maps, or historical flooding spots. In the future, it will be possible to use multiple sets of pre-calculated flooding potential maps, for example, a 24-h 350 mm flooding potential scenario, which can be rapidly generated through the interpolation of a 24-h 300 mm flooding potential map and a 24-h 400 mm flooding potential map. Thus, the scenario’s physical settings would be generated automatically. In addition, new high-spatial resolution flooding potential maps, which takes into account the building block effect will be adopted in the platform for higher fidelity.
- The FWGAP can query the locations and capacities of nearby evacuation shelters. However, it cannot provide information on the actual deployment of resources. For example, Shelter A, which has the capacity to accommodate 300 people, now has 200 evacuees. More metadata on three-dimensional buildings could be added in the future. For example, the FWGAP metadata on care centers for the elderly currently only includes their names and addresses. Therefore, metadata on, for example, their capacities and numbers of floors could be added to the database.
Author Contributions
Funding
Institutional Review Board Statement
Informed Consent Statement
Data Availability Statement
Acknowledgments
Conflicts of Interest
References
- Von Lischka, K. Kriegsspiel (Wargame) Wie Preußische Militärs den Rollenspiel-Ahnen Erfanden. Spiegel Online. 2019. Available online: http://www.spiegel.de/netzwelt/spielzeug/kriegsspiel-wie-preussische-militaers-den-rollenspiel-ahnen-erfanden-a-625745.html (accessed on 13 January 2021). (In German).
- Federal Emergency Management Agency (FEMA); Department of Homeland Security (DHS). Homeland Security Exercise and Evaluation Program (HSEEP). 2020. Available online: https://www.fema.gov/sites/default/files/2020-04/Homeland-Security-Exercise-and-Evaluation-Program-Doctrine-2020-Revision-2-2-25.pdf (accessed on 13 January 2021).
- Federal Emergency Management Agency (FEMA); Department of Homeland Security (DHS). Hurricane Pam Exercise Concludes. 2004. Available online: https://biotech.law.lsu.edu/katrina/hpdc/docs/20040723_Hurr_Pam_exercise.pdf (accessed on 13 January 2021).
- Van Heerden, I.; Bryan, M. The Storm-What Went Wrong and Why during Hurricane Katrina–The Inside Story from One Louisiana Scientist; Viking: New York, NY, USA, 2006; pp. 143–145. [Google Scholar]
- Cabinet Office. Emergency Planning and Preparedness: Exercises and Training. 2013. Available online: https://www.gov.uk/guidance/emergency-planning-and-preparedness-exercises-and-training (accessed on 13 January 2021).
- Table Top Exercise Research Group (TTERG). Introduction to Table Top Exercise; Naigai Publishing: Tokyo, Japan, 2011; pp. 59–61. [Google Scholar]
- Emergency Information Davison (EID); Department of Emergency Management. Shizuoka Prefecture. DIG in the Household-How to Live after an Earthquake. Shizuoka Prefecture Website. 2012. Available online: https://www.pref.shizuoka.jp/bousai/chosa/kateinaidig.html (accessed on 13 January 2021).
- National Fire Agency (NFA). Handbook of Disaster Wargame of the Earthquake for the Local Government; NFA: Taipei, Taiwan, 2012. (In Chinese) [Google Scholar]
- Homeland Security Office (HSO). Executive Yuan. Exercise Handbook of National Critical Infrastructure; HSO: Taipei, Taiwan, 2019. (In Chinese) [Google Scholar]
- Tsai, M.H.; Chang, Y.L.; Kao, C.; Kang, S.C. The effectiveness of a flood protection computer game for disaster education. Vis. Eng. 2015, 3, 9. [Google Scholar] [CrossRef] [Green Version]
- Tsai, M.H.; Wen, M.C.; Chang, Y.L.; Kang, S.C. Game-based education for disaster prevention. AI Soc. 2015, 30, 463–475. [Google Scholar] [CrossRef]
- Tsai, M.H.; Chang, Y.L.; Shiau, J.S.; Wang, S.M. Exploring the effects of a serious game-based learning package for disaster prevention education: The case of Battle of Flooding Protection. Int. J. Disaster Risk Reduct. 2000, 43, 101393. [Google Scholar] [CrossRef]
- Rebolledo-Mendez, G.; Avramides, K.; de Freitas, S.; Memarzia, K. Societal impact of a Serious Game on raising public awareness: The case of FloodSim. In Proceedings of the 2009 ACM SIGGRAPH Symposium on Video Games, New Orleans, LA, USA, 4–9 August 2009; Spencer, S.N., Ed.; Machinery: New York, NY, USA, 2009; pp. 15–22. [Google Scholar] [CrossRef] [Green Version]
- United Nations Office for Disaster Risk Reduction (UNDRR). Stop Disasters v1.3.3. 2019. Available online: https://www.stopdisastersgame.org/stop_disasters/ (accessed on 13 January 2021).
- Lee, H.Y.; Shan, H.Y.; Maa, S.Y.; Wang, J.J.; Lin, Y.J. On the Establishment of the Flooding Wargame System—An Example of Keelung River of Shitze Area; Central Disaster Prevention and Response Council, Executive Yuan: Taipei, Taiwan, 2013. (In Chinese) [Google Scholar]
- Chen, P.; Zhang, J.; Sun, Y.; Liu, X. Wargame Simulation Theory and Evaluation Method for Emergency Evacuation of Residents from Urban Waterlogging Disaster Area. Int. J. Environ. Res. Public Health 2016, 13, 1260. [Google Scholar] [CrossRef] [PubMed]
- Tsai, C.T. The Disaster Prevention Performance of Applying the Interactive Electronic Whiteboard in a War-Game Simulation-The Case Study of Minxiong Township. Master’s Thesis, Department of Information Management, Nanhua University, Chiayi, Taiwan, 2012. [Google Scholar]
- Hsieh, H.T. A Mix-Reality-Based Interactive War-Gaming Platform. Master’s Thesis, National Central University, Taoyuan, Taiwan, 2013. [Google Scholar]
- Chen, Y.F.; Waston, D.; Miles, L. Investigating the effectiveness of using immersive virtual world exercises to teach disaster, development and other: A comparative study of tools developed by Coventry University. In Proceedings of the the 5th International Disaster and Risk Conference, Davos, Switzerland, 24–28 August 2014; pp. 151–154. [Google Scholar]
- Chen, Y.F. Evaluation of strategic emergency response training on an OLIVE platform. Simul. Gaming 2013, 45, 732–751. [Google Scholar] [CrossRef]
- Tsai, M.H.; Juang, J.R.; Kang, S.C.; Lai, J.S.; Tan, Y.C. Generator of Drill Script for Compound Natural Disasters. J. Disaster Manag. 2014, 3, 25–40. (In Chinese) [Google Scholar] [CrossRef]
- Fang, R.C. Disaster prevention and rescue simulation system and its improvement methods. Fire Saf. Mon. 2017, 6, 62–69. (In Chinese) [Google Scholar]
- Manfreda, S.; Di Leo, M.; Sole, A. Detection of Flood-Prone Areas Using Digital Elevation Models. J. Hydrol. Eng. 2011, 16, 781–790. [Google Scholar] [CrossRef]
- Samela, C.; Persiano, S.; Bagli, S.; Luzzi, V.; Mazzoli, P.; Humer, G.; Reithofer, A.; Essenfelder, A.; Amadio, M.; Mysiak, J.; et al. Safer RAIN: A DEM-Based Hierarchical Filling-&-Spilling Algorithm for Pluvial Flood Hazard Assessment and Mapping across Large Urban Areas. Water 2020, 12, 1514. [Google Scholar] [CrossRef]
- Casulli, V. A high-resolution wetting and drying algorithm for free-surface hydrodynamics. Int. J. Numer. Methods Fluids 2009, 60, 391–408. [Google Scholar] [CrossRef]
- Brunner, G.W. HEC-RAS River System 2D Modeling User’s Manual Version 6.0; USACE: Davis, CA, USA, 2021; pp. 1-3–1-5. [Google Scholar]
- Green, W.G. Exercise Alternatives for Training Emergency Management Command Center Staffs; Universal Publisher: Irvine, CA, USA, 2000; pp. 8–10. [Google Scholar]
- Federal Emergency Management Agency (FEMA). Emergency Institute Exercise Design Course: Student Workbook; Government Printing Office: Washington, DC, USA, 1989; pp. 20–21.
- Lovelock, D. Eight Propositions and a Proposal; ABSEL/SAGSET Conference: Warwick, UK, 1994. [Google Scholar]
- Chen, Y.F.; Wang, J.J.; Ma, S.Y. Planning of the exercise. In Emergency Management; Wang, J.J., Ed.; Wunan Publisher: Taipei, Taiwan, 2019; pp. 137–160. (In Chinese) [Google Scholar]
- Ordóñez, L.; Benson, L., III. Decisions under Time Pressure: How Time Constraint Affects Risky Decision Making. Organ. Behav. Hum. Decis. Process. 1997, 71, 121–140. [Google Scholar] [CrossRef]
- Kocher, M.G.; Pahlke, J.; Trautmann, S.T. Tempus Fugit: Time Pressure in Risky Decisions. Manag. Sci. 2013, 59, 2380–2391. [Google Scholar] [CrossRef] [Green Version]
- Wang, W.C.; Hsieh, M.C.; Tseng, C.C.; Fu, H.M.; Chuang, C.T.; Wang, Y.C. Development and Application of Scenario-Based Decision-Making Support System. Disaster Manag Soc of Taiwan Electronic Bulletin Website. 2016. Available online: http://www.dmst.org.tw/e-paper/24/001b.html (accessed on 13 January 2021).
- Kang, S.C.; Wu, T.G.; Chen, Y.C.; Hsu, J.J.; Zhuang, S.K.; Tsai, M.H. Humanized-Operational Historical Typhoon Event Search Program. Disaster Manag Soc of Taiwan Electronic Bulletin Website. 2013. Available online: http://www.dmst.org.tw/e-paper/24/001b.html (accessed on 13 January 2021).
- Beilock, S. Choke: What the Secrets of the Brain Reveal About Getting it Right When You Have to; Free Press: New York, NY, USA, 2011; pp. 211–215. [Google Scholar]
- Deltares. SOBEK Hydrodynamics, Rainfall Runoff and Real Time Control User Manual; Deltares: Delft, The Netherlands, 2013. [Google Scholar]
- Dilley, M.; Chen, R.S.; Deichmann, U.; Lerner-Lam, A.L.; Arnold, M.; Agwe, J.; Buys, P.; Kjevstad, O.; Lyon, B.; Yetman, G. Natural Disaster Hotspots: A Global Risk Analysis; World Bank: Washington, DC, USA, 2015; Available online: http://documents.worldbank.org/curated/en/621711468175150317/Natural-disaster-hotspots-A-global-risk-analysis (accessed on 13 January 2021).
- Taipei Times. Twenty Elderly Patients Found Abandoned to Floods. 23 September 2010. Available online: https://www.taipeitimes.com/News/taiwan/archives/2010/09/23/2003483562 (accessed on 13 January 2021).
- Chen, Y.F.; Borodzicz, E.; Chao, J.M. Flood management: A simulation and gaming perspective. J. Environ. Mamt. 2004, 4, 109–136. [Google Scholar]
- Drabek, T.E. Managing the Emergency Response. Public Admin. Rev. 1985, 45, 85–92. [Google Scholar] [CrossRef]
- Ford, J.K.; Schmidt, A.M. Emergency response training: Strategies for enhancing real world performance. J. Hazard. Mater. 2000, 75, 195–215. [Google Scholar] [CrossRef]
- Crichton, M.; Flin, R. Training for emergency management: Tactical decision games. J. Hazard. Mater. 2001, 88, 255–266. [Google Scholar] [CrossRef]


| No. | Name | Flood Area Estimation | 2D Overland Flow Simulation Maps | Historical Flooding Area | Affected Population Estimation | Nearby Evacuation Shelter | Nearby Fire Brigade | Nearby Elderly Care Center | Nearby Hospitals | 3D Google Earth Maps | Google Street View | CCTV | GIS | 3D Building | VR | Script Generator | Educational |
|---|---|---|---|---|---|---|---|---|---|---|---|---|---|---|---|---|---|
| 1 | FWGAP (this study) | v | v | v | v | v | v | v | v | v | v | v | v | ||||
| 2 | Lee et al. (2003) | v | v | ||||||||||||||
| 3 | Large flood emergency response planning exercise Chen et al. (2013) | v | v | v | |||||||||||||
| 4 | Hsieh (2013) | v | |||||||||||||||
| 5 | Hydroelectric dam exercise Chen et al. (2014) | v | v | ||||||||||||||
| 6 | Tasi et al. (2014) | v | v | ||||||||||||||
| 7 | Tasi et al. (2015a; 2015b) | v | |||||||||||||||
| 8 | Chen et al. (2016) | v | |||||||||||||||
| 9 | FloodSim (Rebolledo-Mendez et al., 2008) | v | v | ||||||||||||||
| 10 | Stop Disasters (UNDRR, 2019) | v | v | v | |||||||||||||
| 11 | Tasi et al. (2020) | v | v |
| No. | Activities | Time (mins.) |
|---|---|---|
| 1 | The orientation process for the wargame and basic settings | 10 |
| 2 | Debriefing on the preparedness of the district for possible flooding due to torrential rain | 10 |
| 3 | Scenario 1/Debriefing 1 | 40 |
| 4 | Break | 15 |
| 5 | Scenario 2/Debriefing 2 | 40 |
| 6 | Special scenarios | 35 |
| 7 | Judge’s observations and comments | 20 |
| Scheme. | Event | Time | Description | Test Function |
|---|---|---|---|---|
| 1 | A | 08:00 | The hourly rainfall is 30 mm. The EOC for New Taipei City requests the district office to launch its EOC at Level 2. |
|
| B | 12:00 | The rainfall in nearby districts has crossed 50 (mm/h) over a 3-h period. The EOC for New Taipei City requests the district office to launch its EOC at Level 1. The director of the district office has to determine whether to announce a day off work in the afternoon. |
| |
| C | 12:35 | The accumulated rainfall in Yonghe District has reached 350 mm. There are large areas of flooding in the villages of Shanlin and Guilin. |
| |
| D | 13:00 | The torrential rain has resulted in a rise in the water level of Xindian River, which is beginning to overflow into the area behind the dike around Yongfu Bridge. Five fishermen have been flushed into the river. |
| |
| E | 13:15 | As the water level in the Xindian River continues to rise, some disabled residents on the lower floors of buildings in Shanlin need to be evacuated. |
| |
| F | 13:55 | The flooding depth of the Hyanho East Rd. reaches 1 m. |
| |
| 2 | G | 15:00 | There are about 300 residents affected by the power outage along Showan and Sholain Streets. A tree has fallen down and hit the telecommunication box in No. 62, Mitzan Rd., thereby cutting off the fixed lines for 100 households. The tap water pipe has burst in the location of a lamp post (no. 103342). |
|
| H | 15:35 | The flooding depth at the intersection of Linshan Rd and Yonghen Rd is 0.5 m. The water level under Yongfu Bridge is less than 1 m. |
| |
| I | 17:55 | The rainfall is stopping, and the EOC for New Taipei City is withdrawing the launch of its EOC. The recovery phase needs to be launched now. |
|
| Age (Years) | 26–30 | 31–35 | 36–40 | 41–45 | 46–50 |
|---|---|---|---|---|---|
| Number of Participants | 5 | 5 | 4 | 1 | 1 |
| Percentage (%) | 31.2 | 31.2 | 25 | 6.2 | 6.2 |
| Years of Disaster-Prevention Work Experience (Years) | 1–5 | 6–10 | 11–15 | 15–20 | - |
| Number of Participants | 12 | 3 | 0 | 1 | - |
| Percentage (%) | 75 | 18.7 | 0 | 6.2 | - |
Publisher’s Note: MDPI stays neutral with regard to jurisdictional claims in published maps and institutional affiliations. |
© 2021 by the authors. Licensee MDPI, Basel, Switzerland. This article is an open access article distributed under the terms and conditions of the Creative Commons Attribution (CC BY) license (https://creativecommons.org/licenses/by/4.0/).
Share and Cite
Su, W.-R.; Lin, Y.-J.; Huang, C.-H.; Yang, C.-H.; Tsai, Y.-F. 3D GIS Platform for Flood Wargame: A Case Study of New Taipei City, Taiwan. Water 2021, 13, 2211. https://doi.org/10.3390/w13162211
Su W-R, Lin Y-J, Huang C-H, Yang C-H, Tsai Y-F. 3D GIS Platform for Flood Wargame: A Case Study of New Taipei City, Taiwan. Water. 2021; 13(16):2211. https://doi.org/10.3390/w13162211
Chicago/Turabian StyleSu, Wen-Ray, Yong-Jun Lin, Chun-Hung Huang, Chun-Hung Yang, and Yuan-Fan Tsai. 2021. "3D GIS Platform for Flood Wargame: A Case Study of New Taipei City, Taiwan" Water 13, no. 16: 2211. https://doi.org/10.3390/w13162211
APA StyleSu, W.-R., Lin, Y.-J., Huang, C.-H., Yang, C.-H., & Tsai, Y.-F. (2021). 3D GIS Platform for Flood Wargame: A Case Study of New Taipei City, Taiwan. Water, 13(16), 2211. https://doi.org/10.3390/w13162211