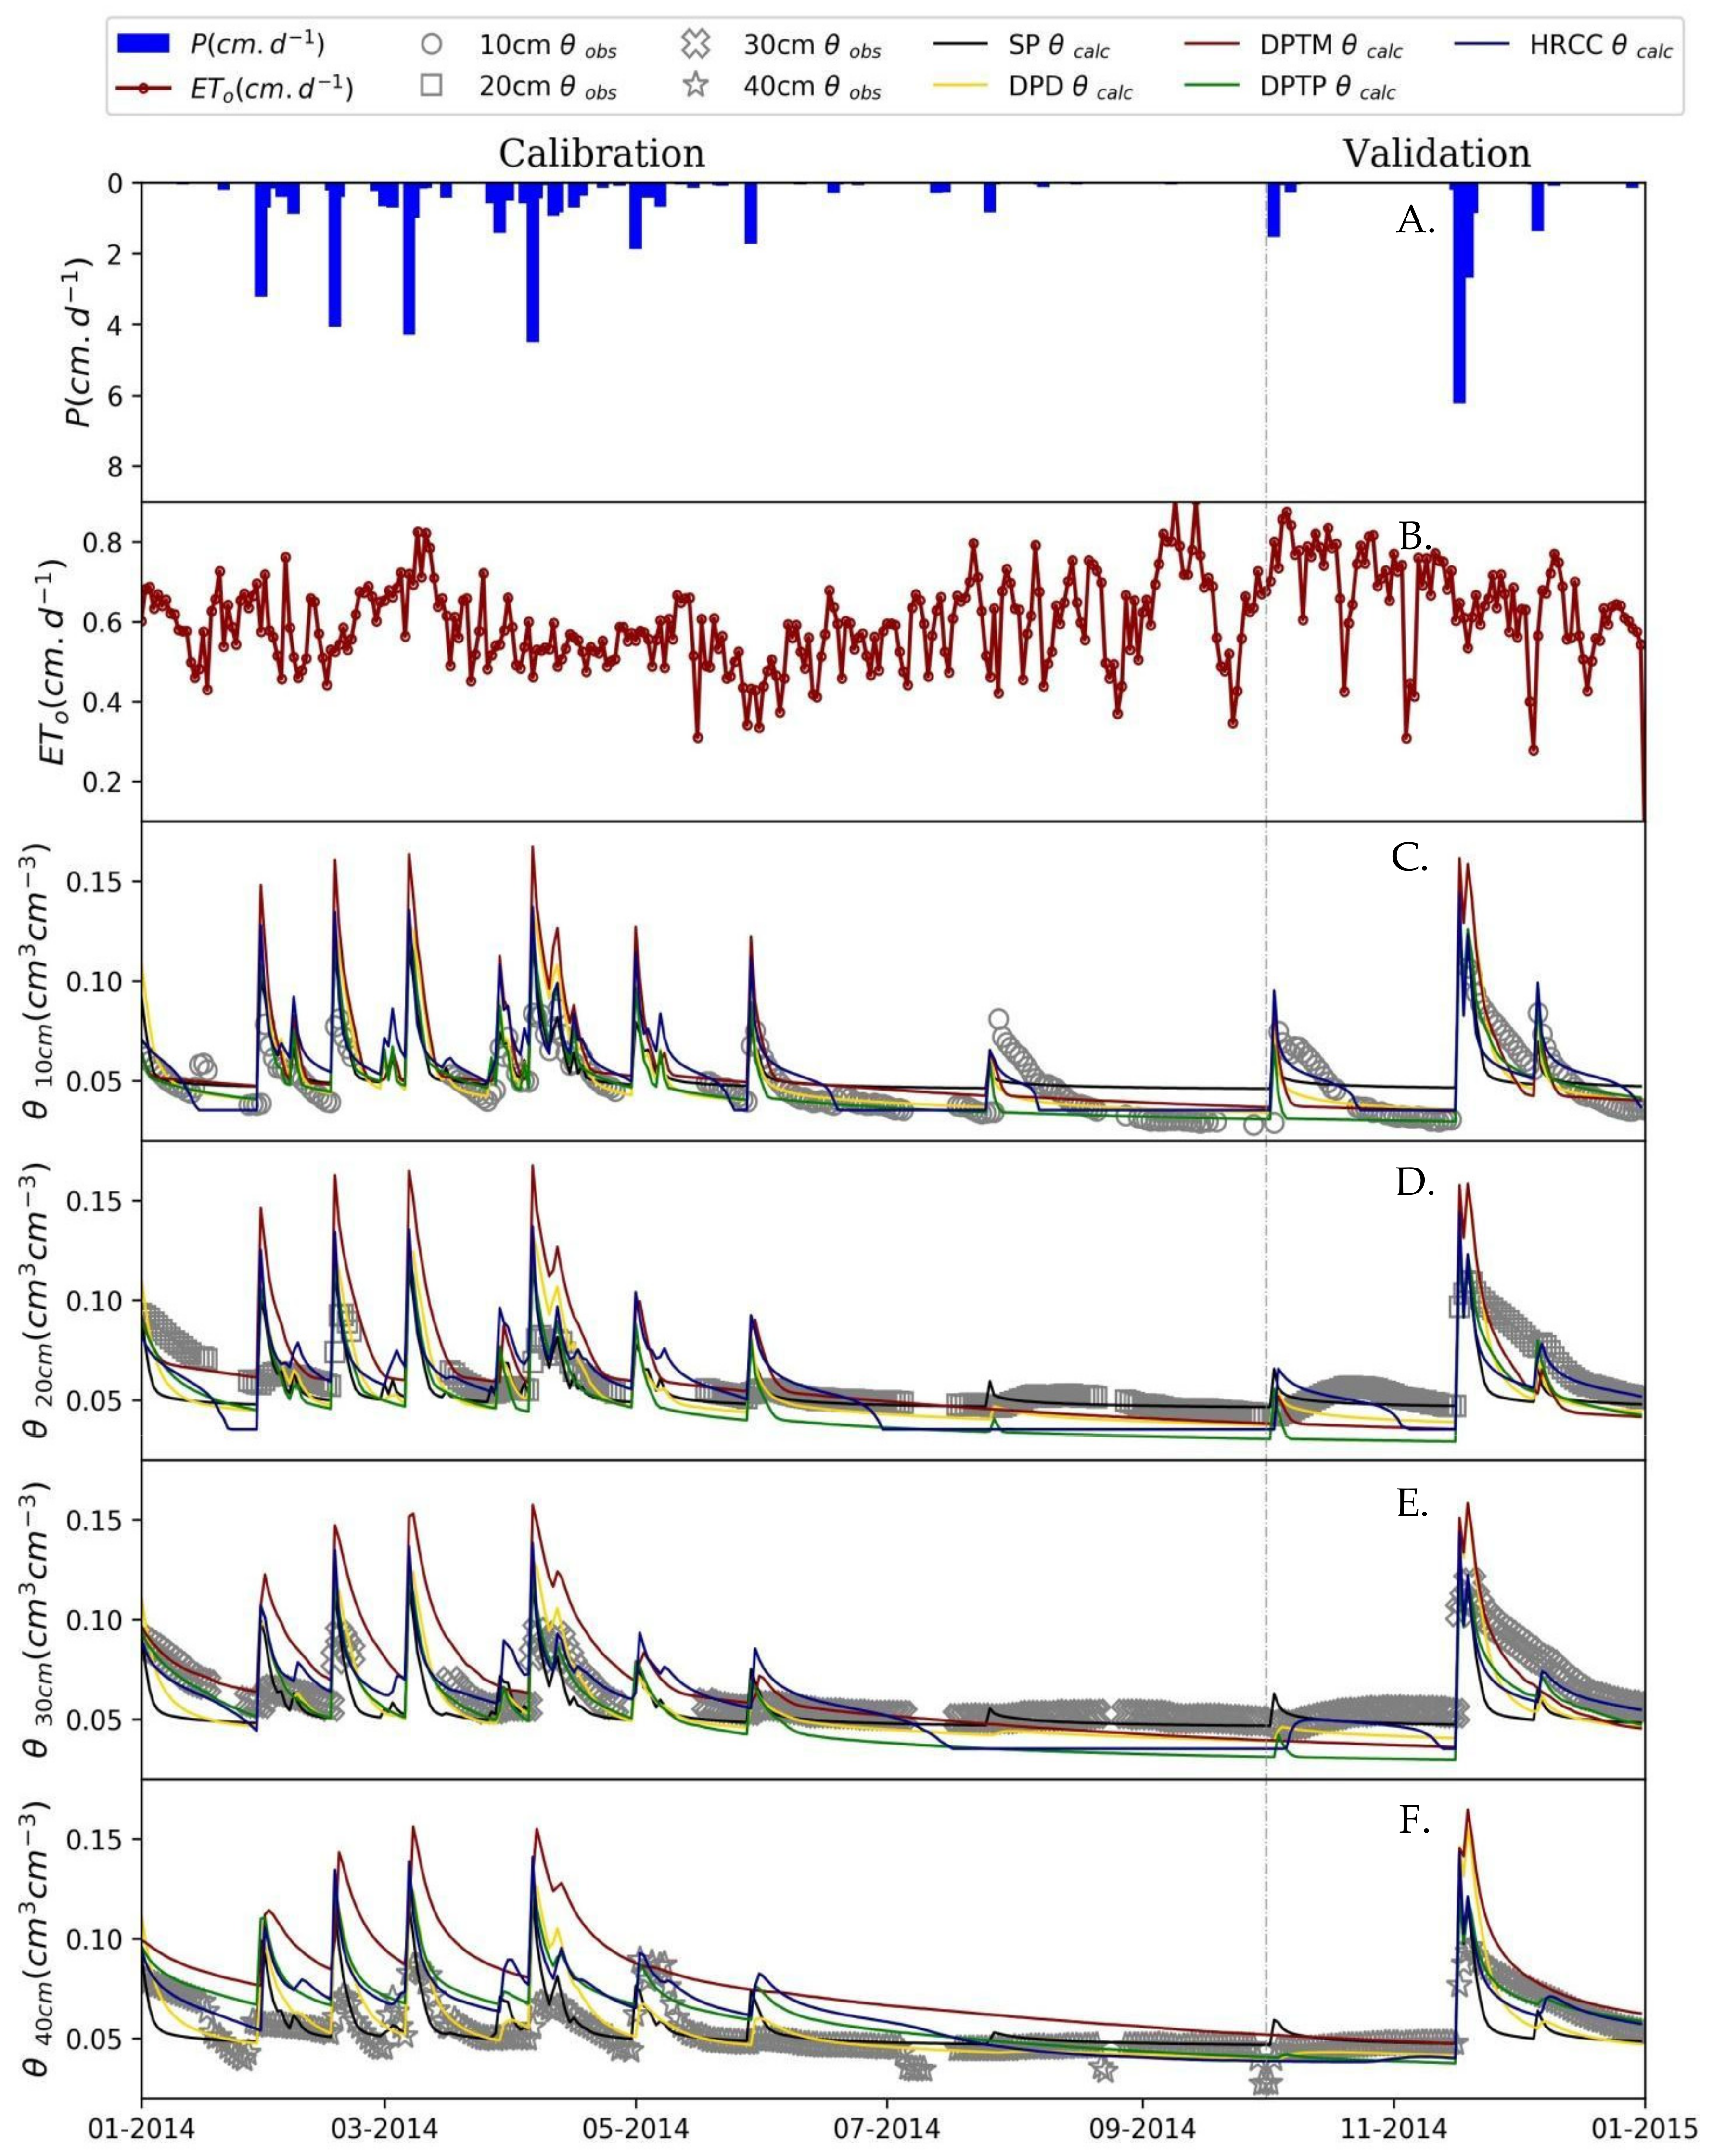
3.2. Adjustment of the Moisture Data to SP, DPD, DPTM, DPTP, and HRCC Models
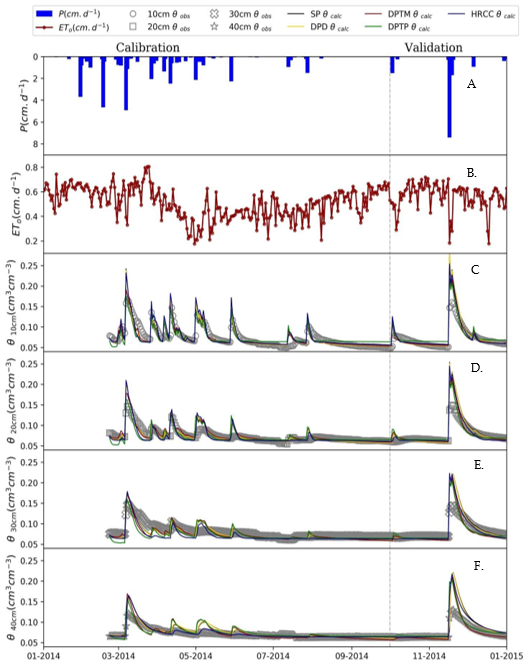
Figure 6 shows the inverse method adjustments for the soil hydraulic models SP, DPD, DPTM, DPTP, and HRCC at the BR-CST tower. In general, the models presented similar behavior. In the calibration step, the fits were better for the lower depths. At 30 and 40 cm depths, the model showed the same sensitivity to rain events as to 10 and 20 cm depths. However, the monitored soil moisture presented a higher variation at the surface.
The inverse method of one-dimensional water flow models finds difficulty in demonstrating the field spatial reality from data measured with TDR and tensiometers [
56]. This type of failure occurs because the Hydrus-1D model is unable to account for the 3D horizontal water flow and lateral drainage that occur in the field.
In the validation step, the models reacted to the soil moisture peak of November and October, but they overestimated these peaks. In general, among the models, the DPTP simulated the lowest soil moisture values in rain events.
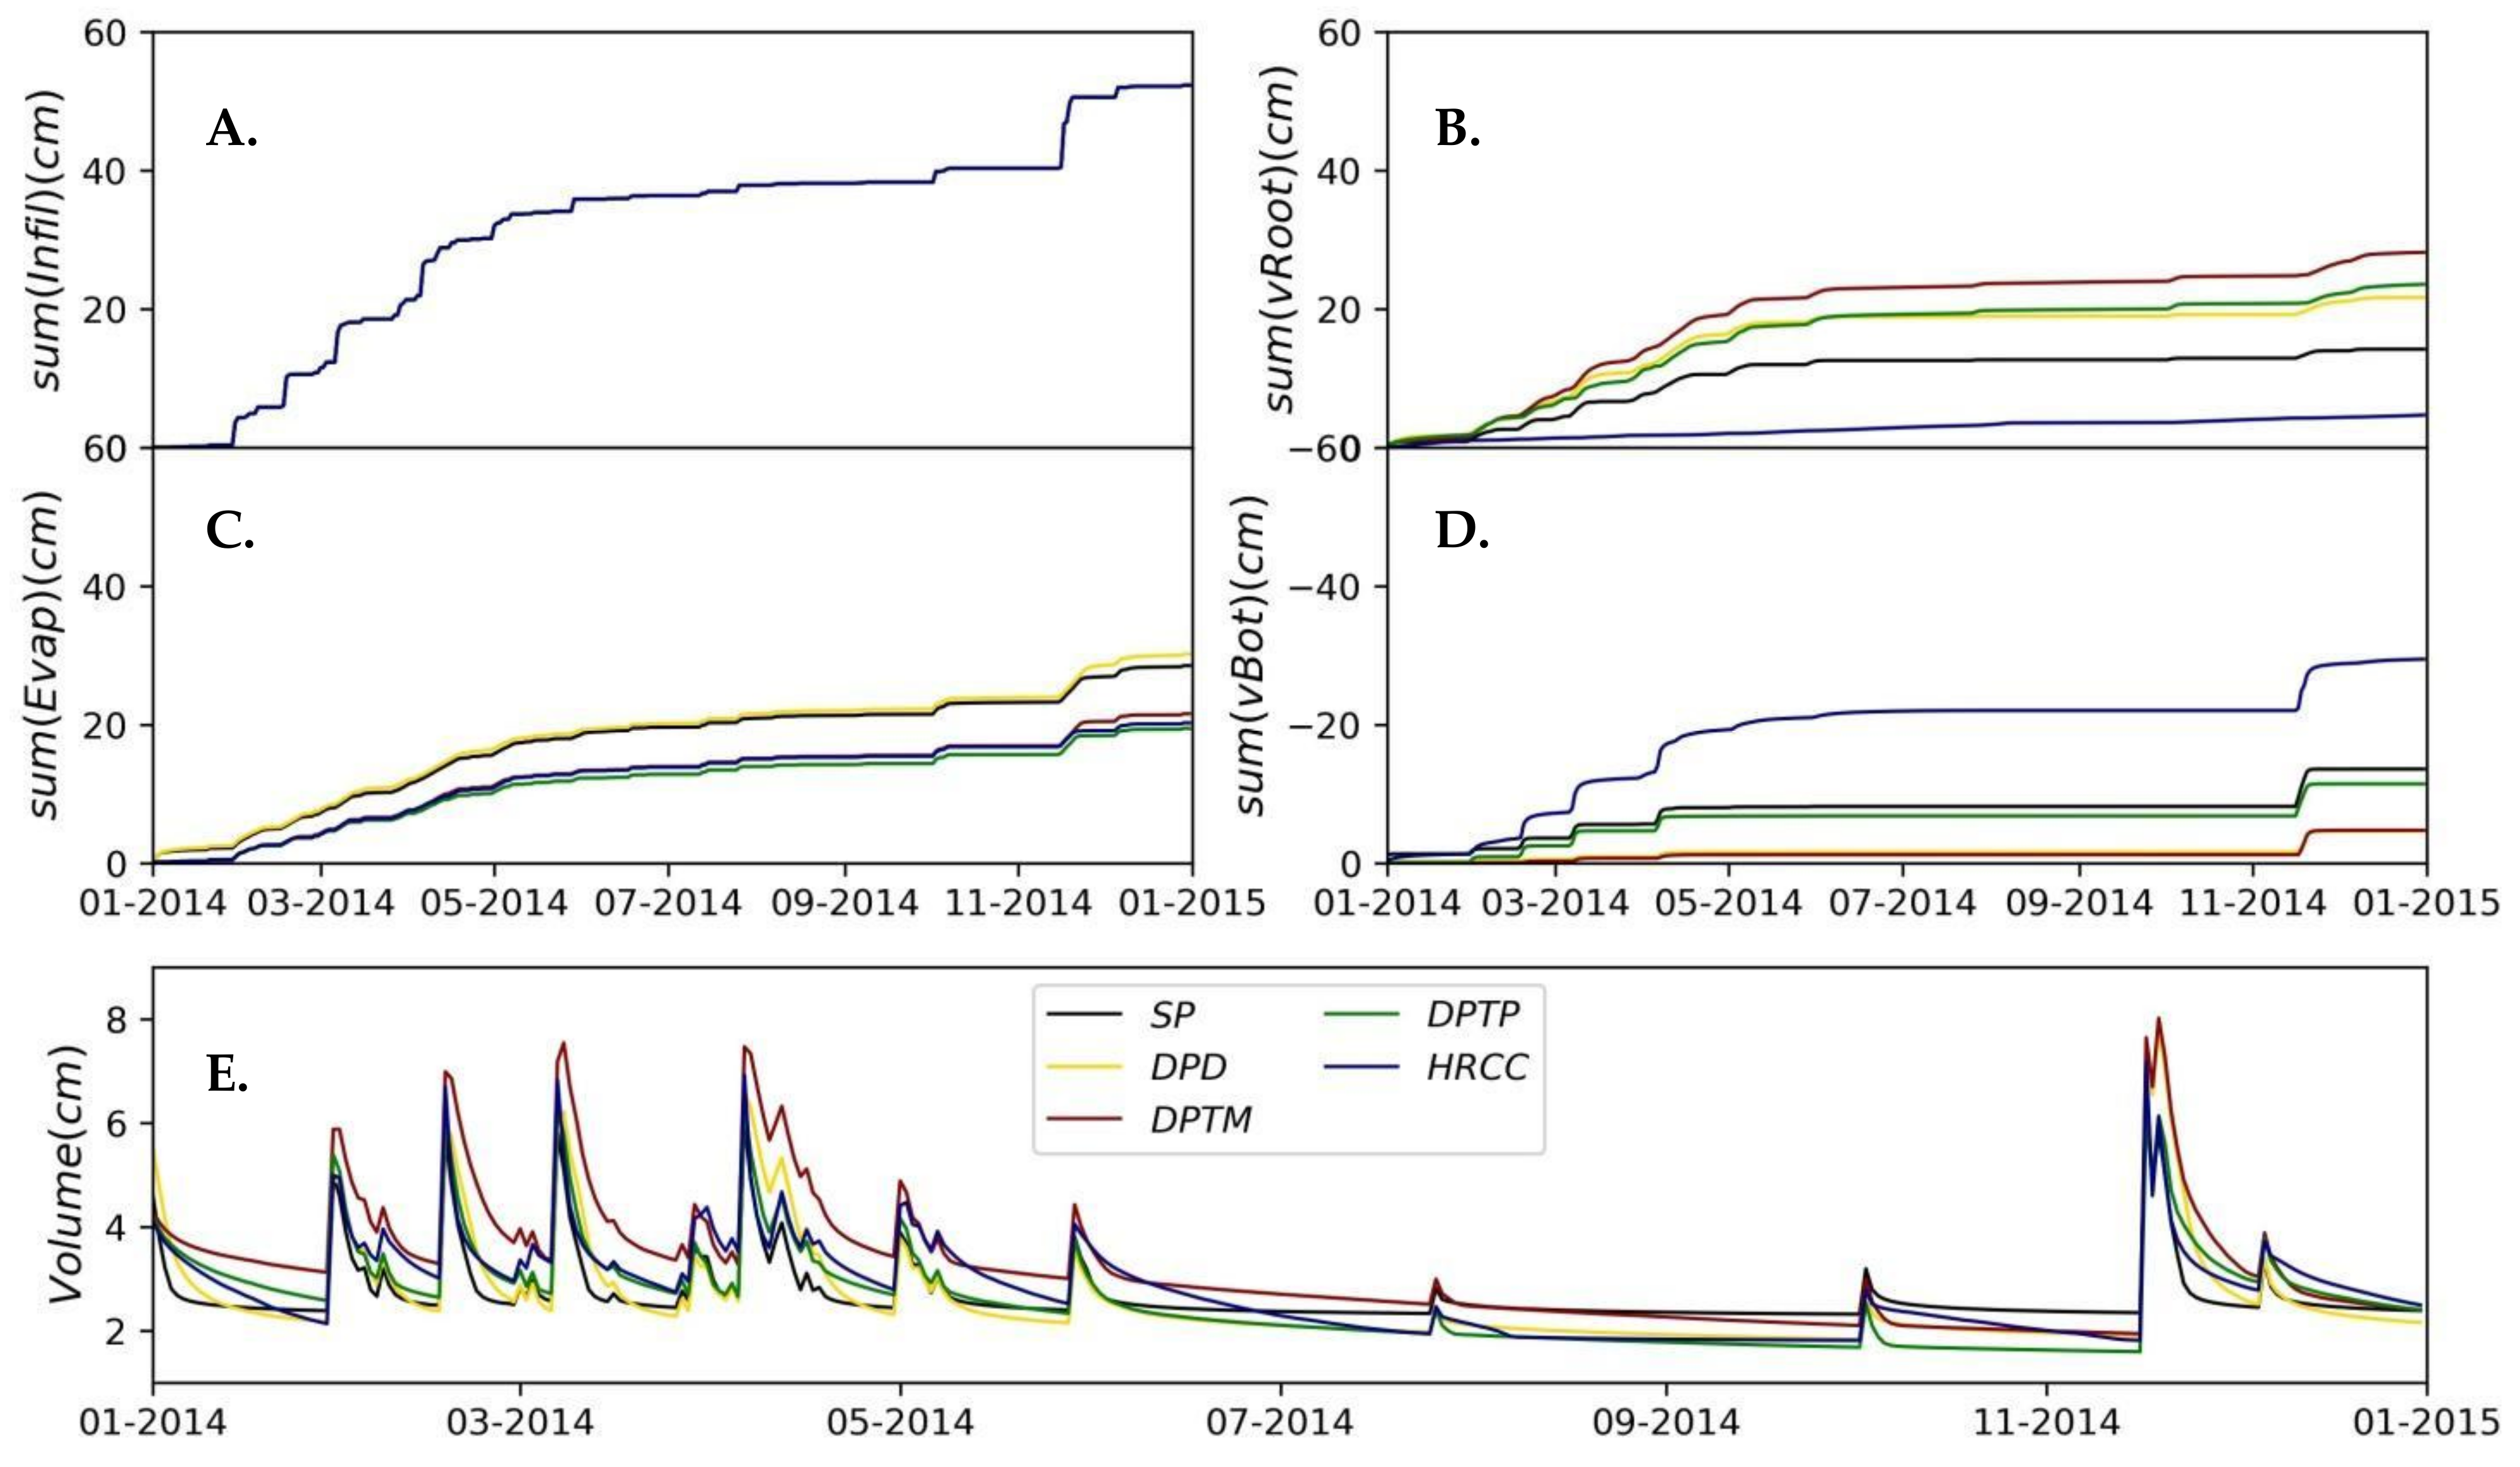
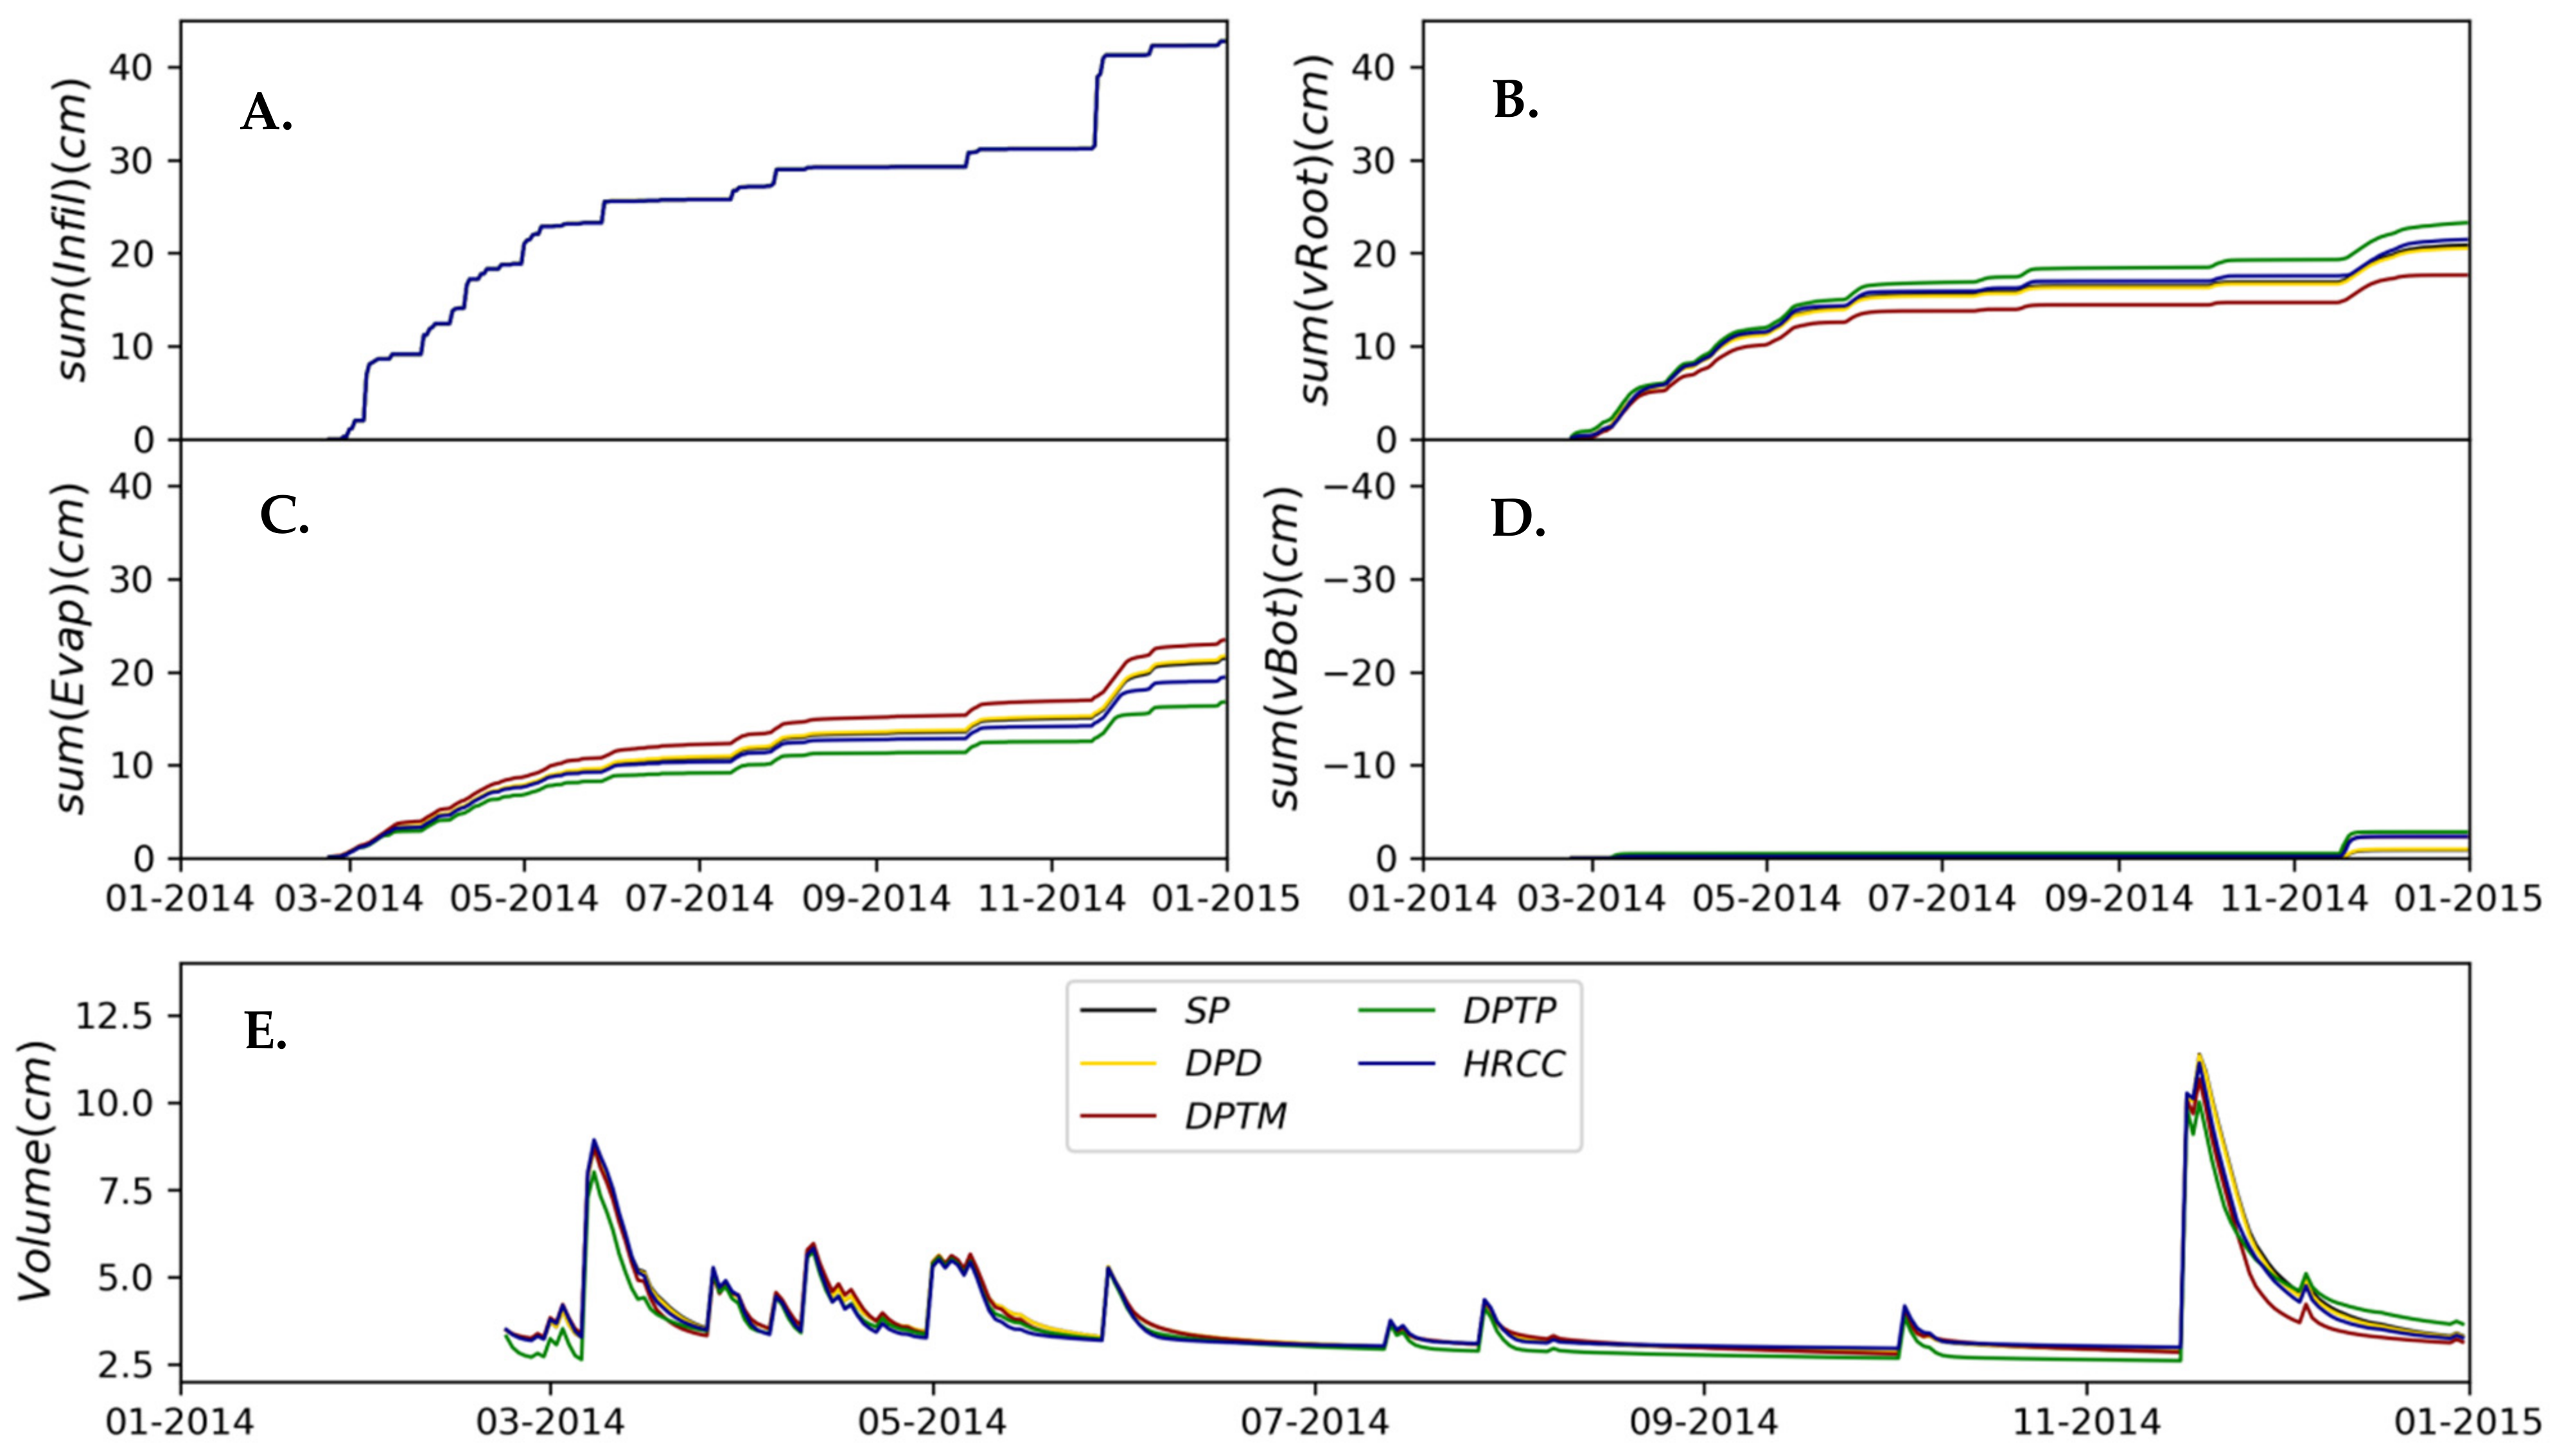
Figure 7 shows the model adjustments for the Pasture area. They demonstrated sensitivity to rain events, but, overall, the DPTM model had the highest simulated soil moisture values. In the calibration, the models overestimated most rain events. Nevertheless, the values of the SP model were the closest to the measured data.
In the validation step, the models also overestimated the soil moisture peaks. In the first peak, at a depth of 10 cm, only the HRCC model was able to simulate the moisture recession. This may prove that hysteresis must be accounted for. However, for the second and third peak, the DPTM model exhibited a better representation of moisture dynamics. At a depth of 20 cm, the SP model was the one that best represented soil moisture in the first rain event, while the HRCC model better represented the second and third rain events. Moreover, the DPD, DPTM, and DPTP models underestimated the dry season data at depths of 20 and 30 cm. However, at a depth of 40 cm, the DPTM model better represented the second rain event.
Table 5 shows the statistics of the data monitored by the BR-CST tower after being adjusted by the models. In the calibration step, the NSE coefficient indicated that only the DPTP model at a 30 cm depth was worse than using the average value of the data (NSE < 0). However, in the validation, at a depth of 20 cm, the NSE coefficient indicated that the SP and DPD models did not simulate the monitored data properly, and, at a depth of 40 cm, only the DPTM model achieved a satisfactory performance. The RMSE indicated errors ranging between 0.01 and 0.02 for the calibration and validation. The determination coefficient ranged from 0.61 to 0.88 in the calibration and from 0.86 to 0.97 in the validation. The r coefficient indicated very high (0.7–0.9) and almost perfect (>0.9) correlations for the models. Lastly, the performance index (c) indicated very good (0.76–0.85) rates for calibration and optimal (>0.85) values for validation.
On the one hand, at a depth of 10 cm, the DPTM model presented the best fit for both calibration and validation. The only exception was the KGE in the validation, for which the DPTP model performance was better. On the other hand, at a depth of 20 and 30 cm, the SP and the DPD model showed better calibration performance. The NSE coefficient indicated the DPTP as the most representative model of the system in the validation step. However, at 40 cm depth, calibration suggests that the best model is the HRCC. However, in the validation, the best model was the DPTM.
Based on the statistics average associated with each depth, the best model, according to the NSE and KGE coefficients, was the DPTM. However, based on R2, r, and c, the best-adjusted model was the SP, indicating that this model can be used in Caatinga areas. Even though it is simpler than the other models, it fits as well as them or even better.
Table 6 shows the statistics of the data adjusted to the models analyzed in the BR-GST tower. In the calibration, at a depth of 10 cm, the NSE coefficient indicated that only the SP and DPTP models represent the measured data properly. Conversely, R
2 indicated that these models had the worst performance. In the validation, only DPTP (at 20 cm depth) and DPTM (at 40 cm depth) models were not satisfactory according to the NSE coefficients.
The R
2 for these models ranged from 0.61 to 0.90. Besides that, RMSE ranged from 0.01 to 0.03 in the calibration and from 0.01 to 0.02 in the validation. Overall, the correlations (r) were moderate (0.4–0.69) and strong (0.7–0.89) in both the calibration and the validation. Moreover, the performance index (c) was estimated for the models as sound (0.66–0.75) and ideal (0.76–0.85). An exception was the SP model, which presented poorly (0.51–0.60) and sound (0.66–0.75) adjustments [
52].
The statistical indices indicate that, at a 10 cm depth, the DPD and HRCC models had the best performance for calibration and validation, respectively, while at depths of 20 and 40 cm, the ideal model was the DPTP. For the 30 cm depth, calibration and validation were better analyzed by the DPTP and DPTM models, respectively.
Based on the average of the KGE, R2, r, and c coefficients for each depth, the best adjustments correspond to the DPTP model. However, considering the NSE and RMSE statistics, the best fit was the SP model. This fact shows that, contrary to the Caatinga, the use of the SP model in Pasture areas is not indicated because it could lead to inconsistent estimations of soil moisture. This occurs due to a better structured and less dense soil in the Caatinga area, favoring the water redistribution process in the soil matrix. In contrast, in the Pasture area, the soil is poorly structured and undergoes greater compaction and more intense weathering processes. This leads to the formation of cracks that create a preferential path for water in the soil. The consequence is a change in the paradigm of soil moisture dynamics, making the SP model inappropriate and promoting the use of dual porosity approaches.
Table 7 shows the Hydraulic parameters of the models adjusted by the inverse method in Hydrus-1D.
The saturated hydraulic conductivity (
Ks) ranged from 107.1 to 445.9 cm·d
−1 for the Caatinga and 23 to 206 cm·d
−1 for the Pasture, depending on the chosen model. Previous study in the Brazilian semi-arid has implemented Hydrus-1D inverse method for two experimental areas [
8]. The authors obtained
Ks values of 234.2 and 243.7 cm·d
−1, which are within the range observed in the field for the BR-CST tower. A research in the semi-arid region of Tunisia, also using the inverse method, obtained
Ks values between 28 and 200 cm·d
−1 for different soil depths. The authors also observed an inverse correlation between soil compactions and
Ks [
57].
In the BR-CST tower, the HRCC model had the highest and lowest
Ks values in its drying and wetting curves, respectively, where
Ksd.
Ksw−1 was 4.16. In the BR-GST tower, the HRCC
d model had the highest Ks value, while the DPTM model had the lowest
Ks value. The ratio between
Ksd and
Ksw was lower in the Pasture (about 1.36) than in the Caatinga (4.16), indicating higher hysteresis in the Caatinga hydraulic conductivity curve. In general, the BR-CST tower had the highest values of
Ks, except for the HRCC model (in the wetting curve). This fact occurs due to the compaction and the land-use change suffered by the soil of the Pasture area. Furthermore, [
5] also detected a lower
Ks in the non-vegetated Caatinga area (180 cm·d
−1) than in the vegetated Caatinga area (200 cm·d
−1).
In an analysis of the hydrodynamic properties of Caatinga and Pasture soil through the Beerkan methodology, the Caatinga
Ks was almost twice that of the Pasture [
4]. The authors claimed that intense animal trampling caused compaction and reduced soil macroporosity, which increased soil density and reduced water infiltration. A comparative analysis of areas of preserved Caatinga, Caatinga under regeneration, cultivated land, and degraded Pasture was carried out in the municipality of Serra Talhada, state of Pernambuco [
58]. They observed that preserved Caatinga had the highest water infiltration rate in the soil and the lowest water and soil loss. Meanwhile, [
59] compared the change in physical water indicators over an area of 40 × 40 m after 21 days of intensive grazing. Through this study, they confirmed that soil compaction due to intense cattle trampling causes a significant reduction of
Ks by almost 50%.
The
θsm was higher in the Caatinga area. This happens due to the extensive use of Pasture soil and the cumulative effect of cattle trampling. These factors influence the increase in density and resistance to penetration, leading to a decrease in soil porosity in the first centimeters of the soil [
60]. In contrast,
θsim (DPTM and DPTP models) was higher in the area of the BR-GST tower. The
θsim corresponded to 31% (DPTM) and 44% (DPTP) of total saturated humidity in BR-CST. In BR-GST,
θsim was equal to 57% (DPTM) and 68% (DPTP) of
θs. This fact is associated with a higher fines percentage present in the BR-GST, which is about 1.5 times higher than in the BR-CST. The higher percentage of
θsim than
θsm is associated with a higher water retention capacity of the porous soil matrix. Furthermore, the introduction of the dual-porosity model improves the accuracy in describing the hydraulic behavior of the porous medium [
29].
This performance is also evident in the
w2 parameter (DPD model), which is six times higher in BR-GST than in BR-CST, therefore indicating that the Pasture area holds two porous regions of more significant evidence. The
θs (
θsim +
θsm for dual-porosity models) ranged from 0.3 (HRCC
w) to 0.458 cm
3·cm
−3 (DPTM) in the BR-CST and between 0.2 (SP, DPD, and HRCC
w) and 0.35 cm
3·cm
−3 (DPTM) in the BR-GST. A study in the semi-arid region of China used the DPTP model at depths between 0 and 50 cm for sandy loam soil, determining
θs values within the range observed in the Caatinga (
θs = 0.438 cm
3·cm
−3), with
θsm = 0.43 cm
3·cm
−3 and
θsim = 0.008 cm
3·cm
−3 [
61]. Using the SP model for sandy loam soils, another study obtained
θs values between 0.342 and 0.369 cm
3·cm
−3 [
8].
The n parameter ranged from 1.374 (HRCC
d) to 1.715 (DPD
2) in the BR-CST and from 1.321 (DPD
2) to 2.35 (HRCC
d) in the BR-GST. This parameter is associated with soil texture, being smaller for soils with finer textures. However, for the most part, the lowest values for this parameter were obtained in the BR-CST tower (except for the DPD model n
2), which has the lowest percentage of fines. Using the HYPROP evaporation method in conjunction with Hydrus-1D to determine hydraulic parameters, [
62] applied the SP and DPD models in soils with different texture and pore sizes. The authors obtained values for the n parameter of 1.32, 1.83, 2.59, and 10 for soils with fine, medium, coarse, and very coarse textures, respectively, when using the SP model. For the DPTP model, the
nim was 1.44 and 1.67 for BR-CST and BR-GST, respectively [
62]. In another study
nim was 1.402 (0–50 cm) and 1.278 (50–100 cm) [
61]. These values differ from those obtained by [
28], who determined
nim equal to 6, using the DPTP model with the Hydrus-2D inverse method.
The
α parameter ranged from 0.004 (DPTMim) to 0.066 cm
−1 (DPD2) in the BR-CST and from 0.001 (SP) to 0.08 cm
−1 (HRCC
W) in the BR-GST. Within this range are the values obtained by [
5], who determined
α equal to 0.028 cm
−1. Using the DPTM model [
63] defined
α equal to 0.023 cm
−1. However, using the DPD model, [
63] measured
α values equal to 0.2 and 0.002 cm
−1, while [
60] found α values of 0.013 cm
−1 and
αim of 1.007 cm
−1 using the DPTP model. In the HRCC model, the
αw/
αd ratio was 2.14 and 1.33 for the BR-CST and BR-GST towers, respectively. The obtained values are within the range determined by [
64], who verified an average value for
αw/
αd of 2.24 ± 1.25. The authors further stated that the higher the
αw/
αd value, the higher the level of soil cohesion, indicating greater particle cohesion in the soil of the BR-CST tower than in the BR-GST, even with a lower percentage of fines. This fact may occur due to the higher level of organic matter in Caatinga vegetated soil. A study evaluated the impact of different sizes of soil aggregates on the hysteresis of their water retention characteristics [
65]. According to the author, the size of the aggregates has a significant impact on the hysteresis effect of water retention in soils, and the negligence of the hysteresis effect may cause inaccuracy in soil water content estimation [
64].
In the DPTM model, BR-CST and BR-GST tower areas had
ω values of 10
−10 and 1.64
10
−3 min
−1, respectively. Applying the inverse method, [
63] determined Ω equal to 2.4
10
−3 and 1.2
10
−3 min
−1, which is in accordance with that obtained for the BR-GST. In the same magnitude, [
29] determined ω values of 1.7
10
−4 and 1.3
10
−3 min
−1. For the DPTP model, BR-CST and BR-GST tower areas had
αω values of 2.89
10
−3 and 2.60
10
−3 (cm·min)
−1, respectively. These values have the same magnitude as those determined by [
60] at a depth of up to 50 cm, with
αω equal to 10
−3 (cm·min)
−1 for sandy loam textured soil. The
αω values adjusted by [
28] using the inverse method range from 0.42
10
−3 to 1.2
10
−3, also corroborating with those determined in this work.
The BR-CST tower also exhibited lower values of the pore connectivity parameter (l). Besides that, for this area of Caatinga, the l parameter was negative for the SP, DPD, and HRCC models. Negative l parameters may occur because these models do not consider dual porosity with pressure or moisture exchange between the mobile and immobile regions of the soil. Moreover, according to [
65,
66], negative values can be understood as correction factors that cause a more gradual drop in the unsaturated hydraulic conductivity. Materials with fine pore distribution have commonly negative values of the l parameter, or l can even be interpreted as an empirical parameter that serves to restrict relative hydraulic conductivity [
67].


 ,
, 


