Article

Quantitative Evaluation of the Trade-Off Growth Strategies of Maize Leaves under Different Drought Severities

1
Tianjin Meteorological Bureau, Tianjin 300074, China
2
Chinese Academy of Meteorological Sciences, Beijing 100081, China
3
National Climate Center, Beijing 100081, China
*
Author to whom correspondence should be addressed.
Water 2021, 13(13), 1852; https://doi.org/10.3390/w13131852
Submission received: 1 June 2021 / Revised: 27 June 2021 / Accepted: 29 June 2021 / Published: 2 July 2021
(This article belongs to the Special Issue Soil Moisture Content and Crop Production Research)

Abstract

:
The leaf is one of the most drought-sensitive plant organs. Investigating how leaf traits change and their trade-off growth during a drought would contribute to developing targeted drought-resistance measures. We investigated changes in five key maize leaf traits (leaf area, dry mass, effective number, water content, and specific weight) and their trade-off growth based on a drought simulation experiment. We also developed an indicator (0, 1) to quantitatively evaluate drought severity. The results showed a trade-off growth between different leaf traits of maize plants under drought conditions. Maize maintained relatively high leaf water content to maintain high leaf metabolic activity until drought severity was greater than 0. When drought severity was (0, 0.48), maize tended to adopt rapid growth strategy by maintaining regular leafing intensity and investing more energy into leaf area rather than specific leaf weight so that more energy could be absorbed. When the drought severity exceeded 0.48, maize conserved its resources for survival by maintaining relatively lower metabolic activity and thicker leaves to minimize water loss. The results provide an insight into the acclimation strategies of maize under drought, and contribute to targeted drought prevention and relief measures to reduce drought-induced risks to food security.

1. Introduction

Drought is one of the greatest threats to the growth and development of plants worldwide [1,2,3,4]. Drought frequency and associated impacts have increased due to climate change since the 1970s [5,6]. It was predicted that by the end of the 21st century, the drought-affected area of the world would increase by 15–44%, and the area with crops affected by drought would increase from 11.6 to 25 million ha, which could lead to global grain price fluctuations and threatened global food security [6,7,8]. Maize is one of the world’s leading crops, and it is also very susceptible to drought [9]. Maize yield reduction caused by drought is the leading factor for grain yield fluctuation [10]. It is critical to understand the effect of drought on maize growth, development, and yield as well as maize adaptation strategies under drought conditions, which would allow targeted drought prevention and relief measures to ensure food security in the context of climate change. Extensive studies have been carried out on the effects of drought on maize, but few have focused on maize adaptability to drought. The leaf is one of the most drought-sensitive plant organs [11]. It is not only important for resource production, but also the site for energy exchange between plants and the external environment. Changes in its traits and trade-off growth relationships can reveal plant survival, growth and adaptation strategies to drought [12,13,14,15]. Plant investment in leaves includes leaf area expansion and dry matter accumulation per leaf area (i.e., specific leaf weight). A larger leaf area promotes light absorption, the accumulation of resources, and the rapid growth of plants, but it also enhances transpiration and water loss, thereby potentially increasing water stress [16]. Specific leaf weight reflects the resource storage of plants. Higher specific leaf weight can enhance the survival ability of plants [13,17]. The trade-off between leaf area and specific leaf weight is indicated by a change in the resource investment strategy between rapid growth and stress tolerance. The total leaf area is determined by the number of leaves and individual leaf area. Larger individual leaf area is conducive to resource acquisition and increased growth rate, but it also increases transpiration and water loss. Therefore, there is a trade-off between the individual leaf area and the number of leaves. Leaf biomass consists of leaf water content and dry mass. Water content reflects leaf metabolic activity [14], while dry matter storage provides resources for survival and reproduction. The trade-off between leaf dry mass and water content can reflect the investment strategy between rapid growth and survival. There have been extensive studies on the impact of drought on plant leaf traits [18,19,20]. However, few studies have investigated plant trade-off growth during drought conditions, limiting the understanding of plant adaptation strategies in arid environments. Identifying maize leaf traits and trade-off growth during drought would contribute to the understanding of maize drought adaptation strategies and provide a basis for targeted drought control measures. Therefore, this study investigated the changes in maize leaf area, dry mass, specific leaf weight, water content, and effective leaf number during drought conditions, and the trade-off growth between leaf area and effective leaf number, leaf area and specific leaf weight, and leaf dry mass and water content.

2. Materials and Methods

2.1. Site Descriptions

The research was conducted at Gucheng Agrometeorological Experimental Station of China Meteorological Administration, which located in Dingxing County, Baoding City, Hebei Province, P. R. China (39°08′ N, 115°40′ E). The station was equipped with an automated rain shelter, which covered 750 m2 and was divided into 42 trial plots, each 2 m wide × 4 m long and isolated by 3 m-deep concrete walls to prevent soil water exchange horizontally. The site has a typical cinnamon soil, containing 13.67 g·kg−1 organic C, 0.87g·kg−1 total N, 25.76 mg kg−1·P, and 118.55 mg kg−1·K. The bulk soil density was 1.37 g·cm−3 and the pH was 8.1. The average field capacity and wilting point were 0.32 and 0.10 cm3·cm−3, respectively. The station has an annual average temperature of 12.1 °C and 494 mm of annual precipitation. Approximately 70% of precipitation occurs in summer. However, the inter-annual variation coefficient can be as high as 62.9% and, therefore, maize in the vegetative stage is at greater risk of drought.

2.2. Experimental Design

The maize field experiment was conducted in 2014. Zhengdan 958, the most popular maize genotype in China was used. The maize was sown on 24 June 2014 with 50 cm line spacing and 25 cm row spacing, resulting in plant density of 8.0 plants m−2. Diammonium phosphate fertilizer was applied at 300 kg ha−1 before sowing, which is equivalent to the fertilization level of local fields. All other agronomic conditions were identical to those in local fields. A completely randomized block design with three replicate plots was used. Irrigation was performed every 2 days, ensuring that the relative soil moisture of each trial plot at a 0–50 cm depth was above 65% to maintain normal growth of maize plants before the third leaf expansion (2 July 2014). Then, six different irrigation treatments were performed on 2 July 2014. The irrigation amounts (treatments 1–6) were 150, 120, 90, 60, 30, and 10 mm, respectively, corresponding to 100%, 80%, 60%, 40%, 20%, and 7% of the average local average precipitation in July (150 mm). No additional irrigation was performed thereafter. Precipitation was completely blocked by the automated rain shelter during the entire growth period.

2.3. Measurements

Maize leaf traits and soil water content were observed every 7 days after the irrigation treatment, and four times observation were performed during the maize three-leaf stage to jointing stage (10 July to 9 August). The observation date was 10 July, 18 July, 31 July and 7 August, respectively.

2.3.1. Leaf Traits

Two maize plants were randomly selected from each trial plot to measure the effective leaf number, area, fresh mass, dry mass, and water content.
  • Effective leaf number: The total number of leaves in the plant that were visible and not completely dried and shed (hereinafter referred to as the leaf number).
  • Leaf area (LA): The length (Li) and width (the widest part of the leaf, Di) of every fully expanded leaf of the sample plants were measured. LA (m2) of an individual maize plant was calculated with Equation (1):
LA = i = 1 n L i × D i × k
where k (=0.75) is the shape factor [21], and n is the number of leaves.
  • Leaf biomass and leaf water content: The leaf fresh biomass was weighed. Then, leaves were placed in paper bags and dried in an oven at 80 °C for more than 24 h until their weights were constant. Then, leaf dry biomass was weighed. Leaf water content and specific leaf weight were calculated with the following formulas [22]:
LWC = LFB LDB
SLW = LDB / LA
where LWC, LFB, LDB, SLW, and LA were leaf water content (g), leaf fresh biomass (g), leaf dry biomass (g), specific leaf weight (g·m−2), and leaf area (cm2), respectively.

2.3.2. Soil Water Content

Soil water content was measured using the oven-drying method. One sampling point was randomly selected between two rows of maize in a trial plot, and three samples were collected for each treatment. Soil samples of every 10 cm were collected from each sampling point up to 90 cm. The samples were weighed both before and after they were dried in an oven at 105 °C. The relative soil moisture (RSM) at 0–30 cm depth was used to describe soil water status (Equation (4)) because it was most closely associated with maize growth characteristics between all measured depths.
RSM = i = 1 3 F S i D S i / i = 1 3 D S i F C / ρ × 100 %
where FS and DS were fresh and dry weights (g) of soil samples from different layers; i was the soil layer number (i = 1, 2, 3 refers to soil layer 0–10, 11–20, and 21–30 cm, respectively); FC was the field capacity (=0.32 cm3·cm−3); ρ is the bulk soil density (=1.37 g·cm−3).

2.4. Quantified Expressions of Drought Intensity and Drought Severity

The drought severity (D) refers to the accumulated water deficit over a period of time and is the function of drought intensity (I) and duration [23]. It can be expressed as:
D = 1 e 5.3 · 1 T I t · E T 0 t 1 T E T 0 t
where ET0 (mm·d−1) is the potential daily evapotranspiration, which is calculated using the Penman–Monteith method [24]; T is the number of days of the evaluation period (from 2 July to 7 August, 36 days in total); It is the drought intensity on day T of the evaluation period and ∑ is the sum of day 1 to day T.
Drought intensity (I) refers to the degree of water deficit of crops on a given day. Referring to the water deficit coefficient Ks as recommended by Food and Agriculture Organization (FAO) [24], the expression of drought intensity is:
I = 1 K s
K s = 1   D r R A W TAW D r TAW RAW   R A W < D r < T A W   0   D r T A W  
TAW = θ FC θ WP  
D r = θ FC θ i
RAW = p · TAW
p = p 0 + 0.04 × 5 ET c
where TAW is the maximum available water content (cm3·cm−3) of the reference soil layer depth (0–30 cm), representing all available soil water content. FC is the field water capacity (cm3·cm−3); WP is the wilting point (cm3·cm−3); θi is the actual water content of the reference soil layer (cm3·cm−3); Dr is the soil water deficit (cm3·cm−3); RAW is the soil available water content (cm3·cm−3) of the reference soil layer, or the difference between the field water capacity and the water content of the capillary fracture, representing the lower limit of soil water content that can be quickly absorbed by crops. P0 is 0.55, and ETc is calculated using the Penman–Monteith method [24]. The daily meteorological data required by calculation of ETc such as average temperature, maximum and minimum temperature, average humidity, wind speed, and sunshine duration was obtain from the automatic meteorological station of Gucheng Agrometeorological Experimental Station.
Equation (7) shows that if the available soil water content (RAW) is greater than the soil water deficit (Dr), then Ks = 1 and I = 0, indicating that the crop is not affected by drought. When soil moisture is equal to or less than the wilting coefficient, all available soil water is depleted, and Ks = 0 and I = 1.

2.5. Interpolation of Soil Water Content

The rate of soil water content gradually decreased as drought progressed, and a power function was used to fit the soil water content dynamics of each plot:
S W m x = a · x b
where x was the number of days after irrigation; SWm was the relative soil moisture (%) of the 0–30 cm soil layer on the x day after irrigation, and a, and b were the regression parameters of the model.

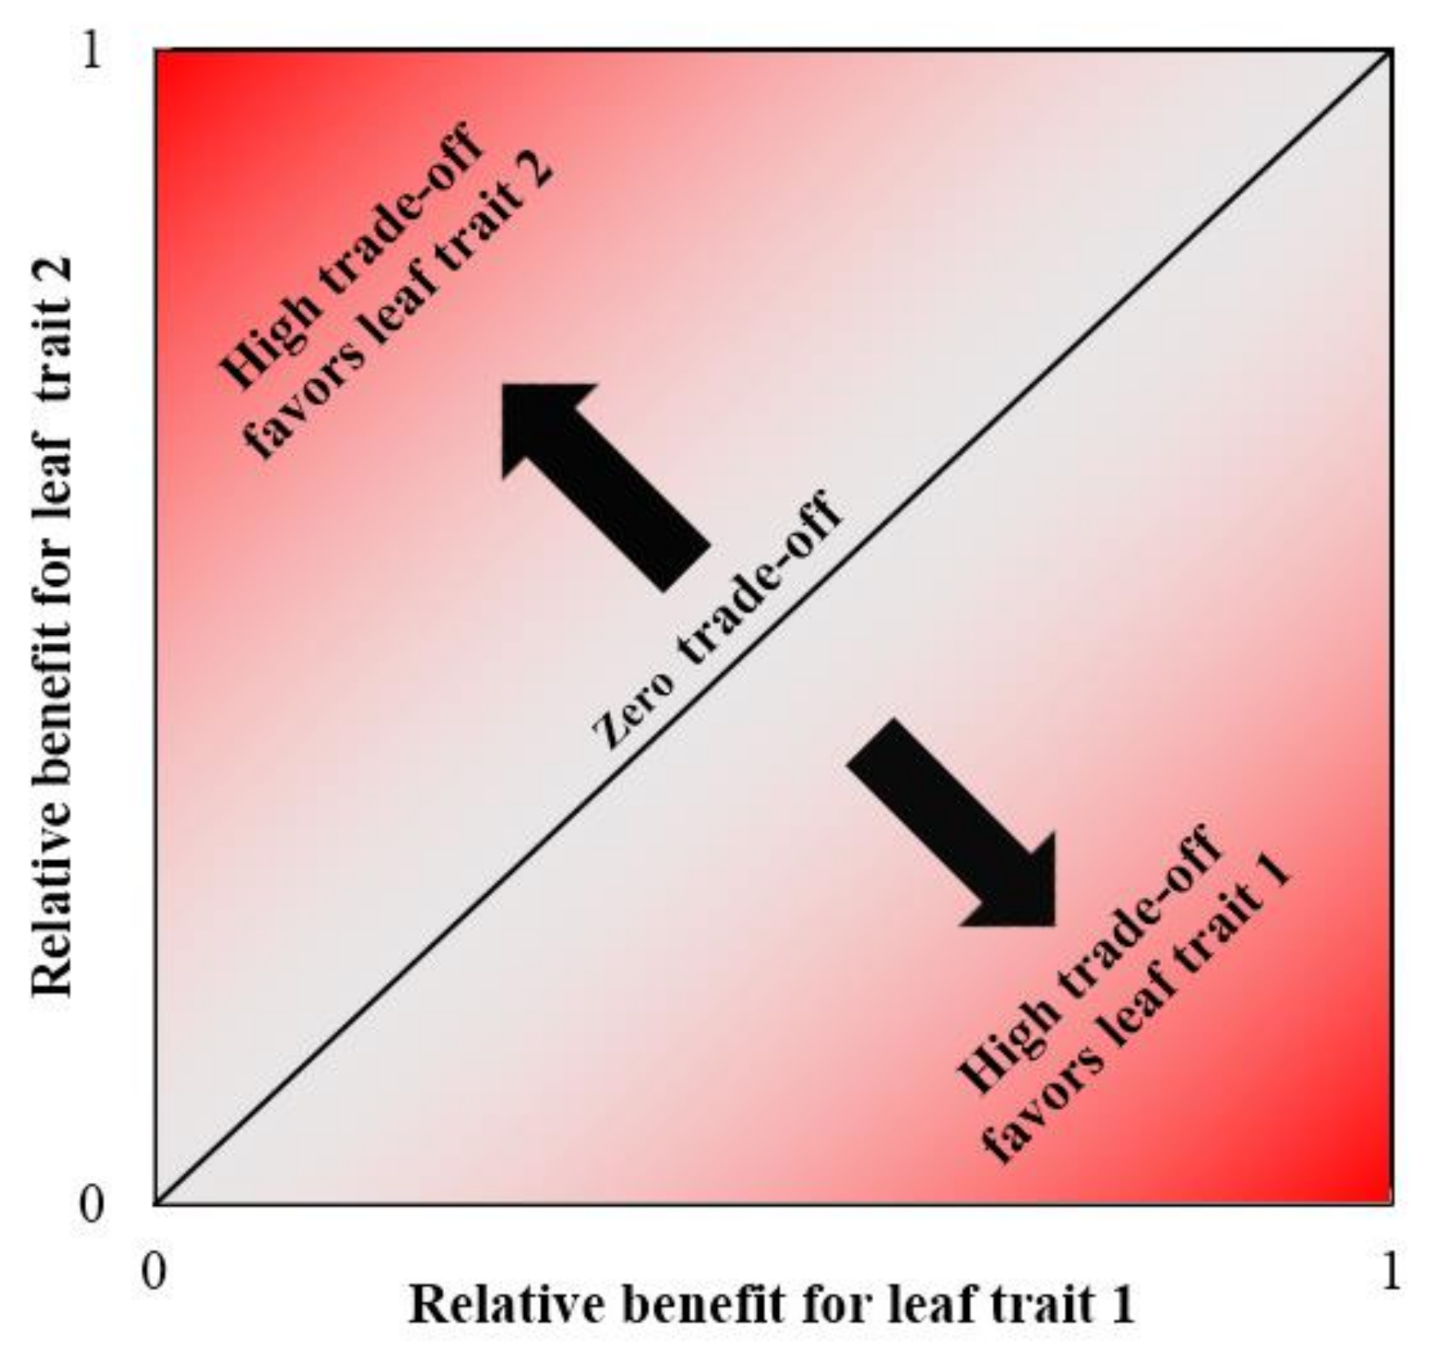
2.6. Calculation of Trade-Off Values

The trade-off between two leaf traits could be indicated by differences in their benefits. The benefit (BA) of leaf trait A can be conceptualized as the proportion of the maximum yield that leaf trait A can achieve in response to a specific drought severity, which varies from 0 to 1, and could be calculated as follows [25]:
B A , i = A o b s , i A m i n , i A m a x , i A m i n , i
where i was the ith observation performed in this experiment; Aobs,i was the observed values of trait A from certain irrigation treatment; Amax,i was the maximum value when the drought severity was 0; Amin,i was the minimum value of the treatment 6. Since all treatments were affected by drought after 18 July, a quadratic polynomial fitting was first performed for each leaf trait and its corresponding degree of drought severity to obtain the maximum value of trait A. The corresponding trait value of the curve was considered to be the maximum trait value when the degree of drought severity was 0.
The trade-off between two traits can be expressed as the root mean square error (RMSE) of the benefits of the two traits. RMSE is the distance from the standard value coordinate of the two traits to the diagonal (1:1) on the two-dimensional coordinate axis, where the benefits of leaf traits 1 and 2 are equal (Figure 1). The relative position of the benefit value relative to the diagonal indicates the tendency of the trade-off, the greater the distance to the diagonal, the greater the trade-off [25].

3. Results

3.1. Influence of Drought Severity on Maize Leaf Traits

The sizes and dynamics of maize leaf traits exposed to different irrigation treatments during the growth period varied depending on drought severity. On 10 July, the drought severity of treatments 1 to 5 ranged from 0 to 0.23, and there were no significant between-treatment differences in any leaf traits. However, the drought severity of treatment 6 reached 0.87, and its leaf traits were significantly lower than those exposed to treatments 1 to 5. On 18 July, there were significant differences in leaf traits between treatments 1–3, 4–5, and 6, with corresponding drought severities of 0–0.10, 0.48–0.72, and 0.95. On 31 July, there were significant differences in leaf traits in treatments 1–3 and 4–6, with corresponding drought severities of 0.26–0.54 and 0.74–0.98. On 7 August, there were significant differences in leaf traits in treatments 1–2, 3, and 4–6, and the drought severities were 0.44–0.64, 0.69, and 0.81–0.98, respectively (Table 1). During the observation period, the drought severity of treatments 1–3 ranged from 0 to 0.69, and their leaf traits showed an increasing trend. The drought severity of treatments 4 and 5 ranged from 0 to 0.90, and leaf area, number, and water content initially increased; however, leaf area, leaf water content and effective leaf number in treatments 4–5 began to decrease after 31 July, and leaf dry mass in treatment 5 also decreased after 31 July, when the drought severity was greater than 0.74. This was due to reduced expansion rate and accelerated aging of old leaves. As a result, the growth of new leaves could not compensate for the senescence of old leaves, leading to decline in leaf traits. Drought severity in treatment 6 reached 0.95 on 18 July, and its leaf growth was almost stagnated. The drought conditions significantly inhibited maize growth, and no new leaves were produced, while the old leaves were shed very slowly to ensure the survival of the plant (Table 2). In summary, when drought severity was lower than 0.23, its effect on leaf traits was negligible; however, when drought severity was between 0.23 and 0.74, maize leaf traits were significantly affected, but the growth trend did not change. When drought severity was between 0.74 and 0.90, the growth rate of maize leaves significantly decreased, and the aging of old leaves accelerated. Under such conditions, the formation of new leaves could not compensate for the shedding of old leaves, and the effective leaf number, dry mass, area, and water content decreased. When drought severity was greater than 0.90, leaf growth almost completely inhibited (Table 1).

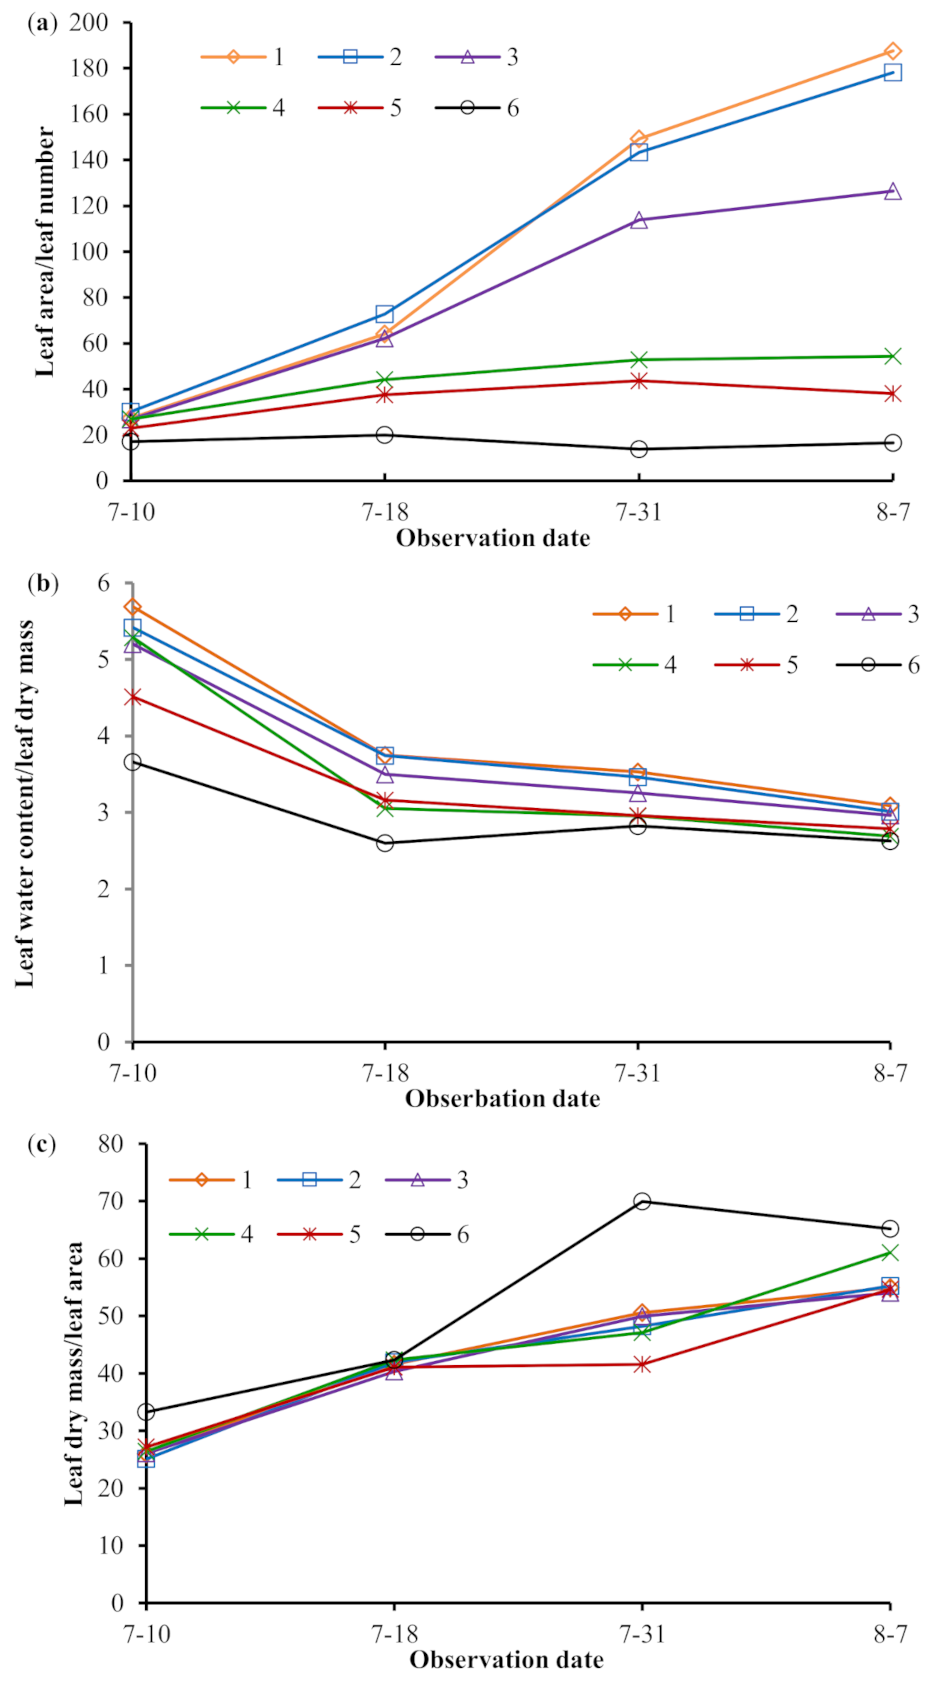
3.2. Dynamics of Paired Maize Leaf Traits

The ratio of leaf area/leaf number of maize plants in each treatment increased with time (in the horizontal direction), indicating that the size of single blade gradually increased. At each observation time, the leaf area/leaf number ratio decreased corresponding to the initial irrigation gradients (in the vertical direction), indicating that the drought effect on leaf area was greater than that on leaf number (Figure 2a). The ratio of leaf water content/dry mass for each treatment decreased over time, suggesting that the relative leaf moisture decreased. At every time point, leaf water content/dry mass decreased along with the initial irrigation gradients, showing that drought had a greater impact on leaf water content than on dry mass, thereby reducing relative leaf moisture (Figure 2b). The leaf dry mass/leaf area ratio for each treatment increased over time, indicating that the specific leaf weight gradually increased. A decrease in the leaf dry mass/leaf area ratio was associated with the initial irrigation gradients only on 10 July (Figure 2c).

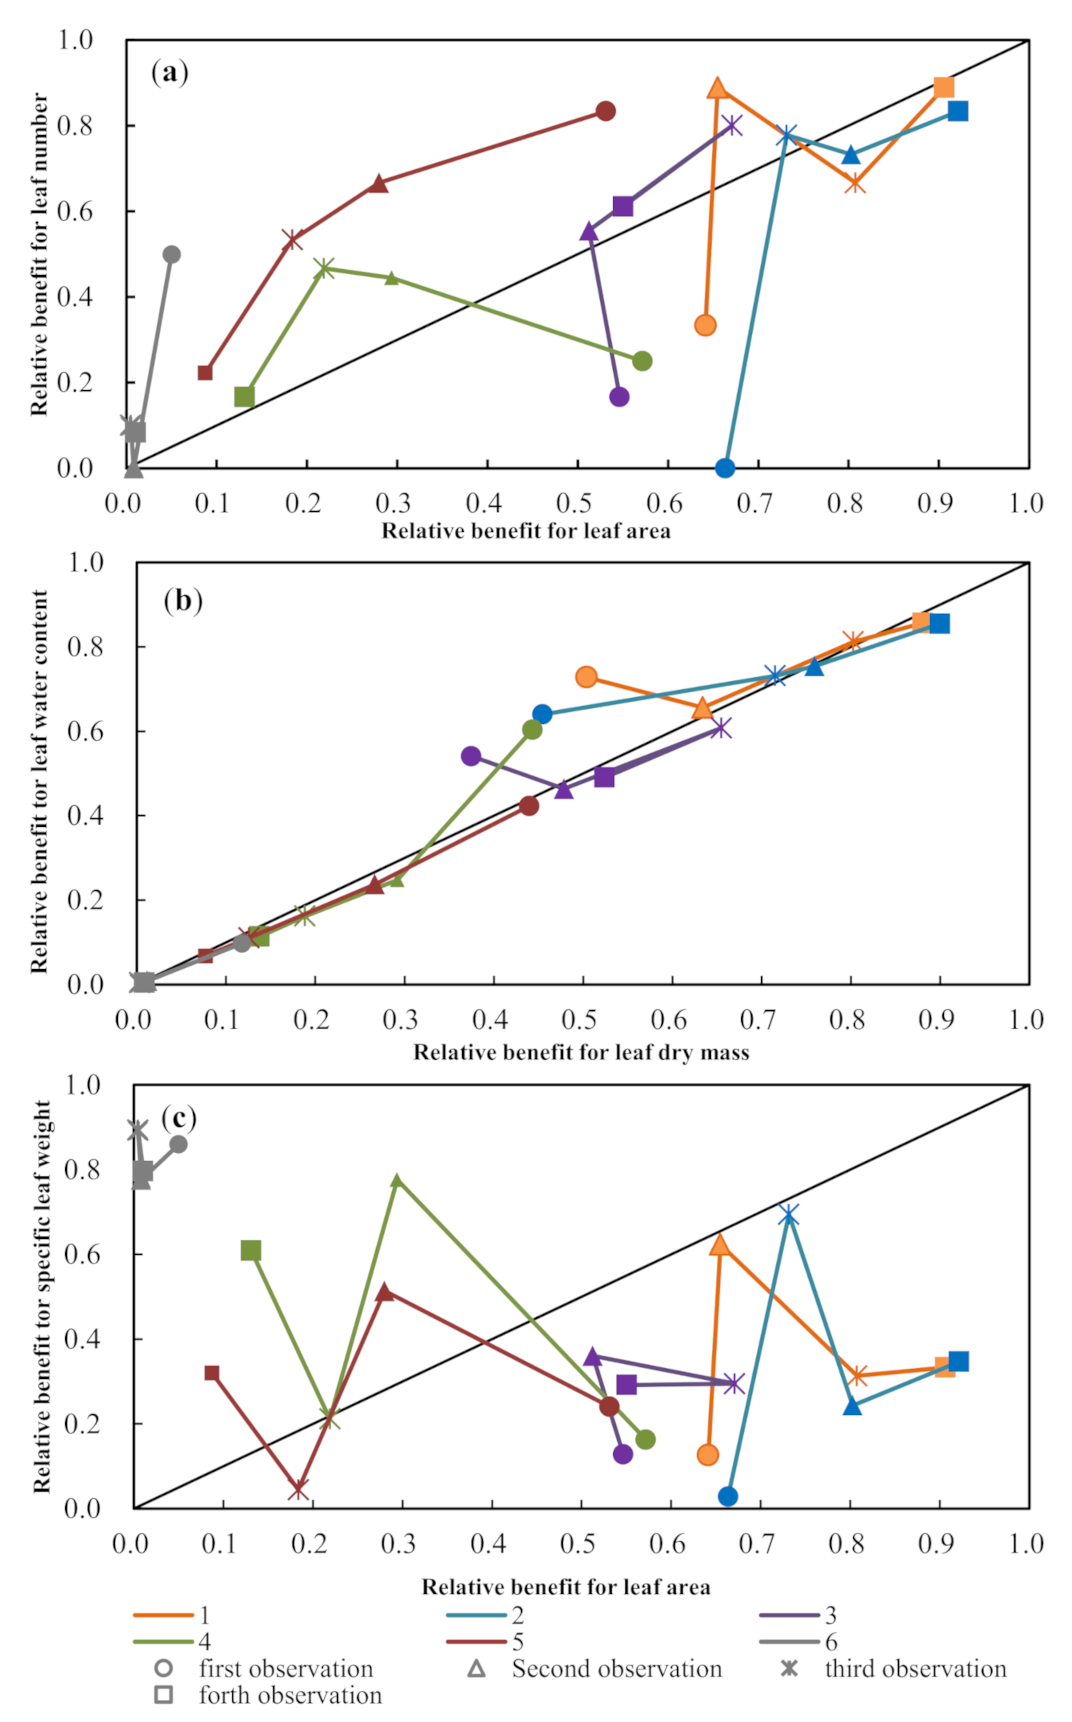
3.3. Trade-Off Growth of Paired Leaf Traits to Different Drought Severity Conditions

The trade-off values on 10 July (the first observation) showed that leaf area had a greater benefit than leaf number in treatments 1 to 4, while the leaf number had a greater benefit than leaf area in treatments 5 and 6. On 18 July (the second observation), leaf number had greater benefit than leaf area in treatments 1 to 5, while leaf area had a slightly greater benefit in treatment 6. On 31 July (the third observation), leaf area had a greater benefit in treatments 1 and 2, while maize plants in treatments 3 to 6 had greater benefits in leaf number. On 7 August (the fourth observation), leaf number had a greater benefit in all treatments except for 2, which had a slightly higher benefit in leaf area (Figure 3a). All up, the trade-off between leaf area and leaf number in treatments 1 and 2 favored leaf area throughout the observation period, while the higher trade-off in treatments 3 and 4 switched from leaf area to leaf number as the drought progressed, and that in treatments 5 and 6 favored leaf number. It suggested that the plants invested more resources in leaf expansion to achieve rapid growth and preserved energy for reproductive growth when the drought was slight, while they reduced single leaf area to decrease water loss at the expense of a slower growth rate when the drought was more severe.
Trade-off values on 10 July showed that leaf water content had a greater benefit in treatments 1 to 4 as compared to treatments 5 and 6. On 18 July, the trade-off favored leaf water content in treatments 1 and 2, while leaf dry mass was favored in treatments 3 to 6. On 31 July, there were small differences in the trade-off between leaf dry mass and leaf water content in all treatments. Leaf water content had a greater trade-off in treatment 1, while leaf dry mass had a greater trade-off in treatments 2 to 5, and the trade-off value of treatment 6 was close to 0. On 7 August, the trade-off favored leaf dry mass in treatments 1 to 6 (Figure 3b). In above, the higher trade-off values of treatments 1 to 4 switched from leaf water content to leaf dry mass as the drought progressed, while treatments 5 and 6 had higher trade-off values favoring leaf dry mass throughout the observation period. It could be seen that when drought severity was greater than 0, maize plants invested less energy in maintaining leaf water content than leaf dry mass, indicating that maize plants under drought conditions would reduce leaf metabolic activity and growth by decreasing leaf water content, while accumulating resources to enhance survival probability.
On 10 July, leaf area had a greater benefit than specific leaf weight in treatments 1 to 5, while less than that in treatment 6. On 18 July, the higher trade-off favored leaf area in treatments 1 to 3, while specific leaf weight was favored in treatments 4 to 6. On 31 July, leaf area had a higher benefit in treatments 1 to 5, while was lower than specific leaf weight in treatment 6. On 7 August, the higher trade-off favored leaf area in treatments 1 to 3, while favoring specific leaf weight in treatments 4 to 6 (Figure 3c). In above, treatments 1 to 3 had a higher benefit for leaf area and treatment 6 had a higher benefit for the specific leaf weight throughout the observation period, while the higher benefit in treatments 4 and 5 switched from leaf area to specific leaf weight. It can be seen that when drought severity was greater than 0.48, the higher trade-off in treatments 4 and 5 switched from leaf area to specific leaf weight, indicating that when soil water was sufficient, maize plants expanded their leaf area to obtain energy and achieve rapid growth, while when confronted with drought, maize plants increased specific leaf weight to improve their ability to resist drought.
Figure 3. Trade-off between leaf traits of each observation. (a) The trade–off between leaf area and leaf number; (b) The trade–off between leaf water content and leaf dry mass; (c) The trade–off between leaf dry mass and leaf area. The numbers in the legend represent the corresponding treatments, and the different icons refer to different time observations (10 July, 18 July, 31 July and 7 August, respectively). The relative position of the benefit value relative to the diagonal indicates the tendency of the trade-off, the greater the distance to the diagonal, the greater the trade-off.
Water 13 01852 g003
Note: The solid line is the zero trade-off line, and 1–6 represent the trade-off between the leaf area and the number of leaves for plants in treatments 1–6.

4. Discussion

4.1. Quantitative Expression of Drought Intensity and Drought Severity

Soil moisture is one of the most common drought indicators for crops [23]. However, drought is a dynamic process, and its influence on crops is not only related to its occurrence time, intensity, and duration, but it is also affected by meteorological conditions, soil properties, root distribution, and the water absorption capacity of crops [26]. The soil water content only indicates the current soil water status, but it does not provide information on previous drought conditions. Therefore, the same soil water content may correspond to different drought conditions [23,27]. For example, in this study, the initial soil water content and soil water reduction in treatments 3 and 4 were significantly different, and consequently, the effect on maize plants was also different. However, the relative soil moisture in both treatments reached 48% on 31 July, which could not explain the significant differences in their leaf traits (Table 1 and Table 2). In view of this, the FAO crop stress coefficient (Ks) was applied in this study to indicate the water deficit degree of maize plant on a given day, which takes into consideration the effective soil water content, rapidly available water content that could be easily absorbed by roots as well as soil properties, meteorological conditions, and crop growth stages. Based on Ks, drought severity was developed to describe water deficit degree of maize plant over a period of time, which was proved to better account for the differences in maize leaf traits among treatments, and the trade-off relationships between leaf traits in different drought conditions compared to soil moisture.

4.2. Effects of Drought on Maize Leaf Traits

The leaf is one of the most drought-sensitive plant organs [28,29]. When exposed to drought, leaf area, and leaf number decrease, and leaf thicken and curl [29,30]. In this study, drought significantly inhibited the expansion of maize leaves, reduced leaf water content, decreased leaf development rate, and accelerated the senescence and shedding of old leaves, resulting in decreased leaf area and dry matter accumulation, and a slower leaf growth rate. These changes reduced leaf water loss and improved the water use efficiency of maize plants [14,31]. However, the effects of drought severity on leaf traits were not consistent. The results showed that when drought severity was less than 0.23, maize leaf traits were largely unaffected. When drought severity was between 0.23 and 0.74, the leaf area, effective leaf number, dry mass, and water content increased, but at a slower rate. The influence of drought on maize leaves was mainly on the values of leaf traits, but it did not fundamentally change their growing trends. When drought severity was between 0.74 and 0.90, the growth rate of maize leaves decreased significantly while the senescence of old leaves was accelerated, and the formation of new leaves could not compensate for the senescence of old ones. Therefore, the effective leaf number, leaf dry mass, leaf area, and water content decreased. When drought severity was greater than 0.90, maize leaf growth was slow, but the leaves were maintained, and leaf traits changed slightly. Plants in resource-rich environments have a high resource absorption rate and turnover and will maximize their growth rate by constantly generating new tissues and organs. However, in resource-poor environments, plants absorb and utilize resources at a lower rate, conserve resources by delaying the aging of tissues and organs, and prolong the growth cycle to compensate for the resource consumption necessary for growth. The slower turnover rate enhances the survival rate, but it reduces the growth rate [32].

4.3. Trade-Off Strategies of Maize Leaf Traits during Drought Conditions

Drought had an influence on all maize leaf traits, but to different extent, which took the following form: leaf area > effective leaf number, and leaf water content > leaf dry mass, reflecting the trade-off growth during drought conditions. The influence on leaf area was greater than that on leaf number, indicating that decreased leaf area was mainly caused by the significant decrease in single blades, which reflected the trade-off strategy of “leafing intensity premium” in plants under adverse conditions (plants reduced the single leaf area and to ensure that the number of leaves was not affected) [31,33,34,35]. Smaller blades have better thermal conductivity, which could ensure the capture of light energy while avoiding overheating and thereby reducing water loss [34,36]. In addition, smaller leaf size lowers the threshold for reproductive growth, which ensures that plants can still reproduce in cases of severe plant volume inhibition due to adverse environmental conditions, such as drought [31]. Maize leaf spread is necessary for the differentiation and development of reproductive organs. Maintaining the leaf spreading rate ensures that maize development is less affected, allowing the plant to complete its life cycle and form yield in a limited period suitable for growth [37,38].
Drought influence on leaf water content was greater than that on leaf dry mass, indicating that under drought conditions, maize would reduce leaf metabolic activity, maintain a lower growth rate, and accumulate dry matter to resist the adverse effects of drought. The growth strategy of maize under drought conditions essentially reflects the trade-off between rapid growth and survival [39]. With different drought conditions, maize would adopt different trade-off strategies. This study showed that maize maintained high metabolic activity in the absence of drought. When drought severity was greater than 0, maize would reduce leaf water content to inhibit the leaf metabolic activity and reduce energy losses. When drought severity was less than 0.48, maize absorbed more energy by rapidly increasing leaf area to accumulate energy for reproductive organ growth. However, when drought severity was greater than 0.48, maize plants reduced their single leaf area and maintained a higher specific leaf weight to reduce water loss, and conserved resources to enhance their drought resistance. Therefore, when drought severity is lower than 0.48, maize could basically maintain normal growth through the trade-off growth strategies, and corresponding drought-resistance measures may not be taken. When drought severity is greater than 0.48, drought prevention and resistance measures such as timely supplementary irrigation, spraying of foliar fertilizer or applying plant growth regulators to promote maturity, removing maize tassels alternately, loosening the land between ridges, etc. should be taken to alleviate the inhibition of drought on maize growth and yield formation.

5. Conclusions

Drought can significantly inhibit the expansion of maize leaf area, reduce leaf water content, decrease leaf spreading rate, and accelerate the senescence and shedding of old leaves, leading to a decrease in leaf area and dry matter accumulation, and slower growth. However, the effects of different drought severity on leaf traits were not consistent. When drought severity was less than 0.23, maize leaf traits were hardly affected. When drought severity was between 0.23 and 0.74, the leaf area, effective leaf number, dry mass, and water content increased, but at a slower rate. Drought affected the values of leaf traits, but it did not fundamentally change their growth trends. When drought severity was between 0.74 and 0.90, the growth rate of maize leaves decreased significantly, and the senescence of old leaves accelerated. Thus, the formation of new leaves could not compensate for the senescence of old leaves. Therefore, the effective leaf number, dry mass, area, and water content decreased. When drought severity was greater than 0.90, maize leaf growth was very slow, leaves were maintained, and leaf traits changed slightly. To improve survival ability under drought conditions, maize plants decreased water loss and leaf metabolism by reducing leaf area and water content. This reduced energy consumption and increased resource storage, which essentially reflected the trade-off between rapid growth and survival.
Maize plants adopted different trade-off strategies between leaf traits under different drought conditions. Plants maintained a high metabolic activity when not affected by drought. However, when drought severity was greater than 0, the plants reduced leaf water content to decrease leaf metabolic activity. When drought severity was less than 0.48, maize absorbed more energy by rapidly increasing leaf area to accumulate reserves for the growth of reproductive organs. When drought severity was greater than 0.48, maize plants reduced single leaf area to reduce water loss, and conserved resources to enhance their drought resistance.
The results provide an insight into the acclimation strategies of maize under drought, and contribute to targeted drought prevention and relief measures to reduce drought-induced risks on food security in the context of climate change.

Author Contributions

Conceptualization, G.Z.; Data curation, X.M. and Q.W.; Formal analysis, X.M.; Funding acquisition, G.Z.; Investigation, X.M. and Q.W.; Methodology, X.M.; Project administration, G.Z. and G.L.; Resources, Q.W.; Software, X.M.; Supervision, G.Z.; Validation, G.L.; Visualization, X.M. and G.L.; Writing—original draft, X.M.; Writing—review and editing, G.Z. and G.L. All authors have read and agreed to the published version of the manuscript.

Funding

This research was jointly supported by National Natural Science Foundation of China (31901398), and the Climate Change Special Fund for China Meteorological Administration (CCSF202024).

Institutional Review Board Statement

Not applicable.

Informed Consent Statement

Not applicable.

Data Availability Statement

The data presented in this study are all available in this article.

Acknowledgments

We acknowledge Gucheng Agrometeorological Experimental Station of China Meteorological Administration for providing convenient experiment facilities. We thank Zhenzhu Xu from Institute of Botany, Chinese Academy of Sciences for his critical suggestions. We also thank Feng Zhang, Yanling Jiang, Yaohui Shi, Huailin Zhou, Minzheng Wang, YuheJi, Tao Liu, Bozhen Li, Li Zhang, Shaojun Liu, Jun Tang, Jian Song, and Shujie Zhang for their help during field work.

Conflicts of Interest

The authors have declared that no competing interests exist.

References

  1. Neumann, P.M. Coping mechanisms for crop plants in drought—Prone environments. Ann. Bot. 2008, 101, 901–907. [Google Scholar] [CrossRef] [PubMed]
  2. Farooq, M.; Wahid, A.; Kobayashi, N.; Fujita, D.; Basra, S.M.A. Plant drought stress: Effects, mechanisms and management. Agron. Sustain. Dev. 2009, 29, 185–212. [Google Scholar] [CrossRef] [Green Version]
  3. Alam, M.R.; Nakasathien, S.; Sarobol, E.; Vichukit, V. Responses of physiological traits of maize to water deficit induced at different phonological stages. Kasetsart J. Nat. Sci. 2014, 48, 183–196. [Google Scholar]
  4. Costa, L.C.; Cunha, A.P.; Anderson, L.O.; Cunningham, C. New approach for drought assessment: A case study in the northern region of Minas Gerais. Int. J. Disaster Risk Reduct. 2021, 102019. [Google Scholar] [CrossRef]
  5. Dai, A. Increasing drought under global warming in observations and models. Nat. Clim. Chang. 2013, 3, 52–58. [Google Scholar] [CrossRef]
  6. IPCC. Climate Change 2013: The Physical Science Basis; Contribution of Working Group I to the Fifth Assessment Report of the Intergovernmental Panel on Climate Change; Cambridge University Press: Cambridge, UK; New York, NY, USA, 2013; p. 1535. [Google Scholar]
  7. Olesen, J.E.; Trnka, M.; Kersebaum, K.C.; Skjelvåg, A.O.; Seguin, B.; Peltonen-Sainio, P.; Rossi, F.; Kozyra, J.; Micale, F. Impacts and adaptation of European crop production systems to climate change. Eur. J. Agron. 2011, 34, 96–112. [Google Scholar] [CrossRef]
  8. Chen, H.; Wang, J.; Huang, J. Policy support, social capital, and farmers’ adaptation to drought in China. Glob. Environ. Chang. 2014, 24, 193–202. [Google Scholar] [CrossRef]
  9. Jiang, P.; Cai, F.; Zhao, Z.-Q.; Meng, Y.; Gao, L.-Y.; Zhao, T.-H. Physiological and Dry Matter Characteristics of Spring Maize in Northeast China under Drought Stress. Water 2018, 10, 1561. [Google Scholar] [CrossRef] [Green Version]
  10. Saglam, A.; Kadioğlu, A.; Demiralay, M.; Terzi, R. Leaf Rolling Reduces Photosynthetic Loss in Maize Under Severe Drought. Acta Bot. Croat. 2014, 73, 315–332. [Google Scholar] [CrossRef]
  11. Farooq, M.; Kobayashi, N.; Ito, O.; Wahid, A.; Serraj, R. Broader leaves result in better performance of indica rice under drought stress. J. Plant Physiol. 2010, 167, 1066–1075. [Google Scholar] [CrossRef]
  12. Poorter, L.; Bongers, F. Leaf traits are good predictors of plant performance across 53 rain forest species. Ecology 2006, 87, 1733–1743. [Google Scholar] [CrossRef]
  13. Freschet, G.T.; Cornelissen, J.H.C.; Van Logtestijn, R.S.P.; Aerts, R. Evidence of the ‘plant economics spectrum’ in a subarctic flora. J. Ecol. 2010, 98, 362–373. [Google Scholar] [CrossRef] [Green Version]
  14. Pan, S. Variation in Leaf Metabolic Ecological Exponent and Leaf Traits along Environmental Gradients; Zhejiang University: Hangzhou, China, 2014. [Google Scholar]
  15. Zhu, J.; Zhu, H.; Cao, Y.; Li, J.; Zhu, Q.; Yao, J.; Xu, C. Effect of simulated warming on leaf functional traits of urban greening plants. BMC Plant Biol. 2020, 20, 139. [Google Scholar] [CrossRef]
  16. Qiu, R.; Katul, G.G.; Wang, J.; Xu, J.; Kang, S.; Liu, C.; Zhang, B.; Li, L.; Cajucom, E.P. Differential response of rice evapotranspiration to varying patterns of warming. Agric. For. Meteorol. 2021, 298–299, 108293. [Google Scholar] [CrossRef]
  17. Wright, I.J.; Reich, P.B.; Westoby, M.; Ackerly, D.D.; Baruch, Z.; Bongers, F.; Cavender-Bares, J.; Chapin, T.; Cornelissen, J.H.C.; Diemer, M.; et al. The worldwide leaf economics spectrum. Nature 2004, 428, 821–827. [Google Scholar] [CrossRef]
  18. Bosabalidis, A.M.; Kofidis, G. Comparative effects of drought stress on leaf anatomy of two olive cultivars. Plant Sci. 2002, 163, 375–379. [Google Scholar] [CrossRef]
  19. Munné-Bosch, S.; Alegre, L. Die and let live: Leaf senescence contributes to plant survival under drought stress. Funct. Plant Biol. 2004, 31, 203–216. [Google Scholar] [CrossRef]
  20. Lefi, E.; GULÍAS, J.; Cifre, J.; Ben Younes, M.; Medrano, H. Drought effects on the dynamics of leaf production and senescence in field-grown Medicago arborea and Medicago citrina. Ann. Appl. Biol. 2004, 144, 169–176. [Google Scholar] [CrossRef]
  21. Francis, C.A.; Rutger, J.N.; Palmer, A.F.E. A Rapid Method for Plant Leaf Area Estimation in Maize (Zea mays L.). Crop Sci. 1969, 9, 537–539. [Google Scholar] [CrossRef]
  22. Peuke, A.D.; Schraml, C.; Hartung, W.; Rennenberg, H. Identification of drought-sensitive beech ecotypes by physiological parameters. New Phytol. 2002, 154, 373–387. [Google Scholar] [CrossRef]
  23. Chen, J.Z.; Wang, S.; Zhang, L.L.; Guo-An, L. Response of Maize to Progressive Drought and Red Soil’s Drought Threshold. Sci. Agric. Sin. 2007, 40, 532–539. [Google Scholar]
  24. Allen, R.; Pereira, L.; Raes, D.; Smith, M. Crop Evapotranspiration. Guidelines for Computing Crop Water Requirements; FAO Irrigation and Drainage Paper 56; FAO: Rome, Italy, 1998. [Google Scholar]
  25. Bradford, J.B.; D’Amato, A.W. Recognizing trade-offs in multi-objective land management. Front. Ecol. Environ. 2012, 10, 210–216. [Google Scholar] [CrossRef] [Green Version]
  26. Porporato, A.; Laio, F.; Ridolfi, L.; Rodriguez-Iturbe, I. Plants in water-controlled ecosystems: Active role in hydrologic processes and response to water stress: III. Vegetation water stress. Adv. Water Resour. 2001, 24, 725–744. [Google Scholar] [CrossRef]
  27. Zhang, Y.; Na, M.; Cheng, P.; Ji, R. Influences of Soil Water Stress on Growth and Development of Maize. Chin. Agric. Sci. Bull. 2012, 28, 1–7. [Google Scholar]
  28. Elhaak, M.A. Response of Plantago albicans leaves of environmental drought. Feddes Repert. 1990, 101, 645–650. [Google Scholar] [CrossRef]
  29. Ye, L.; Huang, X.; Li, X. Effects of Drought on Leaf Traits and Drought-resistant Physiology of Trees. World For. Res. 2014, 27, 29–34. [Google Scholar]
  30. Shi, Y.H.; Zhou, G.S.; Jiang, Y.L.; Ma, X.Y. Thresholds of Stipa baicalensis sensitive indicators response to precipitation change. Acta Ecol. Sin. 2017, 37, 2620–2630. [Google Scholar]
  31. Aarssen, L.W. Reducing size to increase number: A hypothesis for compound leaves. Ideas Ecol. Evol. 2012, 5, 1–5. [Google Scholar] [CrossRef] [Green Version]
  32. Sterck, F.J.; Poorter, L.; Schieving, F. Leaf traits determine the growth—Survival trade—Off across rain forest tree species. Am. Nat. 2006, 167, 758–765. [Google Scholar] [CrossRef]
  33. Yang, D.M.; Feng, Z.; Zhang, H.W. Trade-off between leaf size and number in current-year twigs of deciduous broad-leaved woody species at different altitudes on Qingliang Mountain, southeastern China. Chin. J. Plant Ecol. 2012, 36, 281–291. [Google Scholar] [CrossRef]
  34. Kleimn, D.; Aarssen, L.W. The leaf size/number trade-off in trees. J. Ecol. 2007, 95, 376–382. [Google Scholar] [CrossRef]
  35. Qiu, R.; Liu, C.; Cui, N.; Wu, Y.; Wang, Z.; Li, G. Evapotranspiration estimation using a modified Priestley-Taylor model in a rice-wheat rotation system. Agric. Water Manag. 2019, 224, 105755. [Google Scholar] [CrossRef]
  36. Whitman, T.; Aarssen, L.W. The leaf size/number trade-off in herbaceous angiosperms. J. Plant Ecol. 2009, 3, 49–58. [Google Scholar] [CrossRef] [Green Version]
  37. Fu, L.; Wang, S.; Liu, Z.; Nijs, I.; Ma, K.; Li, Z. Effects of resource availability on the trade-off between seed and vegetative reproduction. J. Plant Ecol. 2010, 3, 251–258. [Google Scholar] [CrossRef] [Green Version]
  38. Zheng, G.Q.; Duan, S.F.; Yan, S.B.; Lu, B.Q. Simulation Models of the Development of Leaf Age and Organs in Maize. J. Maize Sci. 2003, 11, 63–66. [Google Scholar]
  39. Ocheltree, T.W.; Nippert, J.B.; Prasad, P.V.V. A safety vs. efficiency trade-off identified in the hydraulic pathway of grass leaves is decoupled from photosynthesis, stomatal conductance and precipitation. New Phytol. 2016, 210, 97–107. [Google Scholar] [CrossRef] [Green Version]
Figure 1. Illustration of trade-off between two leaf traits [25].
Water 13 01852 g001
Figure 2. Dynamics of pair—ratios of leaf traits. (a) The dynamics of the ratio of leaf area and leaf number; (b) The dynamics of the ratio of leaf water content and leaf dry mass; (c) The dynamics of the ratio of leaf dry mass and leaf area. The numbers in the legend represent the corresponding treatments.
Water 13 01852 g002
Table 1. The relative soil moisture (RSM) at 0–30cm depth and drought severity of each treatment.
Treatments10 July18 July31 July7 August
Soil Moisture Content (%)Drought SeveritySoil Moisture Content (%)Drought SeveritySoil Moisture Content (%)Drought SeveritySoil Moisture Content (%)Drought Severity
196.5 ± 1.0 a0.00 c69.1 ± 3.9 a0.000 d56.5 ± 6.7 a0.26 d49.3 ± 2.1 a0.44 e
290.8 ± 1.4 b0.00 c68.3 ± 1.8 a0.02 d52.7 ± 3.7 ab0.46 c44.1 ± 3.3 a0.64 d
383.1 ± 4.7 c0.00 c63.0 ± 5.2 a0.10 d47.7 ± 2.5 bc0.54 c45.1 ± 7.8 a0.69 cd
469.1 ± 2.6 d0.04 c54.6 ± 2.3 b0.48 c47.6 ± 1.5 bc0.74 b42.3 ± 4.9 a0.81 bc
561.3 ± 4.5 e0.23 b48.0 ± 2.9 b0.72 b43.7 ± 4.9 c0.87 ab41.7 ± 4.8 a0.90 ab
645.3 ± 1.1 f0.87 a41.0 ± 2.2 c0.95 a31.8 ± 1.4 d0.98 a32.8 ± 0.7 a0.98 a
Note: The absence of identical letters in the same column indicates a significant difference at the 0.05 level. Treatments 1𠄃6 refer to the six different irrigations that performed during the three-leaf period of maize with irrigation amounts of 150, 120, 90, 60, 30, and 10 mm, equivalent to 100%, 80%, 60%, 40%, 20%, and 7% of the local average precipitation in July, respectively.
Table 2. Leaf traits of maize plants in each treatment.
Observation DateTreatmentsEffective Leaf NumberLeaf Area
(cm2)
Leaf Dry Mass
(g)
Leaf Water Content
(g)
Specific Leaf Weight (g.m−2)
10 July14.3 ± 0.6121.2 ± 24.6 a0.31 ± 0.071.76 ± 0.37 a26.02 ± 0.55 a
24.0 ± 0.0122.0 ± 16.1 a0.30 ± 0.051.64 ± 0.26 a25.06 ± 0.39 a
34.2 ± 0.3107.9 ± 3.2 a0.29 ± 0.041.51 ± 0.19 a26.04 ± 1.03 a
44.3 ± 0.4114.1 ± 2.4 a0.30 ± 0.011.59 ± 0.14 a26.39 ± 0.01 a
54.8 ± 0.3107.6 ± 5.6 a0.30 ± 0.011.36 ± 0.10 ab27.15 ± 2.13 b
64.5 ± 0.576.2 ± 3.8 b0.25 ± 0.020.93 ± 0.17 b33.26 ± 1.69b
18 July16.7 ± 0.6 a425.3 ± 47.9 a1.77 ± 0.23 a6.65 ± 1.09 ab41.58 ± 0.74
26.3 ± 0.6 ab466.0 ± 130.1 a1.96 ± 0.58 a7.33 ± 2.13 a41.92 ± 1.56
35.7 ± 0.6 bc349.1 ± 58.4 ab1.41 ± 0.28 ab4.94 ± 0.98 bc40.34 ± 1.57
45.3 ± 0.6 c232.5 ± 51.9 b0.98 ± 0.22 b3.01 ± 0.74 cd42.31 ± 0.94
56.0 ± 0.0 abc225.0 ± 29.0 b0.93 ± 0.15 b2.92 ± 0.44 cd41.06 ± 2.22
64.0 ± 0.0 d79.9 ± 6.3 c0.34 ± 0.04 c0.88 ± 0.11 d42.31 ± 1.36
31 July17.3 ± 0.6 ab1101.1 ± 218.6a5.57 ± 1.12 a19.62 ± 3.73 a50.54 ± 0.75 a
27.7 ± 0.6 ab1095.0 ± 173.8 a5.29 ± 1.01 a18.30 ± 3.47 a48.20 ± 2.67 a
38.0 ± 1.0 a924.5 ± 341.5 a4.62 ± 1.73 a14.97 ± 5.40 a49.92 ± 2.60 a
46.3 ± 0.6 b339.4 ± 136.4 b1.62 ± 0.72 b4.81 ± 2.20 b47.13 ± 2.40 a
56.7 ± 0.6 ab293.8 ± 68.3 b1.22 ± 0.29 b3.65 ± 1.05 b41.54 ± 1.32 b
64.5 ± 0.7 c62.1 ± 8.8 b0.43 ± 0.03 b1.22 ± 0.15 b69.94 ± 5.08 b
7 August19.0 ± 0.0 a1688.5 ± 143.2 a9.28 ± 0.79 a28.70 ± 3.67 a54.94 ± 1.26 a
29.7 ± 0.6 a1716.3 ± 168.4 a9.47 ± 1.06 a28.64 ± 4.68 a55.24 ± 4.04 a
38.3 ± 0.6 a1048.1 ± 54.5 b5.69 ± 1.00 b16.92 ± 3.65 b54.03 ± 7.02 a
45.3 ± 0.6 b293.4 ± 116.4 c1.79 ± 0.72 c4.78 ± 1.88 c61.02 ± 4.04 ab
55.7 ± 1.2 b215.0 ± 52.9 c1.18 ± 0.31 c3.29 ± 0.91c54.64 ± 4.25 a
64.5 ± 0.7 b76.1 ± 26.2 c0.49 ± 0.12 c1.27 ± 0.21c65.15 ± 6.33 b
Note: The absence of identical letters in the same column indicates a significant difference at the 0.05 level.
Publisher’s Note: MDPI stays neutral with regard to jurisdictional claims in published maps and institutional affiliations.

