
Variabilities and Trends of Rainfall, Temperature, and River Flow in Sipi Sub-Catchment on the Slopes of Mt. Elgon, Uganda


Abstract
:1. Introduction
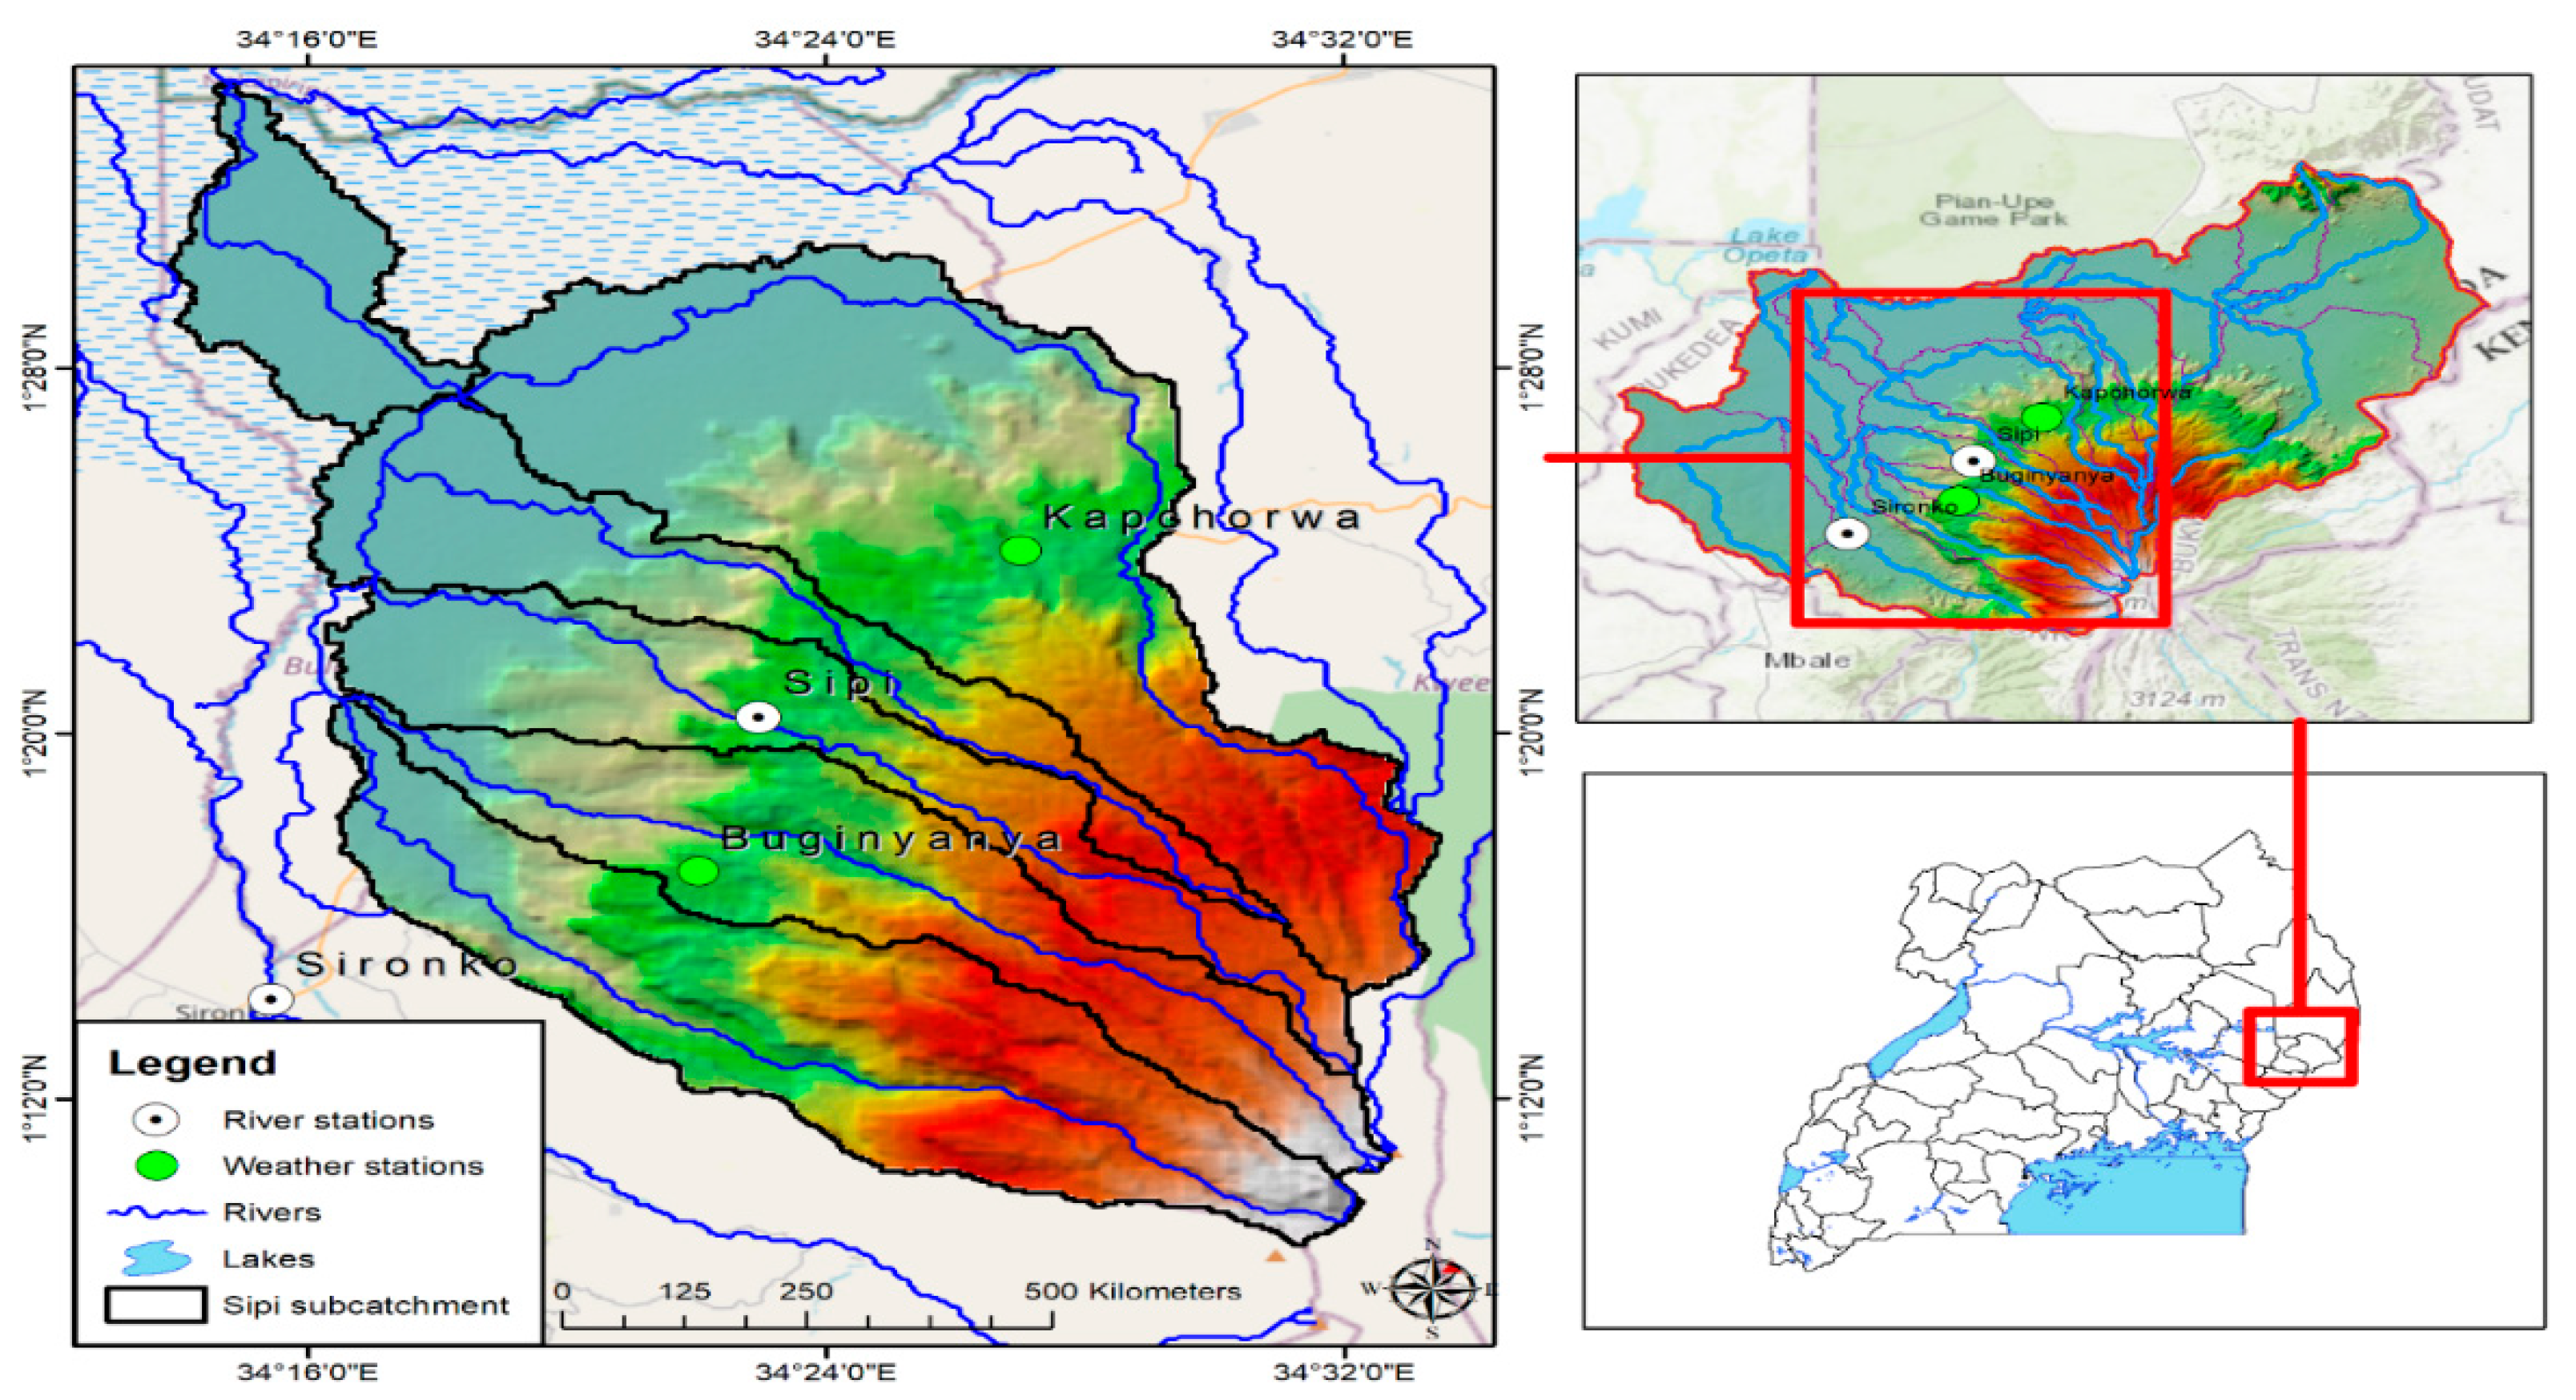
2. Materials and Methods
2.1. Data and Methods
2.2. Data Analysis
3. Results
3.1. Seasonal Variability in Rainfall and Temperature
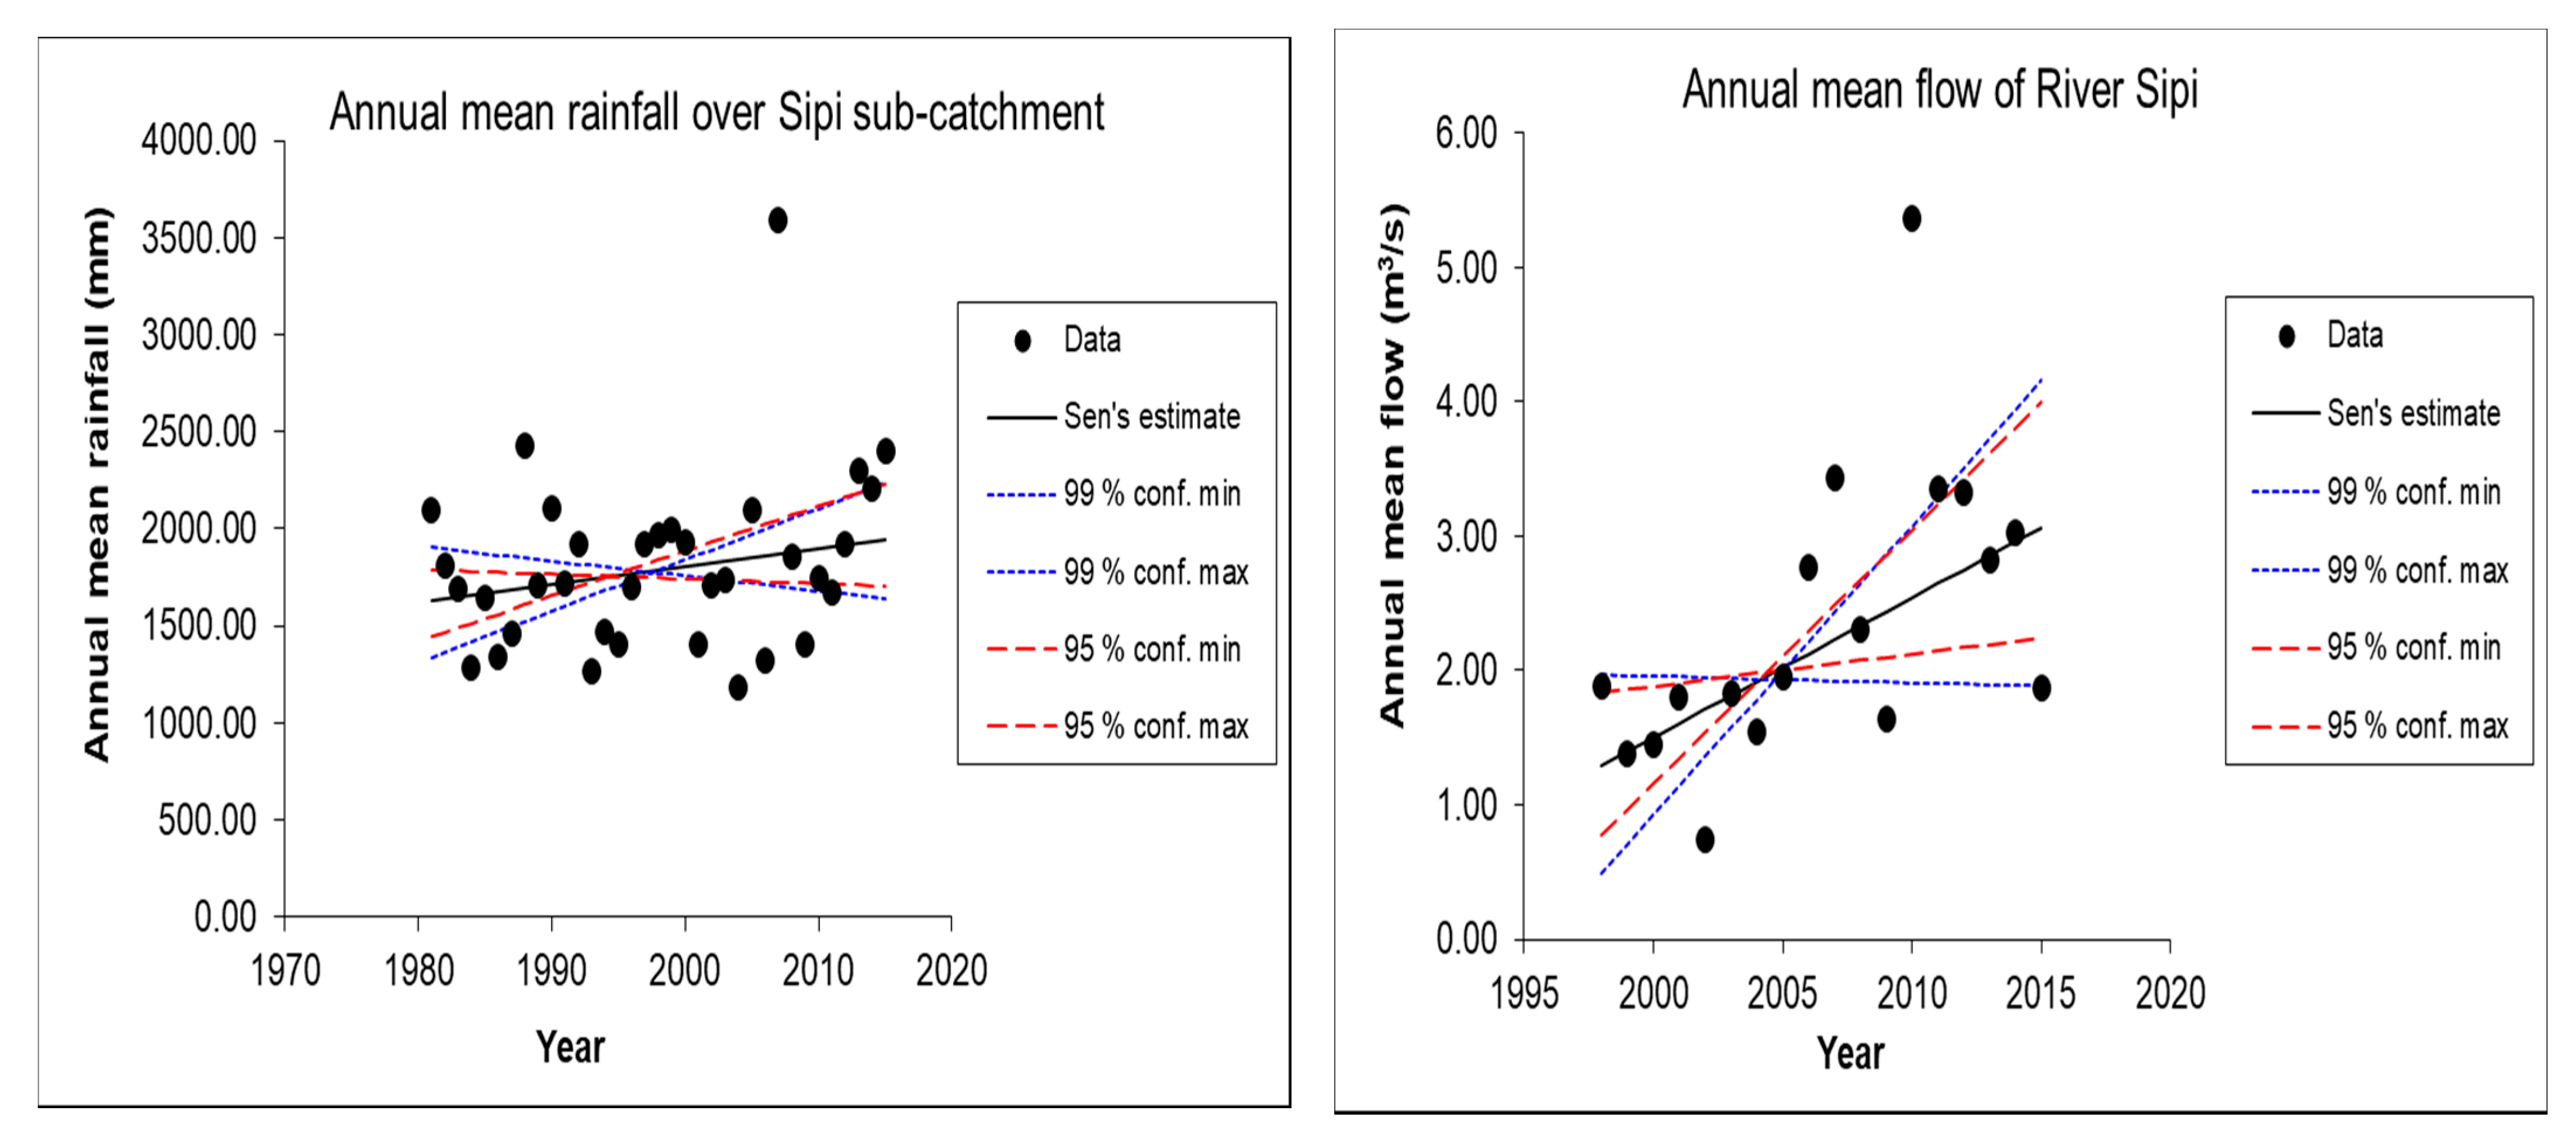
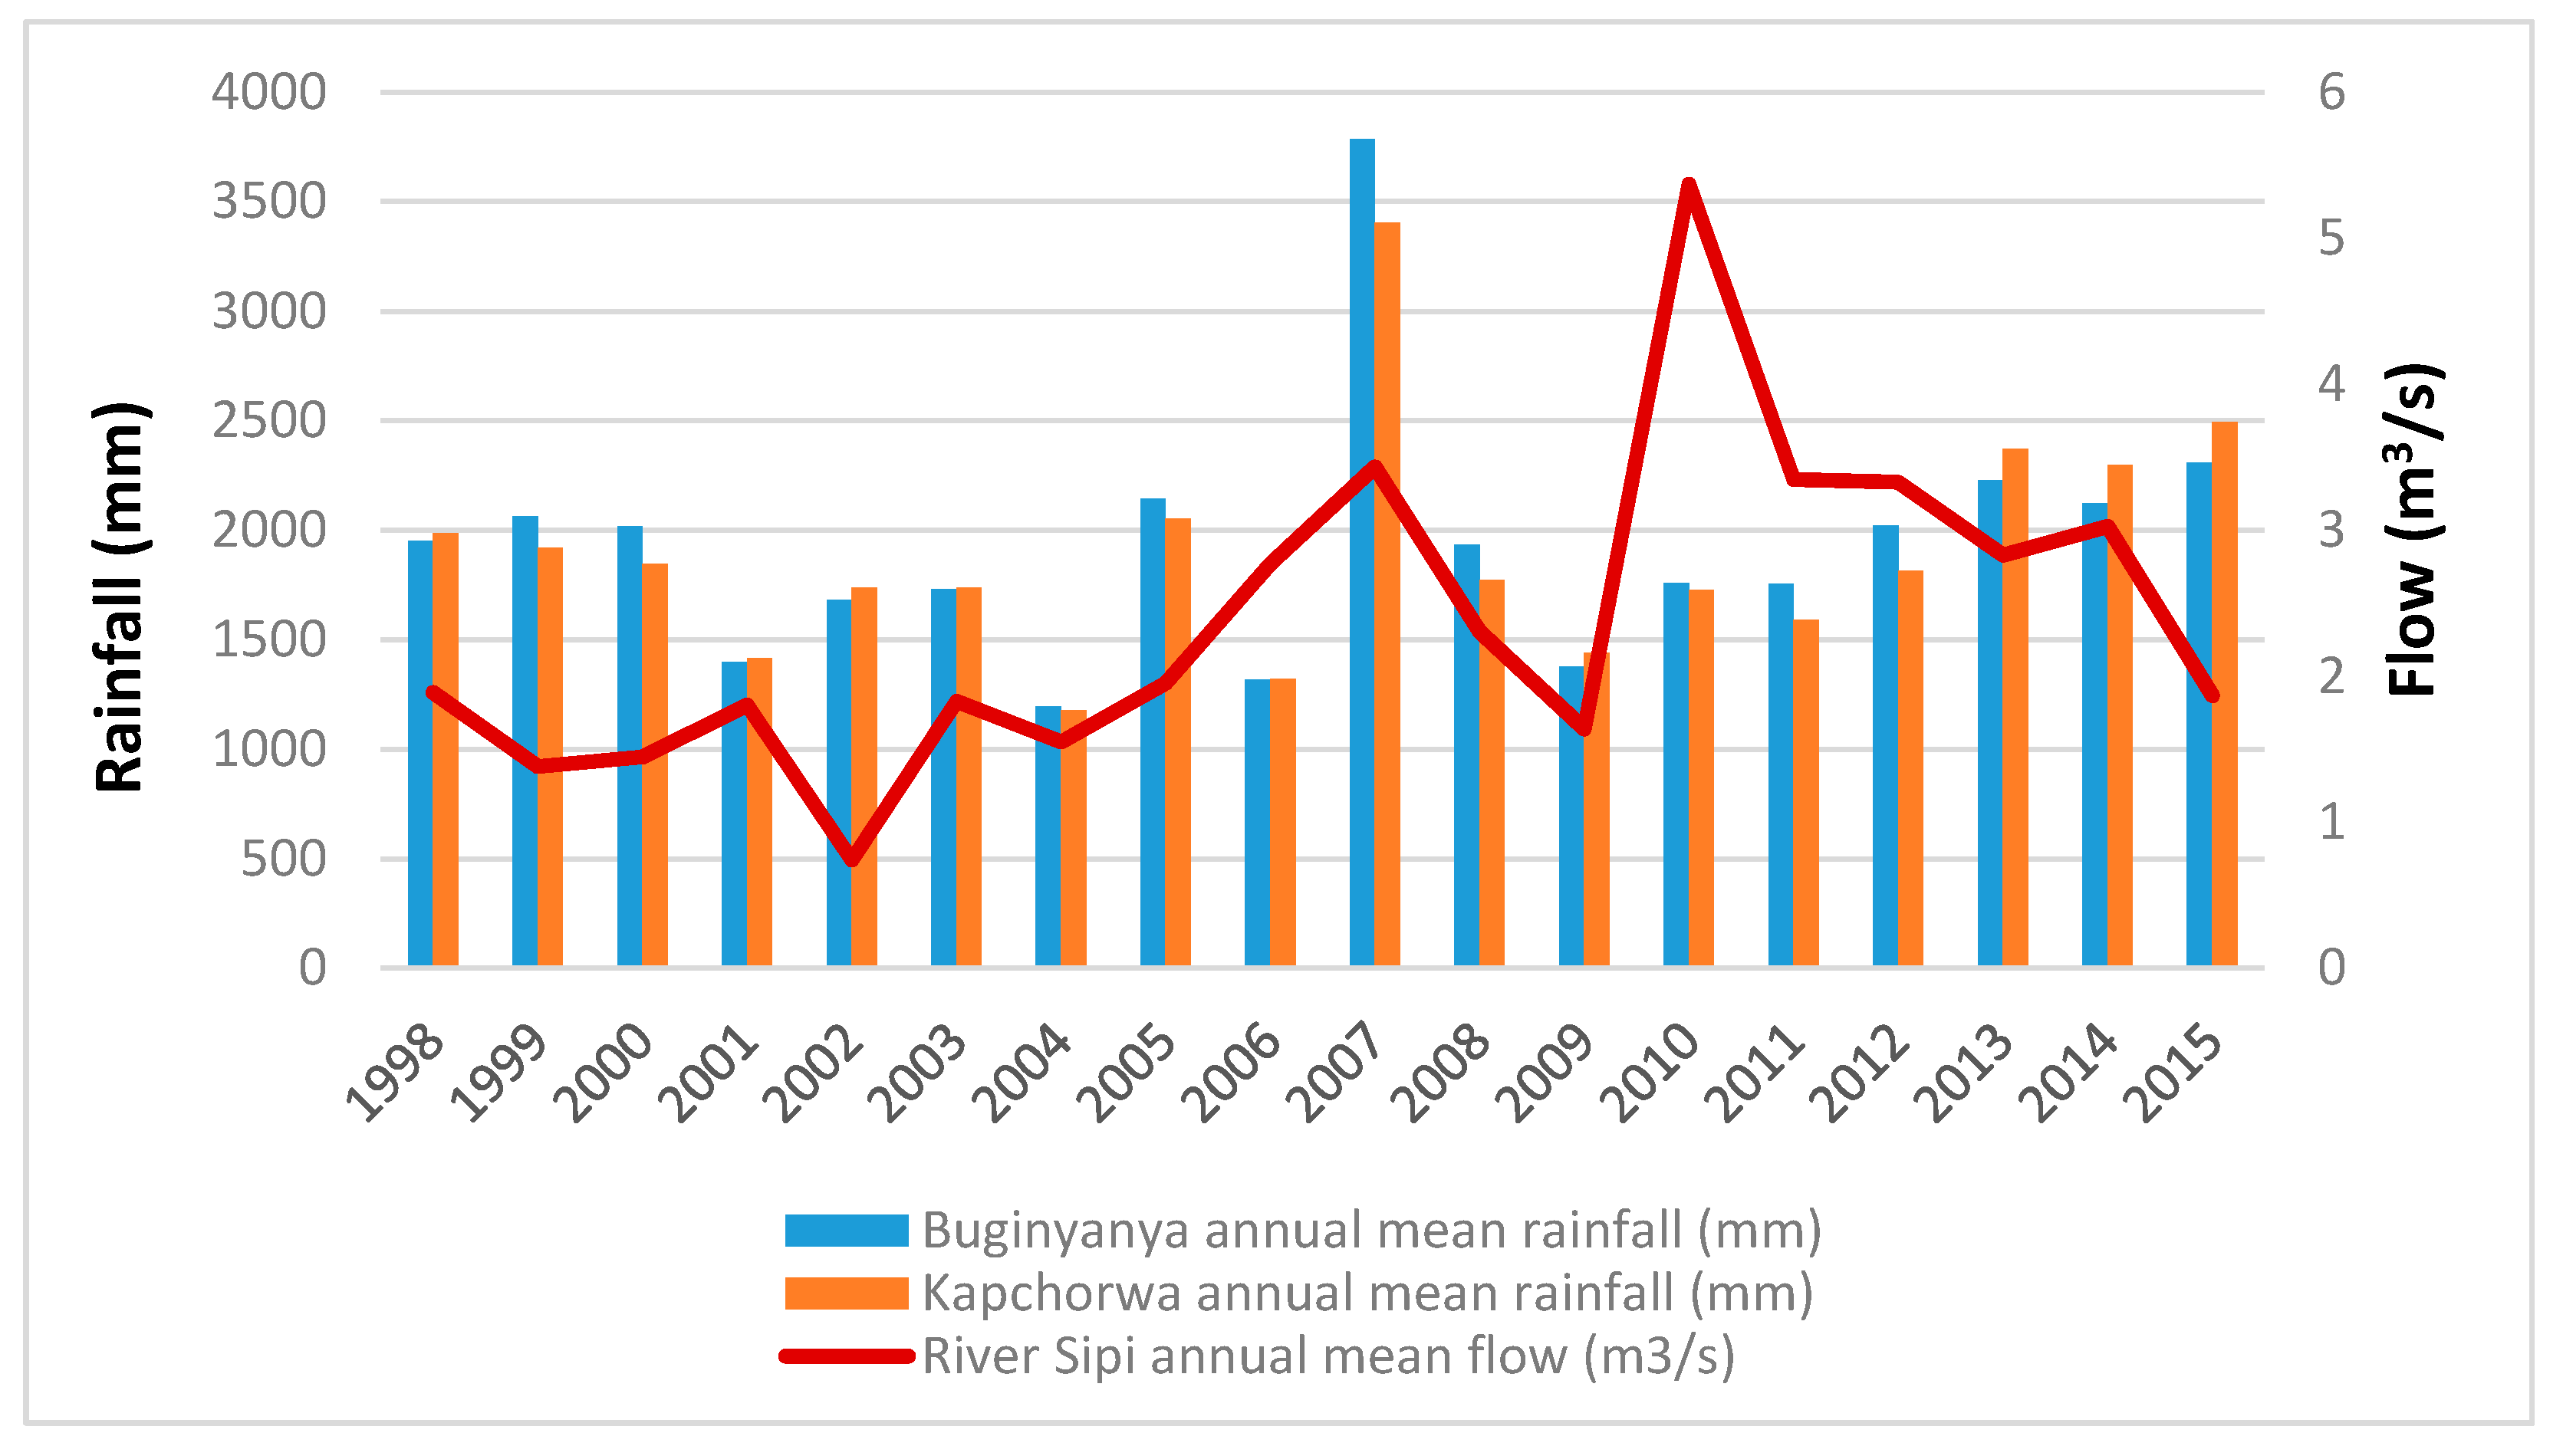
3.2. Annual Variability in Rainfall, Temperature, and River Flow
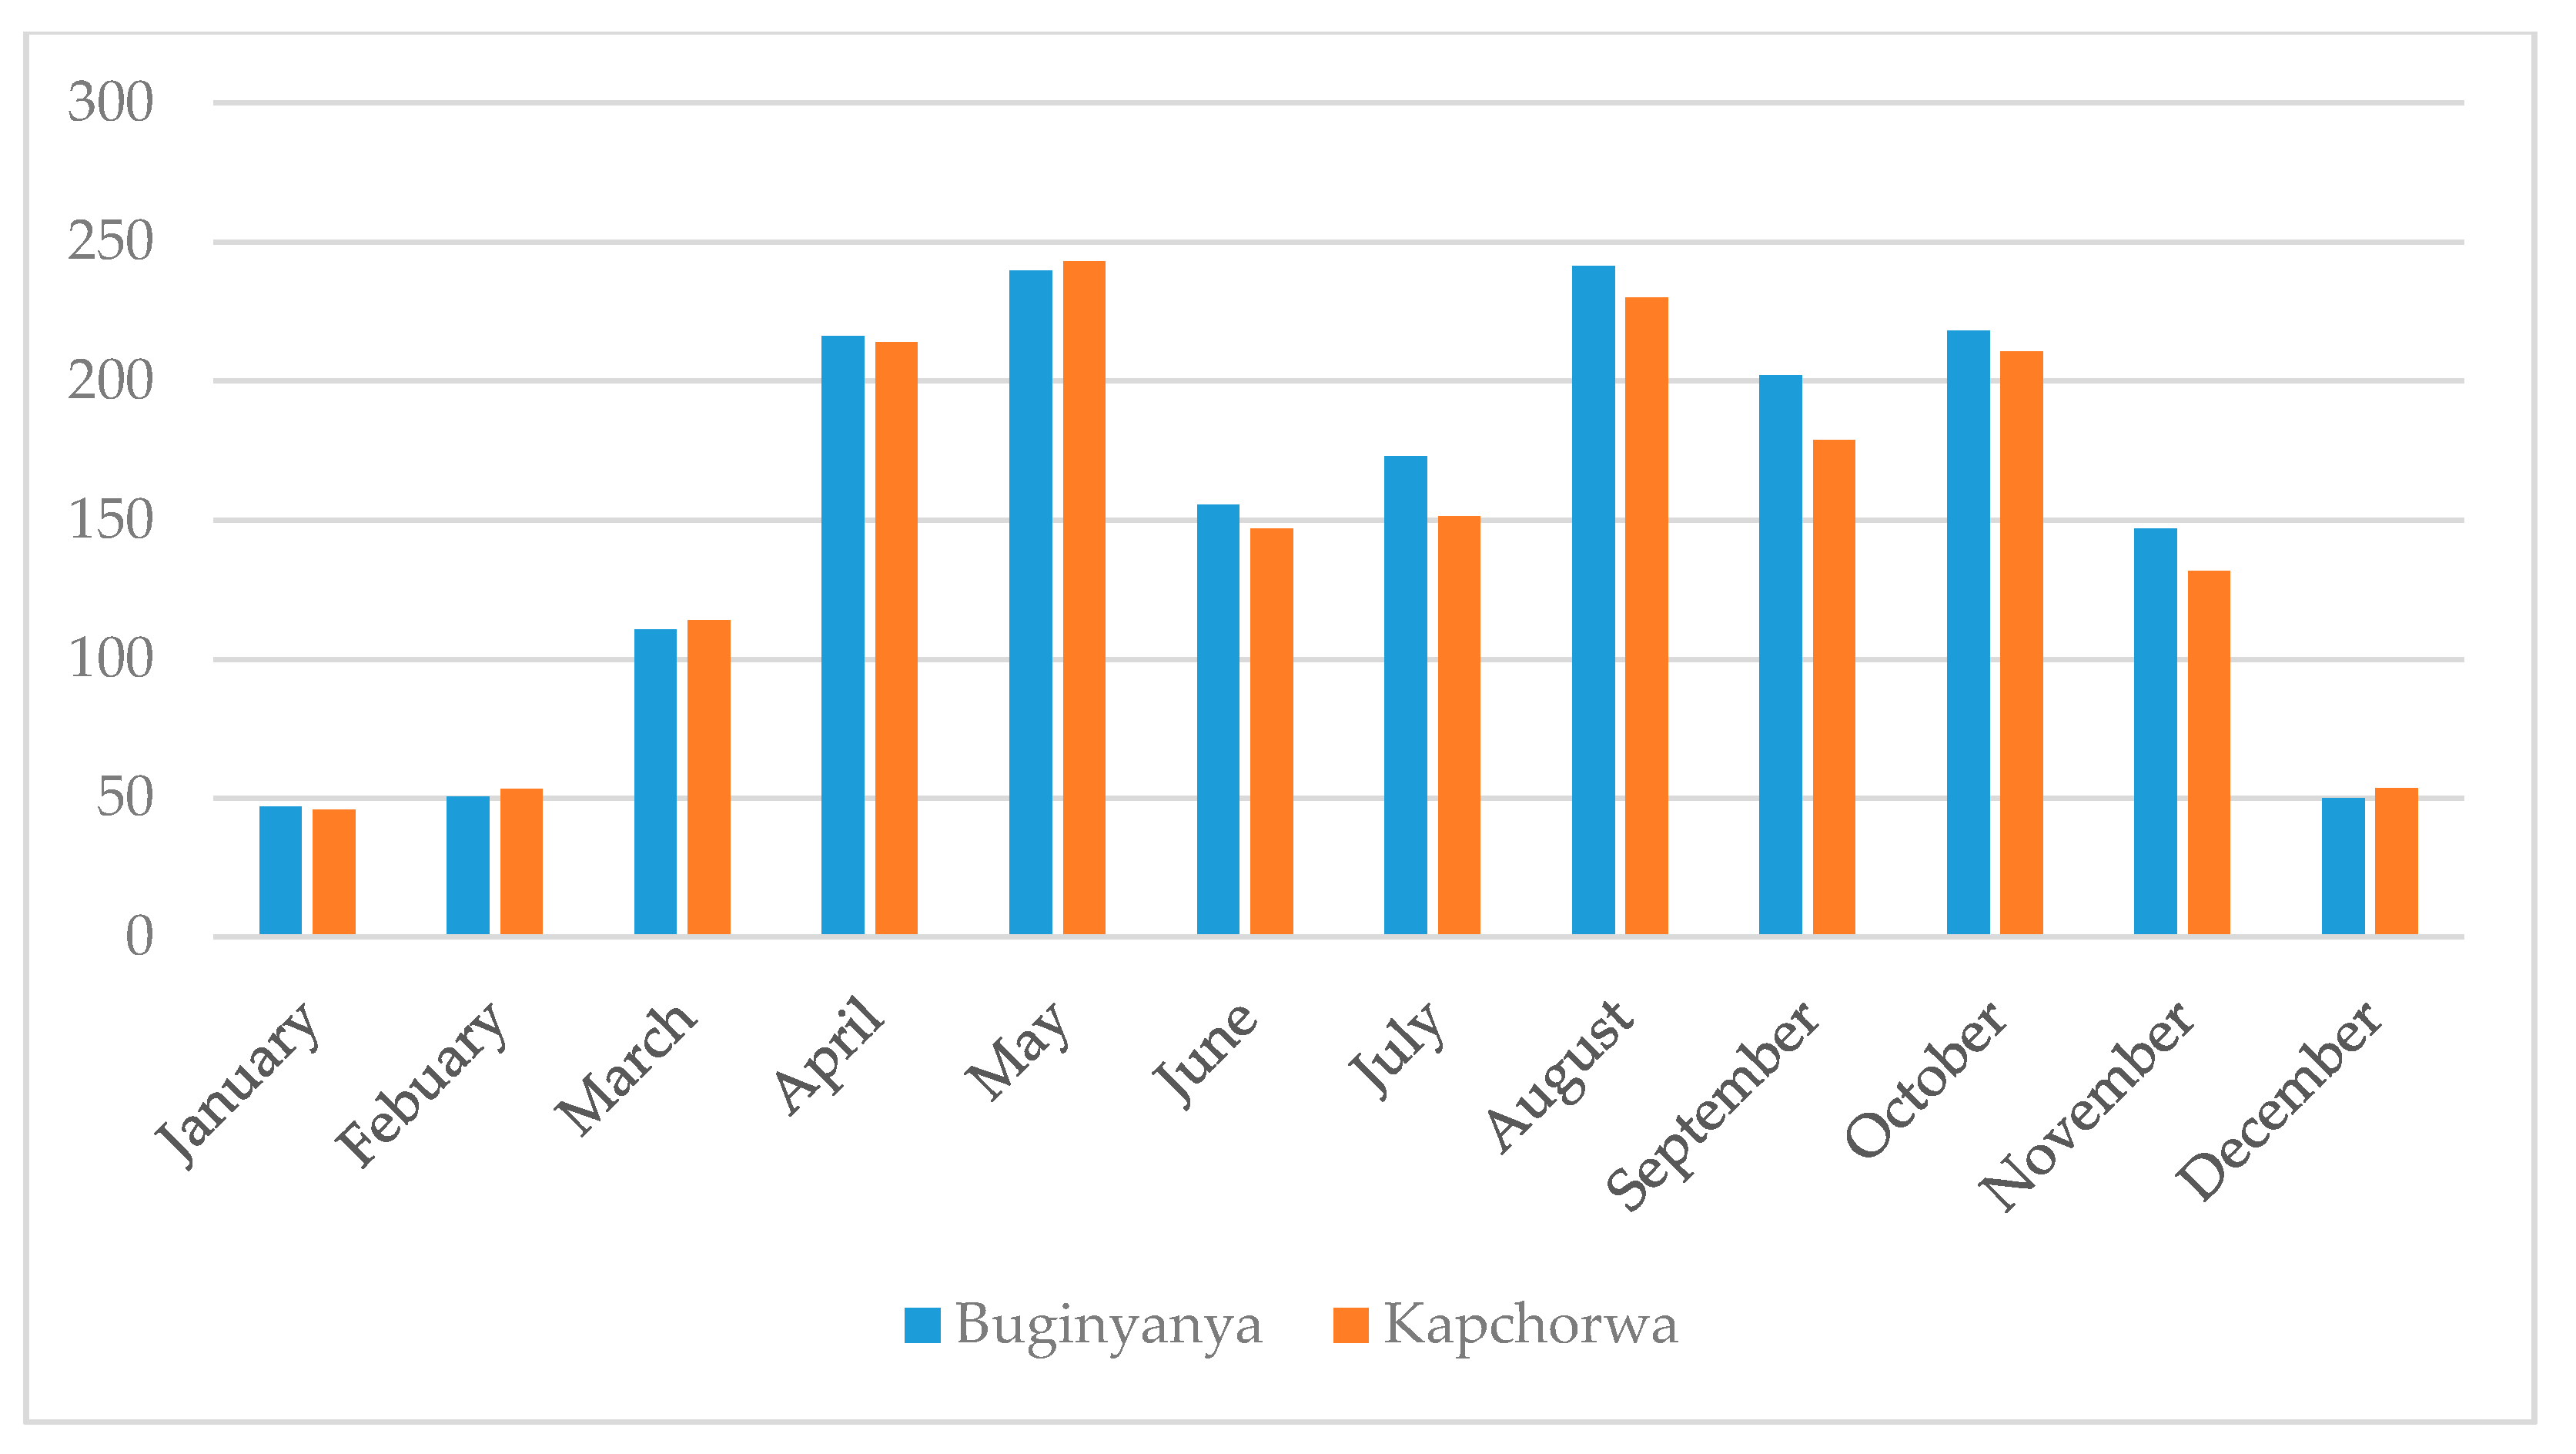
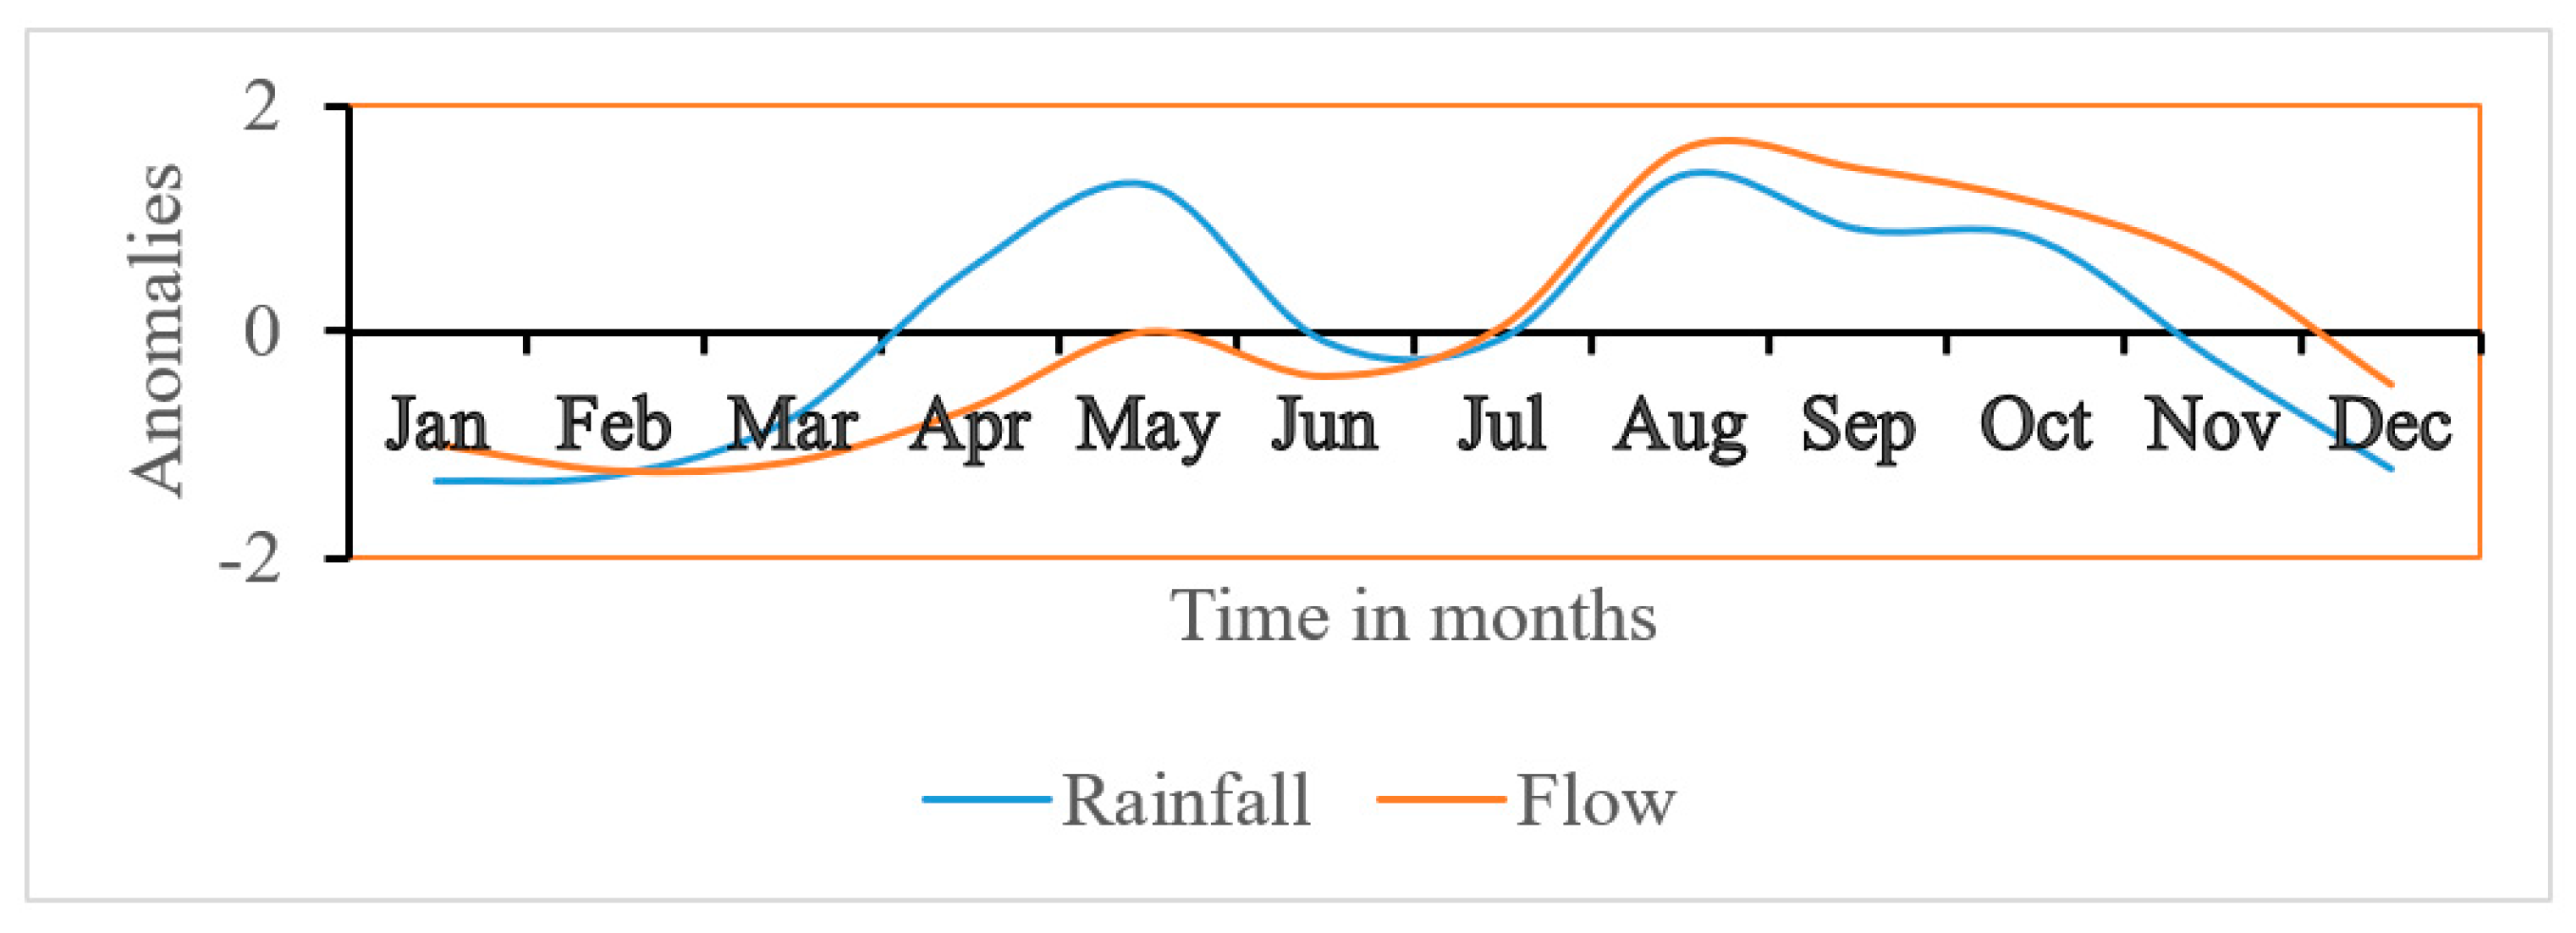
3.3. Monthly and Annual Patterns of Rainfall and River Flow
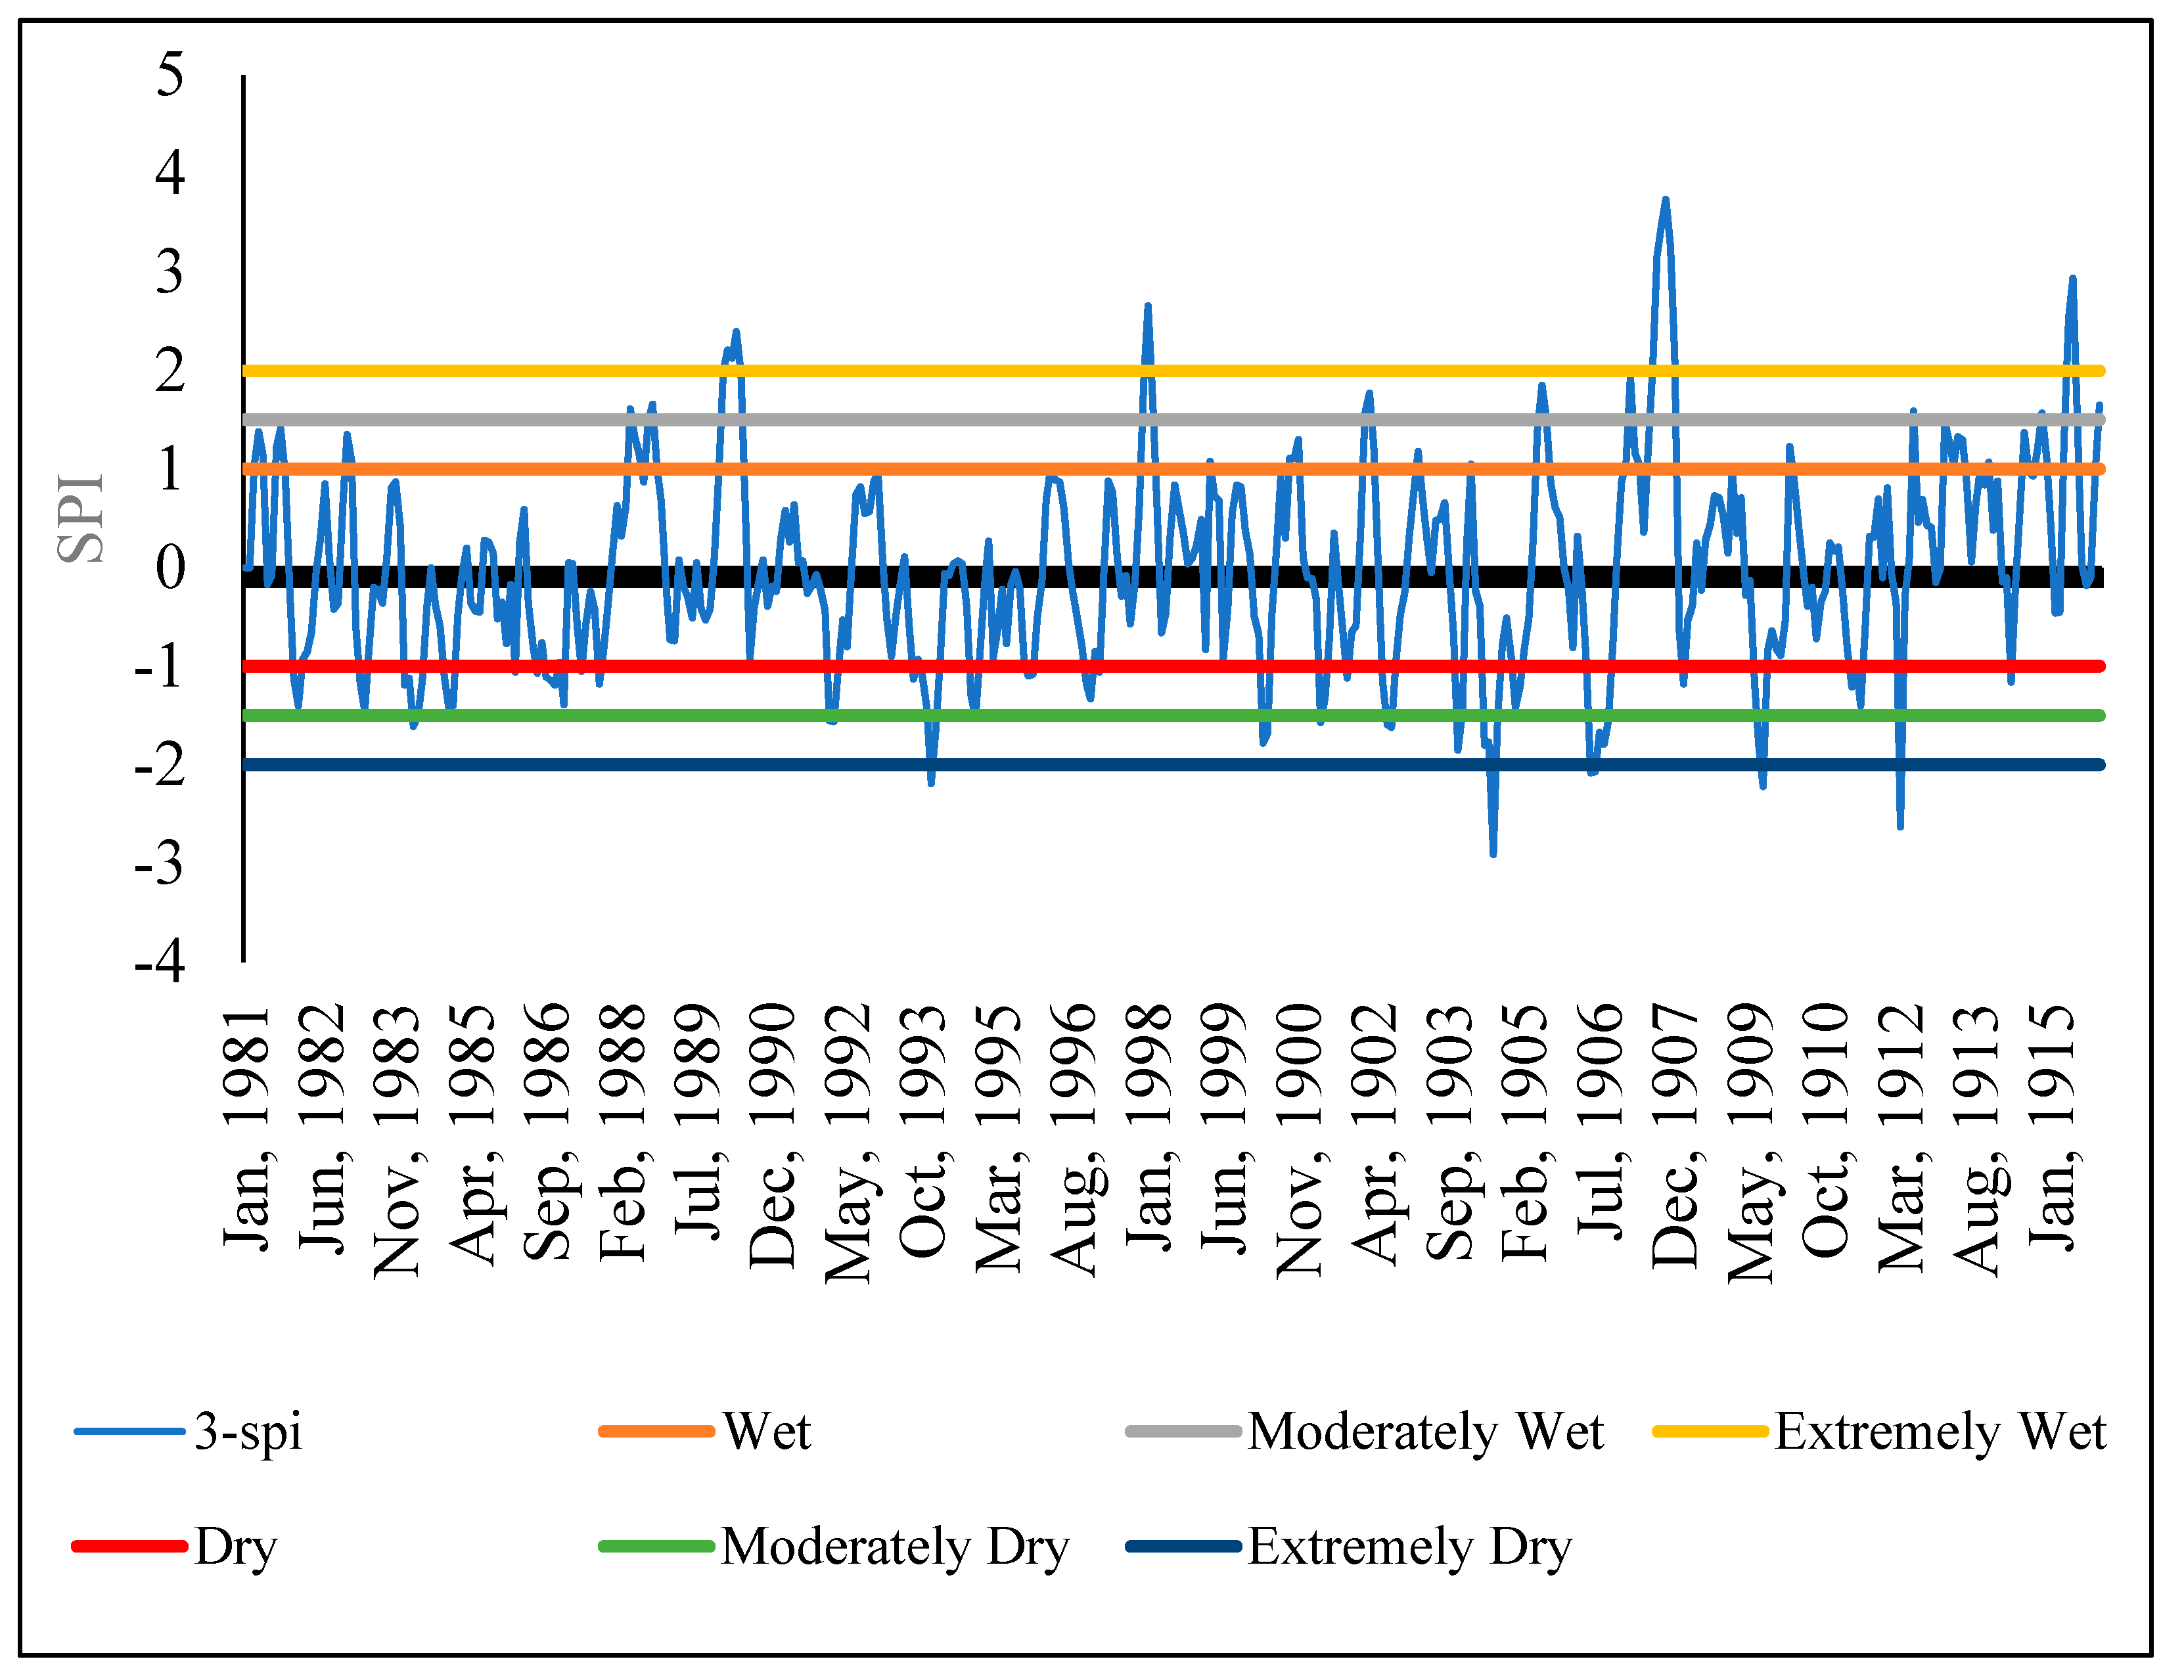
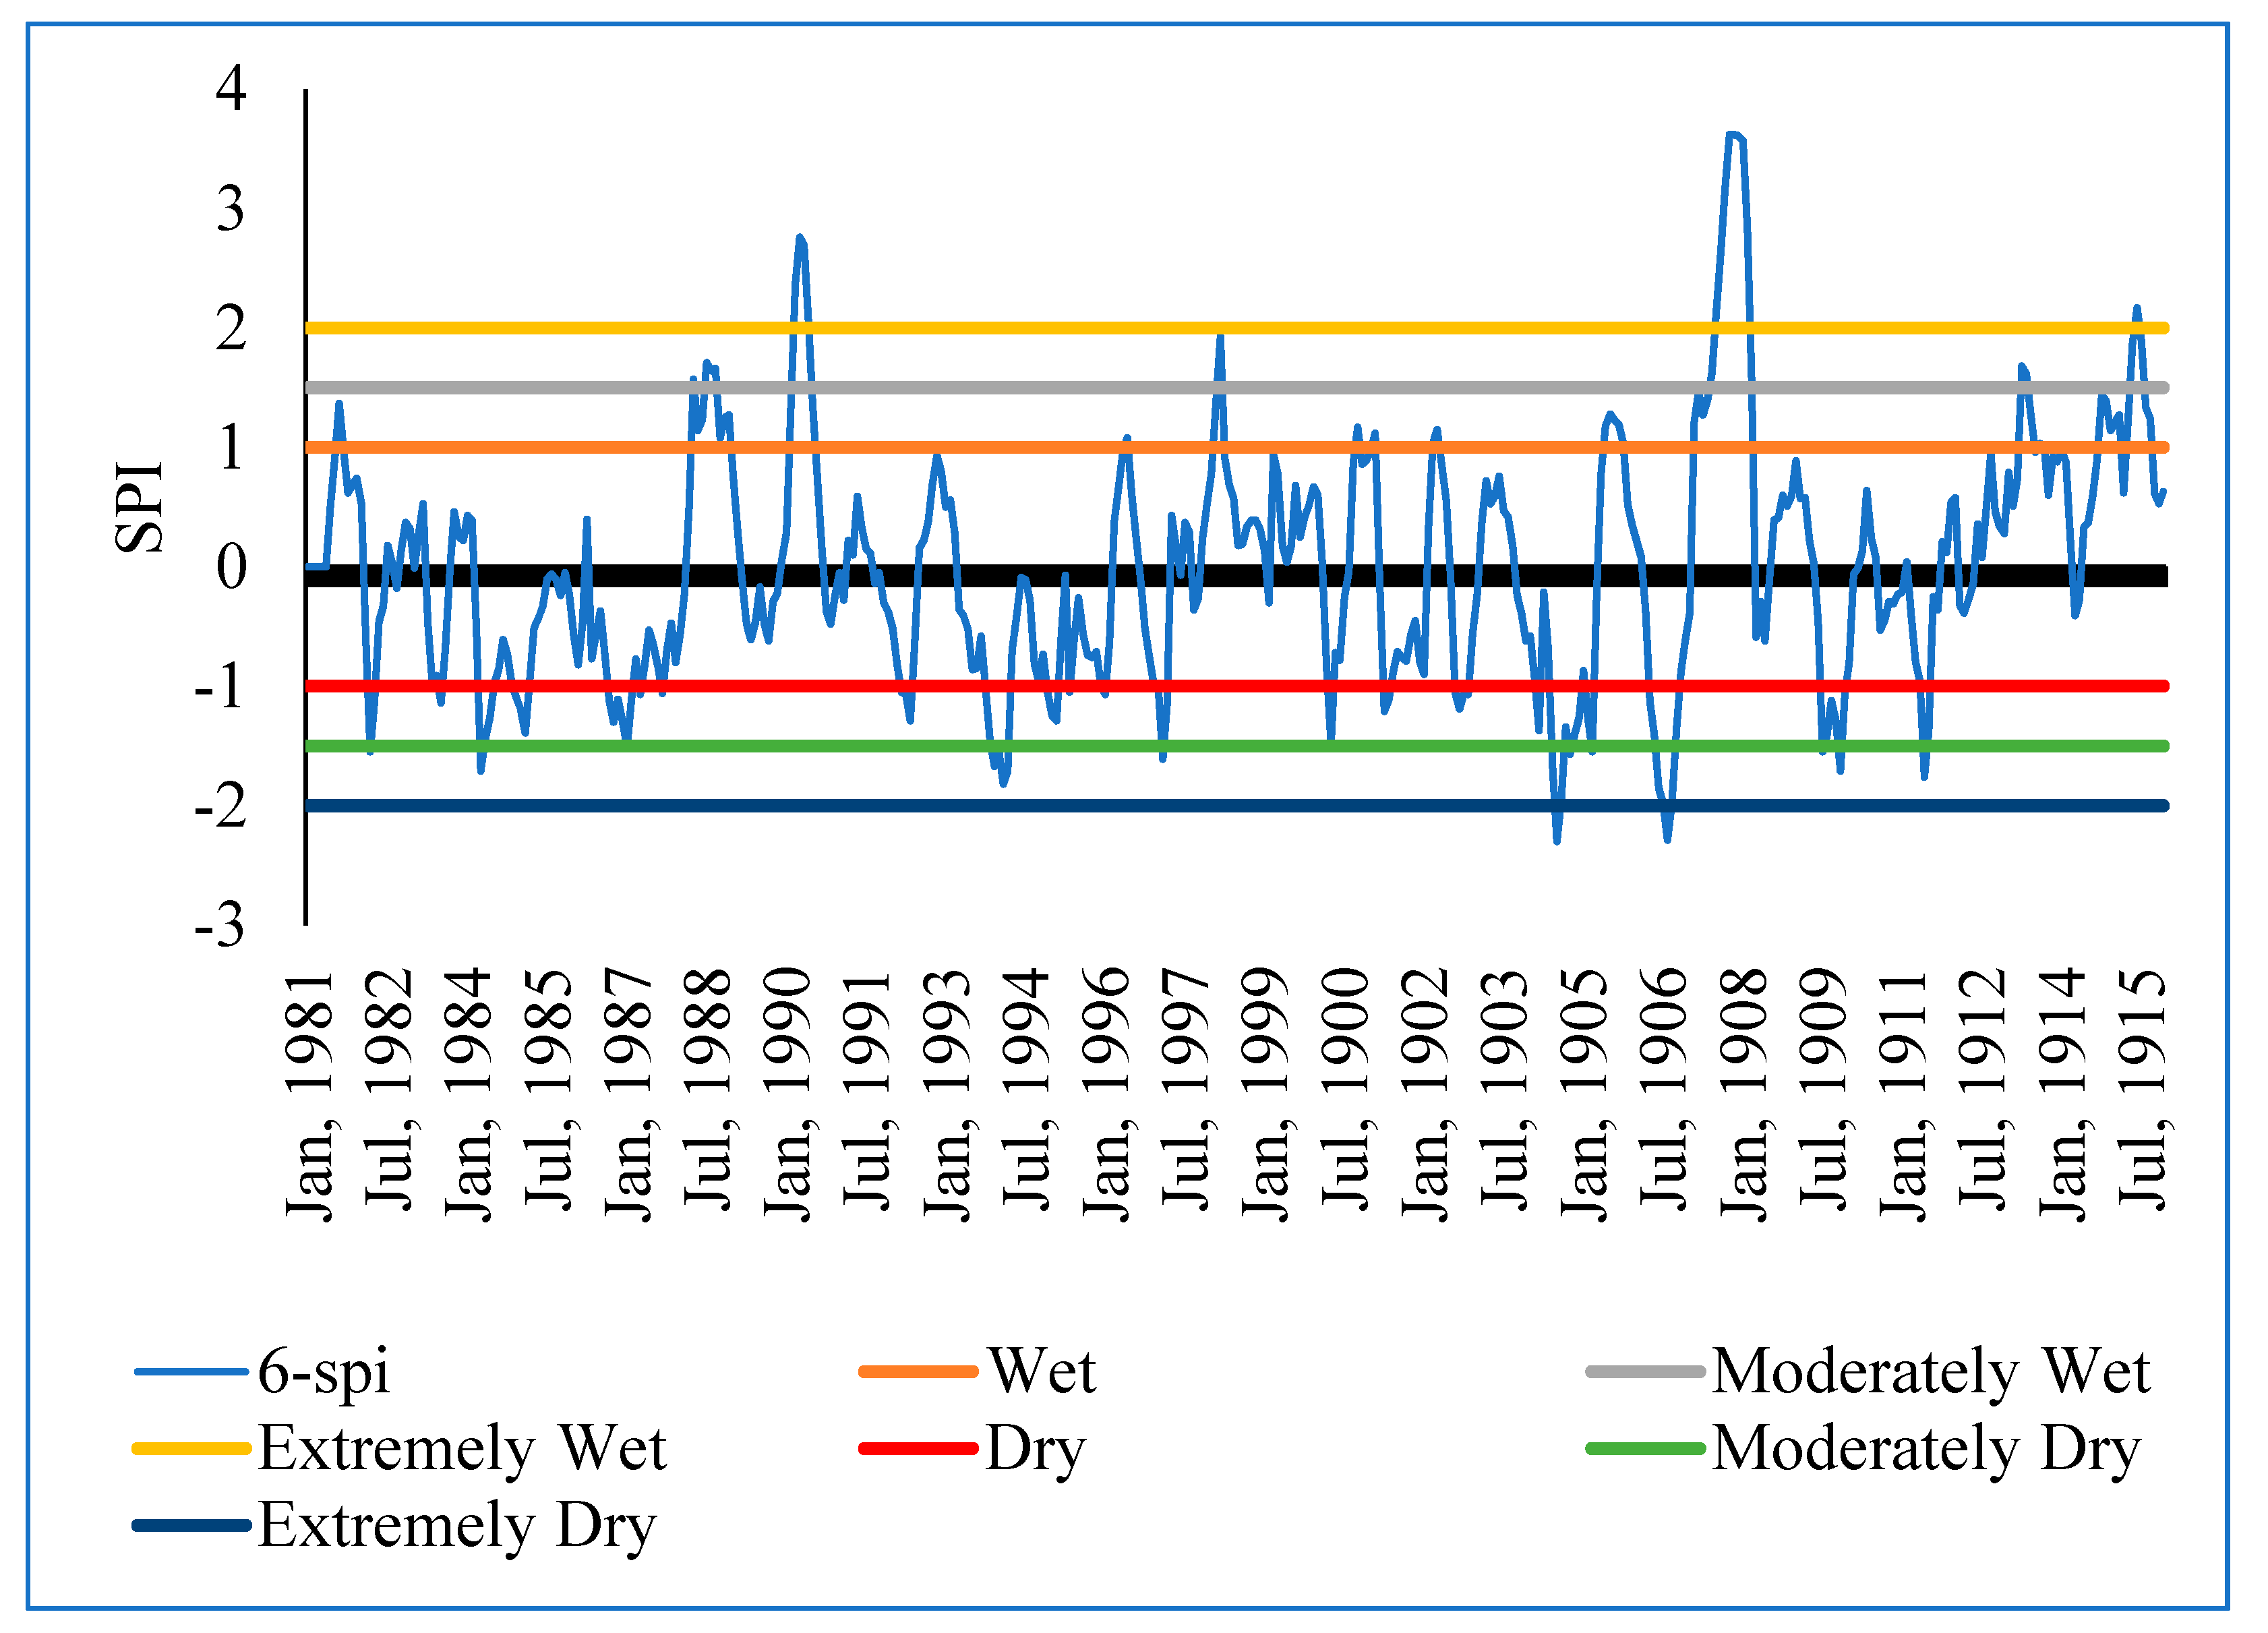
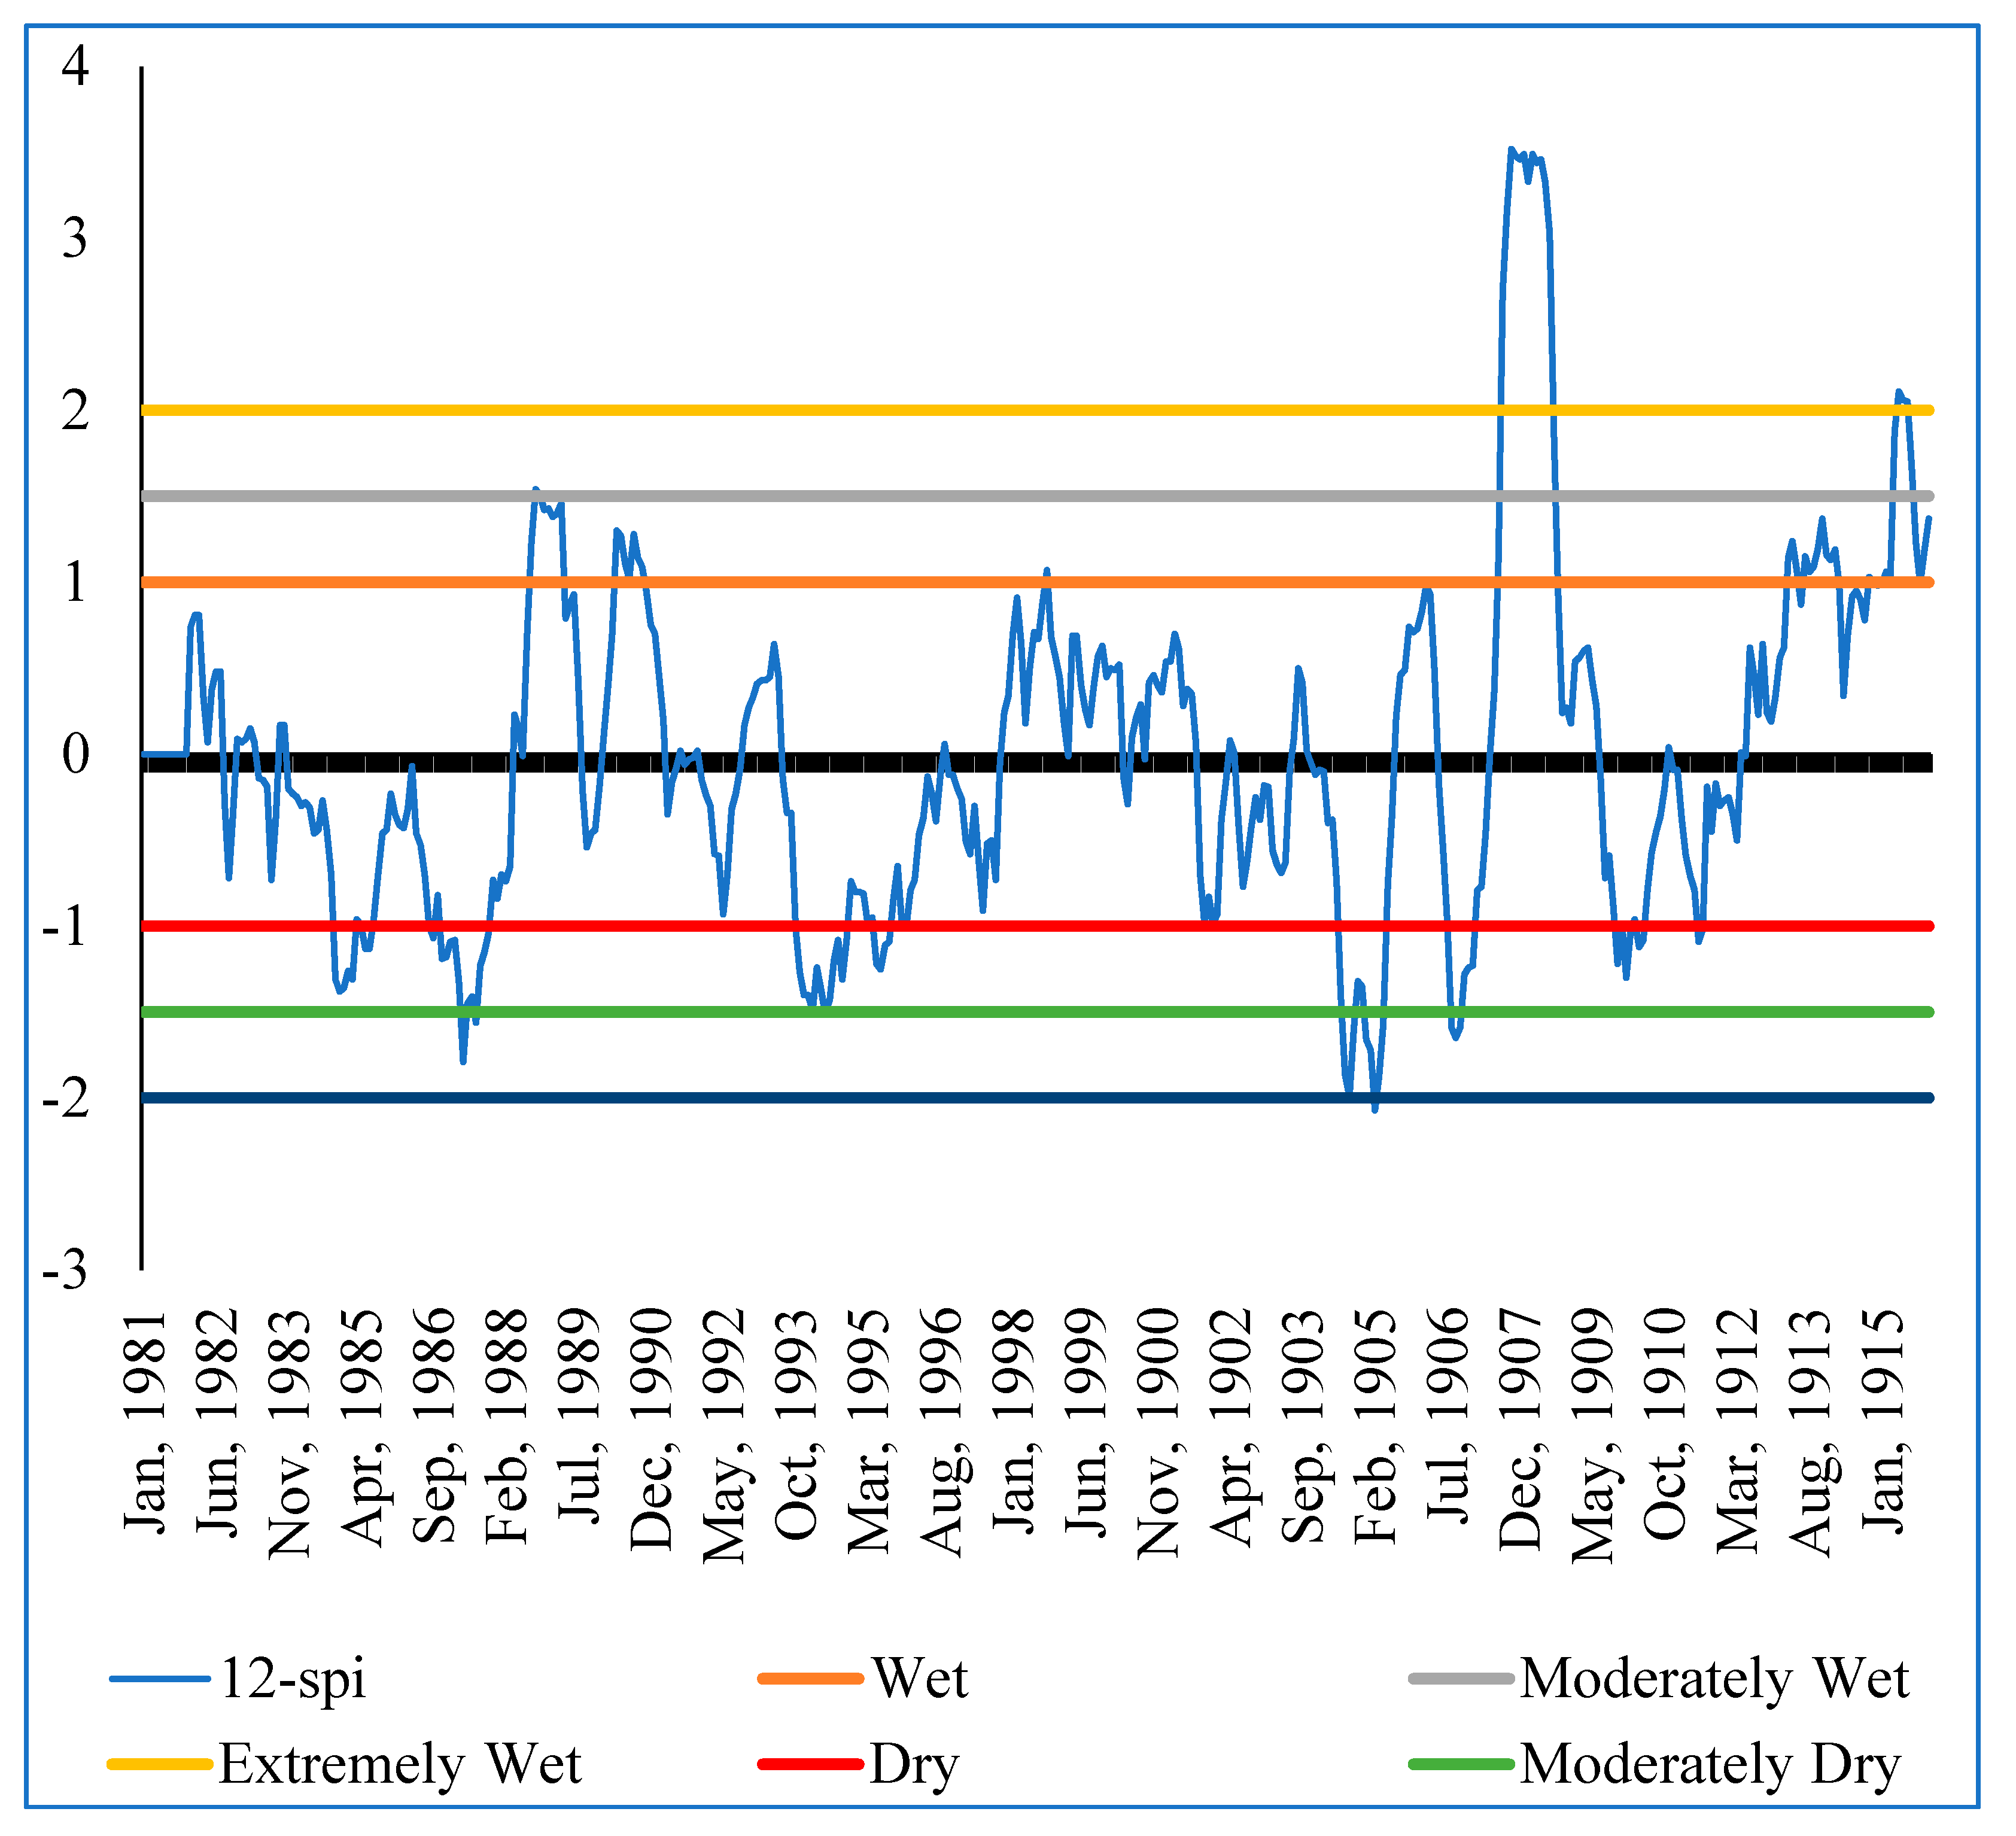
3.4. Frequency of Extremely Wet and Dry Events in Sipi Sub-Catchment
3.5. Seasonal and Annual Trends
4. Discussion
4.1. Conclusions
4.2. Limitations
Author Contributions
Funding
Data Availability Statement
Acknowledgments
Conflicts of Interest
References
- Langat, P.; Kumar, L.; Koech, R. Temporal Variability and Trends of Rainfall and Streamflow in Tana River Basin, Kenya. Sustainability 2017, 9, 1963. [Google Scholar] [CrossRef] [Green Version]
- Guo, H.D.; Zhang, L.; Zhu, L.W. Earth observation big data for climate change research. Adv. Clim. Chang. Res. 2015, 6, 108–117. [Google Scholar] [CrossRef]
- Poortinga, A.; Bastiaanssen, W.; Simons, G.; Saah, D.; Senay, G.; Fenn, M.; Bean, B.; Kadyszewski, J. A self-calibrating runoff and streamflow remote sensing model for ungauged basins using open-access earth observation data. Remote Sens. 2017, 9, 86. [Google Scholar] [CrossRef] [Green Version]
- Marques, R.; Santos, C.A.G.; Moreira, M.; Valeriano, C.; Isabella, C.L.S. Rainfall and river flow trends using Mann—Kendall and Sen’ s slope estimator statistical tests in the Cobres River basin. Nat. Hazards 2015, 77, 1205–1221. [Google Scholar]
- Bekele, D.; Alamirew, T.; Kebede, A.; Zeleke, G.; Melese, A.M.; Bekele, D. Analysis of rainfall trend and variability for agricultural water management in Awash River Basin, Ethiopia. J. Water Clim. Chang. 2016, 8, 127–141. [Google Scholar] [CrossRef] [Green Version]
- Onyutha, C. Geospatial trends and decadal anomalies in extreme rainfall over Uganda, East Africa. Adv. Meteorol. 2016, 2016. [Google Scholar] [CrossRef] [Green Version]
- Fentaw, F.; Hailu, D.; Nigussie, A. Trend and Variability Analysis of Rainfall & Stream Flow Series at Tekeze River Basin, Ethiopia. Int. J. Sci. Eng. Res. 2017, 8, 11. [Google Scholar]
- Onyutha, C.; Willems, P. Investigation of flow-rainfall co-variation for catchments selected based on the two main sources of River Nile. Stoch. Environ. Res. Risk Assess. 2017, 32, 623–641. [Google Scholar] [CrossRef]
- Tigabu, T.B.; Hörmann, G.; Wagner, P.D.; Fohrer, N. Statistical analysis of rainfall and streamflow time series in the Lake Tana Basin, Ethiopia. J. Water Clim. Chang. 2018, 11, 258–273. [Google Scholar] [CrossRef]
- Kassian, L.M.; Tenywa, M.; Liwenga, E.T.; Dyer, K.W.; Bamutaze, Y. Implication of climate change and variability on stream flow in Iringa region, Tanzania. J. Water Clim. Chang. 2017, 8, 336–347. [Google Scholar] [CrossRef] [Green Version]
- Asfaw, A.; Simane, B.; Hassen, A.; Bantider, A. Variability and time series trend analysis of rainfall and temperature in northcentral Ethiopia: A case study in Woleka sub-basin. Weather Clim. Extrem. 2018, 19, 29–41. [Google Scholar] [CrossRef]
- Berhane, A.; Hadgu, G.; Worku, W.; Abrha, B. Trends in extreme temperature and rainfall indices in the semi-arid areas of Western Tigray, Ethiopia. Environ. Syst. Res. 2020, 9, 1–20. [Google Scholar] [CrossRef] [Green Version]
- Abbam, T.; Johnson, F.A.; Dash, J.; Padmadas, S.S. Spatiotemporal Variations in Rainfall and Temperature in Ghana over the Twentieth Century, 1900–2014. Earth Sp. Sci. 2018, 5, 120–132. [Google Scholar] [CrossRef] [Green Version]
- Gebrechorkos, S.H.; Hülsmann, S.; Bernhofer, C. Long-term trends in rainfall and temperature using high-resolution climate datasets in East Africa. Sci. Rep. 2019, 9, 1–9. [Google Scholar]
- Mwaura, F.M.; Okoboi, G. Climate variability and crop production in Uganda. J. Sustain. Dev. 2014, 7, 159–172. [Google Scholar] [CrossRef]
- Diem, J.E.; Ryan, S.J.; Hartter, J.; Palace, M.W. Satellite-based rainfall data reveal a recent drying trend in central equatorial Africa. Clim. Chang. 2014, 126, 263–272. [Google Scholar] [CrossRef]
- Mukasa, J.; Olaka, L.; Said, M.Y. Drought and households’ adaptive capacity to water scarcity in Kasali, Uganda. J. Water Clim. Chang. 2020, 11, 217–232. [Google Scholar] [CrossRef]
- Mubialiwo, A.; Onyutha, C.; Abebe, A. Historical Rainfall and Evapotranspiration Changes over Mpologoma Catchment in Uganda. Adv. Meteorol. 2020, 9, 2020. [Google Scholar] [CrossRef]
- Nsubuga, F.N.W.; Olwoch, J.M.; de Rautenbach, C.J.W.; Botai, O.J. Analysis of mid-twentieth century rainfall trends and variability over southwestern Uganda. Theor. Appl. Climatol. 2014, 115, 53–71. [Google Scholar] [CrossRef] [Green Version]
- MWE. Government of Uganda Ministry of Water and Environment Water and Environment Sector Performance Report 2019; MWE: Kampala, Uganda, 2019. [Google Scholar]
- Amoti, C.K.; Moses, O.; Harrison, N.W.; Moenga, N.J.; Edward, K.; Simon, N. The Republic of Uganda: Feasibility Study and Detailed Engineering Design for Bukedea Water Supply and Sanitation System in Bukedea District in Uganda Proposed Bukedea Gravity Flow Water Supply Sanitation System (Bukedea District in Uganda). Ministry of Water and Environment Uganda, 2015. Consultant: Harrison W. Ngirigacha. Available online: www.mwe.og.ug/sites/default/files/Bukedea%20GFS%20ESIA%20Report.pdf (accessed on 7 May 2018).
- Fodor, M.; Messerli, H. Economic and Statistical Analysis of Tourism in Uganda; The World Bank Group Washington: Washington, DC, USA, 2013. [Google Scholar]
- UBOS. National Population and Housing Census 2014; UBOS: Kampala, Uganda, 2014. [Google Scholar]
- FAO. Food and Agricultural Organization of the United Nations: Small Family Farms Country Factsheet; FAO: Kampala, Uganda, 2018; Available online: http://www.fao.org/3/i8359en/I8359EN.pdf (accessed on 7 May 2018).
- Stampone, M.; Hartter, J.; Chapman, C.; Ryan, S. Trends and variability in localized precipitation around Kibale National Park, Uganda, Africa. Res. J. Environ. Earth Sci. 2011, 3, 14–23. [Google Scholar]
- Egeru, A.; Barasa, B.; Nampijja, J.; Siya, A.; Makooma, M.T.; Majaliwa, M.G.J. Past, present and future climate trends under varied representative concentration pathways for a sub-humid region in Uganda. Climate 2019, 7, 35. [Google Scholar] [CrossRef] [Green Version]
- Hare, W. Assessment of Knowledge on Impacts of Climate Change—Contribution to the Specification of Art. 2 of the UNFCCC: Impacts on Ecosystems, Food Production, Water and Socio-Economic Systems; Wissenschaftlicher Beirat der Bundesregierung Globale Umweltveränderungen Geschäftsstelle Reichpietschufer 60–62; WBGU: Berlin, Germany, 2003. [Google Scholar]
- Salehnia, N.; Bannayan, M.; Co, T.L.; Zarrin, A.; Hoogenboom, G. Estimation of meteorological drought indices based on AgMERRA precipitation data and station-observed precipitation data. Arid Land 2017, 9, 797–809. [Google Scholar] [CrossRef] [Green Version]
- Larbi, I.; Hountondji, F.C.C.; Annor, T.; Agyare, W.A.; Gathenya, J.M.; Amuzu, J. Spatio-temporal trend analysis of rainfall and temperature extremes in the Vea catchment, Ghana. Climate 2018, 6, 87. [Google Scholar] [CrossRef] [Green Version]
- Funk, C.; Peterson, P.; Landsfeld, M.; Pedreros, D.; Verdin, J.; Shukla, S.; Husak, G.; Rowland, J.; Harrison, L.; Hoell, A.; et al. The climate hazards infrared precipitation with stations—new environmental record for monitoring extremes. Sci. Data 2015, 2, 1–21. [Google Scholar] [CrossRef] [Green Version]
- Oriangi, G. Urban Resilience to Climate Change Shocks and Stresses in Mbale Municipality in Uganda; Dept of Physical Geography and Ecosystem Science: Lund, Sweden, 2019. [Google Scholar]
- Hayes, M.; Svoboda, M.; Whilhite, D.A.; Wilhite, D.A. Monitoring drought using the standardized precipitation index. Drought a Glob. Assess. 2000, 1, 168–180. [Google Scholar]
- Nsubuga, F.N.W.; Mearns, K.F.; Adeola, A.M. Lake Sibayi variations in response to climate variability in northern KwaZulu-Natal, South Africa. Theor. Appl. Climatol. 2019, 137, 1233–1245. [Google Scholar] [CrossRef] [Green Version]
- World Meteorological Organization. Standardized Precipitation Index User Guide; Svoboda, M., Hayes, M., Wood, D., Eds.; World Meteorological Organization: Geneva, Switzerland, 2012. [Google Scholar]
- Salmi, T.; Määttä, A.; Anttila, P.; Ruoho-Airola, T.; Amnell, T. Detecting Trends of Annual Values of Atmospheric Pollutants by Mann-Kendal Test and Sen’s Slope Estimates-The Excel Template Application MAKESENS; Air Quality: Helsinki, Finland, 2002. [Google Scholar]
- Jana, C.; Alam, N.M.; Mandal, D.; Shamim, M.; Kaushal, R. Spatio-temporal rainfall trends in the twentieth century for Bundelkhand region, India. J. Water Clim. Chang. 2017, 8, 441–455. [Google Scholar] [CrossRef]
- Ndulue, E.L.; Mbajiorgu, C.C. Modeling climate and landuse change impacts on streamflow and sediment yield of an agricultural watershed using SWAT. CIGR J. 2018, 20, 15–25. [Google Scholar]
- Sen, P.K. Journal of the American Statistical Estimates of the Regression Coefficient Based on Kendall’s Tau. J. Am. Stat. Assoc. 1968, 63, 1379–1389. [Google Scholar] [CrossRef]
- Majaliwa, J.G.M.; Tenywa, M.M.; Bamanya, D.; Majugu, W.; Isabirye, P.; Nandozi, C.; Nampijja, J.; Musinguzi, P.; Nimusiima, A.; Luswata, K.C.; et al. Characterization of Historical Seasonal and Annual Rainfall and Temperature Trends in Selected Climatological Homogenous Rainfall Zones of Uganda. Glob. J. Sci. Front. Res. 2015, 15, 21. [Google Scholar]
- Bomuhangi, A.; Nabanoga, G.; Namaalwa, J.J.; Jacobson, M.G. Local communities’ perceptions of climate variability in the Mt. Elgon region, eastern Uganda. Cogent Environ. Sci. 2016, 1–16. [Google Scholar] [CrossRef]
- Chen, H.; Chen, A.; Xu, L.; Xie, L.; Qiao, H.; Lin, Q.; Cai, K. A deep learning CNN architecture applied in smart near-infrared analysis of water pollution for agricultural irrigation resources. Agric. Water Manag. 2020, 240, 106303. [Google Scholar] [CrossRef]
- Kourgialas, N.N.; Karatzas, G.P.; Koubouris, G.C. A GIS policy approach for assessing the effect of fertilizers on the quality of drinking and irrigation water and wellhead protection zones (Crete, Greece). J. Environ. Manag. 2017, 189, 150–159. [Google Scholar] [CrossRef] [PubMed]
- Benedict, H.M. Effect of Day Length and Temperature on the. J. Agric. Res. 1940, 61, 9. [Google Scholar]
- Sawan, Z.M. Climatic variables: Evaporation, sunshine, relative humidity, soil and air temperature and its adverse effects on cotton production. Inf. Process. Agric. 2018, 5, 134–148. [Google Scholar] [CrossRef]
- Wang, H.; Zhong, S.; Tao, Z.; Dai, J.; Ge, Q. Changes in flowering phenology of woody plants from 1963 to 2014 in North China. Int. J. Biometeorol. 2019, 63, 579–590. [Google Scholar] [CrossRef]
- Mubiru, D.N.; Radeny, M.; Kyazze, F.B.; Zziwa, A.; Lwasa, J.; Kinyangi, J.; Mungai, C. Climate trends, risks and coping strategies in smallholder farming systems in Uganda. Clim. Risk Manag. 2018, 22, 4–21. [Google Scholar] [CrossRef]
- Godfrey, H.; Patrick, K.; Judith, K.; Nicholas, O.D.; Lilian, N.; William, W. Predicting the Response of Insect Pests and Diseases of Arabica Coffee to Climate Change along an Altitudinal Gradient in Mt. Elgon Region, Uganda. J. Agric. Environ. Sci. 2018, 7, 2334–2412. [Google Scholar]
- MDA Information Systemsm LLC. A Modernization Plan for Uganda’s Meteorological Services; Global Facility for Disaster Reduction and Recovery (GFDRR): Kampala, Uganda, 2013. [Google Scholar]


| Climate Data | Altitude (m.a.s.l.) | Longitude (Degrees) | Latitude (Degrees) |
|---|---|---|---|
| Buginyanya | 1845 | 34.37 | 1.28 |
| Kapchorwa | 1920 | 34.45 | 1.40 |
| Sipi River gauge | 1075 | 34.15 | 1.14 |
| Extremely Wet | 2.00 and Above |
|---|---|
| Very wet | 1.5 to 1.99 |
| Moderately wet | 1.00 to 1.49 |
| Normal | −0.99 to 0.99 |
| Moderately dry | −1.00 to −1.49 |
| Very dry | −1.50 to −1.99 |
| Extremely dry | −2.00 and below |
| MAM | ASON | ||||||
|---|---|---|---|---|---|---|---|
| Variables | Mean | SD | CV | Mean | SD | CV (%) | |
| Buginyanya | Mean rainfall (mm) | 188.87 | 46.84 | 24.8 | 202.08 | 76.1 | 37.66 |
| T minimum (°C) | 16.2 | 0.48 | 2.94 | 15.51 | 0.53 | 3.42 | |
| T maximum (°C) | 28.38 | 0.84 | 2.96 | 27.47 | 0.94 | 3.42 | |
| T mean (°C) | 22.29 | 0.58 | 2.58 | 21.49 | 0.67 | 3.12 | |
| Kapchorwa | Mean rainfall (mm) | 190.28 | 49.74 | 26.14 | 187.8 | 70.19 | 37.37 |
| T minimum (°C) | 15.52 | 0.61 | 3.96 | 14.99 | 0.59 | 3.94 | |
| T maximum (°C) | 28.14 | 0.93 | 3.32 | 27.17 | 0.98 | 3.61 | |
| T mean (°C) | 21.83 | 0.7 | 3.19 | 21.08 | 0.72 | 3.42 | |
| Sub-catchment | Mean rainfall (mm) | 189.58 | 47.61 | 25.11 | 194.94 | 72.85 | 37.37 |
| T minimum (°C) | 15.86 | 0.53 | 3.36 | 15.25 | 0.55 | 3.59 | |
| T maximum (°C) | 28.26 | 0.87 | 3.09 | 27.32 | 0.95 | 3.48 | |
| T mean (°C) | 22.06 | 0.62 | 2.82 | 21.28 | 0.69 | 3.22 | |
| Variables | Buginyanya | Kapchorwa | Sub-Catchment | ||||||
|---|---|---|---|---|---|---|---|---|---|
| Mean | SD | CV (%) | Mean | SD | CV | Mean | SD | CV (%) | |
| Rainfall (mm) | 1851.57 | 466.1 | 25.17 | 1773.04 | 444.35 | 25.06 | 1812.3 | 451.56 | 24.92 |
| T min (°C) | 15.73 | 0.47 | 3.01 | 15.12 | 0.58 | 3.83 | 15.43 | 0.52 | 3.34 |
| T max (°C) | 28.07 | 0.85 | 3.02 | 27.78 | 0.9 | 3.25 | 27.92 | 0.87 | 3.1 |
| T mean (°C) | 21.9 | 0.6 | 2.75 | 21.45 | 0.68 | 3.18 | 21.67 | 0.63 | 2.92 |
| Flow (m3/s) | 2.36 | 1.08 | 45.66 | ||||||
| Frequency | Frequency | |||
|---|---|---|---|---|
| %SPI | Extremely Wet | Extremely Dry | Extreme Events Pre-2000 | Extreme Events Post-2000s |
| 3 Months | 4 | 5 | 3 | 6 |
| 6 Months | 3 | 2 | 2 | 4 |
| 12 Months | 2 | 2 | 0 | 4 |
| Seasonal Trends | Buginyanya | Kapchorwa | Sub-Catchment | |||
|---|---|---|---|---|---|---|
| Z | Q | Z | Q | Z | Q | |
| MAM rainfall (mm) | 0.36 | 0.27 | 0.77 | 0.7 | 0.71 | 3.41 |
| MAM T minimum (°C) | 1.59 | 0.02 | 2.30 * | 0.02 | 1.87 | 0.02 |
| MAM T maximum (°C) | 0.34 | 0.01 | 1.08 | 0.01 | 0.68 | 0.01 |
| MAM T mean (°C) | 1.33 | 0.01 | 1.93 | 0.02 | 1.45 | 0.01 |
| MAM Flow (m3/S) | 2.50 * | 0.08 | ||||
| ASON rainfall (mm) | 1.48 | 1.25 | 1.85 | 1.78 | 1.78 | 1.57 |
| ASON T minimum (°C) | 4.09 *** | 0.02 | 4.43 *** | 0.04 | 4.29 *** | 0.04 |
| ASON T maximum (°C) | 1.33 | 0.04 | 1.56 | 0.03 | 1.28 | 0.03 |
| ASON T mean (°C) | 2.47 * | 0.03 | 2.76 ** | 0.04 | 2.64 ** | 0.03 |
| ASON Flow (m3/S) | 1.52 | 0.17 | ||||
| Annual trends | ||||||
| Rainfall (mm) | 1.05 | 8.68 | 1.65 | 9.46 | 1.52 | 18.32 |
| T minimum (°C) | 3.72 *** | 0.03 | 3.95 *** | 0.04 | 4.12 *** | 0.03 |
| T maximum (°C) | 1.51 | 0.02 | 1.42 | 0.02 | 1.39 | 0.02 |
| T mean (°C) | 3.01 | 0.02 | 2.84 | 0.03 | 2.9 | 0.03 |
| Flow (m3/S) | 2.50 * | 0.10 | ||||
Publisher’s Note: MDPI stays neutral with regard to jurisdictional claims in published maps and institutional affiliations. |
© 2021 by the authors. Licensee MDPI, Basel, Switzerland. This article is an open access article distributed under the terms and conditions of the Creative Commons Attribution (CC BY) license (https://creativecommons.org/licenses/by/4.0/).
Share and Cite
Kilama Luwa, J.; Majaliwa, J.-G.M.; Bamutaze, Y.; Kabenge, I.; Pilesjo, P.; Oriangi, G.; Bagula Mukengere, E. Variabilities and Trends of Rainfall, Temperature, and River Flow in Sipi Sub-Catchment on the Slopes of Mt. Elgon, Uganda. Water 2021, 13, 1834. https://doi.org/10.3390/w13131834
Kilama Luwa J, Majaliwa J-GM, Bamutaze Y, Kabenge I, Pilesjo P, Oriangi G, Bagula Mukengere E. Variabilities and Trends of Rainfall, Temperature, and River Flow in Sipi Sub-Catchment on the Slopes of Mt. Elgon, Uganda. Water. 2021; 13(13):1834. https://doi.org/10.3390/w13131834
Chicago/Turabian StyleKilama Luwa, Justine, Jackson-Gilbert Mwanjalolo Majaliwa, Yazidhi Bamutaze, Isa Kabenge, Petter Pilesjo, George Oriangi, and Espoir Bagula Mukengere. 2021. "Variabilities and Trends of Rainfall, Temperature, and River Flow in Sipi Sub-Catchment on the Slopes of Mt. Elgon, Uganda" Water 13, no. 13: 1834. https://doi.org/10.3390/w13131834
APA StyleKilama Luwa, J., Majaliwa, J.-G. M., Bamutaze, Y., Kabenge, I., Pilesjo, P., Oriangi, G., & Bagula Mukengere, E. (2021). Variabilities and Trends of Rainfall, Temperature, and River Flow in Sipi Sub-Catchment on the Slopes of Mt. Elgon, Uganda. Water, 13(13), 1834. https://doi.org/10.3390/w13131834