
Determining Freshwater Lake Communities’ Vulnerability to Snowstorms in the Northwest Territories

 , ,
, ,
Abstract
:1. Introduction
2. Data and Methodology
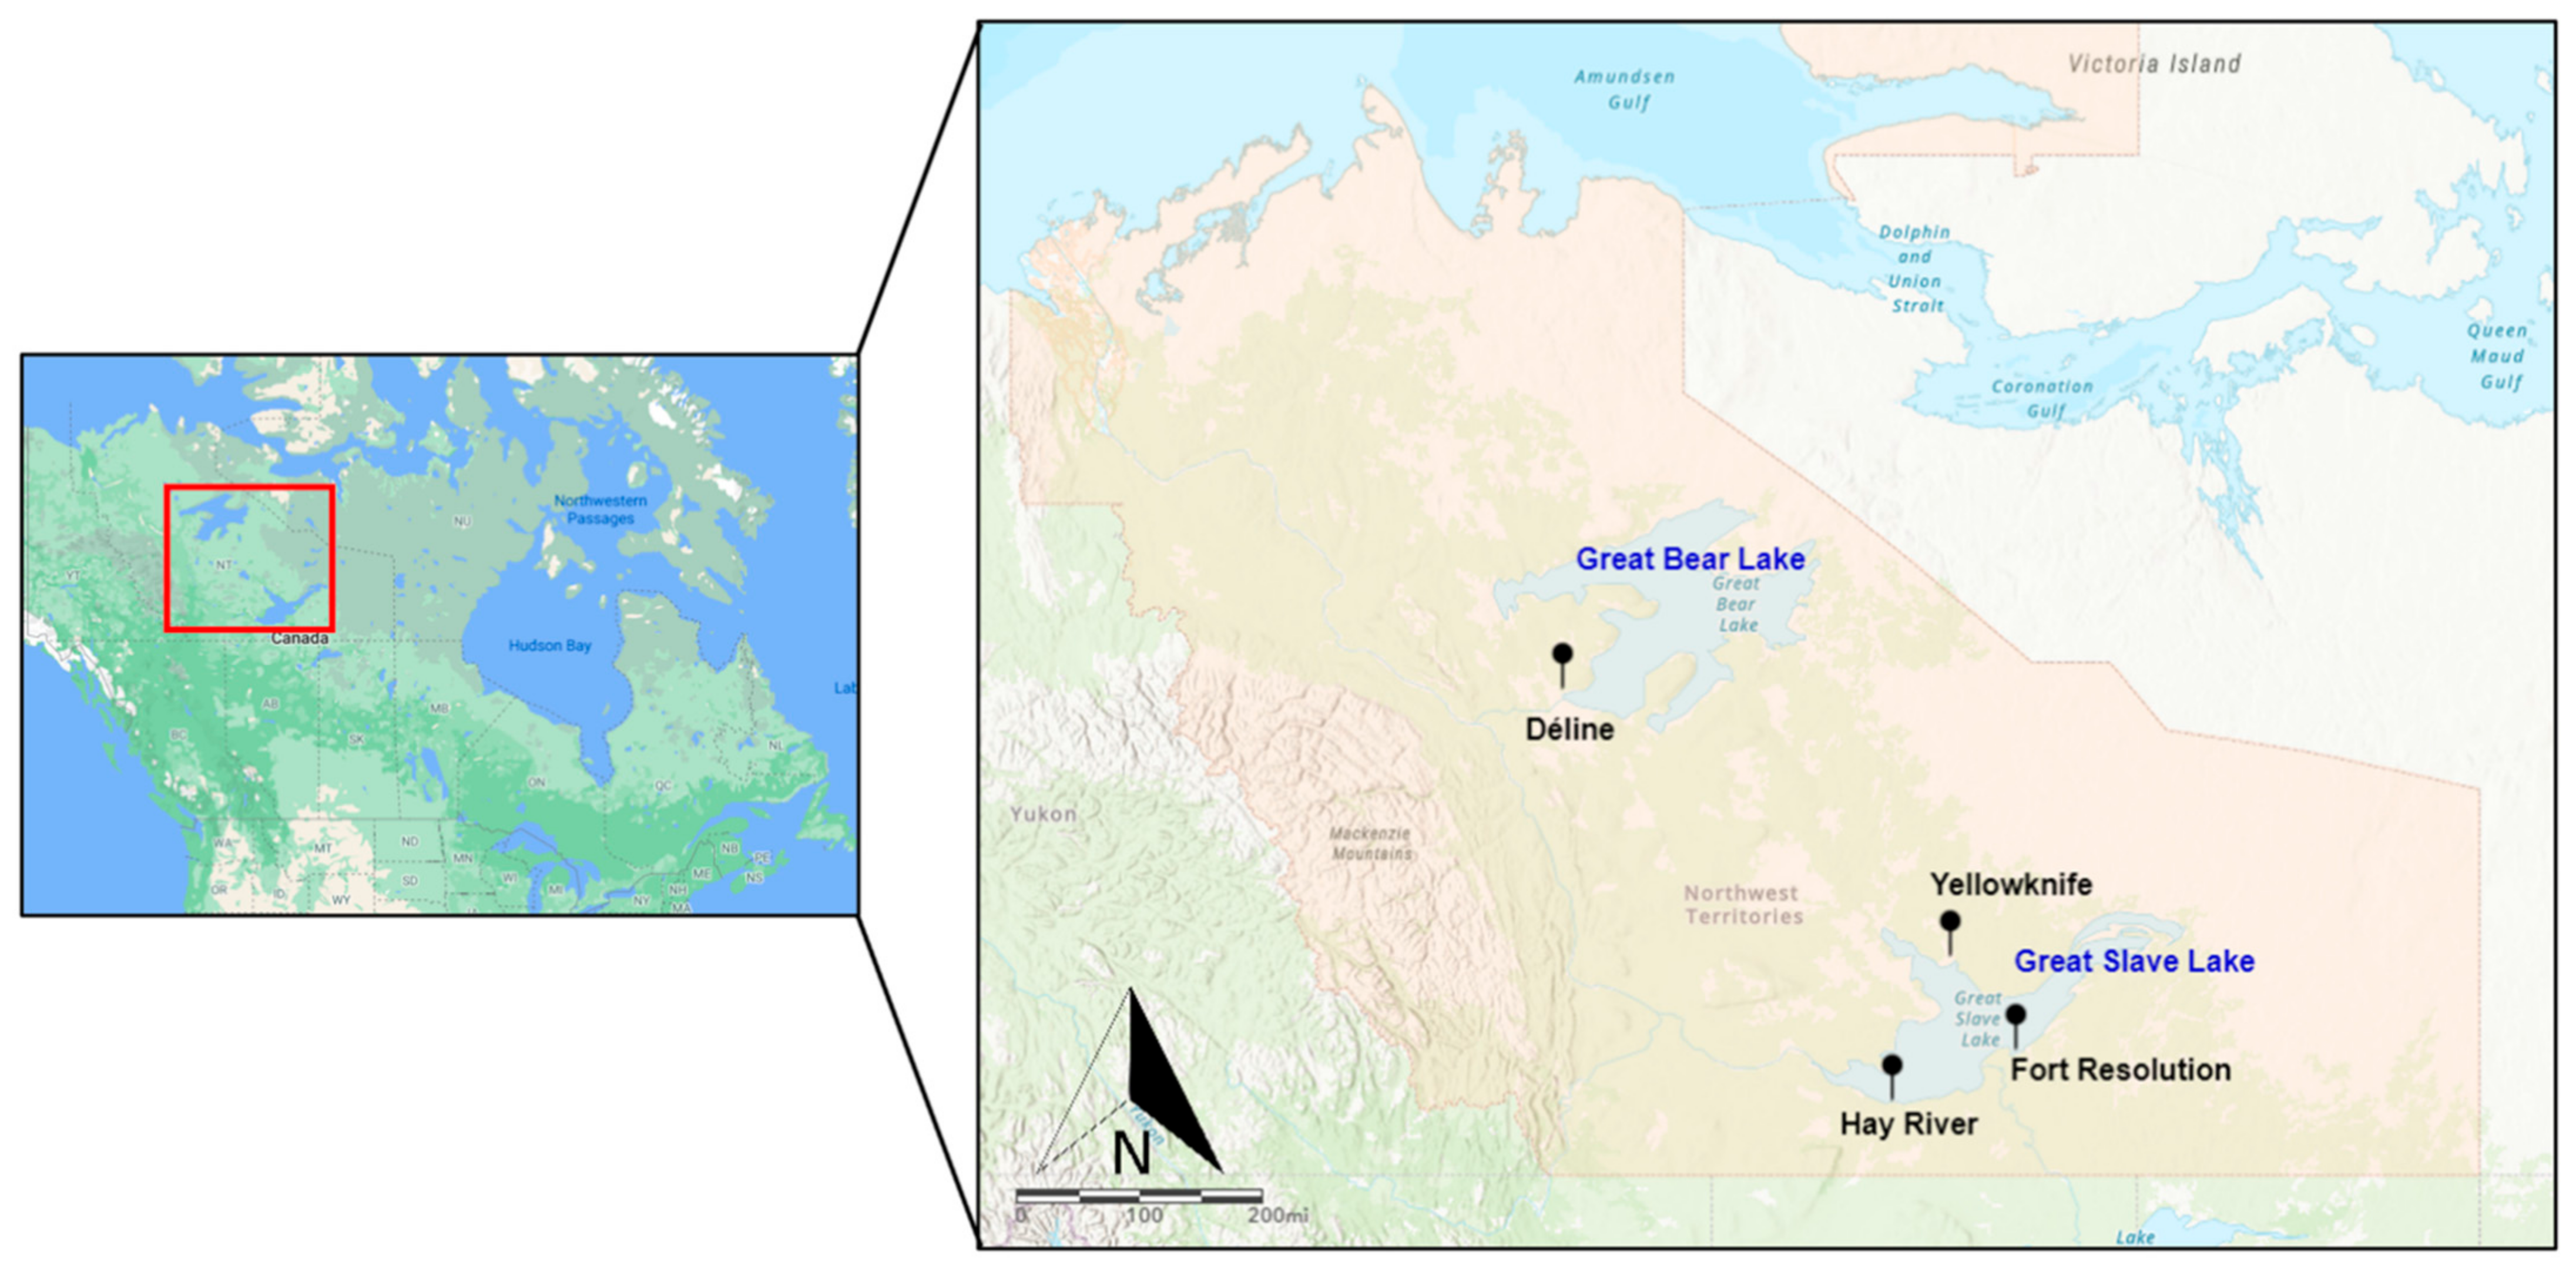
2.1. Selection of Communities and Their Livelihoods
2.2. Data Sources
2.3. Calculating the Contributing Factors
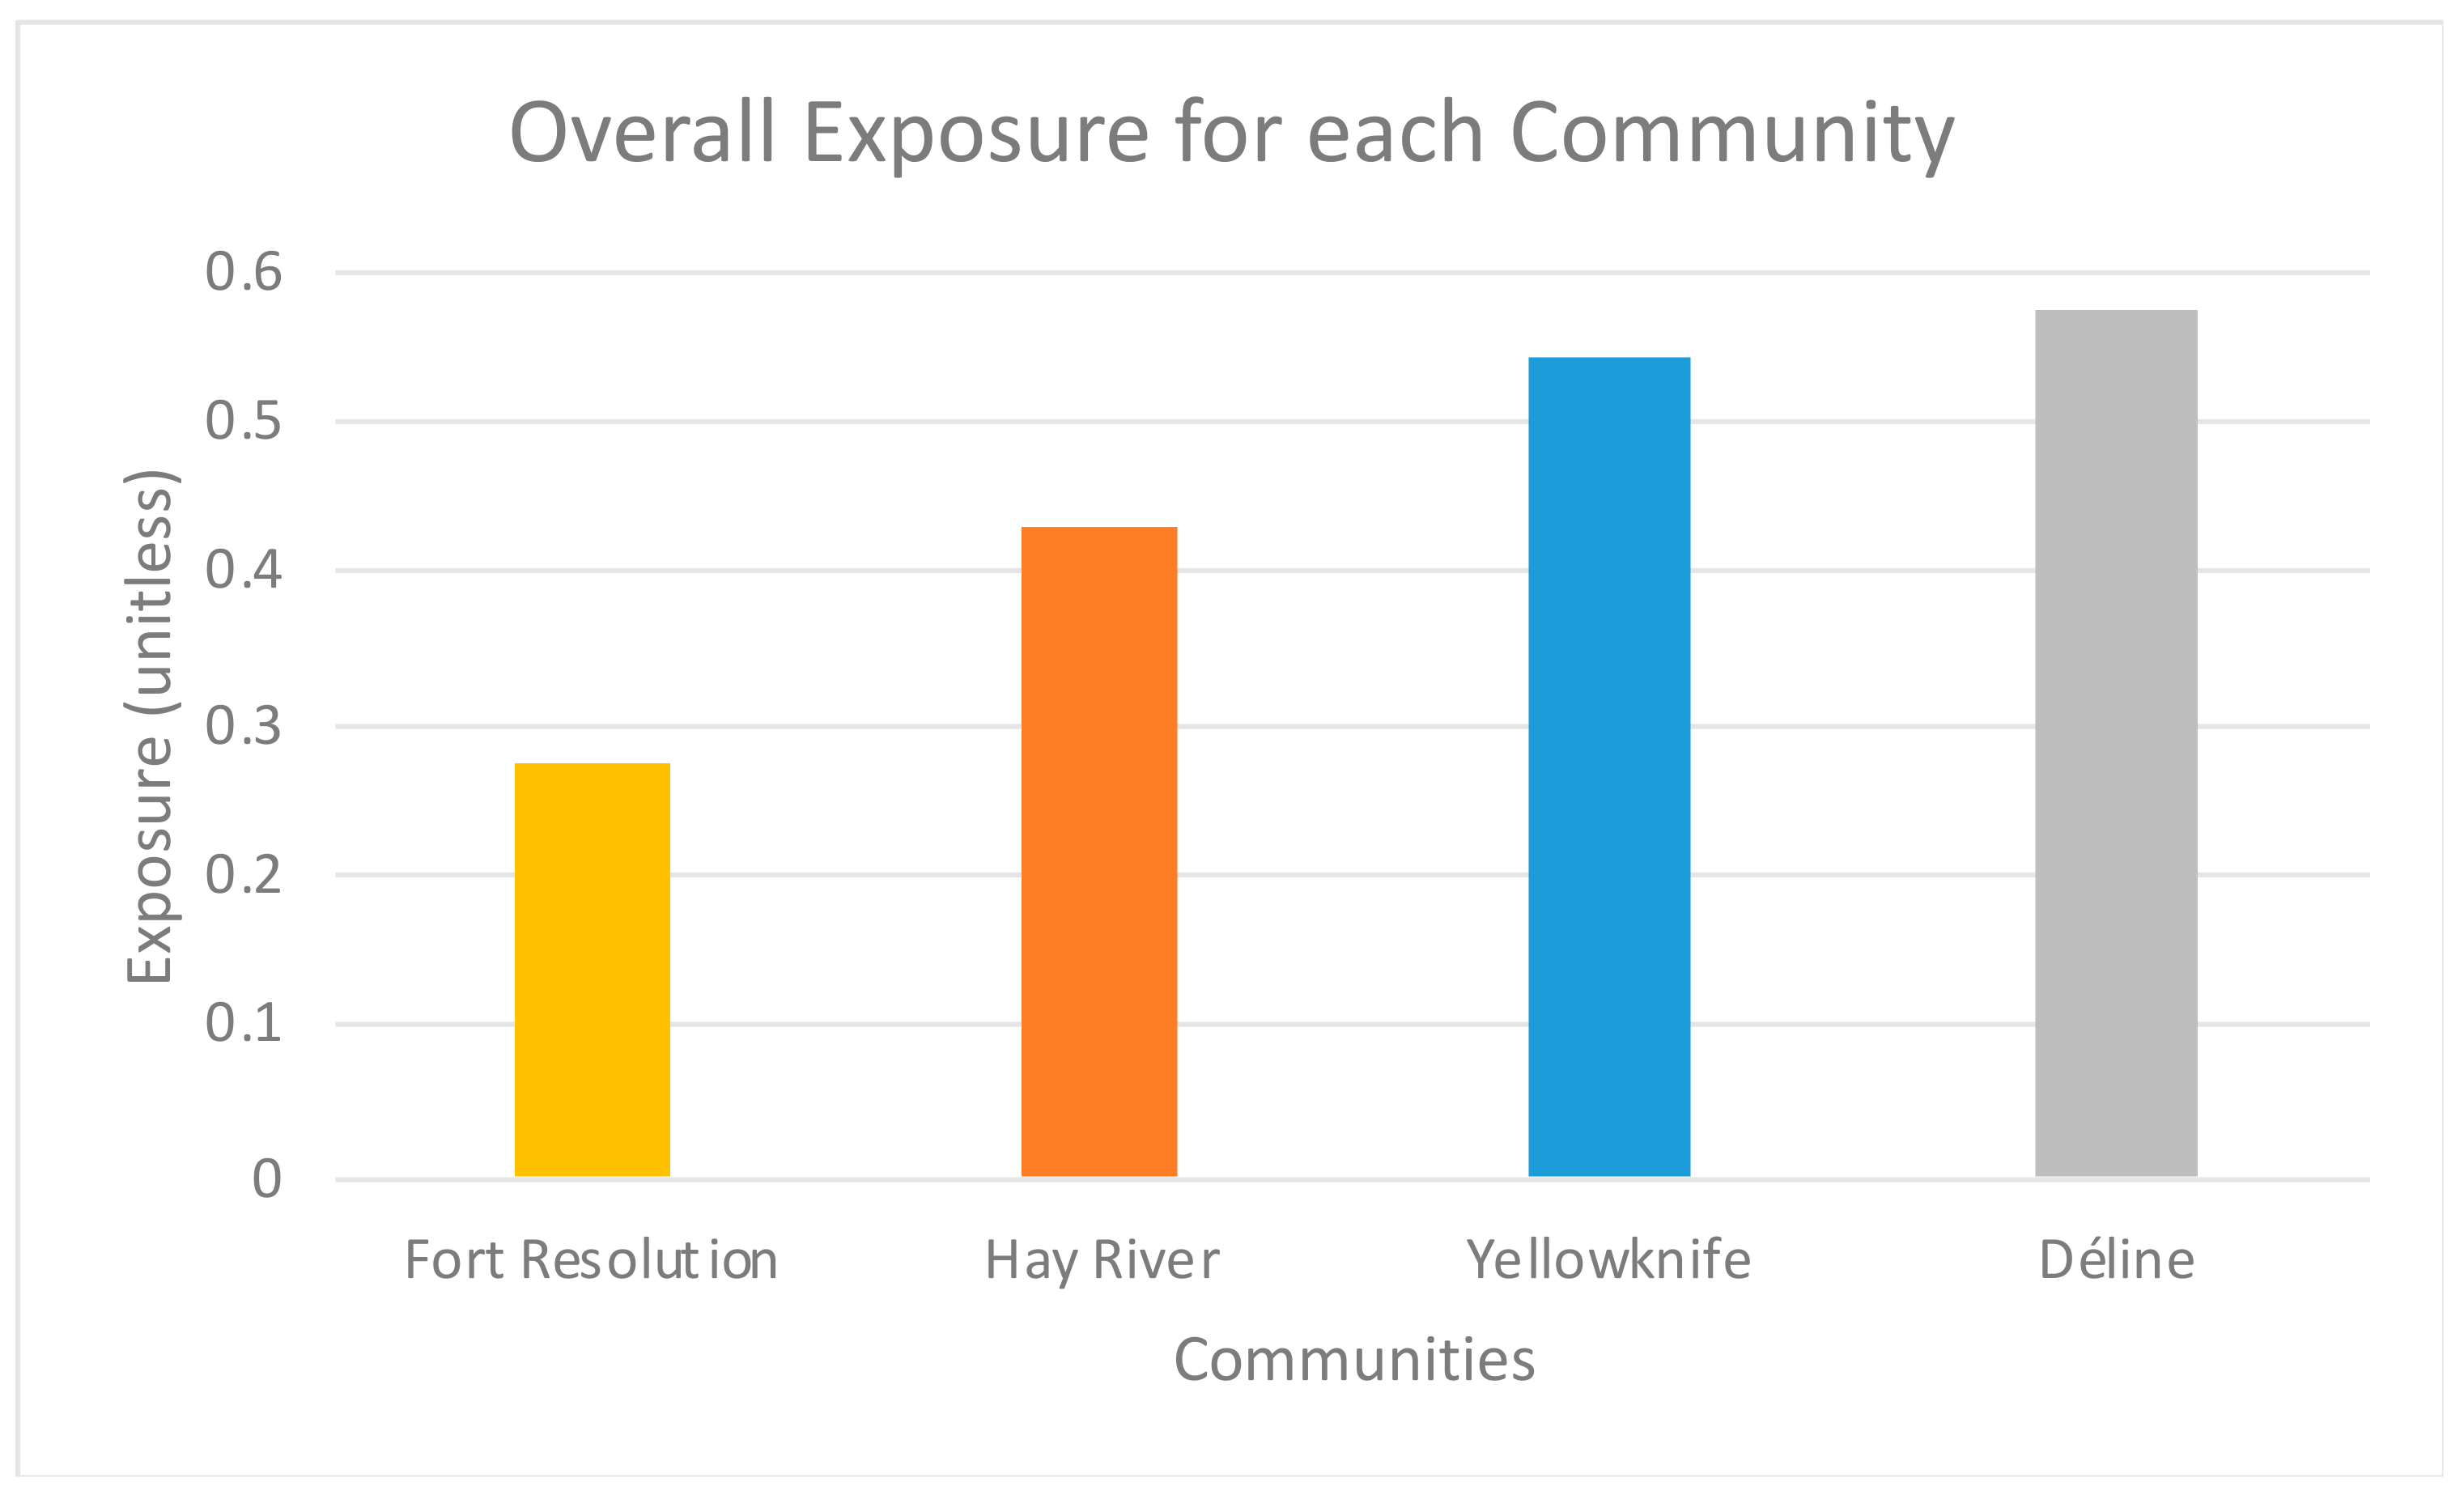
2.4. Exposure
2.5. Sensitivity
2.6. Adaptive Capacity
2.7. Index Calculation
3. Results
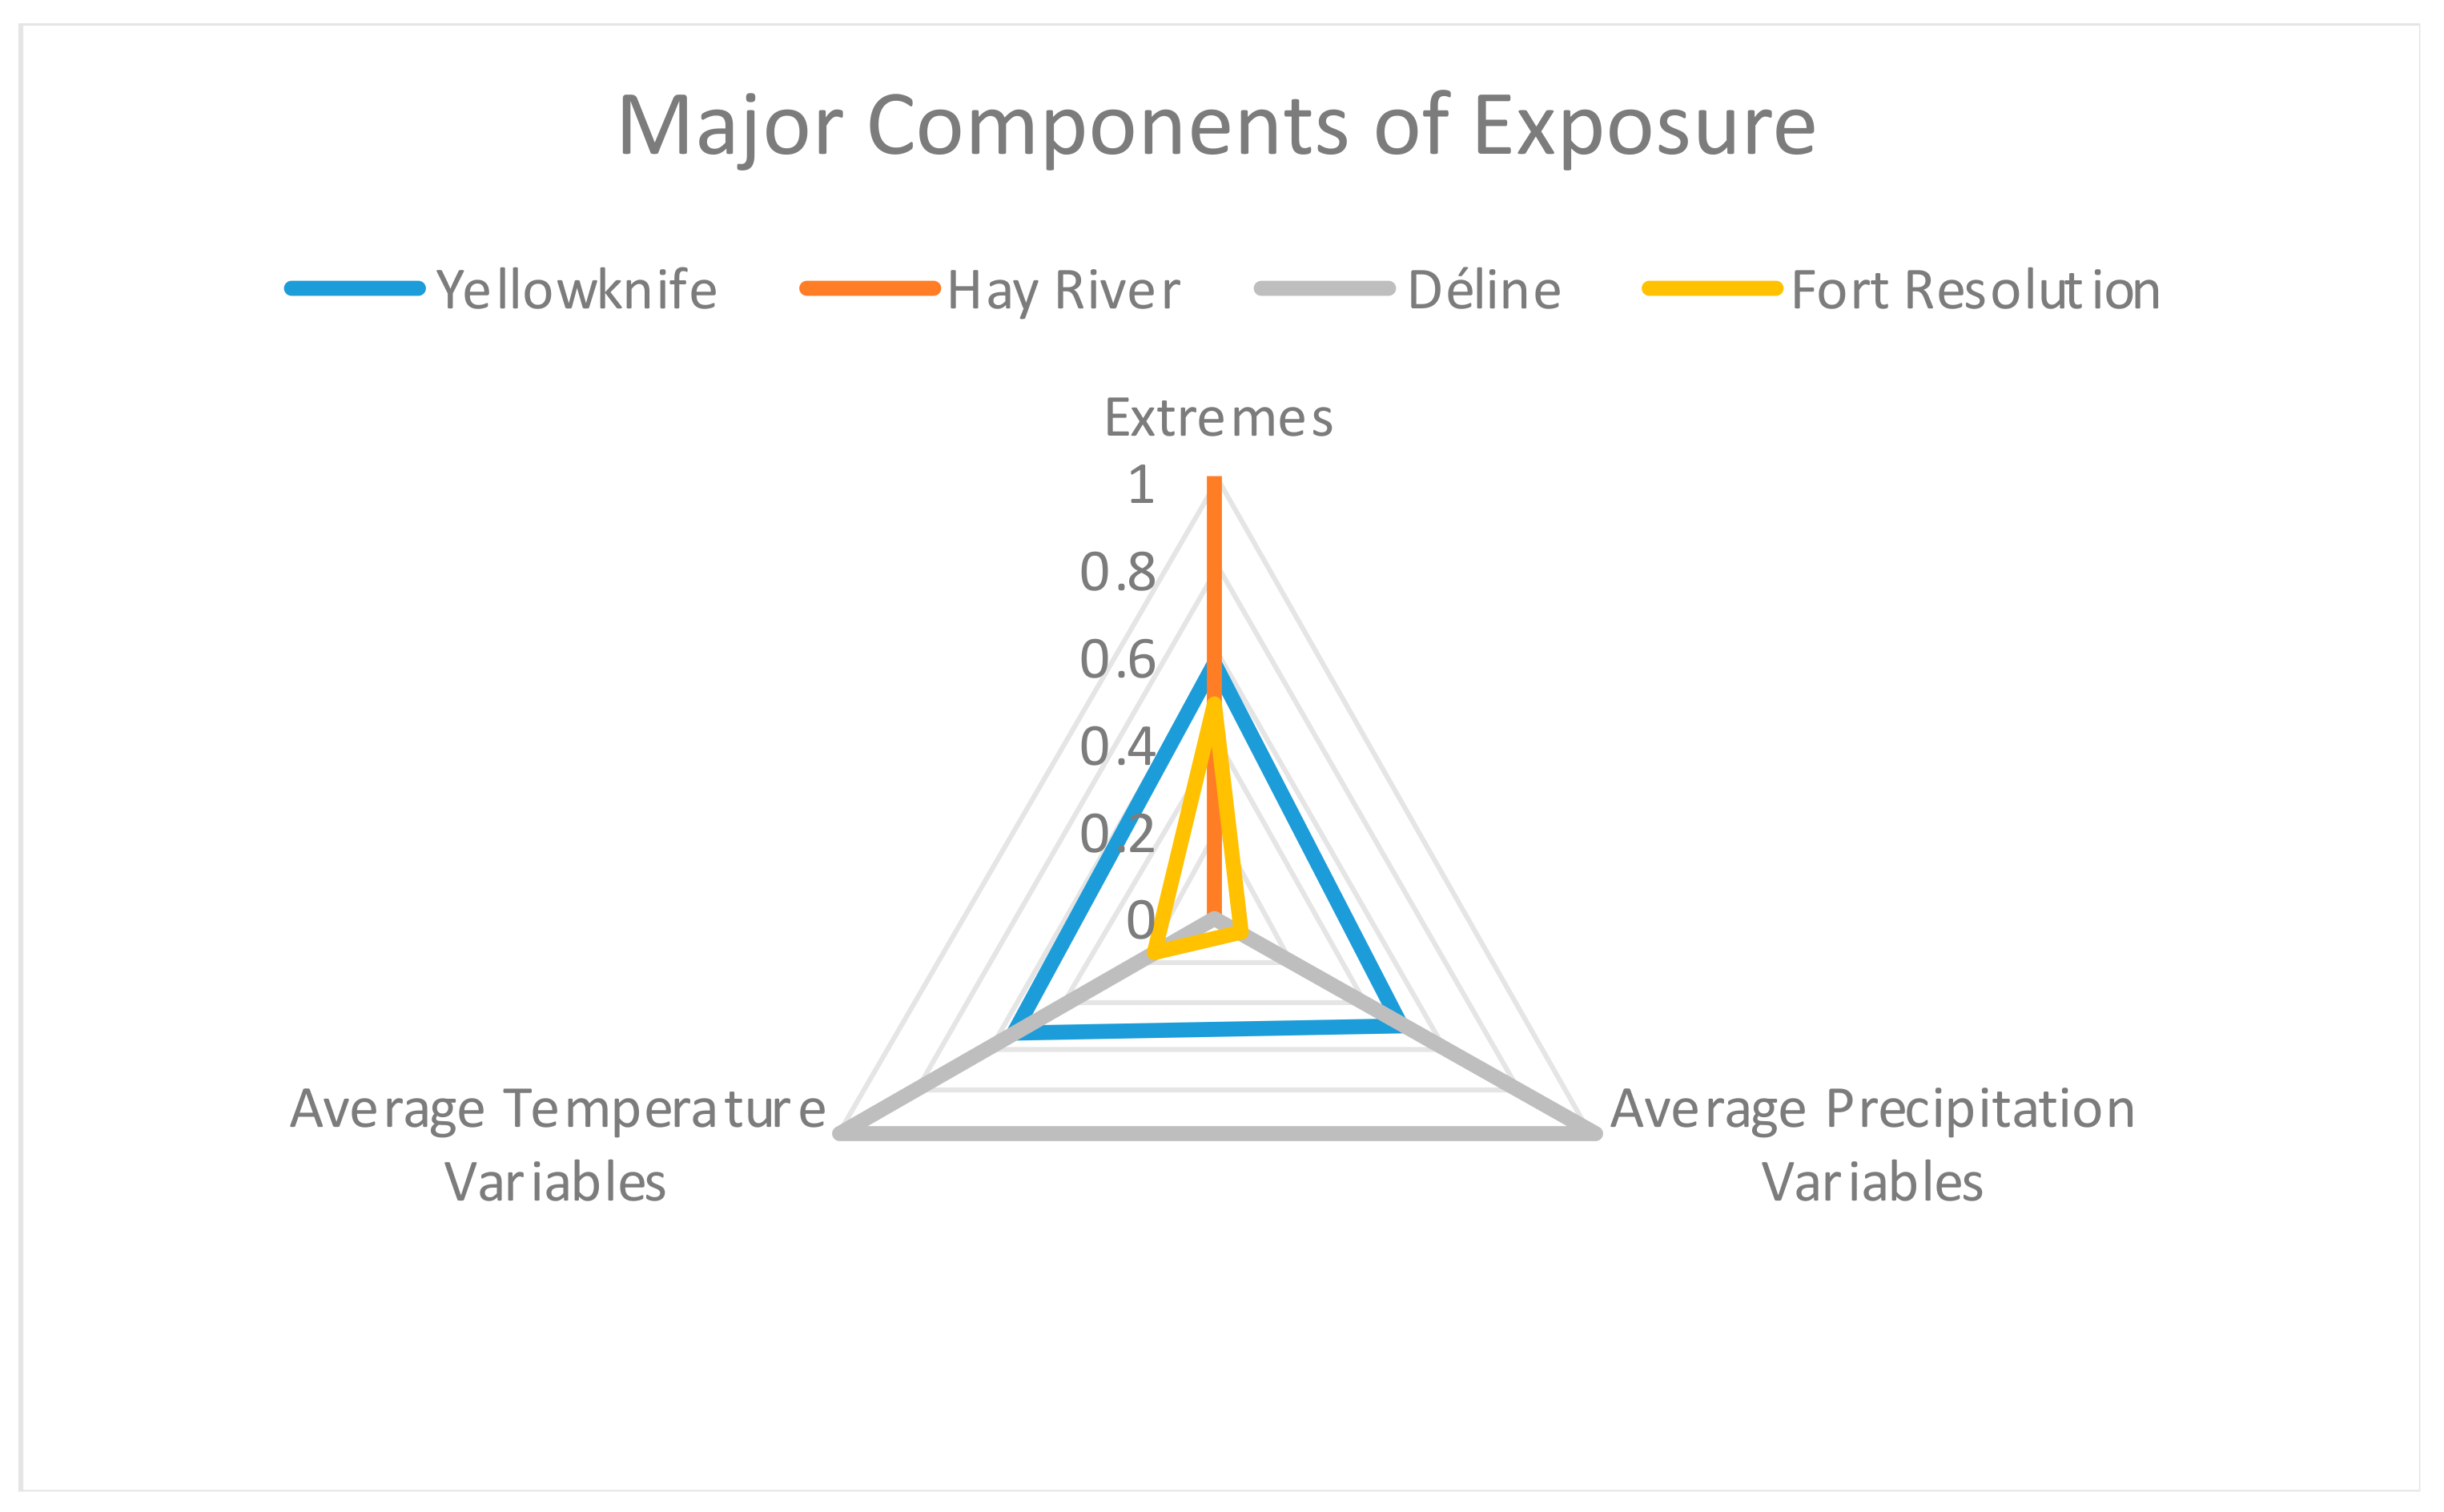
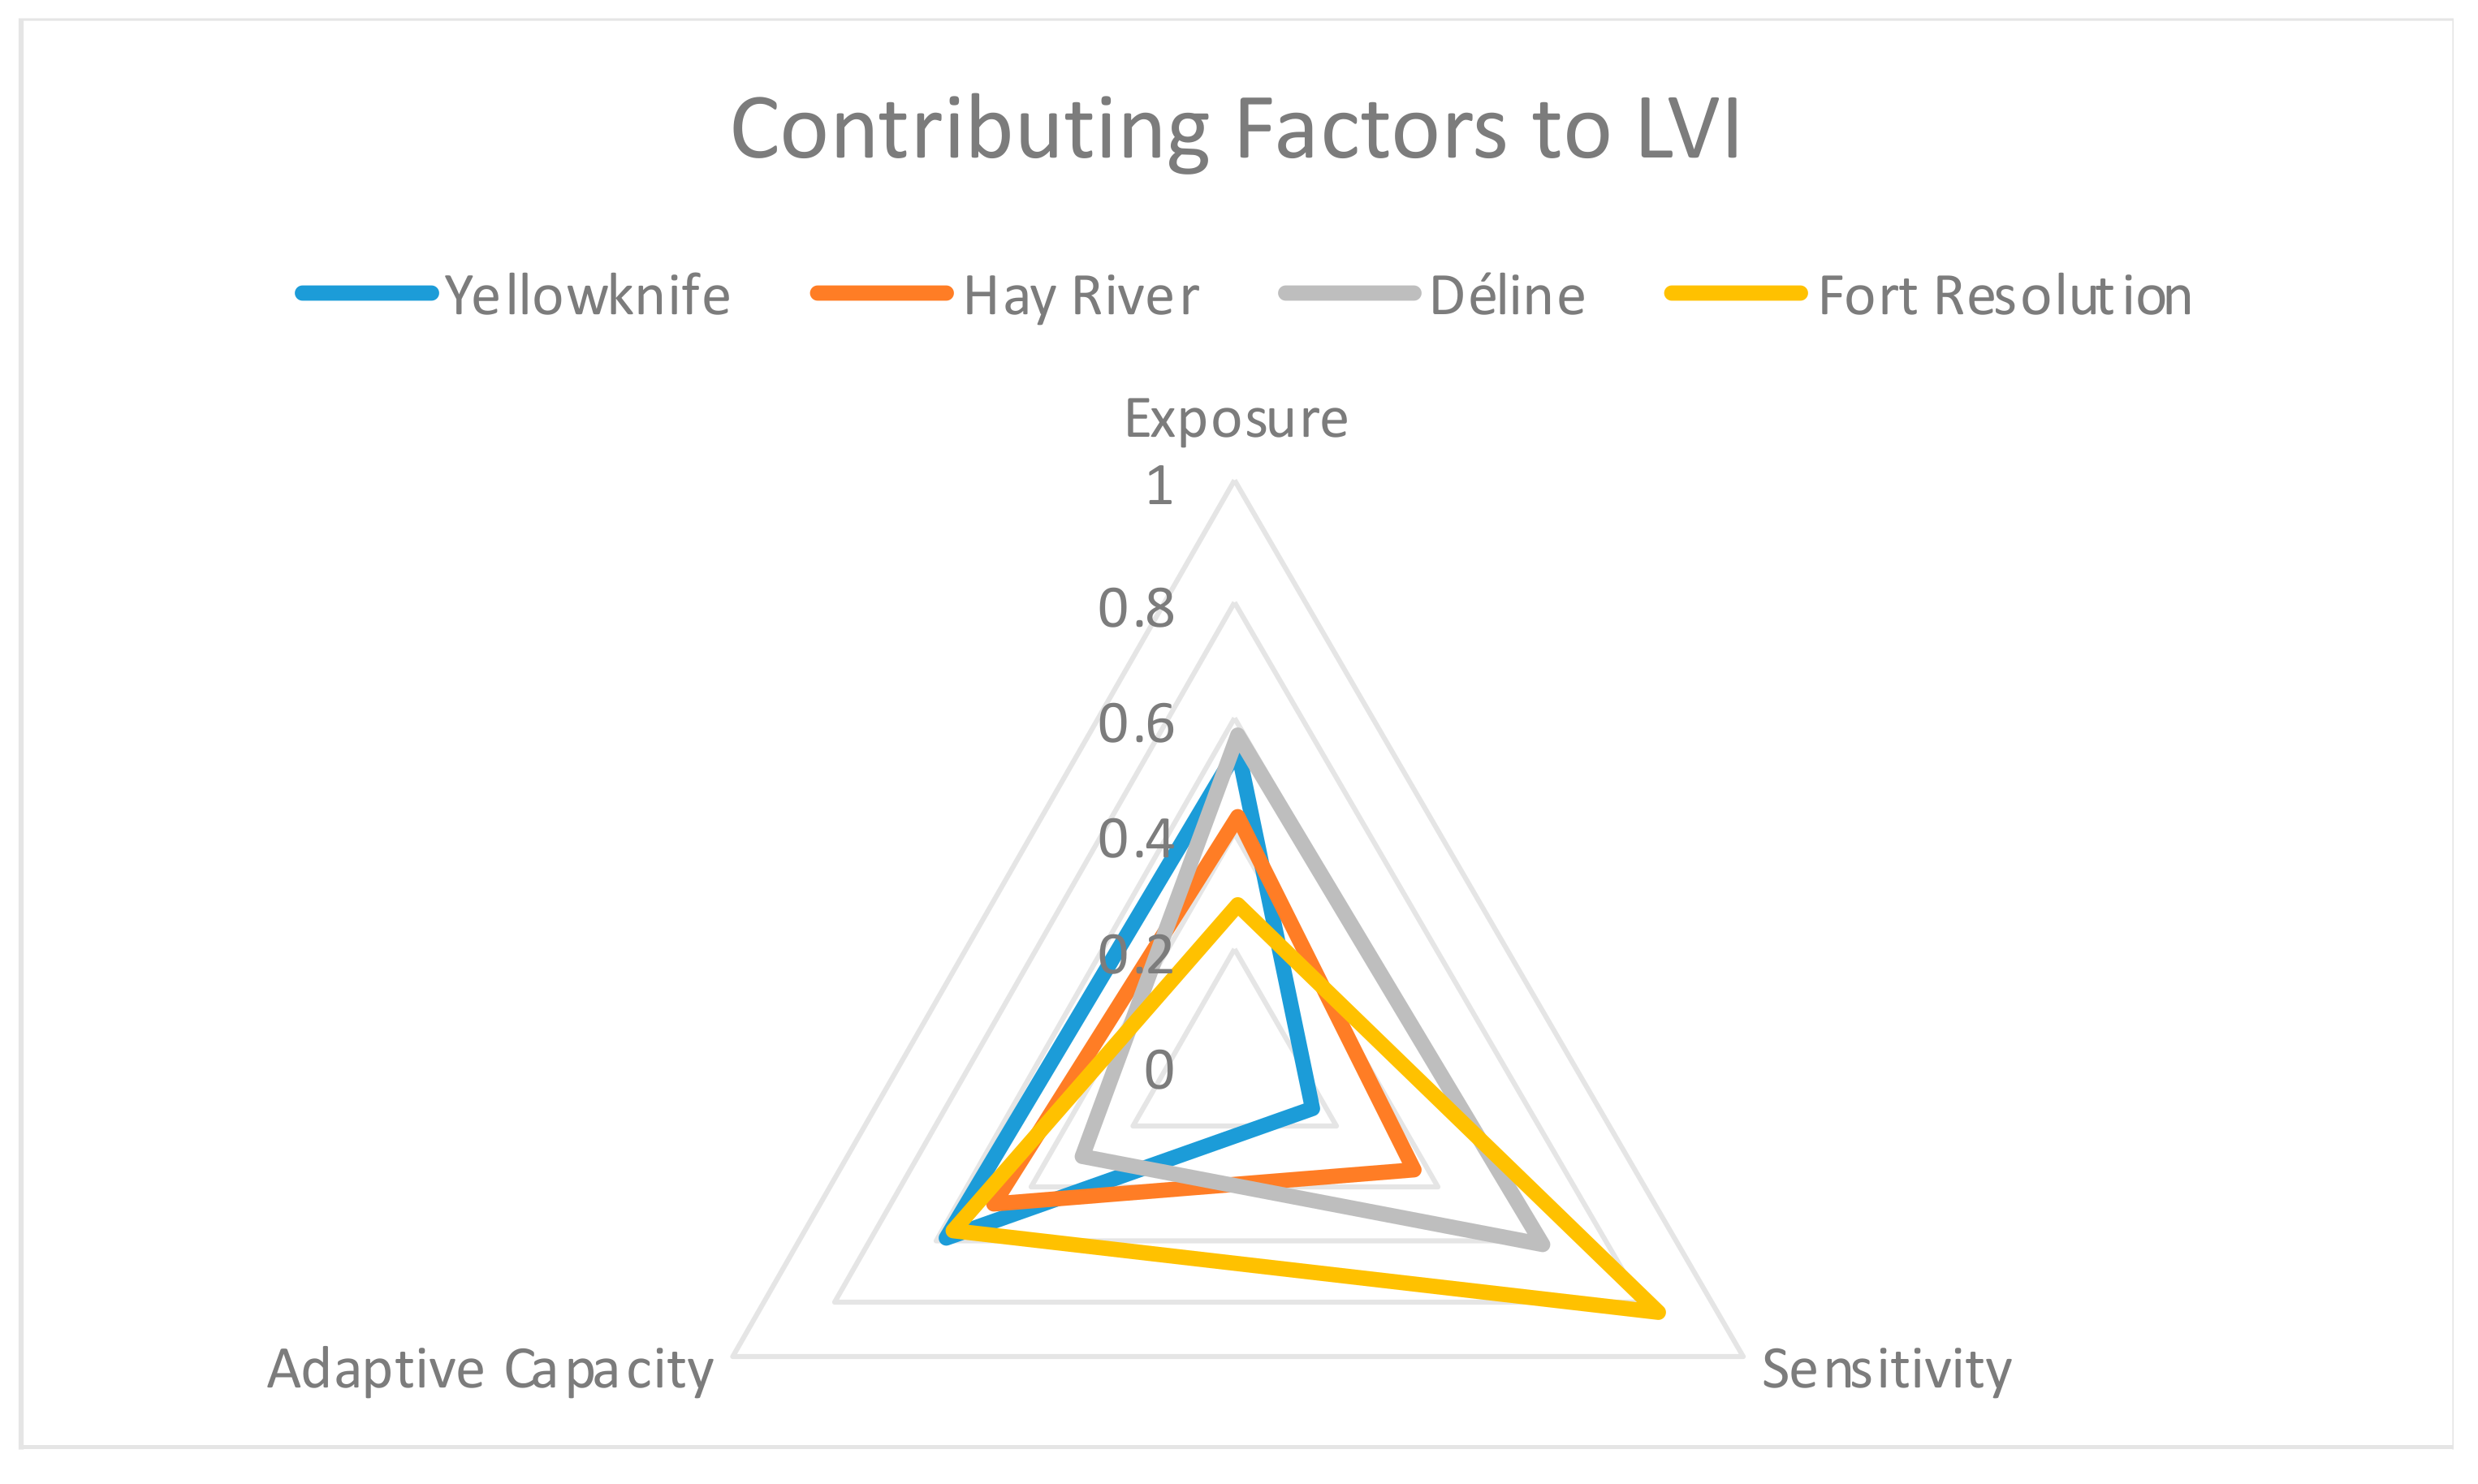
3.1. Exposure
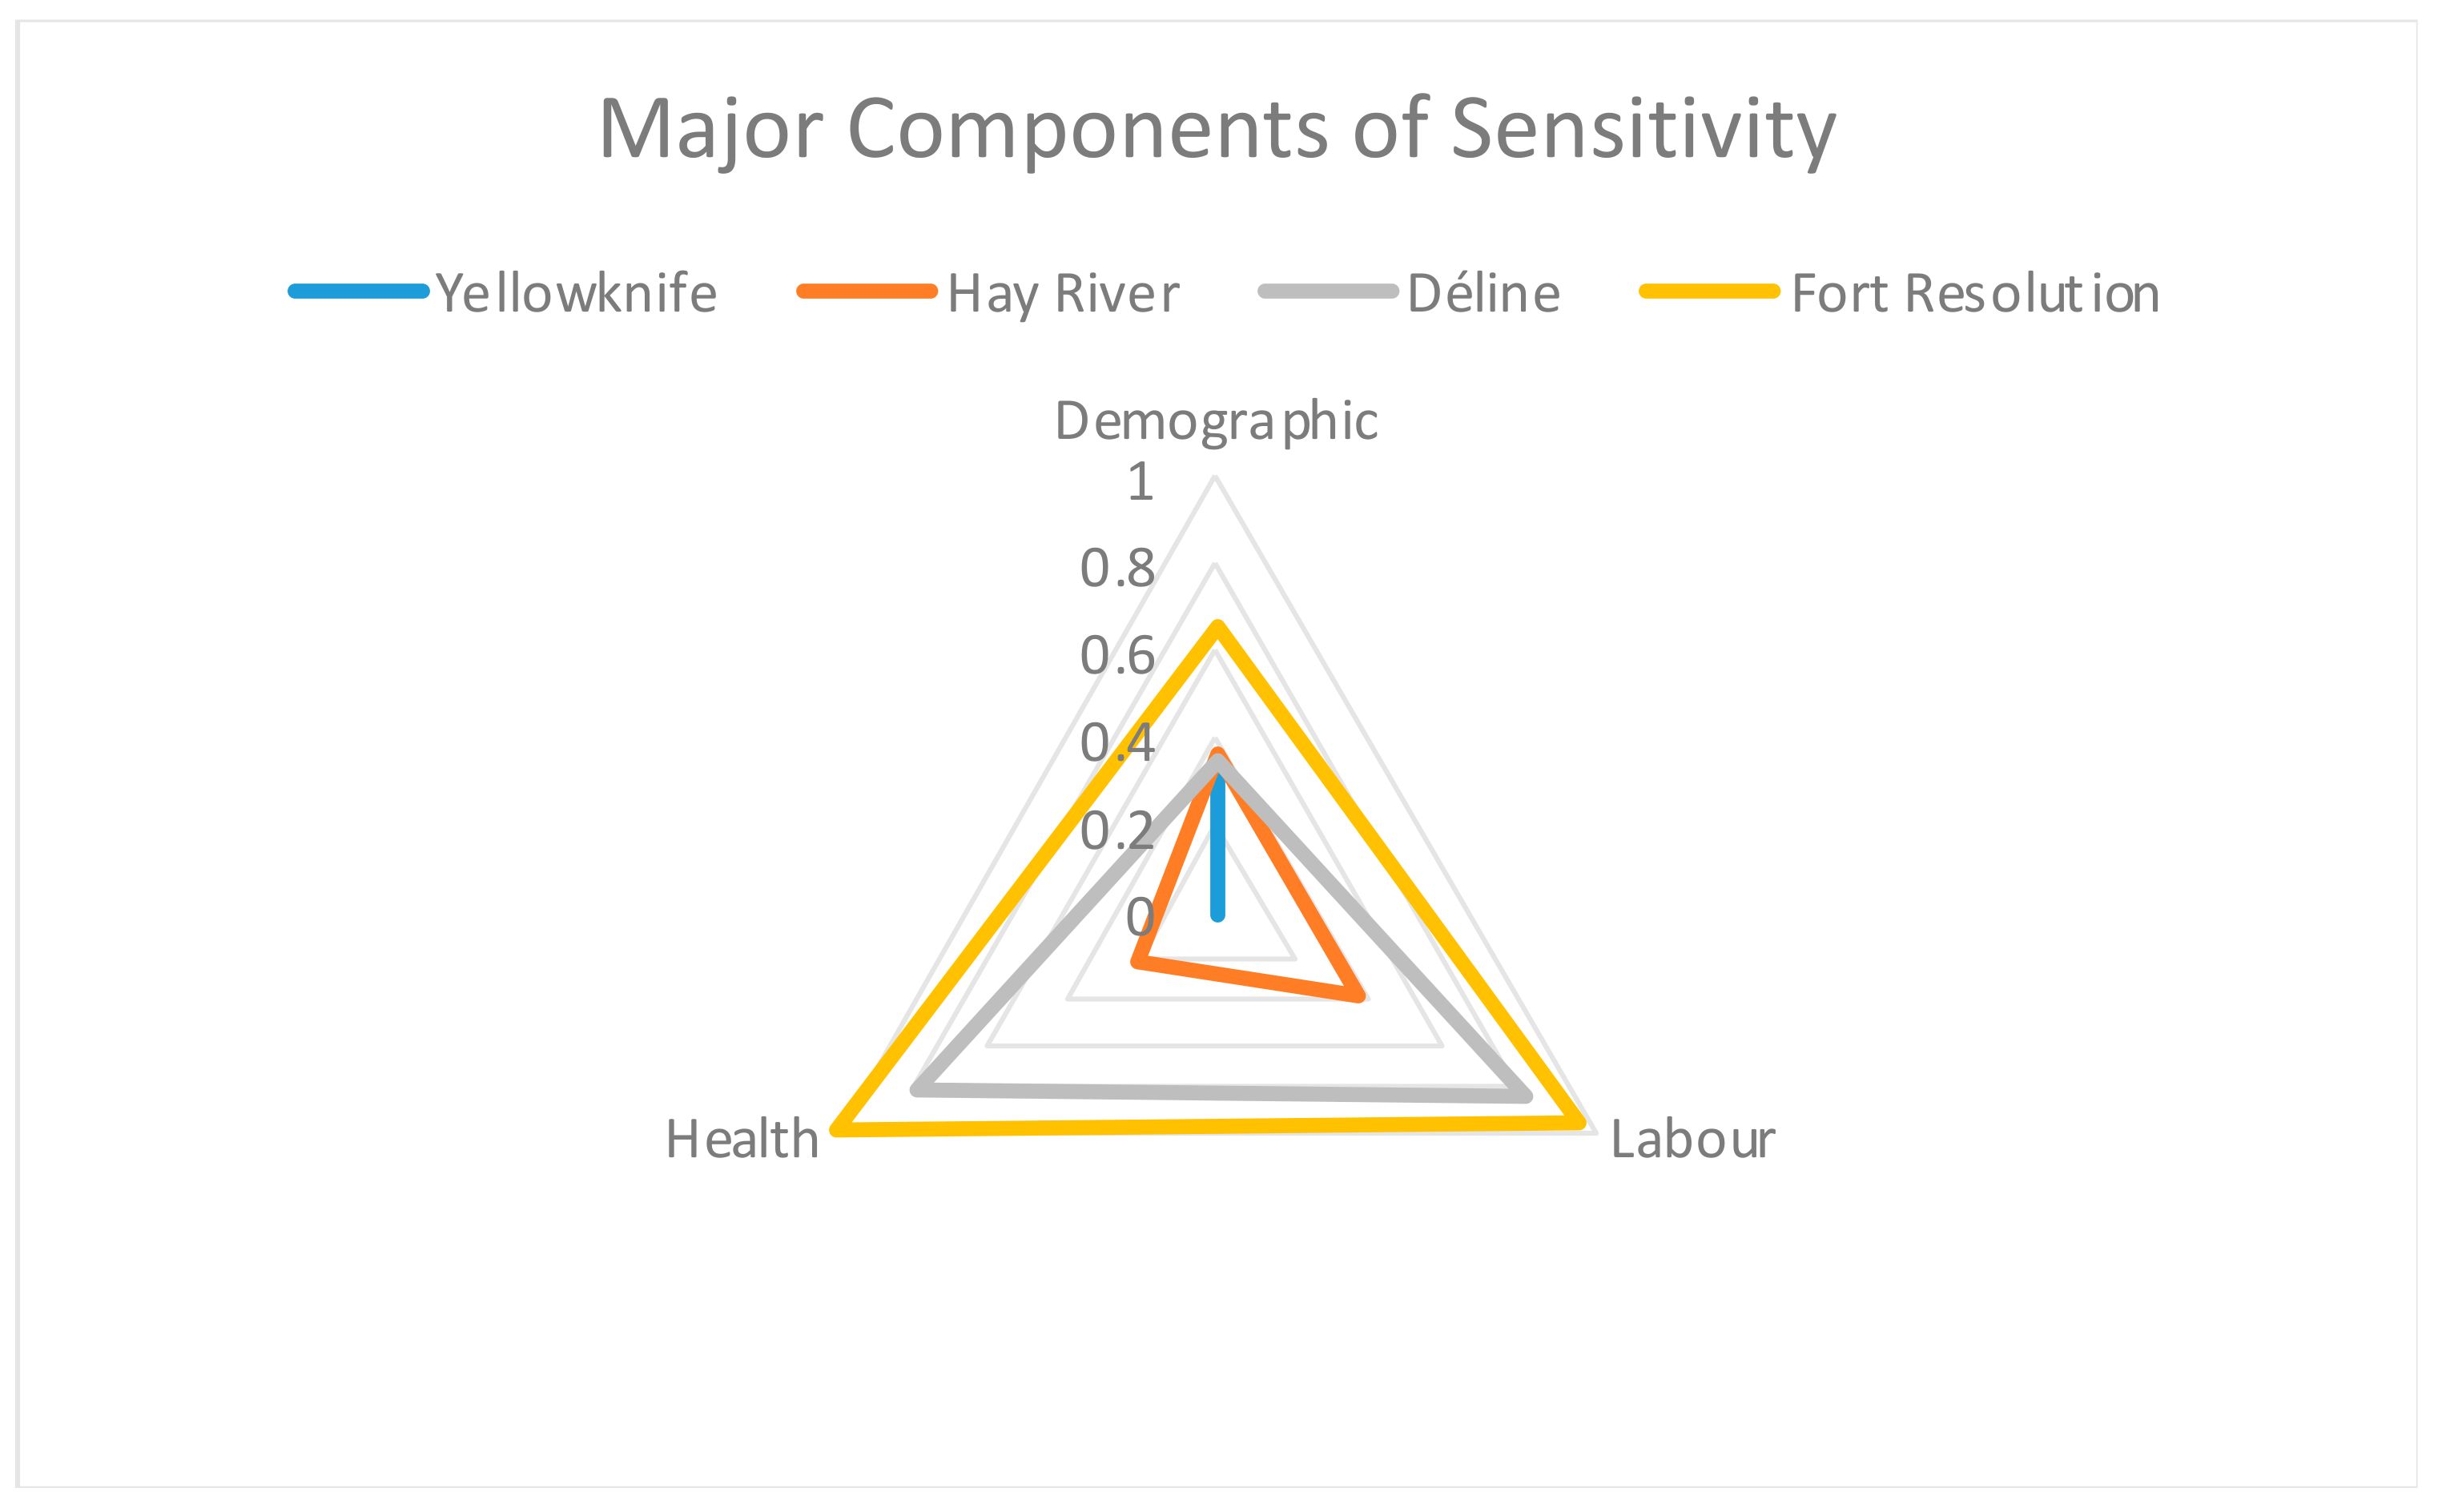
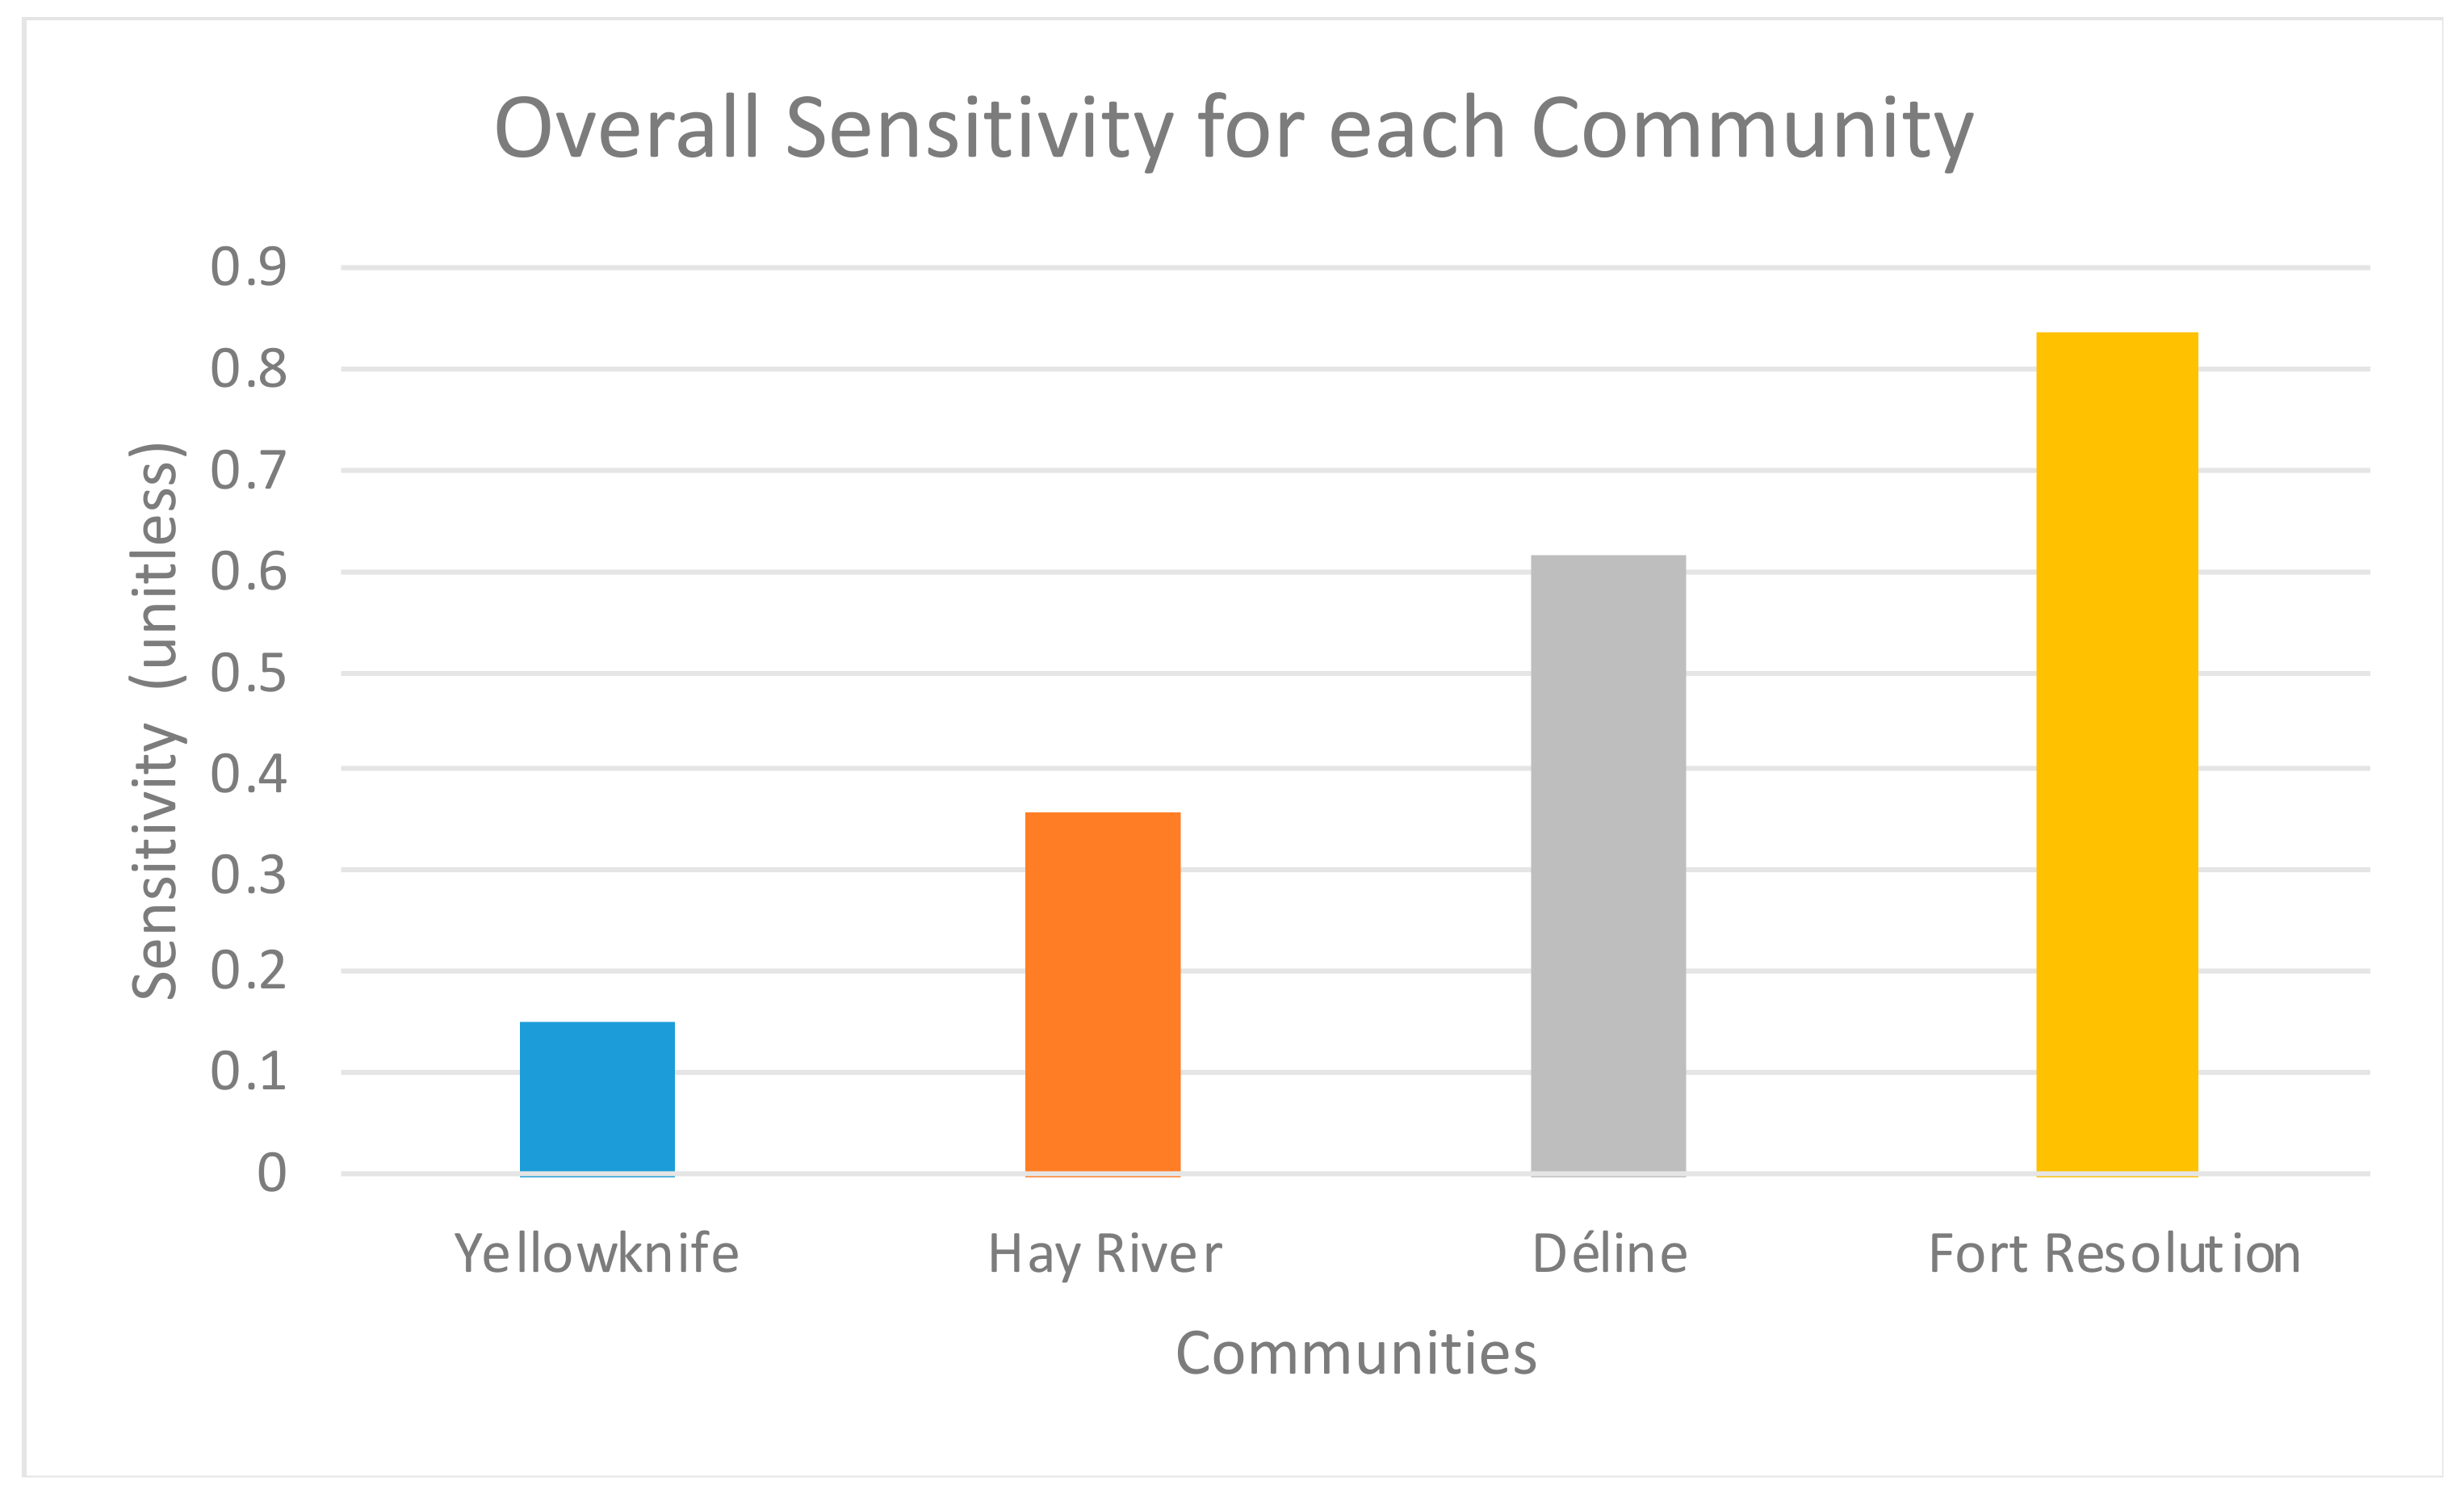
3.2. Sensitivity
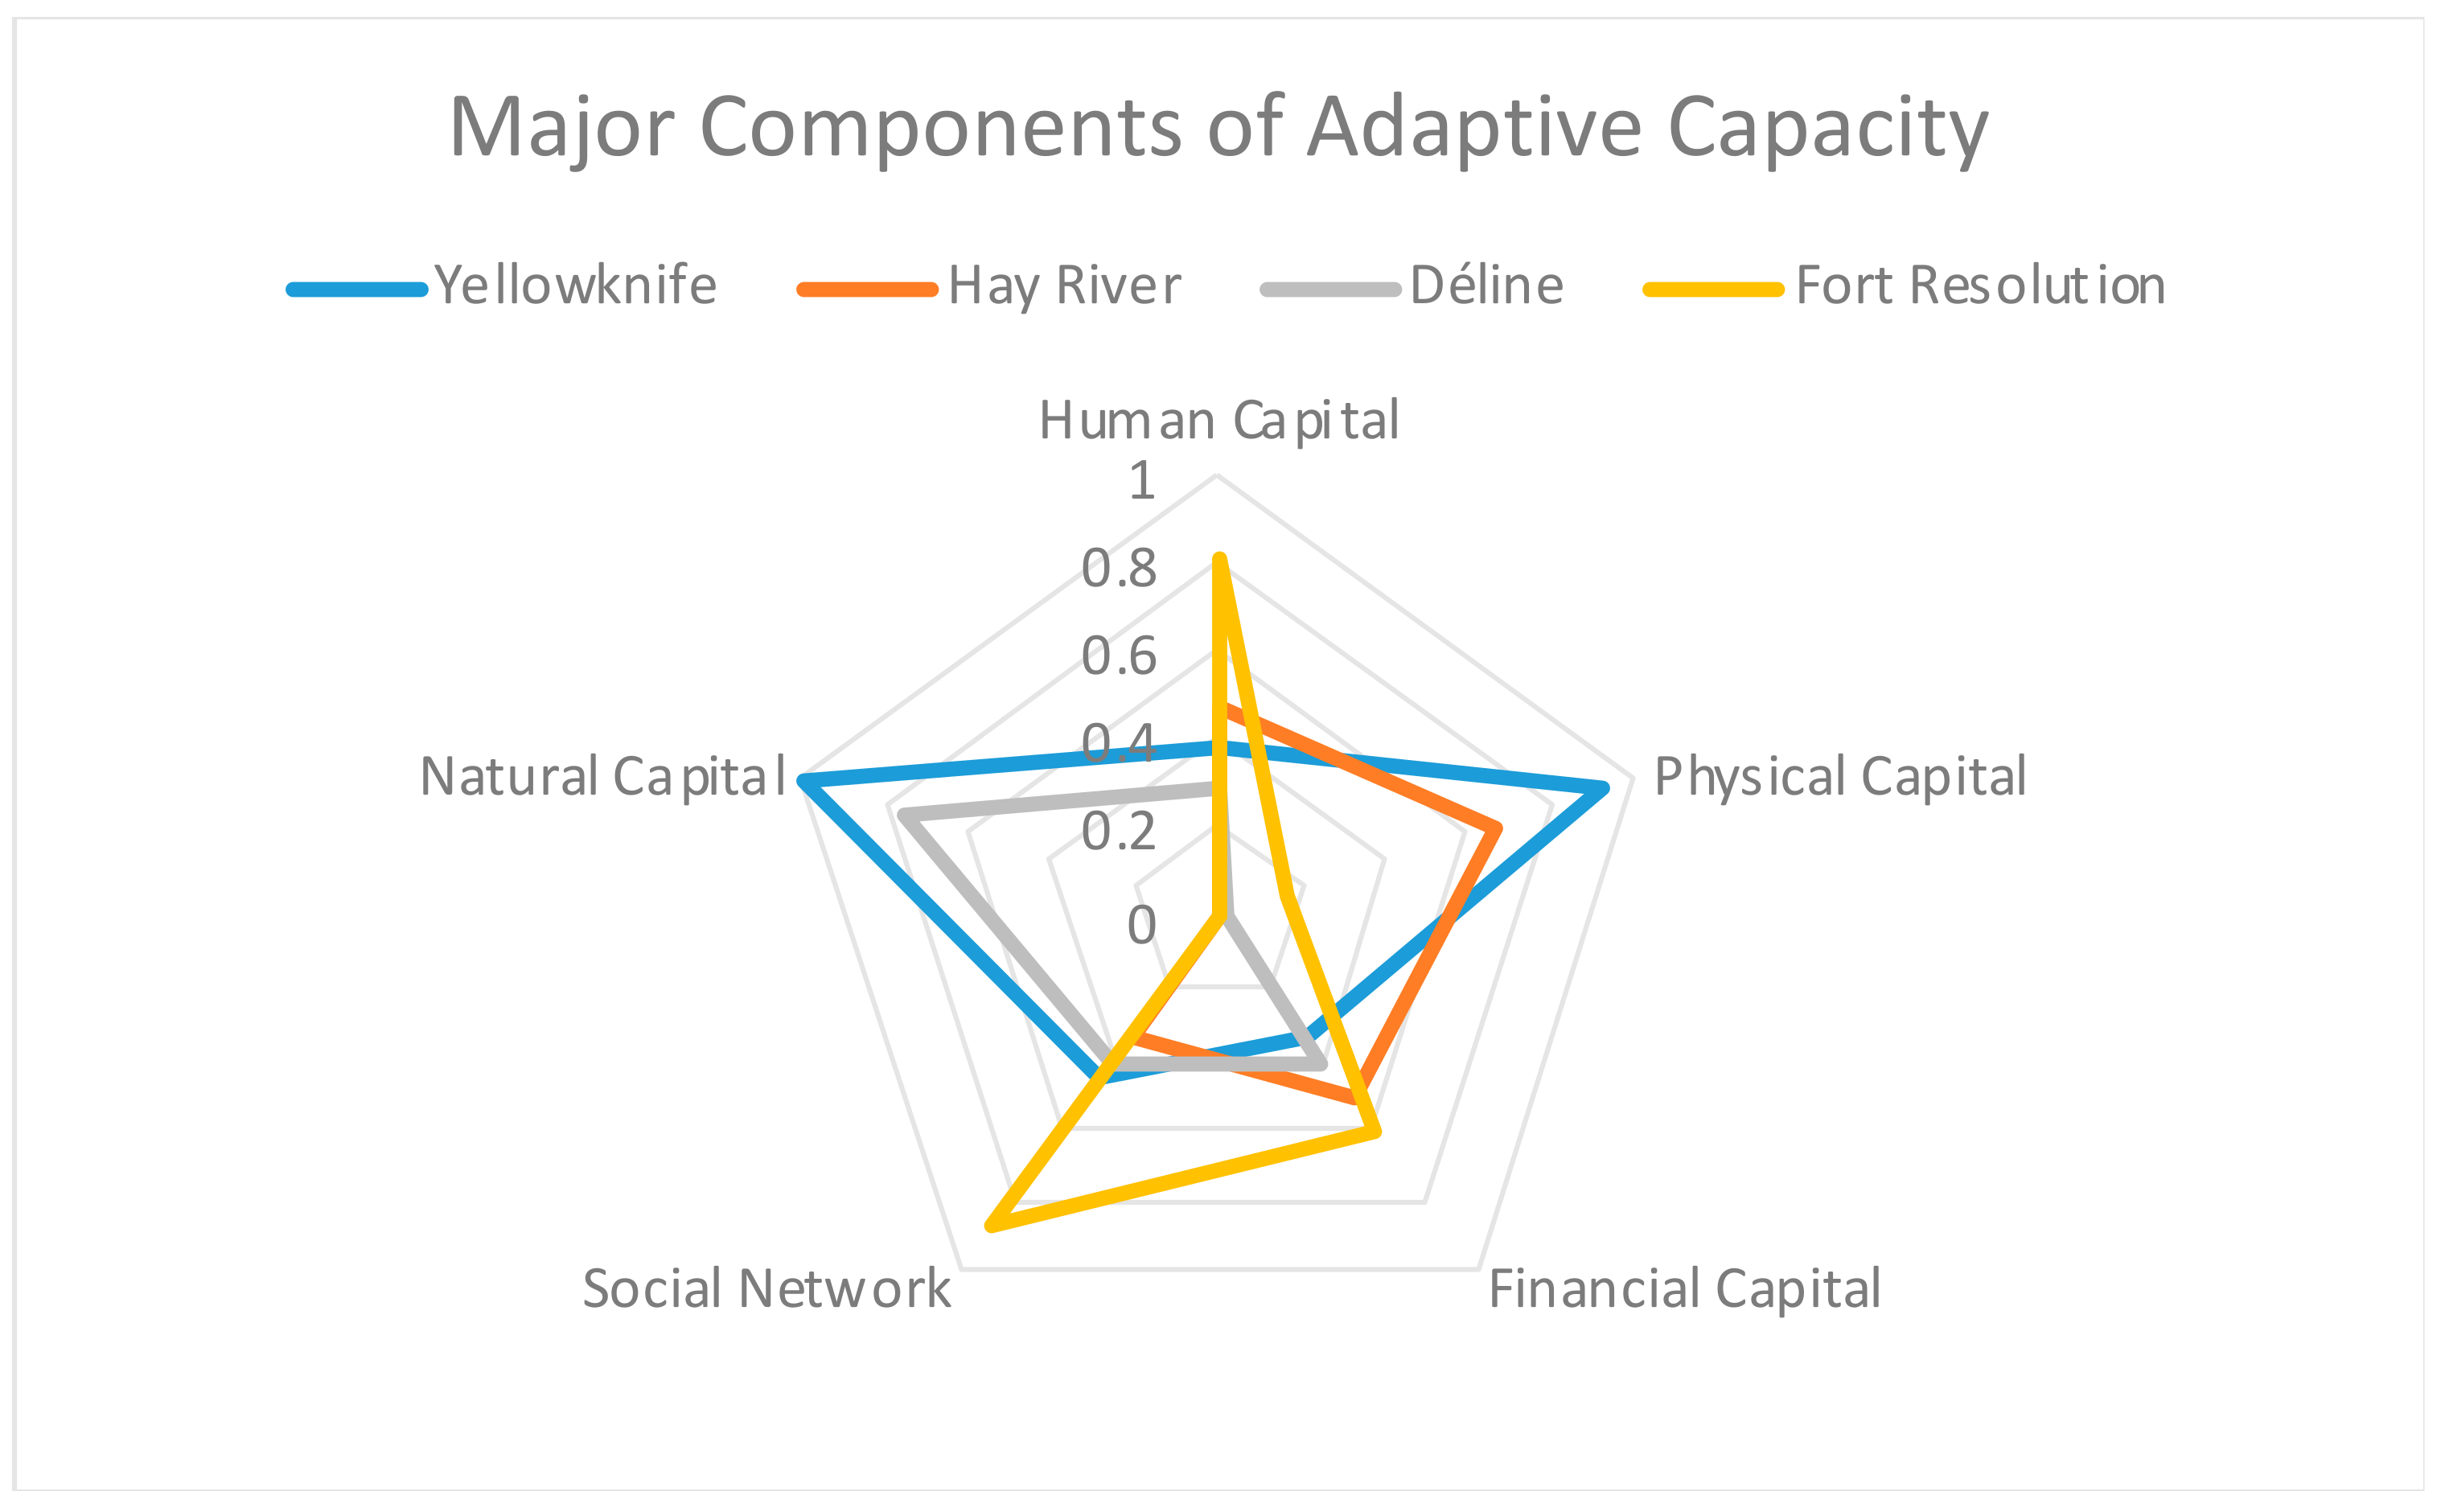
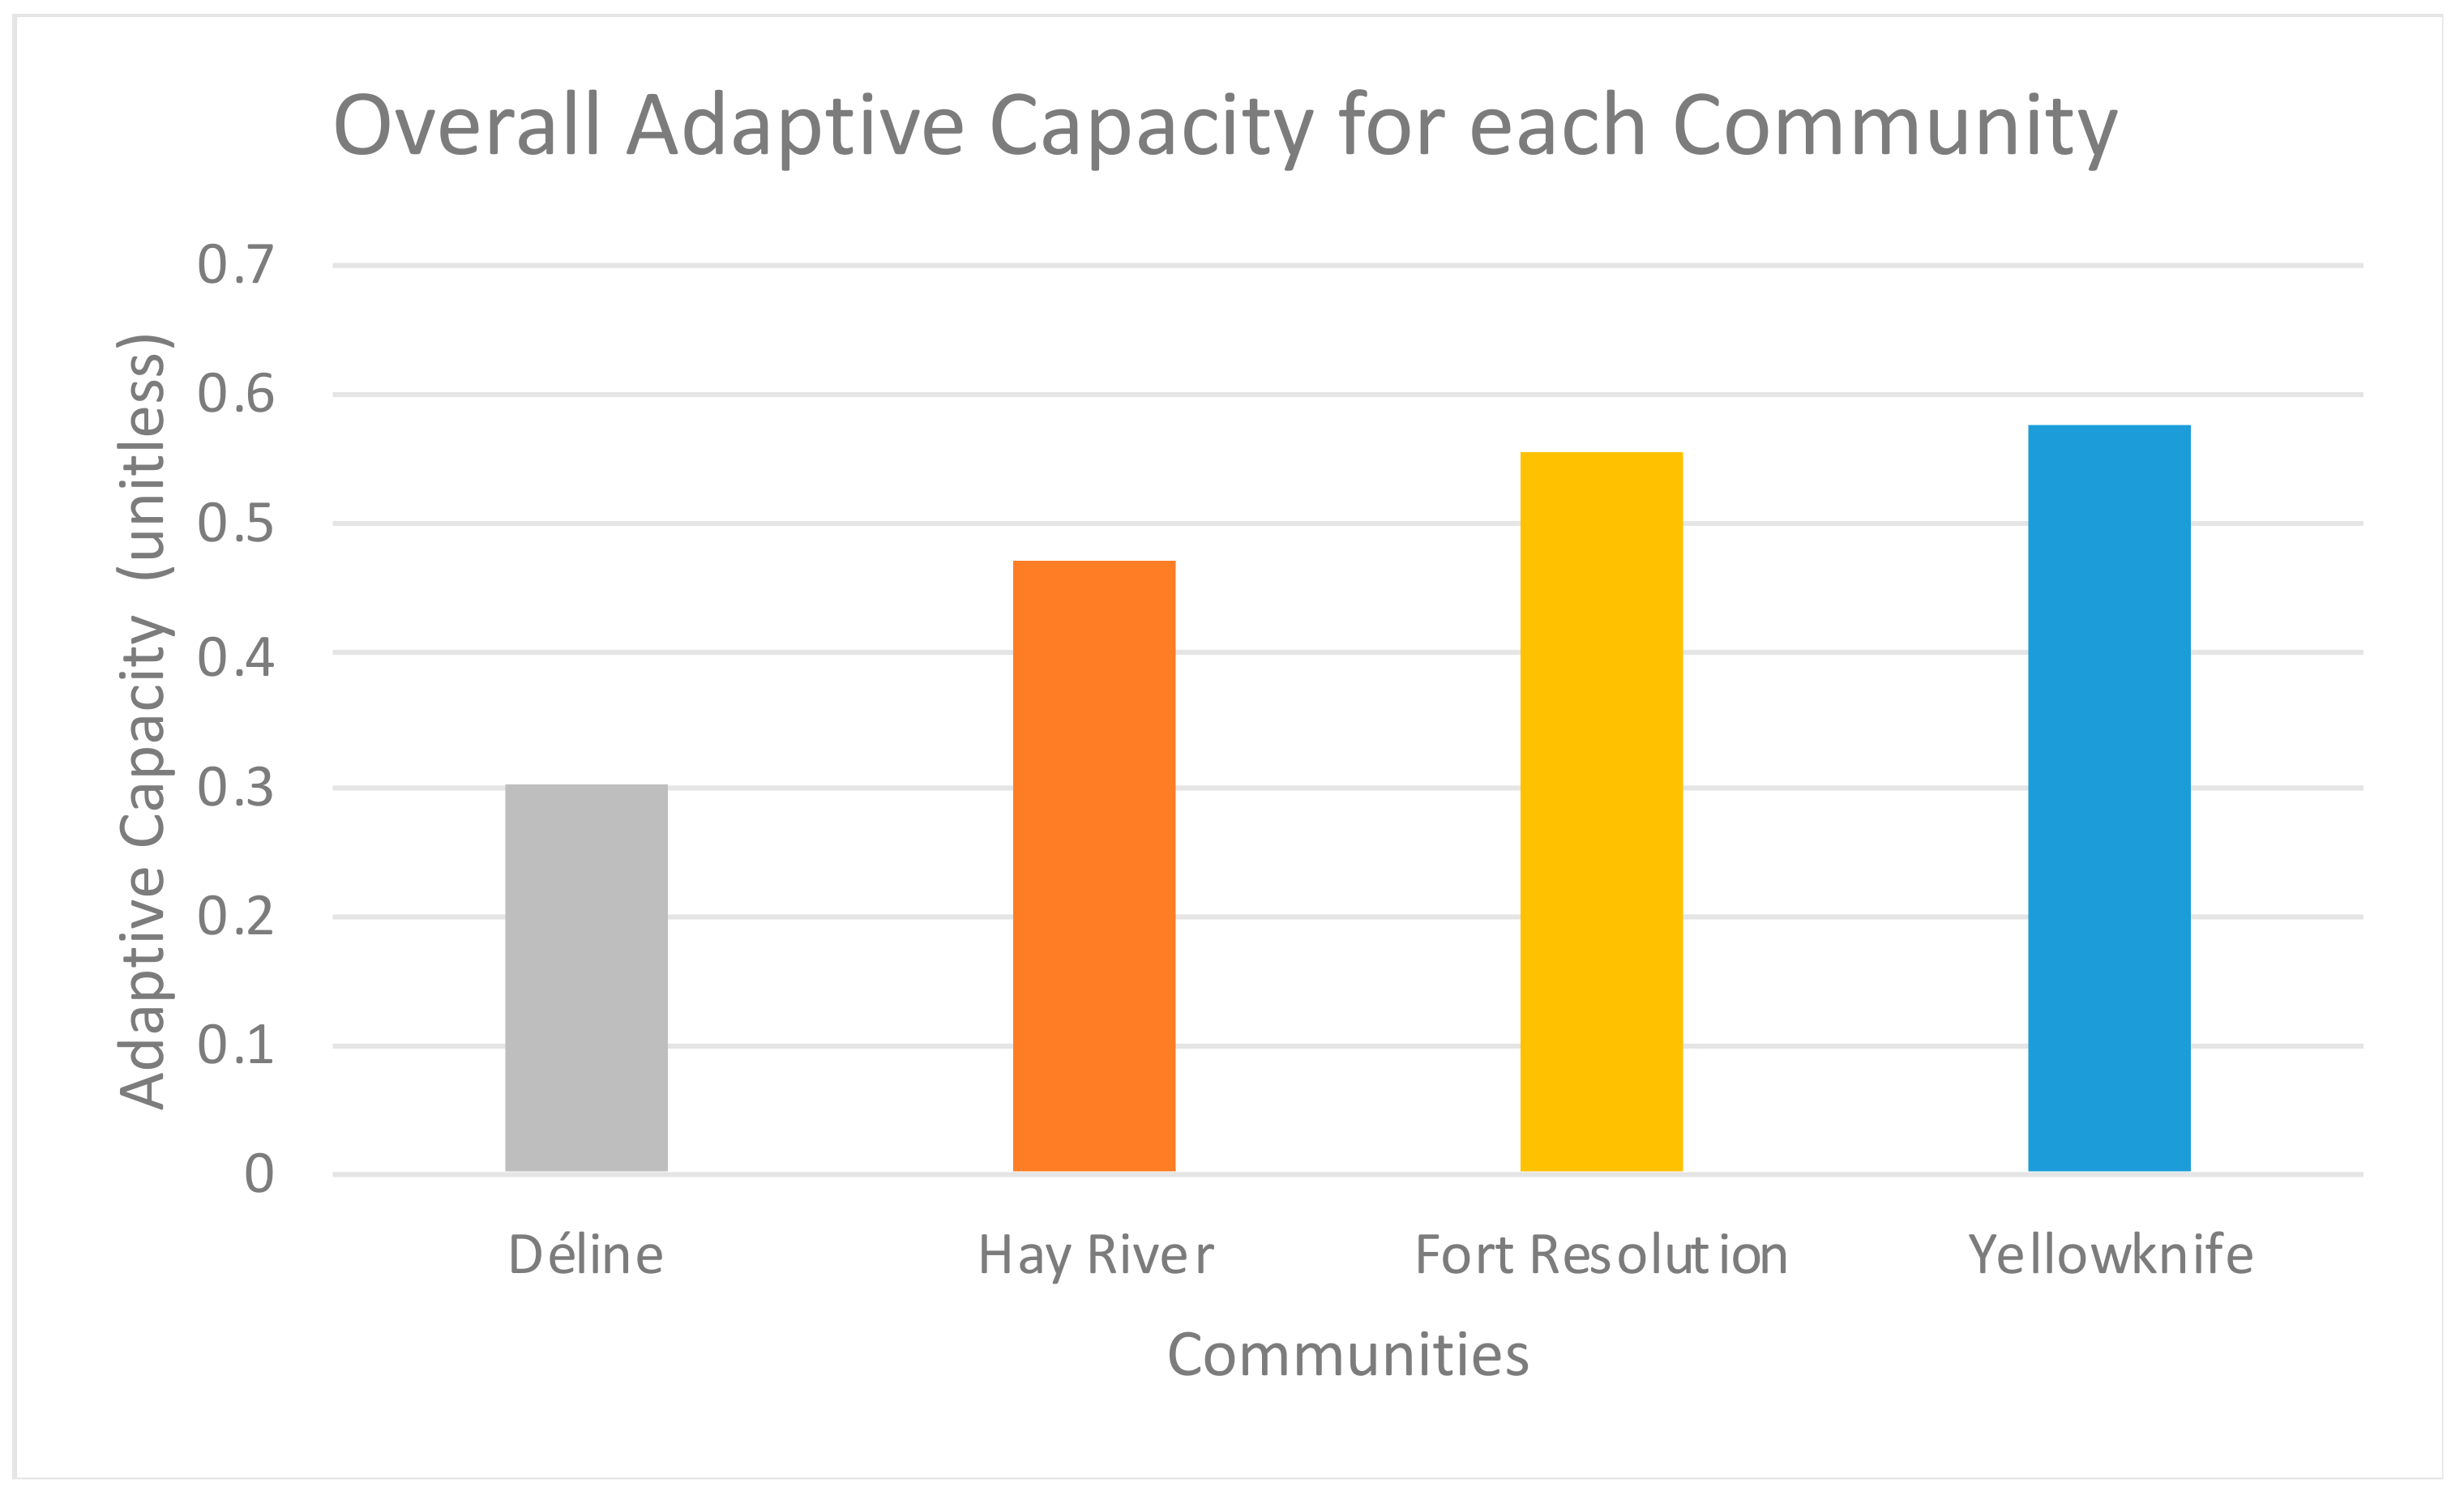
3.3. Adaptive Capacity
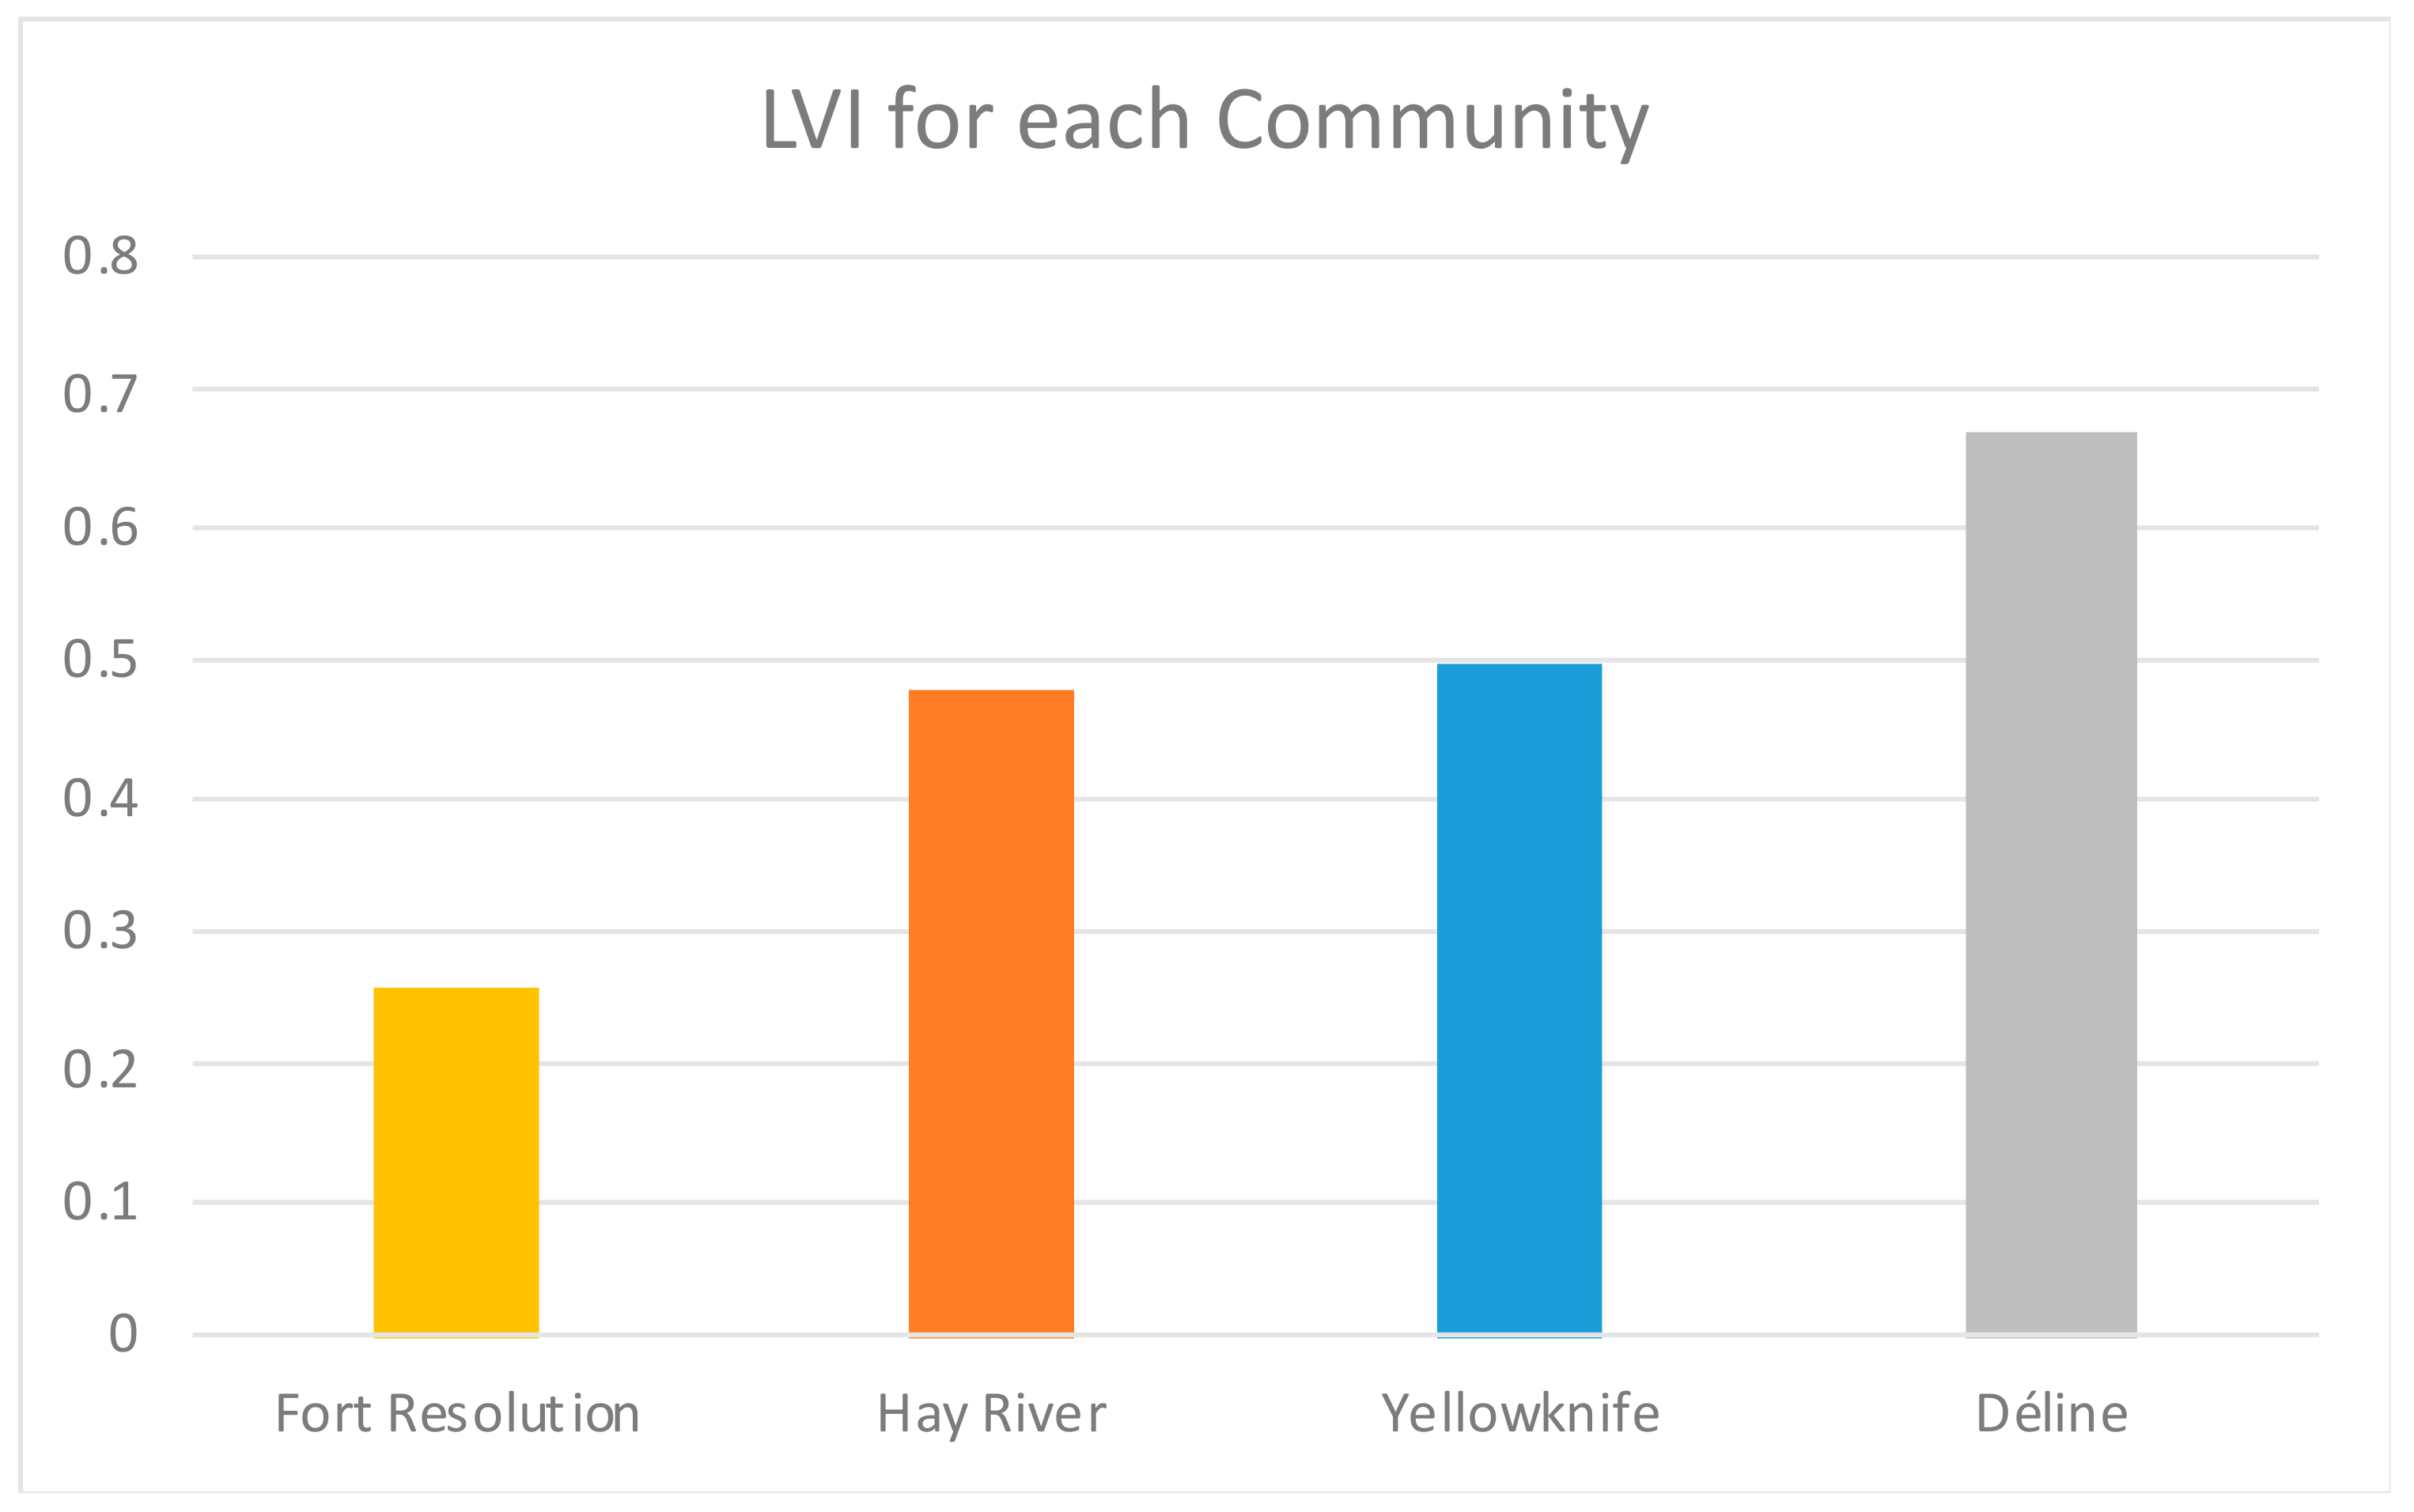
3.4. Livelihood Vulnerability Index
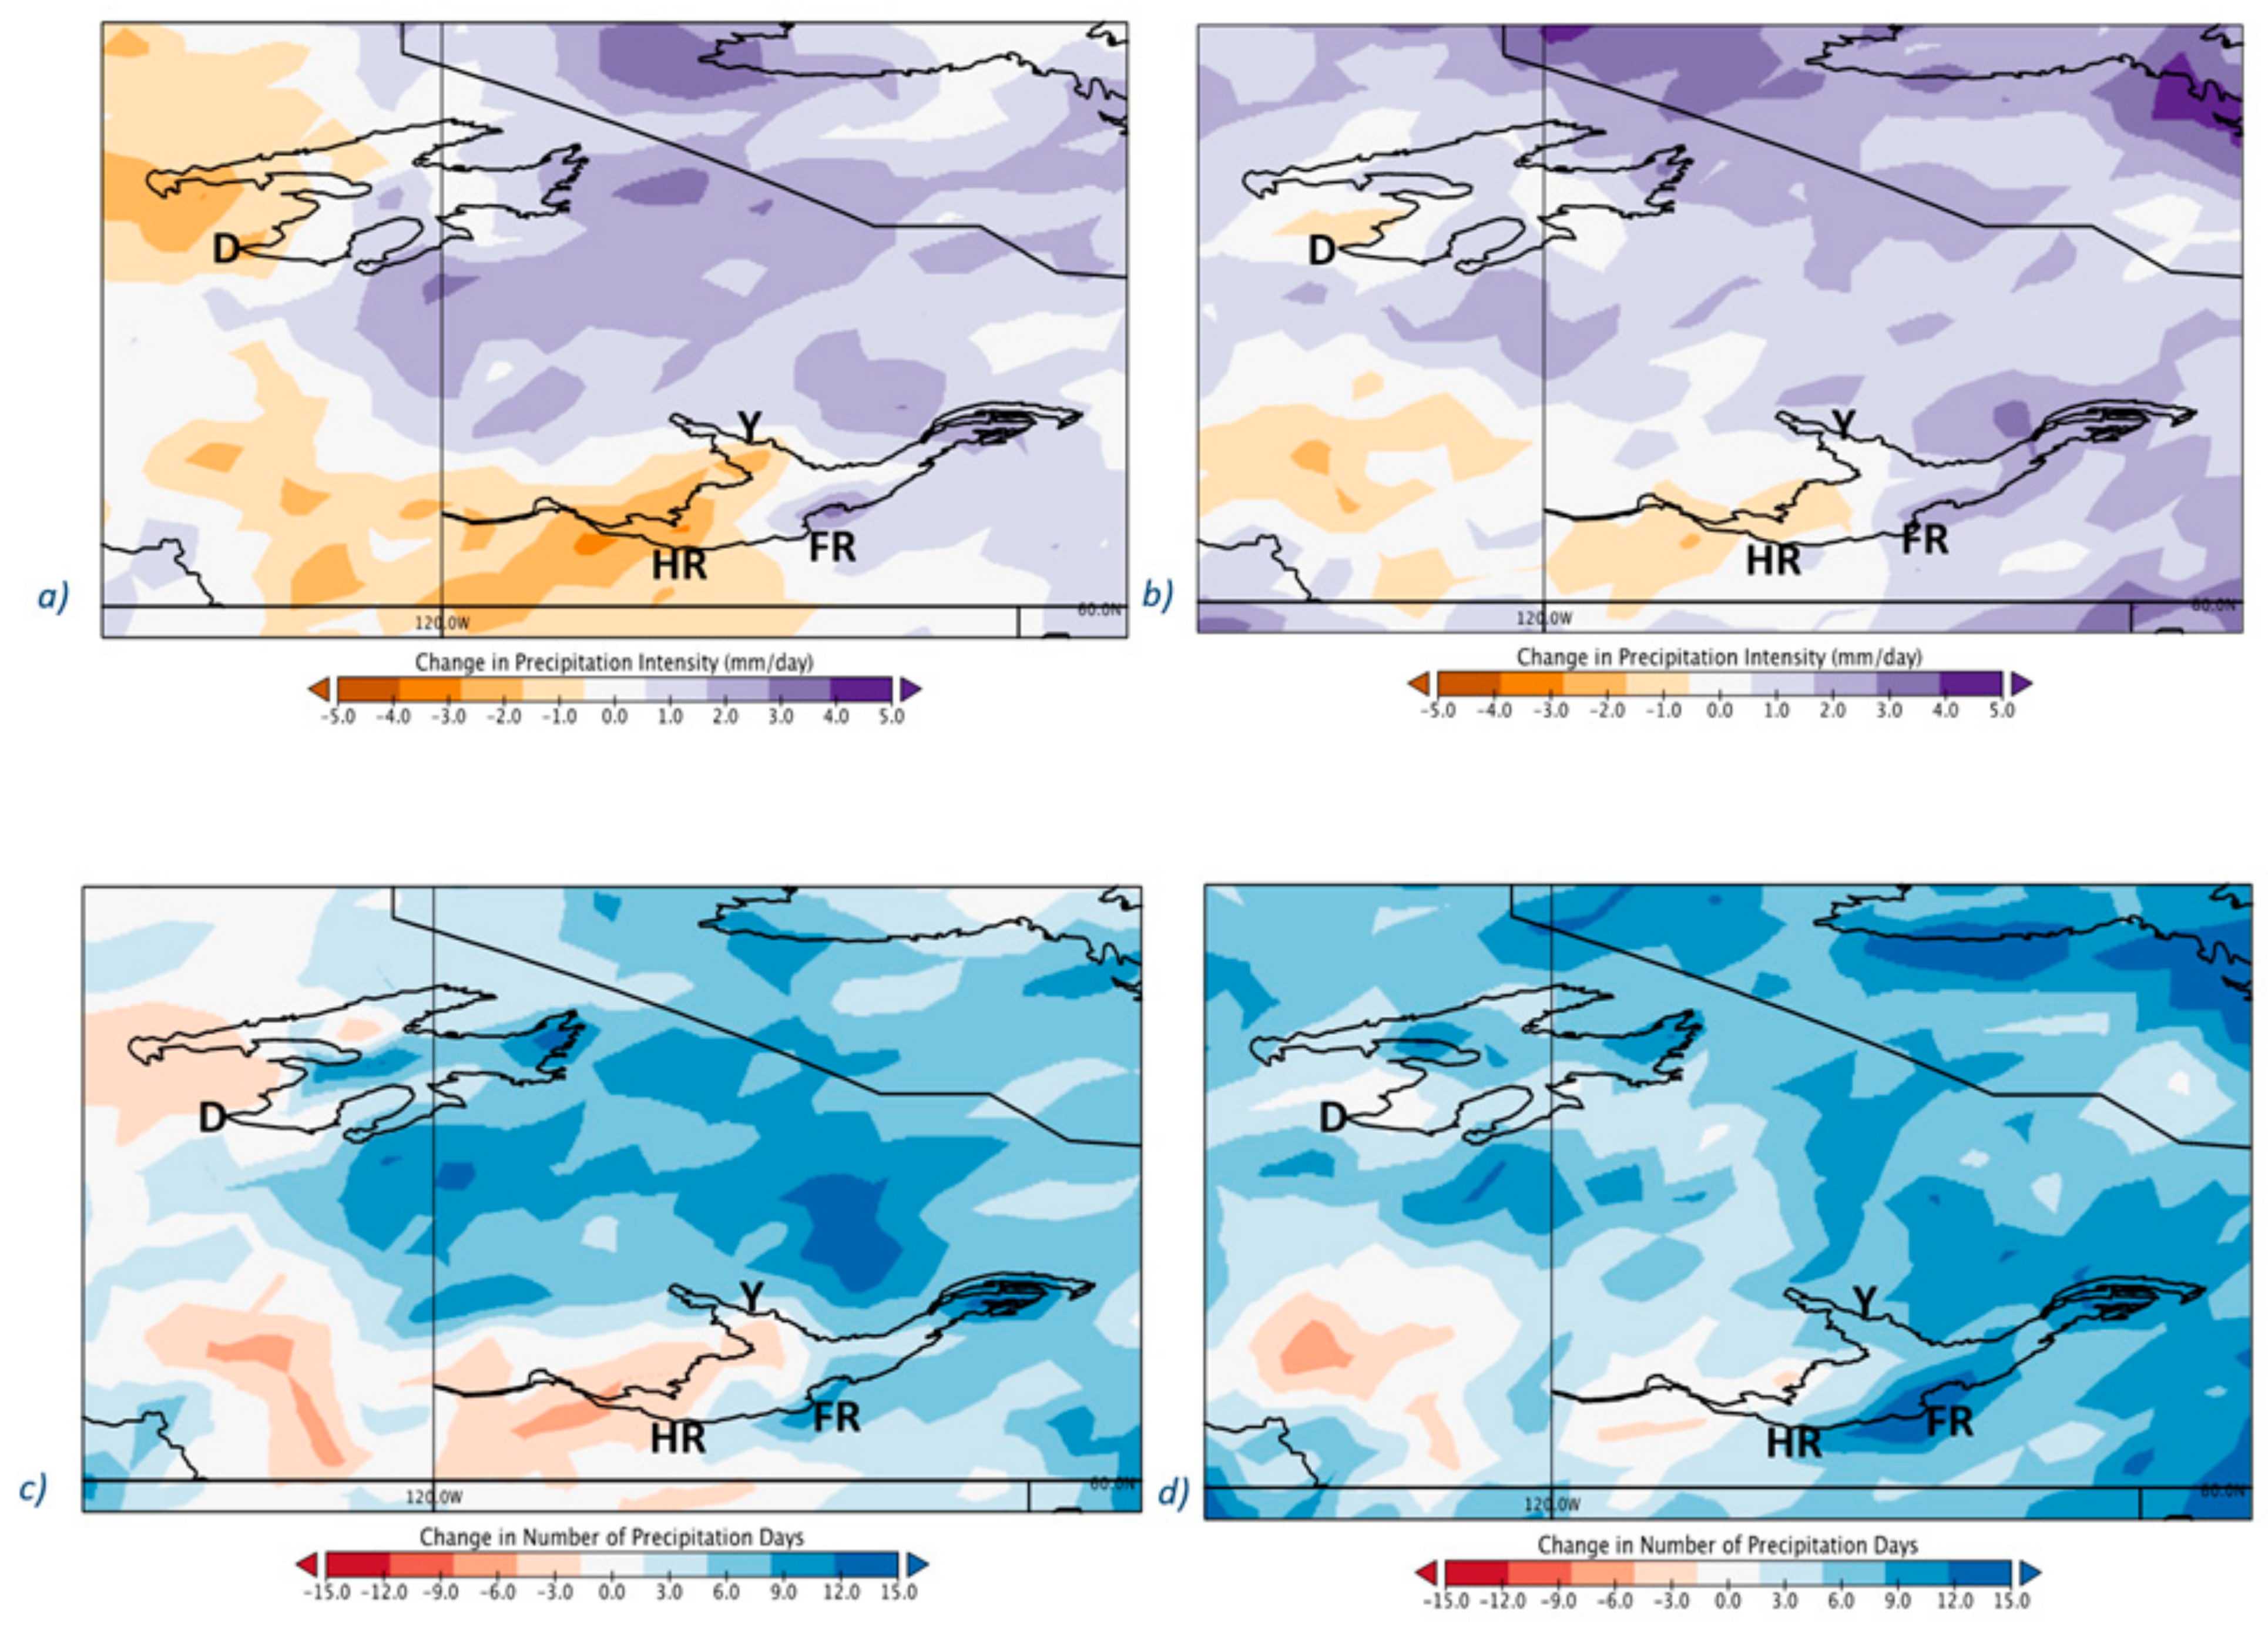
3.5. Future Simulation
4. Discussion
5. Conclusions
Author Contributions
Funding
Institutional Review Board Statement
Informed Consent Statement
Data Availability Statement
Conflicts of Interest
Appendix A
Appendix A.1. A Brief Description of Each Community
Appendix A.2. Description of Future Exposure Projection
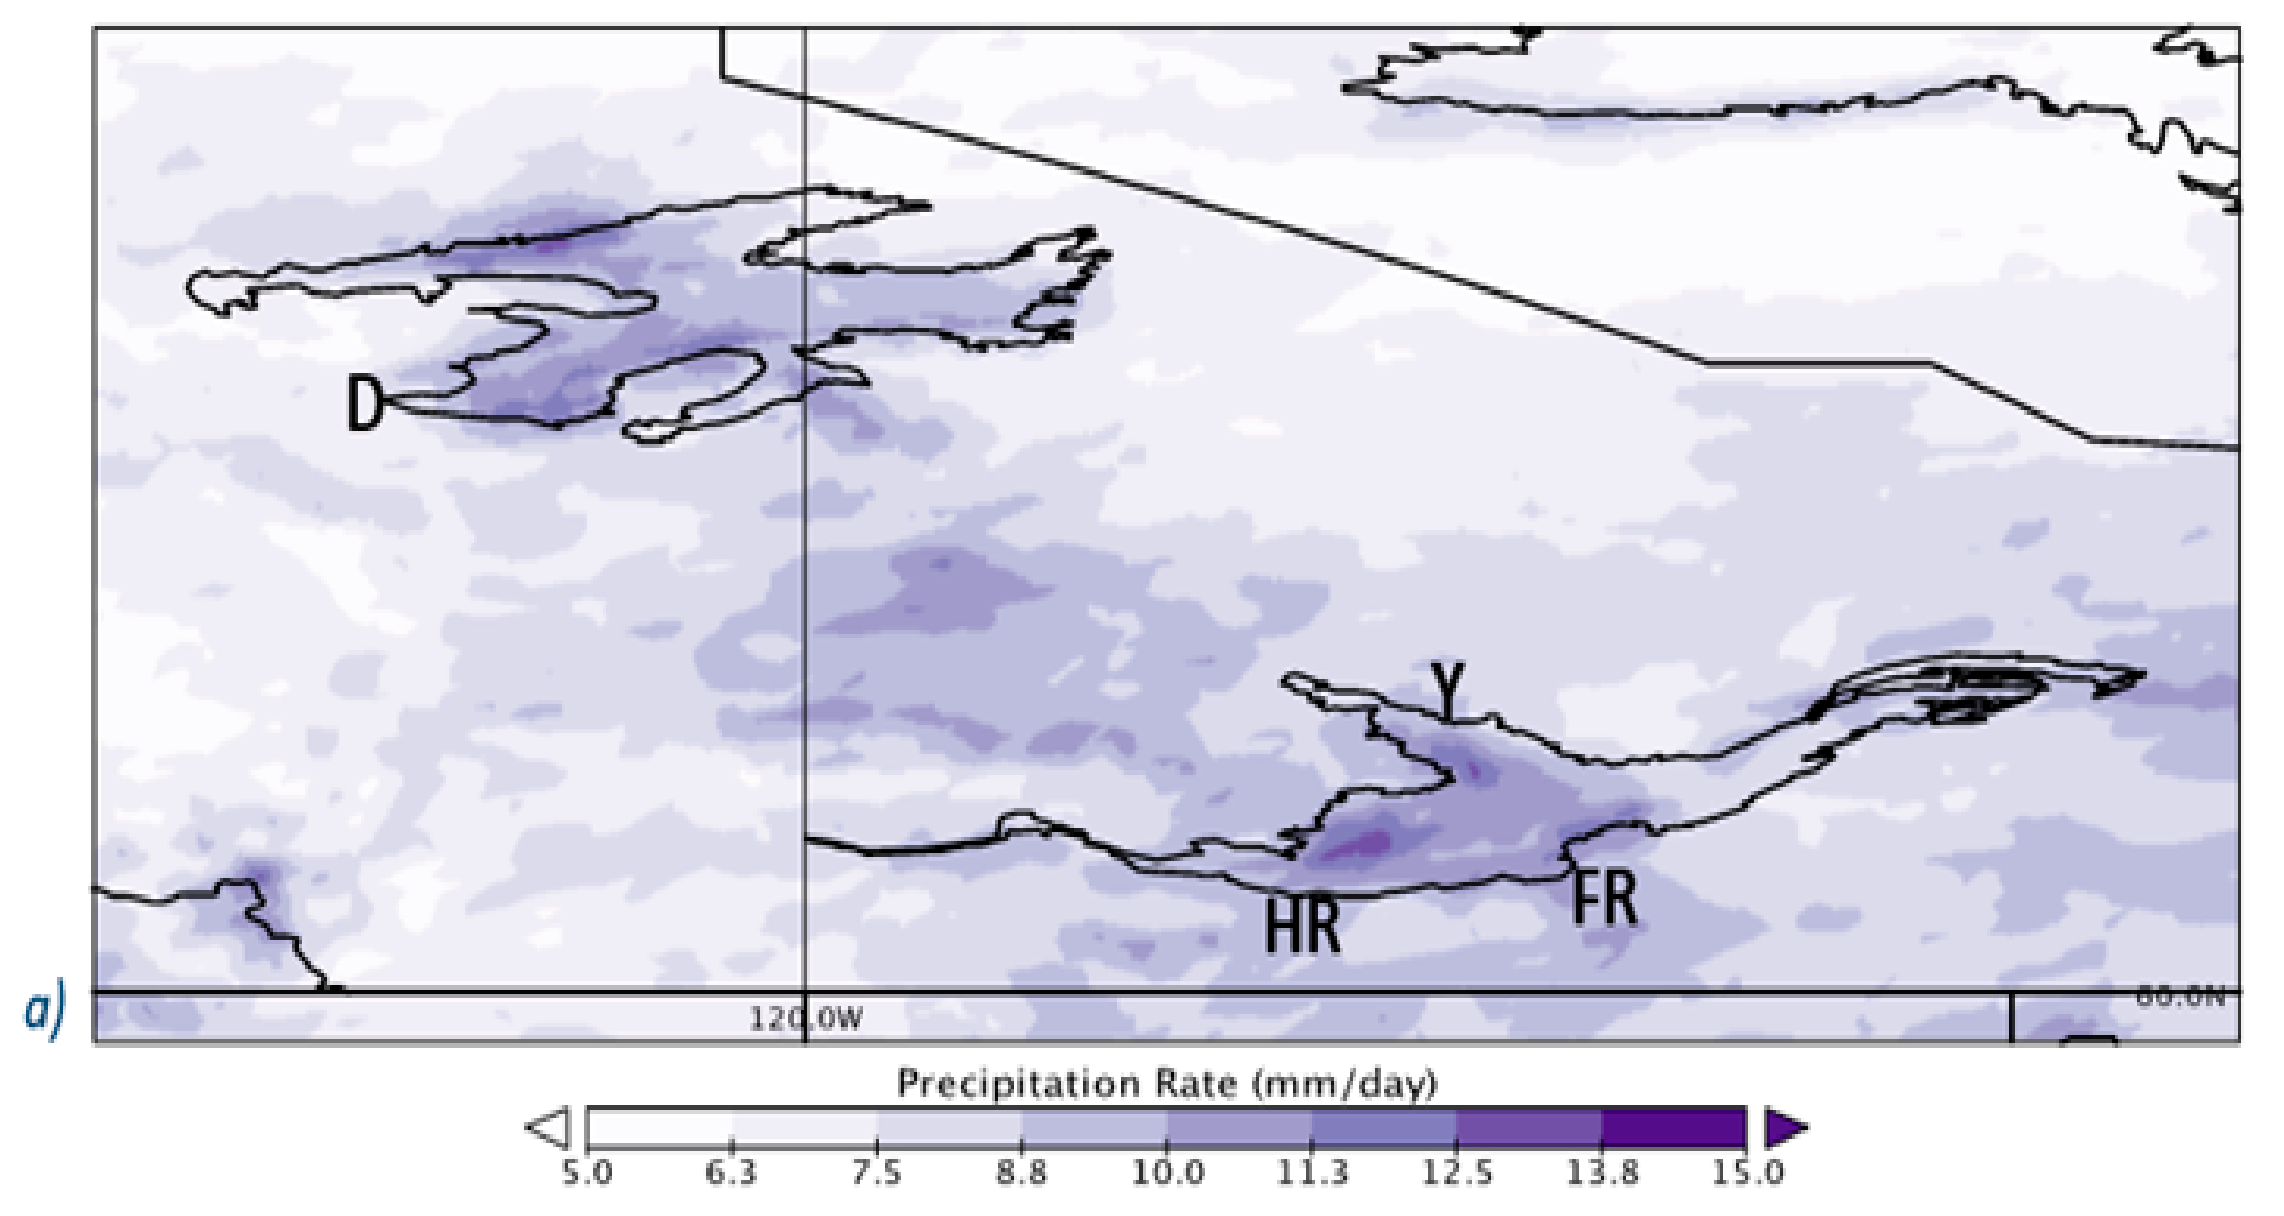
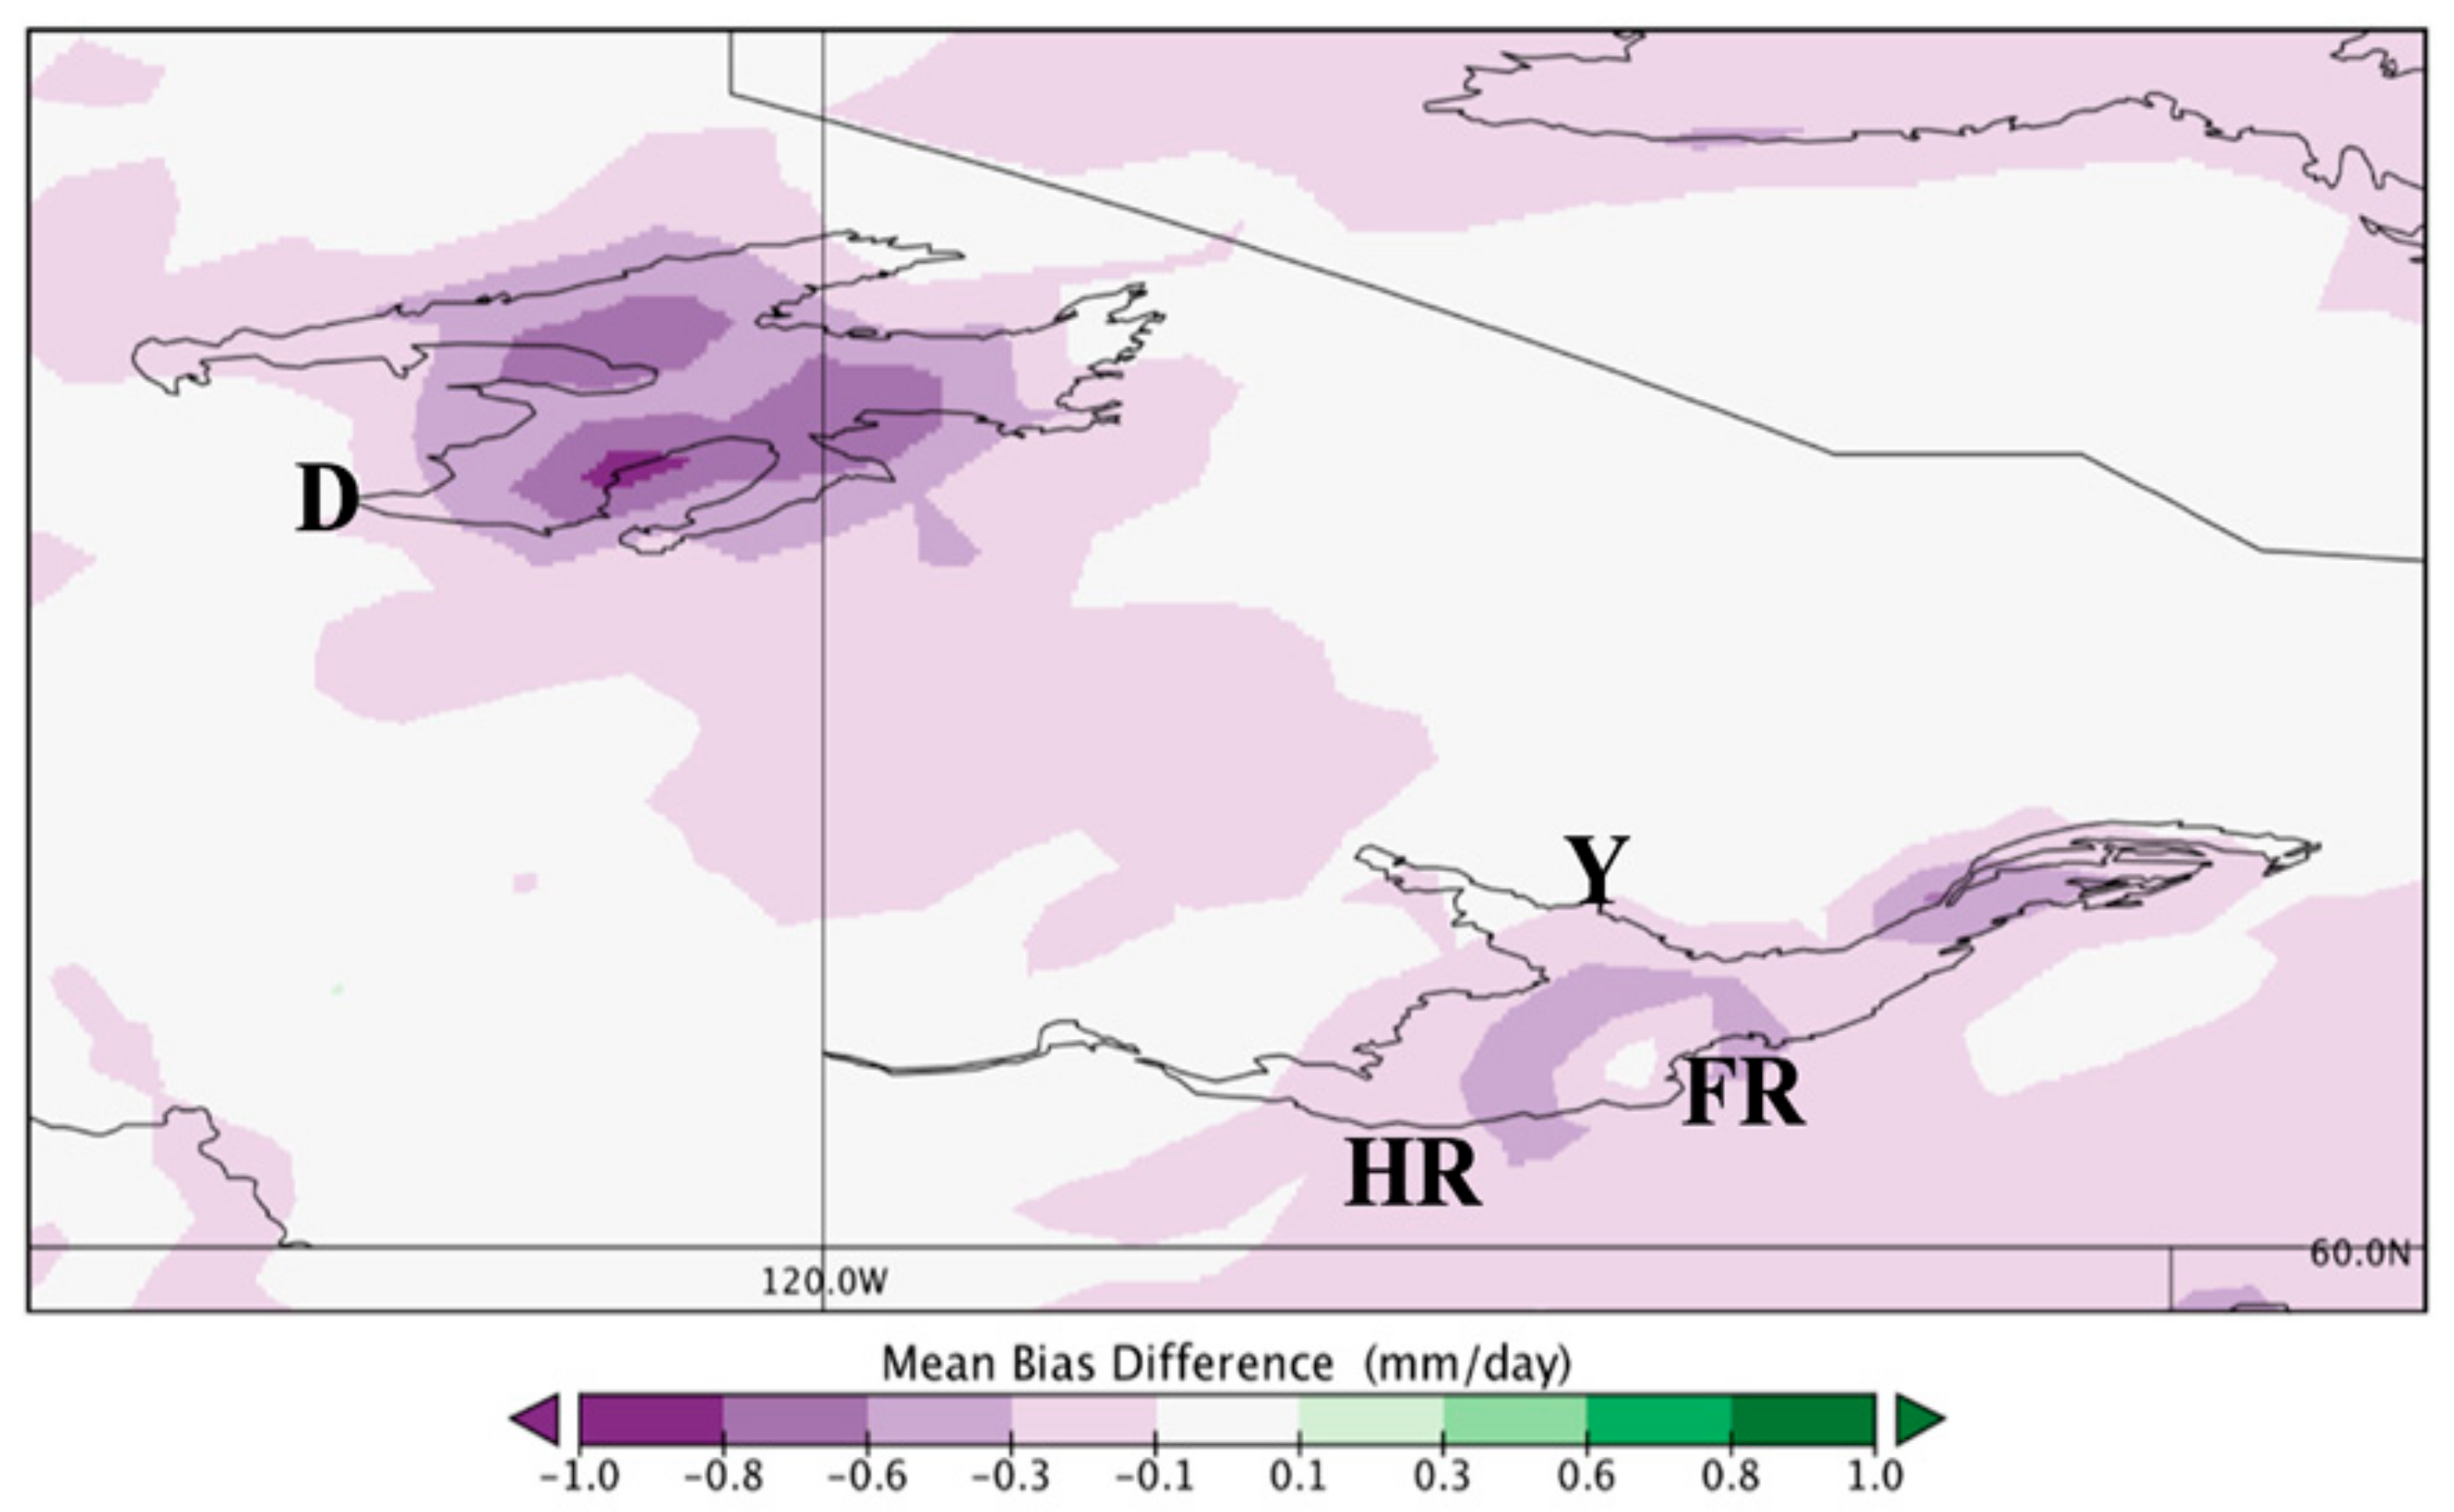
Appendix A.3. Validation Analysis


| (mm/day) | Yellowknife | Hay River | Déline | Fort Resolution |
|---|---|---|---|---|
| MBD | −0.2 | −0.2 | −0.1 | −0.4 |
Appendix A.4. Steps for Deriving 8 mm/Day Snowfall in the Liquid State
| Adaptive Capacity | |||||
|---|---|---|---|---|---|
| Major Sub Components | Subcomponents | Indicator | Contribution | Year & Source of Data | Unit |
| 1. Human Capital | Education | Attained post-secondary diploma or degree | The level of education represents a population who are informed and can respond accordingly to climate hazards | 2016: Statistics Canada Census Profile [54,58,59,60] | % of population |
| Apprentice or trade certificate or diploma | The level of education in the trades provides personnel with the right tools and know-how to respond to climate hazards, for example, electricians and construction workers that can fix potential damages from snowstorms, such as power outages or structural damages | 2016: Statistics Canada Census Profile [54,58,59,60] | % of population | ||
| Major field of study in natural resources and conservation | The level of education in the natural resources provides personnel with the right tools and know-how to respond to climate hazards, such as staying informed and being able to monitor natural environmental concerns, such as climate change hazards | 2016: Statistics Canada Census Profile [54,58,59,60] | % of population | ||
| Major field of study in personal, protective, and transportation services | The level of education in the protective services, such as police officers and other first responders, provides personnel with the right tools and know-how to respond in emergency situations during climate hazards | 2016: Statistics Canada Census Profile [54,58,59,60] | % of population | ||
| 2. Physical Capital | Transportation | Transportatio-n by main driver using car, truck, or van as a main mode of commuting for work | Having access to cars and trucks during hazardous weather makes residents able to reach their work destination and sustain their means of livelihood | 2016: Statistics Canada Census Profile [54,58,59,60] | % of population |
| Transportatio-n to work by public transit | Commuters having access to public transportation allows for safer driving (less traffic on roads) during major snowstorms | 2016: Statistics Canada Census Profile [54,58,59,60] | % of population | ||
| Communication | Number of households with home internet | Important accessibility to emergency access and information during hazardous conditions | 2013: NWT Bureau of Statistics [53] | % of population | |
| Housing | Major repairs required for home | Potential infrastructure issues that can be exacerbated due to heavy snowfall if infrastructure is not stable and secure | 2016: Statistics Canada Census Profile [54,58,59,60] | % of population | |
| 3. Financial Capital | Income | Average total income of households in 2015 | Higher income can provide financial aid in order to respond to climate hazards, such as the ability to incur damages to homes and for potential evacuations | 2015: Statistics Canada Census Profile [54,58,59,60] | Canadian Dollar value averaged by household-s |
| Cost of living | Households spending less than 30% of income on shelter costs (for owner and tenant households with total income greater than zero in non-farm, non-reserve private dwellings) | For residents spending less money on basic costs of living, more financial aid is available for emergency disasters | 2016: Statistics Canada Census Profile [54,58,59,60] | % of population | |
| Subsidies | % of tenants per household in subsidized housing (tenant in non farm, non reserve private dwellings) | Subsidies and financial aid in place to help residents so that they have more financial support for emergency situations Subsidized housing also reduces financial commitments of residents if snowstorms produce structural damages (leaks, insulation, collapsed roof) | 2016: Statistics Canada Census Profile [54,58,59,60] | % of population | |
| 4. Social Network | Social Support | Occupations in education, law and social, community and government services | Strong social network can aid in enacting positive changes. The presence of these occupations provide a social structure within the community to enable others to access resources, information, and social support that can increase the community’s adaptive capacity | 2016: Statistics Canada Census Profile [54,58,59,60] | % of population |
| Major field in public administratio-n and social service professions | The presence of these occupations provide a social structure within the community to enable others to access resources, information, and social support that can increase the community’s adaptive capacity | 2016: Statistics Canada Census Profile [54,58,59,60] | % of population | ||
| Population who volunteered in 2013 | Strong social network can aid in enacting positive changes. The higher the number of volunteers within a community, the greater the opportunity for such a community to get support from one another | % of population | |||
| 5. Natural Capital | Proximity to lakes | Approximate distance to closest lake center (INVERSE) | Shorter distance to the nearest lake suggests a community is closer and has more accessibility to the nearest lake and freshwater resources | 2020: Google Map Data | km |
| Sensitivity | |||||
| 1. Demographic | Family and households | Total lone-parent families | Greater numbers of lone-parent families indicate more people who are dependent in a household during hazardous events | 2016: Statistics Canada Census Profile [54,58,59,60] | % households |
| Dependency ratio | Population 60 years and older | Number of people who are dependent on the household during hazardous events due to old age | 2018: NWT Bureau of Statistics [53] | % of population dependen-y ratio | |
| Population density | Population and dwellings per km2 | Denser areas will have more people who are affected by highly localized winter storms | 2016: Statistics Canada Census Profile [54,58,59,60] | people/km2 | |
| Births | Teen births (number of teen births for 2017 divided by population of 2017) | These households are more dependent because resources may be limited for those who are not prepared for family planning | 2017: NWT Bureau of Statistics [53] | % of population | |
| 2. Labour | Journey to work | Commuting duration for employed labour force with a usual place of work or no fixed workplace address | Higher percentage of people commuting a long duration to work during a snowstorm makes them more exposed and at risk of accidents | 2016: Statistics Canada Census Profile [54,58,59,60] | % of population |
| Traditional Activities | Takes part in hunting and fishing | People who rely on fishing and hunting are more prone to be affected by changes in adverse snowstorms over lakes | 2013: NWT Bureau of Statistics [53] | % of population | |
| Takes part in trapping | People who rely on trapping are more prone to be affected by changes in adverse snowstorms over lakes | 2013: NWT Bureau of Statistics [53] | % of population | ||
| Employment rate | % of population employed (INVERSE) | Greater value indicates that people are most likely leaving their homes to go to work in adverse winter storm conditions | 2016: Statistics Canada Census Profile [54,58,59,60] | % of population | |
| 3. Health | Unhealthy | Population currently smoking | Increased health risk occurs due to adverse weather events for people already prone to health conditions | 2009: NWT Bureau of Statistics [53] | % of population |
| Exposure | |||||
| 1. Extremes | Extreme precipitation Intensity | 99th percentile of daily November precipitation rate for November (1980–2014) | The larger the intensity, the greater the exposure of winter storms, compromising communities’ infrastructure, finances, accessibility, safety, and health | (1980–2014) ERA Interim: McGill University Climate Change and Sustainable Engineering and Design (CCaSED) lab | mm/day |
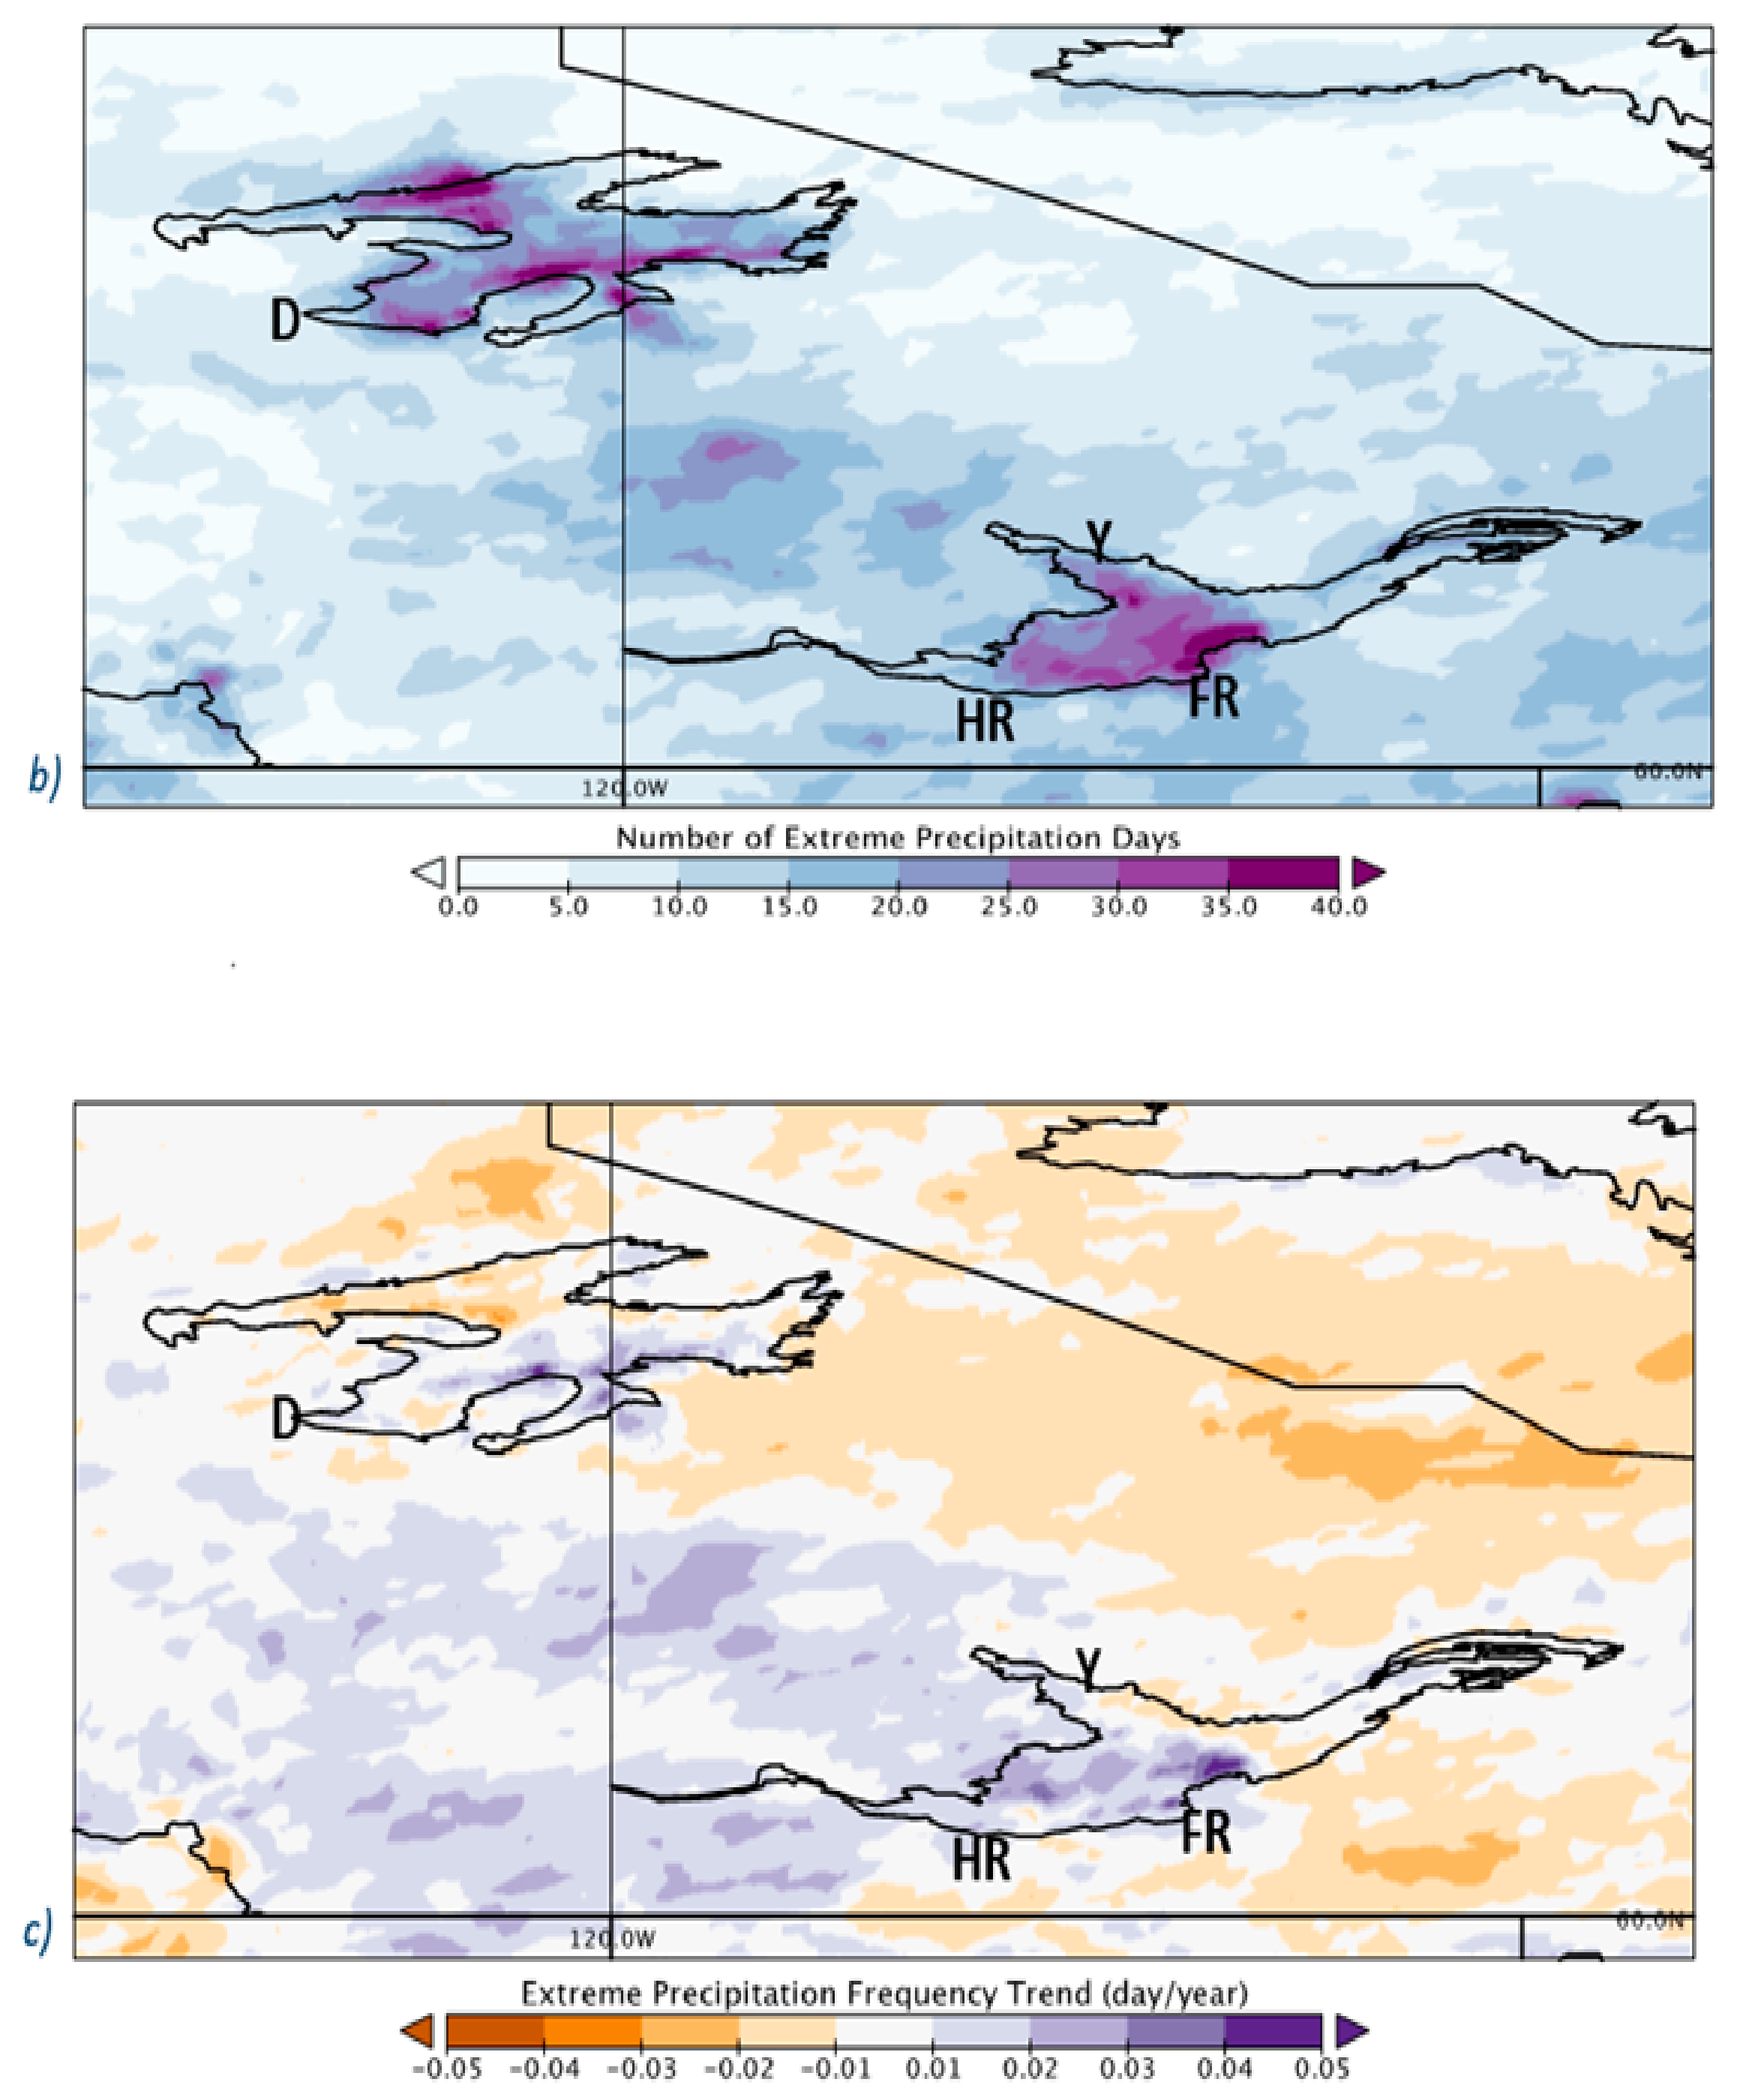
| Frequency of extreme precipitation days | Number of days daily precipitation exceeds 8 mm/day for November over the period of 1980 to 2014 | The greater the frequency of extreme precipitation days, the greater the winter storm exposure, compromising communities’ infrastructure, finances, accessibility, safety, and health | (1980–2014) ERA Interim: McGill University Climate Change and Sustainable Engineering and Design (CCaSED) lab | number of days | |
| Trend in extreme precipitation days | Trend in number of days daily precipitation exceeds 8 mm/day for November (1980–2014) | The greater the increase in frequency of extreme days, the greater the winter storm exposure, compromising communities’ infrastructure, finances, accessibility, safety, and health | (1980–2014) ERA Interim: McGill University Climate Change and Sustainable Engineering and Design (CCaSED) lab | days/year | |
| 2. Average Precipitation Variables | Average precipitation | Average precipitation over 5 years for November (2015–2019) | Greater November precipitation indicates greater potential that winter storms are prevalent | (2015–2019) Daymet [30] | mm/day |
| Average SWE | Average SWE over 5 years for November (2015–2019) | Greater November snow water equivalent indicates greater potential that winter storms are prevalent | (2015–2019) Daymet [30] | kg/m2 | |
| 3. Average Temperature Variables | Average max temperature | Average temp. max over 5 years (deg C) for November (2015–2019) (INVERSE) | Colder daily maximum temperatures indicate greater potential that winter storms are prevalent | (2015–2019) Daymet [30] | (deg C) |
| Average min temperature | Average temp. min over 5 years (deg C) for November (2015–2019) (INVERSE) | Colder daily minimum temperatures indicate greater potential that winter storms are prevalent | (2015–2019) Daymet [30] | (deg C) | |
| Scenario of Indicator Removed under Its Major Component | LVI for Yellowknife | LVI for Hay River | LVI for Déline | LVI for Fort Resolution |
|---|---|---|---|---|
| Original | 0.50 ** | 0.48 *** | 0.67 * | 0.26 **** |
| 1. Major field of study in personal, protective and transportation services: Human Capital | 0.49 ** | 0.48 *** | 0.65 * | 0.29 **** |
| 2.Major repairs needed: Physical Capital | 0.50 ** | 0.48 *** | 0.65 * | 0.24 **** |
| 3. % of tenants per household in subsidized housing (tenant in non farm, non reserve private dwellings): Financial Capital | 0.48 ** | 0.46 *** | 0.69 * | 0.25 **** |
| 4. Population who volunteered in 2013: Social Network | 0.50 **,**** | 0.50 **,*** | 0.65 * | 0.27 **** |
| 5. Approximate distant to closest lake center: Natural Capital | 0.50 ** | 0.47 *,** | 0.69 * | 0.23 **** |
| 6. Teen births (number of teen births for 2017 divided by population of 2017): Demographic | 0.50 ** | 0.49 *** | 0.69 * | 0.27 **** |
| 7. % of population employed: Labour | 0.49 ** | 0.48 *** | 0.65 * | 0.27 **** |
| 8. Population currently smoking: Health | 0.50 ** | 0.49 *** | 0.64 * | 0.30 **** |
| 9. Trend in extreme precipitation days: Extremes | 0.49 ** | 0.45 *** | 0.73 * | 0.20 **** |
| 10. Average SWE: Average Precipitation Variables | 0.50 *** | 0.51 ** | 0.62 * | 0.23 **** |
| 11. Average min temperature: Average Temperature Variables | 0.49 *** | 0.51 ** | 0.62 * | 0.27 **** |
References
- Arctic Climate Impact Assessment (ACIA). 2005. Available online: https://www.amap.no/documents/doc/arctic-arctic-climate-impact-assessment/796 (accessed on 5 January 2019).
- GNWT. Climate observations in the Northwest Territories (1957–2012) Inuvik Norman Wells Yellowknife Fort Resolution. 2015. Available online: https://www.enr.gov.nt.ca/sites/enr/files/page_3_nwt-climate-observations_06-13-2015_vf_1_0.pdf (accessed on 5 January 2019).
- Woo, M. Cold Region Atmospheric and Hydrologic Studies. The Mackenzie GEWEX Experience Volume 1: Atmospheric Dynamics; Springer: Berlin/Heidelberg, Germany, 2008. [Google Scholar]
- Blanken, P.; Rouse, W.; Schertzer, W.M. Time scales of evaporation from Great Slave Lake. In Cold Region Atmospheric and Hydrologic Studies: The Mackenzie GEWEX Experience Volume 2: Hydrologic Processes, 1st ed.; Wo, M.-K., Ed.; Springer: Berlin/Heidelberg, Germany, 2007; pp. 181–196. [Google Scholar]
- Baijnath-Rodino, J.A.; Duguay, C.R. Historical spatiotemporal trends in snowfall extremes over the Canadian domain of the Great Lakes Basin. Adv. Meteorol. 2018, 2018, 1–20. [Google Scholar] [CrossRef]
- Baijnath-Rodino, J.A.; Duguay, C.R.; LeDrew, E. Climatological trends of snowfall over the Laurentian Great Lakes Basin. Int. J. Clim. 2018, 38, 3942–3962. [Google Scholar] [CrossRef]
- Baijnath-Rodino, J.A.; Duguay, C.R. Assessment of coupled CRCM5–FLake on the reproduction of wintertime lake-induced precipitation in the Great Lakes Basin. Theor. Appl. Clim. 2019, 138, 77–96. [Google Scholar] [CrossRef]
- Derksen, C.; Sturm, M.; Liston, G.E.; Holmgren, J.; Huntington, H.; Silis, A.; Solie, D. Northwest Territories and Nunavut snow characteristics from a subarctic traverse: Implications for passive microwave remote sensing. J. Hydrometeorol. 2009, 10, 448–463. [Google Scholar] [CrossRef]
- NWT, 2014: Northwest Territories Hazard Identification Risk Assessment, Vanguard EMC Inc. 1/1/2014). Available online: https://www.maca.gov.nt.ca/sites/maca/files/resources/nwt-hira-final.pdf (accessed on 5 January 2019).
- Pryor, J.; Cobb, P. Creating a More Resilient Yellowknife, Climate Change Impacts and Municipal Decision Making; The Pembina Institute: Calgary, AB, Canada, 2007. [Google Scholar]
- Auger, N.; Potter, B.; Smargiassi, A.; Bilodeau-Bertrand, M.; Paris, C.; Kosatsky, T. Association between quantity and duration of snowfall and risk of myocardial infarction. Can. Med. Assoc. J. 2017, 189, E235–E242. [Google Scholar] [CrossRef] [Green Version]
- Ford, J.D.; Furgal, C. Foreword to the special issue: Climate change impacts, adaptation and vulnerability in the Arctic. Polar Res. 2009, 28, 1–9. [Google Scholar] [CrossRef]
- Adger, W.N. Vulnerability. Glob. Environ. Chang. 2006, 16, 268–281. [Google Scholar] [CrossRef]
- Albizua, A.; Corbera, E.; Pascual, U. Farmers’ vulnerability to global change in Navarre, Spain: Large-scale irrigation as maladaptation. Reg. Environ. Chang. 2019, 19, 1147–1158. [Google Scholar] [CrossRef]
- Dolan, A.H.; Walker, I. Understanding vulnerability of coastal communities to climate change related risk. J. Coast. Res. 2006, 39, 1316–1323. [Google Scholar]
- Berkes, F.; Armitage, D. Co-management institutions, knowledge, and learning: Adapting to change in the Arctic. Études/Inuit/Stud. 2010, 34, 109–131. [Google Scholar] [CrossRef] [Green Version]
- Jeong, D.I.; Sushama, L. Rain-on-snow events over North America based on two Canadian regional climate models. Clim. Dyn. 2017, 50, 303–316. [Google Scholar] [CrossRef] [Green Version]
- Duguay, C.R.; Prowse, T.D.; Bonsal, B.R.; Brown, R.D.; Lacroix, M.P.; Ménard, P. Recent trends in Canadian lake ice cover. Hydrol. Process. 2006, 20, 781–801. [Google Scholar] [CrossRef]
- Ford, J.; Falk, K.; Tesar, C.; Jacobsen, R.B. Adaptation and Resilience. In Adaptation Actions for a Changing Arctic: Perspectives from the Baffin Bay/Davis Strait Region; Arctic Monitoring and Assessment Programme: Oslo, Norway, 2018; pp. 307–328. [Google Scholar]
- Smit, B.; Hovelsrud, G.; Wandel, J. Community Adaptation and Vulnerability in Arctic Regions; Springer: Dordrecht, The Netherlands, 2008. [Google Scholar] [CrossRef]
- Ford, J.D.; Smit, B. A framework for assessing the vulnerability of communities in the Canadian Arctic to risks associated with climate change. Arctic 2004, 57, 389–400. [Google Scholar] [CrossRef]
- Hahn, M.B.; Riederer, A.M.; Foster, S.O. The Livelihood Vulnerability Index: A pragmatic approach to assessing risks from climate variability and change—A case study in Mozambique. Glob. Environ. Chang. 2009, 19, 74–88. [Google Scholar] [CrossRef]
- Wu, S.-Y.; Yarnal, B.; Fisher, A. Vulnerability of coastal communities to sea-level rise: A case study of Cape May County, New Jersey, USA. Clim. Res. 2002, 22, 255–270. [Google Scholar] [CrossRef] [Green Version]
- O’Brien, K.; Quinlan, T.; Ziervogel, G. Vulnerability interventions in the context of multiple stressors: Lessons from the Southern Africa Vulnerability Initiative (SAVI). Environ. Sci. Policy 2009, 12, 23–32. [Google Scholar] [CrossRef]
- Thornton, P.K.; Jones, P.G.; Owiyo, T.M.; Kruska, R.L.; Herrero, M.; Kristjanson, P.; Notenbaert, A.; Bekele, N.; Orindi, V.; Otiende, B.; et al. Mapping Climate Vulnerability and Poverty in Africa; ILRI: Nairobi, Kenya, 2006; 200p. [Google Scholar]
- Sinchi, U.K. Available online: https://sinchi-foundation.com/news/hunting-season-great-slave-lake/ (accessed on 5 January 2019).
- Hamley, W. The Geographical Review; Tourism in the Northwest Territories; Taylor & Francis: Abingdon, UK, 1991; Volume 81, No. 4; pp. 389–399. [Google Scholar]
- Hamley, W. Geography; Problems and Challenges in Canada’s Northwest Territories; Geographical Association: Sheffield, UK, 1993; Volume 78, No. 3; pp. 267–280. [Google Scholar]
- Thornton, P.; Running, S.W.; White, M.A. Generating surfaces of daily meteorological variables over large regions of complex terrain. J. Hydrol. 1997, 190, 214–251. [Google Scholar] [CrossRef] [Green Version]
- Thornton, P.E.; Thornton, M.M.; Mayer, B.W.; Wei, Y.; Devarakonda, R.; Vose, R.S.; Cook, R.B. Daymet: Daily Surface Weather Data on a 1-km Grid for North. America, Version 3; ORNL DAAC: Oak Ridge, TN, USA, 2017. [Google Scholar]
- Cote, J.; Gravel, S.; Methot, A.; Patoine, A.; Roch, M.; Staniforth, A. The operational CMC-MRB global environmental multiscale (GEM) model. Part I: Design considerations and formulations. Mon. Weather. Rev. 1998, 126, 1373–1395. [Google Scholar] [CrossRef]
- Yeh, K.S.; Cote, J.; Gravel, S.; Methot, A.; Patoine, A.; Roch, M.; Staniforth, A. The CMC-MRB global environmental multiscale (GEM) model. Part III: Nonhydrostatic formulation. Mon. Weather. Rev. 2002, 130, 339–356. [Google Scholar] [CrossRef]
- Huziy, O.; Sushama, L. Impact of lake–river connectivity and interflow on the Canadian RCM simulated regional climate and hydrology for Northeast Canada. Clim. Dyn. 2017, 48, 709–725. [Google Scholar] [CrossRef] [Green Version]
- Kourzeneva, E.P.; Samuelsson, P.; Ganbat, G.; Mironov, D. Implementation of lake model Flake into HIRLAM. HIRLAM Newsl. 2008, 54, 54–64. [Google Scholar]
- Martynov, A.; Laprise, R.; Sushama, L. Off-Line Lake Water and Ice Simulations: A Step Towards the Interactive Lake Coupling with the Canadian Regional Climate Model Geophysical Research Abstract, 10, EGU2008-A-02898; EGU General Assembly: Vienna, Austria, 2008. [Google Scholar]
- Mironov, D.; Heise, E.; Kourzeneva, E.; Ritter, B.; Schneider, N.; Terzhevik, A. Implementation of the lake parameterisation scheme Flake into the numerical weather prediction model COSMO. Boreal Environ. Res. 2010, 15, 218–230. [Google Scholar]
- Samuelsson, P.; Kourzeneva, E.; Mironov, D. The impact of lakes on the European climate as simulated by a regional climate model. Boreal Environ. Res. 2010, 15, 113–129. [Google Scholar]
- Kheyrollah Pour, H.; Duguay, C.R.; Martynov, A.; Brown, L.C. Simulation of surface temperature and ice cover of large northern lakes with 1-D models: A comparison with MODIS satellitedata and in situ measurements. Tellus A Dyn. Meteorol. Oceanogr. 2012, 64, 17614. [Google Scholar] [CrossRef] [Green Version]
- Semmler, T.; Cheng, B.; Yang, Y.; Rontu, L. Snow and ice on Bear Lake (Alaska)—Sensitivity experiments with two lake ice models. Tellus A Dyn. Meteorol. Oceanogr. 2012, 64, 17339. [Google Scholar] [CrossRef] [Green Version]
- Mallard, M.S.; Nolte, C.G.; Bullock, O.R.; Spero, T.; Gula, J. Using a coupled lake model with WRF for dynamical downscaling. J. Geophys. Res. Atmos. 2014, 119, 7193–7208. [Google Scholar] [CrossRef]
- IPCC. Climate Change 2001. Impacts, Adaptation and Vulnerability: Summary for Policymakers; Cambridge University Press: Cambridge, UK, 2001. [Google Scholar]
- Ebi, K.L.; Kovats, R.S.; Menne, B. An Approach for Assessing Human Health Vulnerability and Public Health Interventions to Adapt to Climate Change. Environ. Health Perspect. 2006, 114, 1930–1934. [Google Scholar] [CrossRef] [PubMed] [Green Version]
- Notenbaert, A.; Karanja, S.N.; Herrero, M.; Felisberto, M.; Moyo, S. Derivation of a household-level vulnerability index for empirically testing measures of adaptive capacity and vulnerability. Reg. Environ. Chang. 2013, 13, 459–470. [Google Scholar] [CrossRef]
- Speranza, C.I.; Wiesmann, U.; Rist, S. An indicator framework for assessing livelihood resilience in the context of social–ecological dynamics. Glob. Environ. Chang. 2014, 28, 109–119. [Google Scholar] [CrossRef]
- Pandey, R.; Jha, S. Climate vulnerability index—measure of climate change vulnerability to communities: A case of rural Lower Himalaya, India. Mitig. Adapt. Strat. Glob. Chang. 2012, 17, 487–506. [Google Scholar] [CrossRef]
- Wesche, S.; Armitage, D.R. As long as the sun shines, the rivers flow and grass grows’: Vulnerability, adaptation and environmental change in Deninu Kue Traditional Territory, Northwest Territories. In Community Adaptation and Vulnerability in Arctic Regions; Springer: Dordrecht, The Netherlands, 2008; pp. 163–189. [Google Scholar]
- Pearce, T.; Smit, B.; Duerden, F.; Ford, J.; Goose, A.; Kataoyak, F. Inuit vulnerability and adaptive capacity to climate change in Ulukhaktok, Northwest Territories, Canada. Polar. Record. 2010, 46, 157–177. [Google Scholar] [CrossRef] [Green Version]
- Eakin, H.; Bojórquez-Tapia, L.A. Insights into the composition of household vulnerability from multicriteria decision analysis. Glob. Environ. Chang. 2008, 18, 112–127. [Google Scholar] [CrossRef]
- Langemeyer, J.; Gómez-Baggethun, E.; Haase, D.; Scheuer, S.; Elmqvist, T. Bridging the gap between ecosystem service assessments and land-use planning through Multi-Criteria Decision Analysis (MCDA). Environ. Sci. Policy 2016, 62, 45–56. [Google Scholar]
- Sullivan, C.; Meigh, J.R.; Fediw, T.S. Derivation and Testing of the Water Poverty Index Phase1: Final Report; Department for International Development: Wallingford, UK, 2002. [Google Scholar]
- Sullivan, C.; Meigh, J. Targeting attention on local vulnerability using an integrated index approach: The example of the climate vulnerability index. Water Sci. Technol. 2005, 51, 69–78. [Google Scholar] [CrossRef] [PubMed]
- Canadian Encyclopedia, Published by: Historical Canada, Toronto, 2014. Available online: https://www.thecanadianencyclopedia.ca/en/article/nunavut (accessed on 1 November 2020).
- Northwest Bureau of Statistics. Available online: https://www.statsnwt.ca/community-data/index.html (accessed on 1 June 2020).
- Statistics Canada. Yellowknife [Census Agglomeration], Northwest Territories and Northwest Territories [Territory] (Table). Census Profile. 2016 Census. Statistics Canada Catalogue no. 98-316-X2016001. Ottawa. Released November 29, 2017. 2017. Available online: https://www12.statcan.gc.ca/census-recensement/2016/dp-pd/prof/index.cfm?Lang=E (accessed on 3 December 2020).
- Notaro, M.; Zarrin, A.; Vavrus, S.; Bennington, V. Simulation of Heavy Lake-Effect Snowstorms across the Great Lakes Basin by RegCM4: Synoptic Climatology and Variability. Mon. Weather. Rev. 2013, 141, 1990–2014. [Google Scholar] [CrossRef]
- Legates, D.R.; Willmott, C.J. Mean seasonal and spatial variability in global surface air temperature. Theor Appl Climatol. 1990, 41, 11–21. [Google Scholar] [CrossRef]
- Rawlins, M.; Willmott, C.; Shiklomanov, A.; Linder, E.; Frolking, S.; Lammers, R.; Vörösmarty, C. Evaluation of trends in derived snowfall and rainfall across Eurasia and linkages with discharge to the Arctic Ocean. Geophys. Res. Lett. 2006, 33. [Google Scholar] [CrossRef] [Green Version]
- Statistics Canada. Déline, CC [Census Subdivision], Northwest Territories and Region 2, REG [Census Division], Northwest Territories (Table). Census Profile. 2016 Census. Statistics Canada Catalogue no. 98-316-X2016001. Ottawa. Released 29 November 2017. 2017. Available online: https://www12.statcan.gc.ca/census-recensement/2016/dp-pd/prof/index.cfm?Lang=E (accessed on 3 December 2020).
- Statistics Canada. Fort Resolution, HAM [Census subdivision], Northwest Territories and Region 5, REG [Census division], Northwest Territories (table). Census Profile. 2016 Census. Statistics Canada Catalogue No. 98-316-X2016001. Ottawa. Released 29 November 2017. 2017. Available online: https://www12.statcan.gc.ca/census-recensement/2016/dp-pd/prof/index.cfm?Lang=E (accessed on 3 December 2020).
- Statistics Canada. Hay River, T [Census subdivision], Northwest Territories and Region 5, REG [Census division], Northwest Territories (table). Census Profile. 2016 Census. Statistics Canada Catalogue No. 98-316-X2016001. Ottawa. Released 29 November 2017. 2017. Available online: https://www12.statcan.gc.ca/census-recensement/2016/dp-pd/prof/index.cfm?Lang=E (accessed on 3 December 2020).


| Name | Title | Population (2016) | Coordinate Location | Closest Lake |
|---|---|---|---|---|
| Yellowknife | City | 19,234 | 62.46 N 114.44 W | Great Slave |
| Hay River | Town | 3606 | 60.84 N 115.78 W | Great Slave |
| Déline | Charter Community | 533 | 65.21 N 123.43 W | Great Bear |
| Fort Resolution | Hamlet | 474 | 61.18 N 113.69 W | Great Slave |
Publisher’s Note: MDPI stays neutral with regard to jurisdictional claims in published maps and institutional affiliations. |
© 2021 by the authors. Licensee MDPI, Basel, Switzerland. This article is an open access article distributed under the terms and conditions of the Creative Commons Attribution (CC BY) license (https://creativecommons.org/licenses/by/4.0/).
Share and Cite
Baijnath-Rodino, J.A.; Albizua, A.; Sushama, L.; Bennett, E.; Robinson, B.E. Determining Freshwater Lake Communities’ Vulnerability to Snowstorms in the Northwest Territories. Water 2021, 13, 1816. https://doi.org/10.3390/w13131816
Baijnath-Rodino JA, Albizua A, Sushama L, Bennett E, Robinson BE. Determining Freshwater Lake Communities’ Vulnerability to Snowstorms in the Northwest Territories. Water. 2021; 13(13):1816. https://doi.org/10.3390/w13131816
Chicago/Turabian StyleBaijnath-Rodino, Janine A., Amaia Albizua, Laxmi Sushama, Elena Bennett, and Brian E. Robinson. 2021. "Determining Freshwater Lake Communities’ Vulnerability to Snowstorms in the Northwest Territories" Water 13, no. 13: 1816. https://doi.org/10.3390/w13131816
APA StyleBaijnath-Rodino, J. A., Albizua, A., Sushama, L., Bennett, E., & Robinson, B. E. (2021). Determining Freshwater Lake Communities’ Vulnerability to Snowstorms in the Northwest Territories. Water, 13(13), 1816. https://doi.org/10.3390/w13131816