Article

Spatial and Temporal Variation Characteristics of Snowfall in the Haihe River Basin from 1960 to 2016

1
School of Water Conservancy and Hydroelectric Power, Hebei University of Engineering, Handan 056021, China
2
Hydrology and Water Resources Survey Bureau of Handan, Handan 056001, China
3
Hebei Key Laboratory of Intelligent Water Conservancy, Handan 056001, China
*
Authors to whom correspondence should be addressed.
Water 2021, 13(13), 1798; https://doi.org/10.3390/w13131798
Submission received: 28 April 2021 / Revised: 20 June 2021 / Accepted: 21 June 2021 / Published: 29 June 2021

Abstract

:
The spatio-temporal variation of precipitation under global warming had been a research hotspot. Snowfall is an important part of precipitation, and its variabilities and trends in different regions have received great attention. In this paper, the Haihe River Basin is used as a case, and we employ the K-means clustering method to divide the basin into four sub-regions. The double temperature threshold method in the form of the exponential equation is used in this study to identify precipitation phase states, based on daily temperature, snowfall, and precipitation data from 43 meteorological stations in and around the Haihe River Basin from 1960 to 1979. Then, daily snowfall data from 1960 to 2016 are established, and the spatial and temporal variation of snowfall in the Haihe River Basin are analyzed according to the snowfall levels as determined by the national meteorological department. The results evalueted in four different zones show that (1) the snowfall at each meteorological station can be effectively estimated at an annual scale through the exponential equation, for which the correlation coefficient of each division is above 0.95, and the relative error is within 5%. (2) Except for the average snowfall and light snowfall, the snowfall and snowfall days of moderate snow, heavy snow, and snowstorm in each division are in the order of Zones III > IV > I > II. (3) The snowfall and the number of snowfall days at different levels both show a decreasing trend, except for the increasing trend of snowfall in Zone I. (4) The interannual variation trend in the snowfall at the different levels are not obvious, except for Zone III, which shows a significant decreasing trend.

1. Introduction

Snowfall is a solid form of precipitation [1,2], and different snowfall intensities produce different hydrological effects [3,4,5,6]. Snowfall changes the physical characteristics of the surface over a short period, increases the surface reflectance, reduces the surface absorption of solar radiation, delays the time for runoff generation and confluence, and changes the water cycle process of a basin. Snowfall is the main form of precipitation in the winter in many places globally, such that suitable snowfall can supplement soil moisture, increase soil fertility, and contribute to crop growth. In addition, snowfall plays an important role in alleviating water shortages and protecting the ecological environment [7]. In contrast, heavy snow is prone to cause natural disasters, such as avalanches and snow damage [8,9,10,11], which have a serious impact on transportation, agricultural production, and even the safety of human life and property [12,13]. With continuous climate warming, the response of snowfall to climate change is remarkable [14,15,16,17], i.e., extreme snowfall events continue to frequently occur around the world [18], and cause significant losses to human life and property. Therefore, research on the spatial and temporal variation characteristics of snowfall at different levels in the context of climate warming has a practical significance in the formulation of natural disaster prevention and mitigation policies, the development of snow disaster prediction abilities, and the reduction of national economic losses [3,19,20].
Previous studies in various fields have conducted extensive investigations on the spatial and temporal variations of snowfall. By simulating the variation trends in winter snowfall in western and central Europe, Vries et al. [21] and De et al. [22] found that the snowfall in their study areas in the context of global warming has a significant increasing trend, with an increased number of abnormal snowfall events. Bintanja [23] simulated the variation trend in snowfall in the Arctic using several global climate models, suggesting that climate warming is the main reason for the increase in snowfall in the Arctic region. By analyzing the snowfall in Xinjiang, China, Wenxuan et al. [24] found that the total snowfall, number of snowfall days, and snowfall at each level in Xinjiang all showed an increasing trend. For snowfall in Southern Xinjiang and the Tianshan Mountains in China, Toynizhi et al. [25], Junrong and Jiaqi [26], and Xiaoshouet al. [27] showed that the snowfall in winter had a significant increasing trend. Mishra and Rafiq [28] examined the snowfall variability over the Pahalgam and Gulmarg regions of India, and found that snowfall had decreasing trends in both of them. Huntington et al. [29] in New England found that the annual snowfall to total precipitation (S/P) ratios had significantly decreased from 1949 to 2000. Irannezhad et al. [30] evaluated variabilities and trends in annual S/P ratio at Sodankylä, Kajaani, and Kaisaniemi weather stations in northern, central, and southern Finland during 1909–2008, it found that the annual snowfall to total precipitation (S/P) ratio declined in Finland in 1909–2008. Raisanen [31] found that winter snowfall decreased, but snowfall in the coldest region in winter increased slightly by simulating the snowfall in northern Europe through the twelve regional models. Lute et al. [32], Ning and Bradley [33] studied on snowfall changes in the United States, and found that the snowfall and number of snowfall days in the United States have decreased significantly. Chunyu et al. [34] investigated the variation trend in snowfall in northeast China, finding that snowfall in winter had a decreasing trend. In addition, Skoulikaris et al. [35] investigated the connection of snowfall with river discharges; it simulated with a snowmelt-runoff model a mountainous transboundary basin in the northern Mediterranean and concluded that overestimated river discharges coincided with datasets integrating higher averaged daily temperatures that affected the snowmelt process. Therefore, the snowfall variation trends in different regions have notable differences in response to climate change.
Identifying the phase of precipitation is a key issue in current snowfall research. Currently, the method based on temperature is generally used, such as single temperature threshold methods [36], double temperature threshold methods [37,38], and temperature combined with other meteorological element methods [39,40,41,42,43,44]. The single temperature threshold method refers to the point at which precipitation occurs in the form of snowfall when the daily average temperature is lower than the critical temperature, whereas precipitation occurs in the form of rainfall when the daily average temperature is higher than the critical temperature. The double temperature threshold method [45,46] refers to the point at which all precipitation occurs in the form of snowfall when the daily average temperature is lower than the critical low temperature, while all precipitation occurs in the form of rainfall when the daily average temperature is higher than the critical high temperature. If the daily average temperature is between the critical low and high temperatures, the probability of snowfall under different temperatures is counted to determine the relationship between the snowfall probability and temperature to determine the occurrence probability of snowfall events. The method of combining temperature with other meteorological elements mainly takes temperature as the main influencing factor, and combines dew point temperature [42], surface wet bulb temperature [44], and surface relative humidity [43] to predict the precipitation phase. Another method for predicting the precipitation phase is through atmospheric models with microphysics processes to know the initial hydrometeor phase, hydrometeor shape, and size, and track the hydrometeor falling from the upper atmosphere to the land surface [47]. However, the method needs detailed atmospheric information, often not satisfied in many places.
The Haihe River Basin is one of the basins where human activities are extremely intense, and water resources are scarce [48,49]. As an important water supply source in winter, snowfall plays a positive role in alleviating water shortages in the Haihe River Basin. However, while there are numerous studies on the variation rules for the total and extreme precipitation, few have focused on the spatial and temporal variation rules of snowfall. Therefore, this study identifies and verifies the snowfall using the double temperature threshold value method by considering the Haihe River Basin as the study area and taking the daily temperature and precipitation data from 43 meteorological stations in this basin from 1960 to 2016. We analyze the spatial and temporal variation characteristics of the snowfall and the number of snowfall days according to the snowfall levels divided by the national meteorological department. We discuss the response of snowfall to climate change to understand the response mechanism of snowfall in the context of climate warming and provide a theoretical basis for water resource planning, management, and disaster prevention and mitigation in the Haihe River Basin.

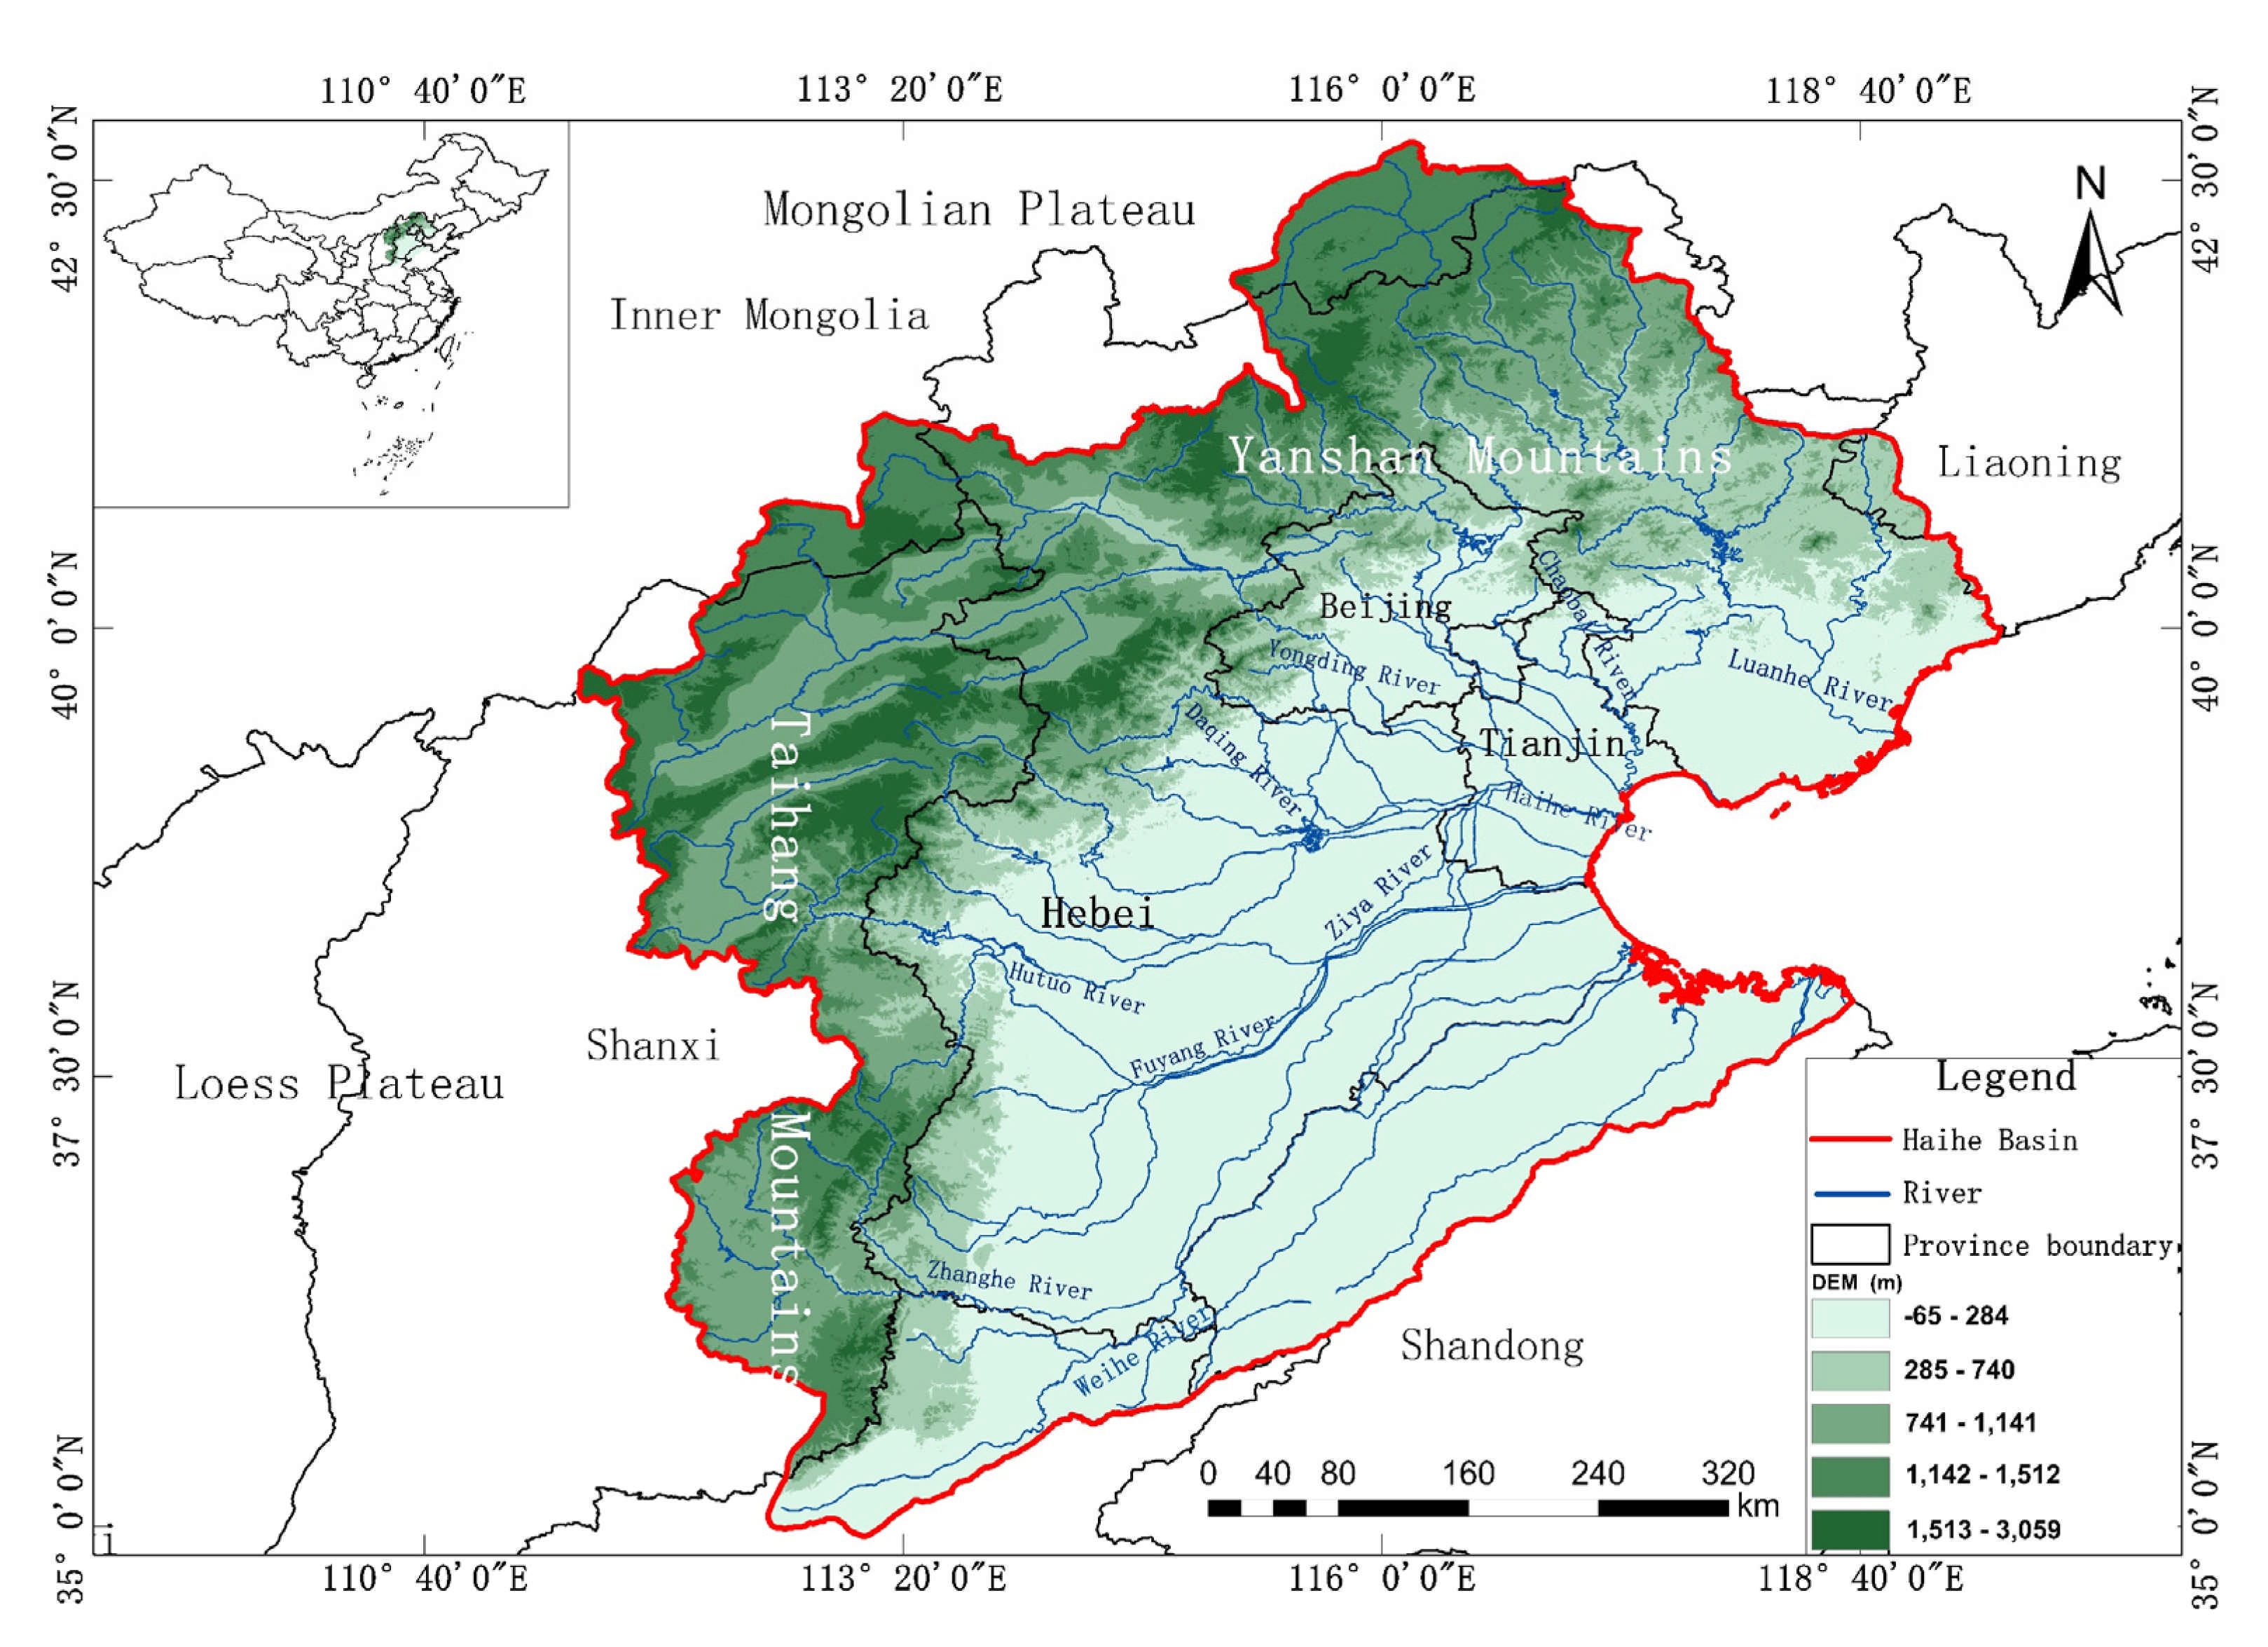
2. Overview of the Study Area

The Haihe River Basin is adjacent to the Bohai Sea in the east, Taihang in the west, the Yellow River in the south, and the Mongolian Plateau in the north [50]. The total area of the basin is 318,200 km2, accounting for 3.3% of the total area of China. The basin’s elevation is high in the northwest and low in the southeast, and can be roughly divided into three geomorphic types: Plateau, mountain, and plain [51]. Specifically, to the west is the Loess Plateau and Taihang Mountains, to the north is the Mongolian Plateau and Yanshan Mountains, and to the east and southeast are plains. The Haihe River Basin covers eight provinces, including Beijing, Tianjin, Hebei, Shanxi, Shandong, Henan, Inner Mongolia, and Liaoning [52]. The water system of the Haihe River Basin includes five tributaries: The Chaobai River, Yongding River, Daqing River, Ziya River, and Nan Canal, as well as a small tributary, i.e., the North Canal. The average annual temperature in the basin ranges from 1.5–14 °C, the average annual relative humidity ranges from 50–70%, the annual average precipitation is 539 mm (a semi-humid and semi-arid zone), the average annual land surface evaporation is 470 mm, and the water surface evaporation is 1100 mm. Figure 1 shows the geographical location and a topographic map of the Haihe River Basin.

3. Data Sources and Methods

3.1. Data Sources

The data used in this study included daily precipitation and temperature data from the Haihe River Basin and surrounding 43 meteorological stations from 1960 to 2016 reported in the “Daily Data Set of China Surface Climatic Data,” as provided by the National Meteorological Information Center. Figure 2 shows the meteorological station distribution in the Haihe River Basin.

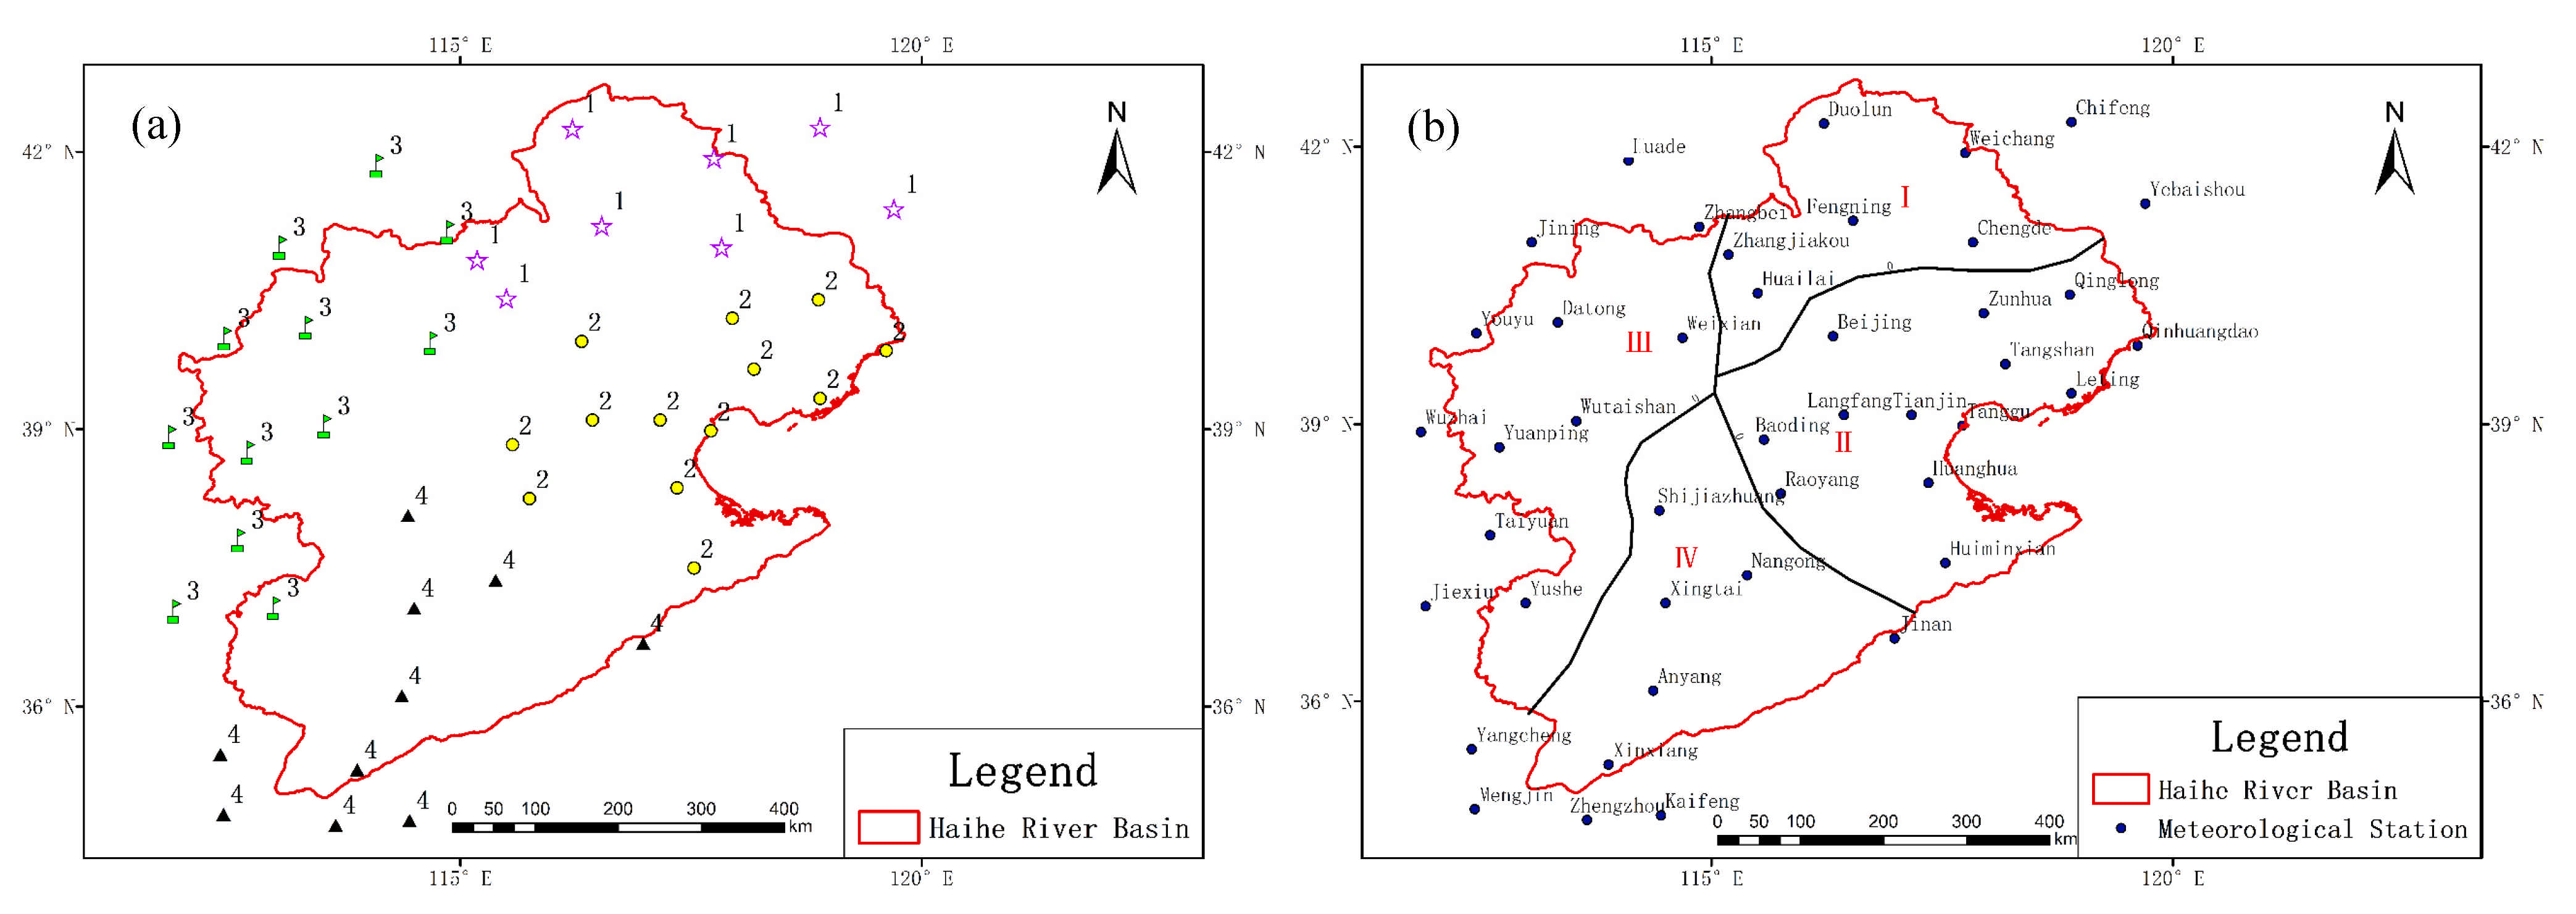
3.2. Clustering Methods and Partitioning

Due to certain differences at each meteorological station in or surrounding the Haihe River Basin, the meteorological stations with similar characteristics were clustered and partitioned to further investigate the spatial and temporal variation trends in snowfall at different levels in the different zones of the Basin.
The K-means clustering method, selecting four representative indicators, i.e., the geodetic coordinates, elevation, average annual snowfall, and average annual temperature, was adopted for cluster analysis in the Haihe River Basin. The cluster spatial distribution was shown in Figure 2a. According to the clustering results, the Haihe River Basin was divided into four zones, as shown in Figure 2b. Table 1 presents the detailed analysis results.

3.3. Research Methods

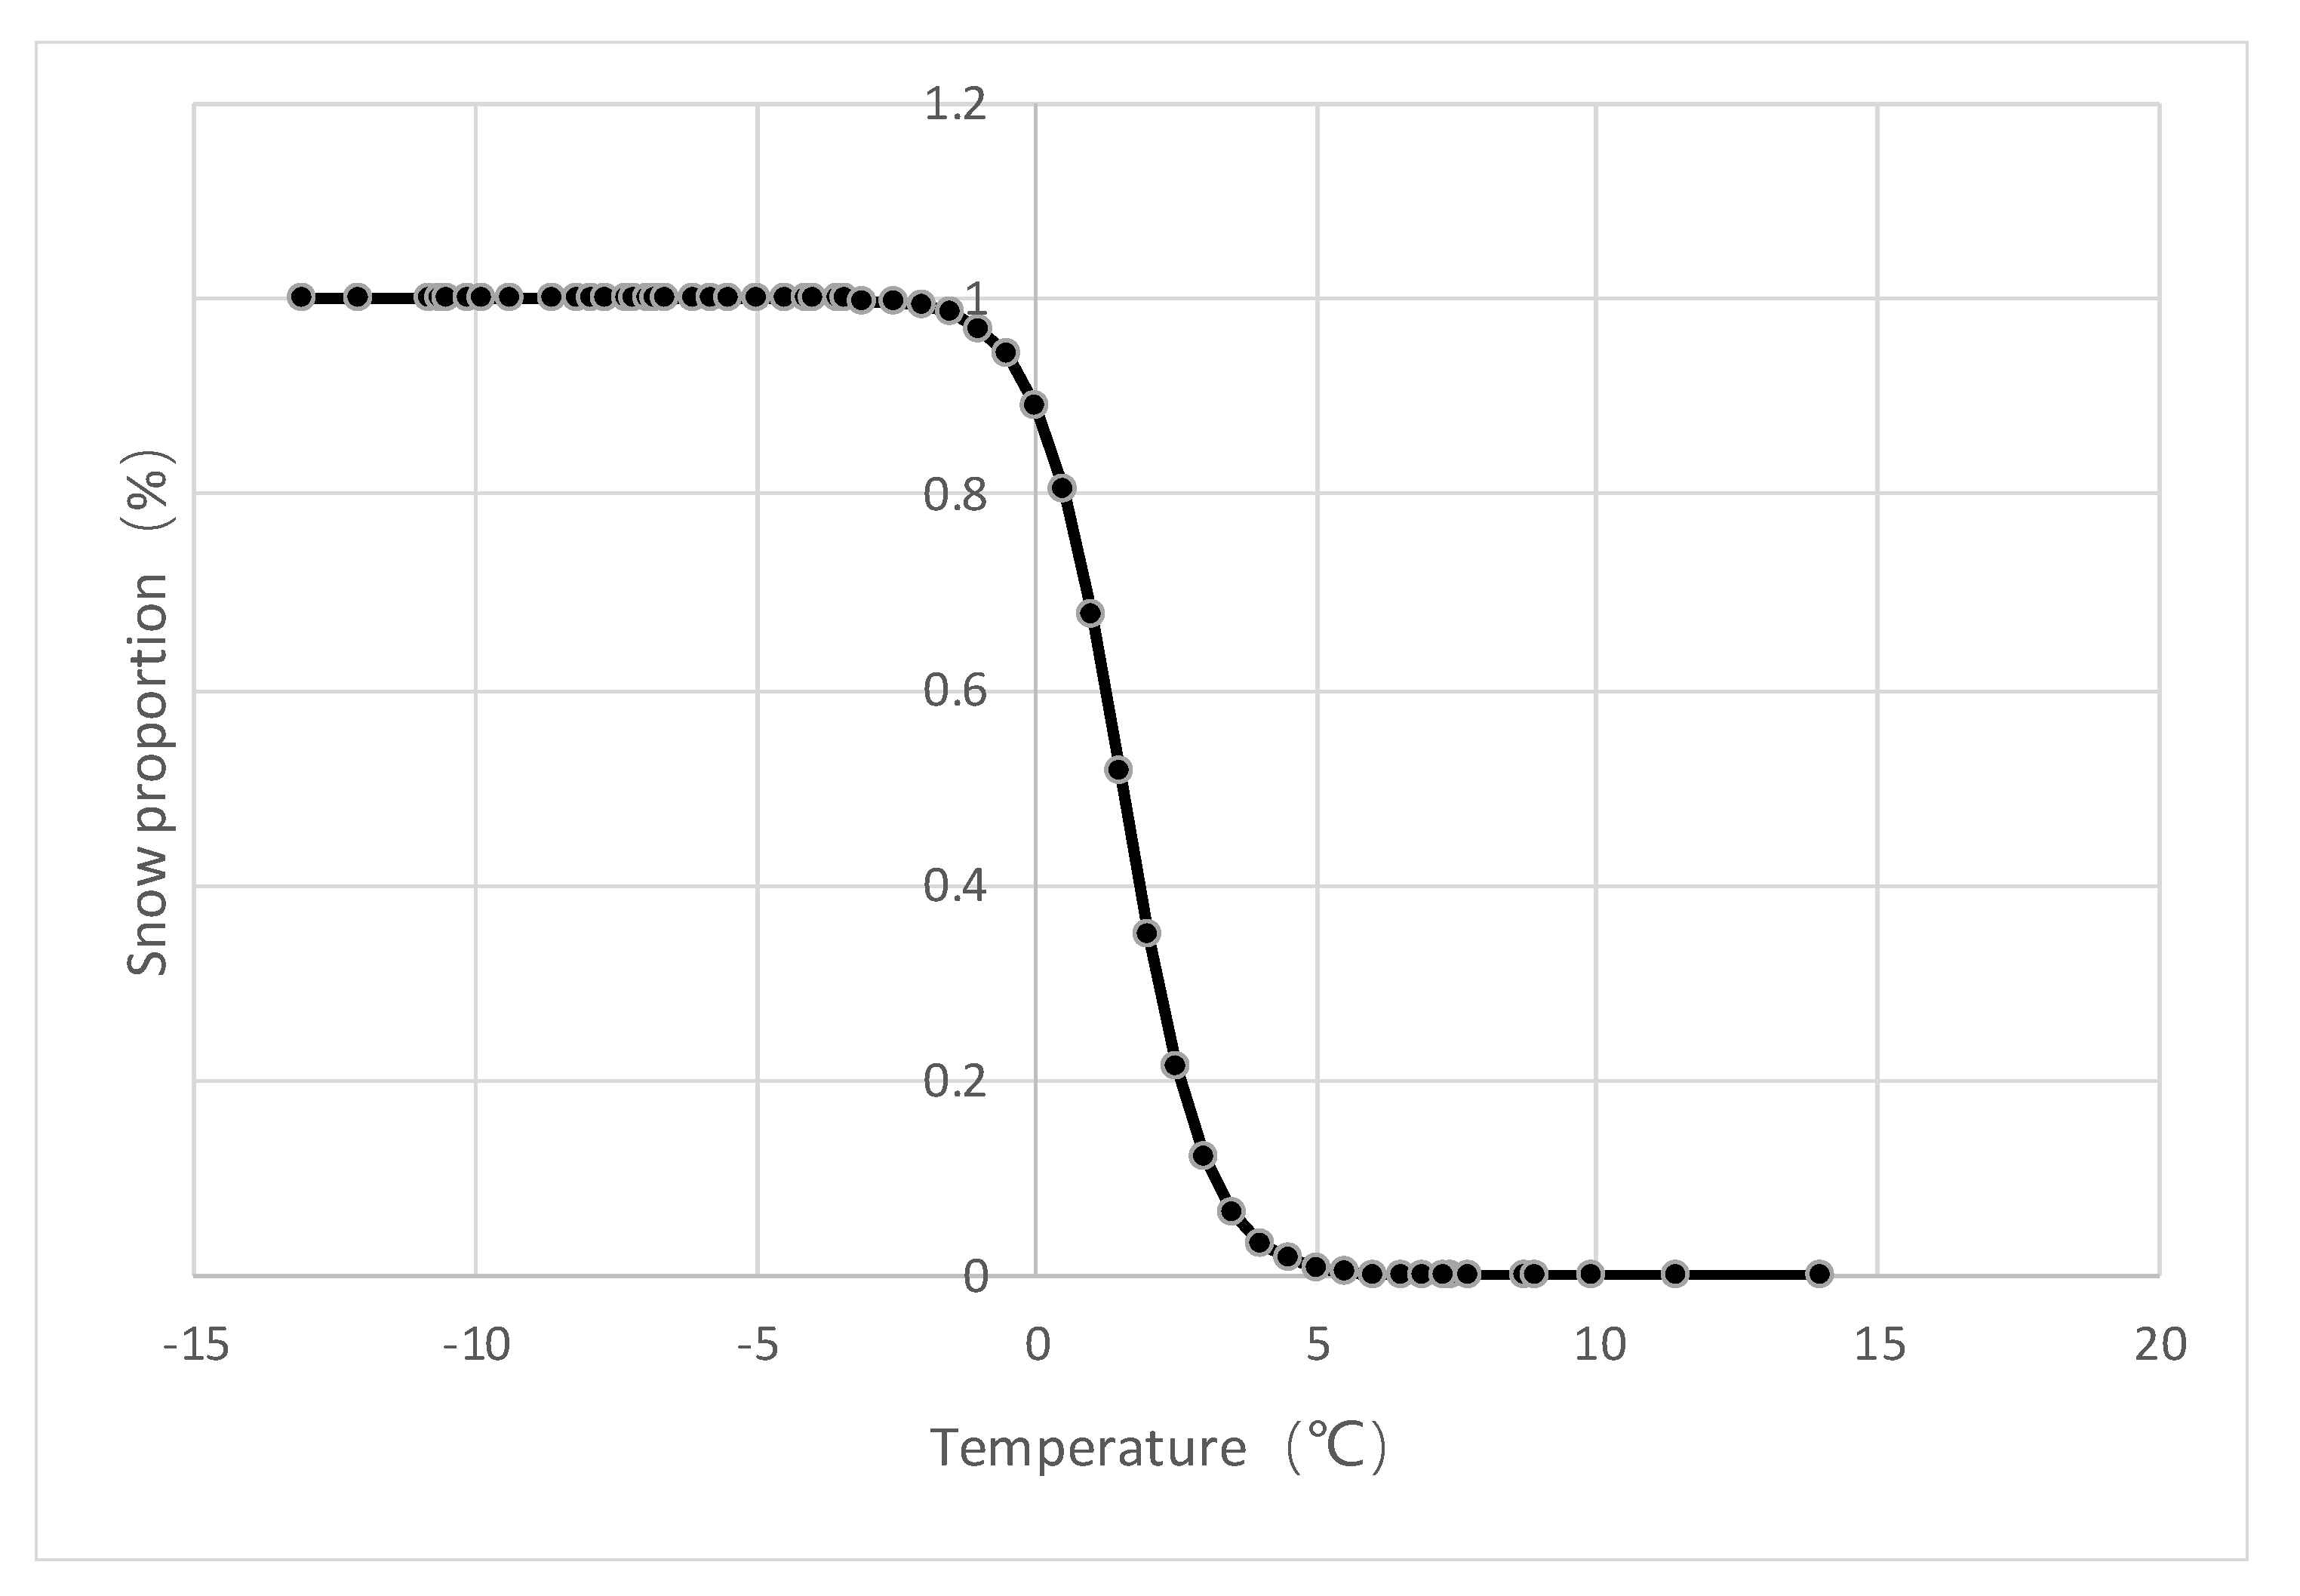
3.3.1. Snowfall Identification Method

As the different phase states of precipitation, i.e., rainfall, snowfall, and sleet, among others, was only recorded before 1979, the daily snowfall and rainfall corresponding to the average temperature of a given day were counted according to the daily precipitation and temperature data in the Haihe River Basin from 1960 to 1979. The ratio of the snowfall to the sum of the snowfall and rainfall was calculated (regardless of the probability of snowfall as sleet) to obtain the distribution of the ratio of the snowfall to the total snowfall and rainfall at different daily average temperatures, as well as to reveal the relationship between different temperatures and snowfall proportions [46,53], as shown in Figure 3. It indicates that all phase states of precipitation are snowfall when the average daily temperature is less than the critical low temperature, tmin = −13.1 ℃. All phase states of precipitation are rainfall when the average daily temperature is higher than the critical high temperature, tmax = 14 ℃. The relationship between the temperature and snowfall proportion conforms to an exponential equation when the average daily temperature is between tmin and tmax, calculated as follows:
p   =   1 1 + exp ( a + b t )
where p indicates the ratio of the snowfall to the sum of the rainfall and snowfall, t indicates the daily average temperature, and a and b are the empirical parameters of the exponential equation.
If the proportion of snowfall as sleet also conforms to the exponential equation at the same temperature, the measured total snowfall in the Haihe River Basin is the sum of pure snowfall and snowfall as sleet. Based on this, we adopted Equation (1) to identify the total snowfall estimated as a portion of the total precipitation [53,54].

3.3.2. Mann–Kendall Trend Test Method

The Mann–Kendall trend test is a widely used non-parametric test method [55,56]. Compared with other parameter test methods, the Mann–Kendall trend test method does not require the sample to follow a certain distribution and is simple to calculate. Therefore, it is suitable for the analysis of hydrological and meteorological time series data, such as rainfall and runoff [57,58,59].
For n independent and random samples, x 1 , x 2 x n , the constructed variable S was calculated as follows:
S = k = 1 n 1 j = k + 1 n S g n ( x j x k )
where
S g n ( x j x k ) = + 1 ( x j x k ) > 0 0 ( x j x k ) = 0 1 ( x j x k ) < 0
The constructed statistics, Z c , of the Mann–Kendall trend test was calculated as follows:
Z c = S 1 V α r ( S ) S > 0 0 S = 0 S 1 V α r ( S ) S < 0
where Var(S) = n(n − 1)(2n + 15)/18.
If Z c Z 1 α 2 , the original hypothesis is rejected, i.e., that there is a notable increasing or decreasing trend in the time series data at the confidence level, α ; specifically, when Z c is more than 0, it is an increasing trend, whereas when Z c is less than 0, it is a decreasing trend. In addition, when Z c is greater than 1.96, the trend conforms to the significant inspection of 0.05 [60].

3.4. Snowfall Index

In this study, the daily snowfall (>0.1 mm) was considered as an effective snowfall event. According to the snowfall level divided by the national meteorological department, light snow refers to a snowfall amount of 0.1–2.5 mm within 24 h, moderate snowfall refers to a snowfall amount of 2.5–5 mm within 24 h, heavy snowfall refers to a snowfall amount of 5–10 mm within 24 h, and a snowstorm refers to a snowfall amount of ≥ 10 mm within 24 h. Table 2 lists the definitions of the snowfall index.

4. Results

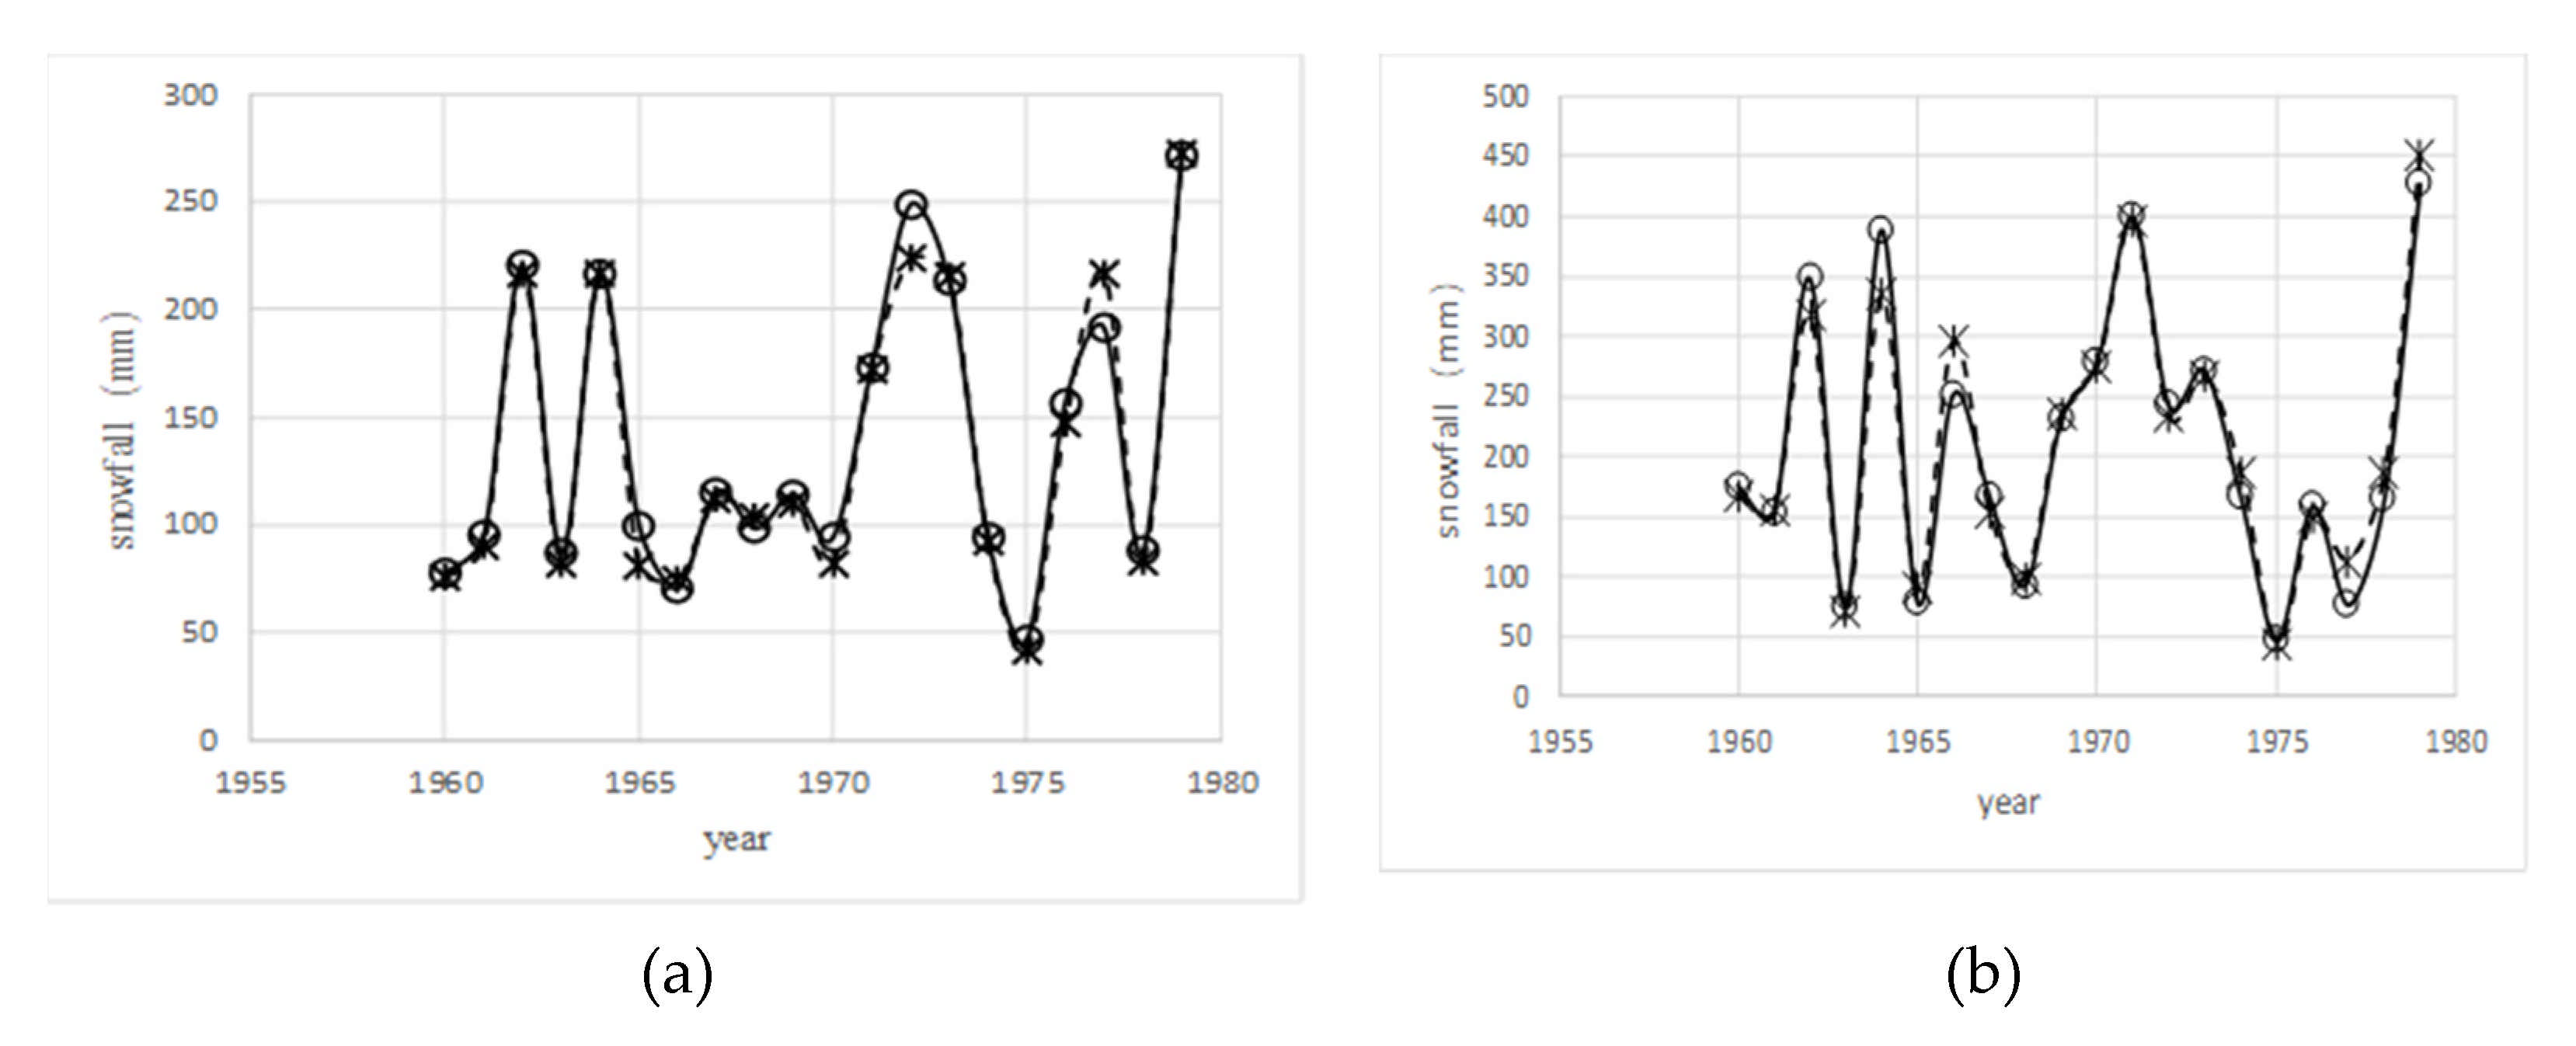
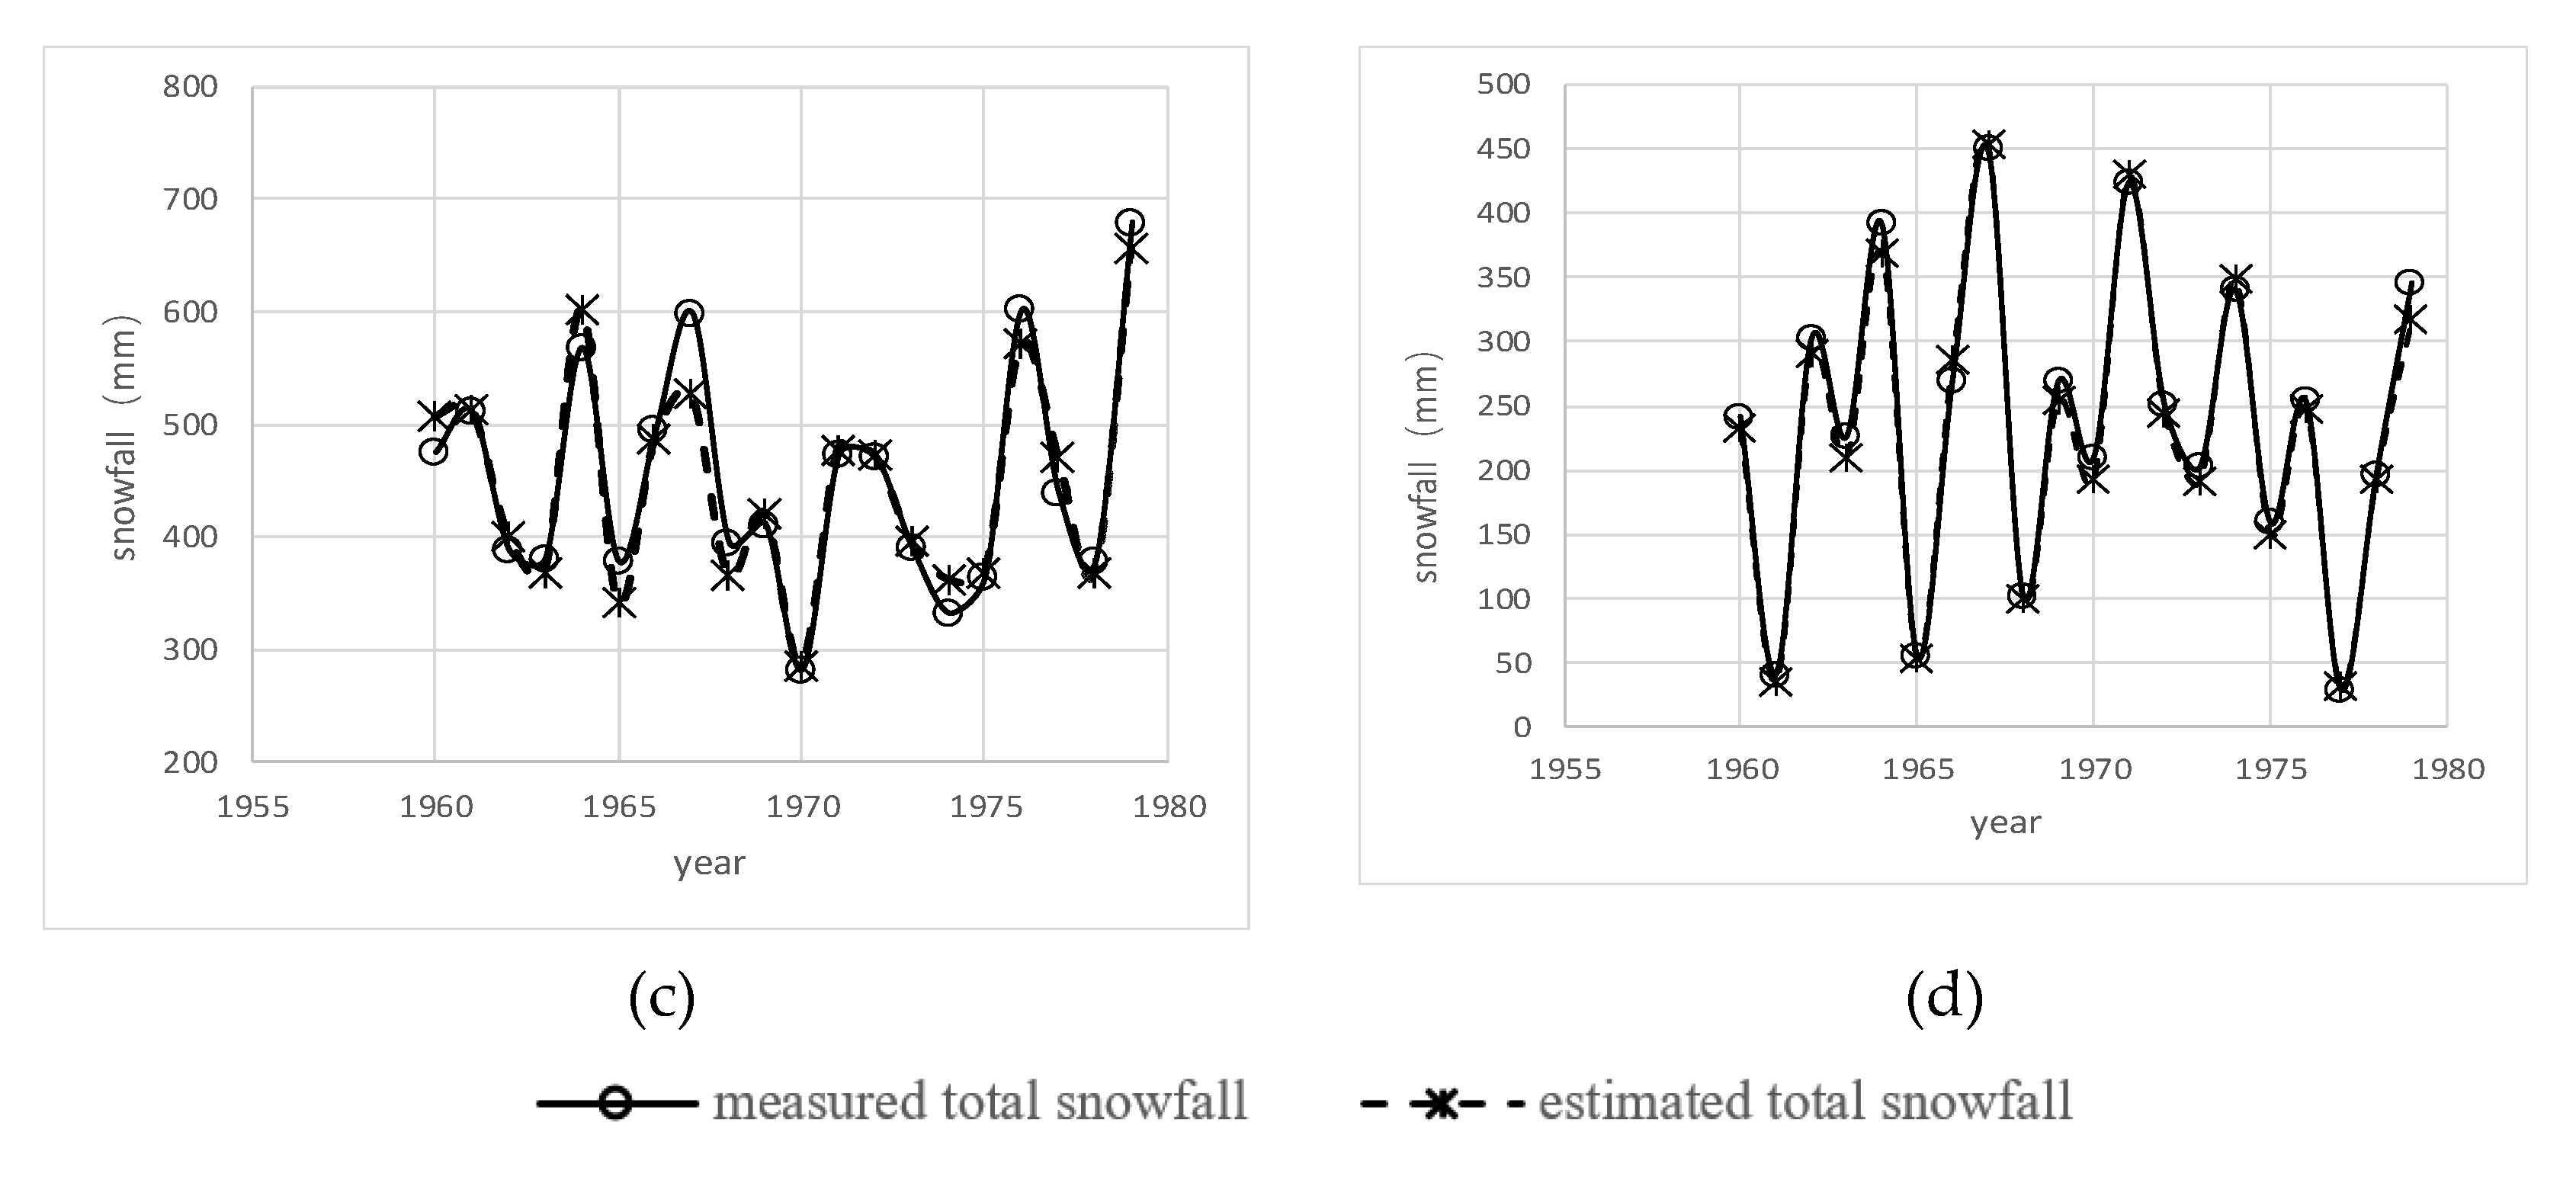
4.1. Snowfall Identification and Verification

The relationship between the temperature and snowfall ratio was analyzed by using the temperature and precipitation data before 1979 for the 43 meteorological stations in the Haihe River Basin; these data were fitted using the exponential equation by taking the critical temperature (−13.1 °C to 14 °C) as the mixing interval for the phase state of precipitation. The exponential equation was calibrated from 1960 to 1969 with the least squares method, and then validated from 1970 to 1979. The value of a is −2.1, and the value of b is 1.36.
Based on Figure 4 and Table 3, the correlation coefficient of each zone is above 0.95, and the relative error is within 5% for each zone in calibration and validation period, respectively, which indicates that the accuracy of the exponential equation for snowfall identification is relatively high, and the fitting between the curve of the measured total snowfall and the curve of the estimated total snowfall is good. Therefore, we suggest that the exponential equation can be used as the identification basis for different phase states of precipitation from 1980 to 2016.

4.2. Spatial Distribution Characteristics of Snowfall and the Number of Snowfall Days at Different Levels

The annual average snowfall in the different zones in the Haihe River Basin had the following order: III > IV > I > II. The snowfall were 36.9 mm, 22.7 mm, 18.6 mm, and 14.5 mm, respectively. The annual average number of snowfall days had the following order: III > I > IV > II, with the number of snowfall days 18.9 days, 11.6 days, 9.5 days, and 7.9 days, respectively.
The annual average snowfall and snowfall days are given in Table 4. The annual average snowfall and number of light snowfall days in the Haihe River Basin had the following order: III > I > IV > II. The snowfall and the number of snowfall days were 11.3 mm, 14.6 days; 6.9 mm, 9.5 days; 5.4 mm, 6.7 days; 4.8 mm, 6.2 days, respectively. The annual average snowfall and number of moderate snowfall days had the following order: III > IV > I > II. The snowfall and the number of snowfall days were 8.7 mm, 2.5 days; 5.3 mm, 1.5 days; 4.5 mm, 1.3 days; 3.8 mm, 1.1 days, respectively. The annual average snowfall and number of heavy snow snowfall days had the following order: III > IV > I > II. The snowfall and the number of snowfall days were 8.7 mm, 1.3 days; 6.5 mm, 0.9 days; 3.9 mm, 0.6 days; 3.6 mm, 0.5 days, respectively. The annual average snowfall and number of snowstorm days had the following order: III > IV > I > II. The snowfall and the number of snowfall days were 8.3 mm, 0.6 days; 5.5 mm, 0.4 days; 3.4 mm, 0.2 days; 2.4 mm, 0.2 days, respectively. It could be known that in terms of the annual average snowfall and number of snowfall days of moderate snow, heavy snow, and snowstorm, it all had the following order: III > IV > I > II. As the III zone is all in Taihang Mountains, the relationship of the snowfall is directly proportional to the terrain can be preliminarily obtained in the Haihe River Basin.
Table 4 also lists the proportions of snowfall and the number of snowfall days at different levels for the total snowfall. The contribution rate of light snow to the total snowfall in Zone I is 36.9%, and the probability of occurrence is 81.98%. The contribution rate of moderate snow to the total snowfall is 23.93%, and the probability of occurrence is 11.1%. The contribution rate of heavy snow to the total snowfall is 21.05%, and the probability of occurrence is 4.98%. The contribution rate of snowstorms to the total snowfall is 18.13%, and the probability of occurrence is 1.93%. The proportions of snowfall and the number of snowfall days for the total snowfall in Zones II and III are similar to those of Zone I. In Zone IV, the contribution rate of snowstorms to the total snowfall is 24.07%, which is higher than that of light and moderate snow, but the probability of snowstorm occurrence is the smallest. It could be seen that, except for Zone IV, the contribution rate of the snowfall at the different levels in the other zones to the total snowfall had the following order: light snow > moderate snow > heavy snow > snowstorm. In Zone IV, although the probability of a snowstorm is the smallest, the contribution to the total snowfall is the largest.

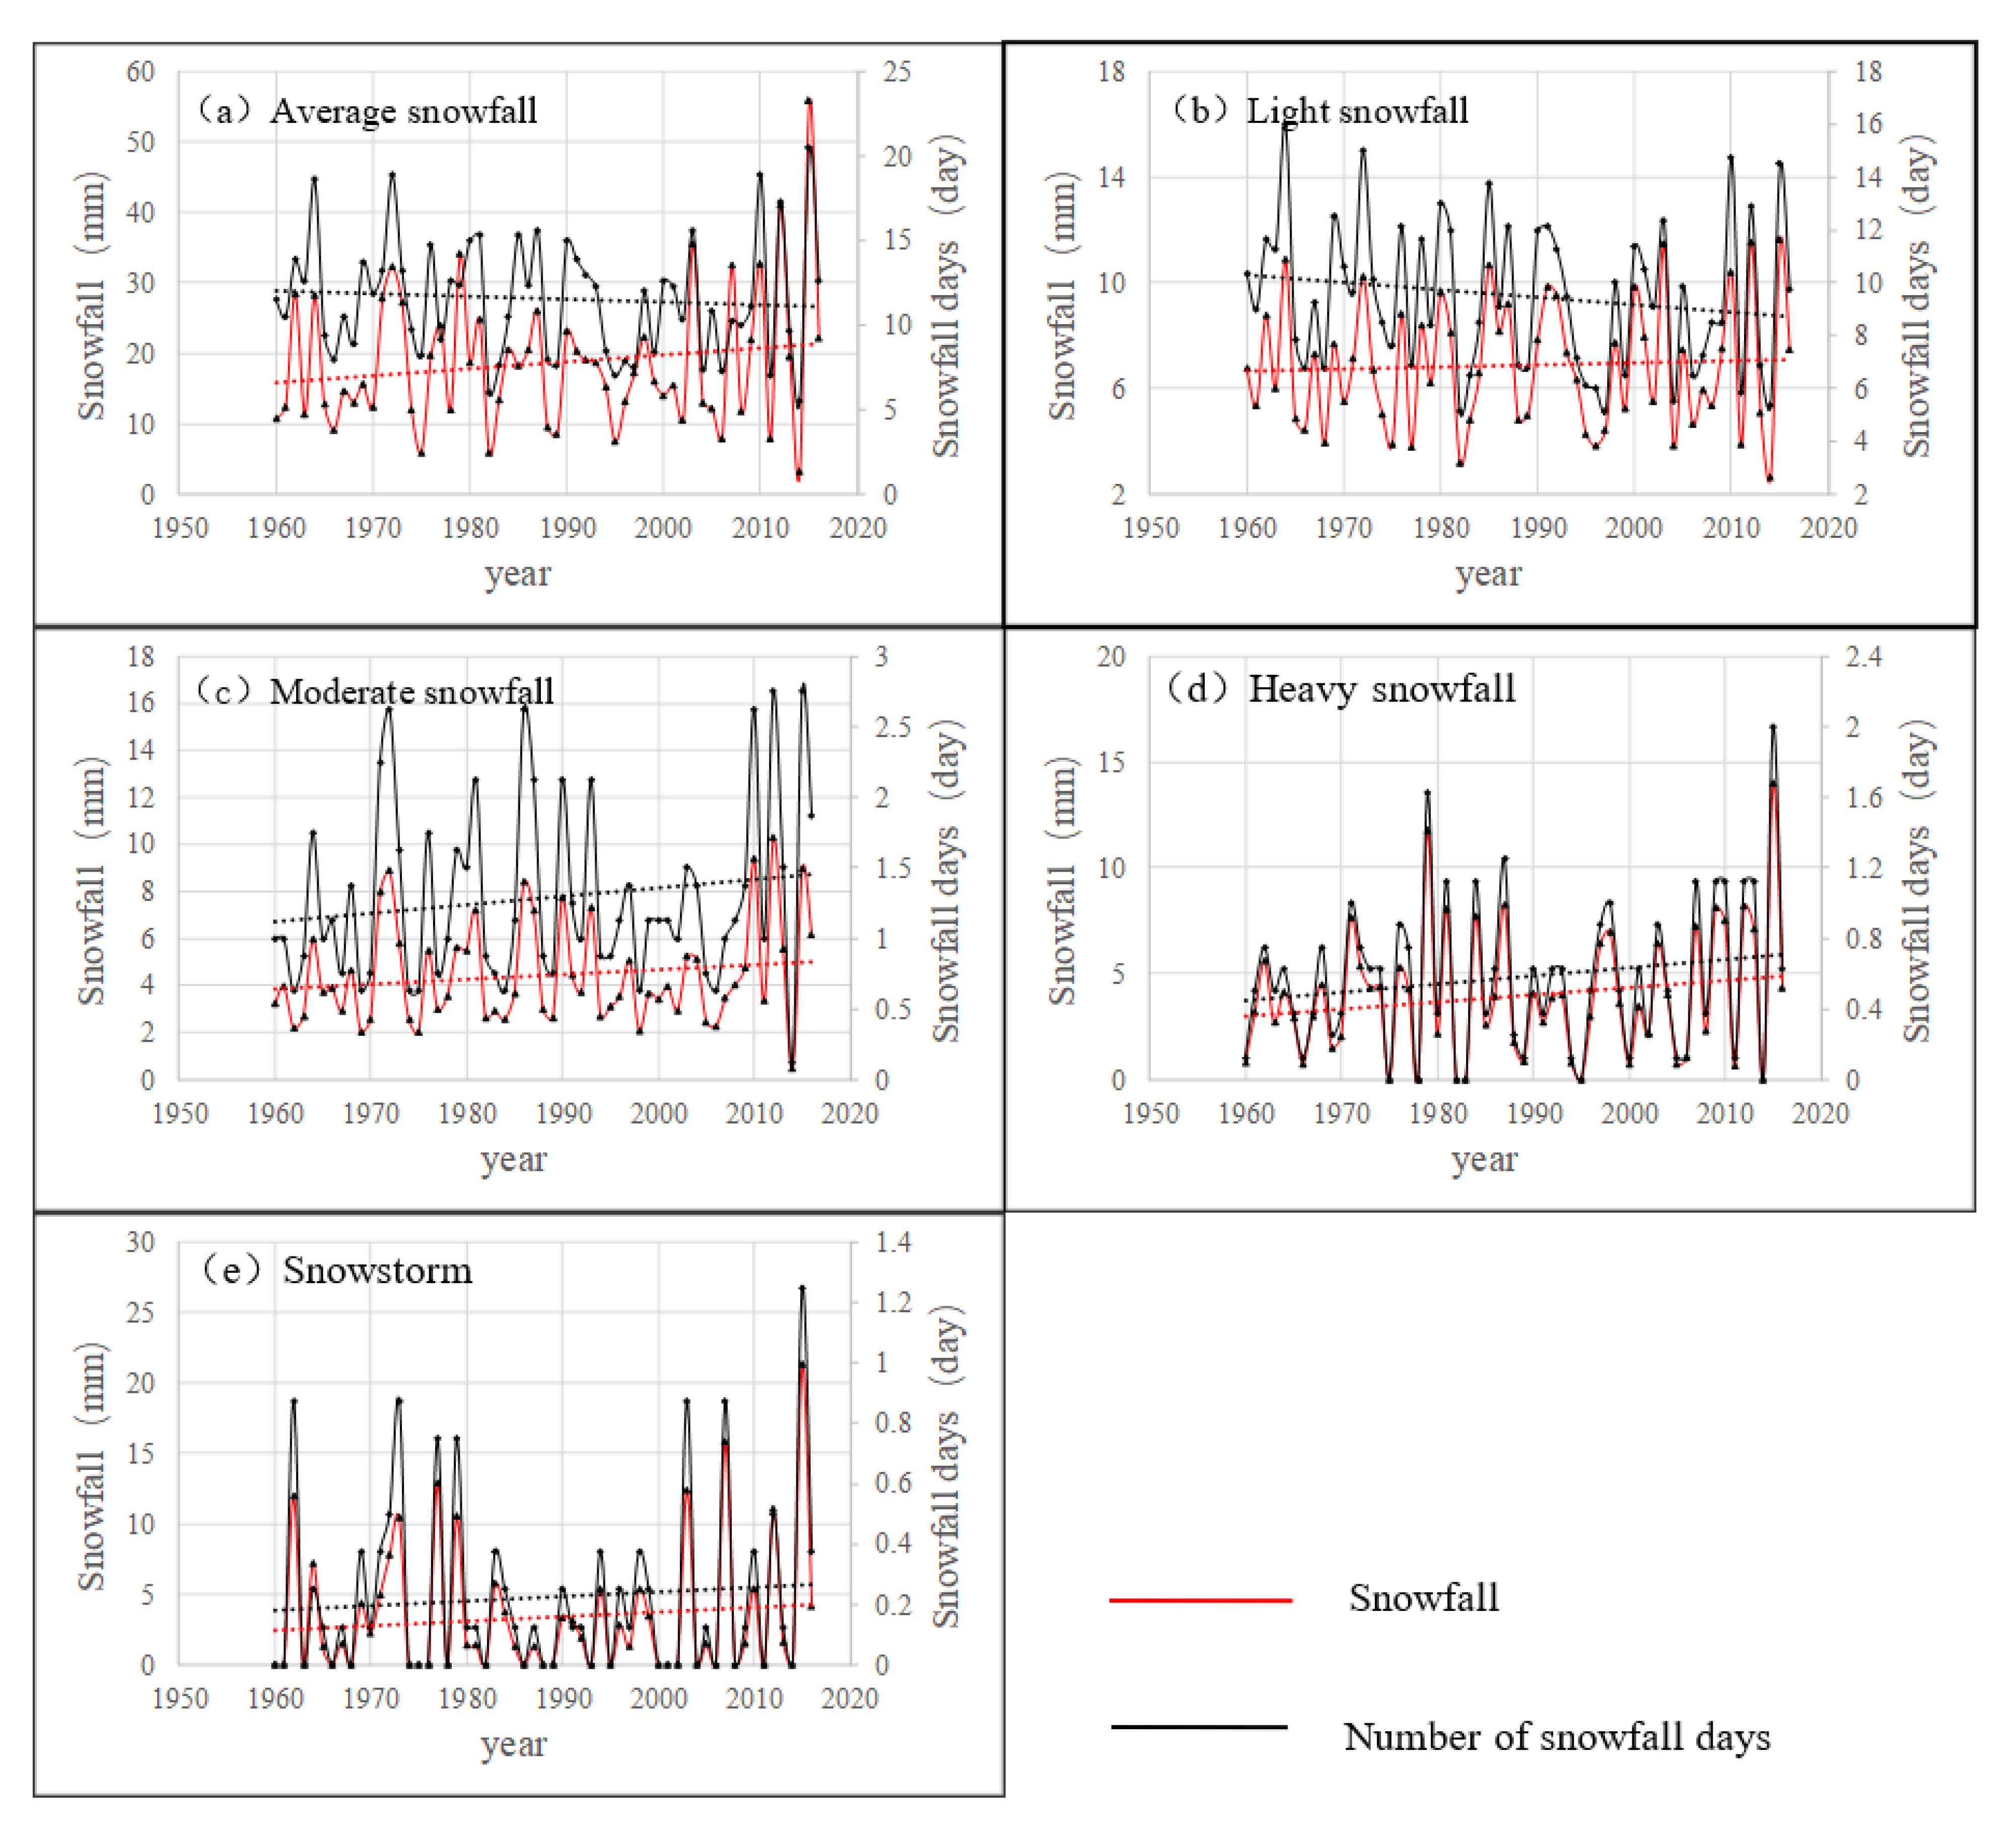
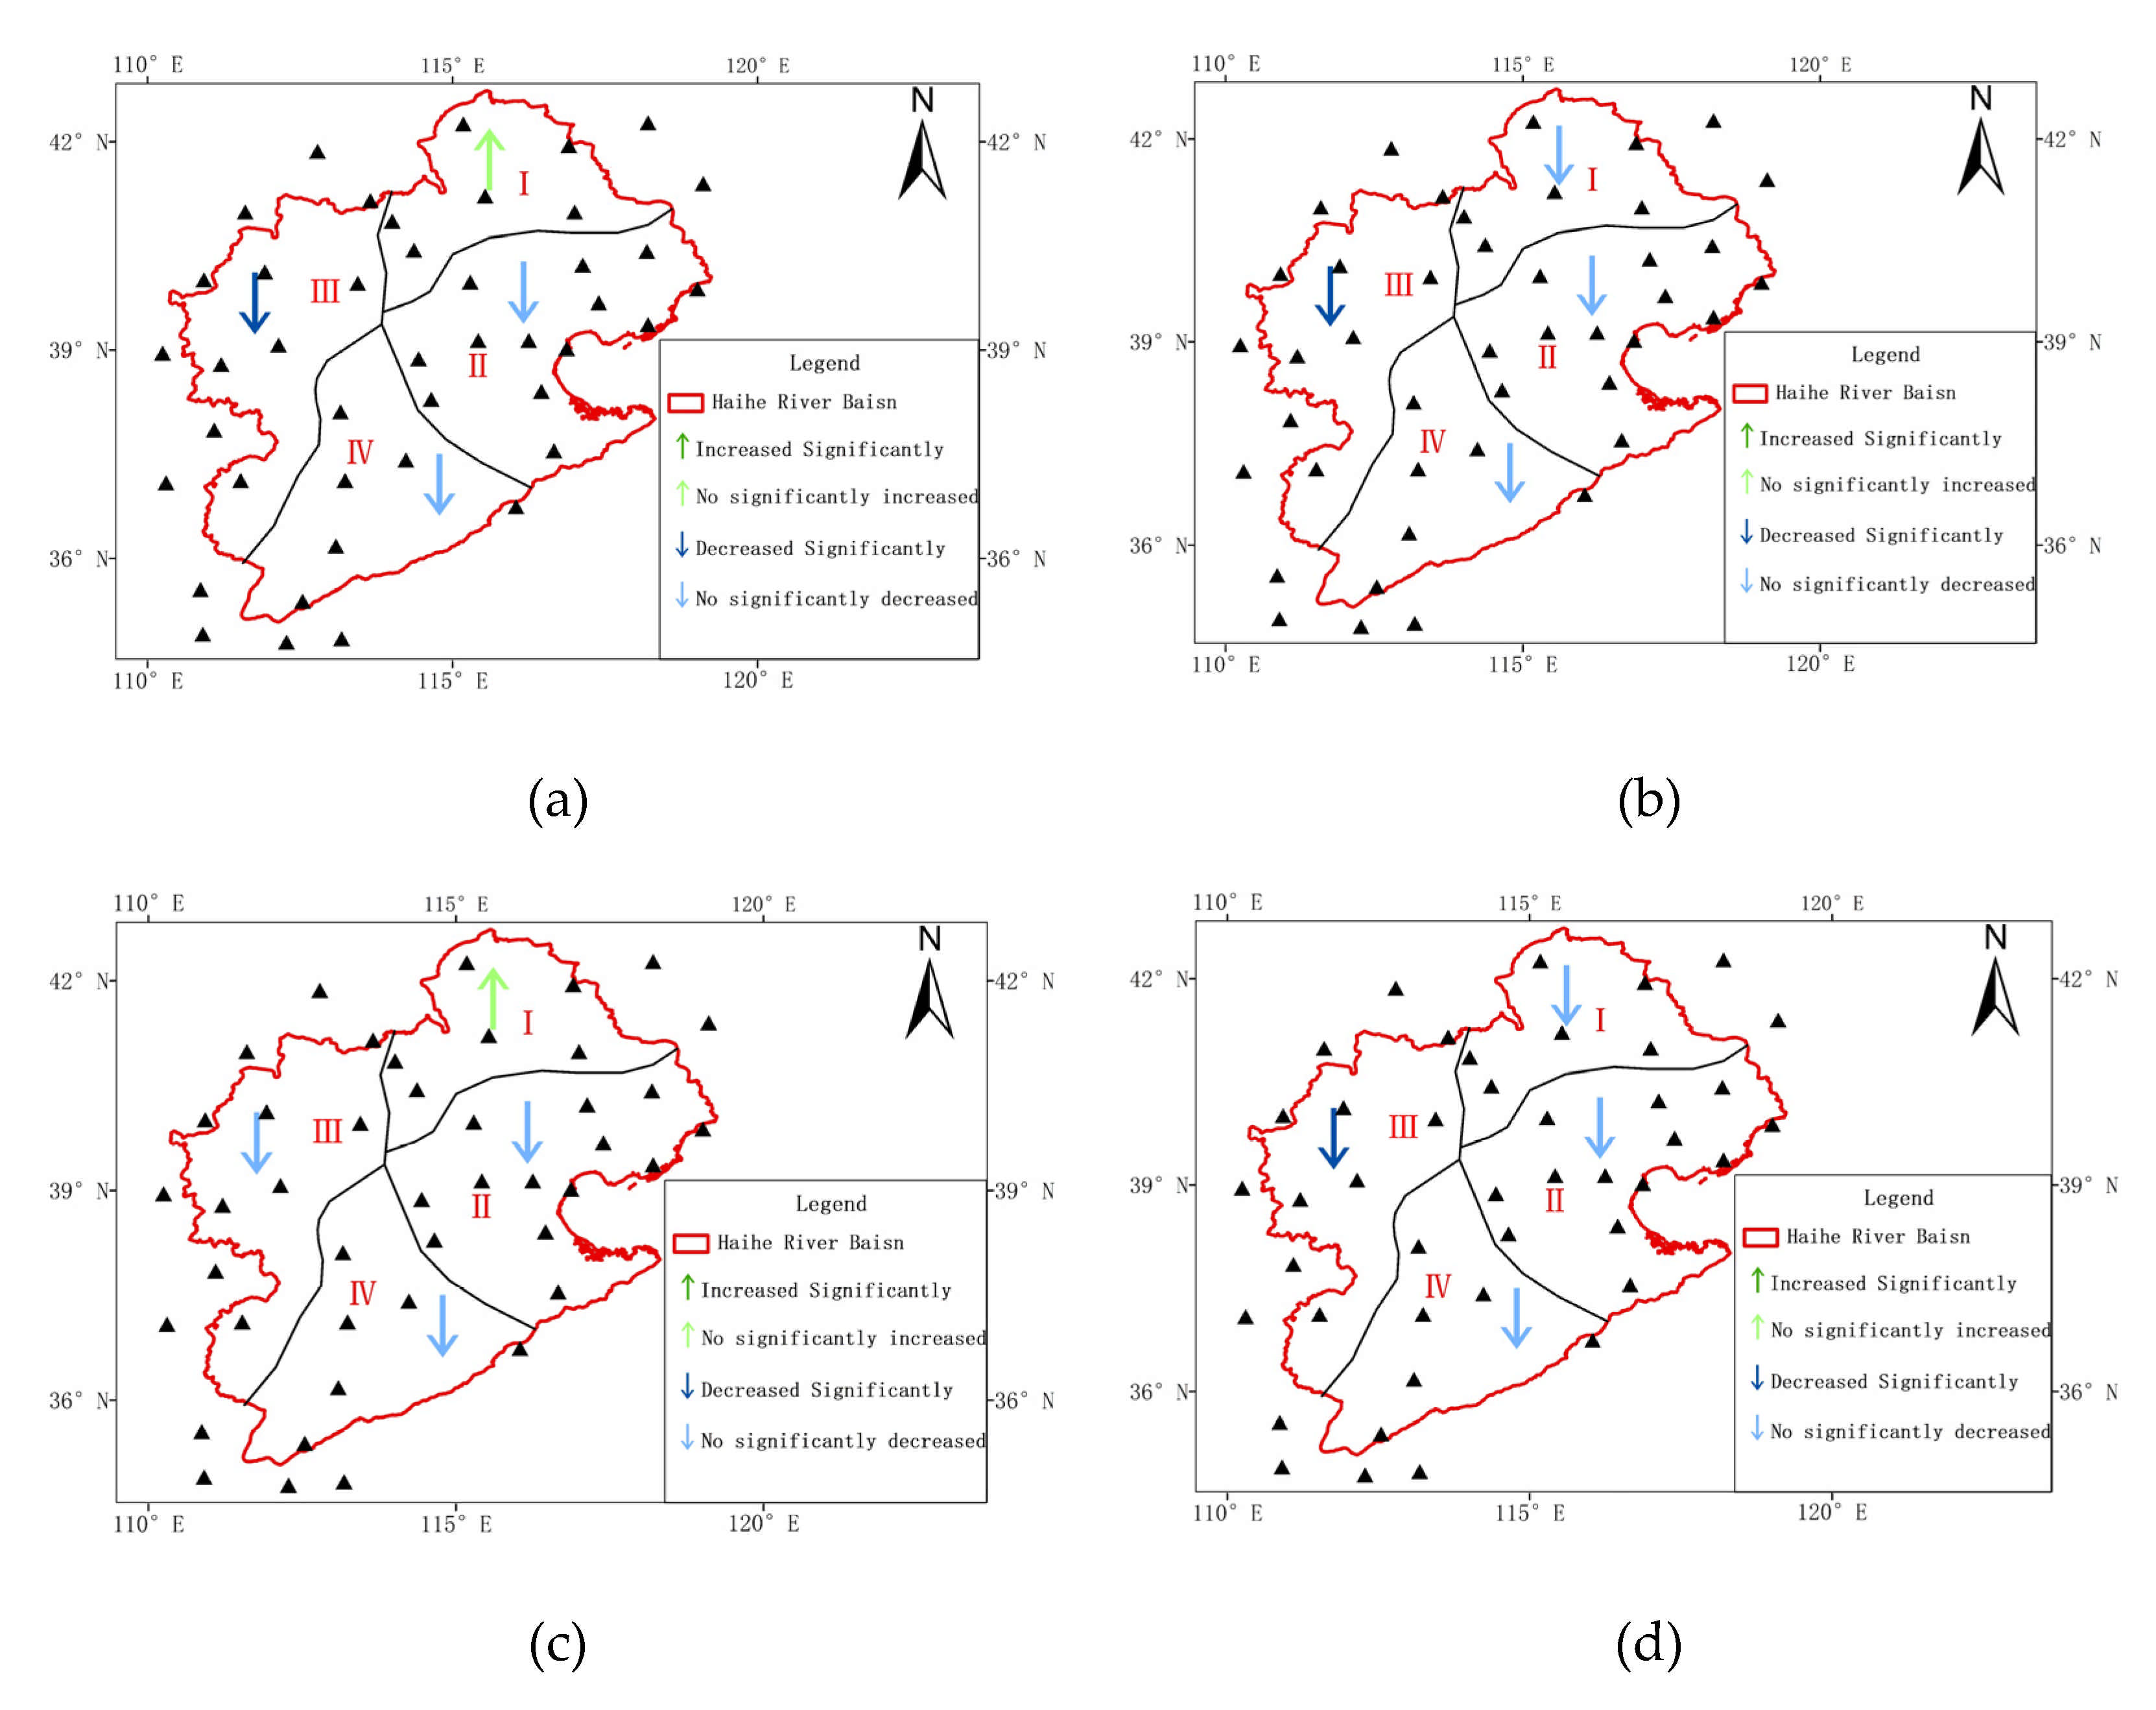
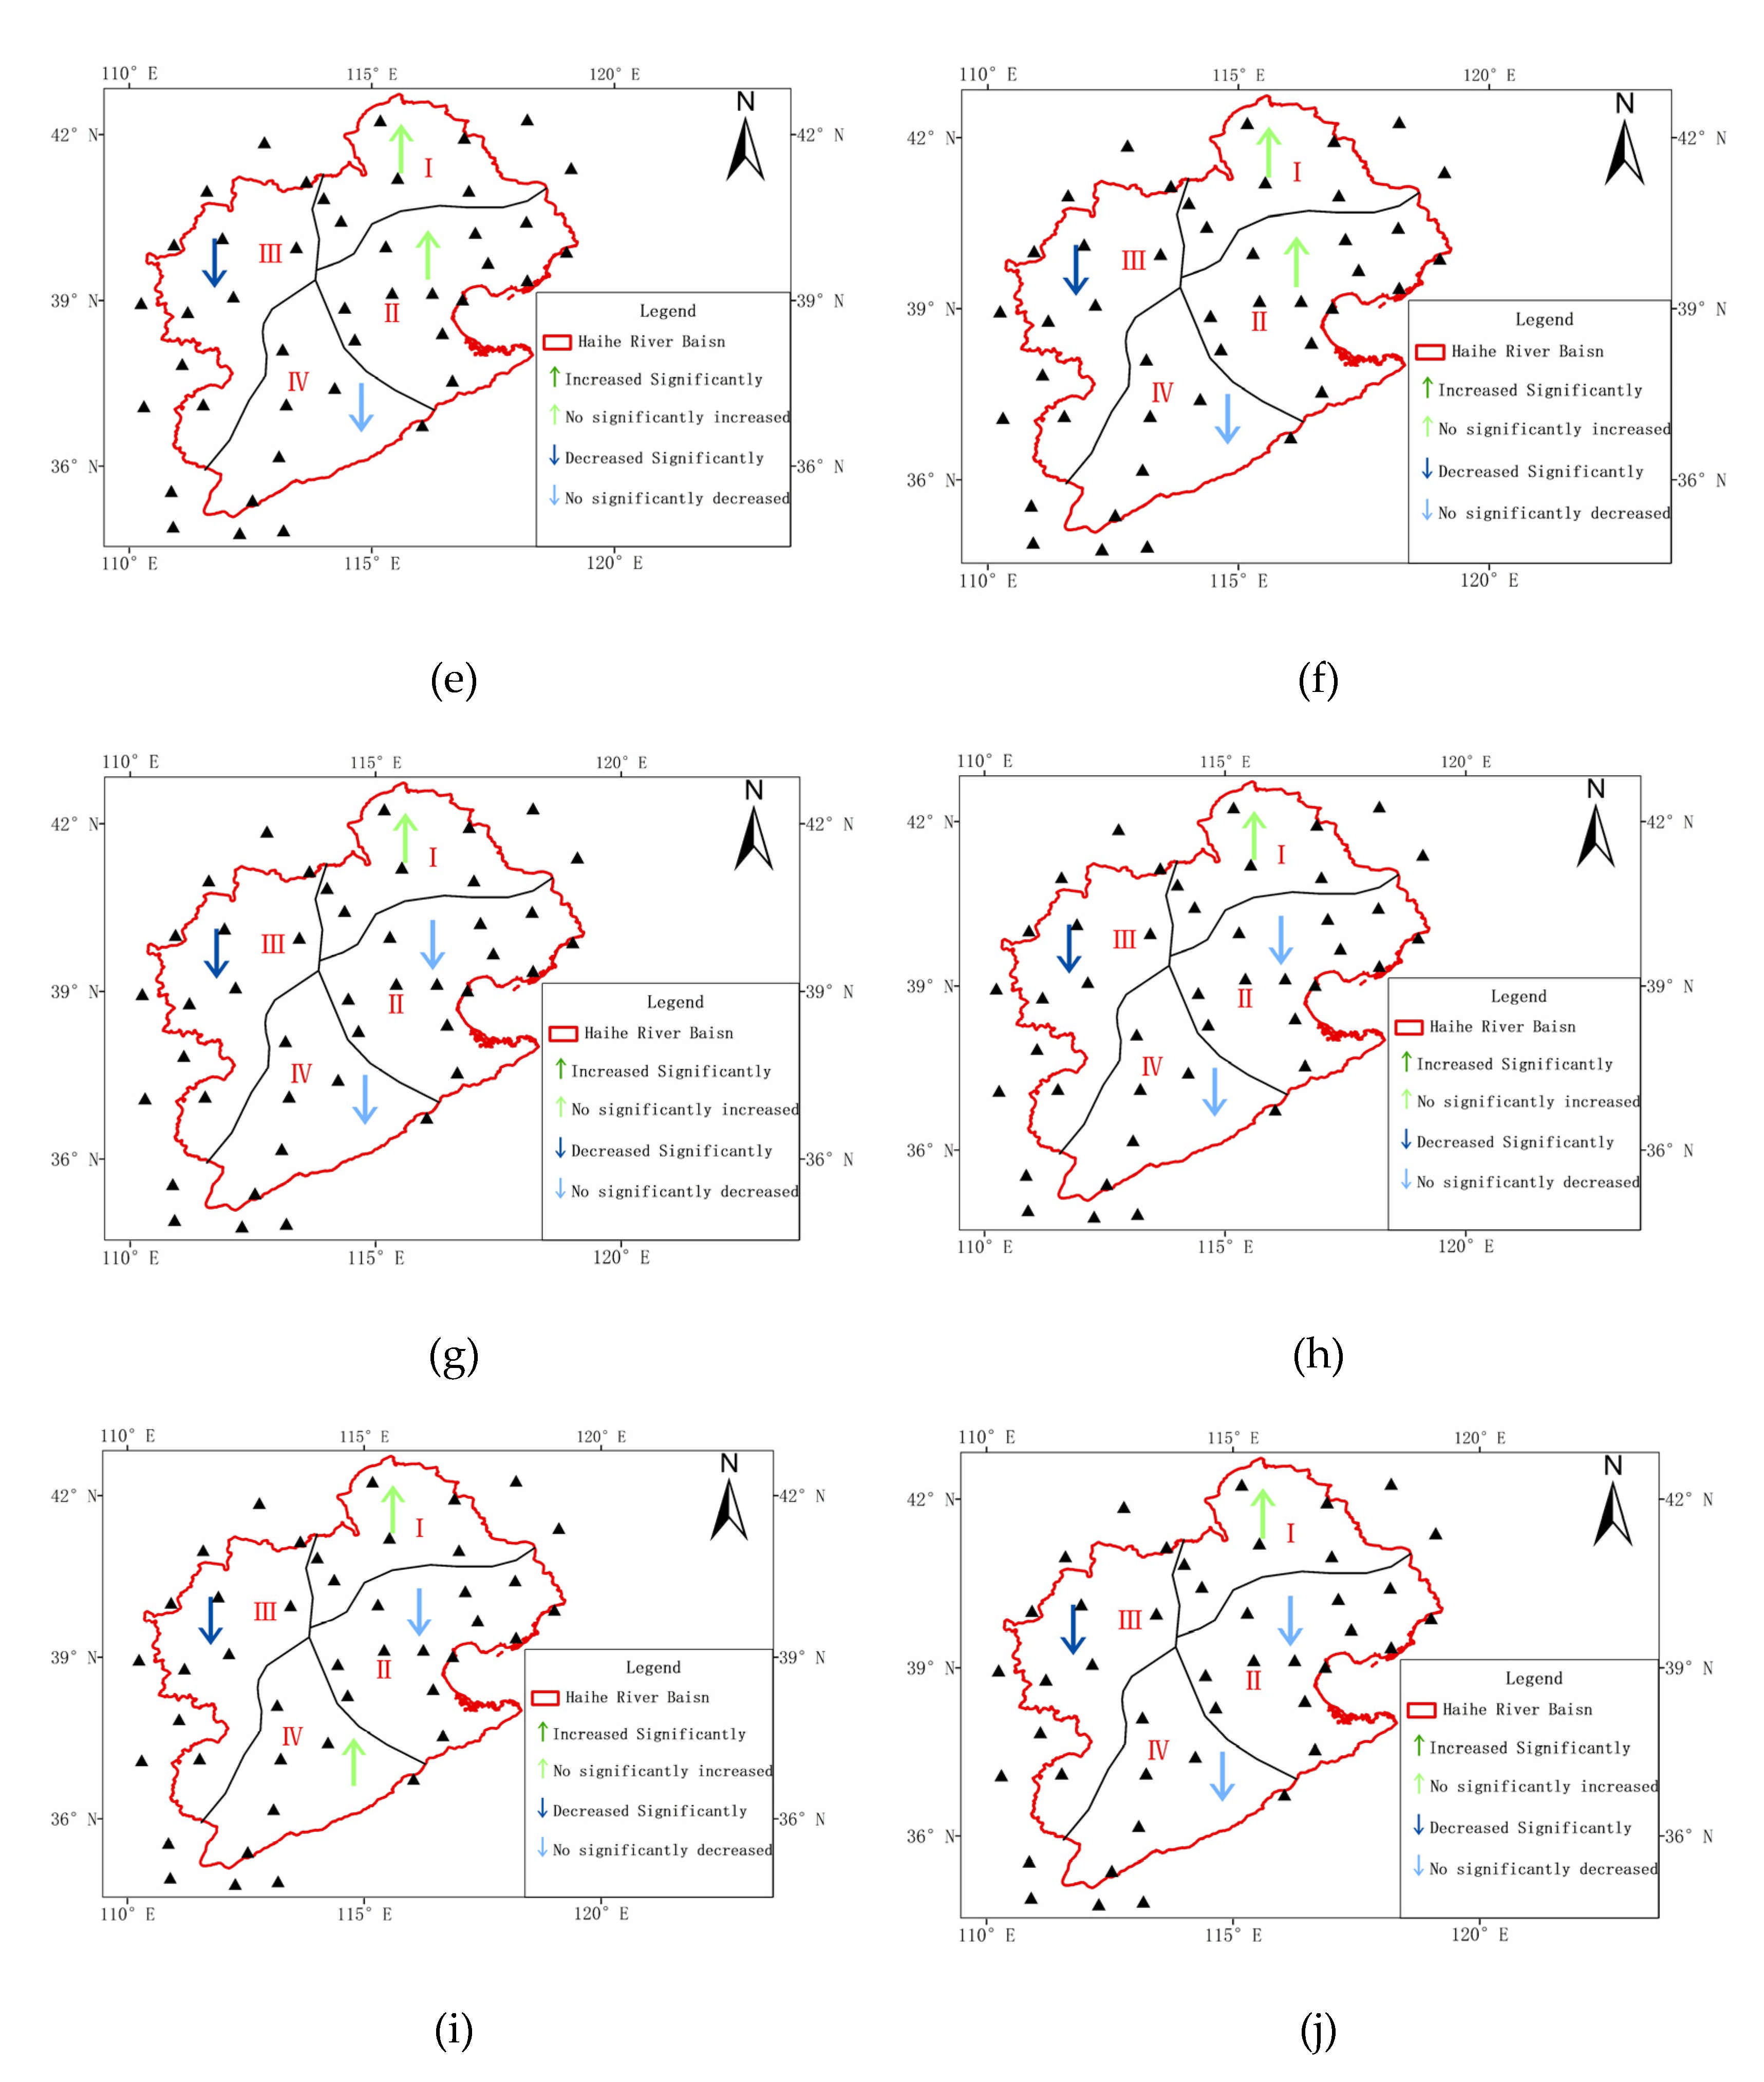
4.3. Interannual Variation Trends in Snowfall and Number of Snowfall Days at Different Levels

The annual snowfall and number of snowfall days at different levels in all zones of the Haihe River Basin were counted, and the interannual variation trends in the snowfall and number of snowfall days at different levels were analyzed, which were represented by the average change in 10 years, e.g., mm/10a and days/10a. For brevity, the results of Zone I are described in detail in Figure 5, while those of other Zones are listed in Table 5.
As shown in Figure 5 and Table 5, the average snowfall in Zone I in the Haihe River Basin from 1960 to 2016 had a slowly increasing trend, with a rate of change of 0.954 mm/10 a. The average number of snowfall days was characterized by a slowly decreasing trend with a rate of change of −0.156 days/10 a; none reached a significant level (p > 0.05). The variation trends in light snow, moderate snow, heavy snow, and snowstorm were similar to the average snowfall, i.e., a slowly increasing trend, with rates of change of 0.080, 0.206, 0.341, and 0.327 mm/10 a, respectively; none reached the significant level (p > 0.05). The variation trend in the number of light snowfall days was consistent with that of the average number of snowfall days, i.e., a slowly decreasing trend with a rate of change of −0.279 days/10 a. In addition, the number of snowfall days with moderate snow, heavy snow, and snowstorm had a slowly increasing trend with rates of change of 0.061, 0.047, and 0.016 days/10 a, respectively; none reached a significant level (p > 0.05). Therefore, the snowfall and number of snowfall days at other levels in Zone I tended to increase, except for the average number of snowfall days and number of light snowfall days, which had a decreasing trend.
In Zone II, the average snowfall and average number of snowfall days showed a consistent slowing decreasing trend with rates of change of −0.354 mm/10 a and −0.319 days/10 a; none reached a significant level (p > 0.05). The variation trends for light snow, heavy snow, and snowstorm were similar to the average snowfall, i.e., a slowly increasing trend with rates of change of −0.158, −0.200, and −0.072 mm/10a, respectively. The variation trends in the number of snowfall days of light snow, heavy snow, and snowstorm were similar to the average number of snowfall days, i.e., a slowly decreasing trend with rates of change of −0.296, −0.030, and −0.030 days/10 a, respectively; none reached a significant level (p > 0.05). In addition, the variation trend in moderate snowfall was the same as that for the number of moderate snowfall days, i.e., a slowly increasing trend with rates of change of 0.085 mm/10 a and 0.017 days/10 a; none reached a significant level (p > 0.05). Therefore, the snowfall and number of snowfall days at other levels in Zone II show had a decreasing trend, except for the snowfall and number of moderate snowfall days, which had an increasing trend.
In Zone III, the average snowfall and average number of snowfall days had a consistent, significantly decreasing trend with rates of change of −3.300 mm/10 a and −1.420 days/10 a, respectively; both reached a significant level (p < 0.05). The variation trends in the snowfall of moderate snow, heavy snow, and snowstorm were similar to the average snowfall, i.e., a significantly decreasing trend with rates of change of −0.927, −0.995, and −0.944 mm/10 a, respectively. The variation trends in the number of snowfall days of light snow, moderate snow, heavy snow, and snowstorm were similar to the average number of snowfall days, i.e., a significantly decreasing trend with rates of change of −0.948, −0.206, −0.154, and −0.058 days/10 a, respectively; all of these parameters reached a significant level (p < 0.05). In addition, light snowfall showed a decreasing trend with a rate of change of −0.436 mm/10 a, which did not reach a significant level (p > 0.05). Therefore, the snowfall and number of snowfall days at different levels in Zone III showed a decreasing trend.
In Zone IV, the average snowfall and average number of snowfall days showed a consistent, slowly decreasing trend with rates of change of −0.088 mm/10 a and −0.080 days/10 a; none reached a significant level (p > 0.05). The variation trends in the snowfall of light snow, moderate snow, and heavy snow were similar to the average snowfall, i.e., a slowly decreasing trend with rates of change of −0.014, −0.067, and −0.045 mm/10 a, respectively. The variation trends in the number of snowfall days of light snow, moderate snow, heavy snow, and snowstorm were similar to the average number of snowfall days, i.e., a slowly decreasing trend with rates of change of −0.039, −0.020, −0.002, and −0.018 day/10 a, respectively; none reached a significant level (p > 0.05). In addition, a snowstorm had a slowly increasing trend with a rate of change of 0.038 mm/10a, which did not reach a significant level (p > 0.05). Therefore, the snowfall and number of snowfall days at other levels in Zone IV showed a decreasing trend, except for snowstorms, which had an increasing trend.
Based on the point of spatial analysis in Figure 6, the average snowfall in Zone I had an insignificantly increasing trend, while the other zones had a decreasing trend. Specifically, the average snowfall in Zone III had a significantly decreasing trend. The average number of snowfall days in all of the zones had a decreasing trend, while Zone III showed a significantly decreasing trend. The spatial variation in light snow was similar to the average snowfall. The snowfall and number of moderate snowfall days in Zones I and II had a gently increasing trend, whereas Zones III and IV showed a decreasing trend; Zone III passed the significance test (p < 0.05). The snowfall and number of heavy snowfall days in Zone I had a significantly increasing trend. Other zones showed a decreasing trend; Zone III passed the significance test (p < 0.05). In addition, snowstorms in Zones I and IV had a gently increasing trend, Zones II and III showed a decreasing trend, and the snowstorm in Zone III passed the significance test (p < 0.05). The number of snowstorm days in Zone I had an insignificantly increasing trend, whereas the other zones showed a decreasing trend; Zone III passed the significance test (p < 0.05). Therefore, the general spatial variation in the snowfall and number of snowfall days were relatively similar, and the amount of snowfall partially depended on the number of snowfall days. The snowfall and the number of snowfall days at different levels passed the significance test (p < 0.05) in Zone III, which indicates that the variation in the snowfall in the Haihe River Basin is closely related to the variation in Zone III. This is consistent with the conclusions of Xiuzhong et al. [61], who analyzed the average snowfall in the North China Plain, which revealed a decreasing trend for the snowfall variation over 46 years.

4.4. Response of Snowfall to Climate Change

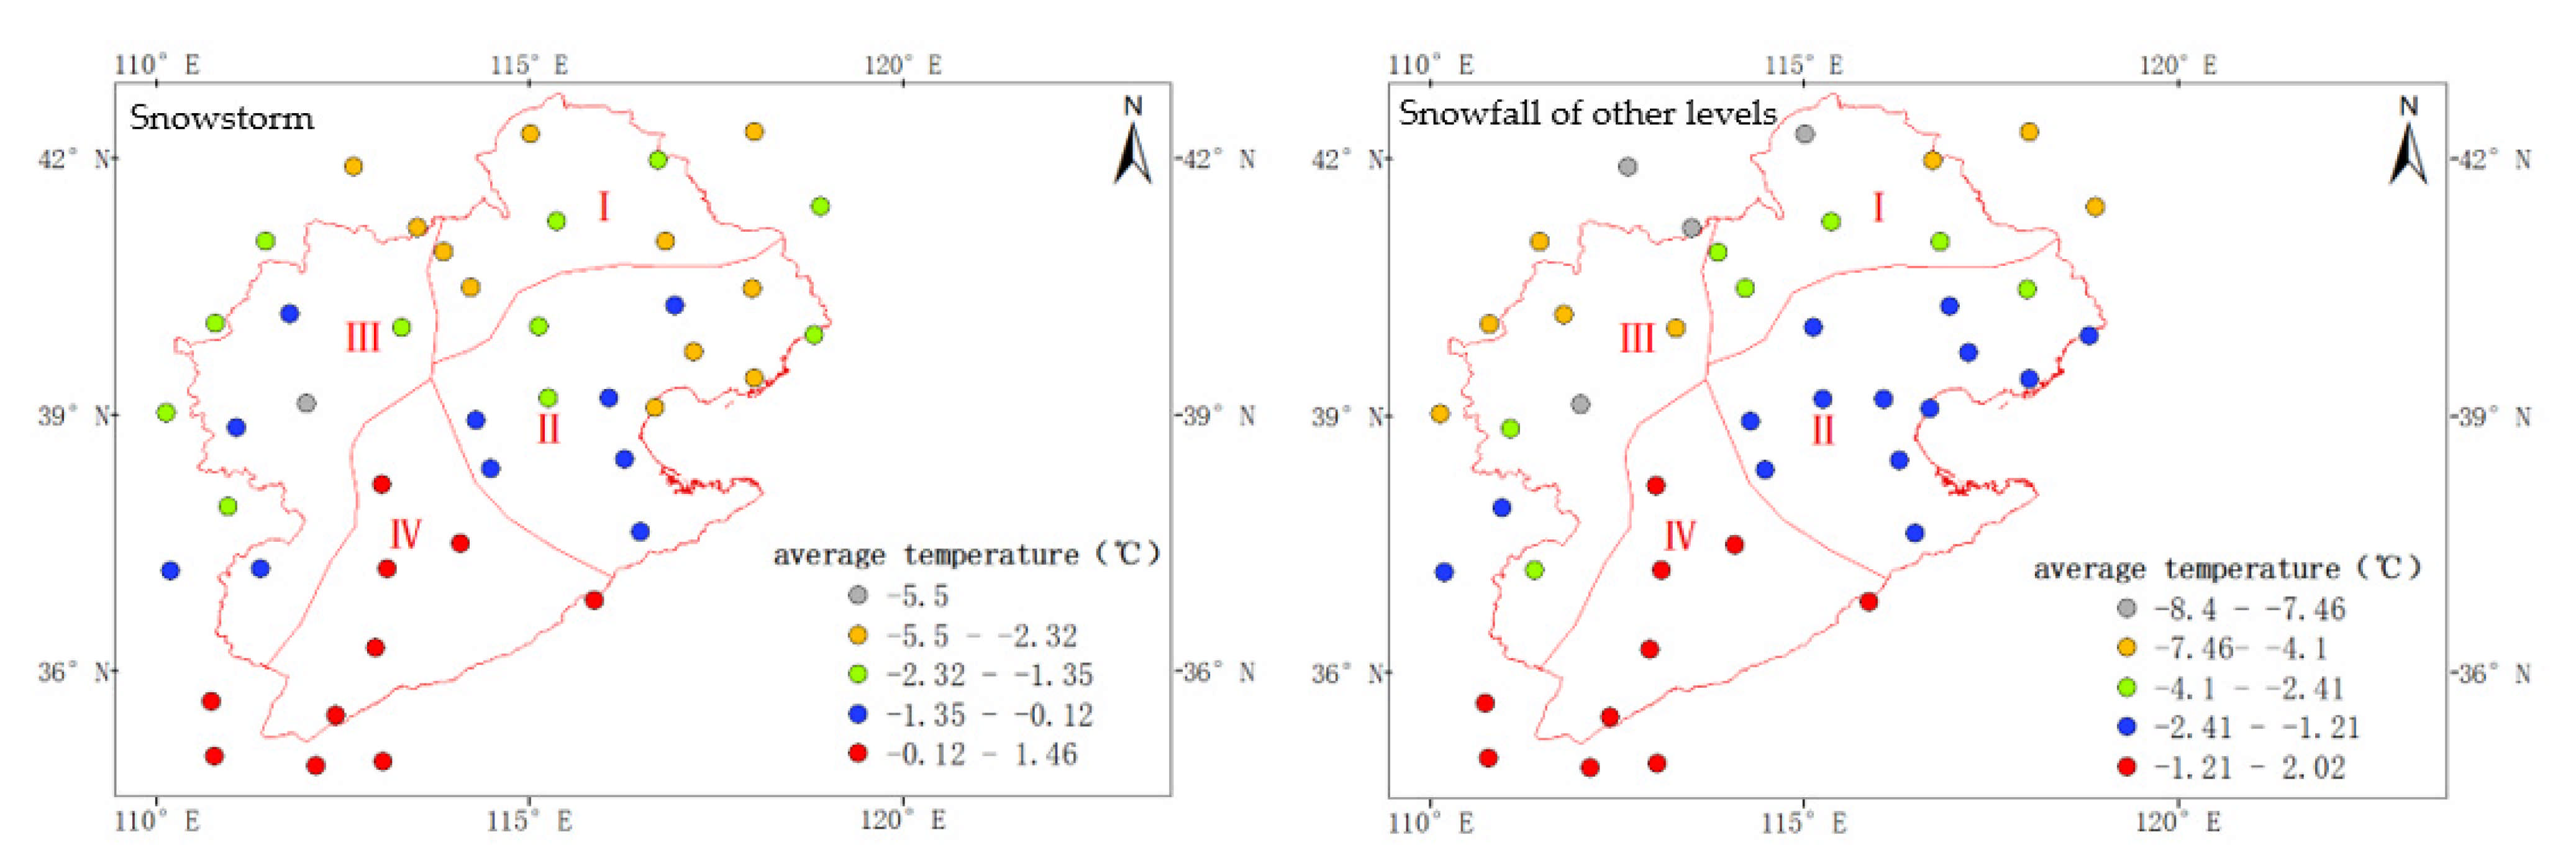
4.4.1. Changes in Temperature during Snowstorms and Other Snowfall Events

The average temperature conditions during snowstorms and other snowfall events in all zones are shown in Figure 7. It illustrates that snowstorm temperatures are concentrated between −5.5 and 1.46 °C, while the snowfall temperatures at other levels are concentrated between −8.4 and 2.0 °C. Based on the point of spatial analysis, the average snowstorm temperatures in all of the zones had the following order: IV > II > III > I, with temperatures of 0.73, −1.60, −1.89, and −2.47 °C, respectively. In addition, the average temperatures of other snowfall events had the following order: IV > II > I > III, with temperatures of 1.88, −1.76, −4.50, and −4.75 °C, respectively. Thus, the average snowfall temperature in Zone IV had a positive value, while the average snowfall temperature in other zones had a negative value.
When the average temperature was lower than 0 °C, the snowstorm temperatures in Zones I, II, and III were higher than the temperature of other snowfall events. When the average temperature was higher than 0 °C, the snowstorm temperature in Zone IV was lower than that for other snowfall events. Our analysis indirectly indicates that a rise in the temperature over a certain range may increase the probability of extreme snowfall.

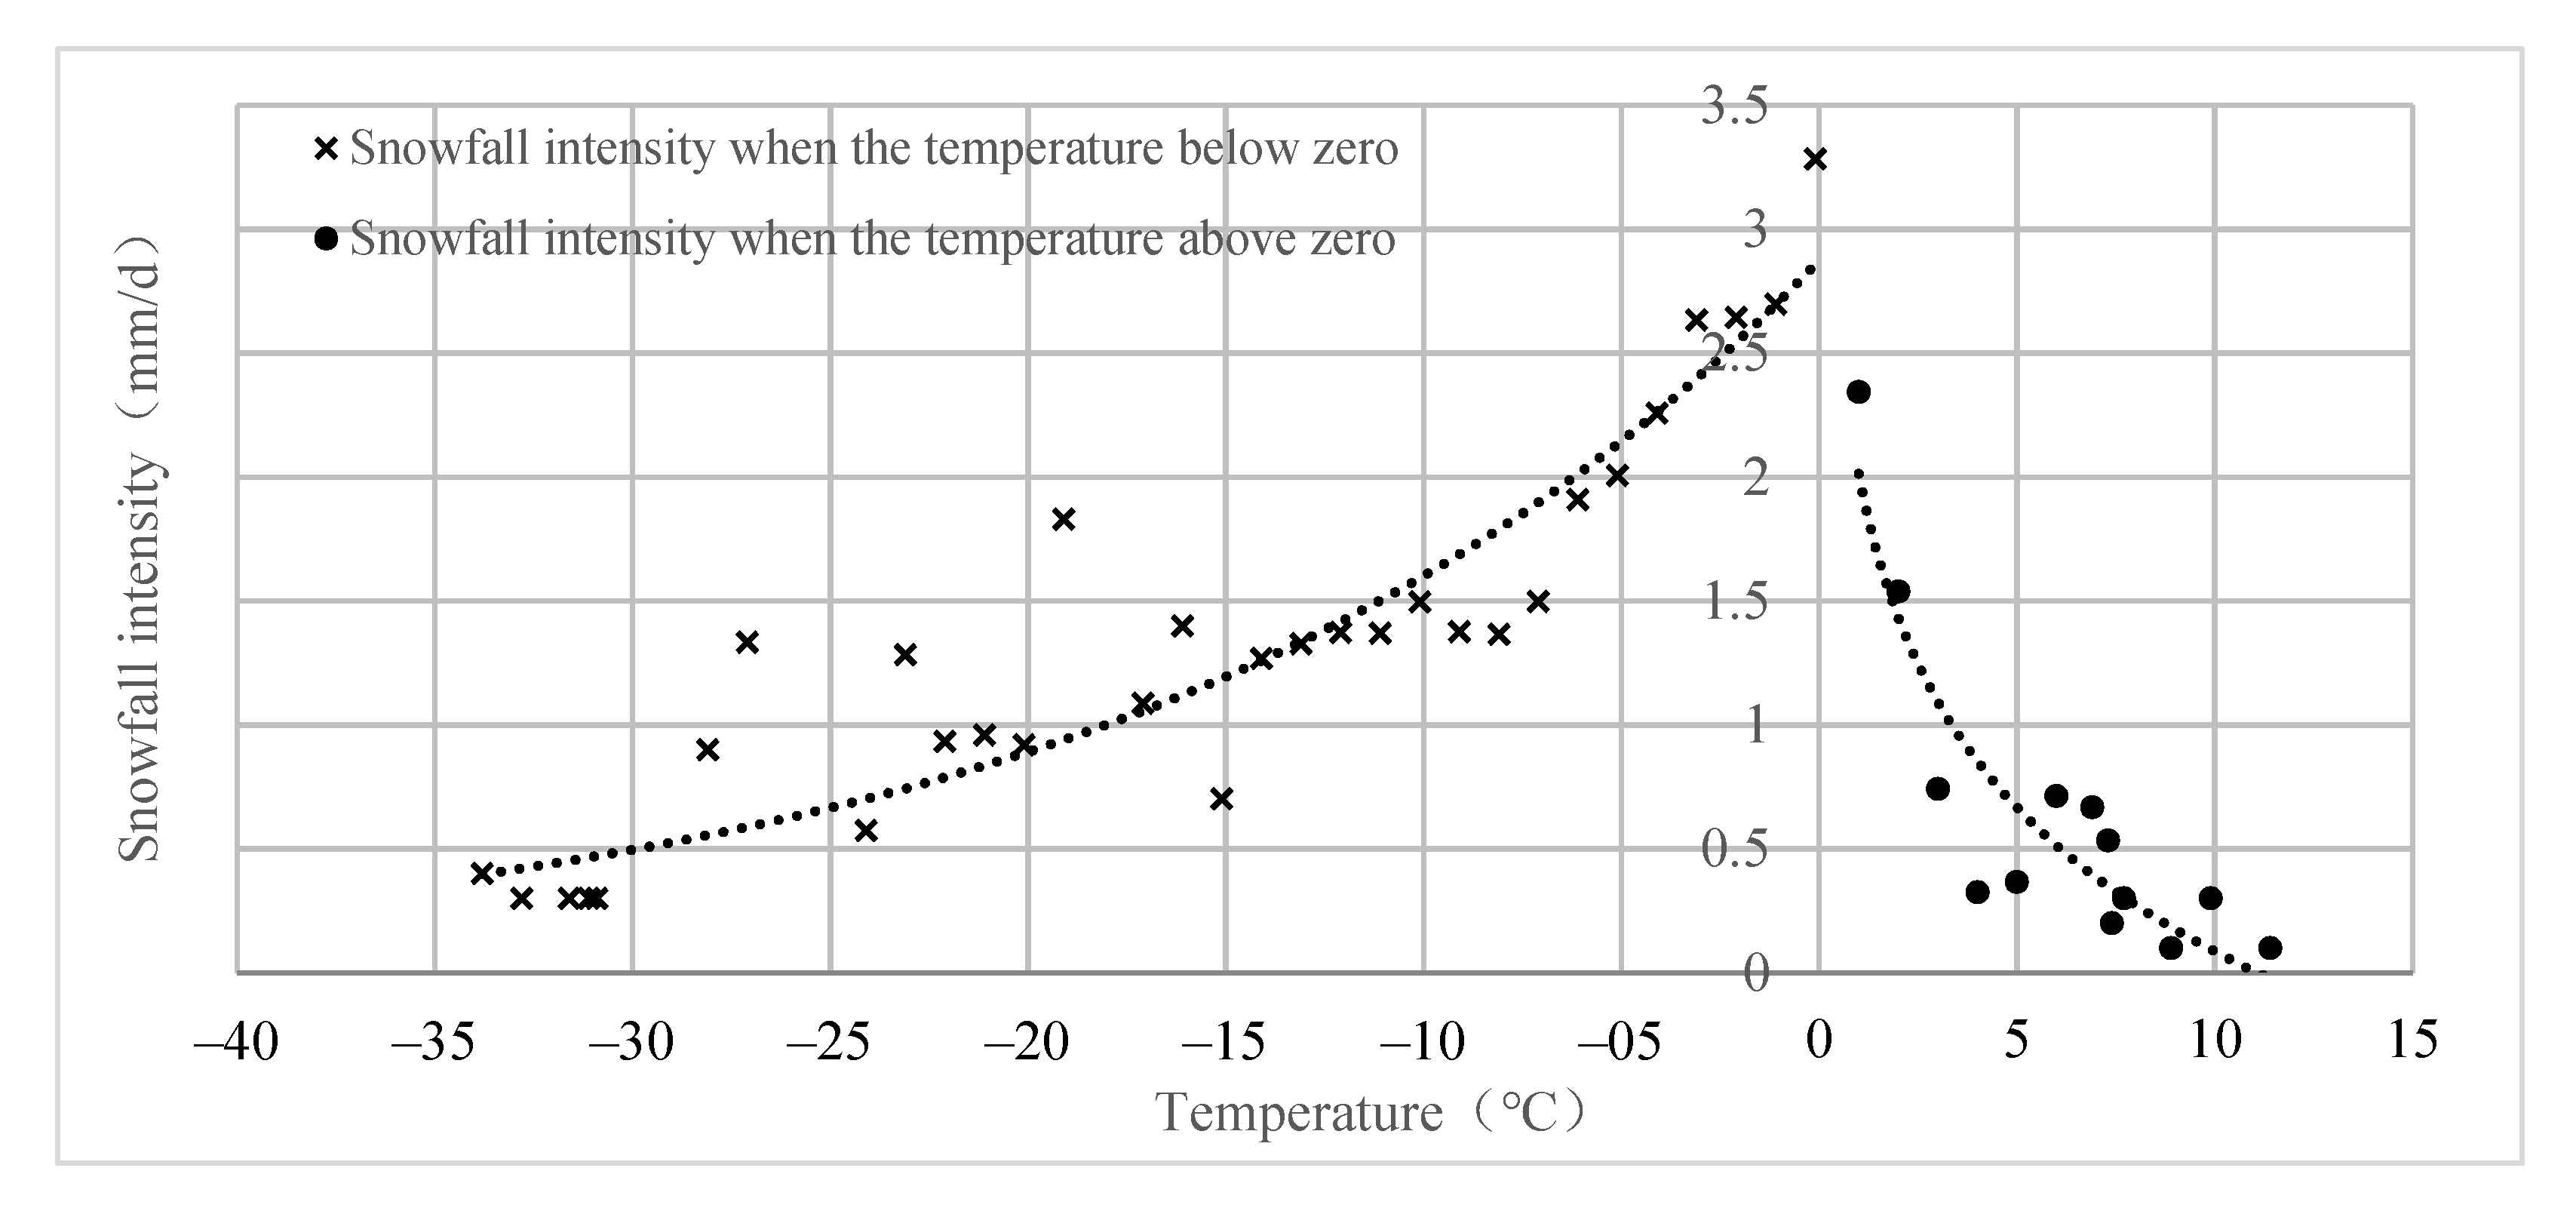
4.4.2. Relationship between Snowfall Intensity and Temperature

To further understand the relationship between snowfall and temperature, we analyzed the relationship between snowfall intensity and temperature at each temperature interval (1 °C) in the Haihe River Basin. Figure 8 shows that when the temperature is lower than 0 °C, the average snowfall intensity increases with a rise in the temperature, with an average growth rate of 16% per degree Celsius. When the temperature is higher than 0 °C, the snowfall decreases, the average snowfall intensity decreases with a rise of temperature, and the average rate of decrease is 2%. In addition, the analysis shows that the snowfall intensity may increase with an increase in the temperature within a certain range.

5. Discussion

Snowfall identification and verification were carried out in this study based on precipitation data from the Haihe River Basin from 1960 to 1979 using the double temperature threshold method; furthermore, we established the daily snowfall data series from 1960 to 2016. The results show that the correlation coefficient between the estimated total snowfall and measured total snowfall in each zone in the Haihe River Basin was 0.95 and above in calibration and validation period, respectively, which are consistent with the correlation coefficients (0.90 and above) obtained by Shaohua et al. [46] and Fei et al. [53] through snowfall identification based on applying the exponential equation to the upstream basin in the Nujiang River and Xilin River basins.
According to the spatial distribution of snowfall at the different levels, the distribution characteristics of the average snowfall are consistent with that of moderate snow, heavy snow, and snowstorm, but different from that of light snow. The main reason for this is that the total amount of snowfall of moderate snow, heavy snow, and snowstorm was more than that of light snow. However, the distribution characteristics for the average number of snowfall days were the same as that of light snow, but different from that of moderate snow, heavy snow, and snowstorm. The main reason for this is that the number of days of light snow was much larger than that of the snowfall days at other levels. From snowfall contribution and the ratio of the number of snowfall days to total snowfall perspectives, the light snowfall and number of light snowfall days in other zones (except for Zone IV) to the total snowfall was the largest, which is consistent with the conclusions of Zhifu et al. [6] and Yulian et al. [62]. In addition, the number of light snowfall days in Zone IV accounted for ≥70%, but light snowfall only accounted for 23%. The number of snowstorm days was relatively few, but the amount of snowfall accounted for 24% of the total snowfall. This may be associated with the snowfall temperatures in Zone IV. The probability of extreme snowfall tended to increase against the background of climate warming, which is consistent with the conclusions drawn by Yan and Jianli [3] in their research on snowfall in the Tianshan Mountains.
In the Haihe River Basin, the snowfall at different levels in Zones II, III, and IV showed a decreasing trend, while Zone I had an increasing trend. The main reason may be that the geographical location of Zone I is the Yanshan Mountains and the Mongolian plateau, where snowfall tends to increase, due to cold air and warm wet air, which is consistent with the conclusions drawn by Yan and Jianli [3] based on snowfall in the Tianshan Mountains. In the Tianshan Mountains, the snowfall and snowfall intensity have an increasing trend as functions of climate warming. This, however, is different from the conclusions reported in Xiuzhong et al. [63] based on variations in the snowfall in China, where that the snowfall in North China shows a decreasing trend. Moreover, snowfall in Zones II, III, and IV had a decreasing trend with climate warming, which is consistent with the conclusions of Xiuzhong et al. [63], Peiji [64], Shuai et al. [65], and Xingkui [66], who all investigated variations in the snowfall in China. As the average altitude of Zone III in the Haihe River Basin is more than 1200 m (the altitude of Wutai Mountain is 2895 m), the perennial average temperature is −1.19 °C, the snowfall as a function of climate warming had a decreasing trend. The reason for this may be that, with economic development, a large number of particles emitted into the atmosphere have caused an increase in the aerosol concentration, therefore inhibiting the formation of precipitation. This is consistent with the conclusions drawn in Hui et al. [67] and Hanbo et al. [68] based on analyses of the variations in precipitation at Wutai Mountain.
In the context of climate warming, not all snowfall indicators are positively correlated with temperature, i.e., the factors affecting snowfall are highly complex. Specifically, relative humidity, atmospheric circulation, aerosols, and other factors may influence snowfall [69]. Therefore, a comprehensive consideration of the various influencing factors is necessary, as well as further research on the spatial and temporal variations in snowfall.

6. Conclusions

With the Haihe River Basin as the research object using surface meteorological observation data on the daily precipitation in this basin and 43 surrounding meteorological stations from 1960 to 2016, we identified the precipitation types within different phase states through snowfall identification methods. We further analyzed the spatial and temporal variation in the snowfall at different levels, as well as a discussion on the response of snowfall to climate change. The main conclusions of this study are as follows.
(1) Based on the exponential equation for the snowfall proportion and average daily temperature, the snowfall at each meteorological station in the Haihe River Basin can be effectively estimated well at an annual scale. The correlation coefficients between the estimated total snowfall and measured total snowfall at the stations in each zone were ≥0.95, and the relative error was ≤5%, in the calibration and validation period, respectively.
(2) In the Haihe River Basin, Except for the average snowfall and light snowfall, the snowfall and snowfall days of moderate snow, heavy snow, and snowstorm in each division are in the order of Zones III > IV > I > II. The snowfall and the number of light snowfall days had the following order: III > I > IV > II. The average snowfall had the following order: III > IV > I > II. The average number of snowfall days had the following order: III > I > IV > II. Except for Zone IV, the contribution rate of the snowfall at the different levels in the other zones to the total snowfall had the following order: light snow > moderate snow > heavy snow > snowstorm.
(3) In terms of time, the average snowfall, light snow, and heavy snow in the zones (except for Zone I) had a decreasing trend. The snowfall and number of moderate snowfall days in Zones I and II showed an increasing trend, while Zones III and IV had a decreasing trend. In addition, snowstorms in Zones I and IV had an increasing trend, while Zones II and IIII showed a decreasing trend. The number of snowstorm days in the other zones (except for Zone I with an increasing trend) showed a decreasing trend. In spatial terms, the interannual variation trends for snowfall at the different levels in Zone III were significant when compared with that of the other zones.
(4) In the Haihe River Basin, the snowstorm temperature was higher than that for other snowfall conditions when the average snowfall temperature was below 0 °C, while the snowstorm temperature was lower than that for other snowfall conditions when the average temperature was above 0 °C. When the temperature was less than 0 °C, the average snowfall intensity increased with an increase in the temperature; if the temperature was more than 0 °C, the average snowfall intensity decreased with an increasing temperature.
(5) In the Haihe River Basin, it is found that the temperature during the snowstorm is higher than that of other levels of snowfall, which indirectly indicates that the increase of temperature may promote the probability of extreme snowfall. This conclusion is local and not generic—it needs to be further investigated.

Author Contributions

This paper is a joint effort by several authors. Conceptualization, S.L. and B.L.; methodology, X.W.; validation, D.X. and X.W.; data curation, S.L.; writing—original draft preparation, X.W.; writing—review and editing, X.W. All authors have read and agreed to the published version of the manuscript.

Funding

This research was funded by the National Water Pollution Control and Management Science and Technology Major Project of China, grant number 2014ZX07203-008, the Postgraduate Innovation Ability Funding Project of Hebei Province, grant number 18129023018.

Institutional Review Board Statement

Not applicable.

Informed Consent Statement

Not applicable.

Data Availability Statement

All data used during the study are proprietary or confidential and may only be provided with restrictions.

Acknowledgments

The authors are also thankful for support from the Hebei University of Engineering.

Conflicts of Interest

The authors declare no conflict of interest.

References

  1. Wang, J.; Li, S. Effects of climate change on snowfall melt runoff in China’s inland arid mountains. Sci. China Earth Sci. 2005, 35, 664–670. [Google Scholar]
  2. Li, X. Variation Characteristics of Snowfall in Xinjiang from 1961 to 2010. Master’s Thesis, Northwest Normal University, Lanzhou, China, 2013. [Google Scholar]
  3. Qin, Y.; Ding, J. Analysis on variation characteristics of snowfall events of different levels in Tianshan, China from 1961 to 2016. Adv. Water Sci. 2019, 30, 457–466. [Google Scholar]
  4. Hahn, D.G.; Shukla, J. An apparent relationship between Eurasian snowfall cover and Indian monsoon rainfall. J. Atmos. Sci. 1976, 33, 2461–2462. [Google Scholar] [CrossRef] [Green Version]
  5. Yamazaki, K. A study of the impact of soil moisture and surface bed of changes on global climate using the MRI GCM-I. J. Meteorol. Soc. Jpn. 1989, 67, 123–146. [Google Scholar] [CrossRef] [Green Version]
  6. Zhang, Z.; Xi, S.; Liu, N.; Yu, Y.; Fan, S.; Feng, M. Analysis on spatiotemporal variation characteristics of snowfall in China from 1961 to 2012. Resour. Sci. 2015, 37, 1765–1773. [Google Scholar]
  7. Lin, Z. Topographic Precipitation Climatology; Science Press: Beijing, China, 1995; pp. 147–148. [Google Scholar]
  8. Barnett, T.P.; Dumenil, L.; Schlese, U.; Roeckner, E. The effect of Eurasian snow cover on global climate. Science 1988, 239, 504–507. [Google Scholar] [CrossRef]
  9. Cohen, J.; Rind, R. The effect of snowfall cover on the climate. J. Clim. 1991, 4, 689–706. [Google Scholar] [CrossRef]
  10. Namias, J. Some empirical evidence for the influence of snow covers on temperature and precipitation. Mon. Weather. Rev. 1985, 113, 1542–1543. [Google Scholar] [CrossRef] [Green Version]
  11. Vernekar, A.D.; Zhou, J.; Shukla, J. The effect of Eurasian snowfall cover on the Indian monsoon. J. Clim. 1995, 8, 248–266. [Google Scholar] [CrossRef] [Green Version]
  12. Wu, M.; Zhao, X.; Liu, W.; Zhang, L.; He, L. Characteristics of hydrothermal conditions in winter of 2017/2018 and influence on agricultural production. Chin. J. Agrometeorol. 2008, 39, 66–68. [Google Scholar]
  13. Shen, Y.; Su, H.; Wang, G.; Mao, W.; Wang, S.; Han, P.; Wang, N.; Li, Z. Response of glaciers and snowfall cover to Climate change in Xinjiang: II: Disaster effect. J. Glaciol. Geocryol. 2013, 35, 1355–1370. [Google Scholar]
  14. Guo, L.; Li, L. Variation of the proportion of precipitation occurring as snow in the Tian Shan Mountains, China. Int. J. Climatol. 2015, 35, 1379–1393. [Google Scholar] [CrossRef]
  15. Wang, Y.; Liu, X.; Bai, A.; Qi, D.; Xiao, H.; Ou, J. Analysis on variation characteristics of extreme snowfall index in Sanjiangyuan region from 1961 to 2017. J. Meteorol. Environ. 2008, 34, 108–115. [Google Scholar]
  16. Zhang, L.; Zhang, J.; Li, J. Analysis on variation characteristics of extreme snowfall events in winter in Altay Prefecture. J. Arid Land Resour. Environ. 2014, 28, 89–95. [Google Scholar]
  17. Yao, T.; Qin, D.; Shen, Y.; Zhao, L.; Wang, N.; Lu, A. Changes in cryosphere of Qinghai-Tibet Plateau and influence on regional water cycle and ecological conditions. Chin. J. Nat. 2013, 35, 179–186. [Google Scholar]
  18. Donat, M.G.; Lowry, A.L.; Alexander, L.V.; O’Gorman, P.A.; Maher, N. More extreme precipitation in the world’s dry and wet regions. Nat. Clim. Change 2016, 6, 508–513. [Google Scholar] [CrossRef]
  19. Li, B. Analysis on Spatial and Temporal Variation of Precipitation and Snowfall Impact Factor Analysis in Northeast China in Recent 50 Years. Master’s Thesis, Lanzhou University, Lanzhou, China, 2013. [Google Scholar]
  20. Huang, Y. Influence of Climate Warming on Spatial and Temporal Variation of Snowfall in Heilongjiang Province. Master’s Thesis, Harbin Normal University, Harbin, China, 2019. [Google Scholar]
  21. Vries, H.D.; Haarsma, R.J.; Hazeleger, W. On the future reduction of snowfall in western and central Europe. Clim. Dyn. 2013, 41, 2319–2330. [Google Scholar] [CrossRef]
  22. Vries, H.D.; Lenderink, G.; Meijgaard, E.V. Future snowfall in western and central Europe projected with a high-resolution regional climate model ensemble. Geophys. Res. Lett. 2014, 41, 4294–4299. [Google Scholar] [CrossRef]
  23. Bintanja, R. The impact of Arctic warming on increased rainfall. Sci. Rep. 2018, 8, 16001. [Google Scholar] [CrossRef] [Green Version]
  24. Jiang, W.; Xia, L.; Xiao, T.; Luo, B.; Zhou, Z. Climate change and spatial distribution of winter snowfall in Qinghai-Tibet Plateau from 1971 to 2010. J. Glaciol. Geocryol. 2016, 38, 1211–1218. [Google Scholar]
  25. Tunyaz, N.; Mamat, B.; Zhang, Y. Analysis on spatial and temporal distribution characteristics and mutation of snowfall in western Southern Xinjiang. Arid Zone Res. 2016, 33, 934–942. [Google Scholar]
  26. Xu, J.; Qiu, J. Research on snowfall fluctuation in Tianshan Mountains in the past 30 years. J. Glaciol. Geocryol. 1996, S1, 123–128. [Google Scholar]
  27. Li, X.; Zhang, M.; Wang, B.; Wang, Y.; Wang, S. Variation characteristics of snowfall, concentration degree and concentration period in winter in Tianshan region. Resour. Sci. 2012, 34, 1556–1564. [Google Scholar]
  28. Mishra, A.K.; Rafiq, M. Analyzing snowfall variability over two locations in kashmir, india in the context of warming climate. Dyn. Atmos. Oceans 2017, 79, 1–9. [Google Scholar] [CrossRef]
  29. Huntington, T.G.; Hodgkins, G.A.; Keim, B.D.; Dudley, R.W. Changes in the proportion of precipitation occurring as snow in New England (1949–2000). J. Clim. 2004, 17, 2626–2636. [Google Scholar] [CrossRef]
  30. Irannezhad, M.; Ronkanen, A.K.; Kiani, S.; Chen, D.; Kløve, B. Long-term variability and trends in annual snowfall/total precipitation ratio in Finland and the role of atmospheric circulation patterns. Cold Reg. Sci. Technol. 2017, 143, 23–31. [Google Scholar] [CrossRef]
  31. Räisänen, J. Twenty-first century changes in snowfall climate in Northern Europe in ENSEMBLES regional climate models. Clim. Dyn. 2015, 46, 339–353. [Google Scholar] [CrossRef] [Green Version]
  32. Lute, A.C.; Abatzoglou, J.T.; Hegewisch, K.C. Projected changes in snowfall extremes and interannual variability of snowfall in the western U.S. Water Resour. Res. 2015, 51, 960–972. [Google Scholar] [CrossRef]
  33. Ning, L.; Bradley, R.S. Snowfall occurrence changes over the central and eastern United States under future warming scenarios. Sci. Rep. 2015, 5, 17073. [Google Scholar] [CrossRef] [Green Version]
  34. Zhao, C.; Wang, J.; Yan, X.; Wang, Y.; Luo, Y. Climate characteristics and division of winter snowfall in northeast China. J. Nat. Disasters 2009, 18, 29–35. [Google Scholar]
  35. Skoulikaris, C.; Anagnostopoulou, C.; Lazoglou, G. Hydrological modeling response to climate model spatial analysis of a south eastern Europe international basin. Climate 2020, 8, 1. [Google Scholar] [CrossRef] [Green Version]
  36. Yang, Z.L.; Dickinson, R.E.; Robock, A.; Vinnikov, K.Y. Validation of the snowfall submodel of the biosphere-atmosphere transfer scheme with Russian snowfall cover and meteorological observational data. J. Clim. 1997, 10, 353–373. [Google Scholar] [CrossRef]
  37. Zhang, Z.; Wang, Z. Research on identification criterion of precipitation phase state in Hohhot. Inner Mongolia For. Sci. Technol. 2017, 43, 42–47. [Google Scholar]
  38. Dai, A. Temperature and pressure dependence of the rain-snowfall phase transition over land and ocean. Geophys. Res. Lett. 2008, 35, 62–77. [Google Scholar] [CrossRef]
  39. Jennings, K.S.; Molotch, N.P. The sensitivity of modeled snow accumulation and melt to precipitation phase methods across a climatic gradient. Hydrol. Earth Syst. Sci. 2019, 23, 3765–3786. [Google Scholar] [CrossRef] [Green Version]
  40. Jennings, K.S.; Winchell, T.S.; Livneh, B.; Molotch, N.P. Spatial variation of the rain–snow temperature threshold across the northern hemisphere. Nat Commun. 2018, 9, 1148. [Google Scholar] [CrossRef] [Green Version]
  41. Harpold, A.A.; Kaplan, M.L.; Klos, P.Z.; Link, T.; McNamara, J.P.; Rajagopal, S.; Schumer, R.; Steele, C.M. Rain or snow: Hydrologic processes, observations, prediction, and research needs. Hydrol. Earth Syst. Sci. 2017, 21, 1–22. [Google Scholar] [CrossRef] [Green Version]
  42. Marks, D.; Winstral, A.; Reba, M.; Pomeroy, J.; Kumar, M. An evaluation of methods for determining during-storm precipitation phase and the rain/snow transition elevation at the surface in a mountain basin. Adv. Water Resour. 2013, 55, 98–110. [Google Scholar] [CrossRef]
  43. Ye, H.; Cohen, J.; Rawlins, M. Discrimination of solid from liquid precipitation over northern Eurasia using surface atmospheric conditions. J. Hydrometeorol. 2013, 14, 1345–1355. [Google Scholar] [CrossRef] [Green Version]
  44. Matsuo, T.; Sato, Y.; Sasyo, Y. Relationship between types of precipitation on the ground and surface meteorological elements. J. Meteorol. Soc. Jpn. 1981, 59, 462–475. [Google Scholar] [CrossRef] [Green Version]
  45. Chen, R.; Lv, S.; Kang, E.; Ji, X.; Zhang, Z.; Yang, Y.; Qing, W. A distributed water-heat coupled model for mountainous watershed of an inland river basin of Northwest China (I) model structure and equations. Environ. Geol. 2008, 53, 1299–1309. [Google Scholar] [CrossRef]
  46. Liu, S.; Yan, D.; Wang, H.; Qin, T.; Weng, B.; Li, Y. Snowfall identification and evolution trend and cause analysis in the upper reaches of the Nu River. J. Hydraul. Eng. 2018, 49, 254–262. [Google Scholar]
  47. Feiccabrino, J.; Graff, W.; Lundberg, A.; Sandström, N.; Gustafsson, D. Meteorological knowledge useful for the improvement of snow rain separation in surface based models. Hydrology 2015, 2, 266–288. [Google Scholar] [CrossRef] [Green Version]
  48. Wang, G.; Yan, D.; Zhang, D.; Liu, S. Analysis on variation trend of extreme temperature and precipitation in Haihe River Basin from 1961 to 2010. South-to-North Water Divers. Water Conserv. Sci. Technol. 2014, 12, 1–6. [Google Scholar]
  49. Shao, Y.; Liu, L.; Liu, J.; Wu, J. Frequency analysis and spatial and temporal distribution characteristics of precipitation extremum closing to 60a in Haihe River Basin. Trans. Atmos. Sci. 2020, 43, 381–391. [Google Scholar]
  50. Ma, M.; Han, Y.; Wang, Q.; Zhao, Y.; Wang, J. Spatial and temporal variation of extreme precipitation in Haihe River Basin and relationship with atmospheric circulation. Int. J. Hydroelectr. Energy 2019, 37, 1–4. [Google Scholar]
  51. Liu, X.; Ren, G.; Fan, Z.; Zhang, C.; Yang, X. Analysis on spatial and temporal variation trend of extreme heavy precipitation in Haihe River Basin in recent 47 years. J. Arid Land Resour. Environ. 2010, 24, 85–90. [Google Scholar]
  52. Wei, Z. Study on Variation of Underlying Surface Elements in the Haihe River Basin and Its Impact on Flood. Ph.D Thesis, Tianjin University, Tianjin, China, 2013. [Google Scholar]
  53. Wang, F.; Zhu, Z.; Hao, X.; Han, D.; Wang, H.; Wang, Q. Research on snowfall identification and evolution trend in Xilin River Basin. Plateau Meteorol. 2019, 38, 725–733. [Google Scholar]
  54. Zhang, L.; Wu, S.; Dong, F. Research on identification criterion of precipitation phase state in Anqing. J. Meteorol. Environ. 2008, 34, 30–37. [Google Scholar]
  55. Mann, H.B. Non-parametric tests against trend. Econometrica 1945, 13, 245–259. [Google Scholar] [CrossRef]
  56. Kendall, M.G. Rank Correlation Measures; Charles Griffin: London, UK, 1975. [Google Scholar]
  57. Kottegoda, N.T. Stochastic Water Resources Technology; Wiley: New York, NY, USA, 1980; ISBN 978-1-349-03467-3. [Google Scholar]
  58. Burn, D.H.; Elnur, M.A.H. Detection of hydrologic trends and variability. J. Hydrol. 2002, 55, 107–122. [Google Scholar] [CrossRef]
  59. Aziz, O.I.A.; Burn, D.H. Trends and variability in the hydrological regime of the Mackenzie River Basin. J. Hydrol. 2006, 319, 282–294. [Google Scholar] [CrossRef]
  60. Mishra, A.K.; Singh, V.P. Changes in extreme precipitation in Texas. J. Geophys. Res. Atmos. 2010, 115, D14. [Google Scholar] [CrossRef]
  61. Sun, X.; Luo, Y.; Zhang, X.; Gao, Y. Analysis on variation characteristics of snowfall in China in recent 46 years. Plateau Meteorol. 2010, 29, 1594–1601. [Google Scholar]
  62. Liu, Y.; Ren, G.; Yu, H. Characteristics of snowfall climatology in China. Geogr. Sci. 2012, 10, 19–28. [Google Scholar]
  63. Sun, X.; Sun, Z.; Luo, Y. Study on variation characteristics of snowfall in northeast China from 1960 to 2005. J. Meteorol. Environ. 2010, 226, 1–5. [Google Scholar]
  64. Li, P. Preliminary study on change of snowfall in China in recent 30 years. Acta Meteorol. Sin. 1990, 4, 51–55. [Google Scholar]
  65. Li, S.; Chen, L.; Ren, Y. Study on changes of winter precipitation in China from 1951/1952 to 2004/2005. J. Trop. Meteorol. 2008, 24, 94–98. [Google Scholar]
  66. Xu, X. Variation and regional distribution characteristics of snowfall in China from 1970 to 2000. J. Glaciol. Geocryol. 2011, 3, 41–47. [Google Scholar]
  67. Zhang, H.; Chen, Y.; Yang, M. Climatological data uniformity test and climate change trend analysis of Mount Wutai station. Chin. Agric. Sci. Bull. 2016, 32, 168–173. [Google Scholar]
  68. Yang, H.; Yang, D.; Lei, Z. Effects of topographic rain reduction on water resources in Mount Wutai. Adv. Water Sci. 2010, 21, 674–680. [Google Scholar]
  69. Jones, R.; Westra, S.; Sharma, A. Observed relationships between extreme sub-daily precipitation surface temperature and relative humidity. Geophys. Res. Lett. 2011, 37, 22805–22810. [Google Scholar]
Figure 1. Geographical location and topographic map of the Haihe River Basin.
Water 13 01798 g001
Figure 2. K-means clustering results and zones of the Haihe River Basin (a) K-means clustering results and spatial distribution for the Haihe River Basin. (b) Division zones of Haihe River Basin.
Water 13 01798 g002
Figure 3. Diagram of the relationship between the snowfall ratio and average daily temperature.
Water 13 01798 g003
Figure 4. The measured total snowfall and estimated total snowfall in different zones of the Haihe River Basin. (a) Zone I, (b) ZoneⅡ, (c) Zone Ⅲ, (d) Zone Ⅳ.
Water 13 01798 g004aWater 13 01798 g004b
Figure 5. Interannual variations in the snowfall and number of snowfall days at different levels in Zone I in the Haihe River Basin.
Water 13 01798 g005
Figure 6. The Mann–Kendall (M–K) trend test results for the snowfall at the different levels in each zone in the Haihe River Basin (a) Average snowfall, (b) average snowfall days, (c) light snowfall, (d) light snowfall days, (e) moderate snowfall, (f) moderate snowfall days, (g) heavy snowfall, (h) heavy snowfall days, (i) snowstorm, (j) snowstorm days.
Water 13 01798 g006aWater 13 01798 g006b
Figure 7. The average temperature for snowstorms and other snowfall events in all zones in the Haihe River Basin.
Water 13 01798 g007
Figure 8. The relationship between the snowfall intensity and temperature.
Water 13 01798 g008
Table 1. Basic information for the zone partitioning analysis.
ZoneClimate TypeElevation
(m)
Average Annual Snowfall
(mm)
Average Annual Temperature
(°C)
Number of Meteorological StationsProportion of Meteorological Stations (%)
ITemperate continental monsoon climate375.2–1245.418.67.3819
IITemperate monsoon climate1.8–227.214.511.91330
IIITemperate continental monsoon climate748.8–2895.836.96.01228
IVTemperate monsoon climate27.4–659.522.713.91023
Table 2. Definition of the snowfall index.
IndicatorDefinition
Light snow0.1 mm < daily snowfall < 2.5 mm
Moderate snow2.5 mm ≤ daily snowfall < 5 mm
Heavy snow5 mm ≤ daily snowfall < 10 mm
Snowstormdaily snowfall ≥ 10 mm
Table 3. The results of correlation coefficient and relative error in calibration and validation period.
ZoneCalibration Period (1960–1969)Validation Period (1970–1979)
Correlation CoefficientRelative Error (%)Correlation CoefficientRelative Error (%)
I0.99−2.990.98−3.39
II0.970.140.994.82
III0.93−1.520.950.99
IV0.98−3.530.98−1.83
Table 4. Statistic of different levels of annual average snowfall and snowfall days in each zone.
ZoneIndicatorLight SnowModerate SnowHeavy SnowSnowstorm
ISnowfall (mm)6.94.53.93.4
Proportion of snowfall (%)36.9023.9221.0518.13
Snowfall days (d)9.51.30.60.2
Proportion of number of snowfall days (%)81.9811.104.981.93
IISnowfall (mm)4.83.83.62.4
Proportion of snowfall (%)33.0525.9424.4116.60
Snowfall days (d)6.21.10.50.2
Proportion of number of snowfall days (%)77.6413.776.502.09
IIISnowfall (mm)11.38.78.78.3
Proportion of snowfall (%)30.6523.5523.4122.39
Snowfall days (d)14.62.51.30.6
Proportion of number of snowfall days (%)77.2713.106.722.90
IVSnowfall (mm)5.45.36.55.5
Proportion of snowfall (%)23.7523.5028.6824.07
Snowfall days (d)6.71.50.90.4
Proportion of number of snowfall days (%)70.5115.869.773.85
Table 5. Interannual variation trends in the snowfall at different levels in the Haihe River Basin.
LevelIIIIIIIV
Light SnowSnowfall (mm/10 a)0.080−0.158−0.436−0.014
Number of Snowfall Days (d/10 a)−0.279−0.296−0.948−0.039
Moderate SnowSnowfall (mm/10 a)0.2060.085−0.927−0.067
Number of Snowfall Days (d/10 a)0.0610.017−0.262−0.020
Heavy SnowSnowfall (mm/10 a)0.341−0.200−0.995−0.045
Number of Snowfall Days (d/10 a)0.047−0.030−0.154−0.002
SnowstormSnowfall (mm/10 a)0.327−0.072−0.9440.038
Number of Snowfall Days (d/10 a)0.016−0.030−0.058−0.018
AverageSnowfall (mm/10 a)0.954−0.354−3.300−0.088
Number of Snowfall Days (d/10 a)−0.156−0.319−1.420−0.080
Publisher’s Note: MDPI stays neutral with regard to jurisdictional claims in published maps and institutional affiliations.

