
Exploring the Spatial Impact of Green Infrastructure on Urban Drainage Resilience


Abstract
:1. Introduction
2. Materials and Methods
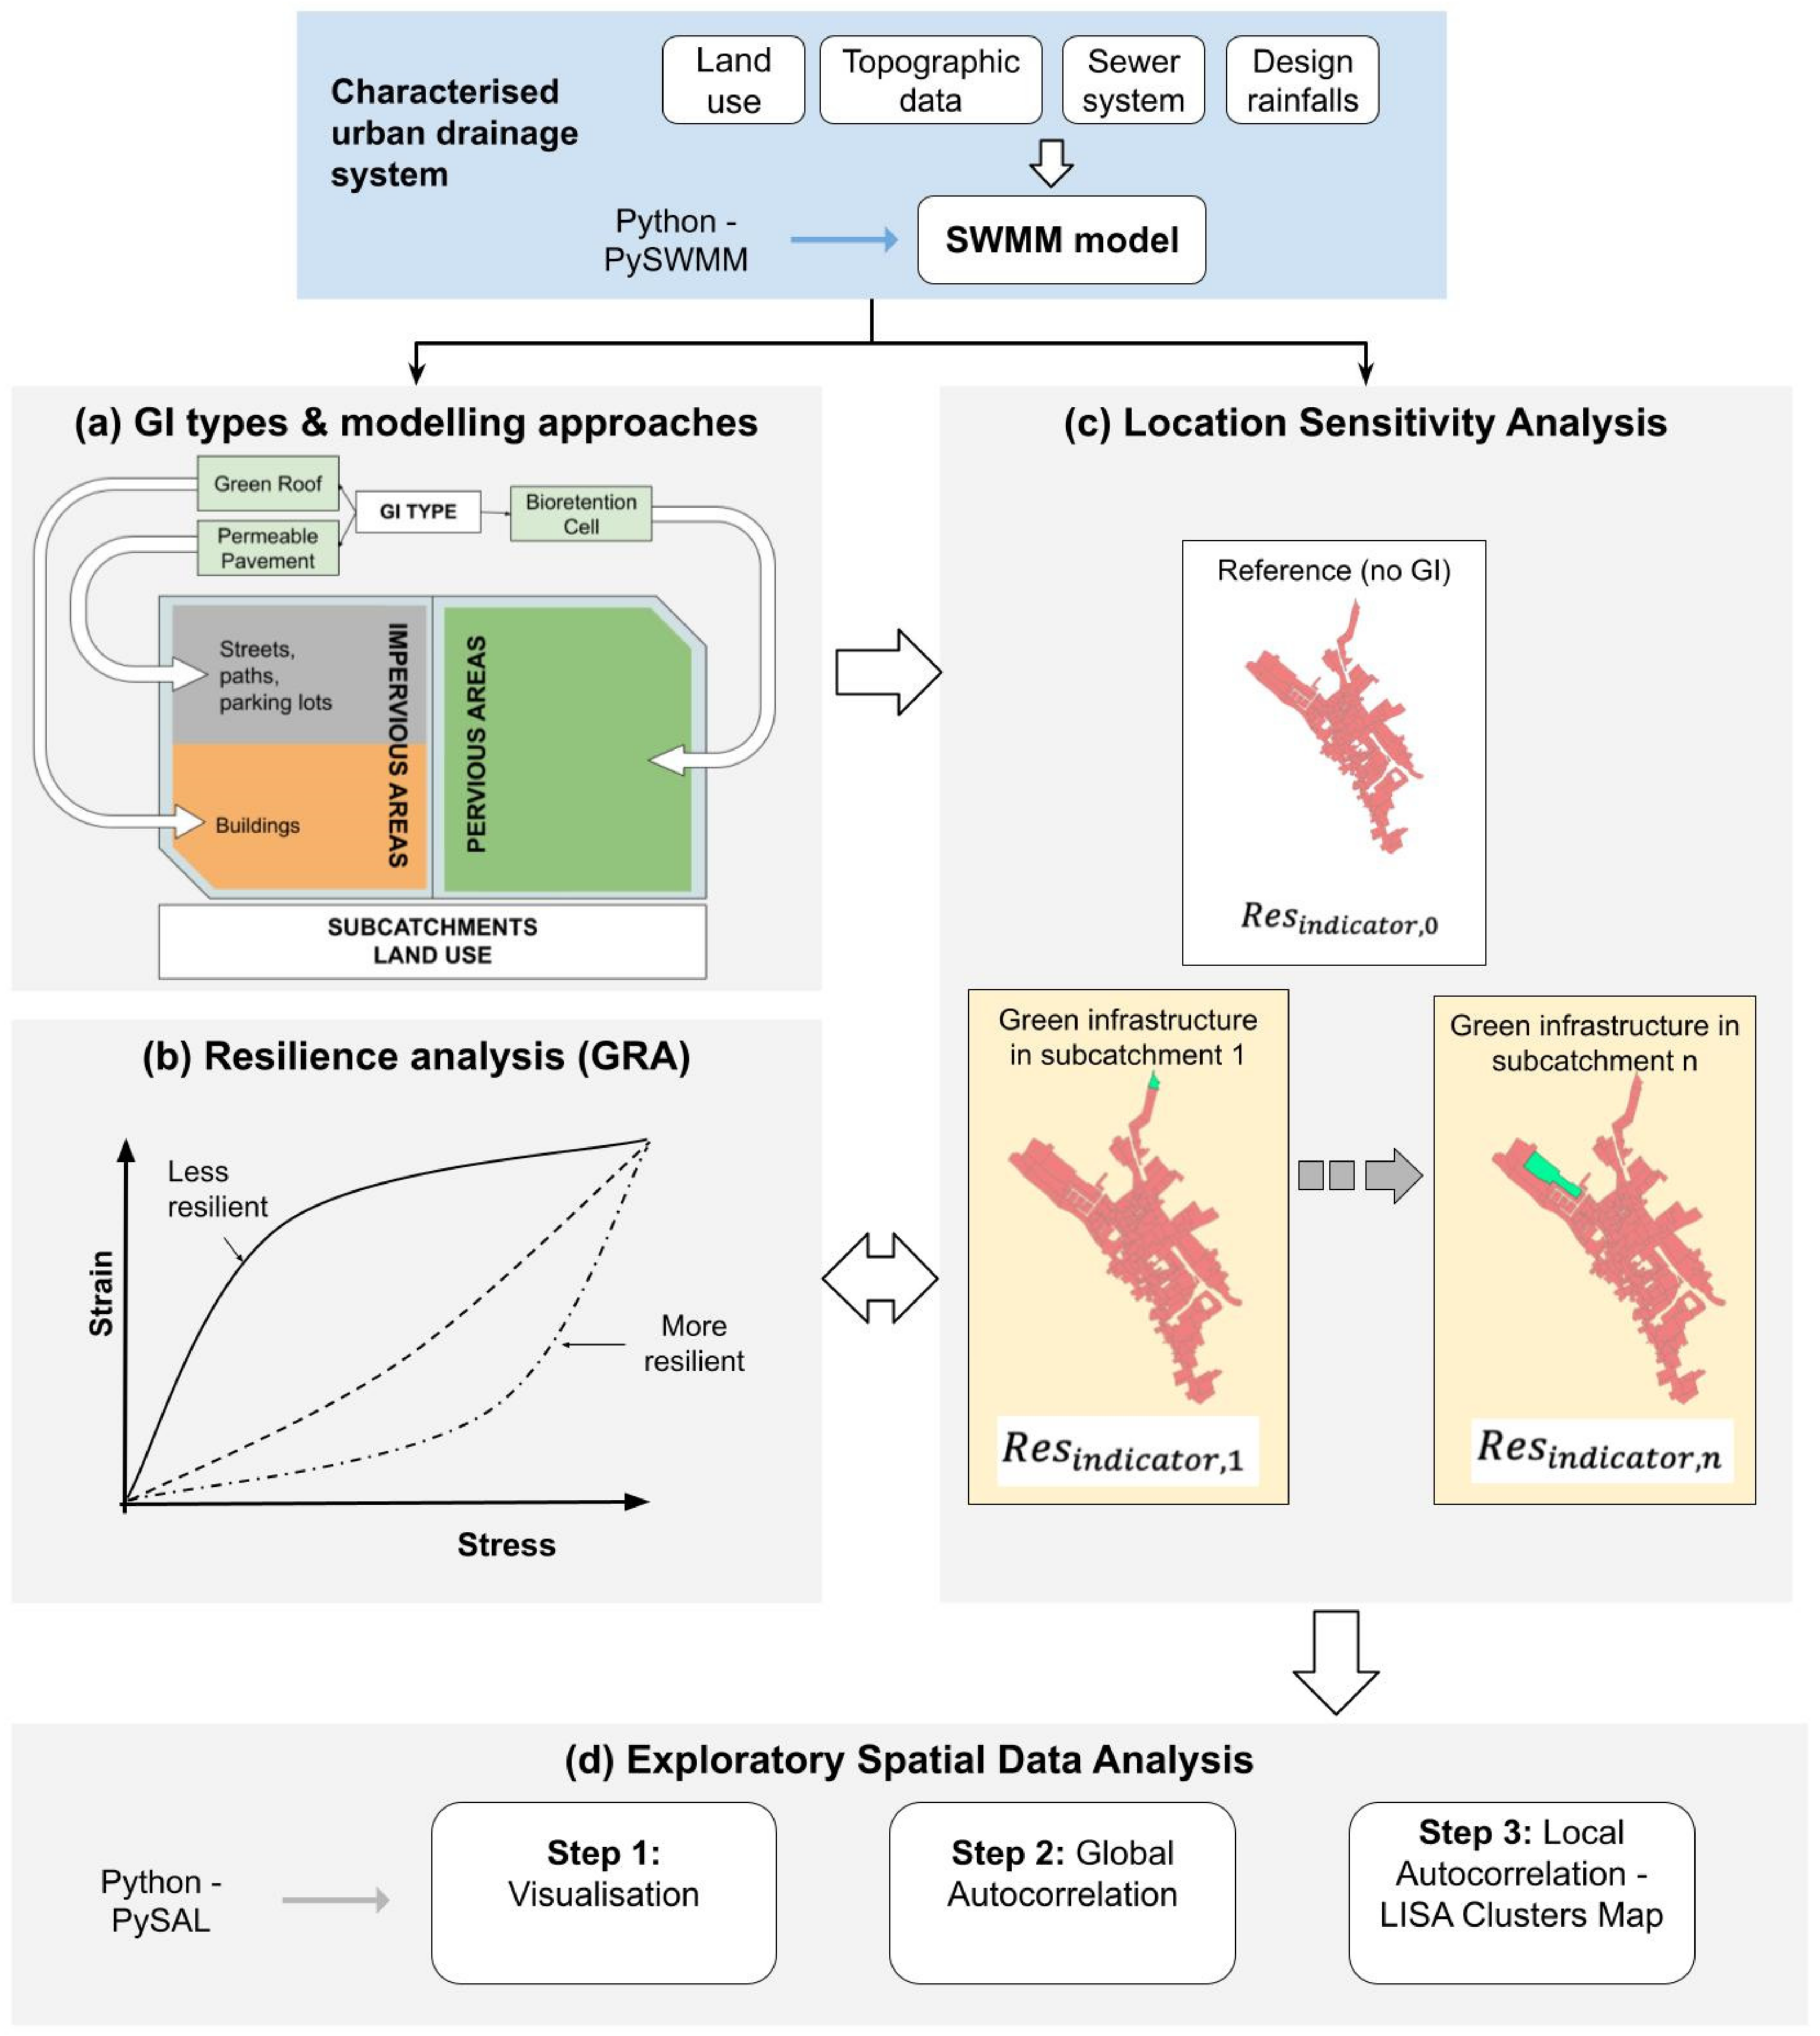
2.1. Overview
2.2. GI Types and Modelling Approaches
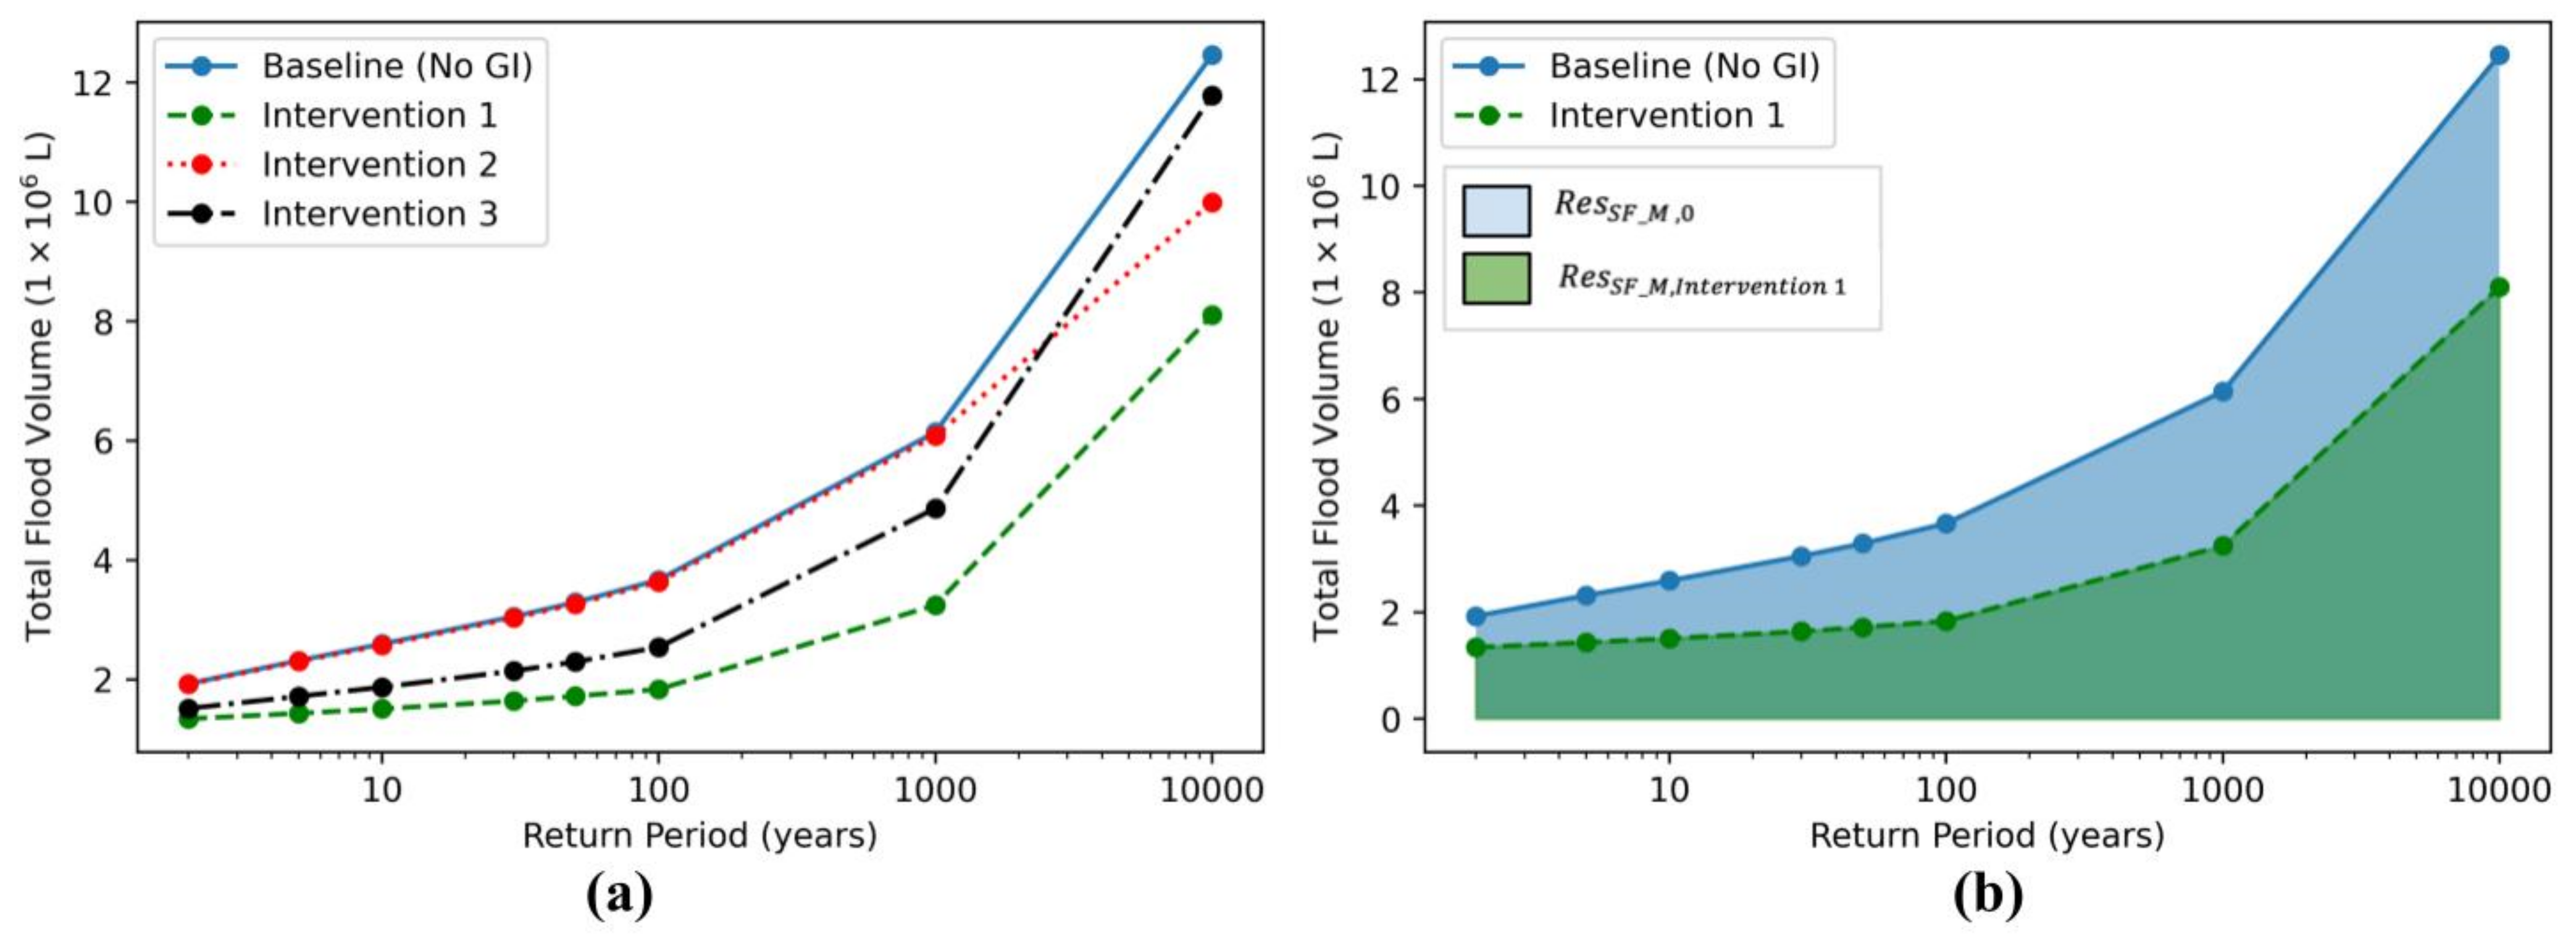
2.3. Resilience Assessment
2.4. Location Sensitivity Analysis
- The system with no design or operational changes is used as the reference for system performance. GRA is used to evaluate the baseline (or no-GI case) resilience for the different indicators, and it is referred to as .
- A single GI infrastructure with a consistent type is applied in each subcatchment at a time and simulated for resilience assessment. The GI size is determined by the maximum extent possible determined by the land use of the subcatchment.
- Assessment of resilience using GRA considering the different metrics. The impact of different GI types and their location in the system is reflected by a change in the response curve shape.
- The net change in the system’s resilience due to the placement of a GI in a subcatchment is calculated using Equation (1).
2.5. Exploratory Spatial Data Analysis
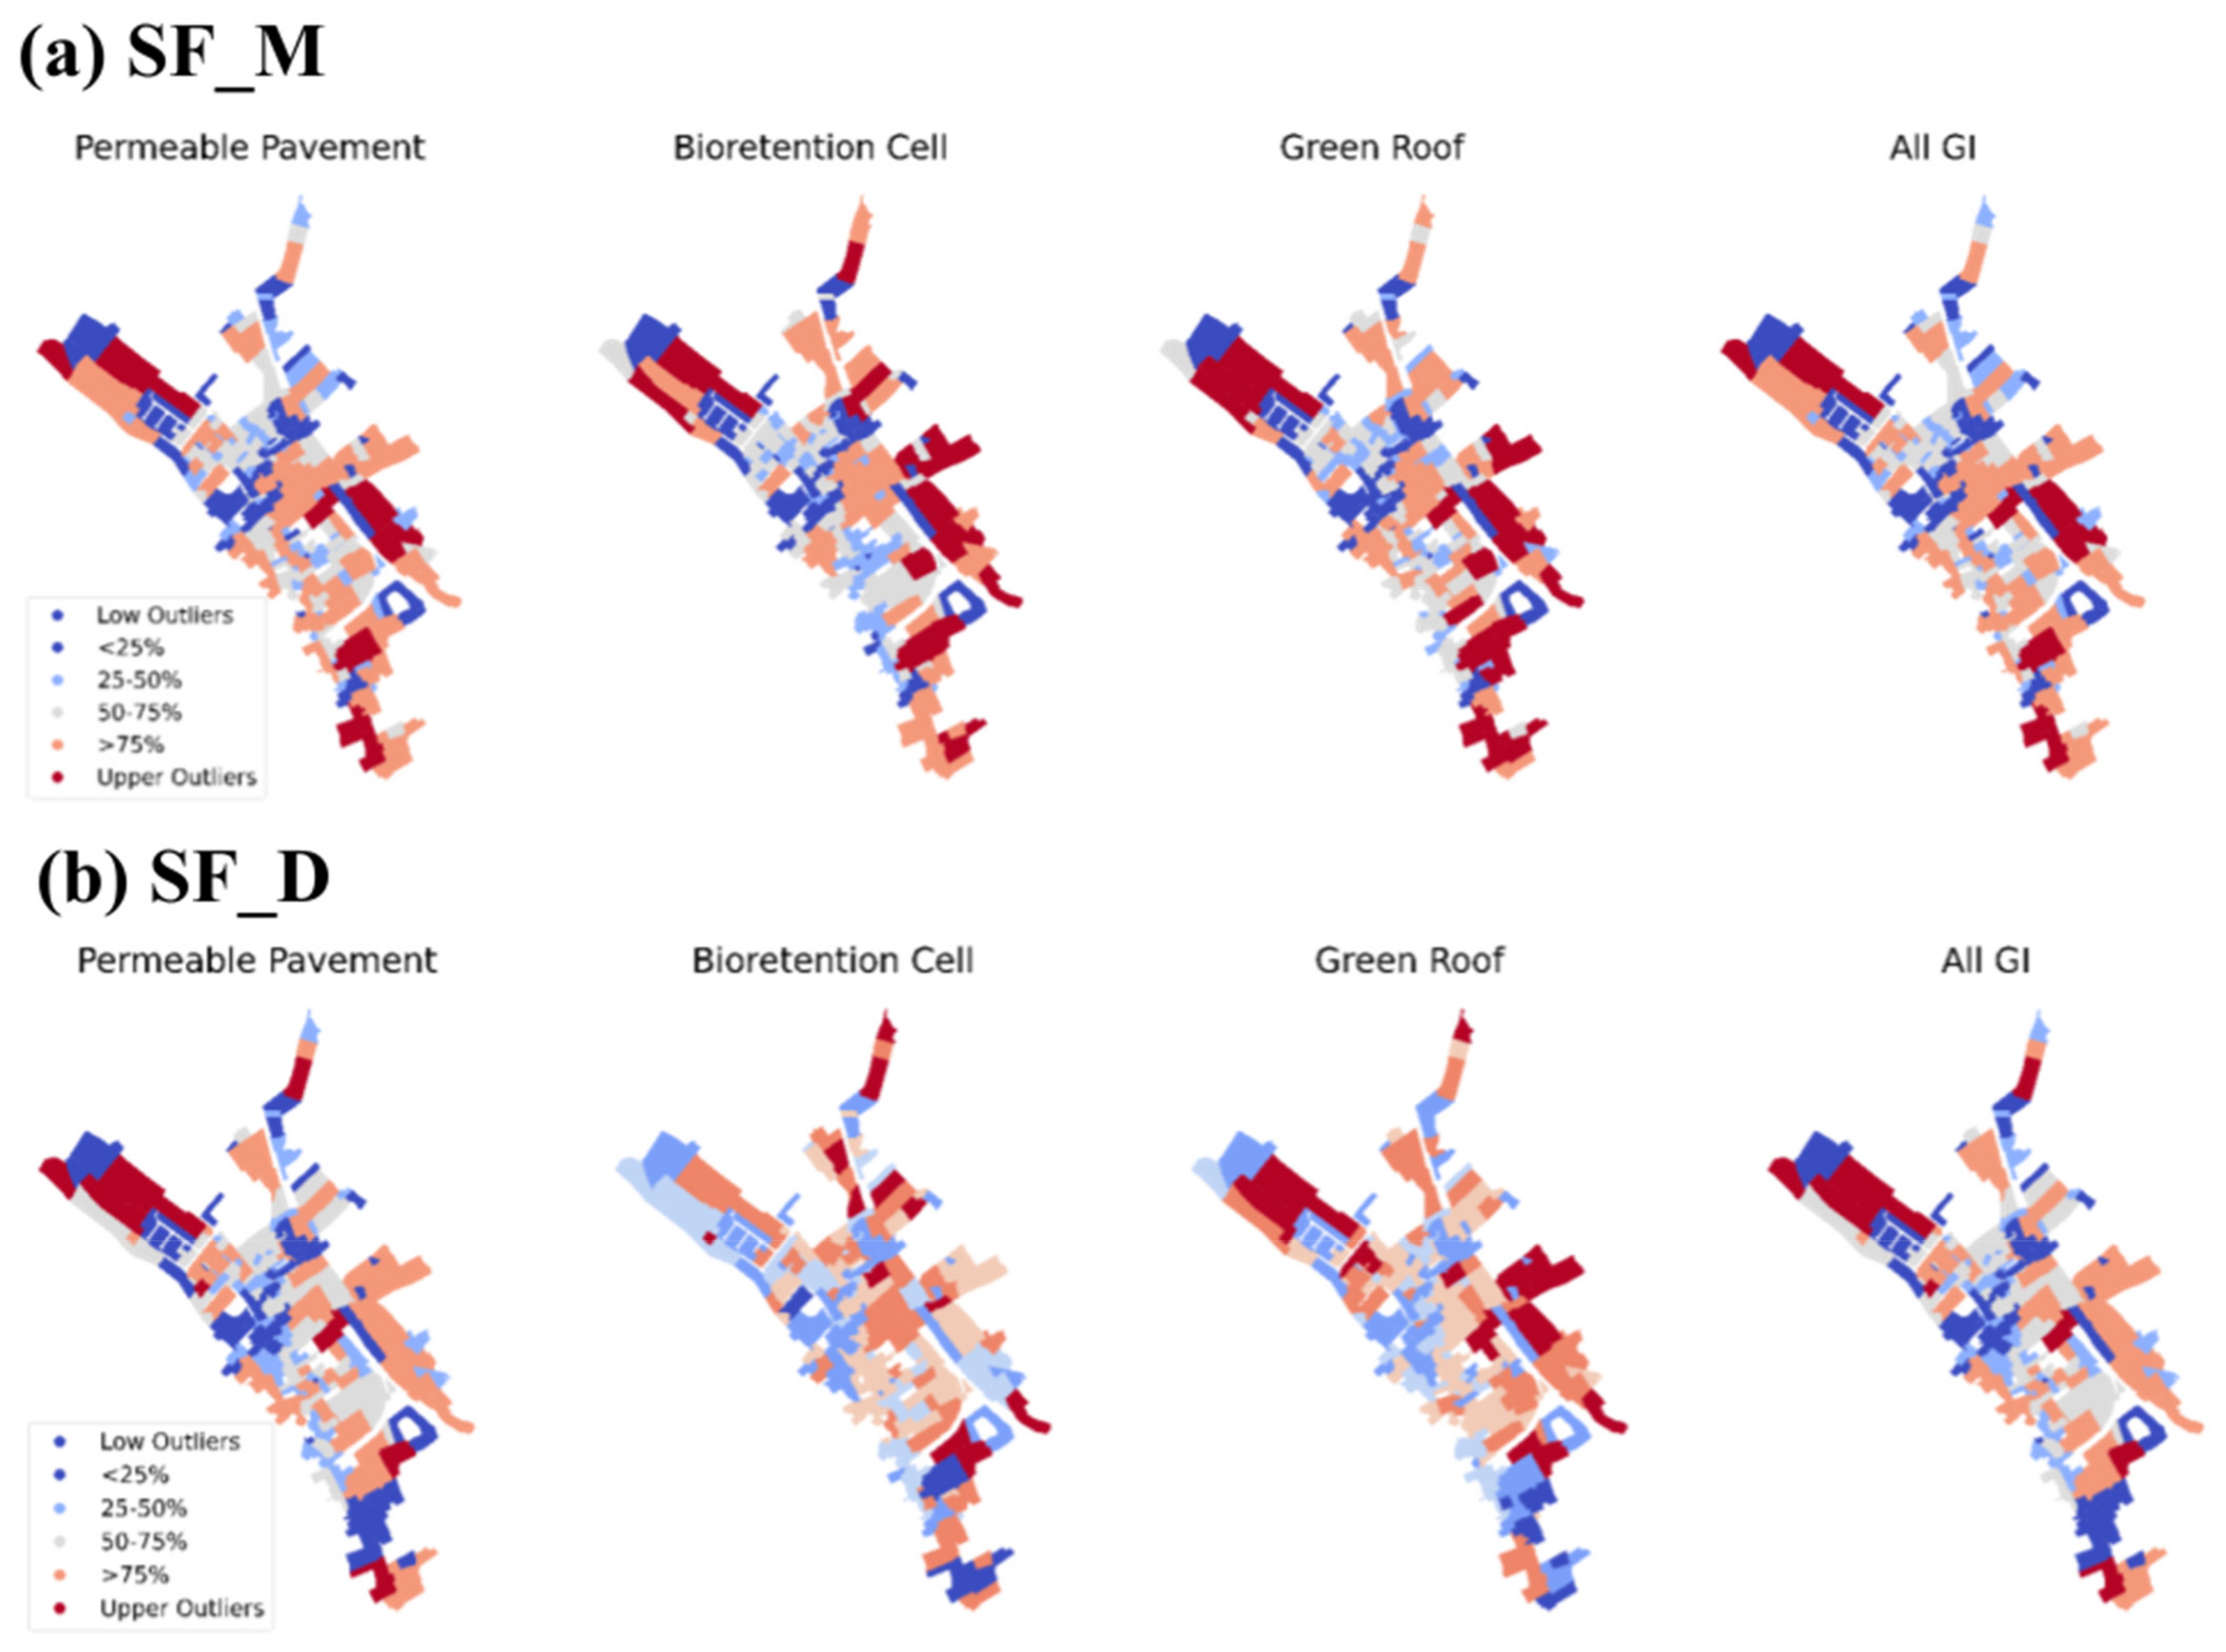
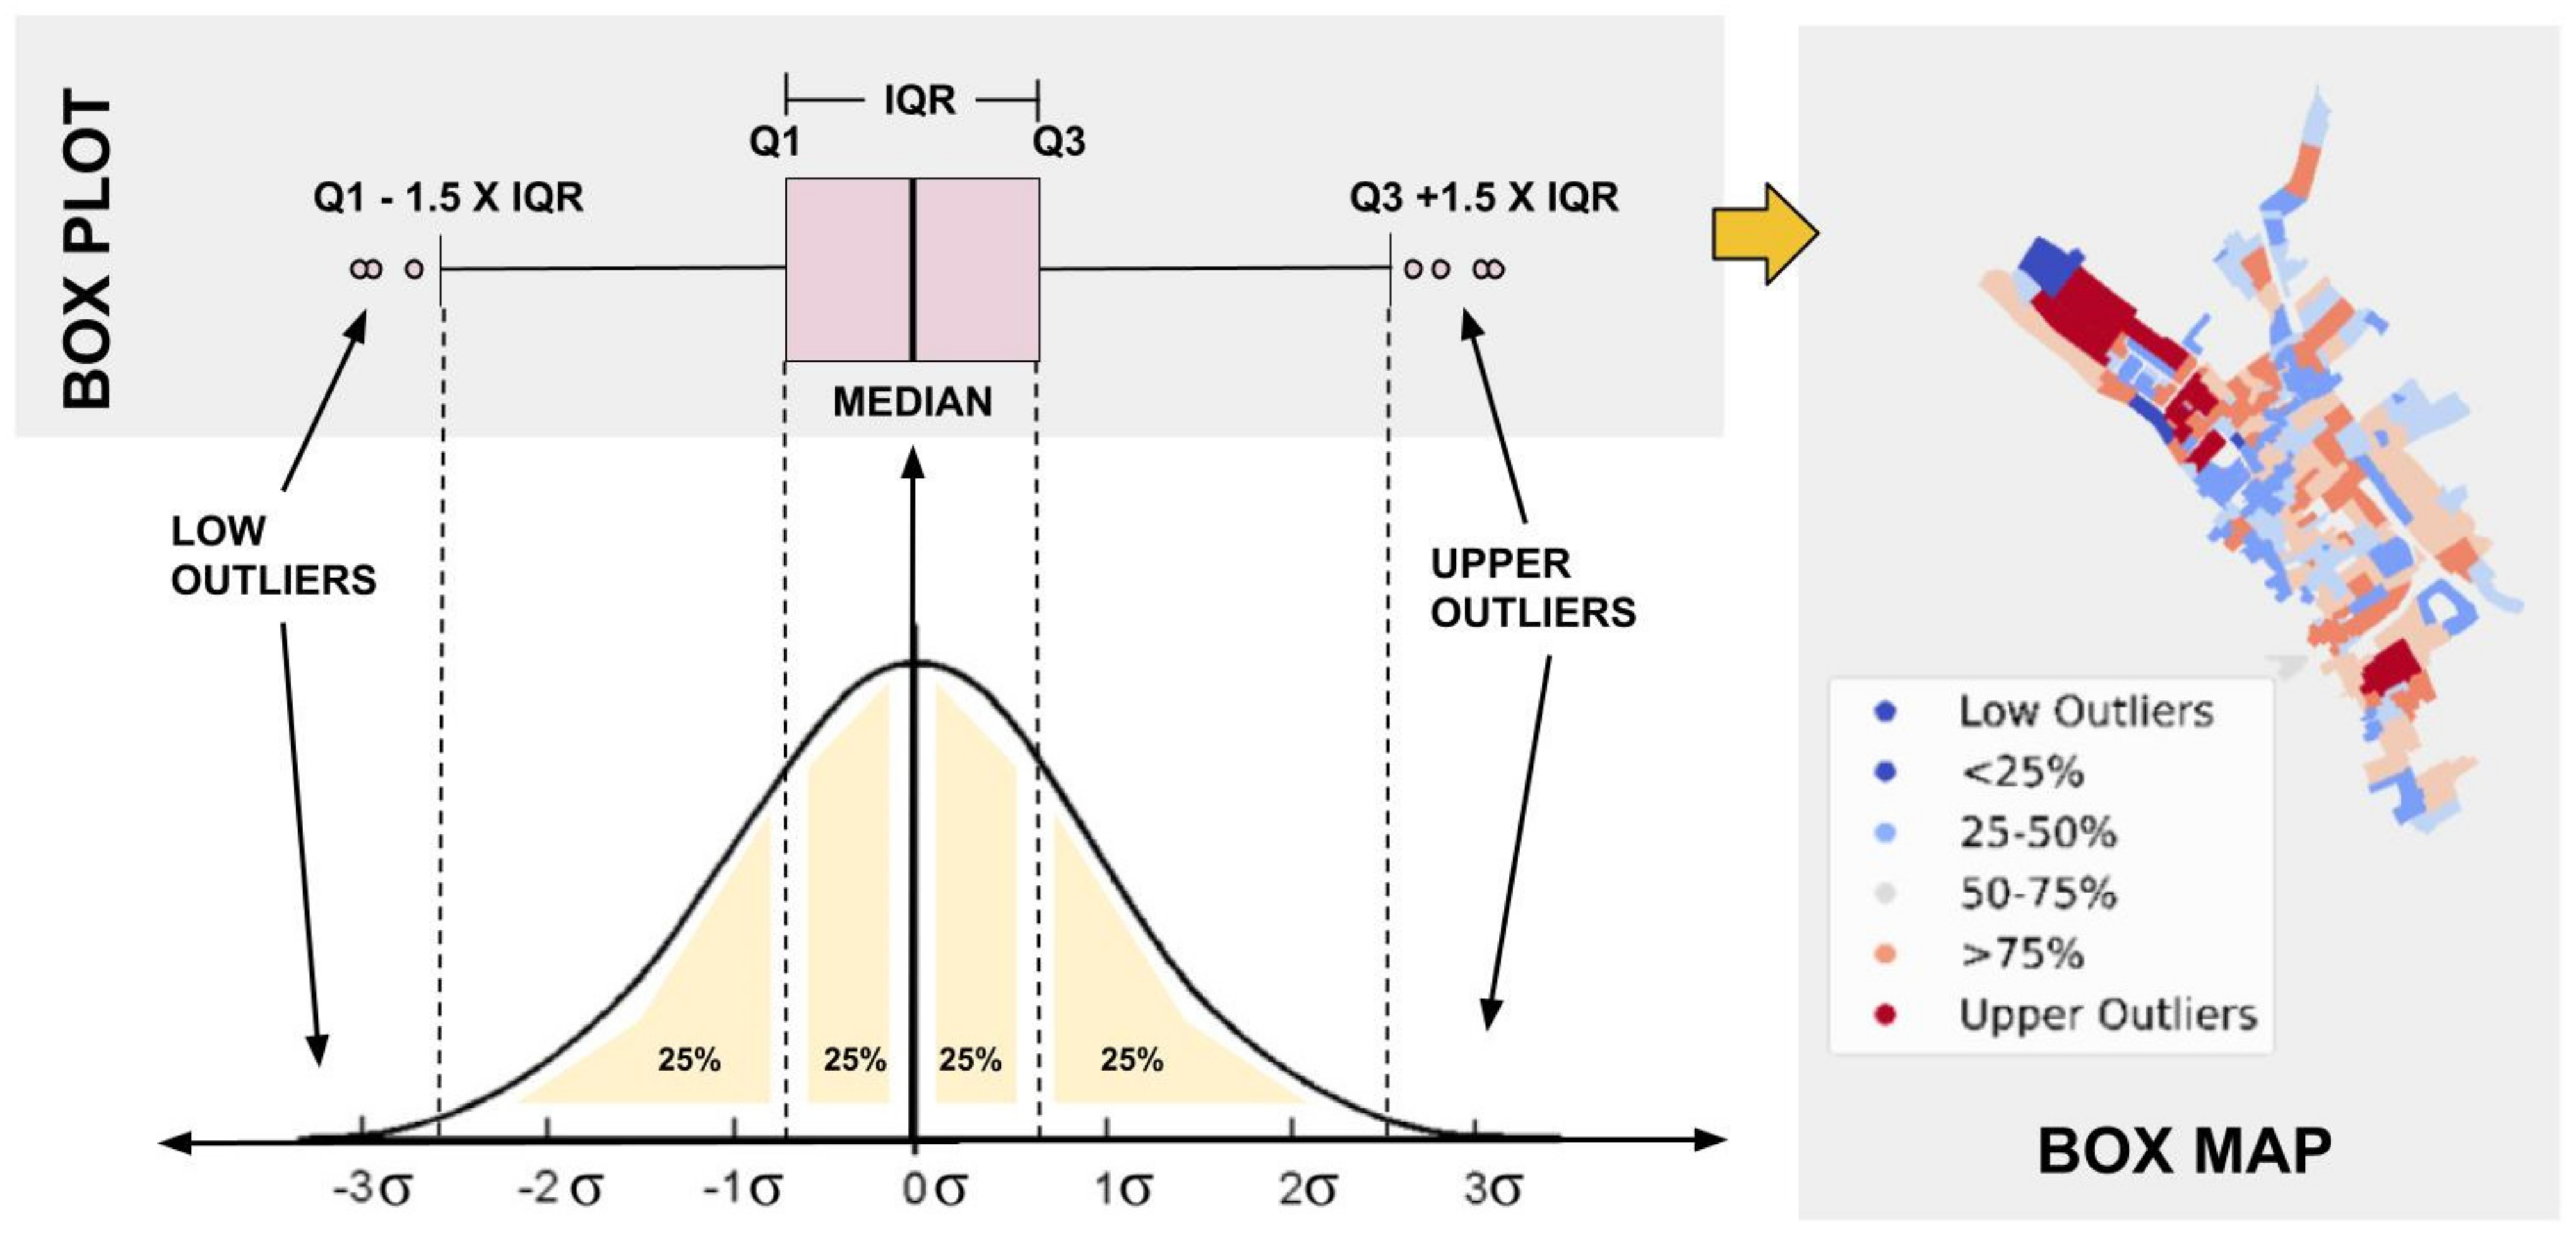
2.5.1. Visualisation
2.5.2. Global Spatial Autocorrelation
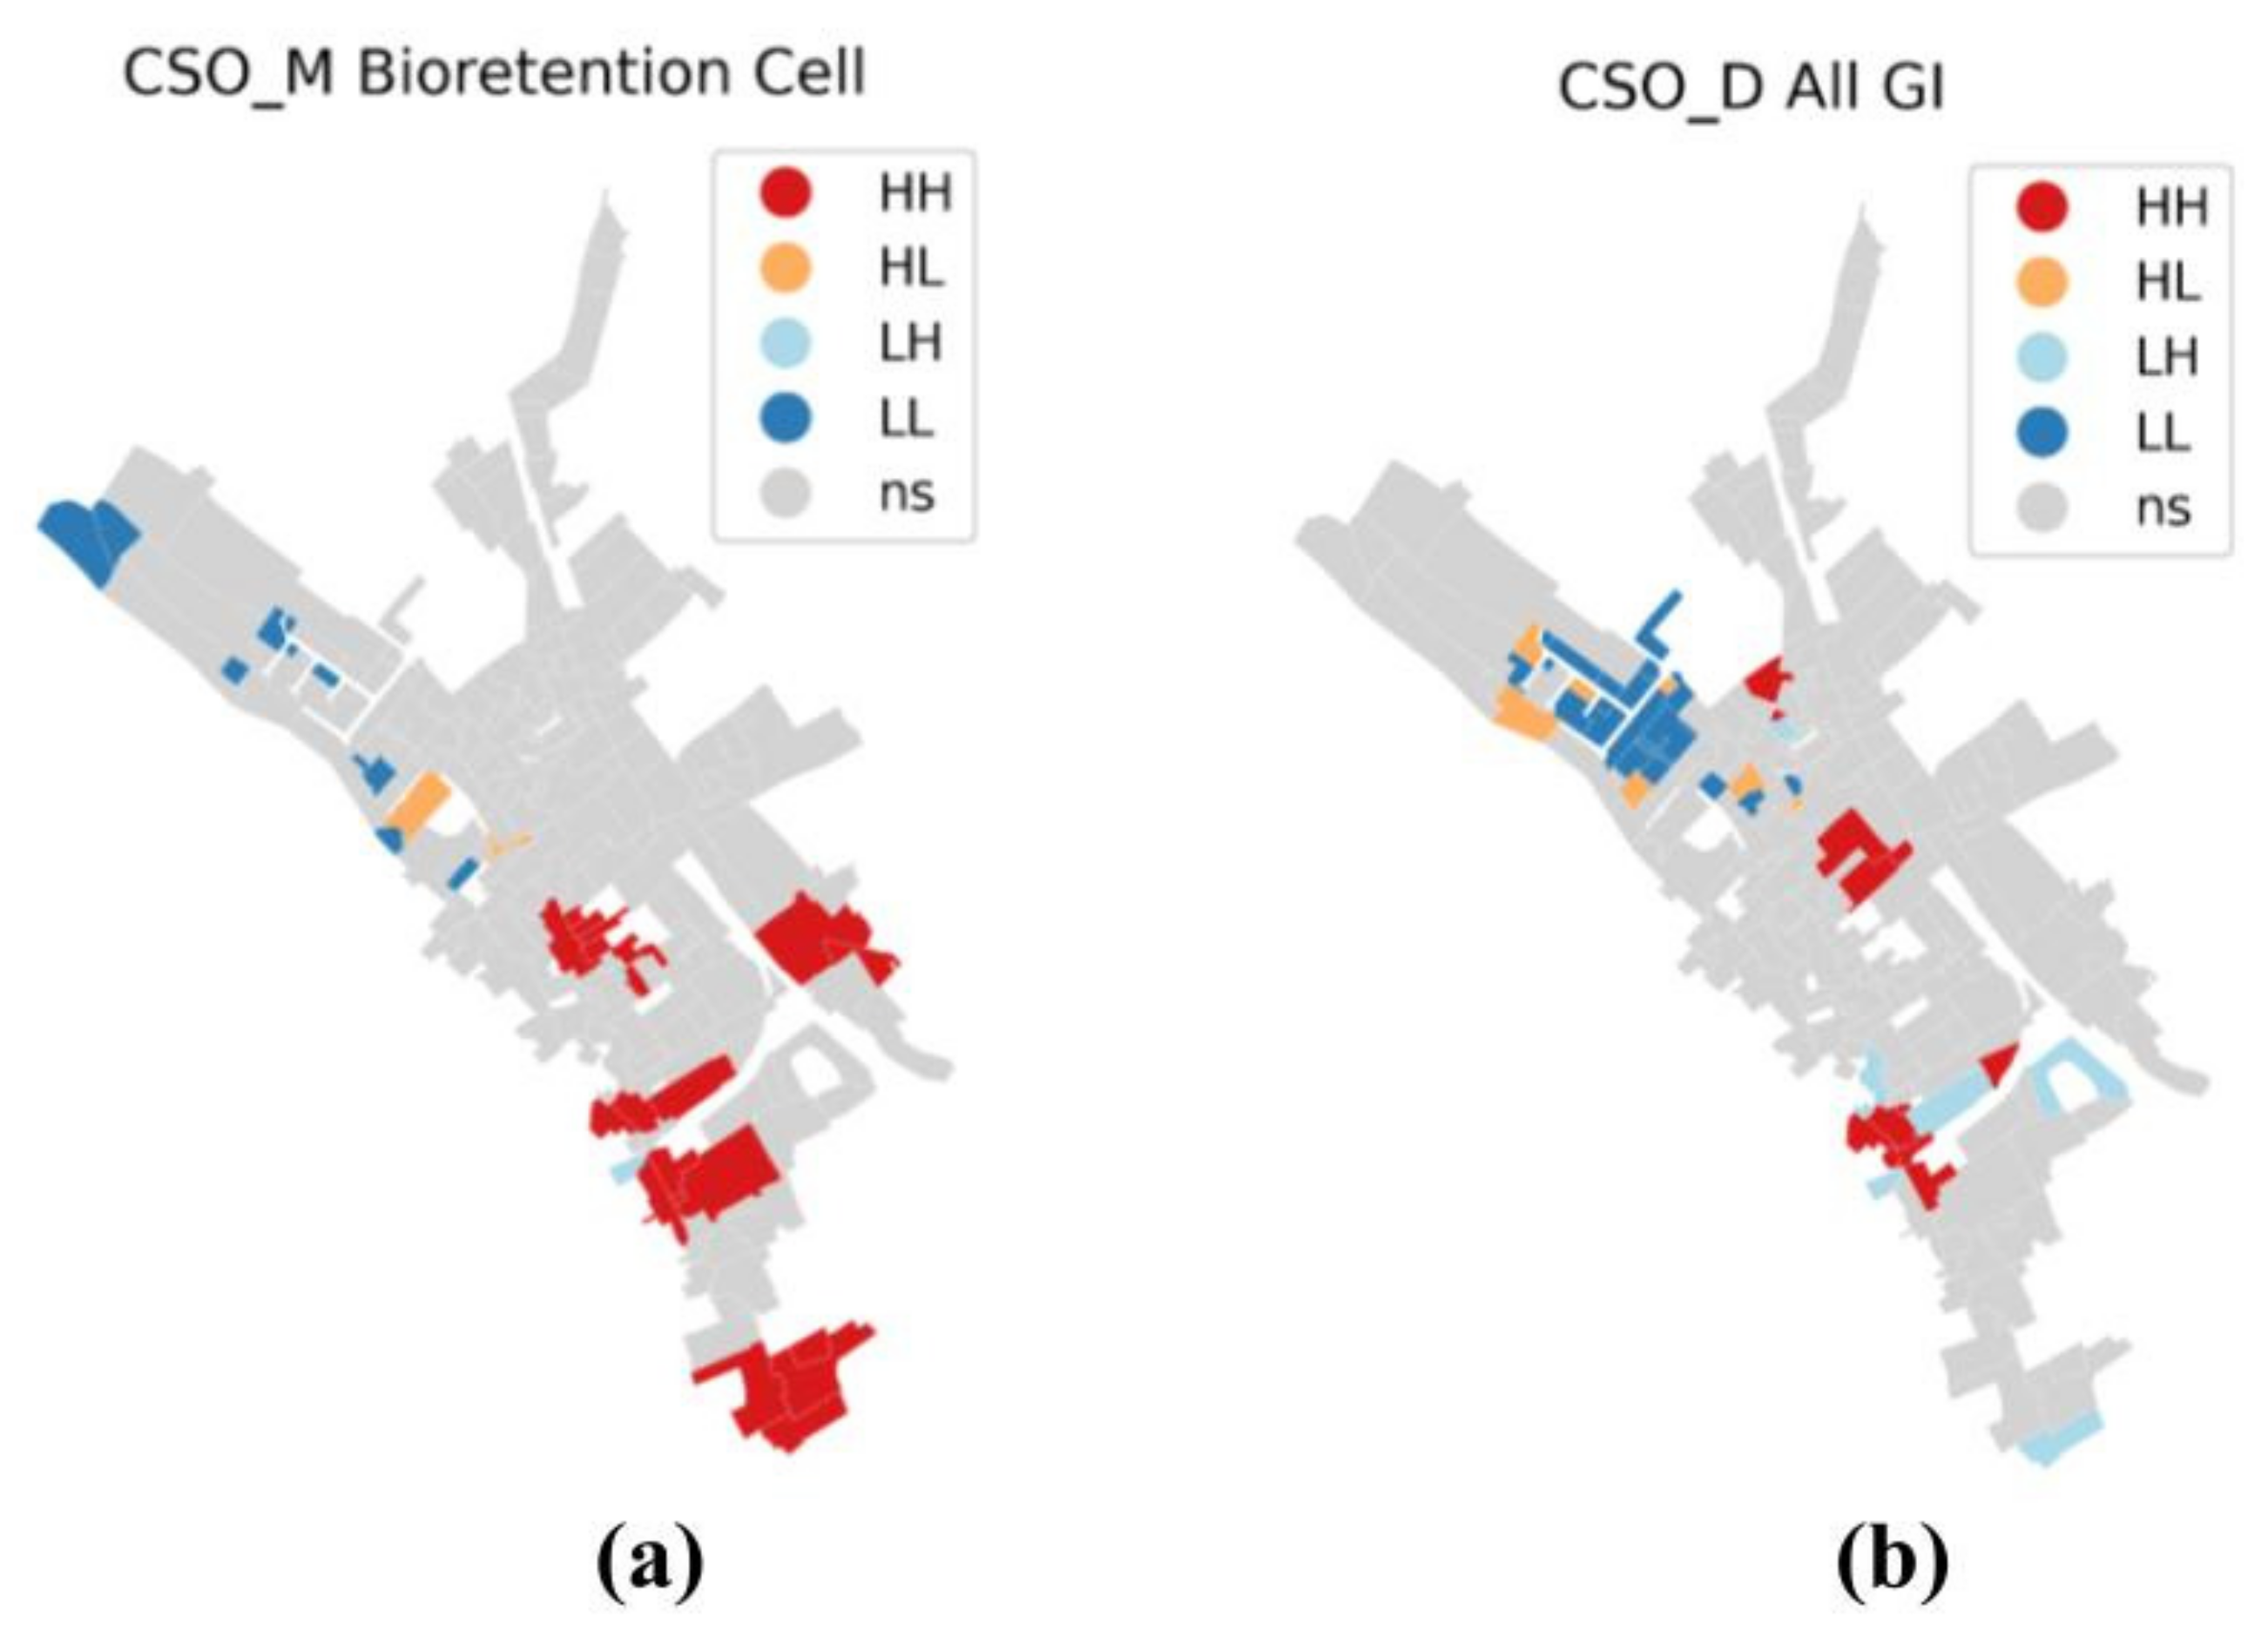
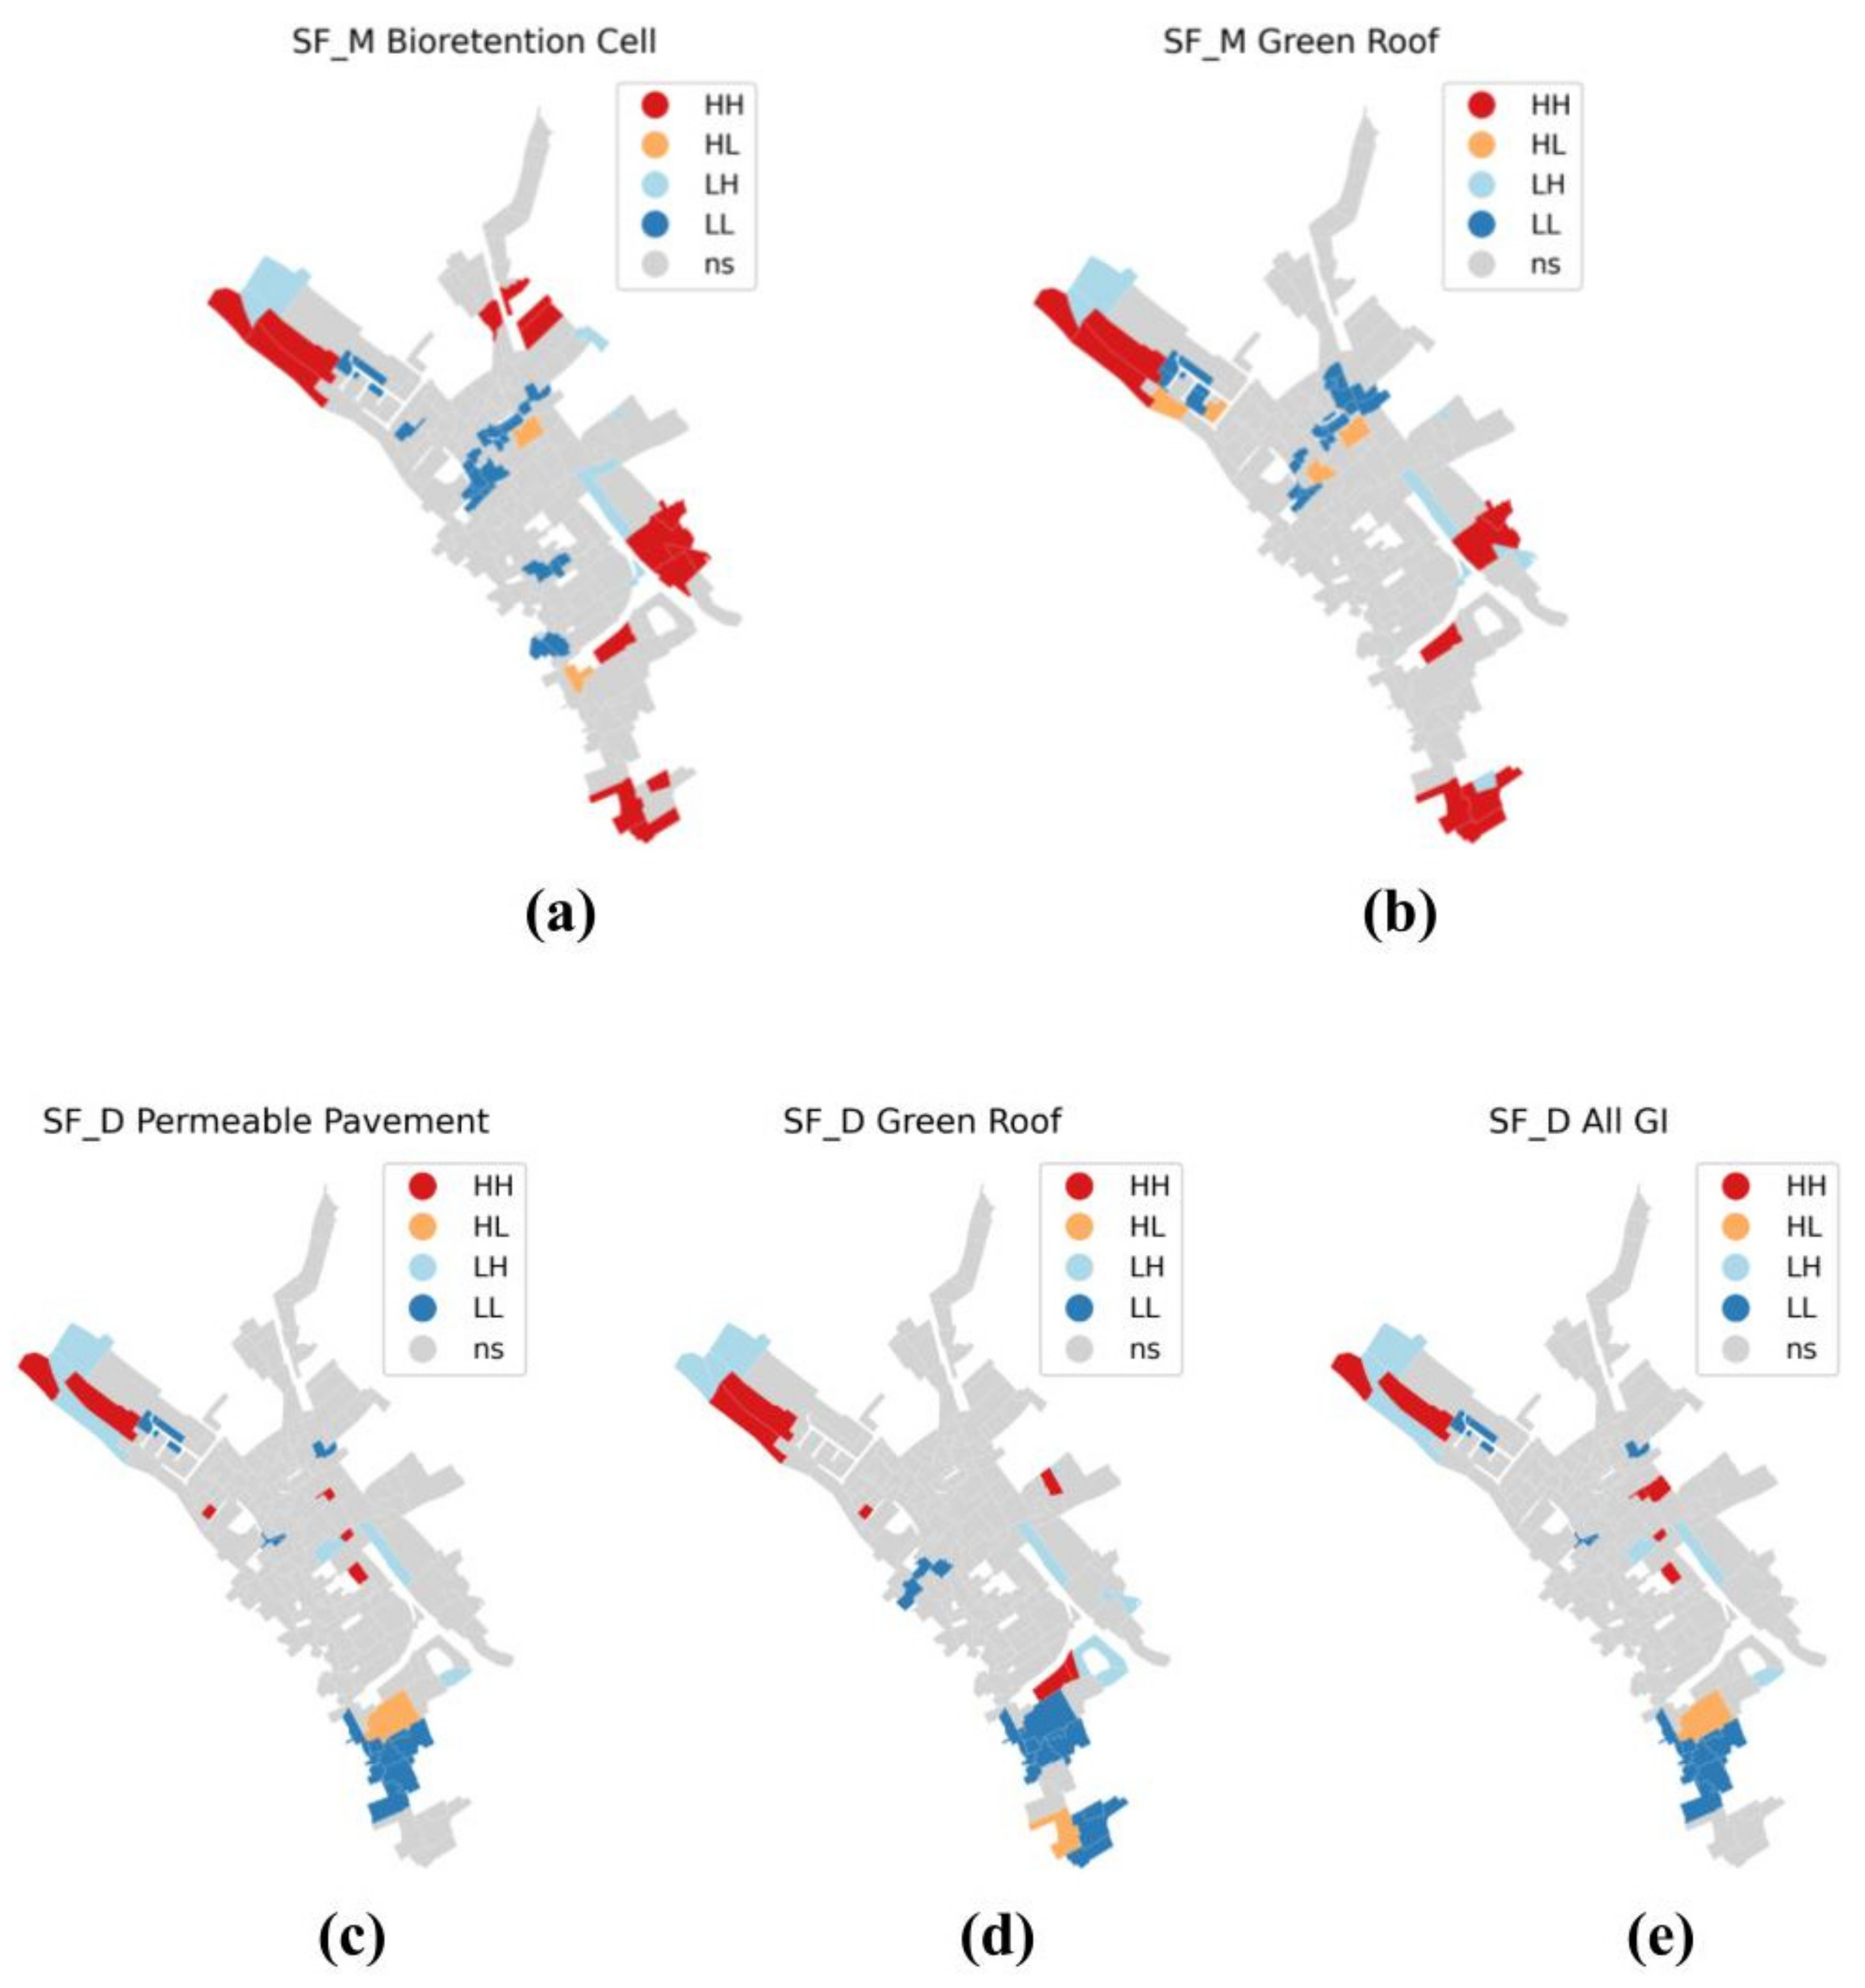
2.5.3. Local Spatial Autocorrelation
- High-high (HH): a high value of net change in resilience in a subcatchment, neighbouring subcatchments have high values of net change in resilience.
- Low-high (LH): a low value of net change in resilience in a subcatchment, neighbouring subcatchments have high values of net change in resilience.
- Low-low (LL): a low value of net change in resilience in a subcatchment, neighbouring subcatchments have low values of net change in resilience.
- High-low (HL): a high value of net change in resilience, neighbouring subcatchments have low values of net change in resilience.
2.5.4. Spatial Weights Matrix
- Queen contiguity: which reflects adjacency relationships as a binary indicator variable denoting whether a subcatchment shares an edge or a vertex with another polygon.
- Rook contiguity: which considers the subcatchment neighbours only when they are sharing an adjacent edge.
- K-nearest neighbours matrices (k = 4, 5, 6): the distances between a given subcatchment and the rest of the set are ranked, and the neighbours are defined as the k closest ones in the ranking [40].
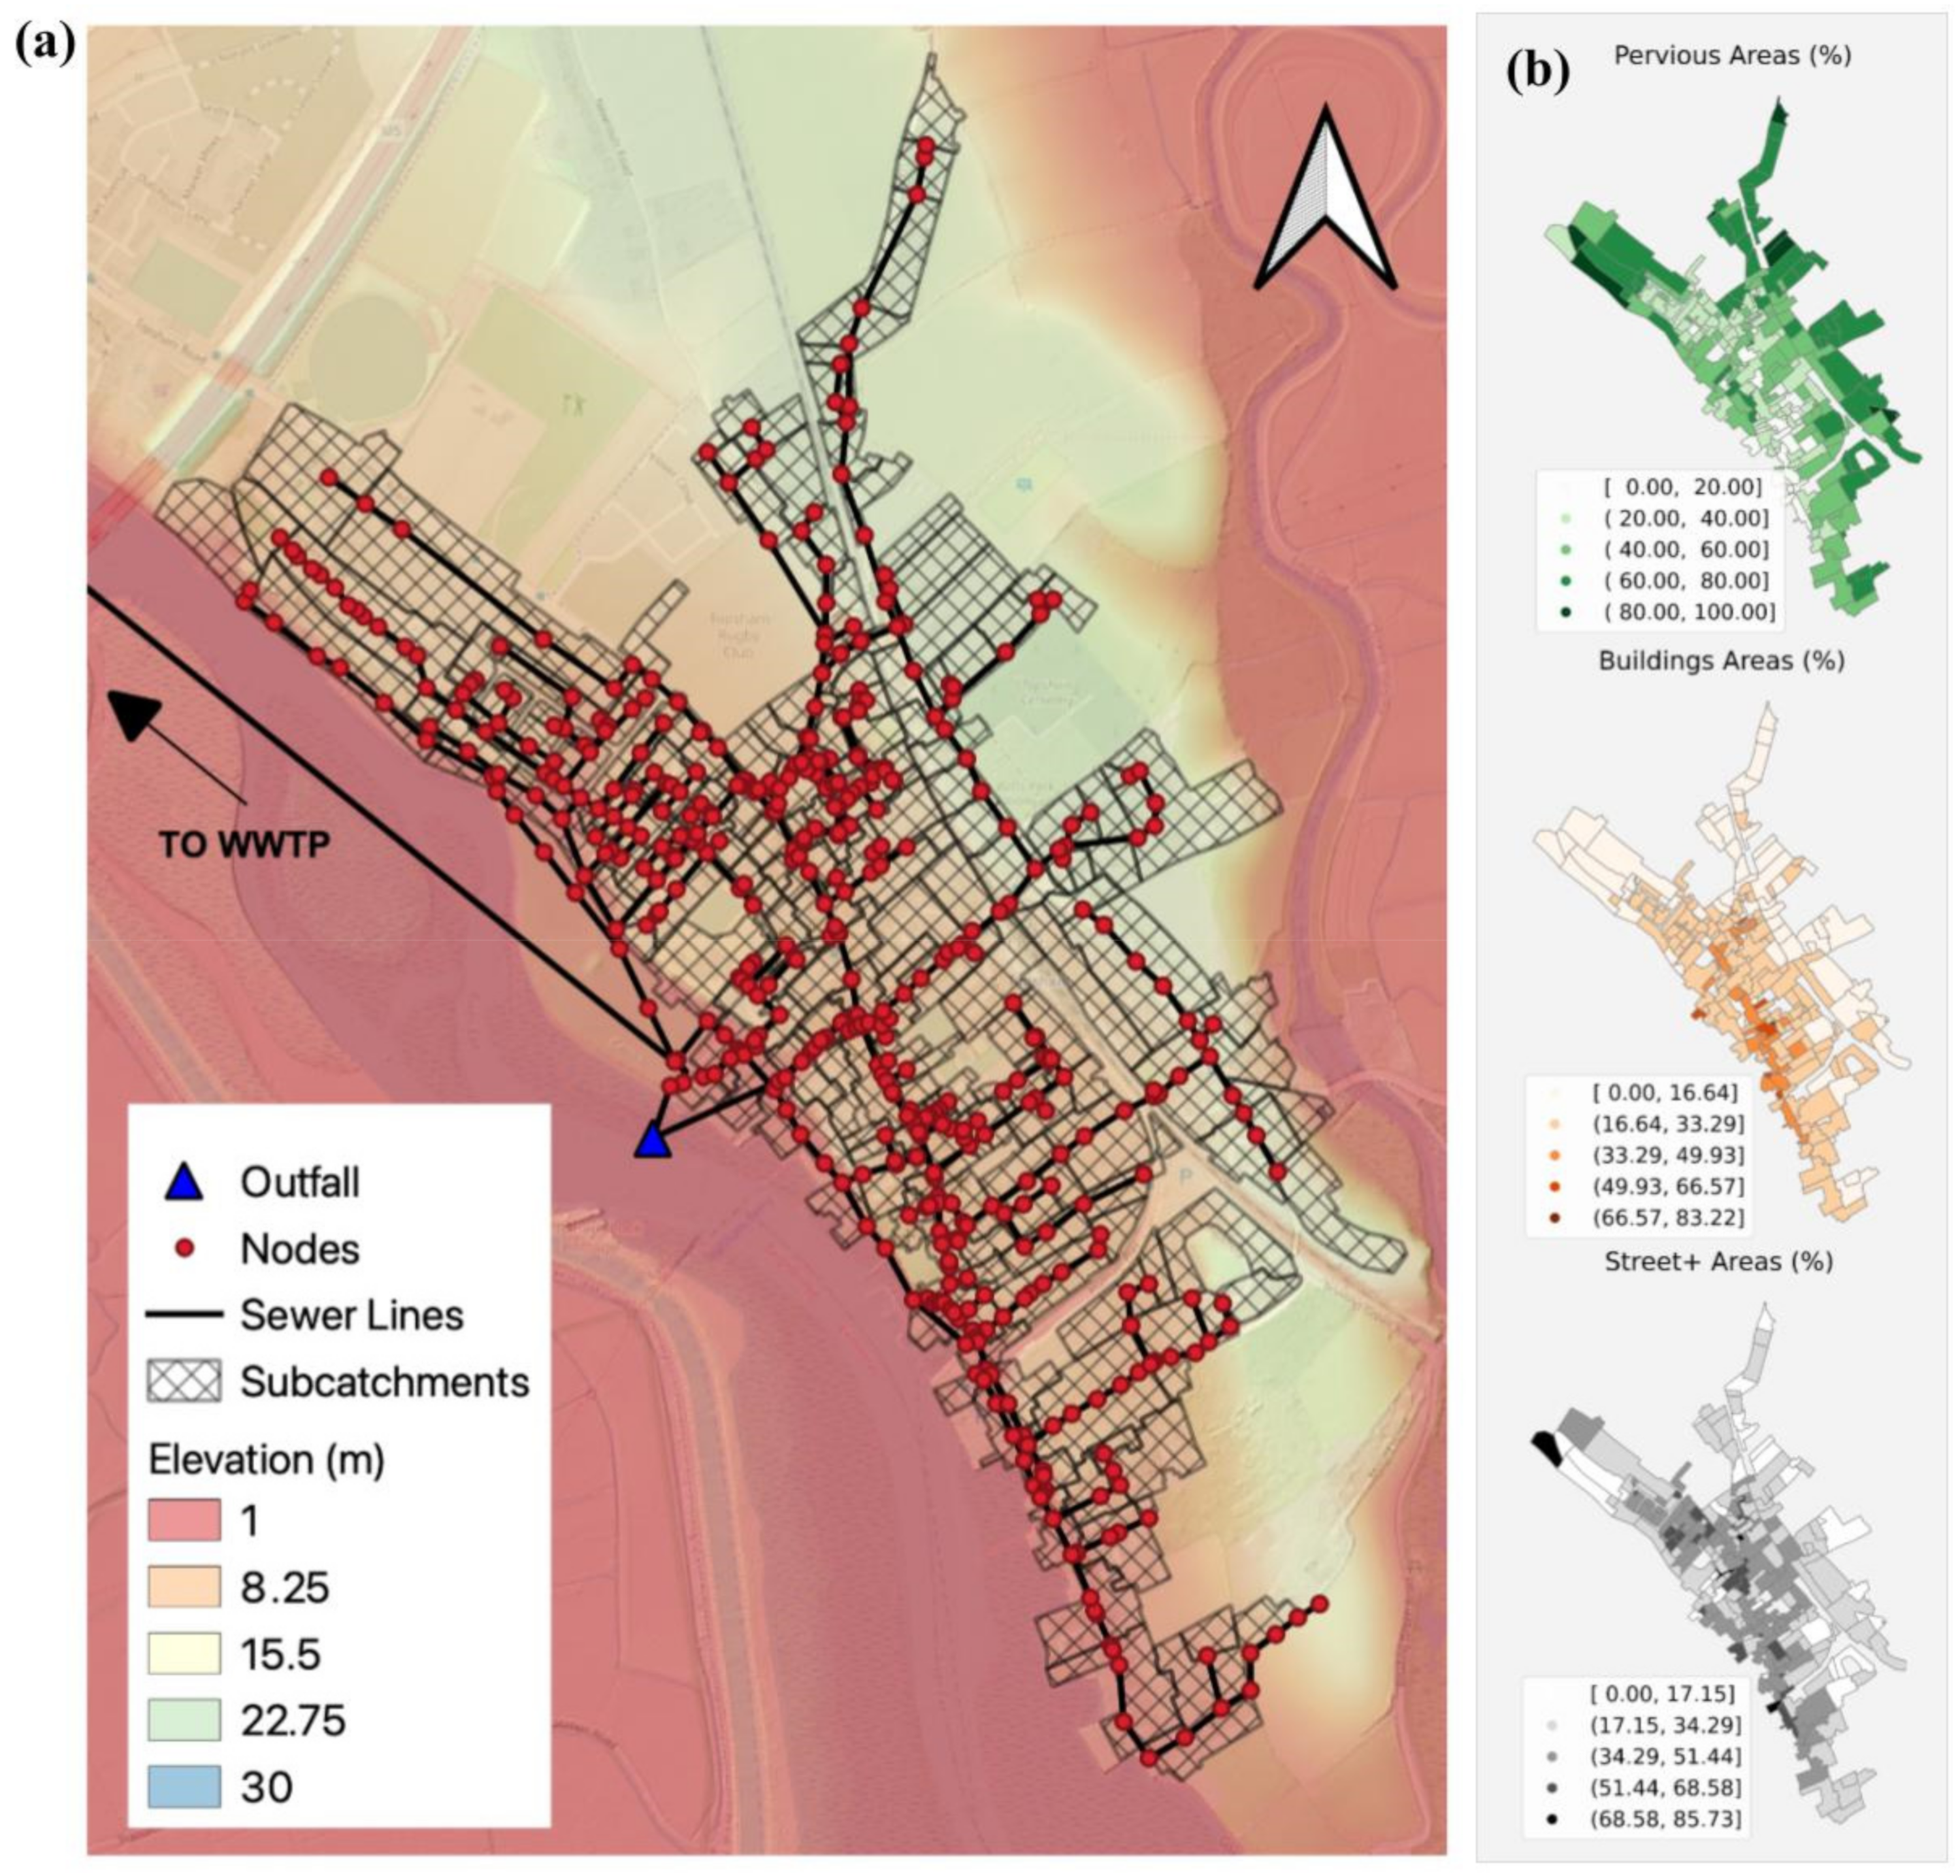
2.6. Case Study
3. Results
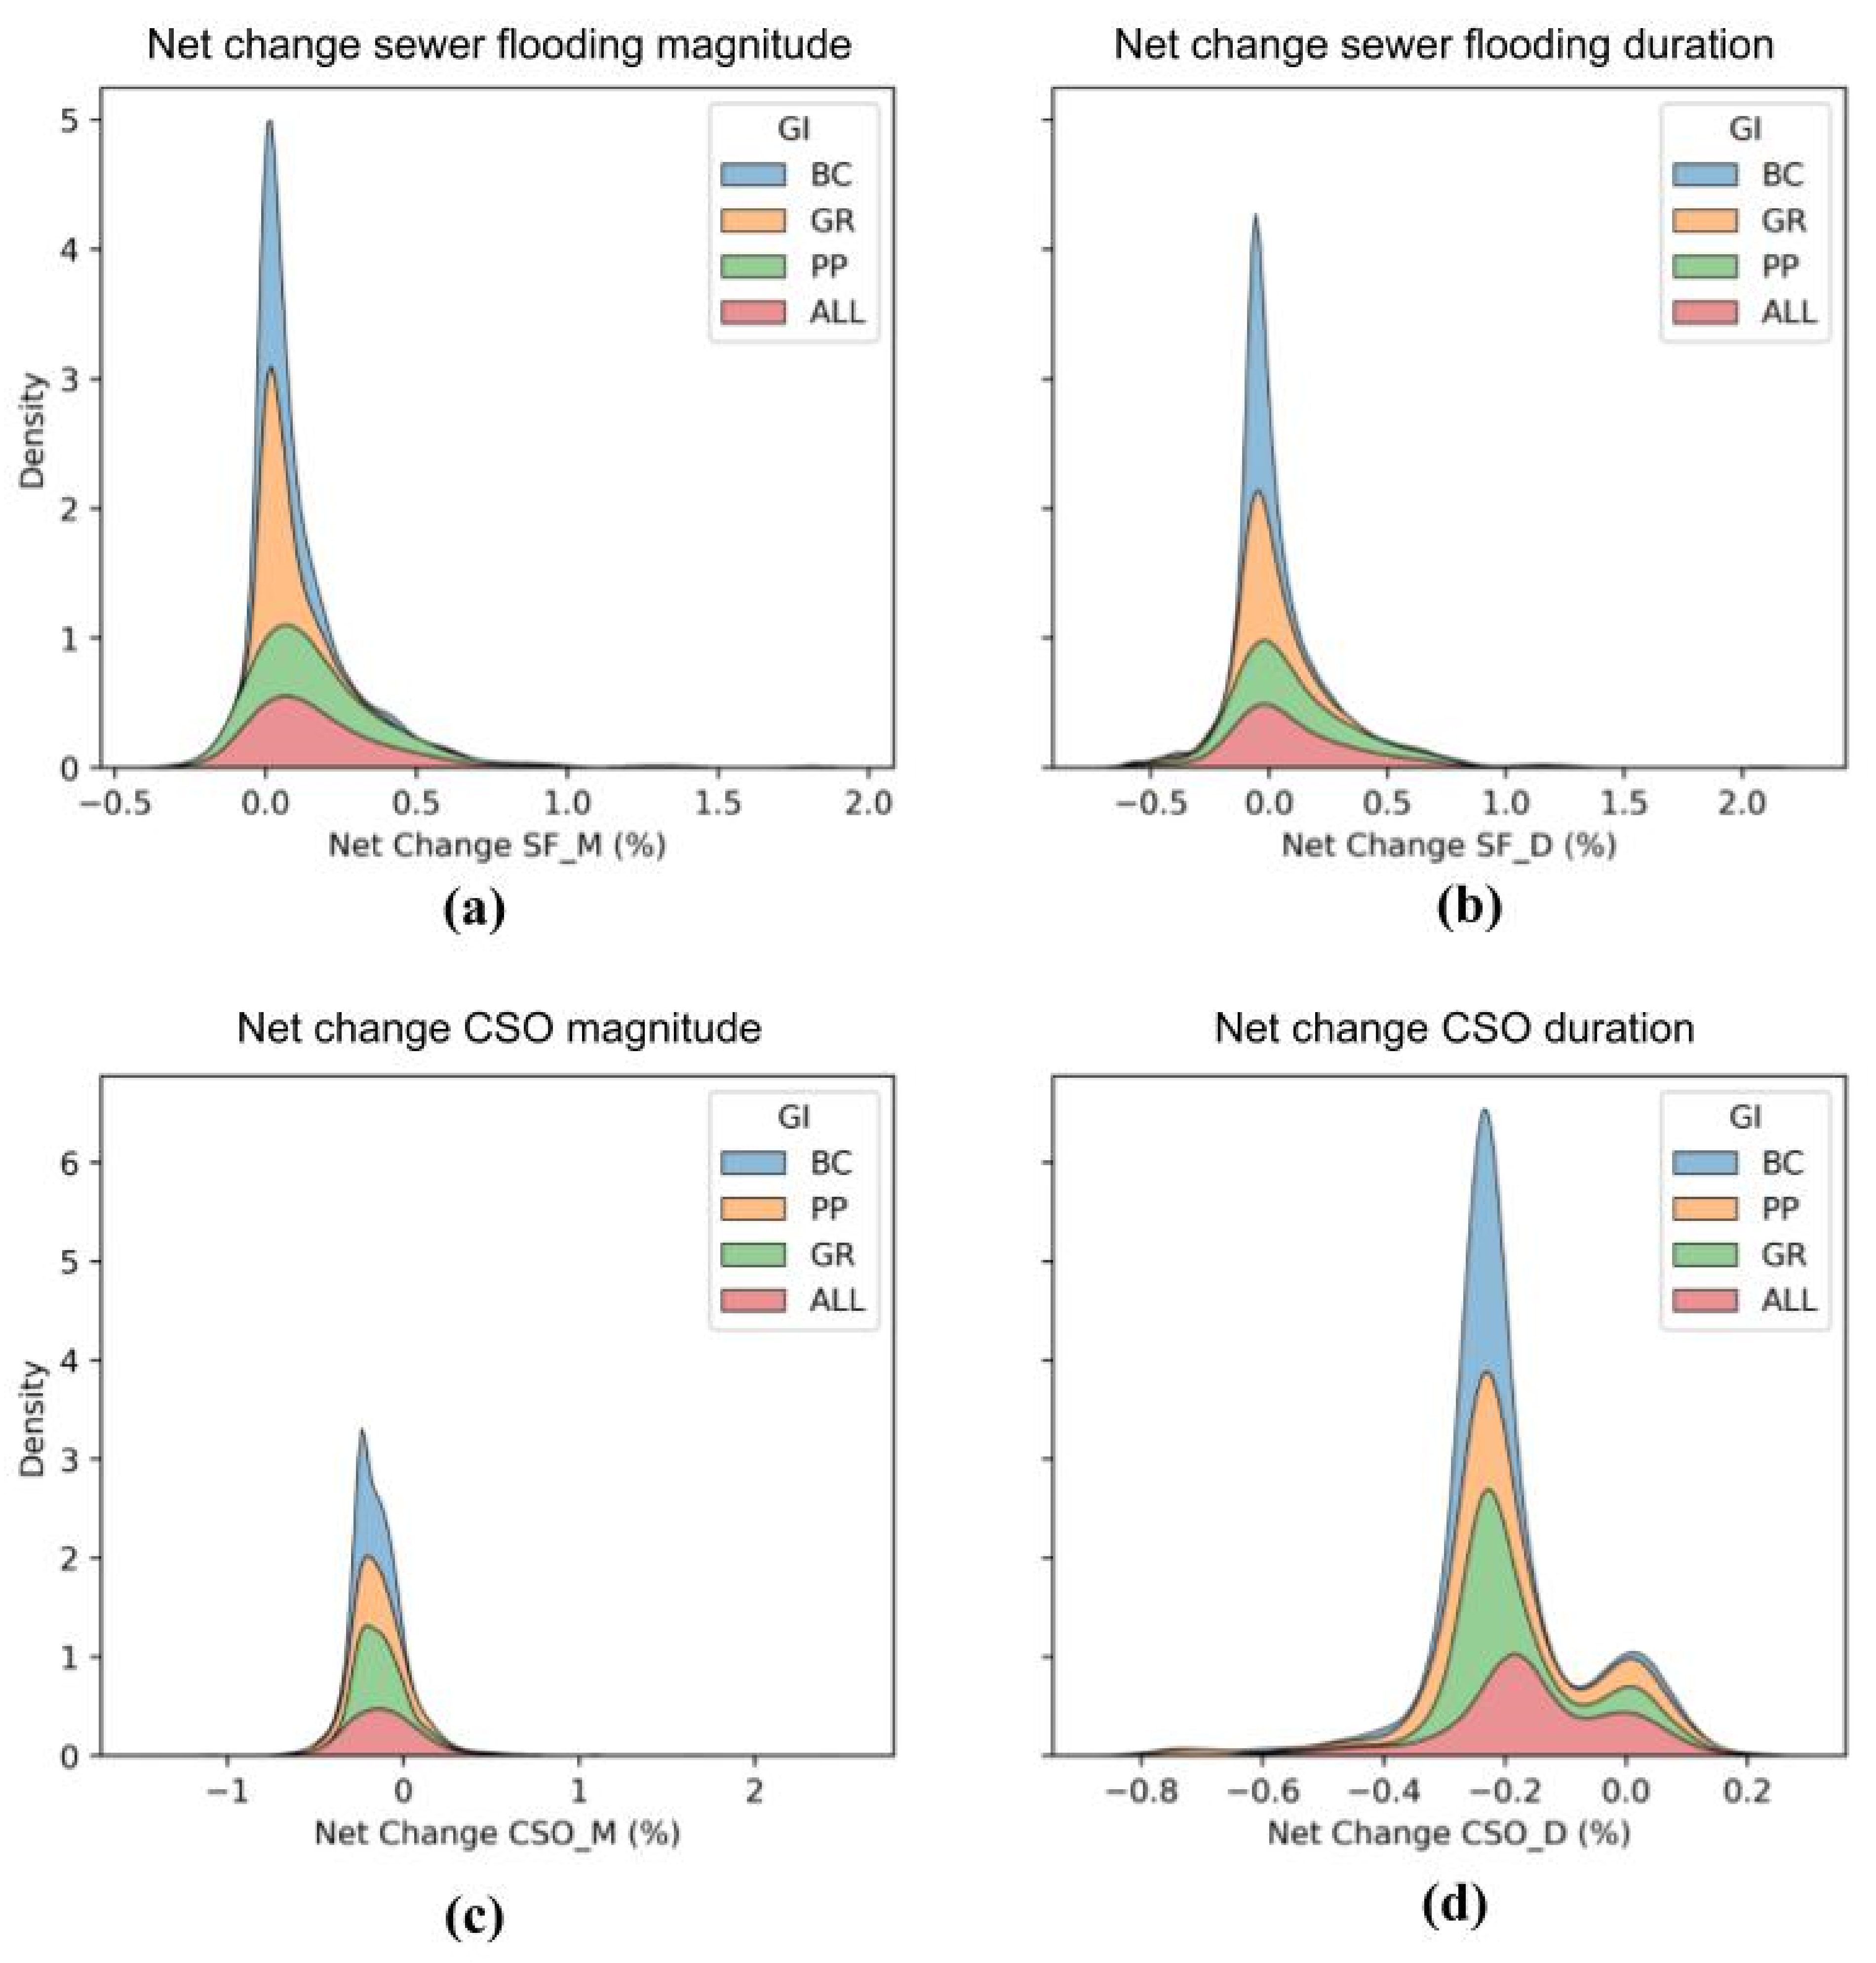
3.1. Visualisation
3.2. Global Spatial Autocorrelation
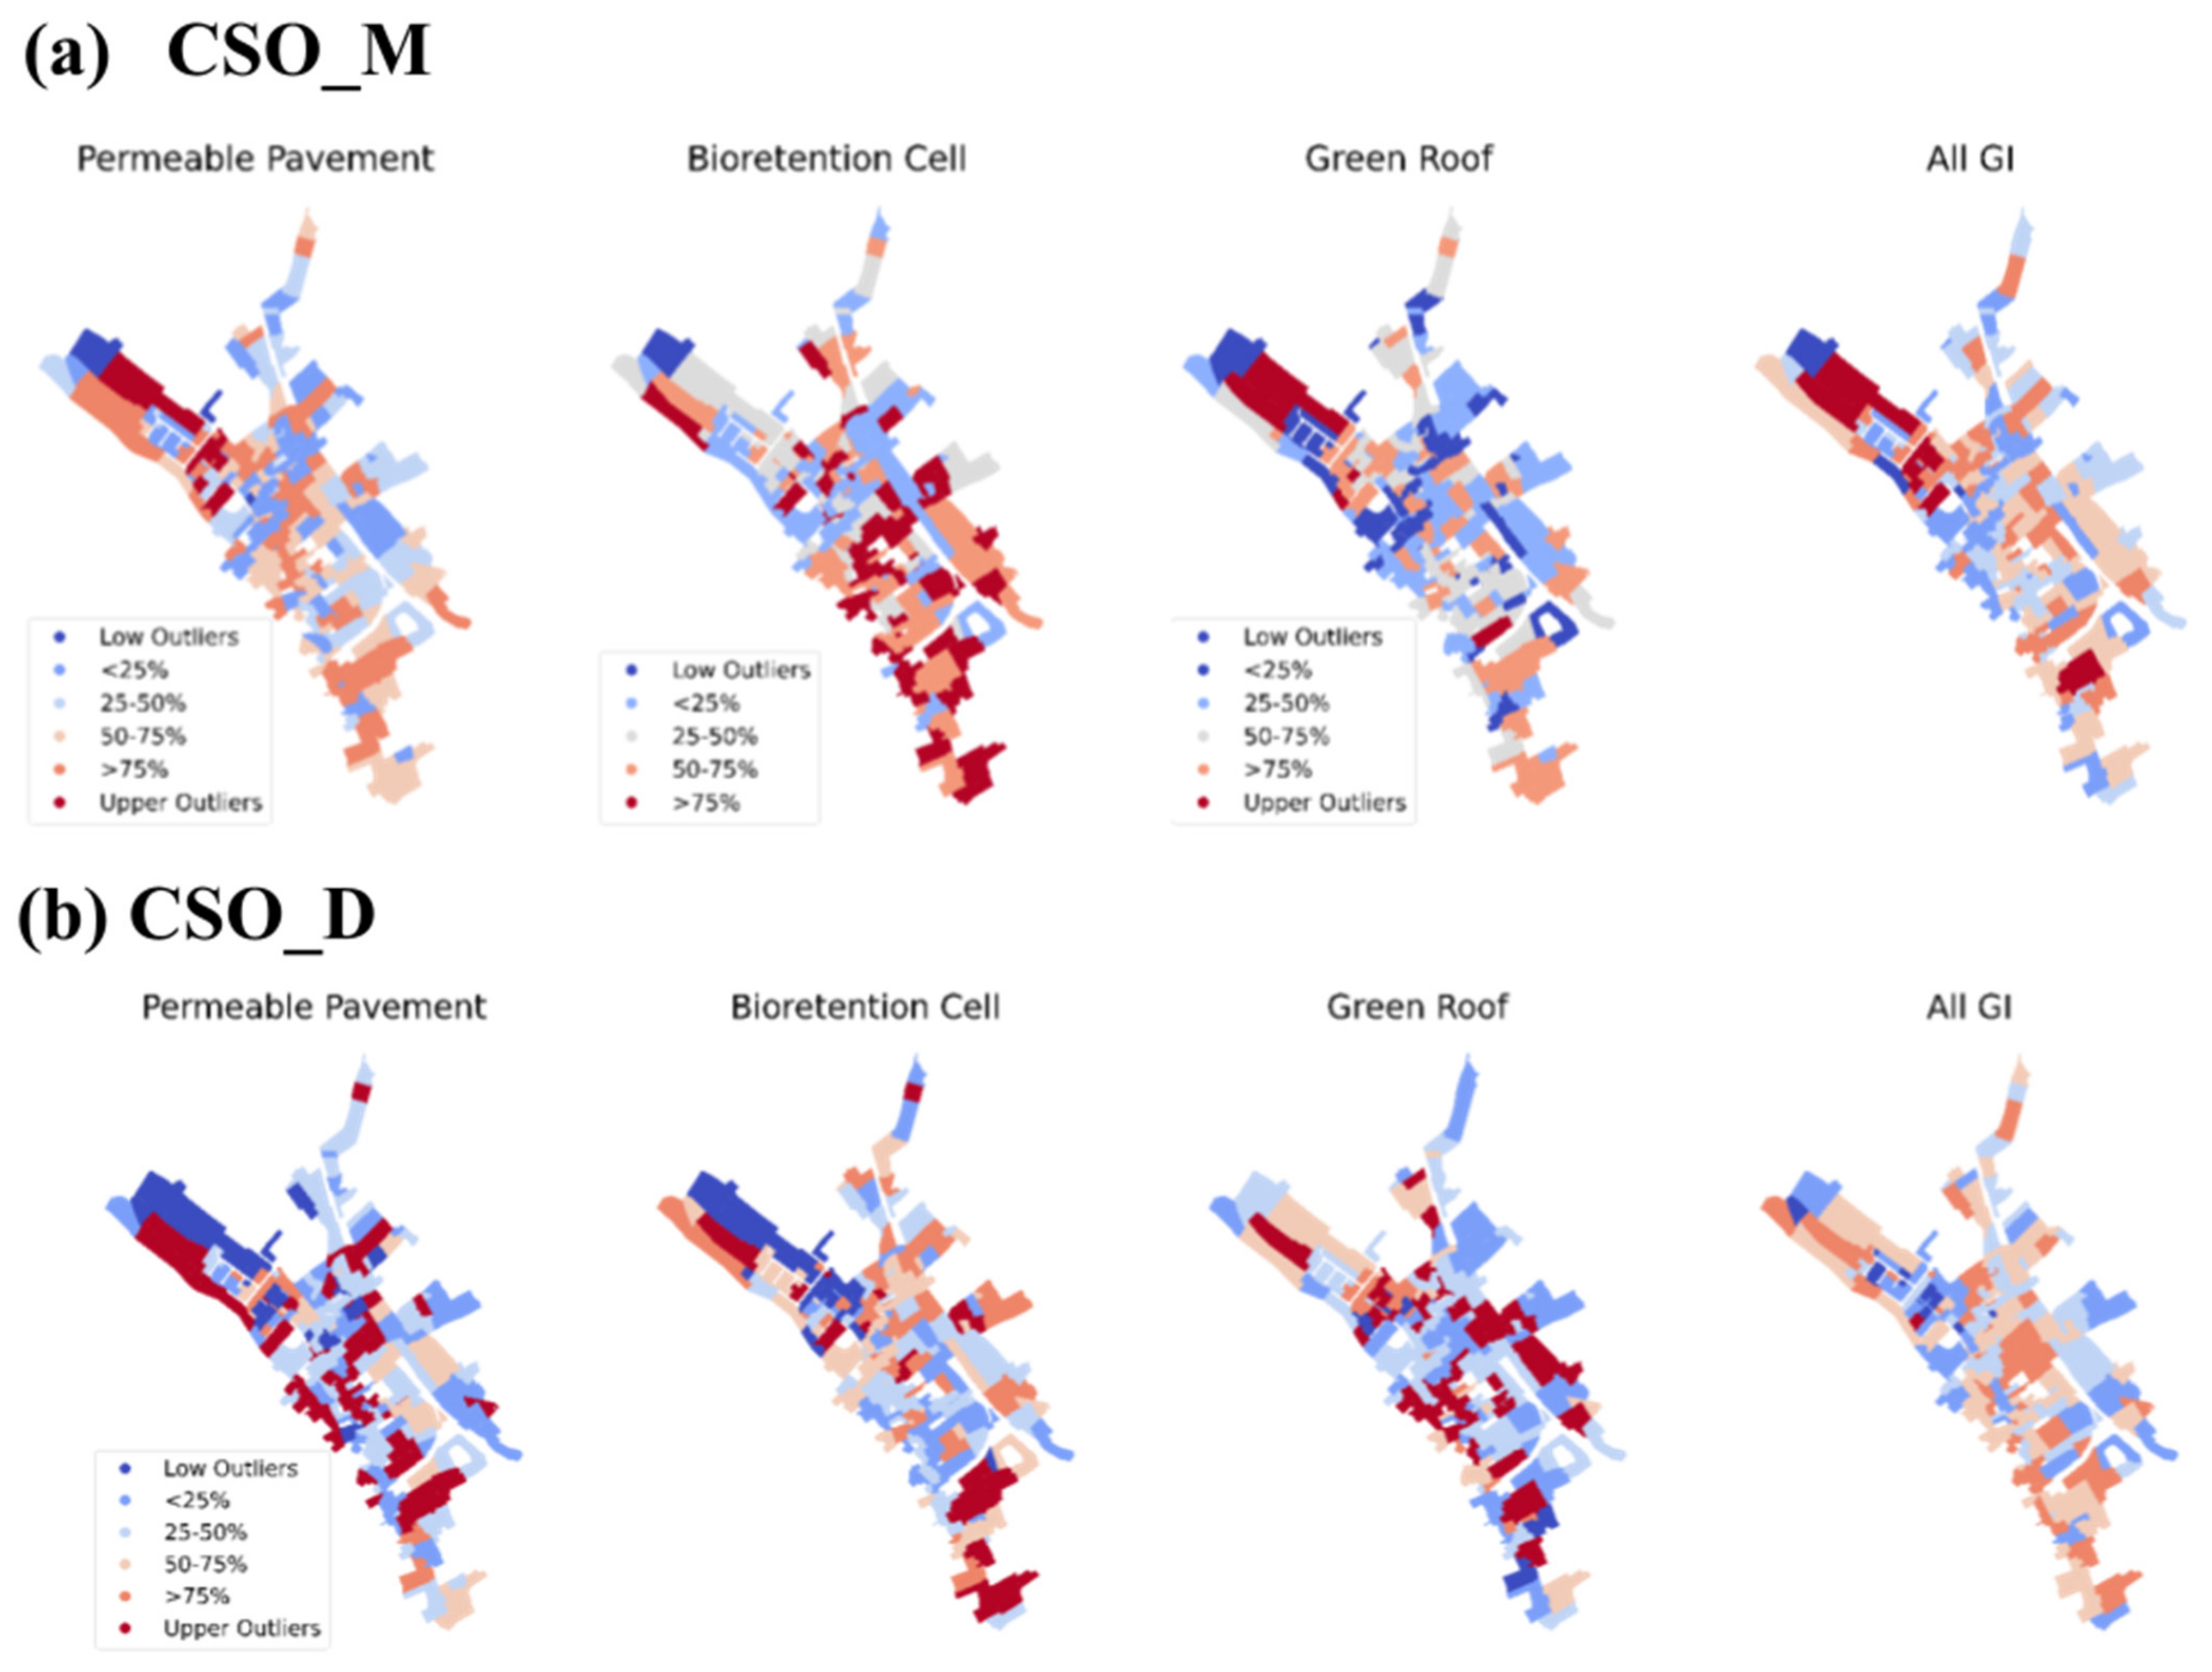
3.3. Local Spatial Autocorrelation
4. Discussion
4.1. GI location and Resilience Enhancement Spatial Relationships
4.2. ESDA and Implications in Urban Planning
4.3. Limitations and Future Research
5. Conclusions
Author Contributions
Funding
Data Availability Statement
Conflicts of Interest
References
- Mugume, S.N.; Gomez, D.E.; Fu, G.; Farmani, R.; Butler, D. A Global Analysis Approach for Investigating Structural Resilience in Urban Drainage Systems. Water Res. 2015, 81, 15–26. [Google Scholar] [CrossRef] [PubMed] [Green Version]
- Butler, D.; Ward, S.; Sweetapple, C.; Astaraie-Imani, M.; Diao, K.; Farmani, R.; Fu, G. Reliable, Resilient and Sustainable Water Management: The Safe & SuRe Approach. Glob. Chall. 2017, 1, 63–77. [Google Scholar] [CrossRef] [PubMed]
- Meerow, S.; Newell, J.P. Spatial Planning for Multifunctional Green Infrastructure: Growing Resilience in Detroit. Landsc. Urban Plan. 2017, 159, 62–75. [Google Scholar] [CrossRef]
- Lennon, M.; Scott, M.; O’Neill, E. Urban Design and Adapting to Flood Risk: The Role of Green Infrastructure. J. Urban Des. 2014, 19, 745–758. [Google Scholar] [CrossRef]
- Fletcher, T.D.; Shuster, W.; Hunt, W.F.; Ashley, R.; Butler, D.; Arthur, S.; Trowsdale, S.; Barraud, S.; Semadeni-Davies, A.; Bertrand-Krajewski, J.L.; et al. SUDS, LID, BMPs, WSUD and More—The Evolution and Application of Terminology Surrounding Urban Drainage. Urban Water J. 2015, 12, 525–542. [Google Scholar] [CrossRef]
- Dhakal, K.P.; Chevalier, L.R. Managing Urban Stormwater for Urban Sustainability: Barriers and Policy Solutions for Green Infrastructure Application. J. Environ. Manag. 2017, 203, 171–181. [Google Scholar] [CrossRef]
- Sweetapple, C.; Fu, G.; Farmani, R.; Meng, F.; Ward, S.; Butler, D. Attribute-Based Intervention Development for Increasing Resilience of Urban Drainage Systems. Water Sci. Technol. 2018, 77, 1757–1764. [Google Scholar] [CrossRef]
- Casal-Campos, A.; Fu, G.; Butler, D.; Moore, A. An Integrated Environmental Assessment of Green and Gray Infrastructure Strategies for Robust Decision Making. Environ. Sci. Technol. 2015, 49, 8307–8314. [Google Scholar] [CrossRef] [Green Version]
- Casal-Campos, A.; Sadr, S.M.K.; Fu, G.; Butler, D. Reliable, Resilient and Sustainable Urban Drainage Systems: An Analysis of Robustness under Deep Uncertainty. Environ. Sci. Technol. 2018, 52, 9008–9021. [Google Scholar] [CrossRef] [Green Version]
- Browder, G.; Ozment, S.; Rehberger Bescos, I.; Gartner, T.; Lange, G.-M. Integrating Green and Gray: Creating Next Generation Infrastructure. WRI Publ. 2019. [Google Scholar] [CrossRef]
- OFWAT. Resilience in the Round: Building Resilience for the Future; OFWAT: London, UK, 2017. [Google Scholar]
- Wang, Y.; Meng, F.; Liu, H.; Zhang, C.; Fu, G. Assessing Catchment Scale Flood Resilience of Urban Areas Using a Grid Cell Based Metric. Water Res. 2019, 163, 114852. [Google Scholar] [CrossRef]
- Sadr, S.M.K.; Casal-Campos, A.; Fu, G.; Farmani, R.; Ward, S.; Butler, D. Strategic Planning of the Integrated Urban Wastewater System Using Adaptation Pathways. Water Res. 2020, 182, 116013. [Google Scholar] [CrossRef]
- Liu, H.; Wang, Y.; Zhang, C.; Chen, A.S.; Fu, G. Assessing Real Options in Urban Surface Water Flood Risk Management under Climate Change. Nat. Hazards 2018, 94, 1–18. [Google Scholar] [CrossRef] [Green Version]
- Bach, P.M.; Kuller, M.; McCarthy, D.T.; Deletic, A. A Spatial Planning-Support System for Generating Decentralised Urban Stormwater Management Schemes. Sci. Total Environ. 2020, 726, 138282. [Google Scholar] [CrossRef]
- Dawson, D.A.; Vercruysse, K.; Wright, N. A Spatial Framework to Explore Needs and Opportunities for Interoperable Urban Flood Management. Philos. Trans. R. Soc. A Math. Phys. Eng. Sci. 2020, 378. [Google Scholar] [CrossRef] [Green Version]
- Zischg, J.; Zeisl, P.; Winkler, D.; Rauch, W.; Sitzenfrei, R. On the Sensitivity of Geospatial Low Impact Development Locations to the Centralized Sewer Network. Water Sci. Technol. 2018, 77, 1851–1860. [Google Scholar] [CrossRef]
- Liu, Y.; Cibin, R.; Bralts, V.F.; Chaubey, I.; Bowling, L.C.; Engel, B.A. Optimal Selection and Placement of BMPs and LID Practices with a Rainfall-Runoff Model. Environ. Model. Softw. 2016, 80, 281–296. [Google Scholar] [CrossRef] [Green Version]
- Fischer, M.M.; Getis, A. (Eds.) Handbook of Applied Spatial Analysis; Springer: Berlin/Heidelberg, Germany, 2010; Volume 102. [Google Scholar] [CrossRef]
- Anselin, L.; Sridharan, S.; Gholston, S. Using Exploratory Spatial Data Analysis to Leverage Social Indicator Databases: The Discovery of Interesting Patterns. Soc. Indic. Res. 2007, 82, 287–309. [Google Scholar] [CrossRef]
- Gallo, J.; Ertur, C. Exploratory Spatial Data Analysis of the Distribution of Regional per Capita GDP in Europe, 1980-1995. Pap. Reg. Sci. 2005, 82, 175–201. [Google Scholar] [CrossRef]
- Sridharan, S.; Tunstall, H.; Lawder, R.; Mitchell, R. An Exploratory Spatial Data Analysis Approach to Understanding the Relationship between Deprivation and Mortality in Scotland. Soc. Sci. Med. 2007, 65, 1942–1952. [Google Scholar] [CrossRef]
- Lee, S.-I. Spatial Association Measures for an ESDA-GIS Framework: Developments, Significance Tests, and Applications to Spatio-Temporal Income Dynamics of U.S. Labor Market Areas, 1969–1999. Ph.D. Thesis, The Ohio State University, Columbus, OH, USA, 2001. [Google Scholar]
- Jing, N.; Cai, W. Analysis on the Spatial Distribution of Logistics Industry in the Developed East Coast Area in China. Ann. Reg. Sci. 2010, 45, 331–350. [Google Scholar] [CrossRef]
- Zhang, J.; Zhang, K.; Zhao, F. Research on the Regional Spatial Effects of Green Development and Environmental Governance in China Based on a Spatial Autocorrelation Model. Struct. Chang. Econ. Dyn. 2020, 55, 1–11. [Google Scholar] [CrossRef]
- Moura, A.C.M.; Fonseca, B.M. ESDA (Exploratory Spatial Data Analysis) of Vegetation Cover in Urban Areas-Recognition of Vulnerabilities for the Management of Resources in Urban Green Infrastructure. Sustainability 2020, 12, 1933. [Google Scholar] [CrossRef] [Green Version]
- Rossman, L.A. Storm Water Management Model User’s Manual Version 5.1; No. EPA/600/R-14/413b; United States Environmental Protection Agency: Washington, DC, USA, 2015. [Google Scholar]
- McDonnell, B.; Ratliff, K.; Tryby, M.; Wu, J.; Mullapudi, A. PySWMM: The Python Interface to Stormwater Management Model (SWMM). J. Open Source Softw. 2020, 5, 2292. [Google Scholar] [CrossRef]
- Rey, S.J.; Anselin, L. PySAL: A Python Library of Spatial Analytical Methods. Rev. Reg. Stud. 2007, 37, 5–27. [Google Scholar] [CrossRef]
- Wang, M.; Sweetapple, C.; Fu, G.; Farmani, R.; Butler, D. A Framework to Support Decision Making in the Selection of Sustainable Drainage System Design Alternatives. J. Environ. Manag. 2017, 201, 145–152. [Google Scholar] [CrossRef]
- Rossman, L.A.; Huber, W.C. Storm Water Management Model Reference Manual Volume III—Water Quality. Environ. Prot. 2016, 3, 158. [Google Scholar]
- Rossman, L.A.; Huber, W.C. Storm Water Management Model Reference Manual Volume I—Hydrology (Revised) (EPA/600/R-15/162A); United States Environmental Protection Agency: Washington, DC, USA, 2016; Volume I. [Google Scholar]
- Wang, M.; Wang, Y.; Gao, X.; Sweetapple, C. Combination and Placement of Sustainable Drainage System Devices Based on Zero-One Integer Programming and Schemes Sampling. J. Environ. Manag. 2019, 238, 59–63. [Google Scholar] [CrossRef] [PubMed]
- Diao, K.; Sweetapple, C.; Farmani, R.; Fu, G.; Ward, S.; Butler, D. Global Resilience Analysis of Water Distribution Systems. Water Res. 2016, 106, 383–393. [Google Scholar] [CrossRef] [PubMed] [Green Version]
- Stewart, E.J.; Jones, D.A.; Svensson, C.; Morris, D.G.; Dempsey, P.; Dent, J.E.; Collier, C.G.; Anderson, C.W. Reservoir Safety—Long Return Period Rainfall; Deparment for Environment, Food and Rural Affairs: London, UK, 2013; Volume 1. [Google Scholar]
- Sweetapple, C.; Fu, G.; Farmani, R.; Butler, D. Exploring Wastewater System Performance under Future Threats: Does Enhancing Resilience Increase Sustainability? Water Res. 2019, 149, 448–459. [Google Scholar] [CrossRef] [PubMed]
- Mair, M.; Sitzenfrei, R.; Kleidorfer, M.; Möderl, M.; Rauch, W. GIS-Based Applications of Sensitivity Analysis for Sewer Models. Water Sci. Technol. 2012, 65, 1215–1222. [Google Scholar] [CrossRef] [Green Version]
- Ord, J.K.; Getis, A. Local Spatial Autocorrelation Statistics: Distributional Issues and an Application. Geogr. Anal. 1995, 27, 286–306. [Google Scholar] [CrossRef]
- Anselin, L. Local Indicators of Spatial Association—LISA. Geogr. Anal. 1995, 27, 93–115. [Google Scholar] [CrossRef]
- Arribas-Bel, D. A Course on Geographic Data Science. J. Open Source Educ. 2019, 2, 42. [Google Scholar] [CrossRef]
- Anselin, L.; Rey, S.J. Spatial Weights: Contiguity. In Modern Spatial Econometrics in Practice: A Guide to GeoDa, GeoDaSpace and PySAL; Anselin, L., Rey, S.J., Eds.; GeoDA Press LLC: Chicago, IL, USA, 2014. [Google Scholar]
- Environmental Agency. Lidar Composite Digital Terrain Model England 1m Resolution [ASC Geospatial Data]. Available online: https://digimap.edina.ac.uk (accessed on 27 January 2021).
- Centre for Ecology and Hydrology. Land Cover map of Great Britain (2019) [TIFF Geospatial Data]. Available online: https://digimap.edina.ac.uk (accessed on 7 January 2021).
- EU Copernicus Programme (European Environment Agency). High Resolution Layer: Imperviousness Density (IMD). 2018. Available online: https://land.copernicus.eu/pan-european/high-resolution-layers/imperviousness/status-maps/imperviousness-density-2018%0A (accessed on 1 February 2021).
- Ordnance Survey (GB). OS MasterMap® Topography Layer. Available online: https://digimap.edina.ac.uk (accessed on 27 January 2021).
- Bondarenko, M.; Kerr, D.; Sorichetta, A.; Tatem, A.J. Census/Projection-Disaggregated Gridded Population Datasets for 189 Countries in 2020 Using Built-Settlement Growth Model (BSGM) Outputs, doi:10.5258/SOTON/WP00684. Available online: https://www.worldpop.org/geodata/ (accessed on 28 June 2021).
- Woods Ballard, B.; Wilson, S.; Udale-Clarke, H.; Illman, S.; Scott, T.; Ashley, R.; Kellagher, R. The SUDS Manual; CIRIA: London, UK, 2015. [Google Scholar]
- Kjeldsen, T.R.; Stewart, E.J.; Packman, J.C.; Folwell, S.S.; Bayliss, A.C. Revitalisation of the FSR/FEH Rainfall Runoff Method; Centre for Ecology & Hydrology: Wallingford, UK, 2005. [Google Scholar]


| Layer | Parameter | Green Roof | Permeable Pavement | Bio-Retention Cell |
|---|---|---|---|---|
| Surface | Berm height (mm) | 50 | 0 | 150 |
| Vegetation fraction (%) | 0.5 | 0 | 0.1 | |
| Roughness (Manning’s n) | 0.4 | 0.012 | 0.1 | |
| Surface slope (%) | 0 | 1 | 1 | |
| Pavement | Thickness (mm) | - | 150 | - |
| Void ratio (volume fraction) | - | 0.15 | - | |
| Fraction Imperviousness (%) | - | 0 | - | |
| Permeability (mm/h) | - | 500 | - | |
| Clogging factor | - | 0 | - | |
| Soil | Thickness (mm) | 150 | - | 600 |
| Porosity (volume fraction) | 0.45 | - | 0.5 | |
| Field capacity (volume fraction) | 0.2 | - | 0.2 | |
| Wilting point (volume fraction) | 0.1 | - | 0.1 | |
| Conductivity (mm/h) | 650 | - | 250 | |
| Conductivity slope (-) | 5 | - | 12.5 | |
| Suction head (mm) | 49.5 | - | 50 | |
| Storage | Height (mm) | - | 300 | 150 |
| Void ratio (-) | - | 0.4 | 0.75 | |
| Seepage factor (mm/h) | - | 7.0 | 7 | |
| Drain | Coefficient (mm/h) | - | 0.5 | 0.5 |
| Exponent (-) | - | 0.5 | 0.5 | |
| Offset height (mm) | - | 100 | 150 | |
| Delay (days) | - | 0 | 0 | |
| Drain Mat | Thickness (mm) | 75 | - | - |
| Void ration (volume fraction) | 0.75 | - | - | |
| Roughness (Manning’s n) | 0.1 | - | - |
| Level of Service Loss | Metric | Description | Calculation | Notations |
|---|---|---|---|---|
| Sewer flooding | Failure Magnitude | The total flood volume in the system | Summation of flood volume at the flooded nodes | SF_M |
| Failure Duration | Time taken between the occurrence of flooding to the recovery of normal performance | Average of the duration of the flooding at the flooded nodes | SF_D | |
| CSO (combined sewer overflows) | Failure Magnitude | The total CSO volume in the system | Summation of CSO volume at the outfall nodes | CSO_M |
| Failure Duration | Time taken between the occurrence of CSO to the recovery of normal performance | Average of the duration of the CSO at the outfall nodes | CSO_D |
| SF_M | SF_D | CSO_M | CSO_D | ||||||
|---|---|---|---|---|---|---|---|---|---|
| GI Type | Spatial Weights | Moran’s I | p-Value | Moran’s I | p-Value | Moran’s I | p-Value | Moran’s I | p-Value |
| Permeable Pavement | Queen Contiguity | 0.015 | 0.354 | 0.110 | 0.020 | −0.005 | 0.138 | −0.011 | 0.430 |
| Rook Contiguity | 0.012 | 0.346 | 0.111 | 0.011 | −0.047 | 0.169 | −0.006 | 0.487 | |
| KNN–4 | 0.070 | 0.052 | 0.156 | 0.001 | 0.059 | 0.058 | 0.001 | 0.448 | |
| KNN–5 | 0.088 | 0.024 | 0.152 | 0.001 | 0.048 | 0.074 | 0.003 | 0.397 | |
| KNN–6 | 0.076 | 0.020 | 0.135 | 0.003 | 0.034 | 0.118 | 0.012 | 0.305 | |
| Bioretention Cell | Queen Contiguity | 0.191 | 0.001 | 0.052 | 0.111 | 0.168 | 0.001 | 0.042 | 0.150 |
| Rook Contiguity | 0.181 | 0.004 | 0.052 | 0.114 | 0.172 | 0.001 | 0.043 | 0.145 | |
| KNN–4 | 0.200 | 0.002 | 0.087 | 0.022 | 0.199 | 0.001 | 0.039 | 0.146 | |
| KNN–5 | 0.210 | 0.001 | 0.040 | 0.126 | 0.175 | 0.001 | 0.044 | 0.096 | |
| KNN–6 | 0.215 | 0.001 | 0.041 | 0.086 | 0.160 | 0.001 | 0.043 | 0.087 | |
| Green Roof | Queen Contiguity | 0.106 | 0.027 | 0.167 | 0.003 | 0.053 | 0.092 | −0.060 | 0.122 |
| Rook Contiguity | 0.101 | 0.022 | 0.164 | 0.001 | 0.053 | 0.111 | −0.070 | 0.092 | |
| KNN–4 | 0.170 | 0.002 | 0.193 | 0.001 | 0.107 | 0.006 | −0.057 | 0.101 | |
| KNN–5 | 0.165 | 0.001 | 0.159 | 0.001 | 0.088 | 0.017 | −0.045 | 0.138 | |
| KNN–6 | 0.167 | 0.001 | 0.135 | 0.001 | 0.059 | 0.033 | −0.053 | 0.067 | |
| All GI | Queen Contiguity | 0.015 | 0.289 | 0.110 | 0.012 | −0.019 | 0.370 | 0.195 | 0.001 |
| Rook Contiguity | 0.012 | 0.325 | 0.111 | 0.018 | −0.018 | 0.404 | 0.198 | 0.001 | |
| KNN–4 | 0.070 | 0.049 | 0.156 | 0.002 | 0.010 | 0.019 | 0.191 | 0.001 | |
| KNN–5 | 0.087 | 0.016 | 0.151 | 0.002 | 0.059 | 0.058 | 0.195 | 0.001 | |
| KNN–6 | 0.076 | 0.019 | 0.134 | 0.001 | 0.059 | 0.033 | 0.154 | 0.001 | |
Publisher’s Note: MDPI stays neutral with regard to jurisdictional claims in published maps and institutional affiliations. |
© 2021 by the authors. Licensee MDPI, Basel, Switzerland. This article is an open access article distributed under the terms and conditions of the Creative Commons Attribution (CC BY) license (https://creativecommons.org/licenses/by/4.0/).
Share and Cite
Rodriguez, M.; Fu, G.; Butler, D.; Yuan, Z.; Sharma, K. Exploring the Spatial Impact of Green Infrastructure on Urban Drainage Resilience. Water 2021, 13, 1789. https://doi.org/10.3390/w13131789
Rodriguez M, Fu G, Butler D, Yuan Z, Sharma K. Exploring the Spatial Impact of Green Infrastructure on Urban Drainage Resilience. Water. 2021; 13(13):1789. https://doi.org/10.3390/w13131789
Chicago/Turabian StyleRodriguez, Mayra, Guangtao Fu, David Butler, Zhiguo Yuan, and Keshab Sharma. 2021. "Exploring the Spatial Impact of Green Infrastructure on Urban Drainage Resilience" Water 13, no. 13: 1789. https://doi.org/10.3390/w13131789
APA StyleRodriguez, M., Fu, G., Butler, D., Yuan, Z., & Sharma, K. (2021). Exploring the Spatial Impact of Green Infrastructure on Urban Drainage Resilience. Water, 13(13), 1789. https://doi.org/10.3390/w13131789