Abstract
Agriculture is the largest fresh water consuming sector, and maize is the most produced and consumed crop worldwide. The water footprint (WF) methodology quantifies and evaluates the water volumes consumed and polluted by a given crop, as well as its impacts. In this work, we quantified for the first time the green WF (soil water from precipitation that is evapotranspired) and the green virtual water exports of maize from Buenos Aires province, Argentina, during 2016–2017, due to the relevance of this region in the world maize trade. Furthermore, at local level, we quantified the green, blue (evapotranspired irrigation), and grey (volume of water needed to assimilate a pollution load) WF of maize in a pilot basin. The green WF of maize in the province of Buenos Aires ranged between 170 and 730 m3/ton, with the highest values in the south following a pattern of yields. The contribution of this province in terms of green virtual water to the international maize trade reached 2213 hm3/year, allowing some water-scarce nations to ensure water and water-dependent food security and avoid further environmental impacts related to water. At the Napaleofú basin scale, the total WF of rainfed maize was 358 m3/ton (89% green and 11% grey) and 388 m3/ton (58% green, 25% blue, and 17% grey) for the irrigated crop, showing that there is not only a green WF behind the exported maize, but also a Nitrogen-related grey WF.
1. Introduction
Agriculture is in continuous expansion and has a central role in food supply both for human population and for livestock [1,2,3,4]. This type of production uses large volumes of water, about 86% of total global consumption, which comes from two main sources: rainfall and irrigation [5,6,7]. In addition, commodity production generates pollution and degradation of both surface and groundwater resources, deforestation, and loss of biodiversity. Consequently, it leads to a loss of water in producing and exporting countries as the water consumed is not available for other purposes, such as domestic water use [2,5,6,7,8].
In Latin America, agricultural production is responsible for 95% of the consumptive water use, of which almost three quarters (71%) is used for crop production, and is mostly consumed (between 90 and 94%) in rainfed conditions, i.e., with green water [2,9,10].
Maize is the most produced, harvested, and consumed crop in the world [11]. In particular, Argentina is the fifth producer of this cereal, after the United States, China, Brazil, and the European Union, and exports more than half of its production [12,13]. Both at a national level and in the province of Buenos Aires, maize is the most relevant crop after soybean in terms of production and area planted [14,15].
In total, in the 2016–2017 crop season, Argentina produced 49.5 million tons of maize in 15 provinces, whereof Buenos Aires generated 26% of the national production. In that crop season, the province of Buenos Aires harvested 13 million tons of maize with an average yield of 8 tons/ha and exported half of its production [15]. Even though agriculture in the province of Buenos Aires is mostly rainfed, supplementary irrigation is sometimes applied to increase yields, as in the case of cultivation of maize, which is very sensitive to water stress [16,17].
In view of the growing maize production and export carried out by Argentina and the province of Buenos Aires during the last decade [15], there is a need to promote a model of sustainable agricultural intensification that contributes to increasing the productivity per unit of area while reducing the environmental footprint and the negative impacts associated with agriculture, as well as achieving improvements in the management of water resources. For this reason, it is important to evaluate the water use of the most relevant crops in the region, by using indicators such as the water footprint, which quantifies the impacts on water resources. The water footprint assessment, coupled with the virtual water trade analysis of maize production in Argentina, will enable to understand the role of the Argentinean maize production in the global context, as well as the dependence of other countries on this production.
The water footprint consists of the sum of the quantities of water consumed and polluted in all stages of the production process of a good [18], and it is expressed in terms of volume of water per unit of product (m3/ton). The indicator has three components: green water footprint (water from precipitation that is evapotranspired), blue water footprint (water applied to the crop by irrigation), and grey water footprint (volume of water needed to assimilate a pollution load). The first two components refer to the consumptive use of water, while the grey water footprint refers to pollution. The green and blue water footprints are differentiated by their hydrological, environmental, and social impacts, as well as the economic opportunity costs that are higher when using blue rather than green water for production [19,20].
Several authors have estimated the water footprint of different crops, such as soybean, maize, and potato, among others, either at the international [5,21,22,23,24,25,26], Latin American [2,10,27,28,29], or Argentinean level [30,31,32,33]. However, there is no detailed analysis of the water footprint of maize production at the provincial and local levels.
The present study aims at assessing the water footprint and virtual-water exports of maize produced in the province of Buenos Aires (Argentina) and at a pilot basin level during the 2016–2017 season. The objective of the study is twofold. Firstly, the study analyses the green water footprint and the virtual water exports of maize in Buenos Aires province, Argentina. Second, at a local scale, the green, blue, and grey water footprints of maize are analyzed in a basin located in the southeast region of the province of Buenos Aires, showing that there is not only a green water footprint, but also a nitrogen-related grey water footprint. This research represents a step forward to achieve a more comprehensive knowledge of the appropriation of water resources by one of the main productive activities of the Buenos Aires province, and shows the contribution of this province in terms of green water to the international maize trade, allowing some water-scarce countries to reduce the water demand for domestic food production and reserve their water for high-value uses.
2. Materials and Methods
2.1. Study Area
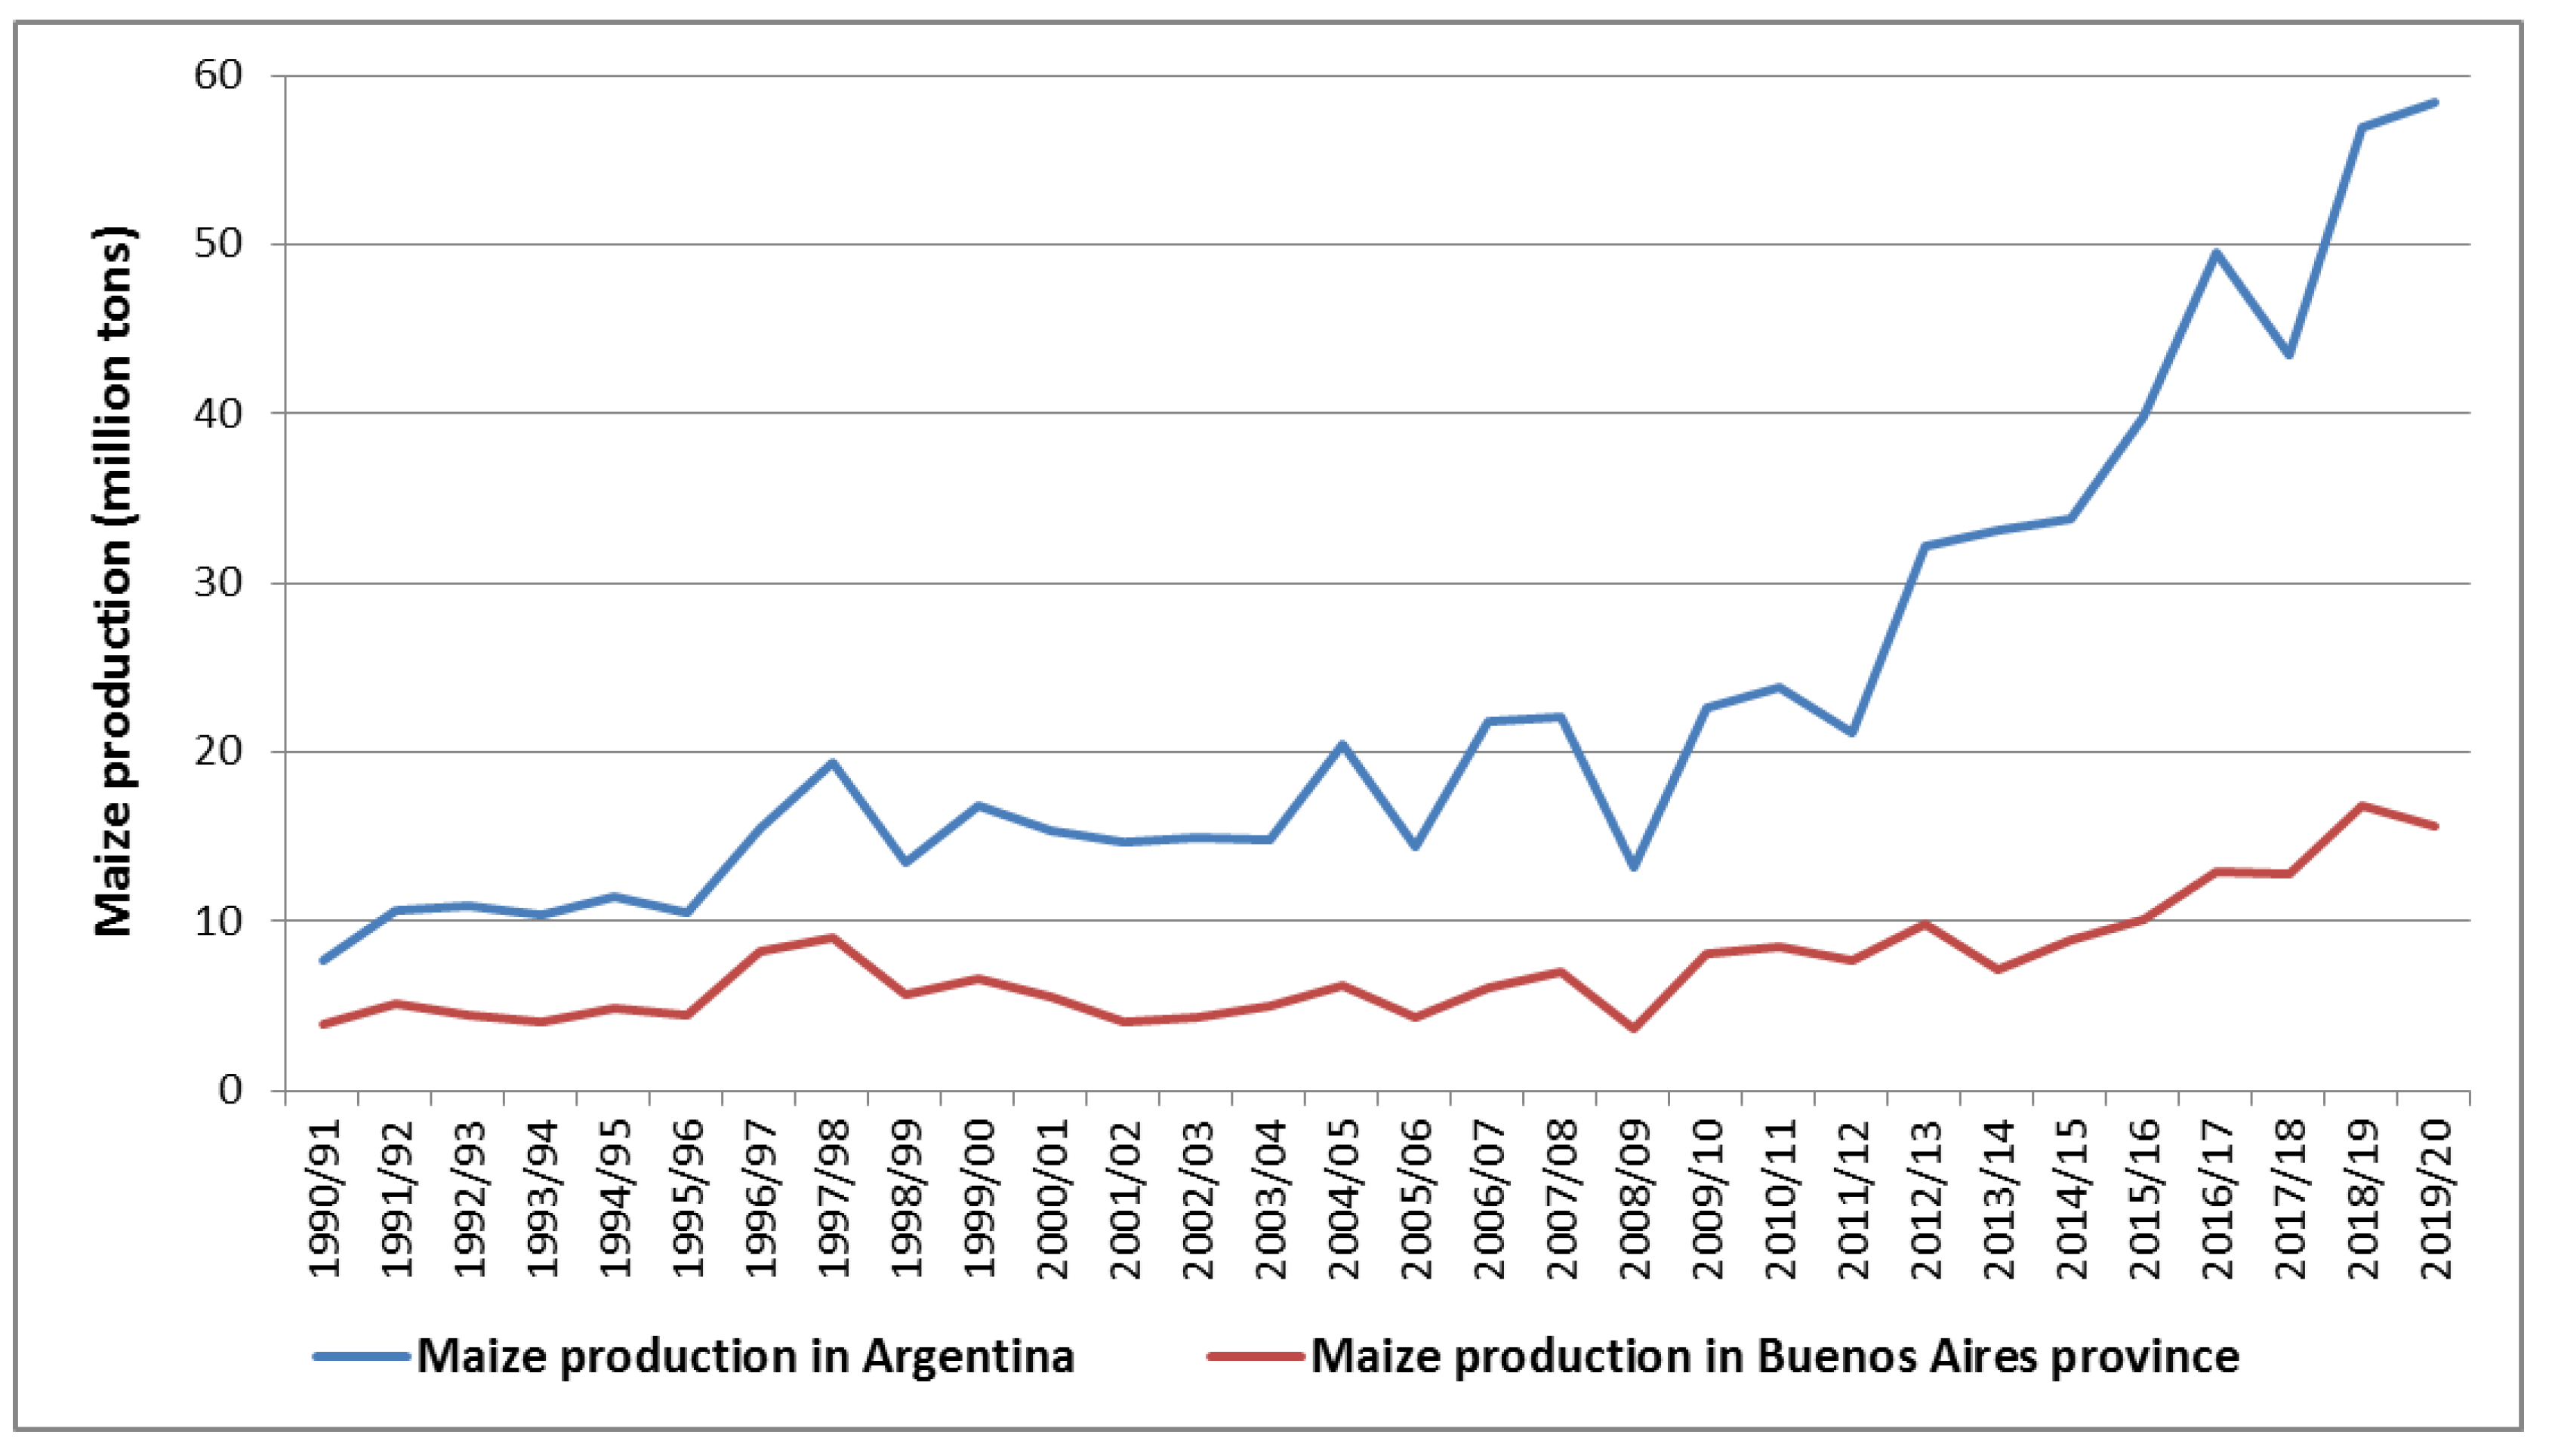
In the last three decades, an increase in maize production has been observed in both Argentina and the Buenos Aires province. During 2016, Argentina and Buenos Aires produced 3.2 times more maize than in the year 2000 (Figure 1). Regarding the international trade of maize, Argentina increased the amount of maize exports by 2.5 times in only four years, from 2013 to 2016 [15].
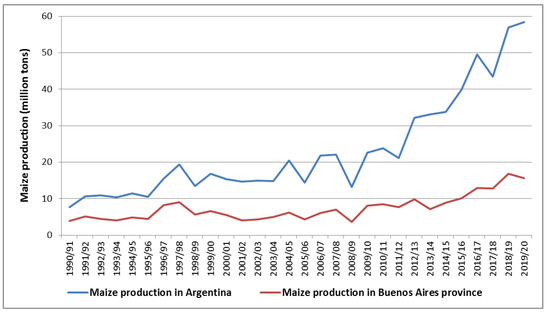
Figure 1.
Maize production in Argentina and Buenos Aires province. Source: Ministry of Agriculture, Livestock and Fisheries of Argentina, 2020.
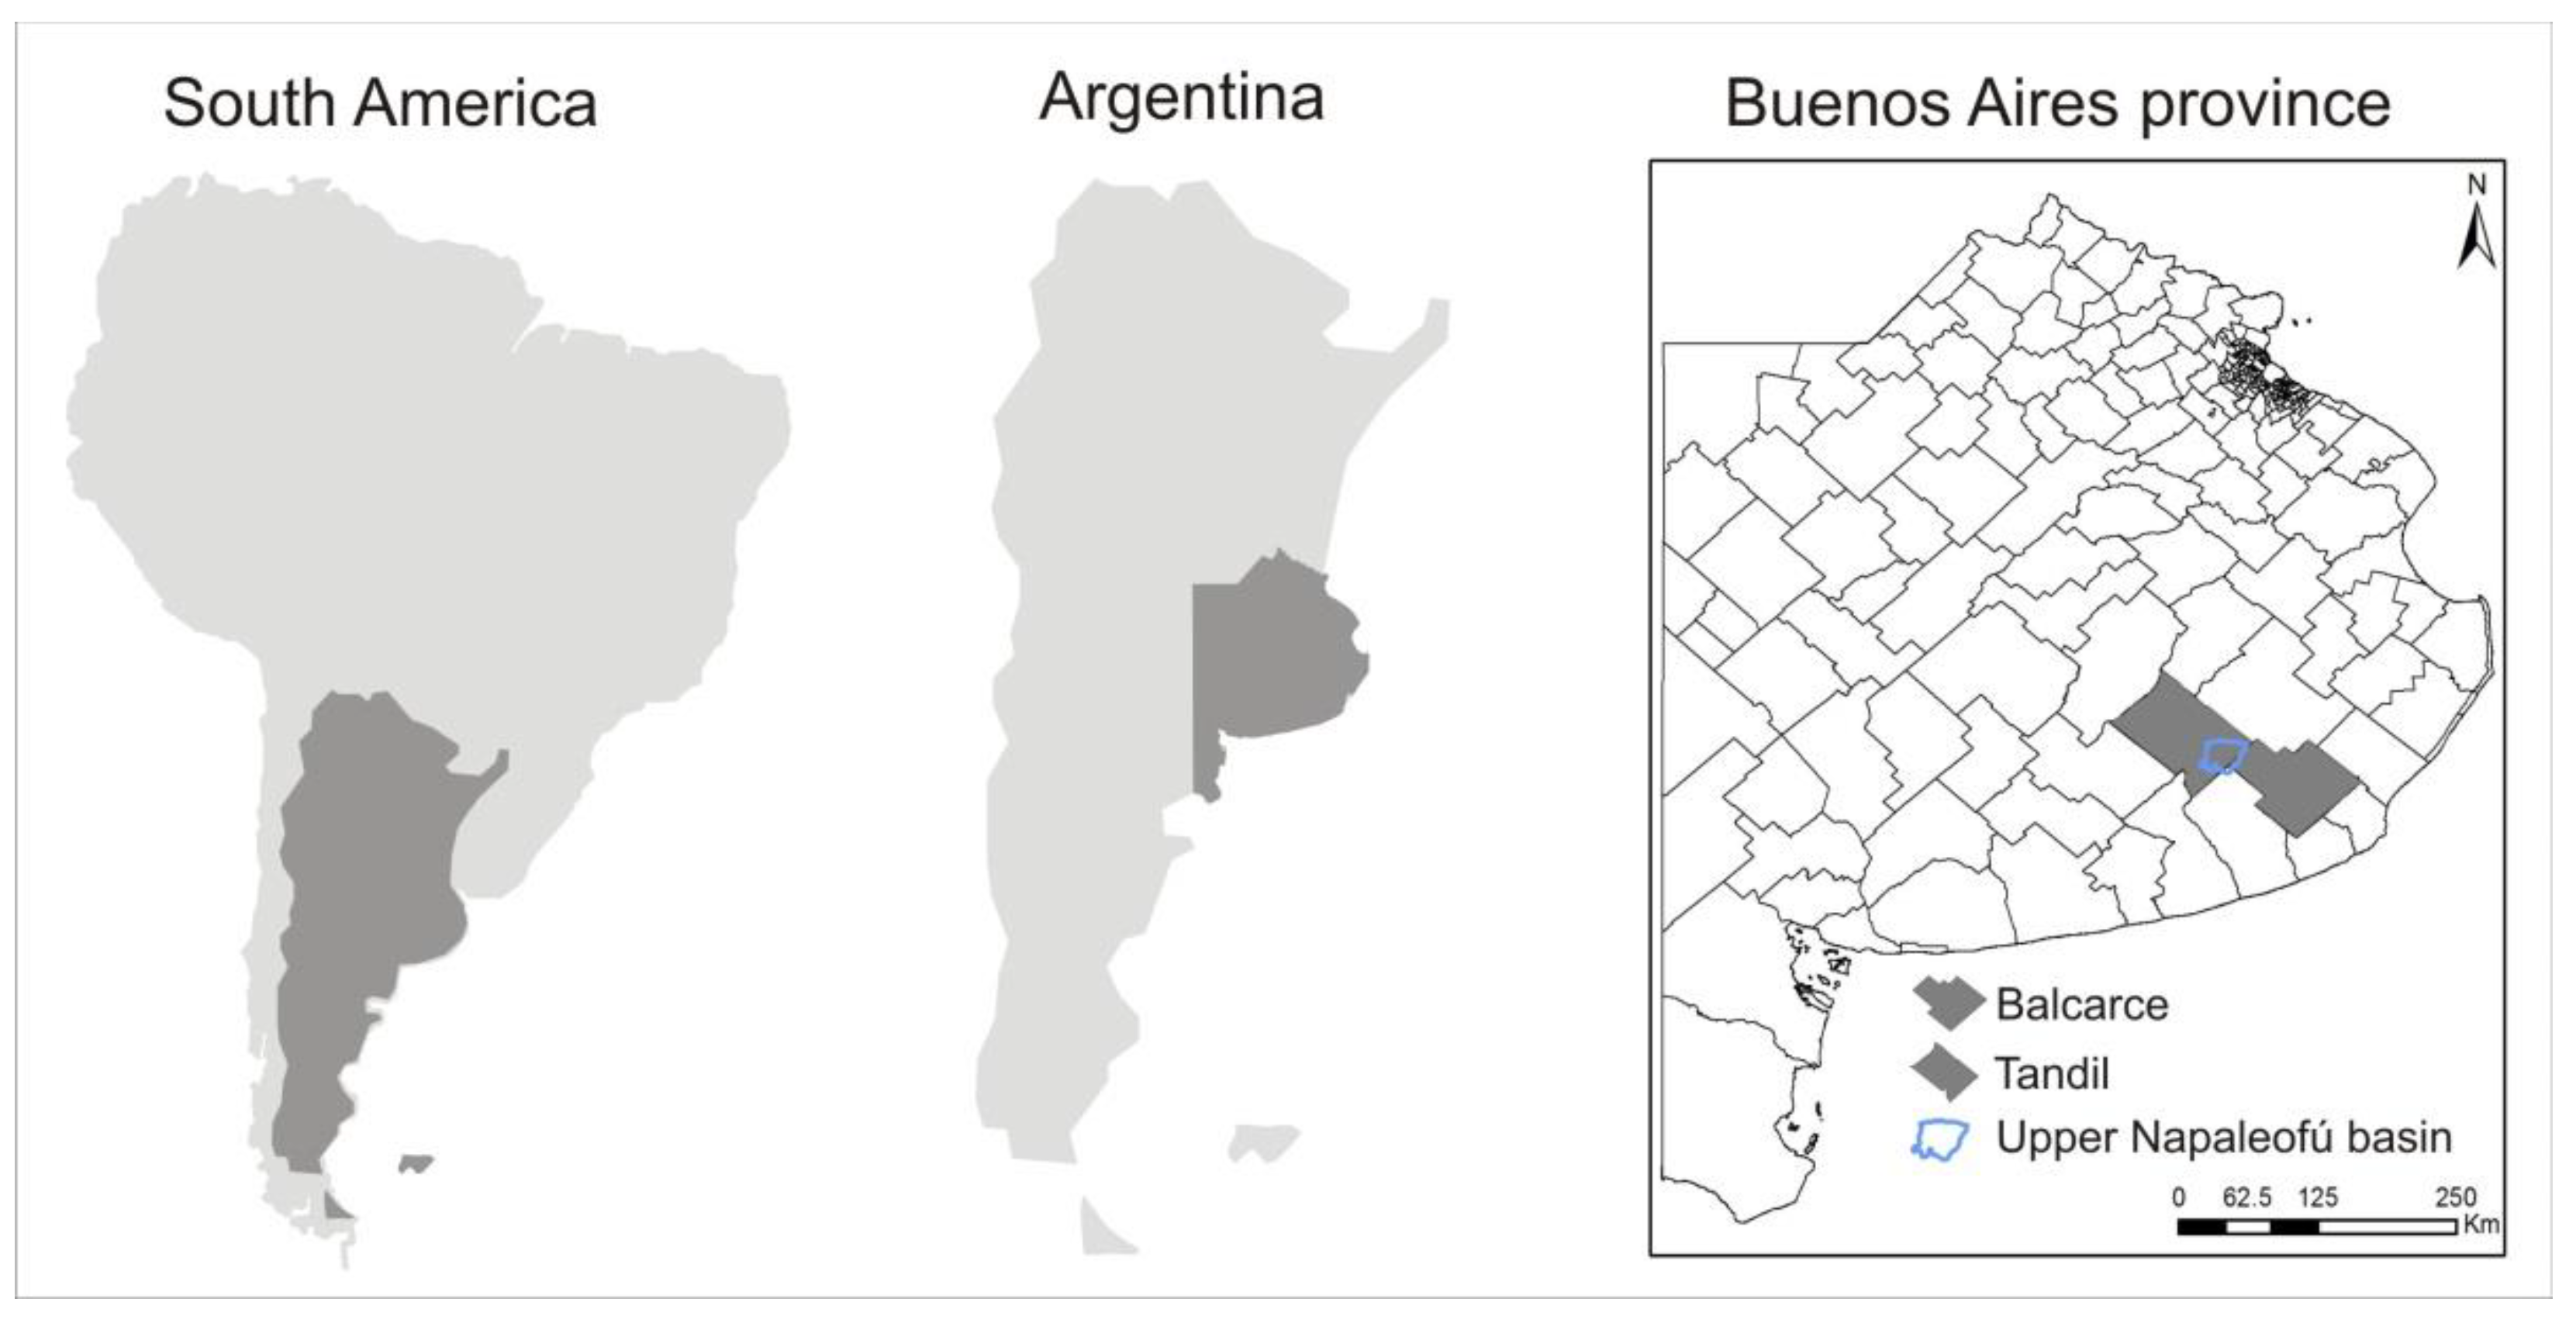
The province of Buenos Aires is one of the 23 provinces of Argentina. It is located in the Pampean region, covering an area of 307,571 km2, and is divided into 135 municipalities (Figure 2). Due to its extension, population, and the relevance of its economic activities, it is considered the most important province in the country.
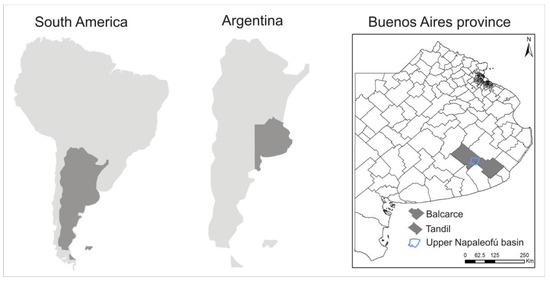
Figure 2.
Location of Argentina in South America (left), location of Buenos Aires province in Argentina (middle), and location of Tandil and Balcarce districts and the upper Napaleofú basin in Buenos Aires province (right).
The climate of this province is humid temperate, with rainfall between 700 and 1200 mm, decreasing from northeast to southwest. The average annual temperatures vary between 14 and 20 °C, declining towards the south. Alternating periods of drought and flooding have been identified. Most of the rainfall is concentrated in spring and summer, presenting a low water deficit in the month of January, which enables rainfed agriculture in the summer months, while in June, despite the low winter rainfall, there is an excess of water as the water requirements and temperatures are lower [34,35].
This province presents a flat, gently undulating relief alternating with depressed plains, with gentle slopes towards the Atlantic Ocean and drainages towards the main rivers. Low hills and plains, fossilized dune fields and sand flats, and permanent and temporary lagoons can also be found. The predominant soils are Molisols, both in extension and in the variety of large groups, followed by Alfisols, Entisols, and Vertisols. The Molisol order is made up of agricultural soils with a surface horizon rich in organic matter, with dark or brownish colors. Within this order, Argiudols, Haplustols, Hapludols, and Natracuols stand out [34].
At local scale, this study is focused on the upper Napaleofú basin, which is located in the southeast of the Buenos Aires province, on the border between the municipalities of Tandil and Balcarce (Figure 2). This region of the province is crossed by the Tandilia Hilly system in a northwest–east direction. The basin is characterized by a humid to sub-humid climate with annual rainfall of around 901 mm and an average annual temperature of 13.9 °C during the period 1968–2010 [36,37].
In the Napaleofú basin, maize is the second most relevant crop after soybean, followed by sunflower and wheat. In total, 779,547 hectares were planted in Tandil and Balcarce during the 2016–2017 crop season, whereof soybean represented 28%, followed by maize with 12% [15]. The yield of the latter crop varied between 5.5 and 10.5 tons/ha.
The Napaleofú basin is considered an experimental area due to the change in land use that has occurred for the last four decades, including the increase in direct seeding and the decrease in the area covered by livestock farming, along with its intensification [37]. This basin is inserted into a gently undulating flat relief of deep, dark, and nutrient-rich soils, such as Argiudols and Hapludols [37,38]. Soils are suitable for agriculture with some limitations in crop choice, or require conservation practices to prevent deterioration [39].
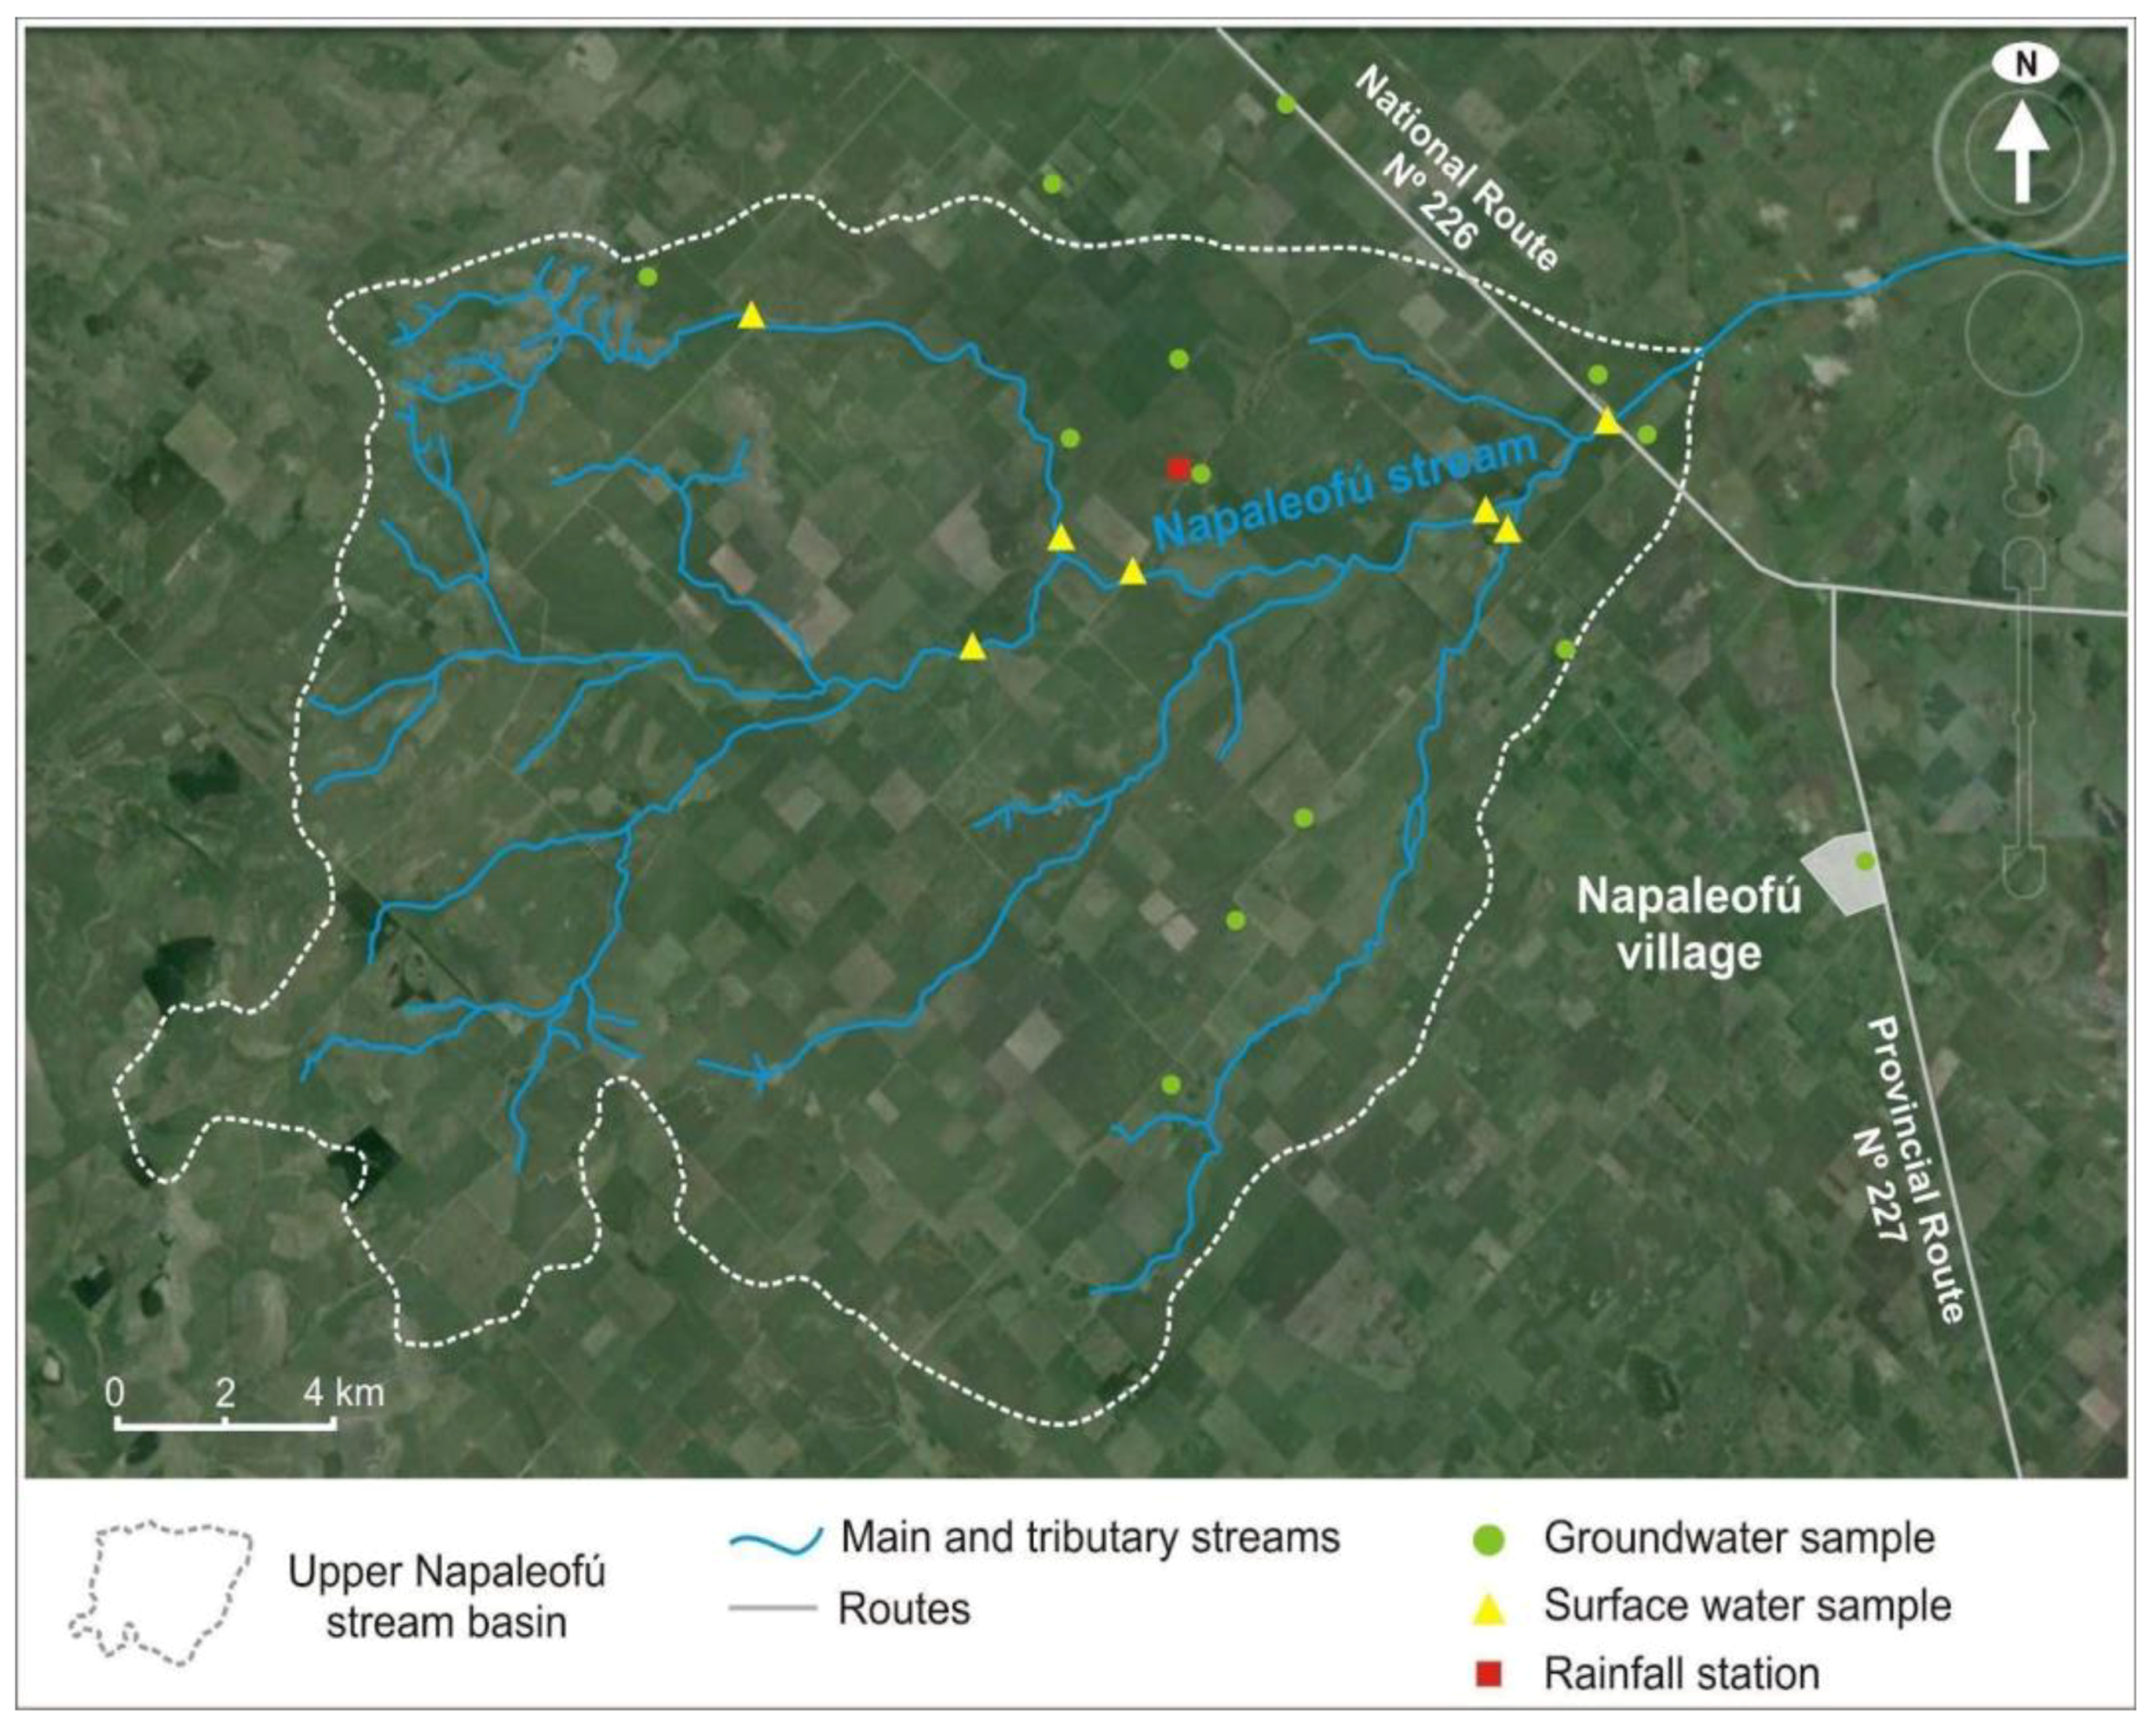
This basin was selected due to the availability of detailed data regarding the maize production (Figure 3), and also as this crop is produced both under rainfed and irrigated conditions.
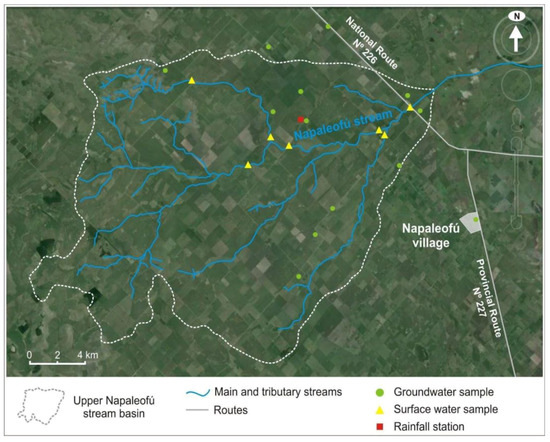
Figure 3.
Location of the Napaleofú stream, groundwater, and surface water sampling points and rainfall station.
The period 2016–2017 was selected for several reasons. On the one hand, it was chosen due to the availability of climatic, production, and trade data. The climatic information of the province was taken from 19 meteorological stations provided by two national databases (National Meteorological Service [40] and National Institute of Agricultural Technology [41]), which do not contain detailed data for long periods along the province in all cases. Additionally, in the national and international databases on maize production and trade (Ministry of Treasury [42] and FAOSTAT [43]), the period of 2016–2017 corresponded to the most recent data available when the study was carried out. At Napaleofú basin level, detailed information about the cultivation of maize is generally recorded neither by farmers nor by governmental dependences. Therefore, during 2016, the surveys and interviews to local farmers were developed in the Napaleofú basin in order to acquire local data. On the other hand, according to the temperature, relative humidity, rainfall, and windspeed data [40,41], the period 2016–2017 was similar to the average climatic conditions. For instance, the average annual rainfall in the province of Buenos Aires was 951 mm for the period 2016–2017, which is similar to the annual average of 876 mm for the period 2008–2018.
2.2. Green Water Footprint Estimation in the Province of Buenos Aires
The green water footprint of maize in rainfed conditions was estimated at provincial level for the 2016–2017 crop season following the method of Hoekstra et al. [44]. The green water footprint (WFgreen, m3/ton) of maize was calculated according to equation 1, where the green water use is related to the yield (Y, tons/ha). The green water use is calculated as the minimum of crop evapotranspiration (ETc) and effective rainfall (Peff) both measured in m3/ha. ETc was calculated at 10-day intervals over the entire growing season using the CROPWAT 8.0 model [45], which is based on the Penman–Monteith equation to estimate the reference crop evapotranspiration following the method described in Allen et al. [46]. The climatic data used in modeling ETc included average, maximum, and minimum monthly temperatures, relative humidity, windspeed, and sunshine hours. The effective precipitation (Peff) is the part of the total amount of rainfall that is retained by the soil so that it is potentially available for meeting the water needs of the crop [44]. The method of the USDA Soil Conservation Service was chosen in the CROPWAT model to calculate Peff, taking into account the monthly rainfall registered in the meteorological stations distributed in the province of Buenos Aires.
The climatic variables and rainfall data for each of the municipalities were taken from the closest meteorological stations provided by the National Meteorological Service [40] and the National Institute of Agricultural Technology [41]. An allocation of the proportional area of influence of each meteorological station was carried out to assign the climate data at municipality level. The maize yield for each municipality was taken from the Ministry of Agriculture, Livestock, and Fishing of Argentina [15].
In order to estimate the green water, crop data (growth stages, crop coefficients, root depth and crop height, critical depletion, and yield response factor) were taken from reference values [45,46,47]. The total available soil moisture and other soil characteristics were obtained from a regional study [48]. The planting and harvest dates were 1 November 2016 and 15 April 2017, respectively and were taken from average dates for the province [49].
Green Virtual Water Export Estimation from the Province of Buenos Aires
Based on the tons of maize produced and exported by the province, a weighting was made based on the municipalities production to determine the tons exported by each municipality. Then, the share of each one was multiplied by the green water footprint by municipality, thus obtaining the green virtual water exported in maize by municipality (hm3). This green virtual water export of maize was analyzed under rainfed conditions as most of the maize production in the province of Buenos Aires does not use irrigation. Furthermore, there is no data on the rainfed and irrigated hectares of this crop production in the province.
The international virtual water trade related to maize grain exported by the Buenos Aires province was assessed, taking into account the main destinations of this cereal from Argentina. Trade data were obtained from national statistical agents and international databases [15,42,43]. The green virtual water exported by the province of Buenos Aires in maize grain was distributed according to the percentage of maize acquired by the main importing countries and by obtain the volume of green virtual water imported by each nation.
2.3. Water Footprint Estimation at Basin Scale
The water footprint of rainfed and irrigated maize in the upper Napaleofú basin was estimated by applying the methodology proposed by Hoekstra et al. [44], and considering locally collected data and background studies in the region. The period was the 2016–2017 season, covering its entire growth cycle from November to March.
Equation (1) was used to calculate the green water footprint, based on basin and municipal data [44].
Under irrigation conditions, the blue water footprint (WFblue, m3/ton) was calculated according to equation 2, where the blue water use is related with the crop yield (Y, tons/ha) [44]. The blue water use is the minimum of the irrigation requirement (Ir) using the CROPWAT model and the effective irrigation water supply (Ieff) obtained from local producers (both measured in m3/ha) (Table 1). The irrigation requirement (Ir) is equal to the difference between ETc and the green water use [44,50]. The Ieff is the part of irrigation water supply that is stored as soil moisture and is available for crop evapotranspiration, and it was calculated considering the percentage of efficiency of the irrigation system [51]. Blue water use is zero if the entire crop evapotranspiration requirement is met by the effective rainfall [50].

Table 1.
Maize production data in the Napaleofú basin.
For the calculation of the green and blue components, the crop data for all growth stages, their duration, crop coefficients, root depth and crop height, critical depletion, and yield response factor, were taken from reference values [42,46,47] and adjusted to the regional conditions [48,52]. In addition, the predominant soils were identified from the topographic chart N° 3760-30-3 of INTA [38], and the total available humidity was calculated based on a previous study [53].
The climatic data for the CROPWAT model were taken from the Tandil Aerodrome meteorological station, except for rainfall, which was recorded at the Napaleofú basin rainfall station (Figure 3).
According to the interviews conducted and the data recorded in the basin, the dates of sowing and harvesting of maize were 11 November 2016 and 15 March 2017, respectively. The sowing method corresponds to no tillage. The fertilizer application rate with commercial urea was 150 kg/ha in the rainfed crop and 325 kg/ha in irrigated maize. Yields were 7.5 tons/ha in rainfed and 10.5 tons/ha in irrigated conditions (Table 1).
In the cases where supplementary irrigation was applied to maize, the sprinkler irrigation system was used with pivot type equipment and 150 mm of water was applied, whereof 67% (Ieff = 100.5 mm) is available for the crop [51] (Table 1).
The nitrogen-related grey water footprint (WFgrey, m3/ton) was estimated following the methodology proposed by Franke et al. [54]. The nitrogen was used as a pollution indicator for commercial urea fertilization. Equation 3 was applied, taking into account the applied pollutant load (L), the difference between the maximum allowed limit (Cmax) and the natural concentration of that compound in the water body (Cnat), and the yield of the crop (Y). The applied pollutant load (L) is calculated by multiplying a dimensionless factor (α), which represents the percentage of nitrogen leached or run off, by the fertilizer application rate (Appl) by farmers.
According to Franke et al. [54], the nitrogen leaching factor can vary between 5 and 15 % depending on the different soil characteristics, mainly texture and type of drainage. For soils such as those in our region, and in the absence of more detailed local data, α is assumed equal to 10%.
The value of Cmax was taken from the maximum concentration in drinking water equivalent to 45 mg/L according to current Argentine regulation [55] (Table 1). Ambient water quality standards are neither available for the basin, nor for Argentina.
Regarding the nitrate concentration in water, two values were considered (Table 1). On the one hand, when natural concentration is not known, as happens in this study area, a value of nitrogen Cnat equal to zero was used, as proposed by Franke et al. [54] and Hoekstra et al. [44]. On the other hand, due to the lack of prior information on the background water quality in the Napaleofú basin, the actual concentration (Cact) of nitrate was assessed through quarterly surface water and groundwater sampling carried out between winter 2015 and winter 2016 for the working group (Figure 3). Then, the average value of nitrate concentration for the Napaleofú basin of 34 mg/L was used to calculate the grey water footprint. We considered the seasonal and spatial average as it represents the actual situation of the whole basin, instead of taking the lowest values, which can show the recent entry of water into the water bodies. This value did not consider samples affected by point source pollution located in the basin (i.e., dairy farms) and is similar to the nitrate concentration in a nearby basin [56]. It should also be noted that in this study area, agriculture and livestock farming have been developed for years, so the concentration of nitrogen in the water bodies is not low.
Finally, the calculation of the total water footprint (m3/ton) was performed for maize grown under rainfed conditions according to equation 4 (WFmaize, rainfed) and for the irrigated crop according to equation 5 (WFmaize, irrigated).
3. Results
3.1. Green Water Footprint of Maize in the Province of Buenos Aires
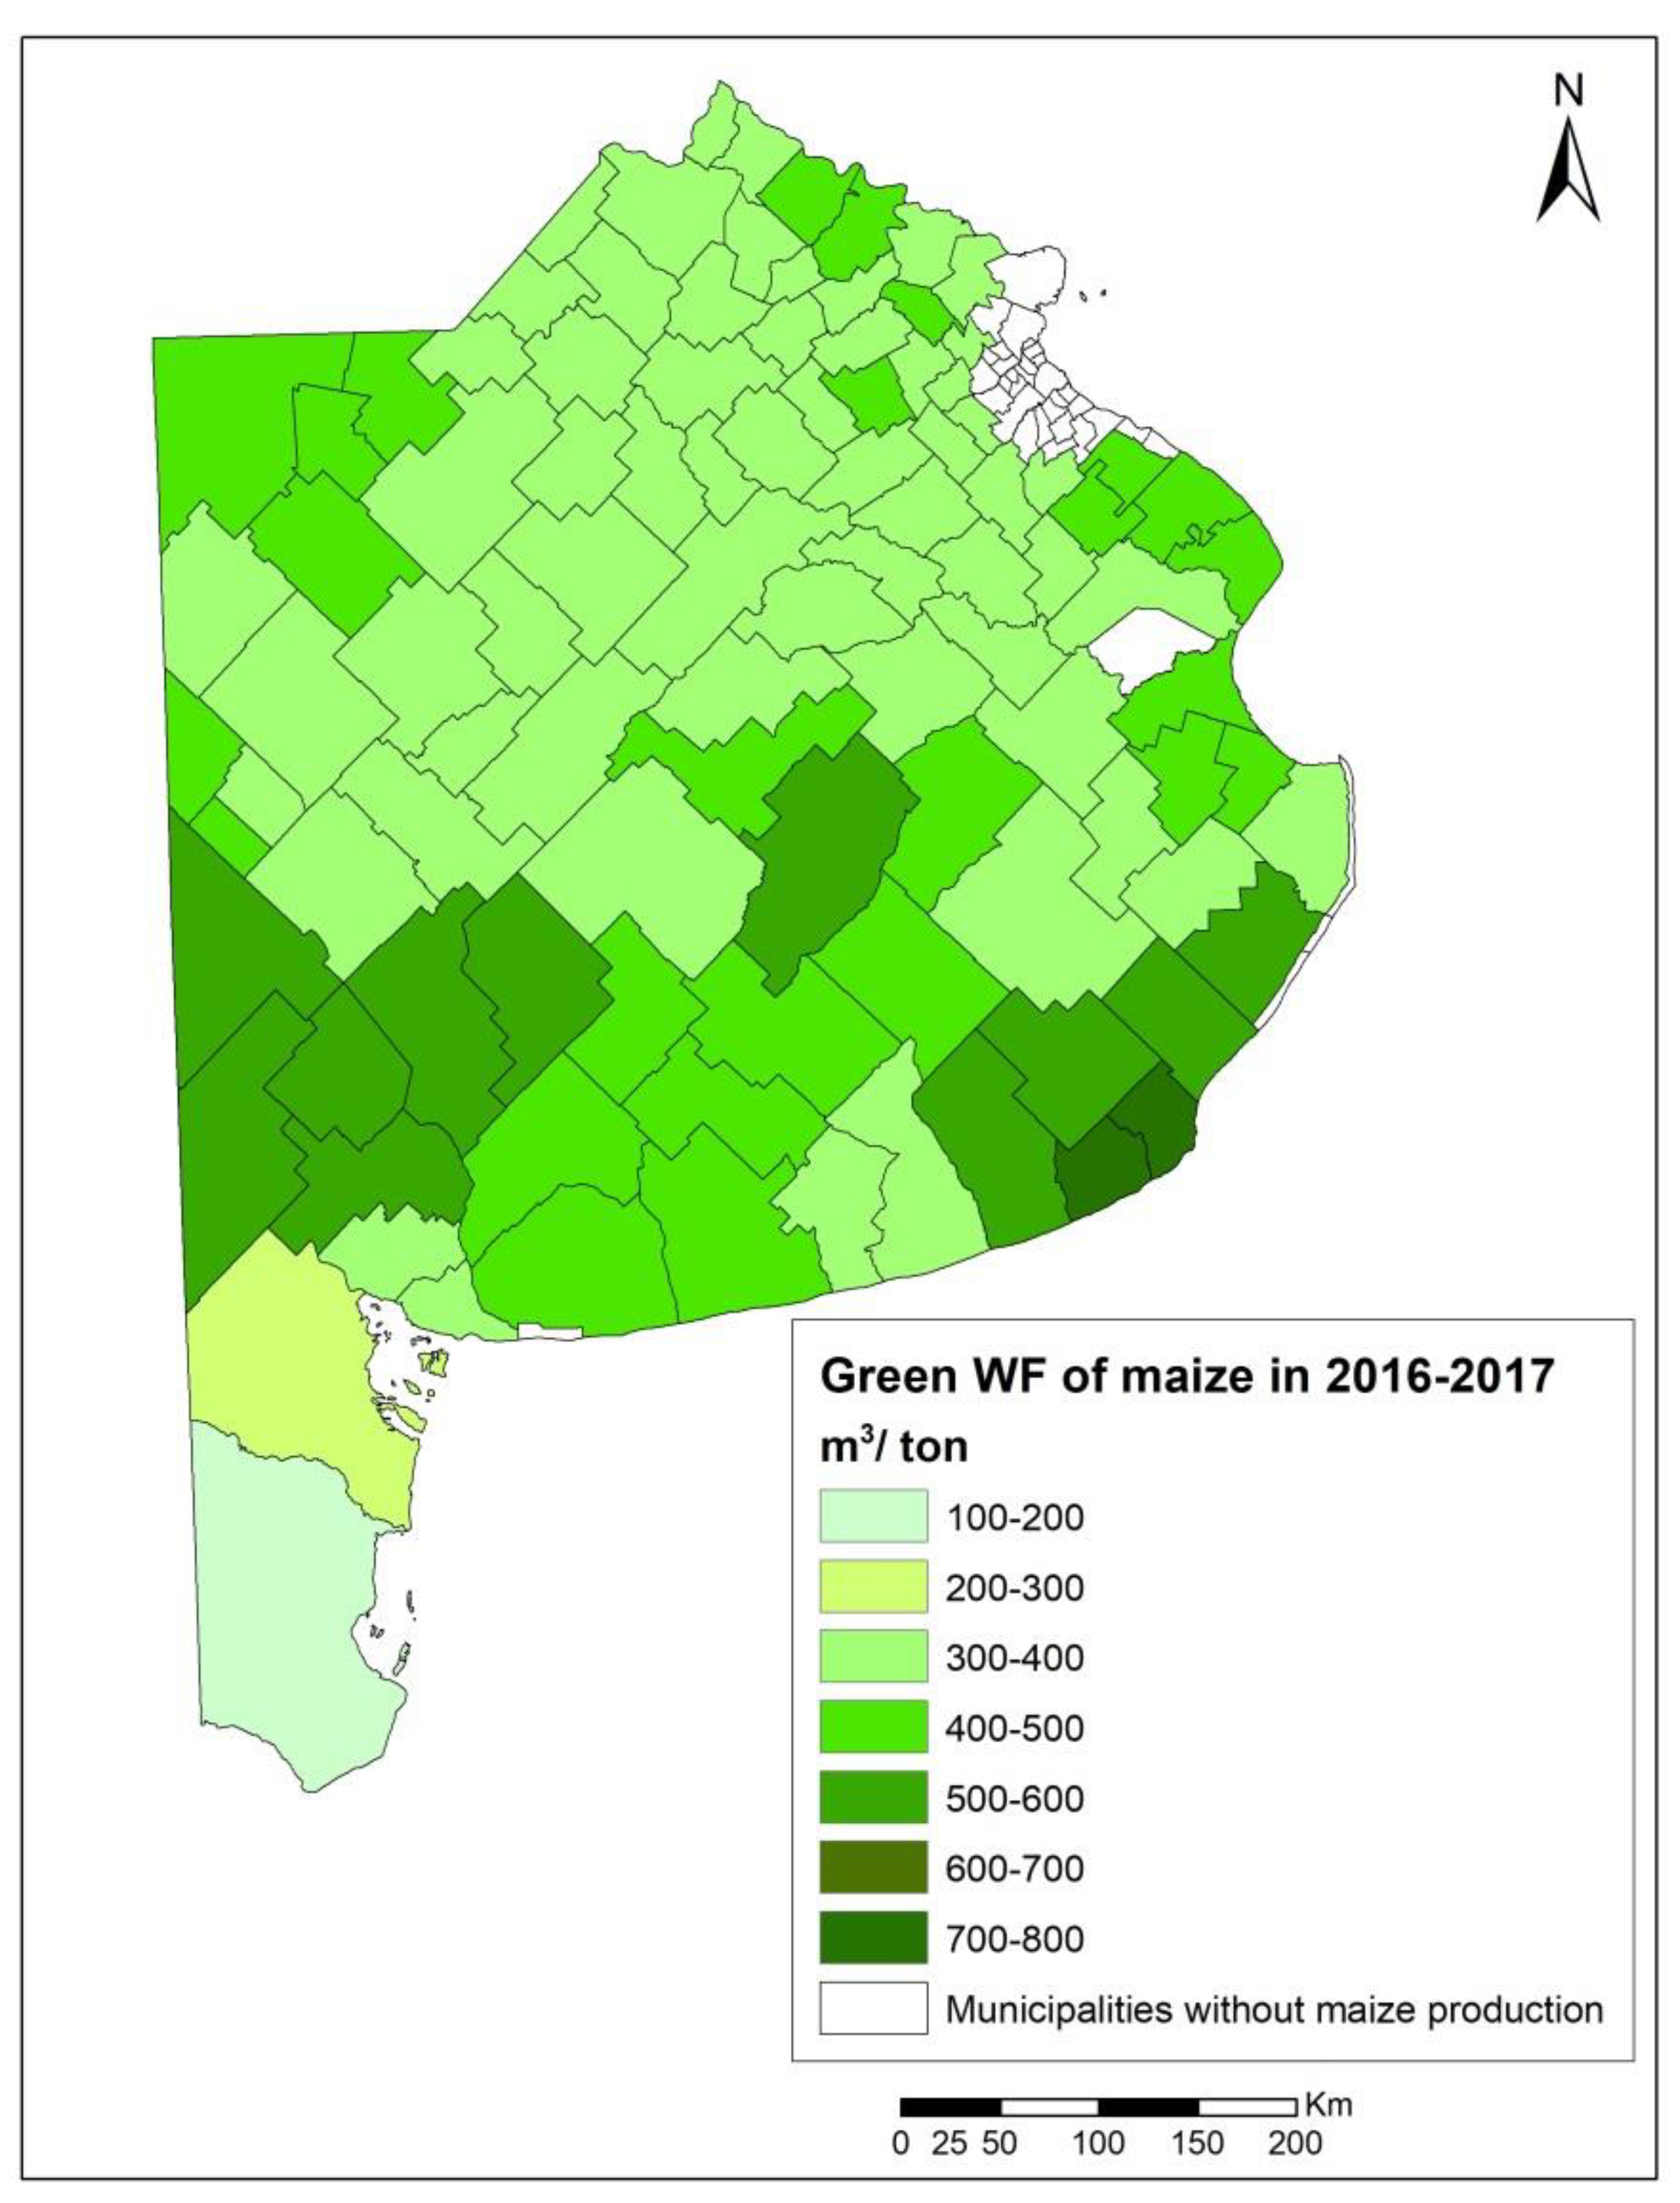
In the season 2016–2017, 102 of the 135 municipalities that constitute the Buenos Aires province planted and harvested maize. The yields (Y) varied between 5.5 and 10.8 tons/ha, with maximum values at the north and minimum to the south, and average values of 8 tons/ha (Table 2 and Figure 4). The green water use was, on average, 3134 m3/ha, reaching its maximum values to the north. The green water footprint ranged between 170 and 730 m3/ton, with an average of 400 m3/ton (Table 2). The highest green water footprints were mostly found at the south of the province and the lowest at the north, center, and extreme south (Figure 5).
Table 2.
Statistical data of green water use, yield, and green water footprint in the province of Buenos Aires.
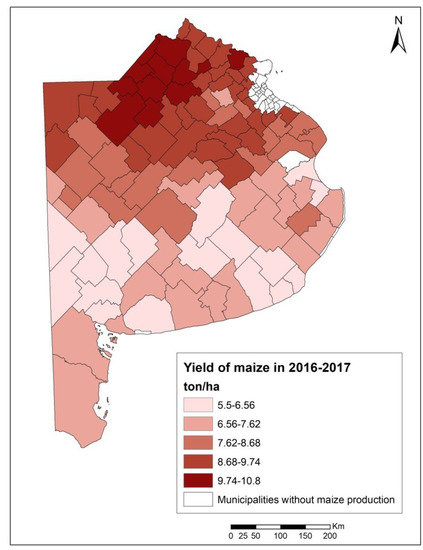
Figure 4.
Yield of maize in 2016–2017 at the municipality level in Buenos Aires province (tons/ha).
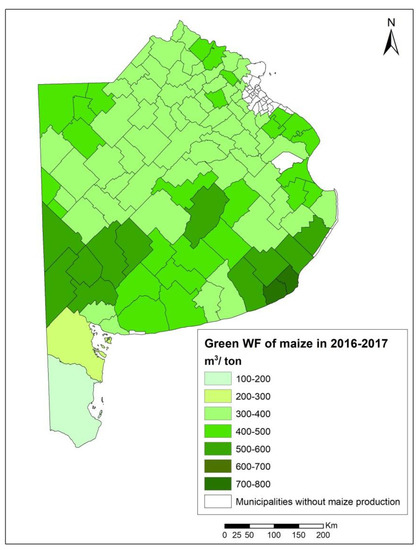
Figure 5.
Green water footprint of maize in 2016–2017 at the municipality level in Buenos Aires province (m3/ton).
Virtual Water Export of Maize from the Province of Buenos Aires
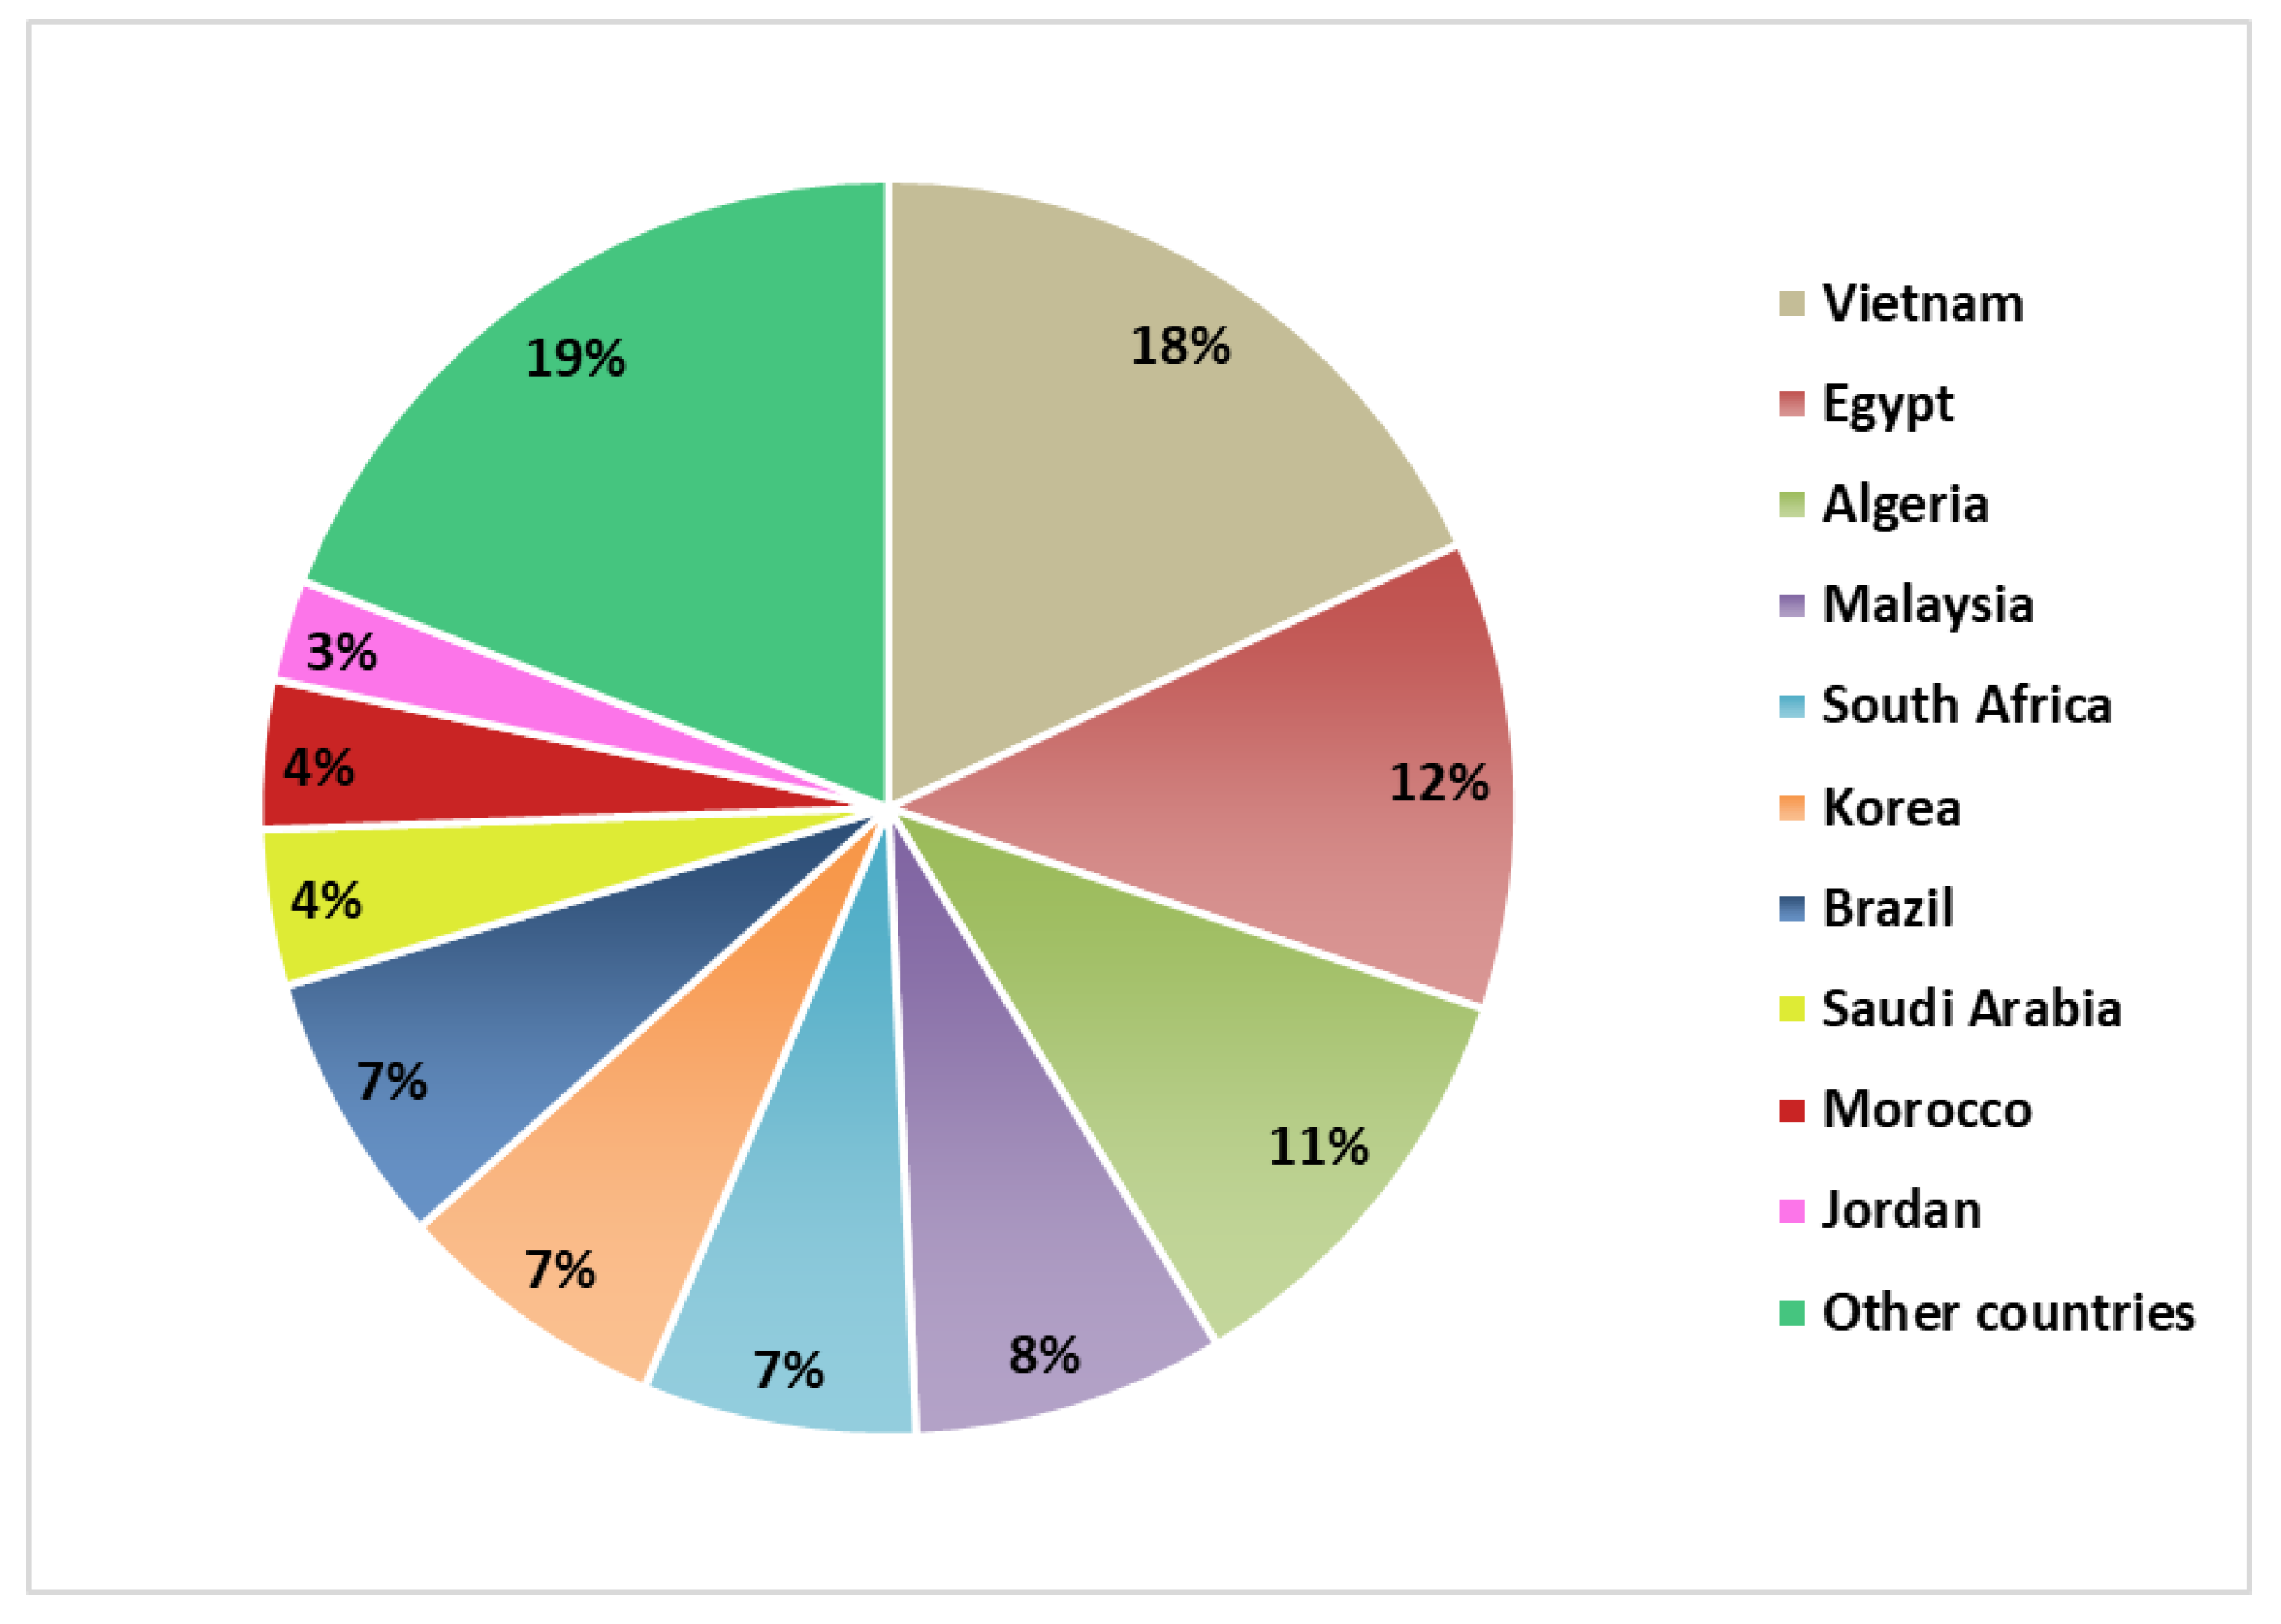
During the 2016–2017 season, Argentina produced almost 138 million tons of grains, where maize represented 37%. During the same period, Argentina exported 24 million tons of this grain to 120 countries, mainly to the following 10 countries, which add up to 81%: Vietnam, Egypt, Algeria, Malaysia, South Africa, Korea, Brazil, Saudi Arabia, Morocco, and Jordan (Figure 6) [43]. This trade route positions Argentina as one of the main maize exporters, contributing in 2016 to 16% of the international trade. Buenos Aires is the province with the largest weight in exports in the 2016–2017 season, being responsible for 25% of the production, equivalent to almost 6 million tons of maize.
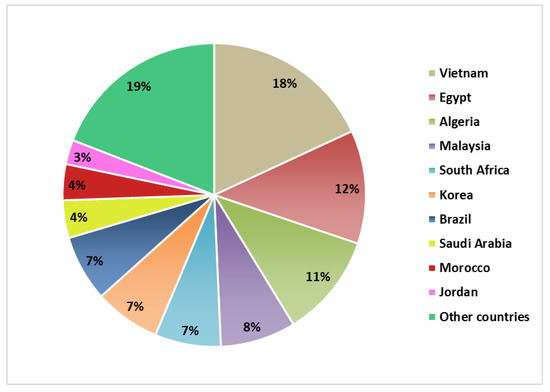
Figure 6.
International destinations of maize from Argentina in 2016–2017.
The green virtual water export of maize by the province of Buenos Aires was 2213 hm3. The values for each municipality within the province ranged widely, between 0.02 and 119 hm3/year for the season 2016–2017 (Figure 7). Ninety percent of the municipalities are below 50 hm3 of green water exported per year, while of the remaining 10%, only one municipality exports the maximum of 119 hm3/year, and the others are between 55 and 71 hm3.
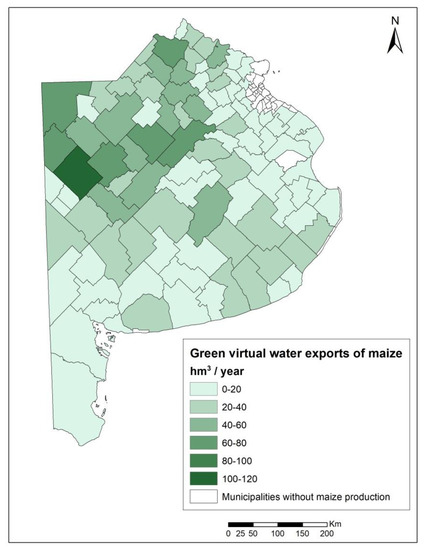
Figure 7.
Green virtual water exports of maize in 2016–2017 at the municipality level in Buenos Aires province (hm3/year).
Comparing Figure 5 and Figure 7, it can be observed that the municipalities with the highest contribution to the green water export were those that had the main productions, and generally areas with average green water footprints.
Table 3 shows that the top 10 maize-importing countries account for a total volume of 1793 hm3/year which is incorporated into the grain, while the rest of 110 nations import approximately 420 hm3 of water per year.
Table 3.
Green virtual water of the province of Buenos Aires related to maize grain imported by the main trading countries in 2016–2017.
3.2. Green, Blue and Grey WF of Maize in the Napaleofú Basin
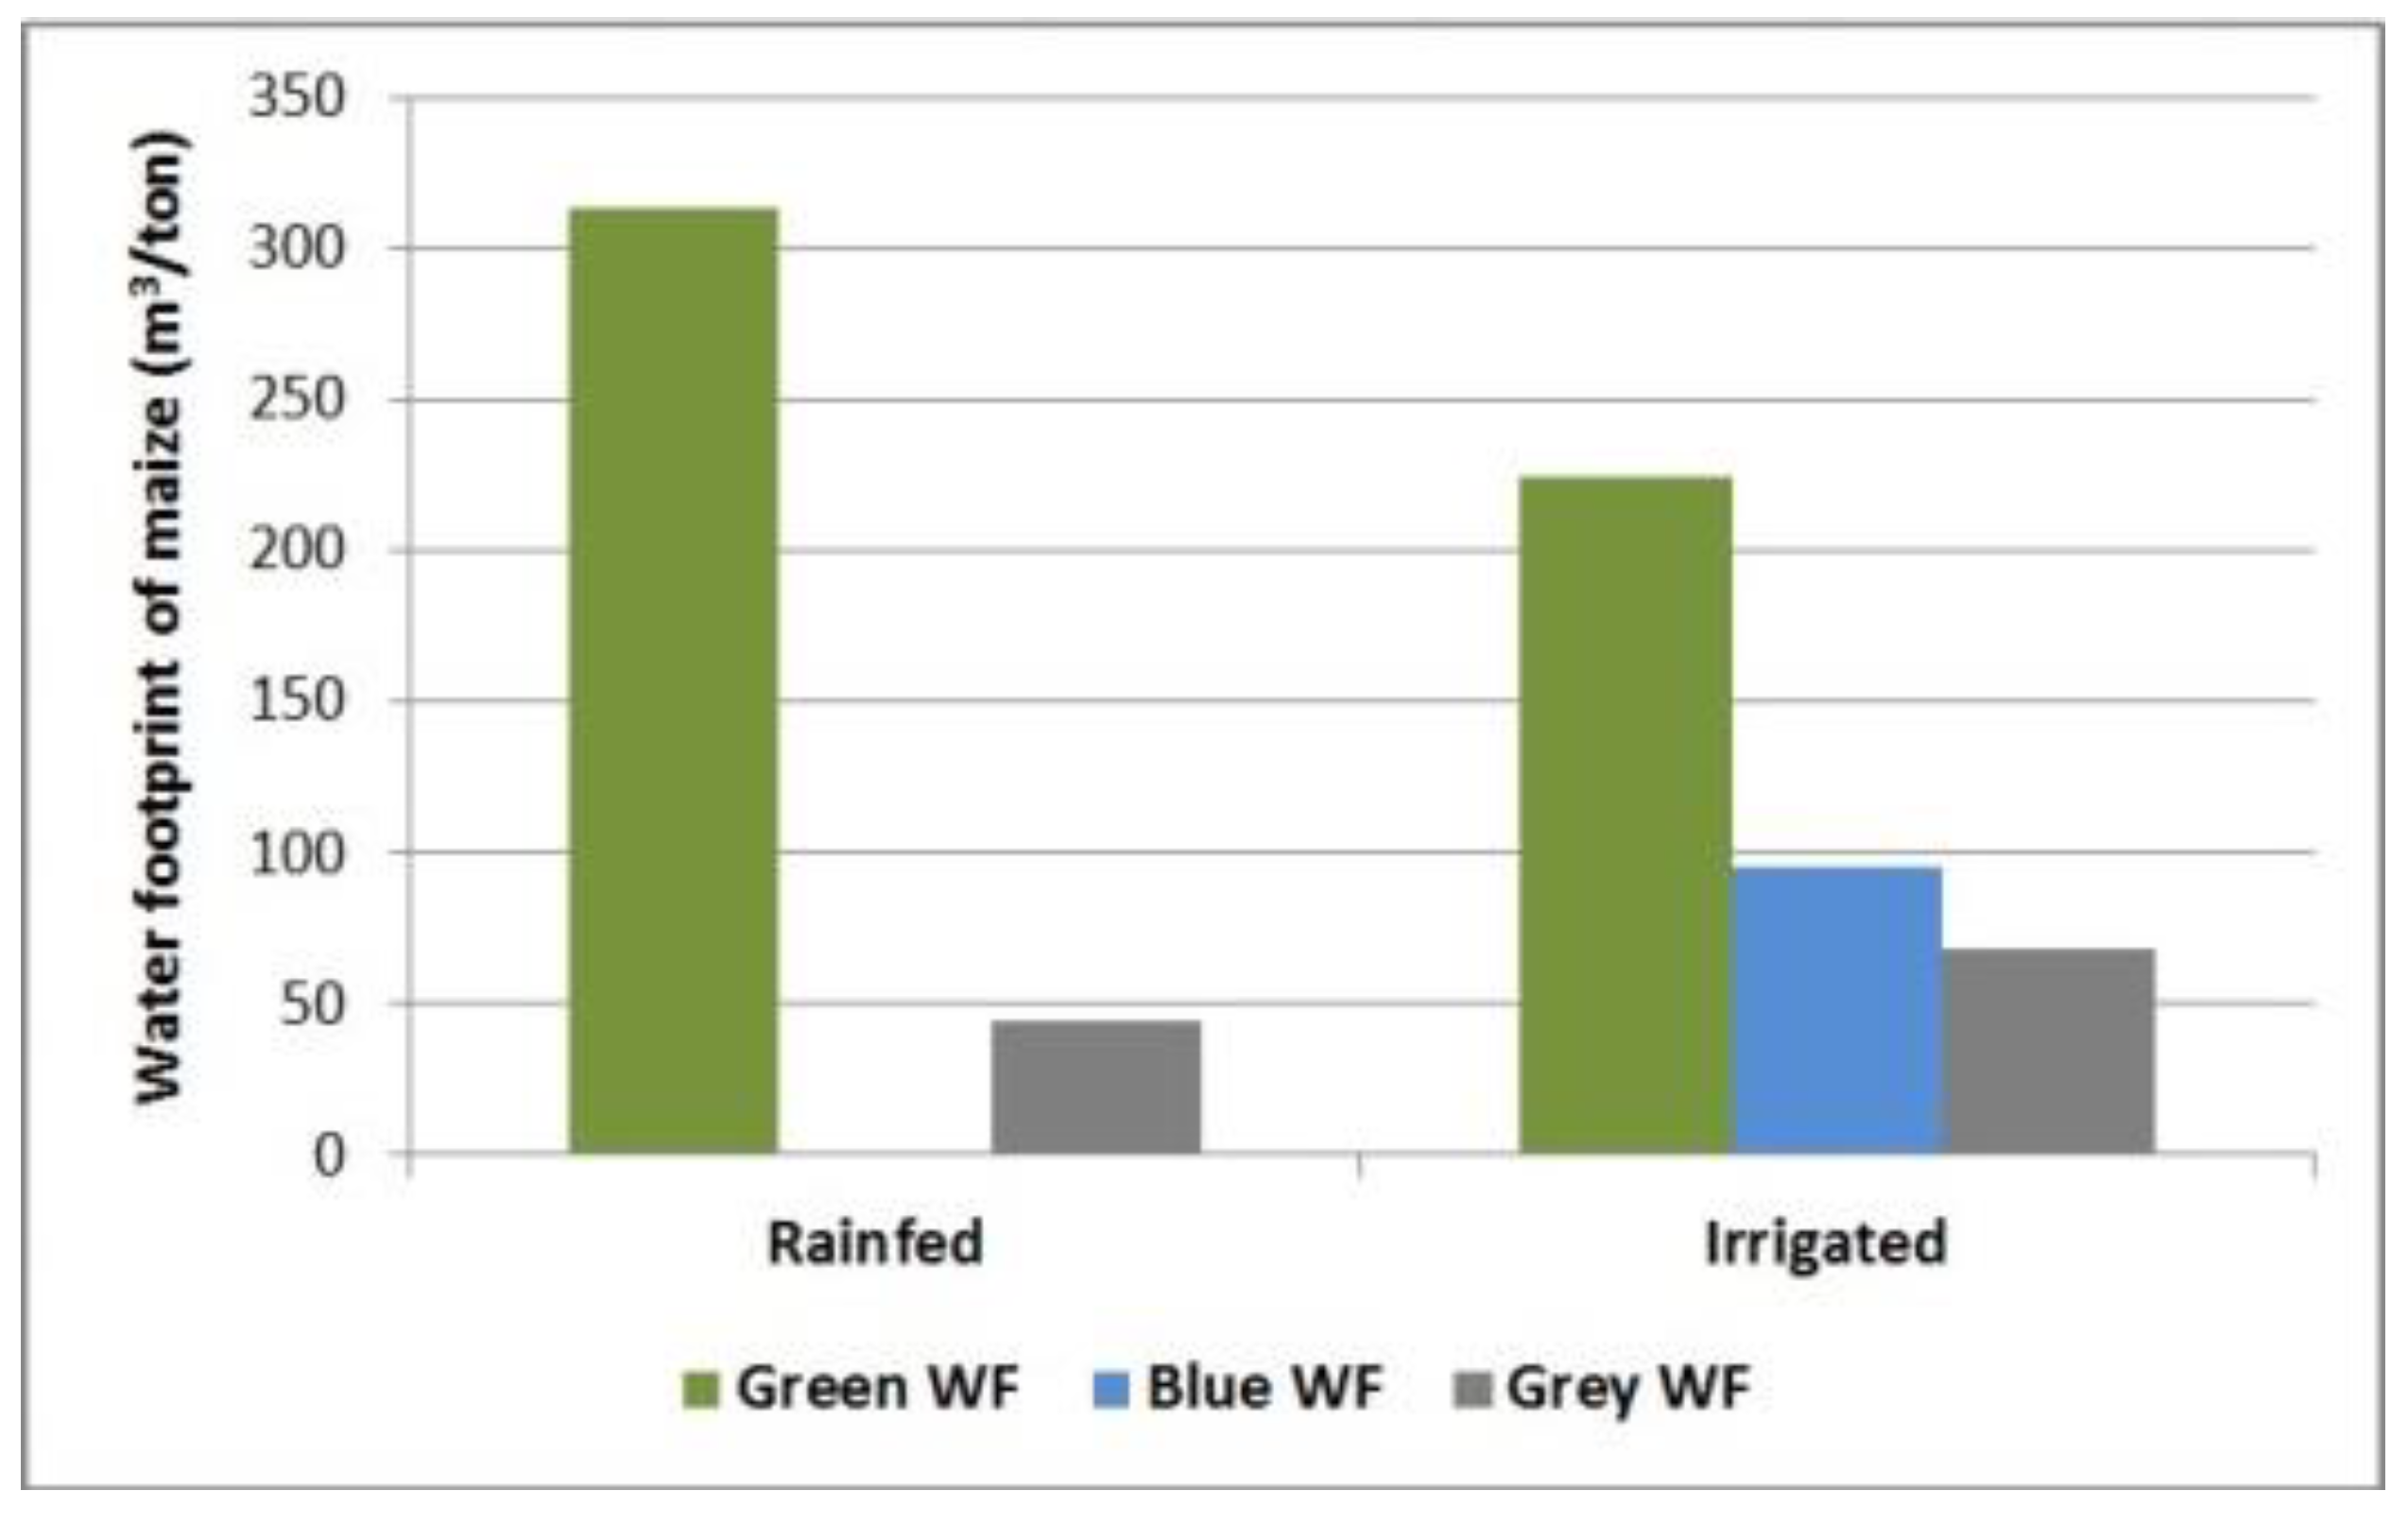
The green water use for maize in the basin reached 2353 m3/ha. Considering the yields, the green water footprint amounted to 314 m3/ton and 224 m3/ton for rainfed and irrigated maize, respectively (Figure 8 and Table 4).

Figure 8.
Comparison of the water footprint components of rainfed and irrigated maize production in the Napaleofú basin in 2016–2017 (m3/ton): green water footprint (Green WF), blue water footprint (Blue WF), and grey water footprint (Grey WF).
Table 4.
Green, blue, and grey water footprint (WF) in rainfed and irrigated maize production, and variations between the two conditions in the Napaleofú basin.
The blue water use reached 1005 m3/ha and was determined by the effective irrigation supply, as not all the irrigation requirement was covered. The blue water footprint of maize in the basin was 96 m3/ton.
The grey water footprint, using a value of Cnat equal to zero, reached 44 m3/ton and 69 m3/ton in rainfed and irrigated maize, respectively (Figure 8 and Table 4), while the grey WF using a value of actual concentration (Cact) of 34 mg/L was 182 m3/ton in rainfed maize and 281 m3/ton in irrigated maize.
The total water footprint of maize (considering a Cnat equal to zero) amounted to 358 m3/ton in rainfed maize and 388 m3/ton in the irrigated crop (Table 4).
4. Discussion
4.1. Relevance of Green Water Exports from the Buenos Aires Province
The green water footprint values throughout the province of Buenos Aires ranged between 170 m3/ton and 730 m3/ton, with the highest values mostly to the south. This rise is due simultaneously to an increase in the green water use added to a decrease in crop yields towards the southern zone of the province, as a result of variations in rainfall (increasing towards the north) and soil features.
As for the virtual water exported by Buenos Aires province in the form of maize grain, the highest values correspond to the municipalities that produced and exported more tons during the analyzed crop season. The largest green water exports correspond to municipalities with higher water productivity (i.e., commodities with a small water footprint). Taking into account the water volumes needed to produce maize and the quantities exported, it is evident that Argentina and, in particular, the province of Buenos Aires, export not only maize, but also thousands of cubic meters of fresh water incorporated in the product that are not considered in its market price.
The green water export from Buenos Aires province of 2213 hm3 is similar to the total renewable water resources in Saudi Arabia (2400 hm3/year) and exceeds the amount of renewable water resources in Jordan (940 hm3/year) [57], both countries importing maize from Argentina.
Green water generally has a lower opportunity cost than blue water. This research highlights the importance of green water in global water and food security through maintaining rainfed crop production. The efficient use of green water would allow an increase in food production in rainfed agriculture systems, and a reduction in agriculture in irrigated areas highly dependent on blue water [5,58,59].
Argentina is one of the world’s leading producers and exporters of maize, and the province of Buenos Aires has a relevant role in such production and trade. It can be observed that maize exports are mainly directed to countries with water or territorial limitations which, by importing this cereal, externalize their environmental impacts of pollution of water resources through the application of fertilizers, and generate water savings. Green water importing countries generate water savings by not producing a water-intensive crop in their territory through the use of irrigation, but by importing this from other areas as already pointed out by previous studies [5], and also make their scarce blue water resources available for other uses.
While Argentina exports half of its production, it is notable that the main utilization of maize in the importing countries is for animal feed. More than half of the maize is used for animal feed in Saudi Arabia (89% of total use), Korea (68%), Vietnam (66%), Egypt (66%), and Brazil (53%). South Africa allocates similar percentages to human food (38%) and animal feed (41%) [11].
4.2. Water Footprint at Basin Level
In the Napaleofú basin, the results indicate that the total WF of irrigated maize is 8.5% higher than under rainfed conditions. The difference is due to the conjunction of irrigation water and the increase in nitrogen fertilization that each have an impact on the values of blue and grey water footprints. In both production systems, the main WF component is green, which means that production is mostly based on rainwater. This situation shows that not only this basin, but also the province of Buenos Aires has comparative advantages in maize production, compared to other regions and countries that base their production on blue water under water scarcity conditions.
The blue component in the irrigated crop harvested in Napaleofú basin accounts for 24.6% of the total WF, while grey water increases due to the application of 2.16 times more fertilizers in this condition than in rainfed crops. The water footprint indicator shows that agricultural intensification, caused by the use of irrigation together with the application of nitrogen fertilizer, determines a rise in cereal productivity at the expense of an increase in the appropriation of fresh water. This analysis allows recognizing the importance of the agricultural practices used in each crop modality on its water footprint and demonstrates the favorable conditions of the entire analyzed area for rainfed maize production.
Using a value of Cnat equal to zero may be leading to an underestimation of the grey water footprint, and therefore the water assimilation capacity for nitrate would be overestimated. By using the actual value of nitrogen concentration in water we would be looking at the remaining assimilative capacity of the water body, and therefore would be probably overestimating the grey water footprint.
In general terms, the results agree with what has been obtained in other research developed in Argentina, regarding the green and blue [5] and grey components [31].
The use of local data would reduce the margins of error, and would not lead to under- or over-estimation of the results. By performing the calculation at basin level, more specificity can be obtained in the results being able to detect variations of the indicator.
4.3. Contributions to Water Management at Basin Level in the Province of Buenos Aires
The basin has been recognized as a practical hydrological unit for water resources management. Although the policies for the use and protection of water resources are set by national governments, when policies are implemented at the basin scale there is the opportunity to deliver whole basin solutions and to resolve controversies [60].
Argentina’s legal framework establishes that the provinces own the water resources and have jurisdiction over them. The province of Buenos Aires has the Water Code, from 1999, which creates the Water Authority as the institution in charge of water resources management. The Water Code promotes the creation of basin committees and consortia. Although several basin committees have been created in the province, not all of them are currently working, and there are information gaps on water management along the province.
Due to this scarcity of information and the great territorial extension of the province, it is difficult to work in detail on a provincial scale, but it is possible to carry out studies in the different river or stream basins of the province.
As regards the temporal scale, it is important to consider long periods of time to evaluate the hydrological conditions of a basin or subbasin, and also consider the fluctuations and temporal variability and trends of water availability and use, moving beyond average values [61].
In this sense, the water footprint methodology generates the necessary information to develop policies for sustainability and integrated management of water resources, as this indicator makes it possible to quantify the volumes of water used, locate them geographically, and insert them in the context of world trade [9]. Furthermore, it is helpful to know the water footprints of different crops at a basin-level scale, so that science-based decisions can be made on which crops to grow and where it makes sense to grow them as the climate warms and populations rise.
For this reason, it is important to highlight the relevance of this type of study at basin level, as it provides precise and specific data, generating water-use information and highlighting the associated impacts, which makes possible an improved water resources management in the basin. The study at the local scale allows us to see processes that prevail and determine patterns that are not visible at larger scales.
5. Conclusions
This study is one of the few studies that assesses the water footprint of maize production in Argentina, and the first one in the Buenos Aires province and at the basin level. Maize production mainly uses green water resources in the study regions.
The trade of virtual water can generate water savings in the importing countries and at a global level. The province of Buenos Aires has a comparative advantage by producing maize in rainfed conditions using green water, while countries with blue water shortages can import this commodity rather than producing it domestically, increasing water use efficiency on a global scale. However, nitrogen pollution as a byproduct of maize production needs to be further analyzed.
This shows the relevance as a basis and background to advance in the evaluation of the water footprint and virtual water trade of maize and other ‘thirsty crops’, whether for human consumption, livestock feed, oil generation, or bioenergy.
For future studies, it is relevant to deepen the assessment of the water footprint of different crops at the regional and local levels, and to extend the time scale of analysis, in order to consider the climate variability and trends.
Author Contributions
Conceptualization, M.M.A. (Maria Macarena Arrien) and C.I.R.; methodology, all authors; data analysis, M.M.A. (Maria Macarena Arrien) and C.I.R.; investigation, all authors; writing—original draft preparation, M.M.A. (Maria Macarena Arrien) and C.I.R.; writing—review and editing, M.M.A. (Maite M. Aldaya); supervision, M.M.A. (Maite M. Aldaya) and C.I.R.; and funding acquisition, M.M.A. (Maite M. Aldaya) and C.I.R. All authors have read and agreed to the published version of the manuscript.
Funding
This research has been carried out with the support of the National Agency for Scientific and Technological Promotion of Argentina (PICT 2017-0564). The participation of M.M. Arrien was possible through a grant from the Scientific Research Commission of the Province of Buenos Aires (CICPBA), Argentina. The project leading to these results has also received funding from “la Caixa” and Caja Navarra Foundation, under agreement LCF/PR/PR13/51080004.
Institutional Review Board Statement
Not applicable.
Informed Consent Statement
Not applicable.
Data Availability Statement
Not applicable.
Conflicts of Interest
The authors declare no conflict of interest.
References
- Hoekstra, A.Y. The hidden water resource use behind meat and dairy. Anim. Front. 2012, 2. [Google Scholar] [CrossRef]
- Willaarts, B.A.; Garrido, A.; de Stefano, L.; Llamas, M.R. Water and Food Security in Latin America and the Caribbean. Regional and Global Implications; Fundación Botín: Madrid, Spain, 2014. [Google Scholar]
- Food and Agriculture Organization for the United Nations (FAO). FAO Information Note on Cereal Supply and Demand, 3 September 2020. Available online: http://www.fao.org/worldfoodsituation/csdb/es/ (accessed on 19 October 2020).
- Food and Agriculture Organization for the United Nations (FAO). Crop Prospects and Food Situation. World Quarterly Report N°4; FAO: Rome, Italy, 2019; Available online: http://www.fao.org/publications/card/es/c/CA7236ES/ (accessed on 19 October 2020).
- Aldaya, M.M.; Allan, J.A.; Hoekstra, A.Y. Strategic importance of green water in international crop trade. Ecol. Econ. 2010, 69, 887–894. [Google Scholar] [CrossRef] [Green Version]
- Chamorro, A.M.; Sarandón, S.J. Water: An essential resource for sustainable agriculture. Effect of technology, site quality and crop type on water use efficiency in Tres Arroyos, Argentina. Cuad. Agroecol. 2013, 8, 1–6. [Google Scholar]
- Hoekstra, A.Y. The water footprint: The relation between human consumption and water use. In The Water We Eat: Combining Virtual Water and Water Footprints; Antonelli, M., Greco, F., Eds.; Springer: Cham, Switzerland, 2015; pp. 35–48. [Google Scholar] [CrossRef]
- Food and Agriculture Organization for the United Nations (FAO). The State of the World’s Land and Water Resources for Food and Agriculture. Management of Systems at Risk; Food and Agriculture Organization for the United Nations: Rome, Italy; Mundi-Prensa: Madrid, Spain, 2011. [Google Scholar]
- Aldaya, M.M.; Niemeyer, I.; Zarate, E. Water and globalisation: Challenges and opportunities for better water resources management. Rev. Española Estud. Agrosoc. Pesq. 2011, 230, 61–63. [Google Scholar]
- Mekonnen, M.M.; Pahlow, M.; Aldaya, M.M.; Zarate, E.; Hoekstra, A.Y. Sustainability, efficiency and equitability of water consumption and pollution in Latin America and the Caribbean. Sustainability 2015, 7, 2086–2112. [Google Scholar] [CrossRef] [Green Version]
- Agricultural Market Information System (AMIS). Market Database. Supply and Demand Overview. Available online: https://app.amis-outlook.org/#/market-database/supply-and-demand-overview (accessed on 28 October 2020).
- Agencia de Servicios a la Comercialización y Desarrollo de Mercados Agropecuarios (ASERCA). Panorama Mundial. Maíz. Gobierno de México. Available online: https://info.aserca.gob.mx/analisis/panmundial/panmundial-20190919.pdf (accessed on 28 October 2020).
- Food and Agriculture Organization for the United Nations (FAO). Global Information and Early Warning System (GIEWS). Country BRIEFS: Argentina. Available online: http://www.fao.org/giews/countrybrief/country.jsp?code=ARG&lang=es (accessed on 26 October 2020).
- Southern Agricultural Council (CAS). The Maize Market in the CAS Countries. Available online: http://consejocas.org/wp-content/uploads/2014/03/libro_maiz_cas.pdf (accessed on 22 October 2020).
- Ministry of Agriculture, Livestock and Fisheries of Argentina. Agricultural Estimates. Available online: http://datosestimaciones.magyp.gob.ar/reportes.php?reporte=Estimaciones (accessed on 22 October 2020).
- Marano, R. Study of the effects on a silage maize crop grown in an argiudol with four years of supplementary irrigation. In Proceedings of the 1st Reunión Internacional de Riego, INTA EEA, Manfredi, Argentina, 18–20 June 2008; Available online: https://inta.gob.ar/documentos/estudio-de-efectos-sobre-un-cultivo-de-maiz-para-silo-implantado-en-un-argiudol-con-cuatro-anos-de-riego-suplementario (accessed on 9 November 2020).
- Dickie, M.J.; Coronel, A. Statistical relationship between maize yields and the occurrence of water deficiencies in the department of Rosario. Rev. Investig. Fac. Cienc. Agrar. 2018, 31, 17–24. [Google Scholar]
- Mekonnen, M.M.; Hoekstra, A.Y. The green, blue and grey water footprint of crops and derived crop products. Hydrol. Earth Syst. Sci. 2011, 15, 1577–1600. [Google Scholar] [CrossRef] [Green Version]
- Falkenmark, M.; Rockström, J. Balancing Water for Humans and Nature: The New Approach in Ecohydrology; Earthscan: London, UK, 2004. [Google Scholar]
- Hoekstra, A.Y.; Chapagain, A.K. Globalization of Water: Sharing the Planet’s Freshwater Resources; Blackwell Publishing: Oxford, UK, 2008. [Google Scholar] [CrossRef] [Green Version]
- Chapagain, A.; Hoekstra, A.Y. Water Footprints of Nations; Value of Water Research Report Series, No. 16; UNESCO-IHE: Delft, The Netherlands, 2004. [Google Scholar]
- Chapagain, A.K.; Hoekstra, A.Y.; Savernake, H.H.G.; Gautam, R. The water footprint of cotton consumption: An assessment of the impact of world wide consumption of cotton products on the water resources in the cotton producing countries. Ecol. Econ. 2006, 60, 186–203. [Google Scholar] [CrossRef]
- Rodríguez Casado, R.; Garrido Colmenero, A.; Llamas Madurga, M.R.; Varela Ortega, C. The water footprint of Spanish agriculture. Pap. Agua Virtual 2008, 2, 1–38. [Google Scholar]
- Mekonnen, M.M.; Hoekstra, A.Y. A global and high-resolution assessment of the green, blue and grey water footprint of wheat. Hydrol. Earth Syst. Sci. Discuss. 2010, 7, 2499–2542. [Google Scholar] [CrossRef] [Green Version]
- Mekonnen, M.M.; Hoekstra, A.Y. The Green, Blue and Grey Water Footprint of Farm Animals and Animal Products; Value of water Research Report Series Nº 48; UNESCO-IHE: Delft, The Netherlands, 2010. [Google Scholar]
- Nana, E.; Corbari, C.; Bocchiola, D. A model for crop yield and water footprint assessment: Study of maize in the Po valley. Agric. Syst. 2014, 127, 139–149. [Google Scholar] [CrossRef]
- Arévalo, D.; Lozano, J.; Sabogal, J. National study of Colombia’s water footprint in the agricultural sector. Rev. Int. Sostenibilidad Tecnol. Humanismo 2011, 6, 101–126. [Google Scholar]
- Del Mercado Arribas, R.V.; Rodríguez, M.O.B. Latin America’s water footprint: Challenges and opportunities. Aqua LAC 2012, 4, 41–48. [Google Scholar]
- Solange, I. Assessment and Analysis of the Water Footprint and Virtual Water Footprint of Agricultural Production in Ecuador. Bachelor’s Thesis, Escuela Agrícola Panamericana Zamorano, San Antonio de Oriente, Honduras, 2012. [Google Scholar]
- Hoekstra, A.Y.; Chapagain, A.K. Water footprints of nations: Water use by people as a function of their consumption pattern. In Integrated Assessment of Water Resources and Global Change; Craswell, E., Bonnell, M., Bossio, D., Demuth, S., van de Giesen, N., Eds.; Springer: Dordrecht, The Netherlands, 2006. [Google Scholar] [CrossRef]
- Government of the Province of San Luis. Calculation and Analysis of the Water Footprint of the Province of San Luis. Agricultural and Livestock Sectors. 2014. Available online: http://www.huellahidrica.org/Reports/Calculo%20Huella%20Hidrica.pdf (accessed on 17 February 2021).
- Rodríguez, C.I.; de Galarreta, V.A.R.; Kruse, E.E. Analysis of water footprint of potato production in the pampean region of Argentina. J. Clean. Prod. 2015, 90, 91–96. [Google Scholar] [CrossRef]
- Olivera Rodriguez, P.; Holzman, M.E.; Degano, M.F.; Faramiñán, A.M.G.; Rivas, R.E.; Bayala, M.I. Spatial variability of the green water footprint using a medium-resolution remote sensing technique: The case of soybean production in the Southeast Argentine Pampas. Sci. Total. Environ. 2021, 763, 142963. [Google Scholar] [CrossRef] [PubMed]
- Mateucci, S.D. Pampas Ecoregion. In Ecoregions and Ecosystem Complexes in Argentina; Morello, J., Matteucci, S.D., Rodríguez, A.F., Silva, M.E., Eds.; Orientación Gráfica Editora: Buenos Aires, Argentina, 2012; pp. 261–278. [Google Scholar]
- Cravero, S.A.C.; Bianchi, C.L.; Elena, H.J.; Bianchi, A.R. Climate of Argentina: Monthly Digital Maps of Precipitation and Precipitation Minus Potential Evapotranspiration: Addendum to the Digital Climate Atlas of the Argentine Republic; Ediciones INTA: Salta, Argentina, 2017. [Google Scholar]
- Senisterra, G.; Gaspari, F.; Delgado, M.I. Zoning of environmental vulnerability in a rural mountain basin. Rev. Estud. Ambient. 2015, 3, 38–58. [Google Scholar]
- Senisterra, G.; Rodríguez Vagaría, A.; Gaspari, F.; Mazzucchelli, G. Morphometric aspects of the upper basin of the Napaleofú stream, province of Buenos Aires-Argentina. Rev. Geográfica Venez. 2014, 55, 287–303. [Google Scholar]
- National Institute of Agricultural Technology (INTA). Soils Map of the Province of Buenos Aires (scale 1:500.000), 1989. Buenos Aires-Argentina. Available online: http://anterior.inta.gov.ar/suelos/cartas/3760/Napaleofu/ (accessed on 21 October 2020).
- National Institute of Agricultural Technology (INTA). Soil Atlas of the Argentine Republic; SAGyP-INTA: Buenos Aires, Argentina, 1990. [Google Scholar]
- National Meteorological Service (SMN). Download the SMN Open Data Catalog. Available online: https://www.smn.gob.ar/descarga-de-datos (accessed on 14 September 2020).
- National Institute of Agricultural Technology (INTA). Agrometeorological Information and Management System. Available online: http://siga2.inta.gov.ar/#/ (accessed on 14 September 2020).
- Ministry of Treasury. National Directorate of Provincial affairs: Provincial and Municipal Economic Information. Available online: http://www2.mecon.gov.ar/hacienda/dinrep/mapas/mapa2017.php (accessed on 26 October 2020).
- Food and Agriculture Organization for the United Nations (FAO). FAOSTAT Database, Rome, Italy. Available online: http://www.fao.org/faostat/es/#home (accessed on 19 October 2020).
- Hoekstra, A.Y.; Chapagain, A.K.; Aldaya, M.M.; Mekonnen, M.M. The Water Footprint Assessment Manual: Setting the Global Standard; Earthscan: London, UK, 2011. [Google Scholar] [CrossRef]
- Food and Agriculture Organization for the United Nations (FAO). CROPWAT 8.0 Model, FAO, Rome. Available online: http://www.fao.org/land-water/databases-and-software/cropwat/es/ (accessed on 1 September 2020).
- Allen, R.G.; Pereira, L.S.; Raes, D.; Smith, M. Crop. Evapotranspiration. Guidelines for Computing Crop Water Requirements; FAO Irrigation and Drainage Paper Nº 56; FAO: Rome, Italy, 1998. [Google Scholar]
- Doorenbos, J.; Kassam, A.H.; Bentvelsen, C.L.M.; Branscheid, V.; Plusjé, J.M.G.A.; Smith, M.; Uittenbogaard, G.O.; van Der Val, H.K. Yield Response to Water; FAO Irrigation and Drainage Paper Nº 33; FAO: Rome, Italy, 1979. [Google Scholar]
- Falasca, S.L.; Ulberich, A. The water available from the soils of southeastern Buenos Aires, Argentine Republic. Rev. Geográfica 2006, 2, 5–15. [Google Scholar]
- National Institute of Agricultural Technology (INTA). Crops by Province. What to Sow and Harvest in Each Month? Available online: https://public.tableau.com/profile/gabi.ta1236#!/vizhome/Cultivosxprovincia/Cultivosporprovincias (accessed on 25 September 2020).
- Chapagain, A.K.; Orr, S. An improved water footprint methodology linking global consumption to local water resources: A case of Spanish tomatoes. J. Environ. Manag. 2009, 90, 1219–1228. [Google Scholar] [CrossRef] [PubMed]
- Doorenbos, J.; Pruitt, W.O. Guidelins for Predicting Crop Water Requirements; FAO Irrigation and Drainage Paper Nº 24; FAO: Rome, Italy, 1977. [Google Scholar]
- Falasca, S.L.; Forte Lay, J.A.; Bernabé, M.A. Simulation of the complementary irrigation needs of a sector of the municipality of Tandil, Argentine Republic. Rev. Bras. de Agrometeorol. 2002, 10, 333–342. [Google Scholar]
- Rodríguez, C.I. Planning of Complementary Irrigation for Potato Production, in Tandil District. Bachelor’s Thesis, Universidad Nacional del Centro de la Provincia de Buenos Aires, Buenos Aires, Argentina, 2005. [Google Scholar]
- Franke, N.A.; Boyacioglu, H.; Hoekstra, A.Y. Grey Water Footprint Accounting: Tier 1 Supporting Guidelines; Value of Water Research Report Series Nº 65; UNESCO-IHE: Delft, The Netherlands, 2013. [Google Scholar]
- Argentine Food Code. Chapter XII: Water Drinks, Water and Aerated Water. Law 18.284, Argentina. Available online: http://www.anmat.gov.ar/alimentos/códigoa/CAPITULO_XII.pdf (accessed on 22 October 2020).
- Barranquero, R.S.; Varni, M.; de Galarreta, A.R.; Banda Noriega, R. Contribution of hydrochemistry to the conceptual model of the groundwater system. Tandil, Argentina. Geoacta 2012, 37, 130–146. [Google Scholar]
- Engelke, P.; Passell, H. From the Gulf to the Nile: Water Security in an Arid Region; Atlantic Council: Washington, DC, USA, 2017. [Google Scholar]
- Hoekstra, A.Y. Sustainable, efficient, and equitable water use: The three pillars under wise freshwater allocation. WIREs Water 2014, 1, 31–40. [Google Scholar] [CrossRef]
- Hoekstra, A.Y.; Chapagain, A.K.; van Oel, P.R. Advancing water footprint assessment research: Challenges in monitoring progress towards sustainable development goal 6. Water 2017, 9, 438. [Google Scholar] [CrossRef] [Green Version]
- Global Water Partnership (GWP); International Network of Basin Organizations (INBO). A Handbook for Integrated Water Resources Management in Basins; Global Water Partnership GWP: Stockholm, Sweden; International Network of Basin Organizations INBO: Paris, France, 2009. [Google Scholar]
- Aldaya, M.M.; Custodio, E.; Llamas, R.; Fernández, M.F.; García, J.; Ródenas, M.A. An academic analysis with recommendations for water management and planning at the basin scale: A review of water planning in the Segura River Basin. Sci. Total. Environ. 2019, 662, 755–768. [Google Scholar] [CrossRef] [PubMed]


Publisher’s Note: MDPI stays neutral with regard to jurisdictional claims in published maps and institutional affiliations. |
© 2021 by the authors. Licensee MDPI, Basel, Switzerland. This article is an open access article distributed under the terms and conditions of the Creative Commons Attribution (CC BY) license (https://creativecommons.org/licenses/by/4.0/).