Article

Seasonal and Long-Term Connections between Trophic Status, Sestonic Chlorophyll, Nutrients, Organic Matter, and Monsoon Rainfall in a Multipurpose Reservoir

Department of Bioscience and Biotechnology, Chungnam National University, Daejeon 34134, Korea
*
Author to whom correspondence should be addressed.
Indicates equal first authors.
Water 2021, 13(13), 1720; https://doi.org/10.3390/w13131720
Submission received: 29 April 2021 / Revised: 11 June 2021 / Accepted: 15 June 2021 / Published: 22 June 2021

Abstract

:
Due to rapid eutrophication, sustainable water quality management and supply are essential in drinking water sources and aquatic biota in large reservoirs. We evaluated the potentially crucial factors influencing the algal chlorophyll (CHL-a), nutrients, and the links between the rainfall and other vital elements in a large multipurpose reservoir (Yongdam Reservoir) during 2013–2019. We developed the empirical models on algal CHL-a, total phosphorus (TP), total nitrogen (TN), and TN:TP’s ambient ratios considering the maneuvering influence of Asian monsoons. The intensive rainfall during the monsoon months strongly impacted the nutrient regime and other vital factors. The seasonal patterns of algal CHL-a varied in response to the nutrient contents (TN, TP), suspended solids, and ambient N:P ratios along the longitudinal gradient. The conditional plot analysis, empirical modeling, and observations supported an overall P-limitation scenario, as was evident from the magnitude of N:P ratios (R2 = 0.36, F = 24.9, p < 0.001). Furthermore, the reservoir’s trophic status alluded to the larger particles and blue-green algae during the monsoon and postmonsoon months. The correlation analysis, Mann–Kendall trend test, and principal component analysis illustrated compelling links between CHL-a, TP, and rainfall regime. The outcomes suggested the reservoir was primarily controlled by phosphorus limitation, with an increasing CHL-a tendency along with nitrogen dilution. However, a slight decline in phosphorus was also detected. The Yongdam Reservoir is under the threat of recurrent eutrophication events that could jeopardize this vital drinking water facility due to increasing agricultural and anthropic activities.

1. Introduction

The drinking water supply crises tremendously challenge sustainable human society expansion due to global anthropogenic pollution [1,2,3]. Reports abound on the human-caused disturbances at the catchment scale (e.g., by extensive industrialization, urbanization, intensive agriculture) in the lentic ecosystems, resulting in various water quality issues [4,5,6]. One of the most conspicuous and long-term issues is consistent nutrient enrichment (eutrophication), causing significant water quality degradations in the lentic ecosystems [7,8,9]. Such nutrient-related dynamics are primarily determined by the anthropogenic discharges combined with the unobserved internal processes [10,11]. Nutrient enrichment causes uncontrolled phytoplankton growth with subsequent harmful algal blooms (HABs) events. The resultant impacts cause problems such as oxygen depletion, pH fluctuations, causing community-level shifts in the aquatic organisms, toxins from certain phytoplankton species [12], drinking water quality, fishery catch, and recreation [13,14]. Therefore, monitoring water quality in large and multipurpose reservoirs is essential by investigating the nutrient dynamics so that a sustainable water supply and resilient ecological health are maintained.
The human-made reservoir characteristics fall approximately at the intermediate level compared with rivers and natural lakes [15,16]. Their ecosystem functions more like natural lakes, whereas physicochemical components closely resemble riverine ecosystems. The structural dynamics are directly influenced by the longitudinal gradient, nutrients, light penetration, primary productivity, and water temperature along the reservoir gradient [17,18]. Most reservoirs’ upper reaches (riverine zone) are generally narrow and winding like the parent river. The pool is the most profound and broadest near the dam, creating lake conditions constituting the lacustrine zone. The transitional area, however, separates the lacustrine and riverine zones. Each of the reservoir zones is characterized by a variety of factors. For instance, deep areas with longer water residence time (WRT) show transparent and lower chlorophyll-a (CHL-a), organic matter, and nutrient (nitrogen and phosphorus) levels than shallow areas [19,20].
In Korean reservoirs, the hydrologic characteristics are predominantly determined by the intensity of the summer monsoon rainfall [21,22,23]. The monsoon precipitation is characterized by higher inflow and outflow rates, low WRT, and an overload of nutrients (organic matter) accompanied by runoff. Due to excessive external nutrient loading, heavy algal growth occurs during late summer and fall [21,24,25]. A similar pattern is shown in other Asian countries such as Malaysia, Pakistan, India, and China [26,27,28,29]. Several studies have also demonstrated internal nutrients (especially phosphorus) loading from geological cycling inversely influencing the seasonal water quality patterns [30,31,32,33,34]. That could be the potential factor preventing the rapid water quality improvements despite drastic reduction in the external nutrients loading in the lakes and reservoirs.
The regression analysis has shown that CHL-a illustrated a robust positive relationship with total phosphorus (TP) rather than total nitrogen (TN) like other temperate lentic systems [24,35,36]. However, several studies indicated that the regression lines sensitively alter summer monsoon events at the seasonal and annual (dry and drought years) scales [18,25]. However, sometimes there could be a case of co-linearity among the primary nutrients and CHL-a. Another way for determining nutrient limitation and eutrophication is the ambient ratios of TN and TP (TN:TP). Based on TN:TP ambient ratios, lentic ecosystems can be categorized as N-limitation, P-limitation, or co-limitation of N and P. For instance, if the ratio is more than 20, it indicates phosphorus limitation, whereas if it is lower than 10, it means a nitrogen limitation scenario, while co-limitation occurs when the ratio is between 10 and 20 [37,38]. Most studied lakes and reservoirs worldwide are typically determined in P-limitation conditions [12,22,39]. However, some studies indicated short-term N-limitation in lentic ecosystems in the USA and Nepal [29,40]. For instance, Morris and Lewis [40] found N-limitation during summer months in three of their eight study lakes in Colorado with the declining TN. The co-limitation was found in some reservoirs in the upland areas of Canada, Northern Ireland, and the USA [41,42,43].
The Yongdam Reservoir is typically a tributary-storage reservoir that is multipurpose. The multipurpose reservoirs are typically deep with longer WRT and are summer stratified, just like natural lakes [44,45]. Concentrations of nutrients, chlorophyll-a, suspended solids, organic matter, and water temperature are lower than other types of a reservoir [19,46]. They are often used for effective flood control as the desired features of increased dry season flow and decreased flood peak flow [44]. The Yongdam reservoir was constructed for several socio-economic purposes: domestic water supply, hydroelectric power generation, and flood control. It supplies an annual total of 492 million tons of water for human use in some cities on the western coast of South Korea. It generates 198 million kW of electricity per year. It has a flood control capability of 137 million tons for the Geum River’s mid- and downstream areas. Despite such significant socio-economic contributions, recent studies indicated that the upstream construction is influenced by longer WRT, higher nutrient loadings (N and P), and deposition of solids in the down-reservoir (Daecheong Reservoir), thereby modifying the algal response to the nutrients under changing flow regime [47]. The altered flow regime and water quality degradations in the reservoir impacted fish assemblages and the downstream river’s trophic status [48]. Therefore, interlinked zonal water quality assessment of the reservoir is more critical for linked riverine ecosystems and safe drinking water use.
The Yongdam reservoir is one of the leading freshwater sources for the inhabitants of the west-coast region in South Korea. It plays a larger role as a multipurpose reservoir and is a unique water body in several ways, including it being the tributary reservoir, a hub of hydroelectric generation, and greatly influenced by the artificial upstream reservoir where rainfall strongly impacts the water flow. It is of grander importance to investigate the ecological and drinking water quality that is equally presenting a lentic and lotic type of ecosystems. Therefore, the scientific hypothesis of our study included whether the spatio-temporal water quality patterns in Yongdam Reservoir and their relationships are changed along the longitudinal zonation of the reservoir during study period. We also investigated the seasonal and annual water quality trends and inter-relationship between a large set of water quality parameters. Furthermore, we hypothesized the seasonal trophic state and trophic state index deviations (TSID) along with the linear regression models to determine the spatio-temporal relationship between nutrients and CHL-a level. Additionally, we applied multivariate analytical techniques such as principal component analysis (PCA) and the non-parametric Mann–Kendall trend (MKT) test to evaluate the long-term trend of the water quality parameters in the system.

2. Materials and Methods
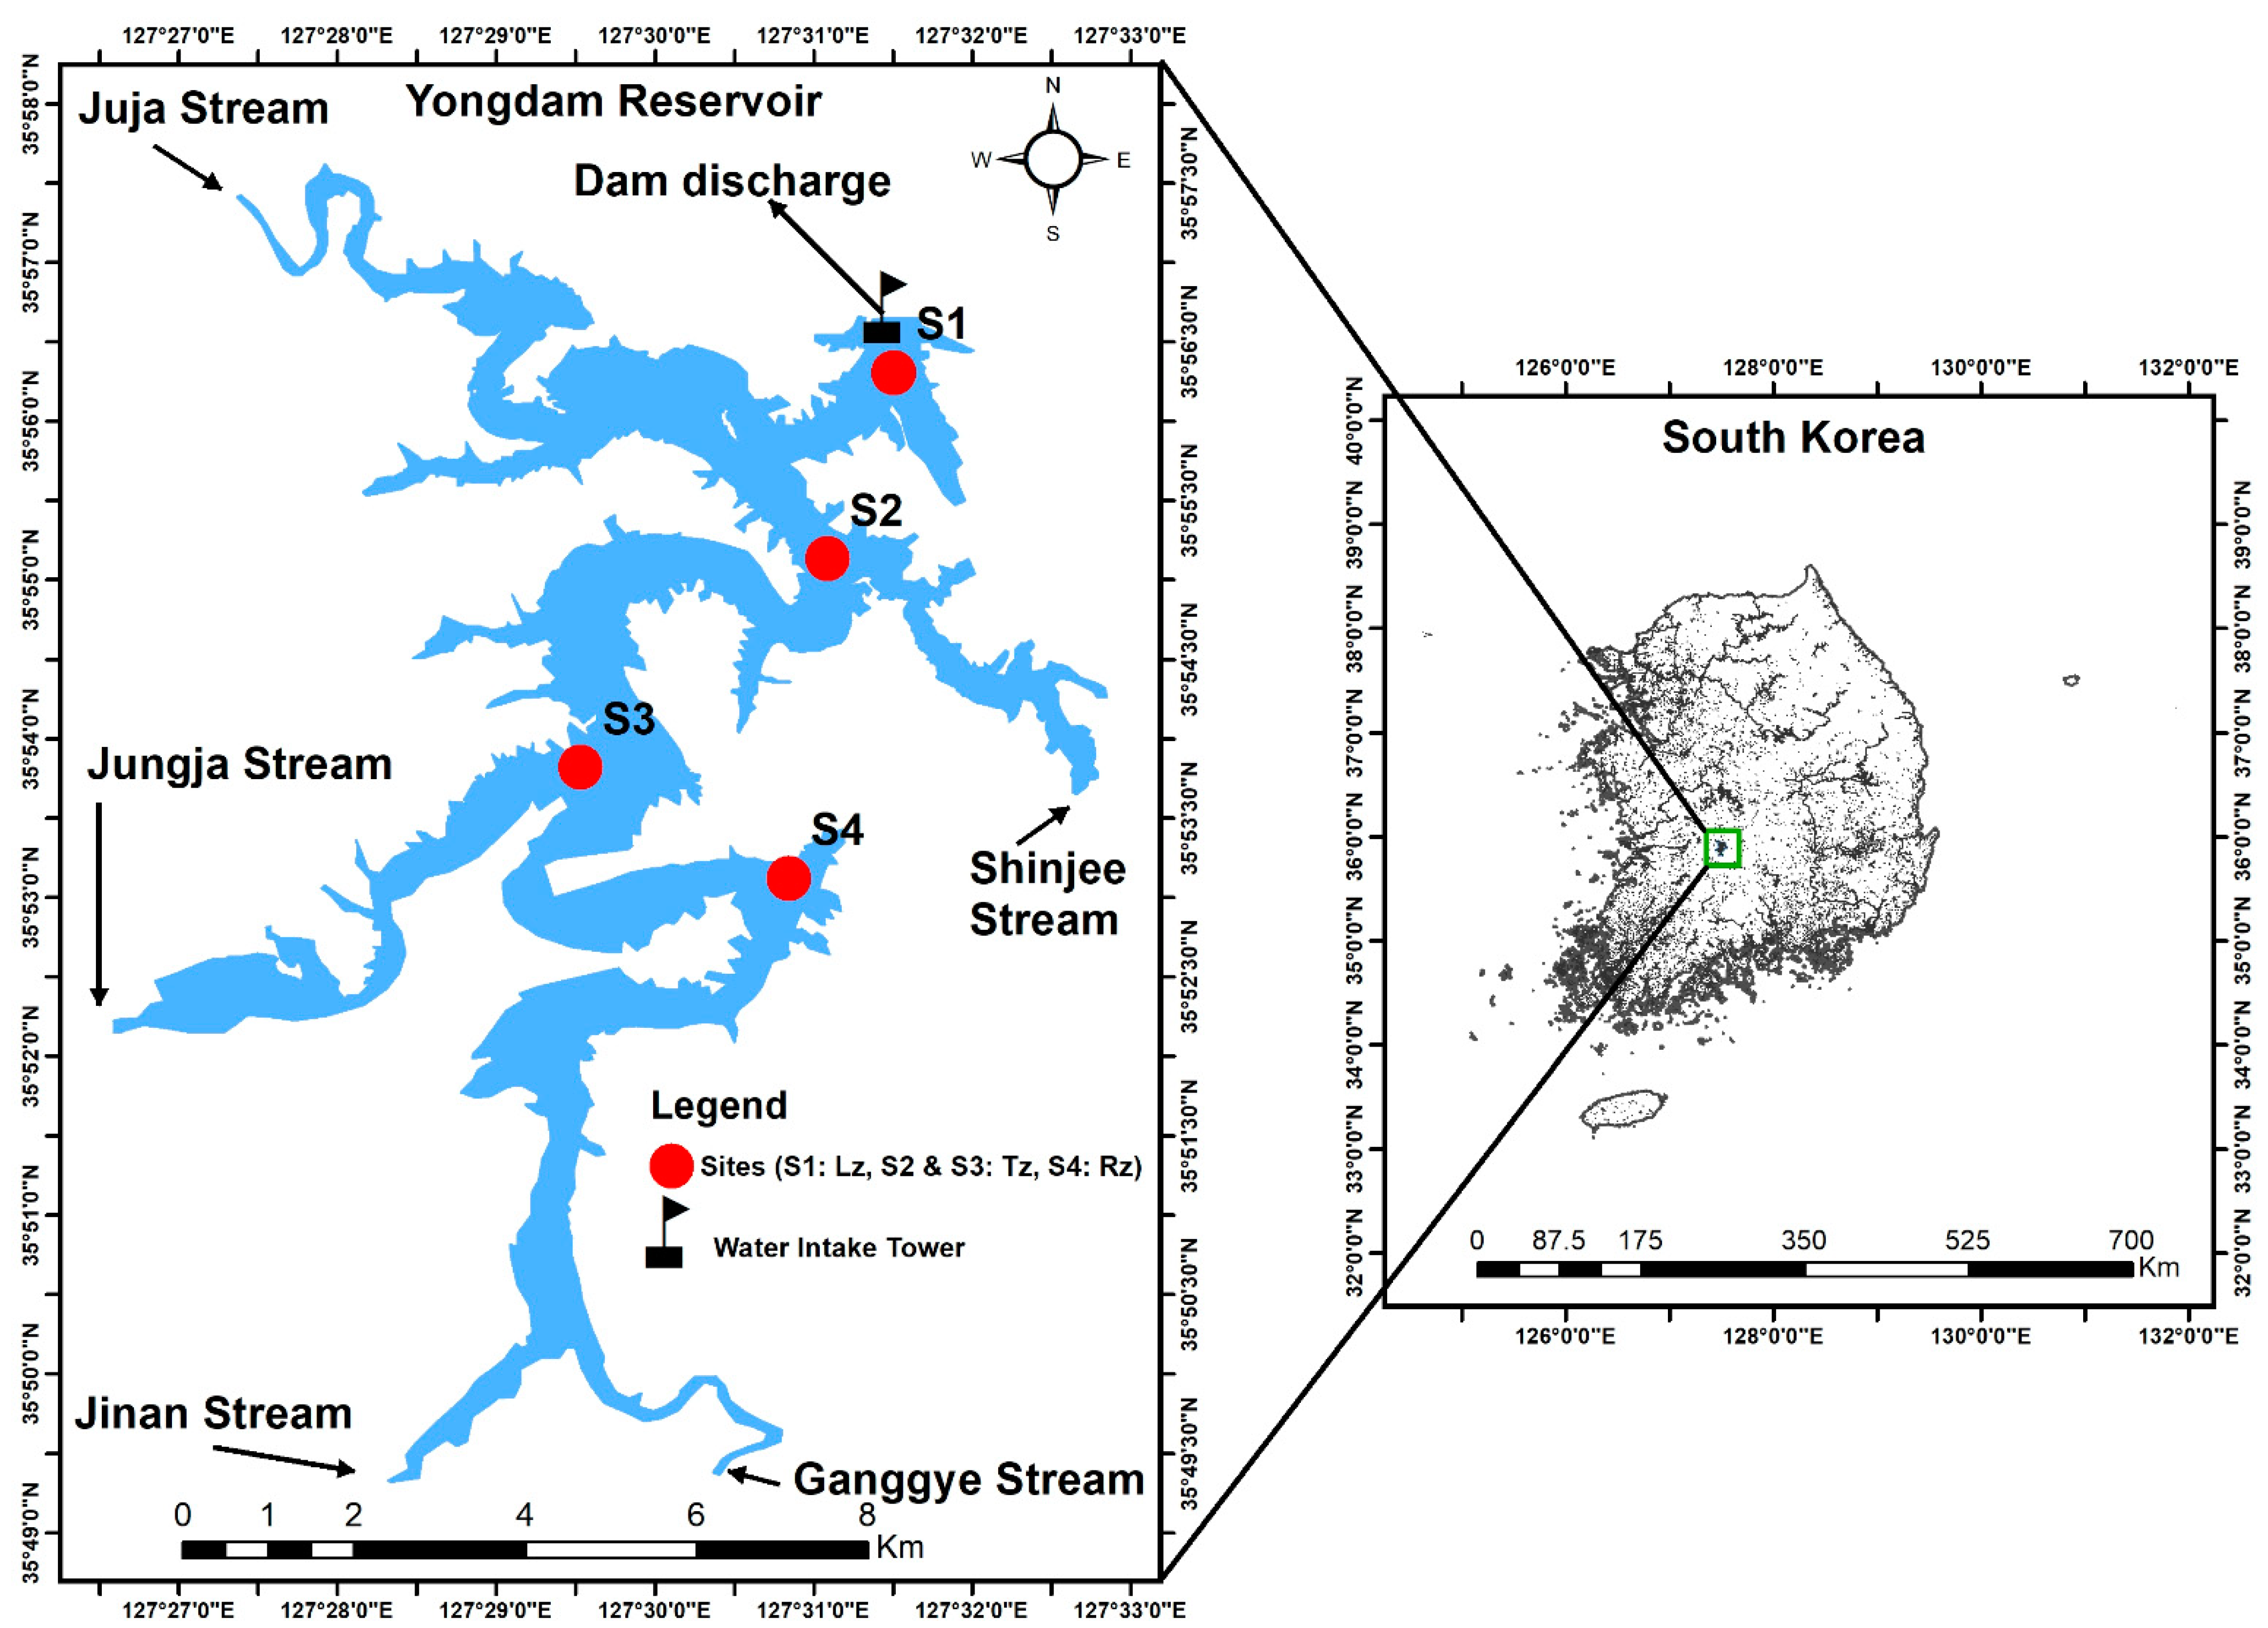
2.1. Study Area

The Yongdam dam is located upstream (127°31′40″ E, 35°56′30″ N) in the Geum River, which flows through the Midwest Korean Peninsula (Figure 1). The reservoir was constructed as a part of the Yongdam dam for flood control (flood control capacity: 137 million m3/year), for water supply to Jeonju city (700,000 m3/d with a planned increase to 1,050,000 m3/d), and hydropower generation (24,400 kW). The principal morphometric features of the Yongdam reservoir show it as a narrow and deep reservoir with a surface area of about 37 km2, a maximum width of 1 km, and a maximum depth of about 70 m. The reservoir terrain slope ranges from 2% to 45%, while the average slope is 15%. The reservoir has a retention time of 318 days and is fed by a catchment area of approximately 930 km2 with five tributaries. This constitutes 9.45% of the total basis area of the Geum River watershed. The reservoir catchment area’s land-use patterns consist mainly of forest (68%), agricultural (30%), and urban regions of 1.2%.

2.2. Sampling Sites

The monitoring sites explored for water quality evaluation are located at reasonable distances from each other and distinctly cover the longitudinal zones (riverine, transition and lacustrine) of Yongdam Reservoir (Figure 1). Site 1 (S1) was exactly located where the water intake tower is erected; therefore, it represents the lacustrine zone (Lz). Sites 2 and 3 (S2, S3) represented the transition zone (Tz), while the riverine zone (Rz) was mainly defined by site 4 (S4). The Yongdam reservoir is a dendritic-shaped reservoir that receives freshwater from various feeding stream channels.

2.3. Field Sampling and Rainfall Data

The reservoir’s monthly water quality data collected during 2013–2019, were procured from the Korean Ministry of Environment. The water samples of the given 17 variables were collected once per month from the four disparate sites related to the reservoir’s fluvial and lentic zone. We measured the water temperature (WT), conductivity (Cond), pH, dissolved oxygen (DO), and chlorophyll-a (CHL-a) in situ with multi-parameter water quality sensors (YSI Sonde Model 6600, YSI Incorporated Yellow Springs, OH, USA). Samples for nutrient analyses were stored in plastic water sample bottles. Rainfall and inflow data during 2013–2019 were obtained from the Korean Meteorological Administration.

2.4. Water Quality Analyses

Nutrients were analyzed by the standard methods of the Ministry of Environment, Korea (2000). Total phosphorus (TP) was determined using unfiltered water digested by the ascorbic acid method after persulfate oxidation. Orthophosphate (PO4-P) was investigated without digestion using filtered water based on the ascorbic acid method. Total dissolved phosphorus (TDP) was measured by the ascorbic acid method through filtered water digestion. Total nitrogen (TN) was determined by UV spectrophotometric method followed by a potassium sulfate digestion. Ammonia nitrogen (NH4–N) was investigated at 630 nm according to the phenate method after filtering the water through GF/C filters, and nitrate–nitrogen (NO3–N) was determined by the ion chromatography method after filtering the water. Organic matters indicators (BOD, COD, TOC), TSS, and chlorophyll-a (CHL-a) were measured by standard methods of APHA [49]. Total suspended solids (TSS) were determined after drying at 105 °C for one hour. Chlorophyll-a concentration was measured by using a spectrophotometer after extraction in ethanol [49]. The detailed water quality assessment methodology for all the tested parameters can be consulted from Atique and An [4].

2.5. Trophic Status Analysis

Natural and anthropogenic nutrient contributing factors primarily influence the trophic state of the lentic ecosystem. The trophic status was evaluated based on Carlson’s trophic state index (TSI), which integrates the leading trophic state indicators in the lakes and reservoirs. The TSI was individually calculated by using the natural log transformation (Ln) of algal CHL-a (µg/L), Secchi depth (SD, meters), and TP (µg/L) as per the following relations [50].
TSI (SD) = 60 − 14.41 Ln (SD)
TSI (CHL) = 30.6 − 9.81 Ln (CHL-a)
TSI (TP) = 14.42 Ln (TP) − 4.15

2.6. Statistical Analysis

We used the Kolmogorov–Smirnov check to normality in the dataset. The water chemistry factors and nutrients (CHL-a, TN, TP, TN:TP) were log-transformed for a normal distribution. We determined the seasonal and spatial variations of the water quality variables using analysis of variance (ANOVA) with the Kruskal–Wallis test, a non-parameter method. We applied various multivariate analytical techniques such as principal component analysis (PCA) and Mann–Kendall test (MKT) to identify the multiple links between the water chemistry factors. PCA helped to identify the data variance and while MKT illustrated the prevalent trends during the study duration. We used the conditional plotting method to testify the limiting nutrient(s) with the help of the R program. Correlation analysis was also performed in R studio to identify the prevalent links between the inflow, rainfall, and selected water quality parameters. The trophic state index deviation (TSID) was performed to see the dominant trophic condition in the reservoir identified based on seasonal rainfall patterns. Sigma Plot v. 12.5 (Systat Software Inc., San Jose, CA, USA) was used to perform the ANOVA, linear regression models, while we used PAST (ver. 4.3) for the principal component analysis (PCA).

3. Results and Discussion

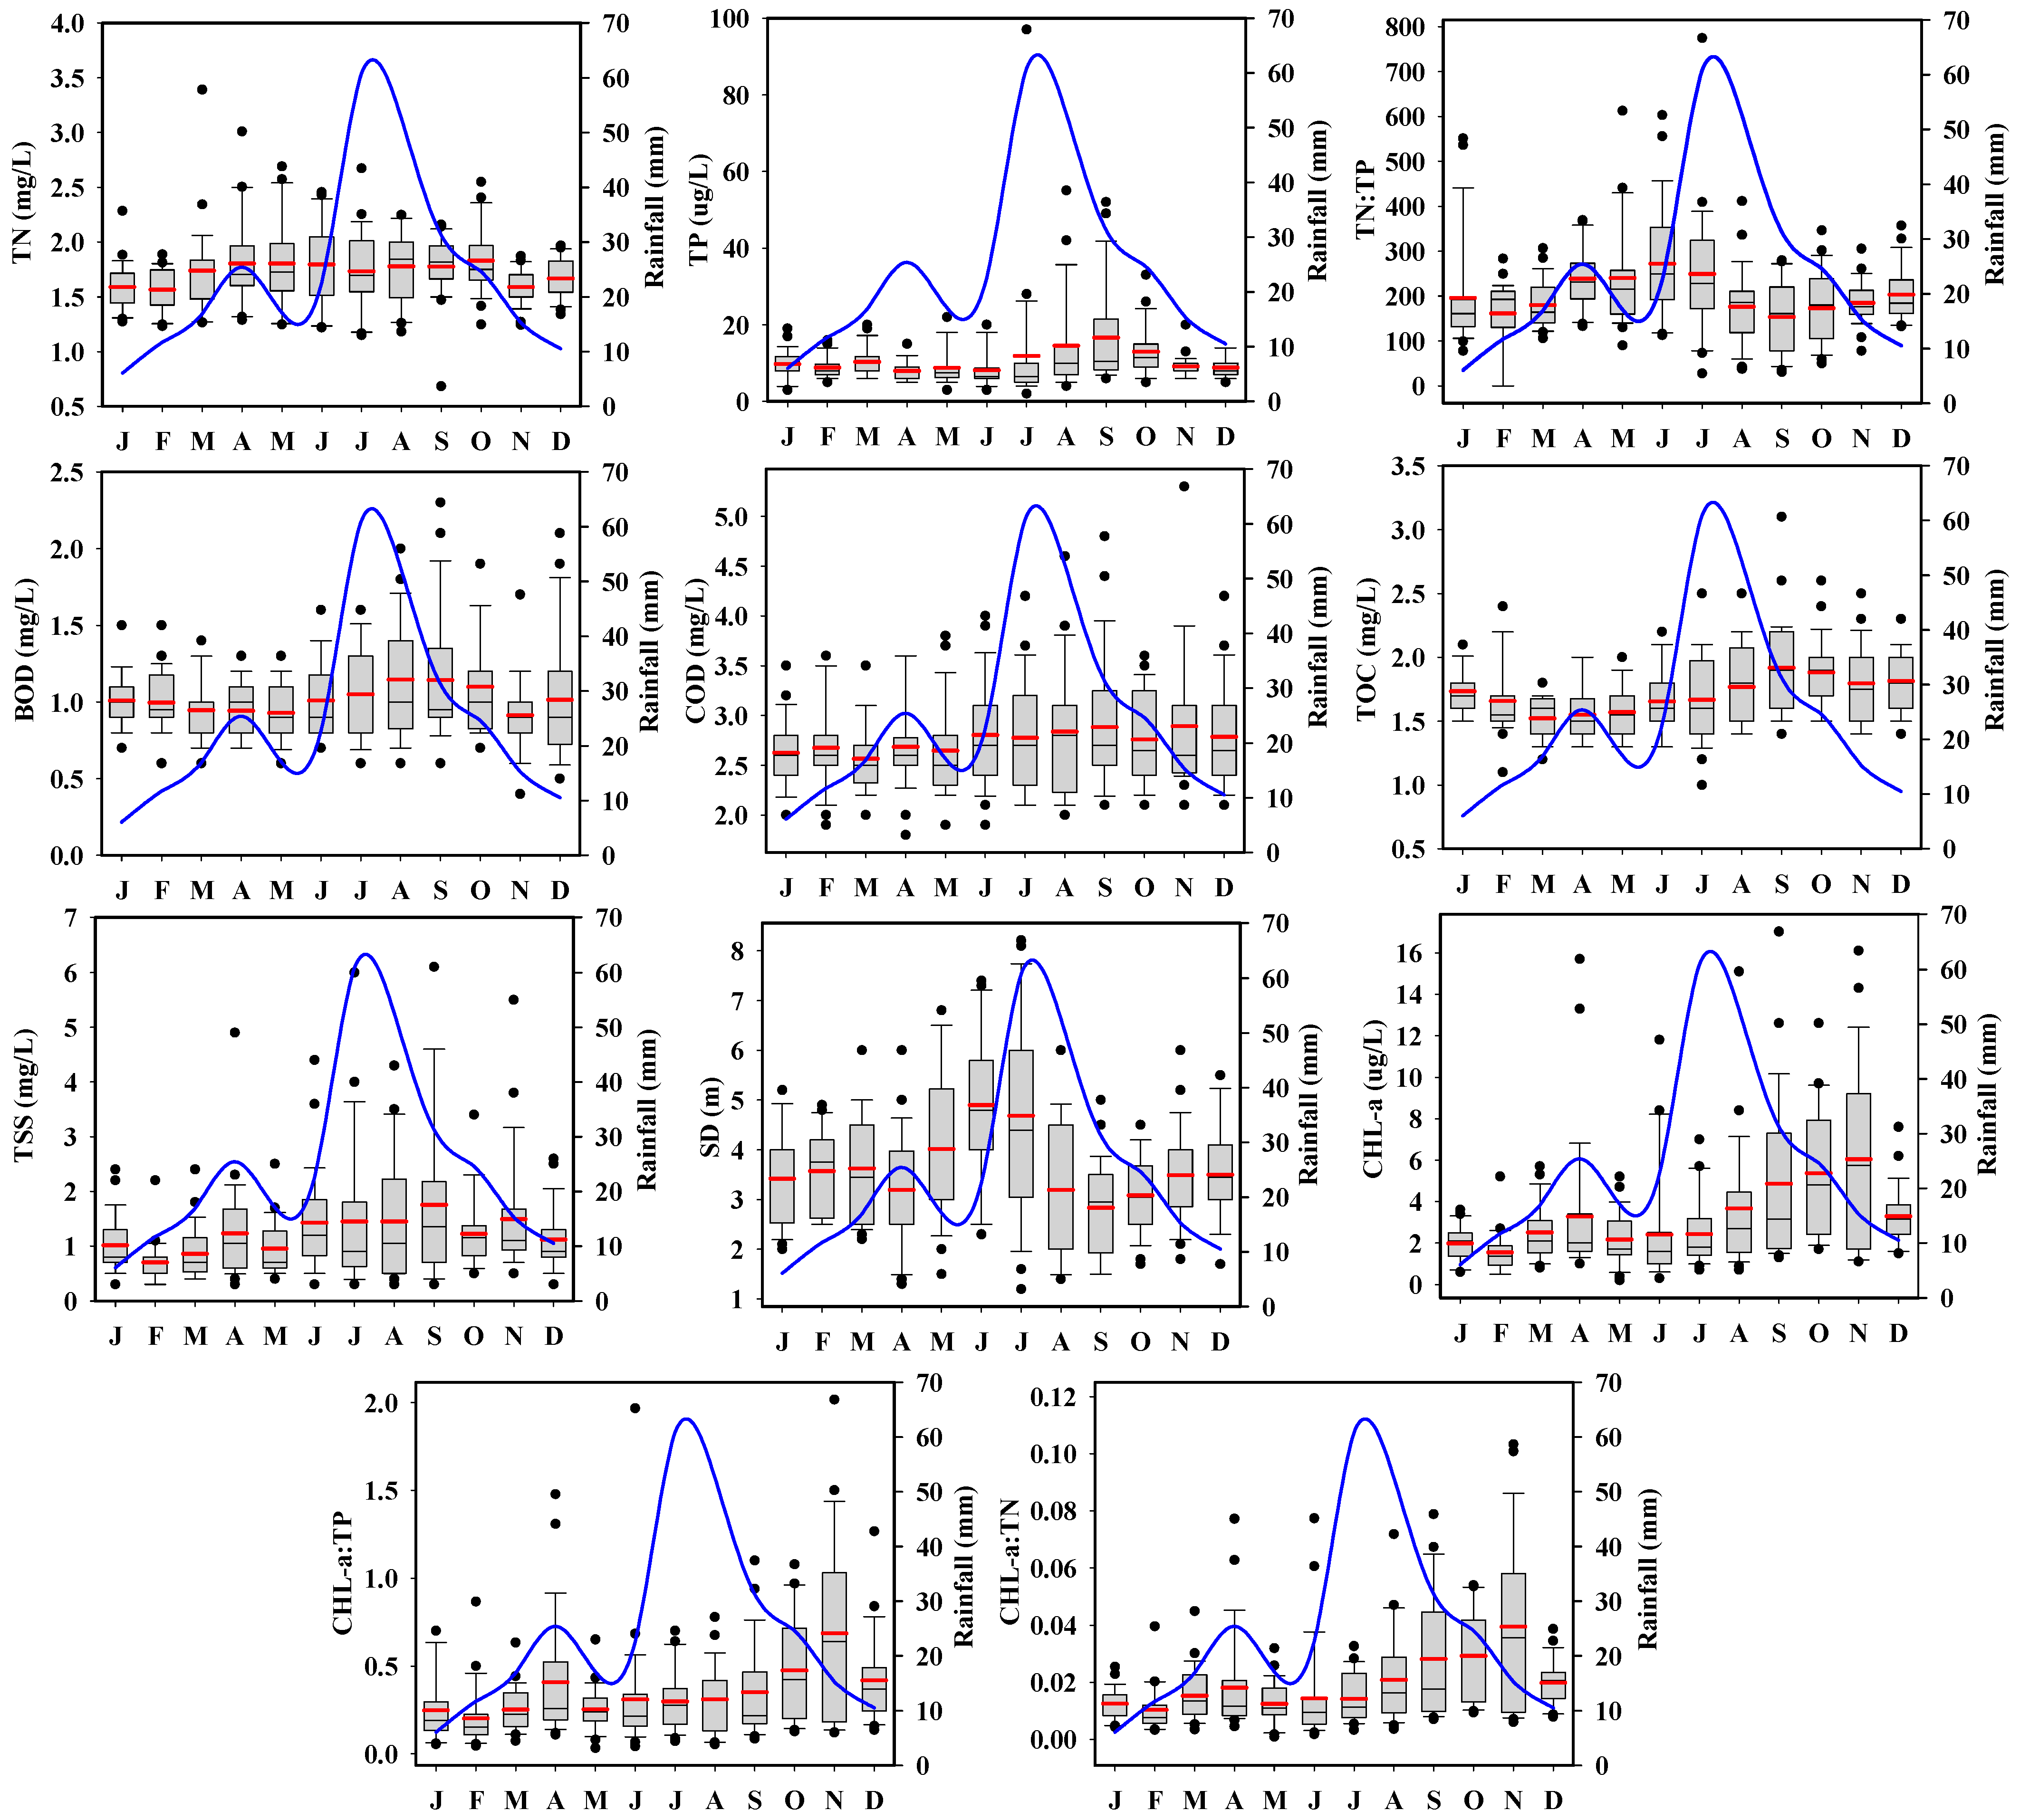
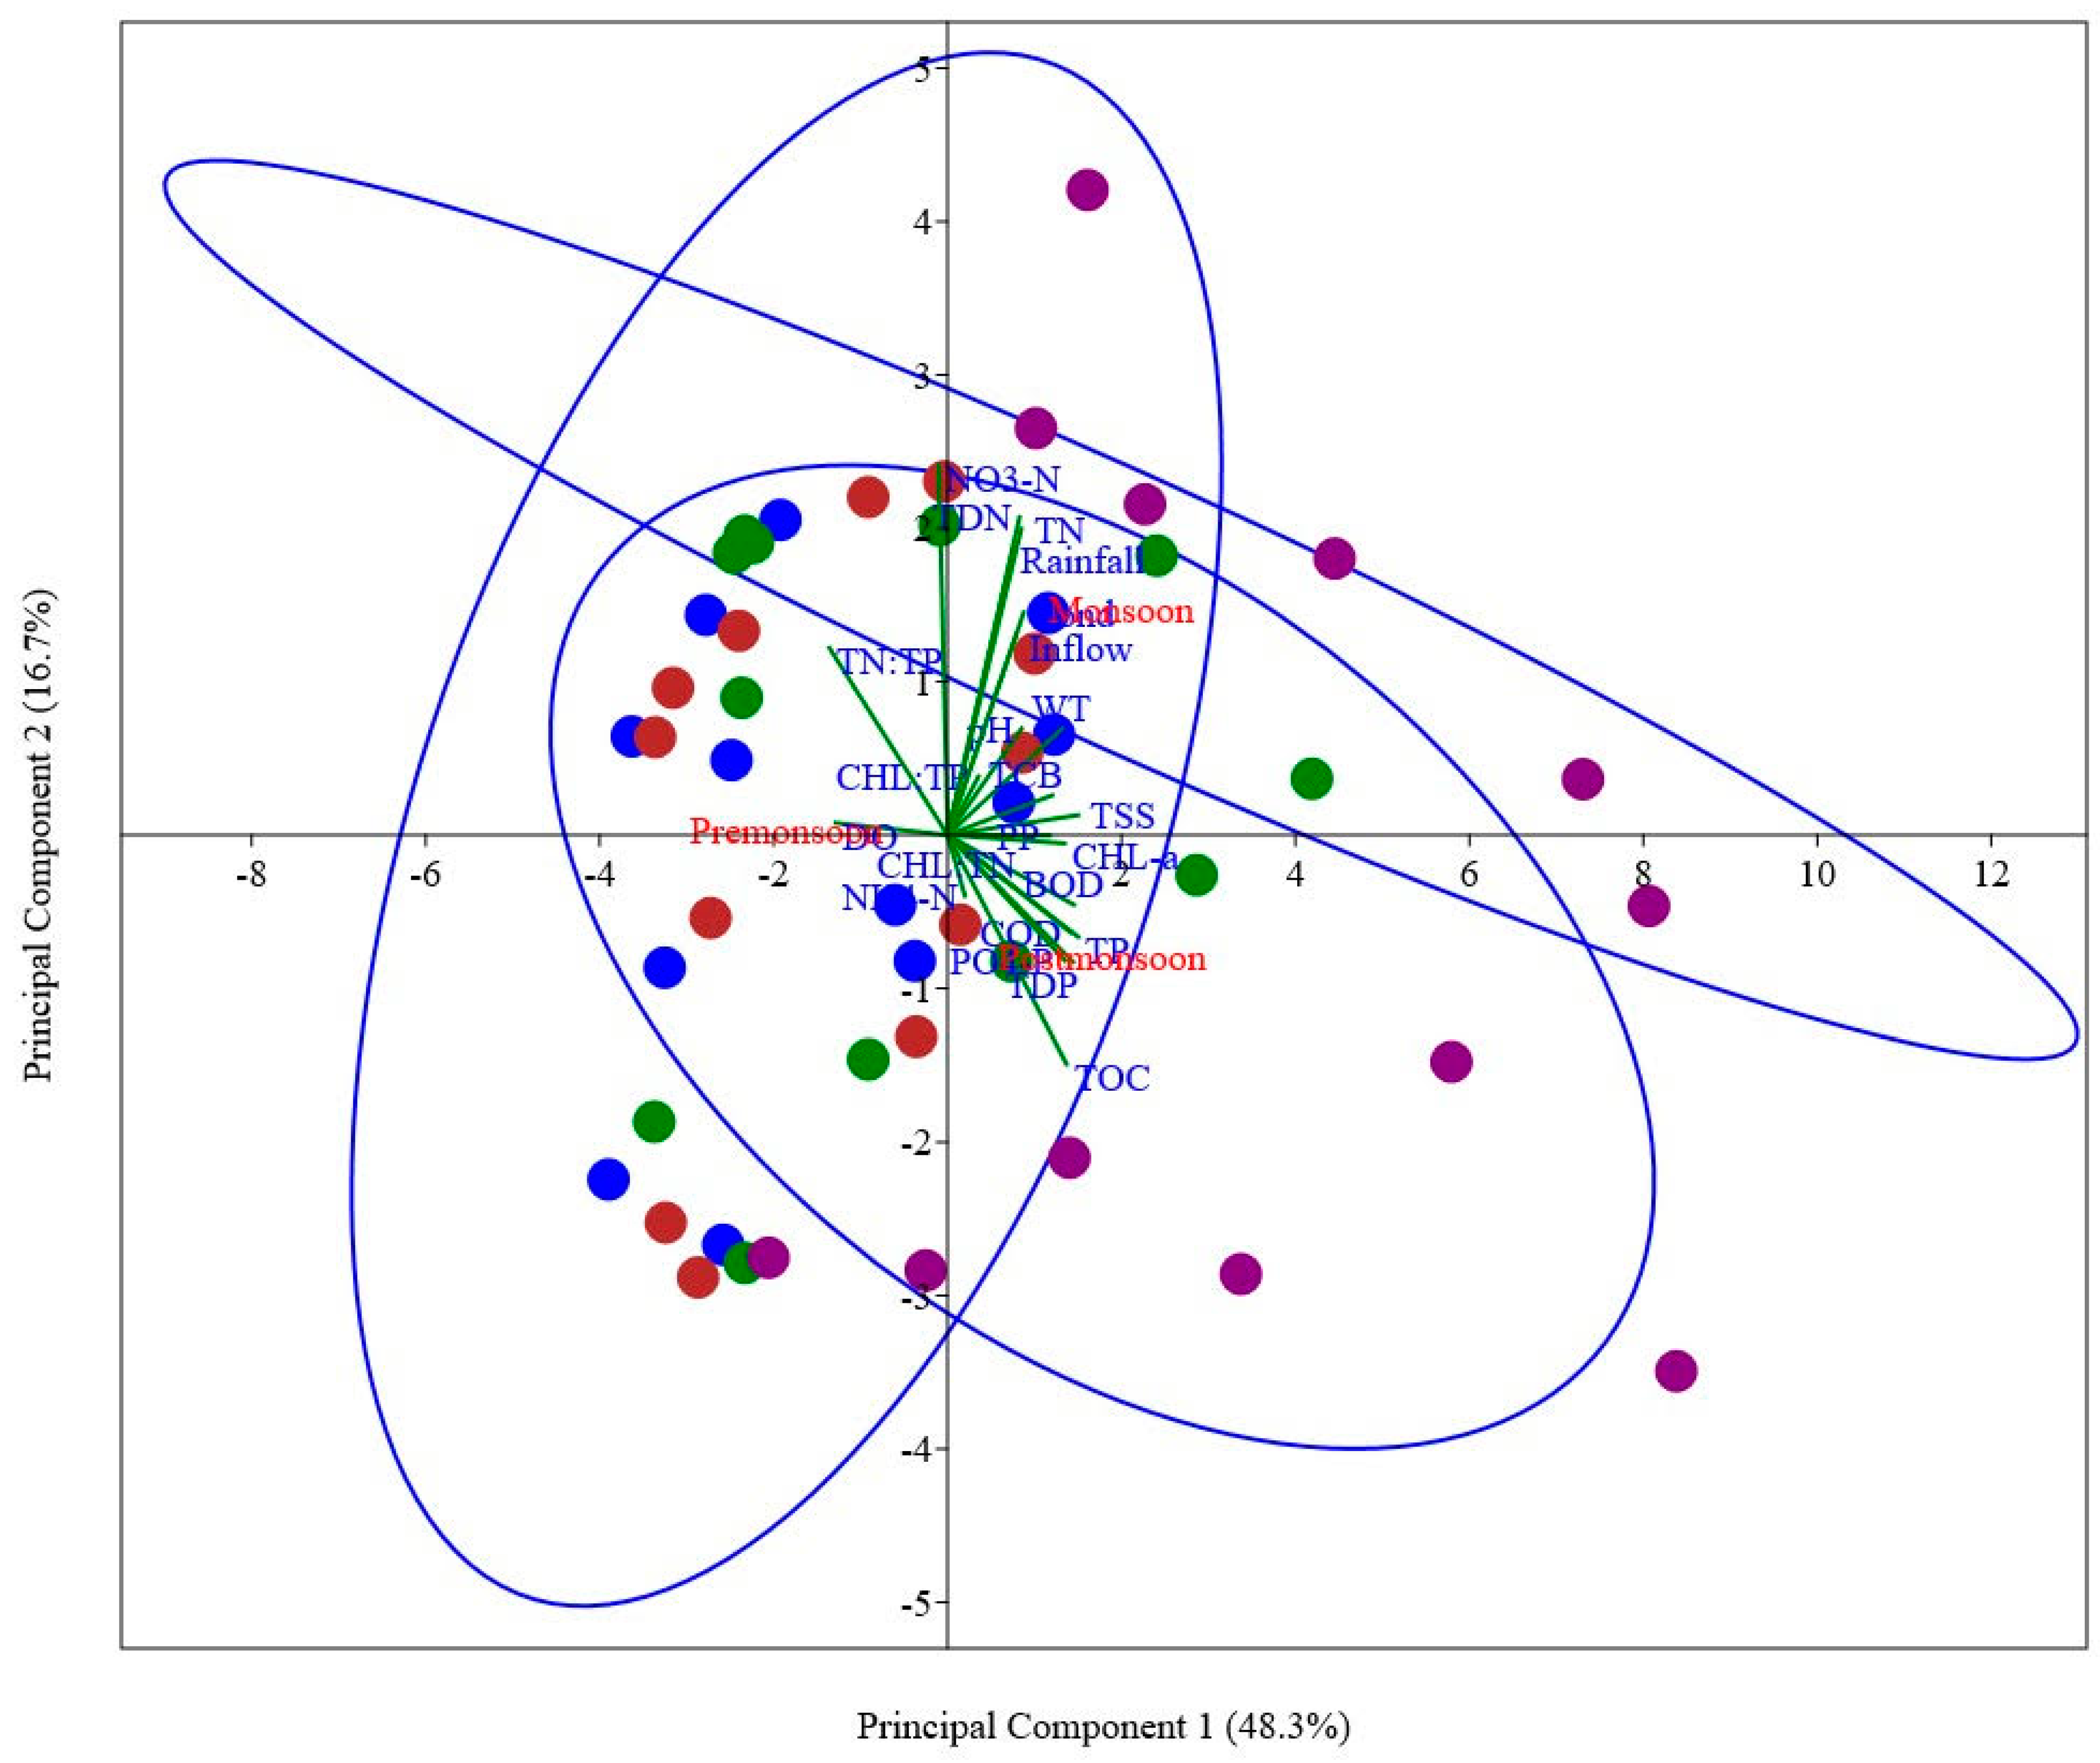
3.1. Role of Monsoon and Water Chemistry Variability

The seasonal rainfall patterns significantly influenced the critical water chemistry parameters, especially TP, TSS, TOC, and light regime (Figure 2). The nutrients, organic matters, TSS, and CHL-a decreased along the longitudinal gradient from site 4 to site 1, showing significant variations, whereas TN:TP ratio increased significantly (Table 1). The annual and maximum BOD and TOC values showed low organic matter pollution in the reservoir (Supplementary Figure S1). The seasonal variations in TSS, CHL-a, TOC, and TP noticeably increased from site 1 to site 4 (Table 2). TN and its associated chemical forms increased from site 1 to site 4, while it was not significant (H = 4.5, p > 0.05). The averages and minimum TN values at different locations showed that the reservoir is a high-nitrogen content system like other temperate reservoirs [51]. Due to the lower TP value, the average of the ambient TN:TP ratios at each site were higher than different types of the reservoir, such as agricultural and estuarine reservoirs [4]. The minimum values of TN:TP was more than 20 at each site, indicating a P-limitation. The CHL-a mean values showed an increasing trend from site 1 (2.88 ± 1.10 μg/L) to site 4 (4.86 ± 1.73 μg/L), displaying mesotrophic to eutrophic nutrient enrichment conditions [50]. TP’s maximum values showed that cyanobacterial risk reached approximately 80% at site 4 and 40% at locations 3 and 4.
Such findings are also supported by several previous studies [14,52].
The summer monsoon strongly influenced the hydrological variables in the reservoir. A total of 41% of the total rainfall occurred during the monsoon months (July–August). Additionally, the precipitation during the monsoon months was greater than an average line of months (Supplementary Figure S2). As a result of intense rainfall, water quality parameters were altered significantly. Despite higher TOC levels recorded, the TSS, BOD, TN, and TP were higher during the intensive summer monsoon season than in the year. TOC is now increasingly used as an indirect indicator of organic pollution that is also linked with rainfall events, as exhibited through our findings. The predominant contributors of TOC include the internal lake processes as well as the surrounding environment. TSS variations showed a close similarity with the CHL-a. The initially lower TP concentration with subsequent increments during and post-rainfall periods indicated that P loading increased from the watershed under the impact of monsoon as well as higher inflow of solid contents [25]. TP’s peak values (more than 30 μg/L) indicated that the algal growth with cyanobacteria dominant occurs in August and September, and the risk of cyanobacteria is more than 40% [52]. As presented in several previous studies, this study also highlights the dominating role of intensive rainfall events and overall rainfall intensity. That is why the inclusion and impact of monsoon on nutrients, flow regime, organic matter, and algal CHL-a productivity remain crucial and always relevant.
The average TN:TP ratios significantly decreased from pre-monsoon (222 ± 93.2) to monsoon (214 ± 121.4) and post-monsoon (182 ± 72.3, H = 9.59, p < 0.05). The growth of CHL-a continuously increased from 2.16 ± 1.23 μg/L to 6.05 ± 4.38 μg/L between May and November. The increasing trend in CHL-a’s higher values indicated that the risk of chlorophyll-a for drinking water repeatedly reached moderate levels (more than 10 μg/L) from August to November [53]. The findings showed the nutrient loadings from watersheds caused by extreme rainfall events that increased the algal CHL-a growth [21,54,55,56]. The increasing TSS levels, BOD, TP, and CHL-a during the flood years declined, indicating intensive rainfall mediated dilution [20,46,57,58].

3.2. Long-Term Trends in the Water Quality Parameters

We used the non-parametric Mann–Kendall trend (MKT) test to check the long-term tendencies in the water quality factors in the Yongdam reservoir, and the results are showing in Table 3. The MKT analyses indicated an increasing trend in the organic matter (COD and TOC), while no trend was detected in the case of BOD. The pH, WT, and TSS alluded to an increasing trend during the study that could indicate that the changing weather conditions strongly impacted the reservoir. The aquatic biota is prone to changes because of such physical changes in the water chemistry.
The EC, BOD, TN, and allied chemical species (TDN and NH4-N) displayed no trends, while NO3-N indicated to a negative trend. This declining trend in nitrate pointed towards the reduction in nitrate-containing fertilizers in the reservoir watershed. However, the increasing TP (TDP and PO4-P) allied chemical species alluded to a growing preference for phosphate fertilizers in the region. However, TP did not propose any trend based on MKT. The algal chlorophyll and TCB displayed an increasing overall trend in the reservoir that explained that the reservoir is subjected to various pressures, including impending water quality deterioration, especially human consumption. Our findings suggested that the key regulatory factors related to human water consumption are continuously increasing. The water quality managers need to advance to mitigate the looming water quality crises as the Yongdam reservoir is predominantly used as a human drinking water resource. It also alluded to the changing trends in fertilizer utilization among the agricultural community and shifting industrial production trends.

3.3. Spatio-Seasonal Links between Nutrients, Ambient Ratios, and Sestonic CHL-a

The spatial and seasonal empirical modeling illustrated algal CHL-a was regulated by TP in a moderately strong regression relationship rather than linked with the reservoir TN (Figure 3, Table 4). The TN:TP ambient ratios and TP demonstrated strong (R2 < 0.70) negative links during the pre-monsoon, monsoon, and post-monsoon periods (Table 4). However, there were strong links between the ambient ratios and TN (R2 = 0.76) during the monsoon. The algal CHL-a:TP showed the moderate–strong relationship to log-transformed CHL-a (n = 48, R2 = 0.35, p < 0.001, F1, 46 = 24.53). However, the monthly TN had weak positive correlation with CHL-a (n = 48, R2 = 0.13, p < 0.05, F1, 46 = 6.85).
On the other hand, the regression trend in the log-transformed TN:TP ratios showed that the ratios declined linearly (n = 48, R2 = 0.90, p < 0.001, F1, 46 = 403.65) with an increase of TP, while there were no links with the TN (p > 0.05, F1, 46 = 1.79). The TN:TP ratio dynamics explained 35% of the log-transformed CHL-a relationship, just like TP. This indicated the potential P-limitation scenario in the Yongdam reservoir. The reservoir shows a severe P-limitation scenario, which is also supported by the studies in the past [18,59,60].

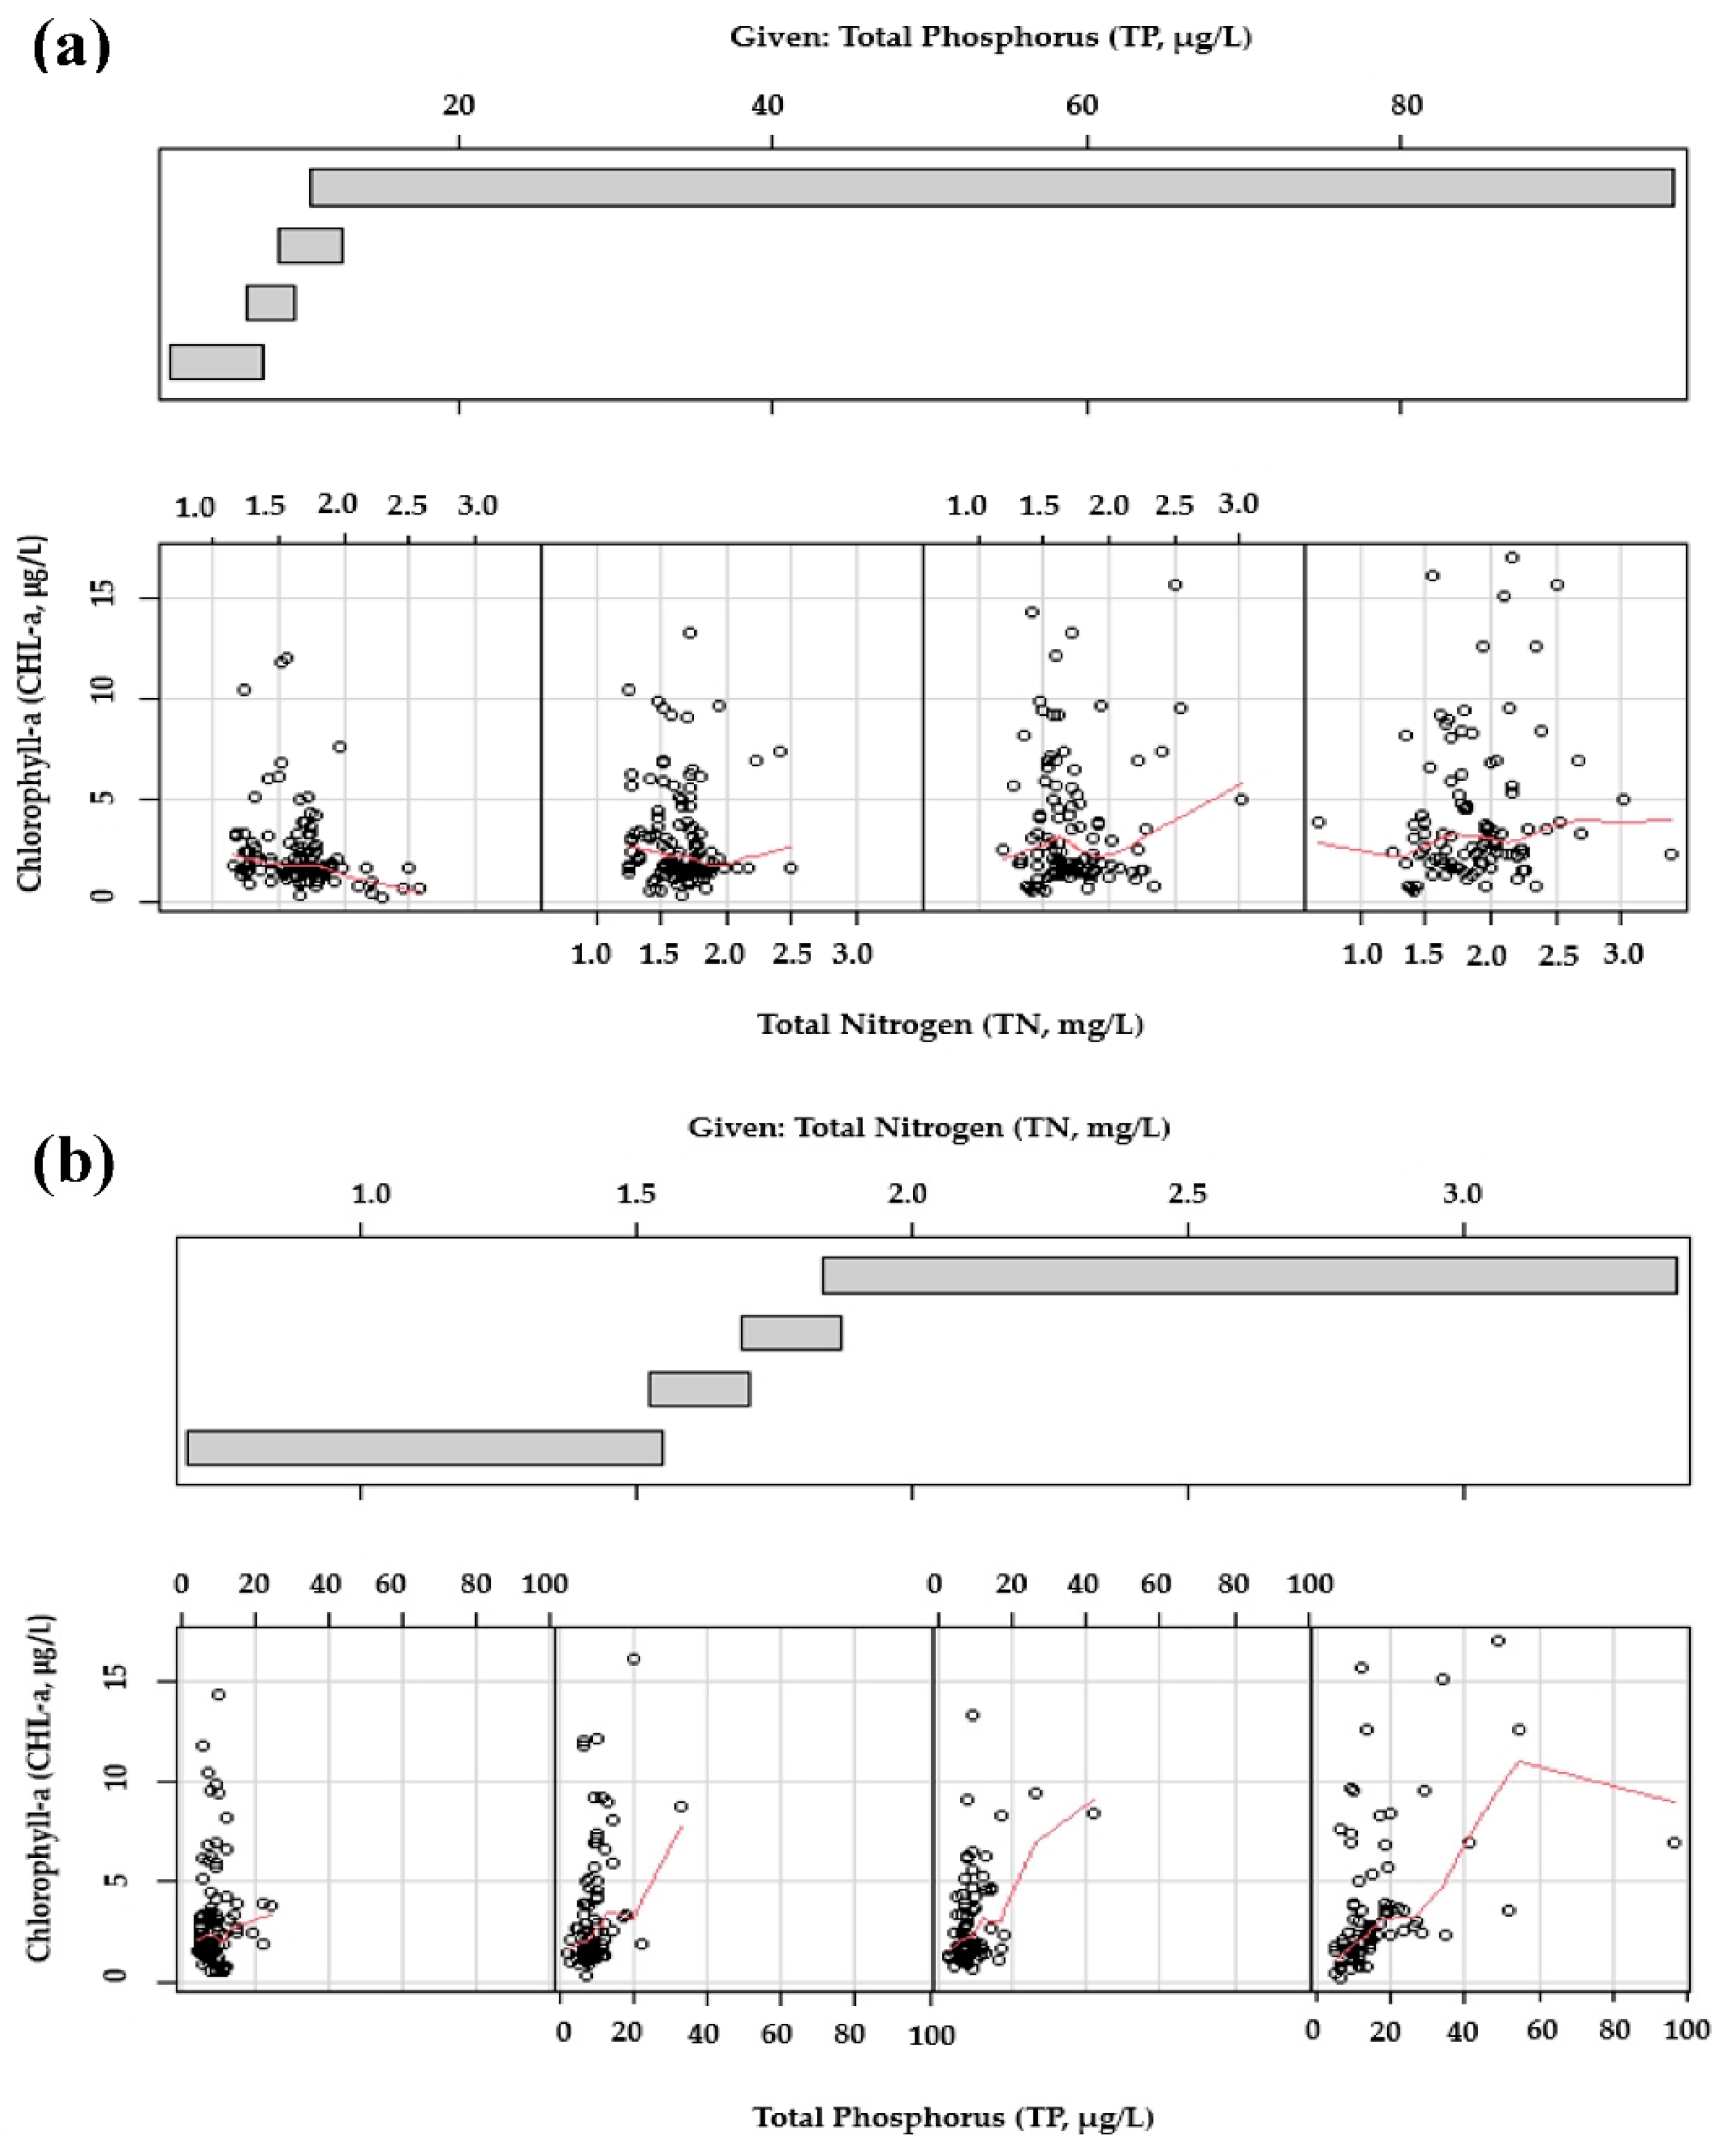
3.4. Conditional Plotting

It is well-established that the lentic ecosystem’s algal productivity is predominantly linked to the ambient nutrient (TP, TN) regime and is mainly contributed by agricultural and other anthropic actions [4,24]. We performed the conditional plotting using the R program, and the results showed that the TP concentrations better explained the algal growth (CHL-a) in the temperate reservoir (Yongdam) than that of TN (Figure 4). This strongly suggested that the reservoir is firmly a P-limited ecosystem [20]. Moreover, conditional plotting has been used to identify limiting nutrients in aquatic systems [46,61]. When two predictors are strongly correlated (R2 > 0.70), collinearity problems may emerge that could hinder the predominant nutrient’s determination, causing the algal growth limitation. However, we performed the conditional plotting, and the findings have shown that TP and TN are poorly correlated (R2 = 0.10) in the Yongdam Reservoir. In the present case, the conditional plots showed that the relationship between CHL-a and TP was relatively stable in Yongdam Reservoir, as indicated by the smooth lines on the four panels with similar slopes, which stated that the impact of TP on CHL-a was consistent regardless of the TN level, specifying a P-limited nutrient condition in the reservoir.
The conditional plot did not illustrate any overlapping interactions between TP and TN, which has further confirmed that Yongdam Reservoir is a P-limited system. The algal productivity is predominantly affected by the phosphorus regime in the reservoir. These findings are beneficial in designating the role of nutrients in algal productivity and are supported mainly by previously published research in the Asian region, predominantly impacted by the intensive summer monsoon rainfall.

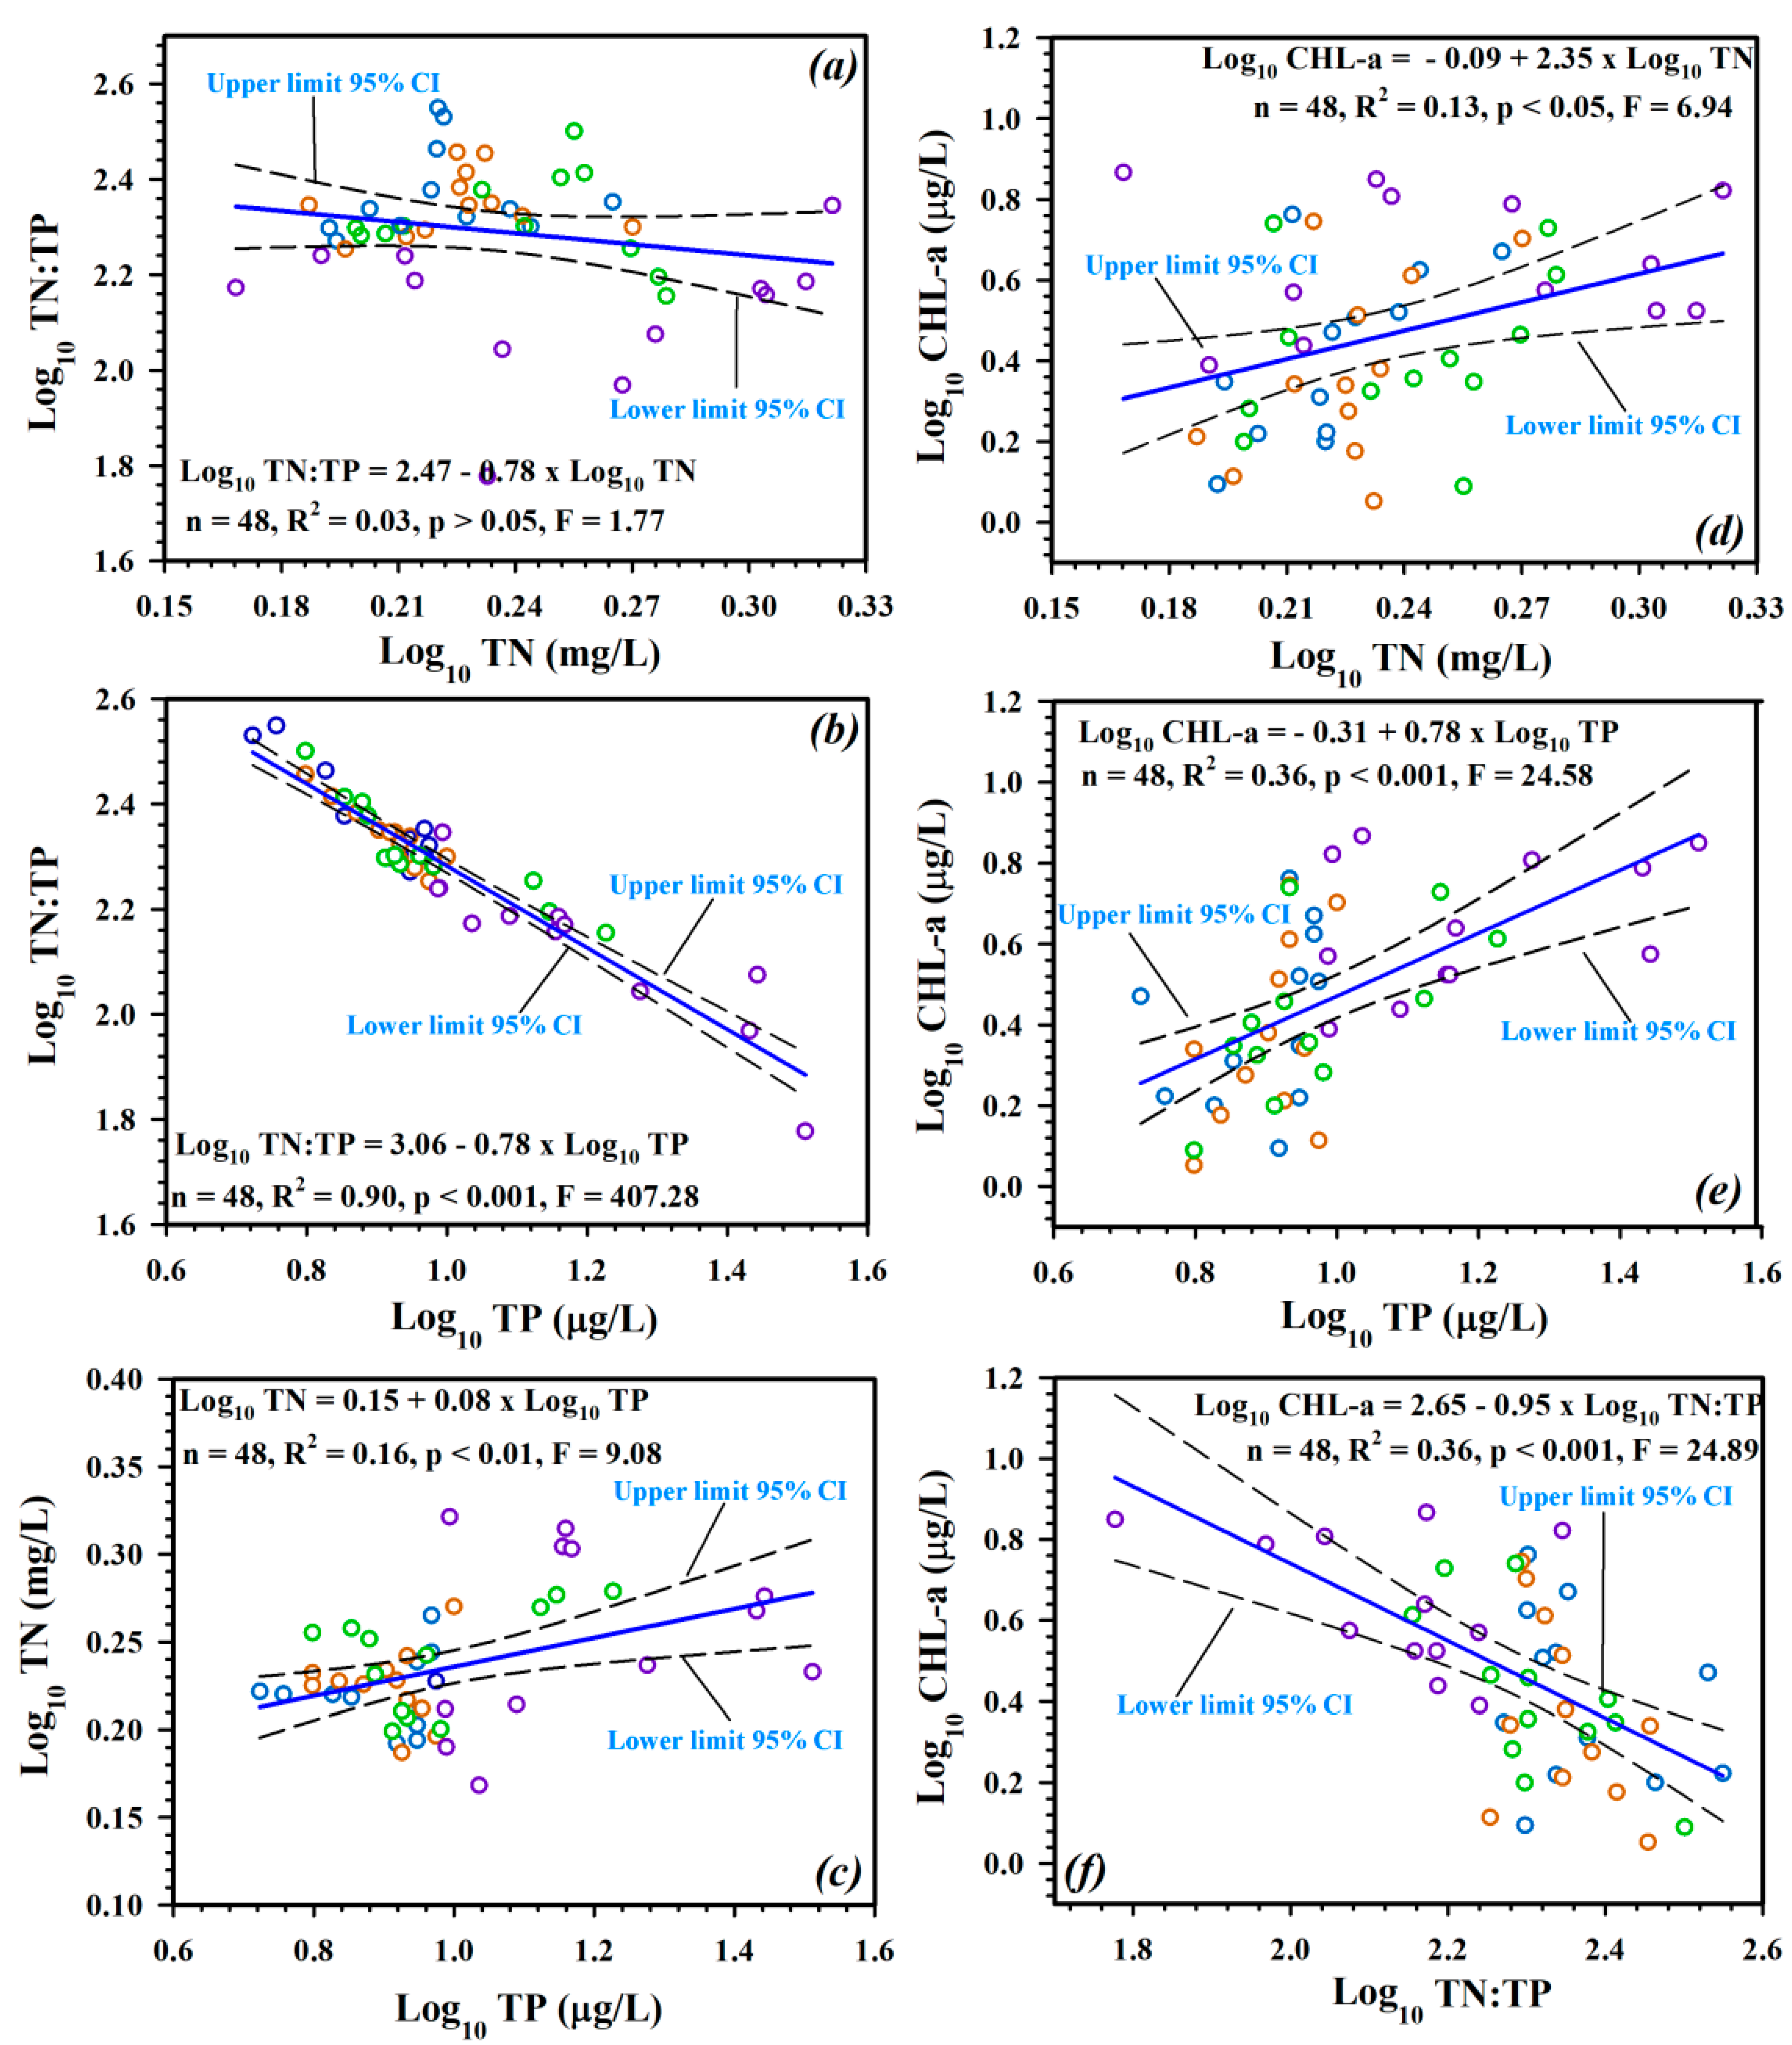
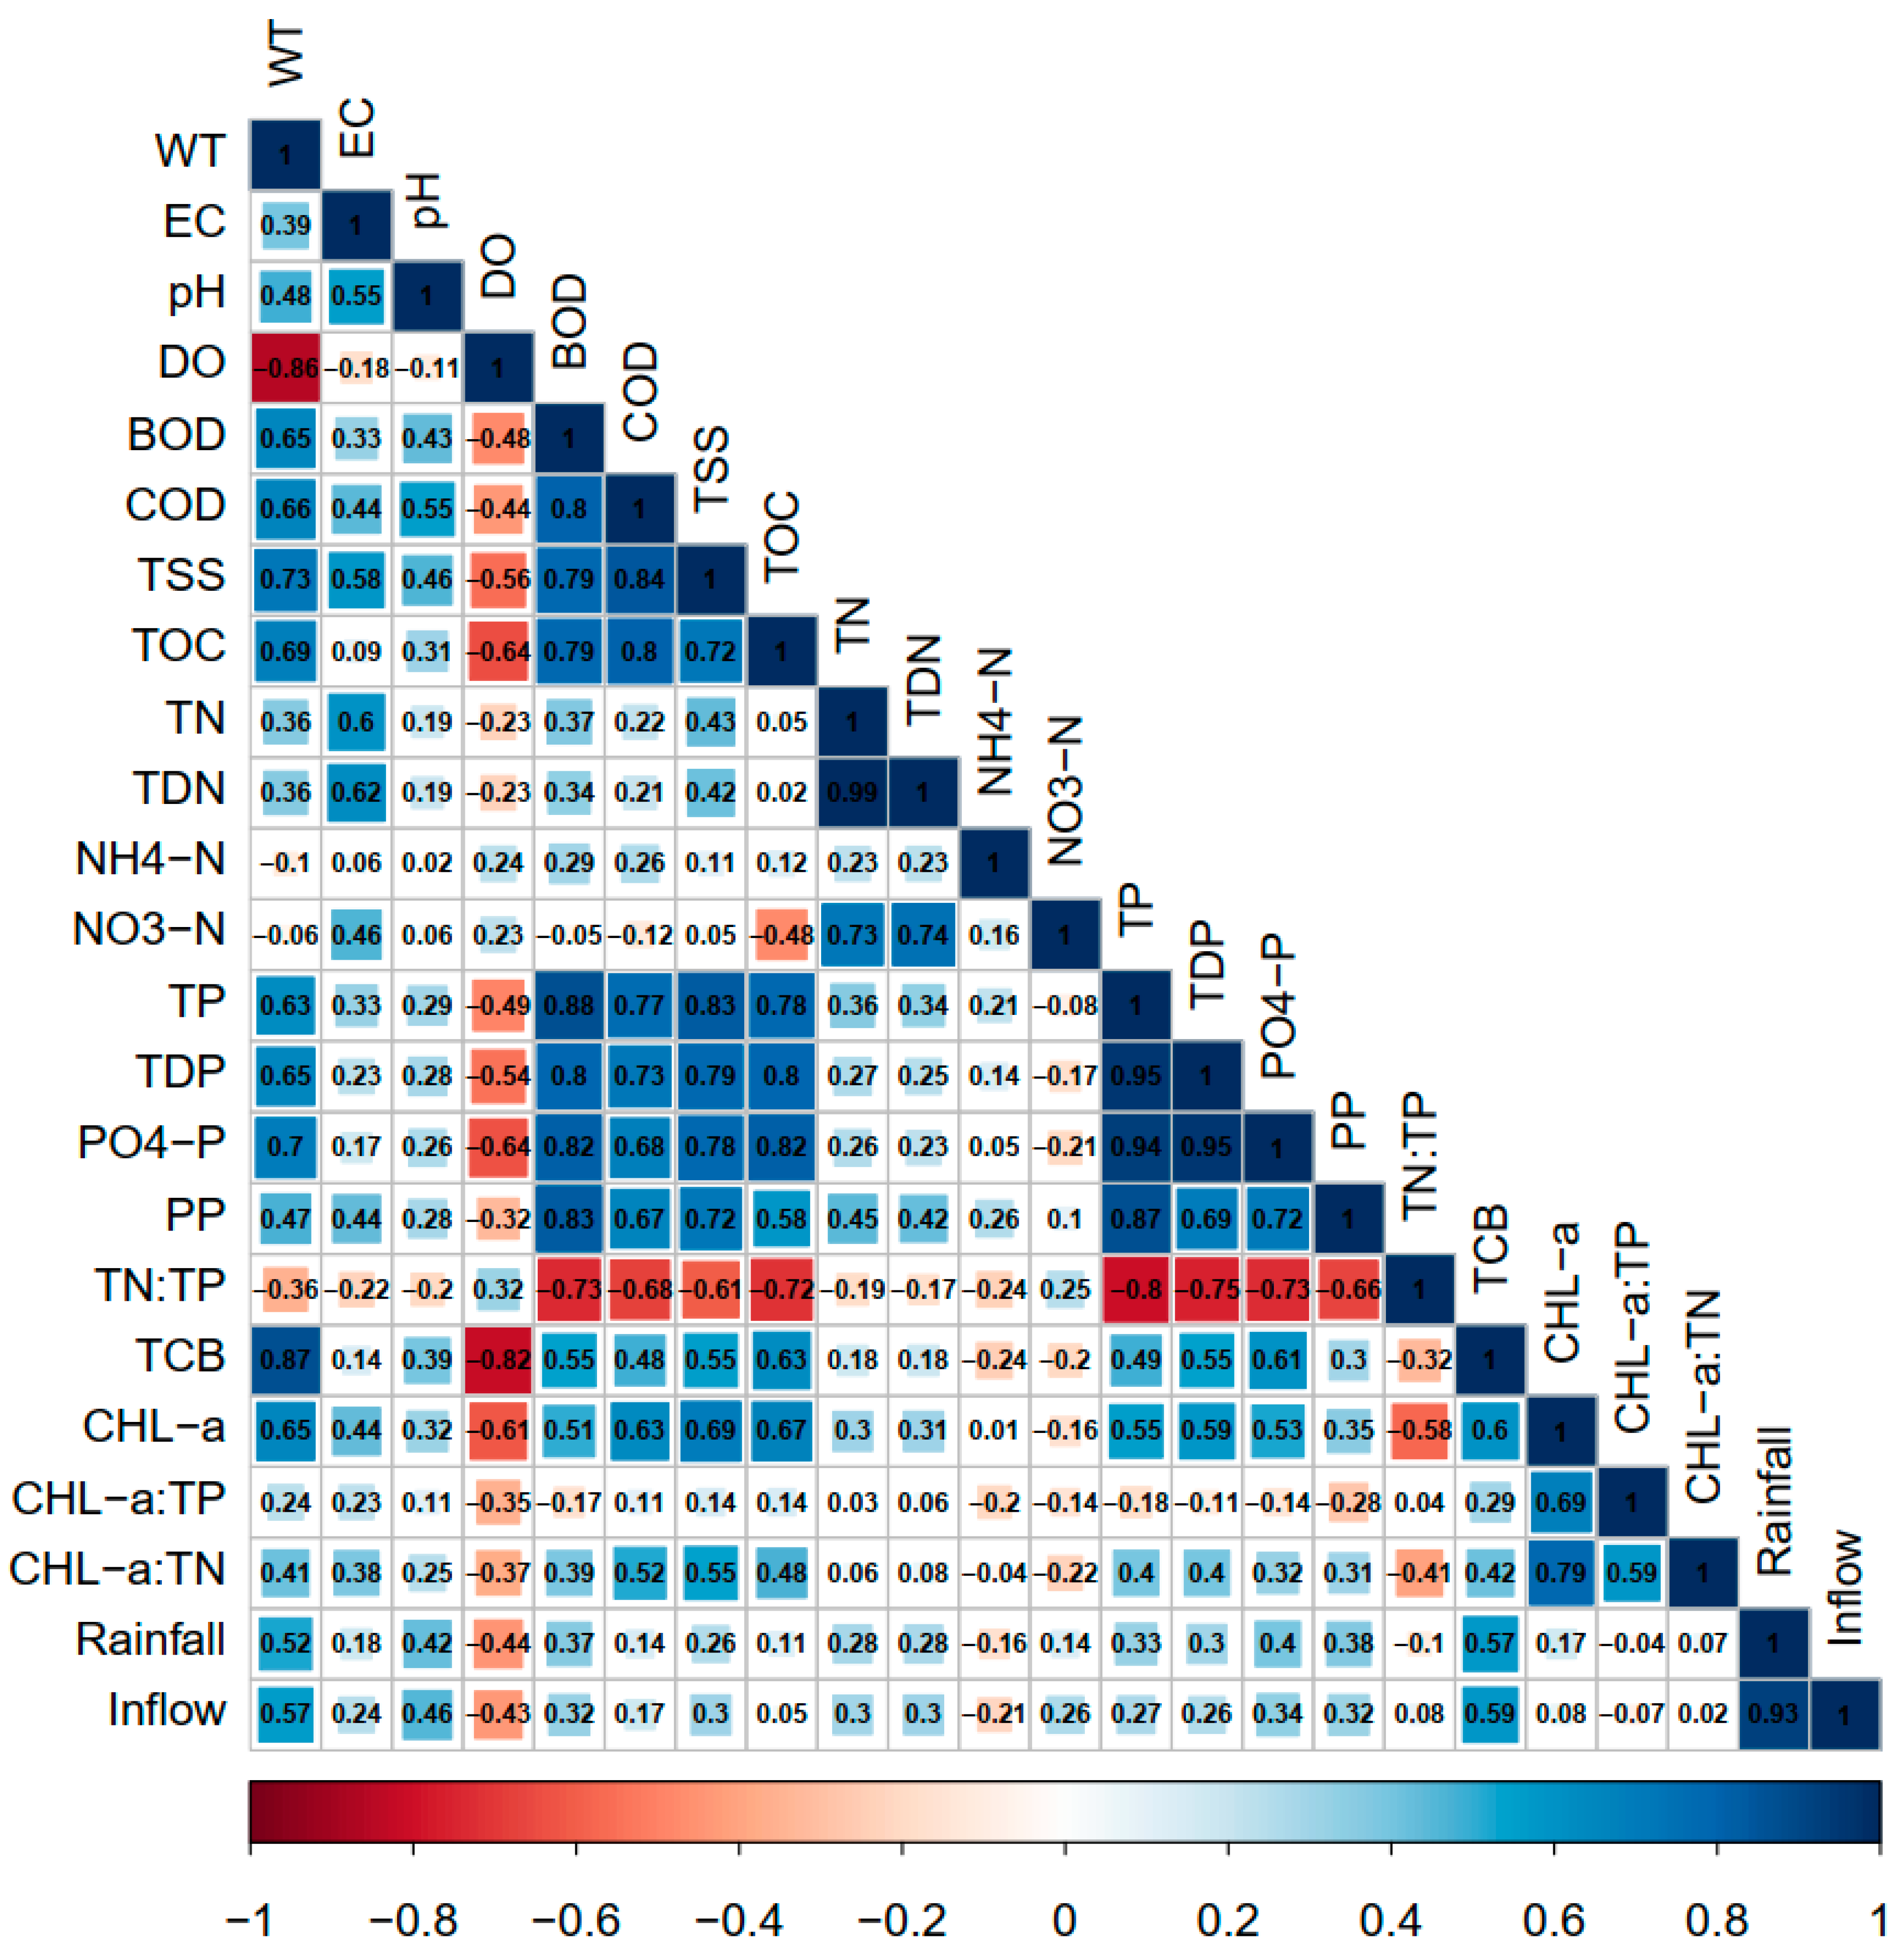
3.5. Co-Relating Water Chemistry Parameters

We determined the strength of Pearson’s correlation coefficient (r) as moderately strong (r ≥ 0.50–≤0.69) to strong (r ≥ 0.7) linear associations between the water quality parameters, which mainly indicated a moderate to strong correlation among the most critical parameters (Figure 5). The correlation coefficient values between ≥0.3–≤0.49 were designated as weak linear relationship while less the 0.3 was considered as little to no linear relationship. For instance, BOD and COD showed a strong positive correlation (r ≥ 0.7) with TSS, TOC, TP, and allied chemical species, and TN, while a strong negative relationship to the ambient ratios of TN:TP (p < 0.001, r > 0.70, respectively). The COD showed strong positive correlations with BOD, TSS, TOC, TP, total dissolved phosphorus (TDP). The other organic matter (TOC) measure manifested a robust positive relationship with BOD, COD, TSS, TP, TDP, and PO4-P. On the other hand, it illustrated a robust negative link with TN:TP. The strongly negative linear relationship between DO and WT suggested the dynamic shifts in reservoir DO that could be linked to the substantial temperature fluctuations or diurnal photosynthesis [62]. On the other hand, pH displayed weak to moderately strong positive linear relationship with most of the parameters with the COD (r = 0.55) showing moderately strong links. EC displayed the highest links with the TN (r = 0.60) and TDN (r = 0.62) while slightly lower links with TSS (r = 0.58). This alluded to the internal loading of ionic content from the alluvial sediments, potentially enriched with high nutrient contents [16,19].
The organic pollution indicators (BOD and COD) are regularly used as signs of organic pollution on a global scale [63]. However, TOC has also been suggested as an alternative indicator of the organic matter prevalence in the freshwater ecosystems, especially those impacted by the WWTPs. The strong correlation between BOD, COD, TOC, and TSS indicated the presence of non-biodegradable organic pollutants in the reservoir that could seriously damage the sustainable water quality of the Yongdam Reservoir. This also indicated that the runoff water mediated by the torrential monsoon currents and increasingly inflowing organic pollutants from the WWTPs could be a considerable problem in the future [18,23]. The strong connections between solids regime and nutrients indicated rich inflows of the adsorbed phosphorus and other dissolved nutrients (TN, TP, and allied chemical species) that could be linked with high monsoon rainfall events in the reservoir watershed [46,48].
The WT showed a strong influence on the TCB (r = 0.87), while algal CHL-a demonstrated a moderately strong (r = 0.65) relationship, thereby compelling links between water temperature, primary productivity, and bacterial communities. Furthermore, the sestonic CHL-a illustrated a moderately strong (r ≥ 0.50–≤0.69) association with BOD, COD, TSS, TOC, and TCB. Similarly, the precipitation regime and inflow displayed a relatively strong positive influence on the presence of TCB. However, the DO level demonstrated a strong negative (r = −0.82) with TCB, which indicated the bacterial communities are likely to populate in the places where the water quality is rapidly worsening due to chemical pollution. This will further endanger the aquatic life and the human health due to the continuous water consumption. On the other hand, the moderately strong relationship between TCB and water inflow (r = 0.59) and rainfall intensity (r = 0.57) indicated that the pollutants are contributed by variety of factors including human fecal matter, livestock, and other sources.
The strong positive (r = 0.93) correlation between the rainfall intensity and inflow alluded to the runoff water as the reservoir’s predominant water resource. This also indicated that the reservoir was more vulnerable to natural events of intensive rainfall as it can potentially play as a connecting factor between variety of pollutants and nutrients present in the reservoir watershed [18]. TN and TDN indicated a weak or no correlation with most of the parameters. However, TP and allied chemical species displayed stronger (r ≥ 0.7) associations with each other and the TN:TP ratios, TOC, TSS, and weak links with the WT and DO. The ambient TN:TP ratios pointed to the more robust but negative (r ≥ 0.7) associations with TOC, BOD, COD, TP, and its other chemical forms, including particulate phosphorus. Moreover, the other rations, i.e., CHL-a:TP and CHL-a:TN, did not show any significant associations with the preponderance of the chemical water quality parameters. The primary productivity indicator (CHL-a), however, showed no explicitly strong associations with any of the critical factors; however, it showed moderately strong (r ≥ 0.50–≤0.69) with TP rather than with TN. Therefore, it is vital to mention that Pearson’s correlation revealed the TP as the more convincing limiting nutrient in the Yongdam reservoir.
The moderately strong connections between algal CHL-a and TP regime strongly indicated that TP makes the greatest contributions to explain the algal CHL-a variations in the reservoir like most of the other multipurpose reservoirs in South Korea. The increasing human activities including resorting to the intensive agriculture practices, livestock farming, industrial actions are all connected to the reservoir through the rich inflows of the water currents after rainfall events during monsoon [47,55,58]. The other sources of water quality deterioration and strong connections between leading water quality parameters comprised of the WWTPs, industrial effluents, domestic releases. All these factors are strongly revealed by our current correlation assessment in the Yongdam Reservoir.

3.6. Predominant Links between Water Chemistry Parameters

The principal component analysis is widely practiced in environmental quality data to reduce large datasets into smaller components (or principal components) with the most negligible information loss. The statistics method helps interpret the relationship among the measured parameters in large datasets to compellingly display the assortments to enhance our understanding of the parameters. The eigenvalues helped to select the principal components (PC) displaying most of the water quality variations. The loading values of the water quality variables were considered strong (>0.75), moderate (0.75–0.50), and weak (0.50–0.30), which also illustrated the strength of variation in the vital parameters. The first four PCs displayed 88.3% variance, with the first PC explaining 48.31% and the second as 16.68% (Table 5, Figure 6). Most of the water chemistry factors, including the nutrient and organic matter regime, displayed strong to moderately strong positive (>0.75, 0.75–0.50) loadings in the PC 1, alluding to the most significant PC. For instance, the WT, BOD, COD, TSS, TOC, TP, TDP, PO4-P, and CHL-a, alluded to strongly positive, while the DO and TN:TP revealed strong negative loadings. We also noticed moderate positive loading values of EC, pH, particulate phosphate (PP), TCB, weak positive loadings of TN, TDN, CHL-a:TN, inflow rate, and precipitation.
The PC 1 indicated that the phosphorus regime and WT strongly influenced primary productivity growth (CHL-a). Consequently, the DO level decline with increasing organic matter loads, PP, and bacterial populations. The second PC interpreted 16.7% of the variance and displayed a strongly favorable loading of NO3-N only. However, moderate positive loadings of EC, TN, TDN, precipitation, and TN’s weak positive loadings with TP and water inflow. Besides, the TOC showed moderate negative loading. It maintained intense rainfall, reducing organic matter and continuously transporting the reservoir’s nitrogen contents, mostly NO3-N loading. Moreover, the negative loadings of TDP, PO4-P, NH4-N in the PC 2 were probably related to the ionic dilution by the intensive monsoon rainfall as the reservoir inflow is strongly impacted the high rainfall events. The fourth PC elucidated 8.1% of the total variance, with the EC, CHL-a, CHL-a:TP, and CHL-a:TP showing moderate positive loadings, whereas rainfall, inflow, PO4-P illustrated the weak negative loadings, indicating the dilution impact of intensive monsoon rainfall on the primary productivity, and an overall positive effect on the phosphorus loadings in the reservoir watershed [64].

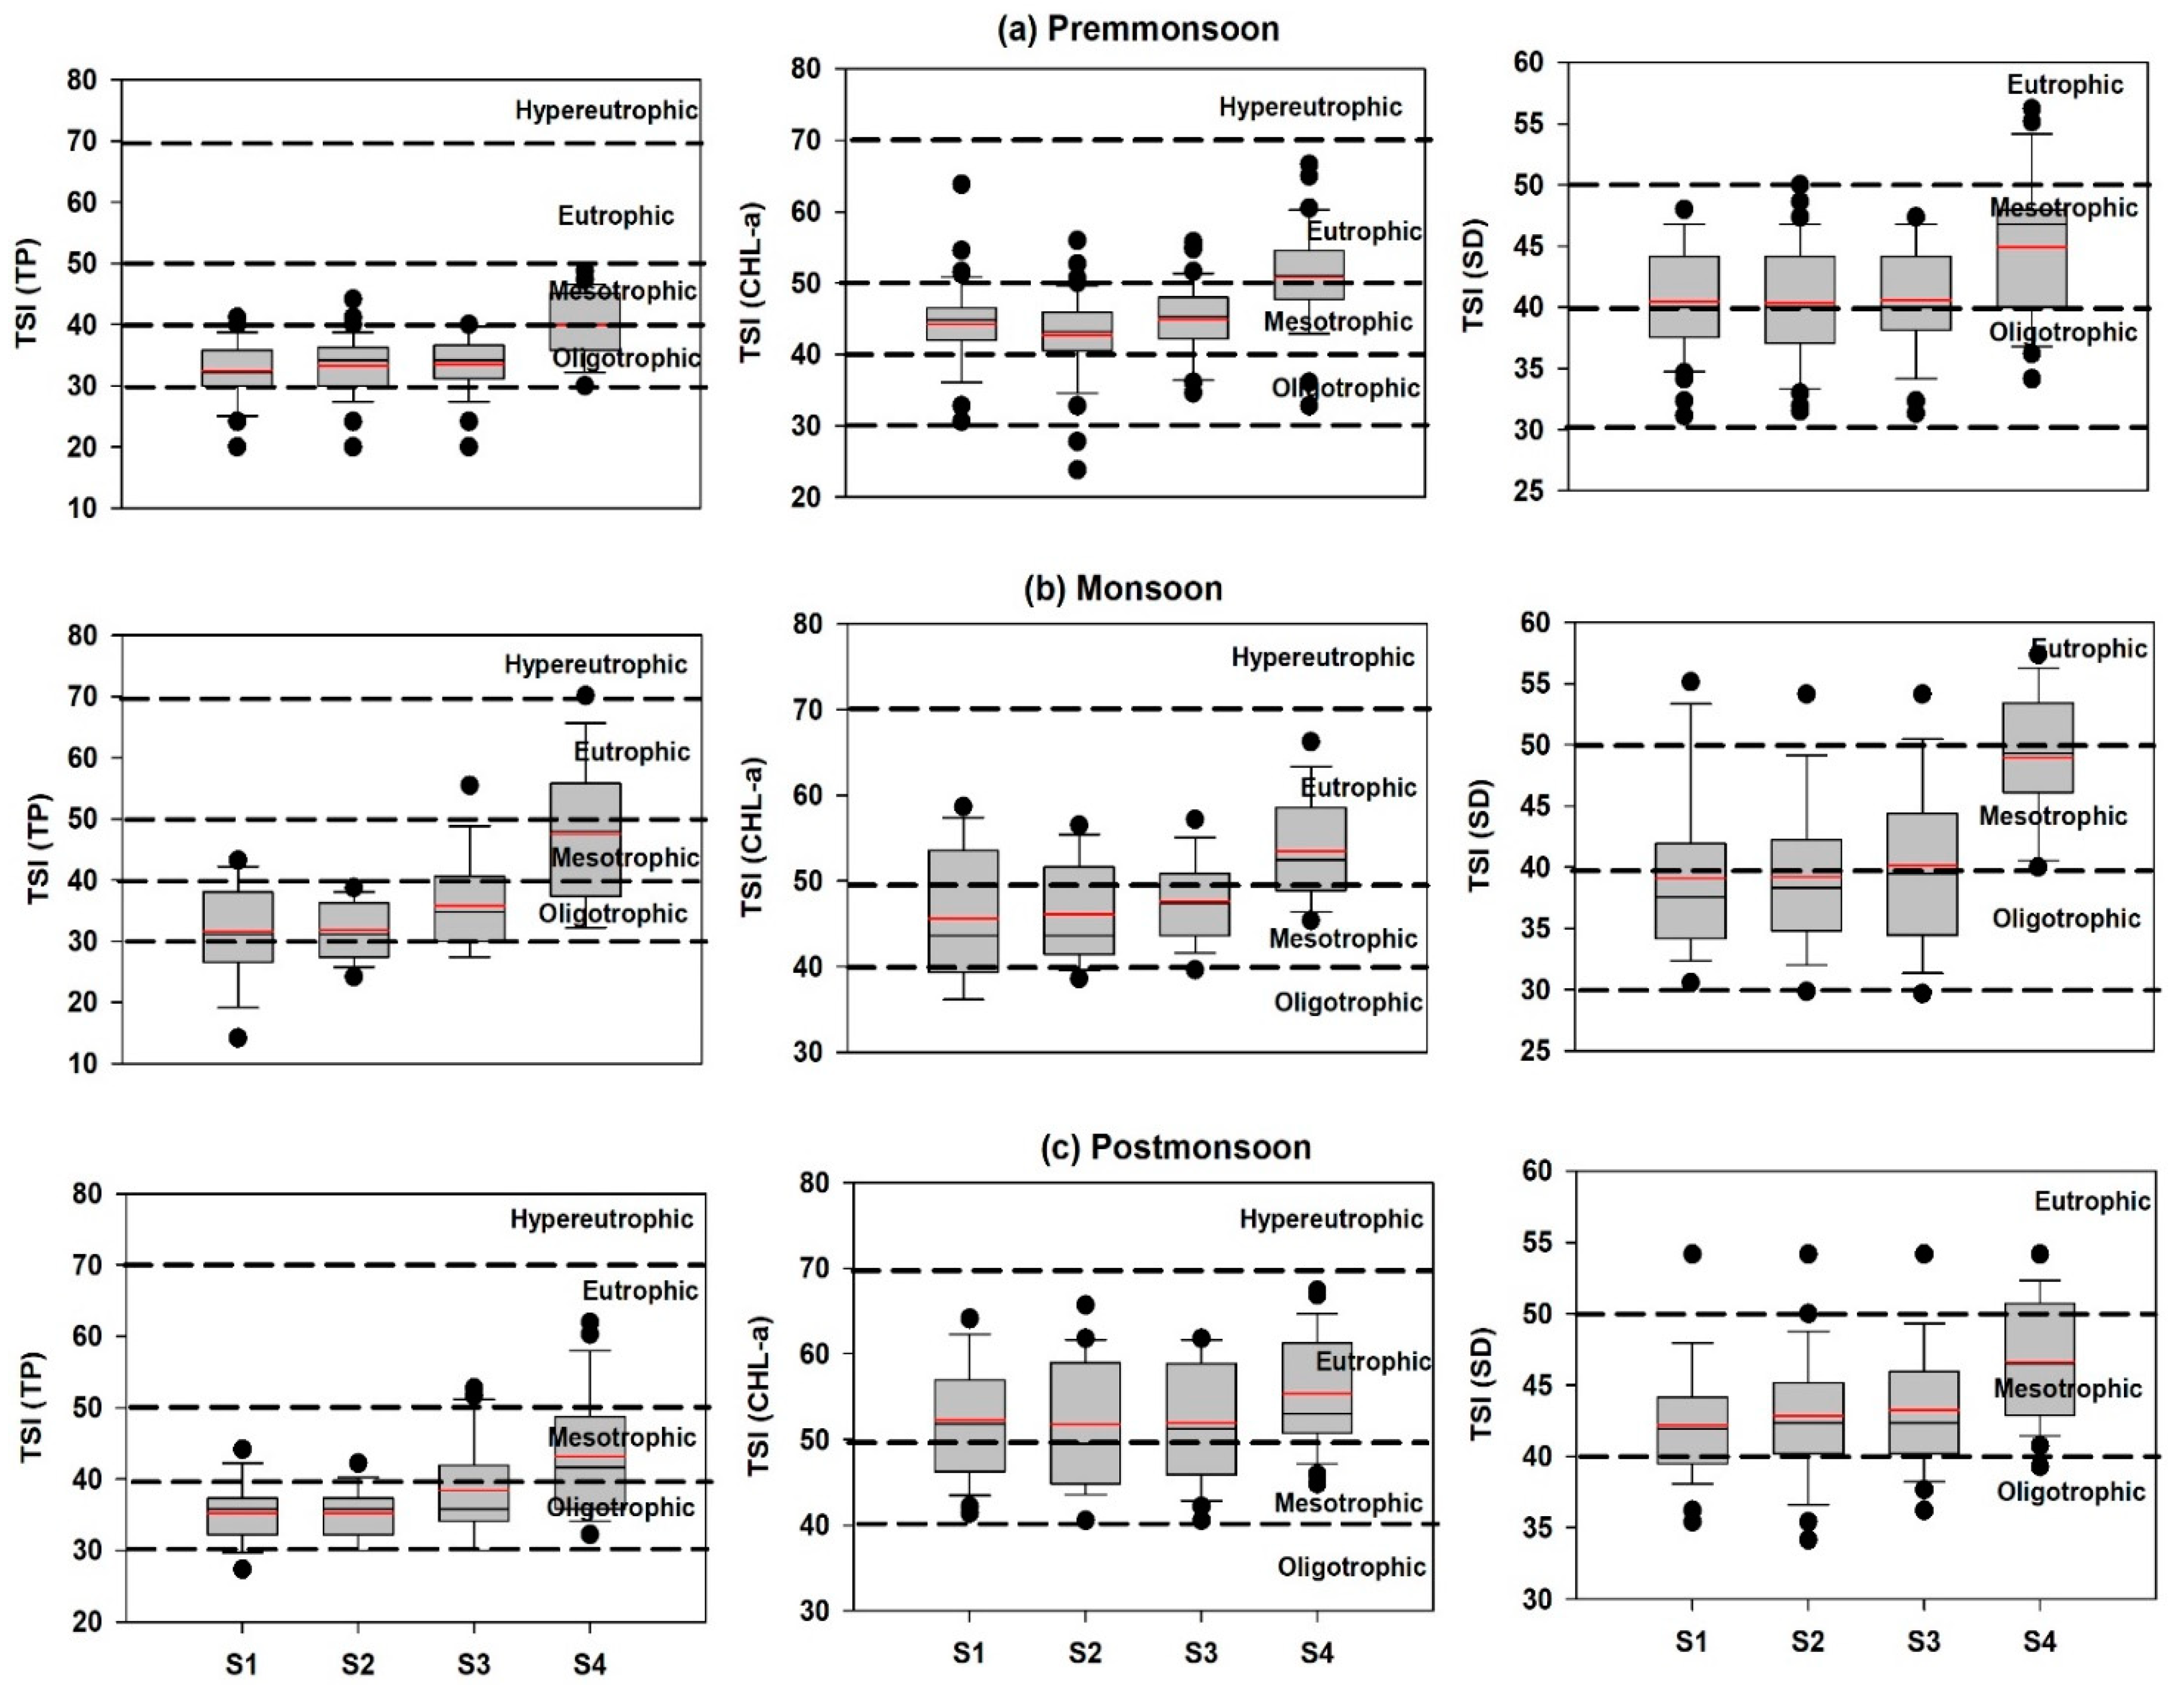
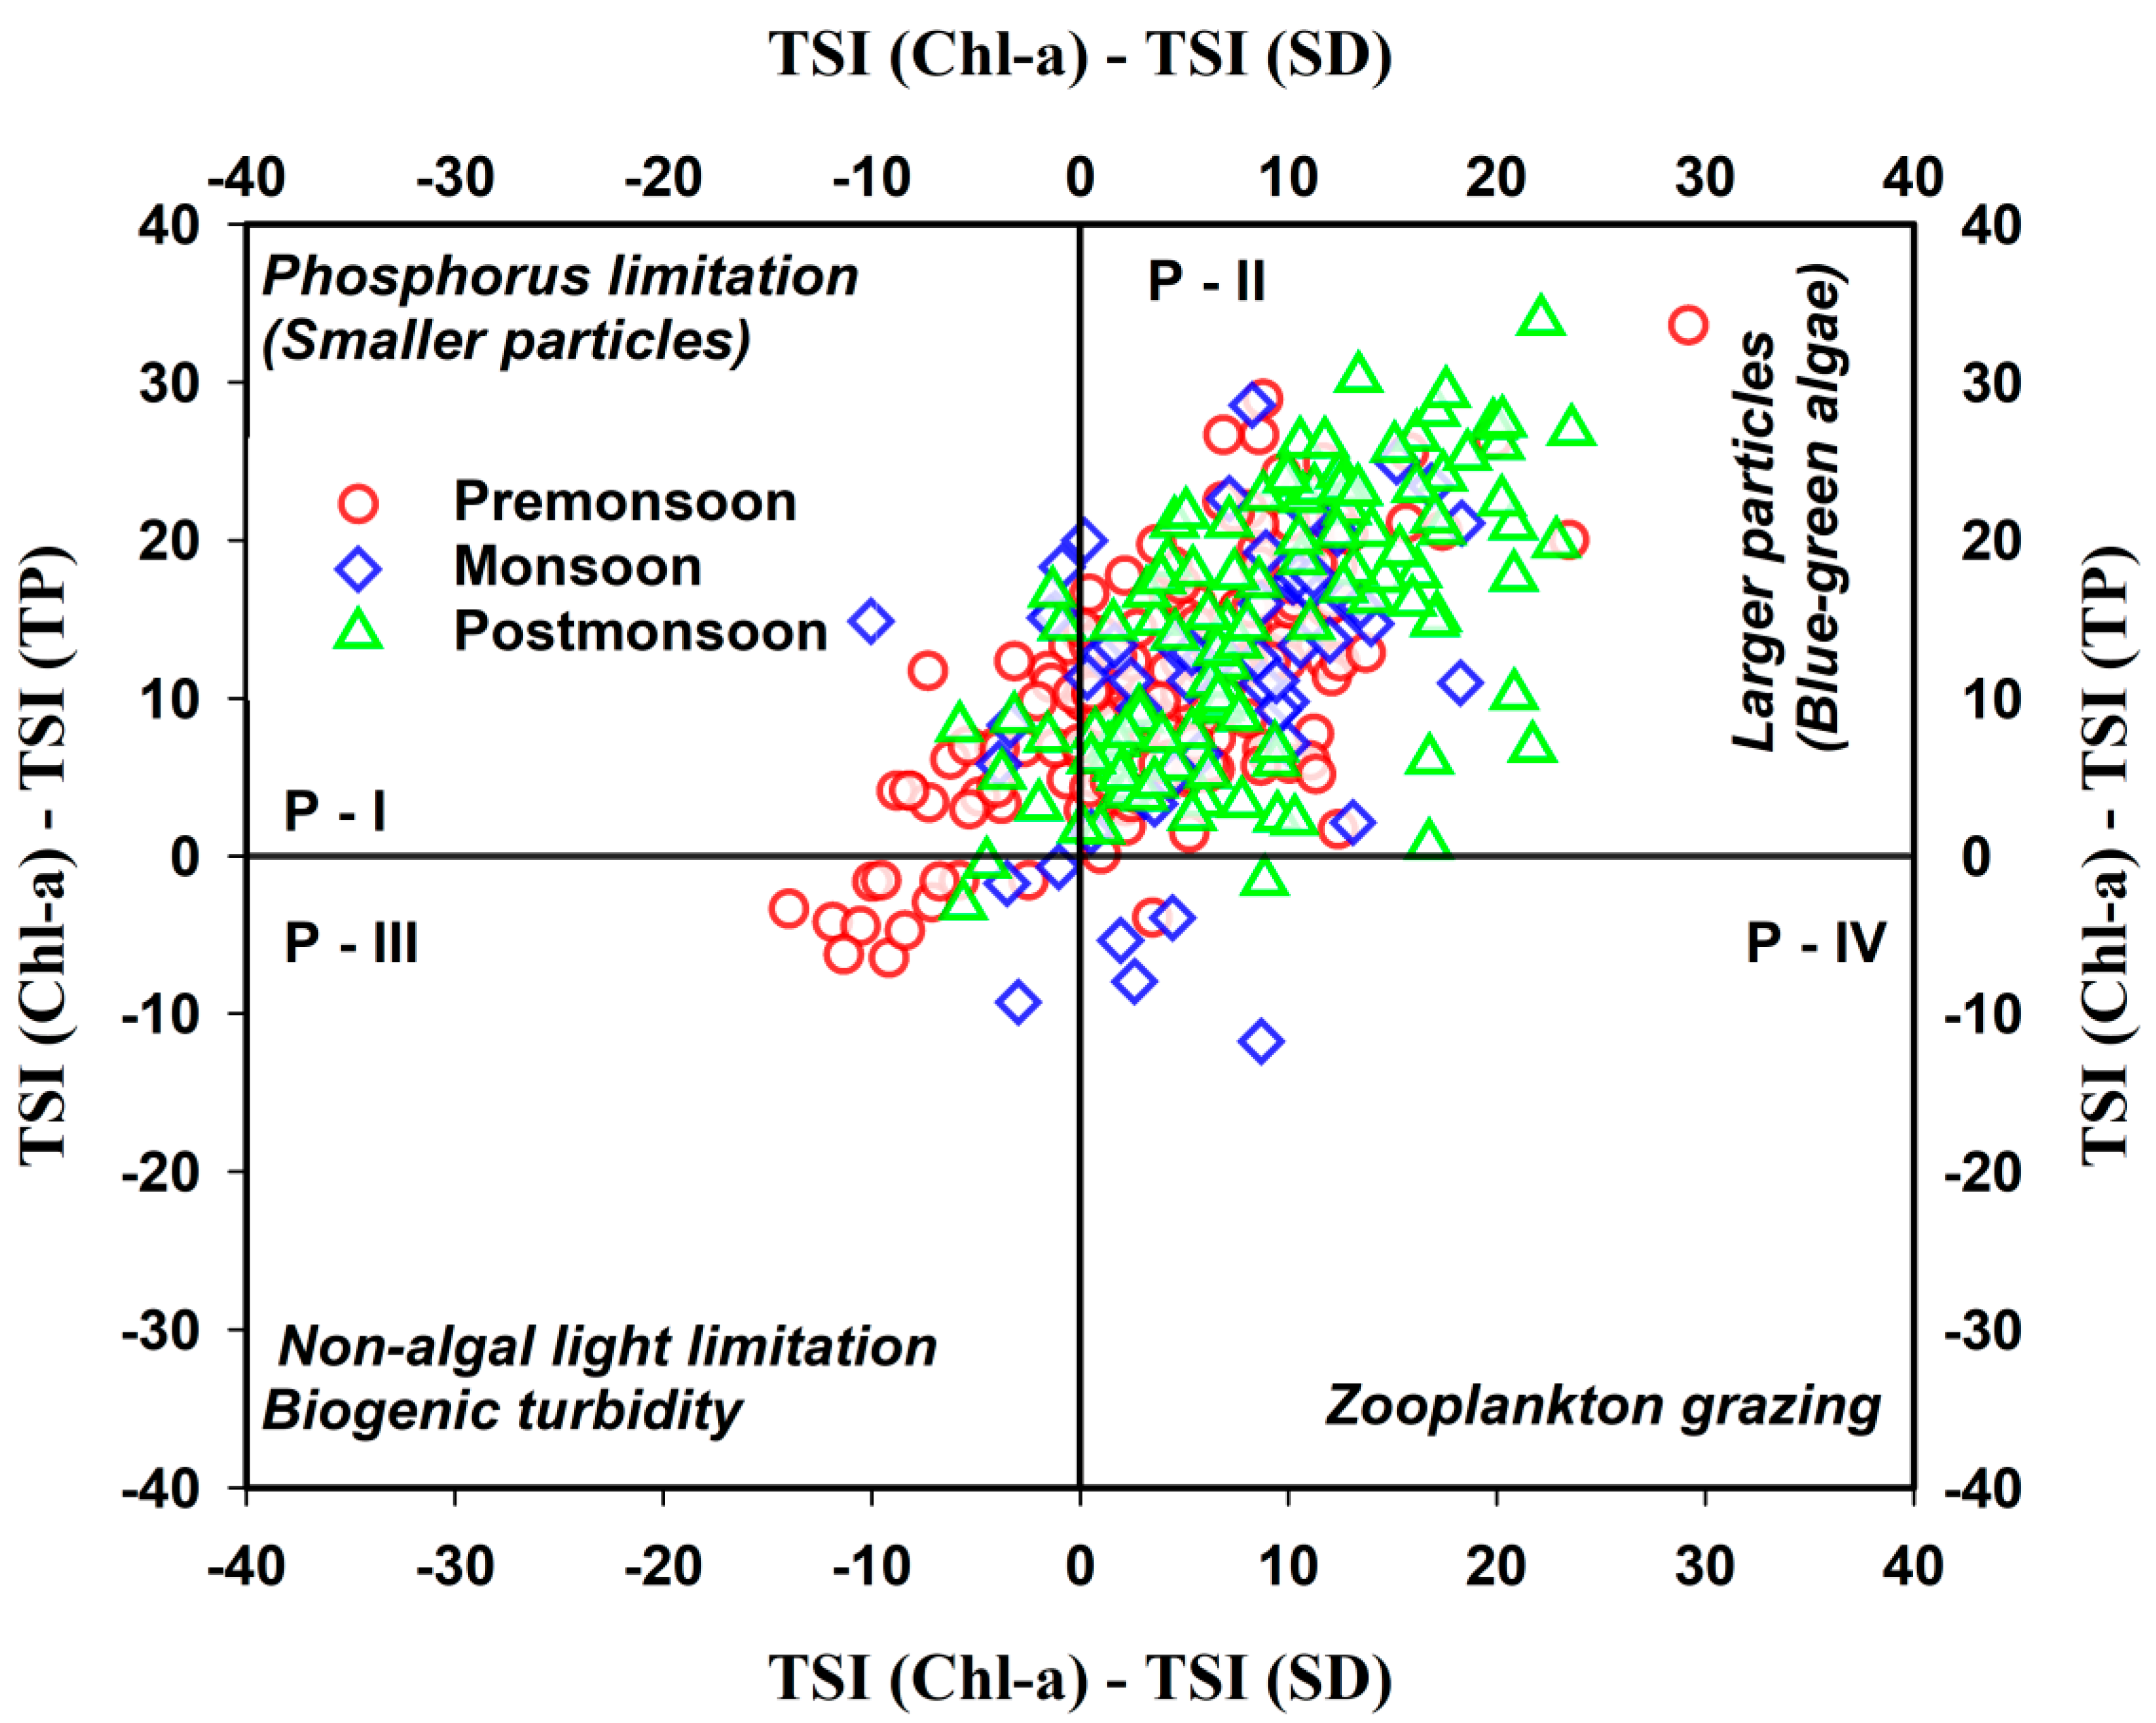
3.7. Trophic State Index Deviation (TSID)

We performed the site-based and seasonal trend analysis on the trophic state index (TSI) of TP, CHL-a, and SD. The graphical presentation highlights the predominant trophic condition in the Yongdam reservoir (Figure 7). The TP trophic state indicated increasing eutrophication tendency during the monsoon period, which alluded to higher TP inflows with the runoff inflowing. The TP showed an expanding trend from oligotrophic to hypereutrophic from sites 1 to 4. The algal productivity (CHL-a) displayed clear eutrophication signs at site 4, indicating an increase in algal productivity along the reservoir gradient. However, the TSI (SD) demonstrated a mean mesotrophic state at all the study sites.
We plotted the two-dimensional seasonal response of the TSI factors (TP, CHL-a, and TP) given by Carlson [50] as TSI (CHL-a)–TSI (SD) along the x-axis while TSI (CHL-a)–TSI (TP) along the y-axis. The post-monsoon trophic status mainly deviated from the algal productivity (blue-green algae) and larger particles (Figure 8). There was an overall tendency of larger particles presence and the blue-green algae, indicating a more substantial summer monsoon influence on the reservoir productivity. The seasonal deviations suggested that the reservoir’s mainstream displayed a minimal to no zooplankton grazing activity during the year. However, the Yongdam reservoir showed a propensity of non-algal light limitation during the pre-monsoon season, with a slight P-limitation. Slighter chances of zooplankton grazing occurred during the monsoon season as well. The burgeoning blue-green algal tendencies during the pre-monsoon, monsoon, and post-monsoon seasons mostly alluded to the higher chances of eutrophication due to the increasing nutrient enrichment. Moreover, such seasonal trends also revealed the potential impact of WRT and the fluctuating water volume.
The TSI is a multidimensional approach mainly applied to the lentic ecosystems, their physiognomic, and the essential energy transfer dynamics. The leading conclusions specify that no particular nutrient could be held responsible for the reservoirs’ trophic state [4,50]. The water clarity and algal biomass are inversely linked based on the grazing principle, while phosphorus emerges as the crucial nutrient contributing factor in this condition [65]. Consistent nutrient enrichment from diffused sources is causing multiple and widespread problems, including the risks of recurrent eutrophication events in various parts of the world across the lentic, lotic and coastal ecosystems. Severe eutrophication actively drives the production of HABs that are strongly capable of producing harmful and toxic compounds that jeopardize the drinking and ecological water quality. As agriculture is the leading contributor of nutrients, nutrient reduction measures should help mitigate the recurrent nutrient enrichment if the reduction measures are adequately implemented. This study adequately supports this notion as sustained in the case of the seasonal trophic state. However, to specify the most critical and critical limiting nutrient, a bioassay is conducted to reveal the suitable answers to such queries and understand the underlying basis of a specific nutrient.

4. Conclusions and Management Strategies

The effective management and sustainable conservation of drinking water facilities are of imperative importance during the modern age. South Korea is rapidly turning towards intensive agricultural activities after urbanization and industrial success. As a result, the temperate reservoirs used for human drinking are under stress of nutrient enrichment and concomitant eutrophication. We performed this study in one of the largest drinking water temperate reservoirs in South Korea that spanned seven years (2013–2019). The outcomes have denoted that the monsoon rainfall regime strongly induced the water quality changes in the Yongdam reservoir. The intensive rainfall events primarily regulated the inflow and water residence time. We found that the potential factors influencing the algal chlorophyll (CHL-a) could be designated as the intensive rainfall patterns, influx, and phosphorus yielding nutrients. Various types of analyses corroborated each other, confirming the TP as the limiting factor. The PCA displayed that the reservoir water quality is primarily modified by the monsoon and organic matter closely linked to each other and the inflowing solids. The empirical models also supported the P-limitation scenarios along with the trophic state index deviation (TSID). The longitudinal gradient of the riverine–transition–lacustrine zones similarly displayed the variation patterns to the longitudinal zonation. Thus, the spatial and seasonal fluctuations between the algal CHL-a, nutrients, and TSS significantly accounted for the ambient water quality and nutrient enrichment status deviations.
Reservoir water quality’s most common management issues include algal blooms, turbidity, nutrient enrichment, organic matter inflow, persistent large aquatic plants, water level fluctuations, and species shifts. Therefore, the most critical aspect of reservoir water quality management is the nutrient regulation and control of anthropic activities in the reservoir watershed, contributing to high nutrients and organic matter. The gradual reduction in TP loads and external nutrients control is the most commonly used measure in this case. Another successful option could be the diversion of nutrients discharge as well as strict monitoring of the WWTPs effluents along with other industrial releases. On the other hand, in-lake treatment methods (aeration and dredging) could also help alleviate the persistent water quality issues. However, such methods are mainly eutrophication targeting and offer only short-term treatment options. As lakes and reservoirs act as the sink for pollutants and inflowing sediments, active management of anthropic activities in the surrounding watersheds could offer long-term and comprehensive management options in the large lakes and reservoirs.

Supplementary Materials

The following are available online at https://www.mdpi.com/article/10.3390/w13131720/s1, Figure S1. Annual variations of the nutrients (TP, TN, and their ratio), chlorophyll a (CHL-a), organic matters (BOD, TOC), and total suspended solids (TSS), along with CHL:TN, CHL:TN (red line—mean value). Figure S2. Annual (right) and seasonal (left) trends in the rainfall and inflow patterns in Yongdam Reservoir water basin during the study periods (red line—average value).

Author Contributions

Conceptualization, N.J., U.A., M.M. and K.-G.A.; methodology, N.J., U.A., M.M. and K.-G.A.; software, N.J., M.M. and U.A.; validation, N.J., U.A., and K.-G.A.; formal analysis, N.J., M.M., U.A.; investigation, N.J., U.A. and M.M.; resources, U.A., and K.-G.A.; data curation, N.J., U.A., writing—original draft preparation, N.J., U.A.; writing—review and editing, U.A.; visualization, N.J., M.M. and U.A.; supervision, U.A. and K.-G.A.; project administration, U.A. and K.-G.A.; funding acquisition, K.-G.A. N.J. and U.A. equally participated in this study. All authors have read and agreed to the published version of the manuscript.

Funding

This research received no external funding.

Institutional Review Board Statement

Not applicable.

Informed Consent Statement

Not applicable.

Data Availability Statement

The data may be available upon request to the corresponding author, subject to the approval.

Acknowledgments

This work was supported by the research fund of Chungnam National University.

Conflicts of Interest

The authors declare no conflict of interest.

References

  1. Atique, U.; An, K.-G. Stream health evaluation using a combined approach of multi-metric chemical pollution and biological integrity models. Water 2018, 10, 661. [Google Scholar] [CrossRef] [Green Version]
  2. Wang, M.; Xu, X.; Wu, Z.; Zhang, X.; Sun, P.; Wen, Y.; Wang, Z.; Lu, X.; Zhang, W.; Wang, X.; et al. Seasonal Pattern of Nutrient Limitation in a Eutrophic Lake and Quantitative Analysis of the Impacts from Internal Nutrient Cycling. Environ. Sci. Technol. 2019, 13675–13686. [Google Scholar] [CrossRef]
  3. Wu, Z.; Zou, R.; Jiang, Q.; Elser, J.J.; Zhao, L.; Ye, R.; Liu, Y. What maintains seasonal nitrogen limitation in hyper-eutrophic Lake Dianchi? Insights from stoichiometric three-dimensional numerical modeling. Aquat. Sci. 2020, 82, 1–12. [Google Scholar] [CrossRef]
  4. Atique, U.; An, K.-G. Landscape heterogeneity impacts water chemistry, nutrient regime, organic matter and chlorophyll dynamics in agricultural reservoirs. Ecol. Indic. 2020, 110, 105813. [Google Scholar] [CrossRef]
  5. Kim, J.-J.; Atique, U.; An, K.-G. Long-Term Ecological Health Assessment of a Restored Urban Stream Based on Chemical Water Quality, Physical Habitat Conditions and Biological Integrity. Water 2019, 11, 114. [Google Scholar] [CrossRef] [Green Version]
  6. Kim, J.Y.; Atique, U.; Mamun, M.; An, K.-G. Long-Term Interannual and Seasonal Links between the Nutrient Regime, Sestonic Chlorophyll and Dominant Bluegreen Algae under the Varying Intensity of Monsoon Precipitation in a Drinking Water Reservoir. Int. J. Environ. Res. Public Health 2021, 18, 2871. [Google Scholar] [CrossRef]
  7. Carlson, R.E.; Havens, K.E. Simple graphical methods for the interpretation of relationships between trophic state variables. Lake Reserv. Manag. 2005, 21, 107–118. [Google Scholar] [CrossRef]
  8. Khan, F.A.; Ansari, A.A. Eutrophication: An Ecological Vision. Bot. Rev. 2005, 71, 449–482. [Google Scholar] [CrossRef]
  9. Atique, U.; An, K.-G. Water quality and Trophic state index analysis in relation to Land use patterns in Agricultural Reservoirs. Korea Soc. Environ. Ecol. Proc. 2019, 2, 110. [Google Scholar]
  10. Havens, K.E.; James, R.T.; East, T.L.; Smith, V.H. N:P ratios, light limitation, and cyanobacterial dominance in a subtropical lake impacted by non-point source nutrient pollution. Environ. Pollut. 2003, 122, 379–390. [Google Scholar] [CrossRef]
  11. Haque, M.A.; Jewel, M.A.S.; Atique, U.; Paul, A.K.; Iqbal, S. Seasonal and spatial variation of flagellate communities in a tropical river. Limnologica 2020, 85, 125824. [Google Scholar] [CrossRef]
  12. Smith, V.H.; Schindler, D.W. Eutrophication science: Where do we go from here? Trends Ecol. Evol. 2009, 24, 201–207. [Google Scholar] [CrossRef] [PubMed]
  13. Chislock, M.F.; Doster, E.; Zitomer, R.A.; Wilson, A.E. Eutrophication: Causes, Consequences, and Controls in Aquatic Ecosystems. Nat. Educ. Knowl. 2013, 4, 10. [Google Scholar]
  14. Atique, U.; An, K.-G. Reservoir Water Quality Assessment Based on Chemical Parameters and the Chlorophyll Dynamics in Relation to Nutrient Regime. Polish J. Environ. Stud. 2019, 28, 1043–1061. [Google Scholar] [CrossRef]
  15. Thornton, K.W. Perspectives on reservoir limnology. In Reservoir Limnology: Ecological Perspectives; Thornton, K.W., Kimmel, B.L., Payne, F.E., Eds.; John Wiley and Sons: New York, NY, USA, 1990; pp. 1–13. [Google Scholar]
  16. Huang, J.; Zhang, Y.; Huang, Q.; Gao, J. When and where to reduce nutrient for controlling harmful algal blooms in large eutrophic lake Chaohu, China? Ecol. Indic. 2018, 89, 808–817. [Google Scholar] [CrossRef]
  17. Kennedy, R.H.; Walker, W.W. Reservoir Nutrient Dynamics. In Reservoir Limnology: Ecological Perspectives; Thornton, K.W., Ed.; John Wiley & Sons: New York, NY, USA, 1990. [Google Scholar]
  18. Hara, J.; Atique, U.; An, K.G. Multiyear links between water chemistry, algal chlorophyll, drought-flood regime, and nutrient enrichment in a morphologically complex reservoir. Int. J. Environ. Res. Public Health 2020, 17, 3139. [Google Scholar] [CrossRef] [PubMed]
  19. Nõges, T. Relationships between morphometry, geographic location and water quality parameters of European lakes. Hydrobiologia 2009, 633, 33–43. [Google Scholar] [CrossRef]
  20. Mamun, M.; Kwon, S.; Kim, J.E.; An, K.G. Evaluation of algal chlorophyll and nutrient relations and the N:P ratios along with trophic status and light regime in 60 Korea reservoirs. Sci. Total Environ. 2020, 741, 140451. [Google Scholar] [CrossRef]
  21. An, K.G.; Park, S.S. Indirect influence of the summer monsoon on chlorophyll-total phosphorus models in reservoirs: A case study. Ecol. Model. 2002, 152, 191–203. [Google Scholar] [CrossRef]
  22. Kim, B.; Park, J.H.; Hwang, G.; Jun, M.S.; Choi, K. Eutrophication of reservoirs in South Korea. Limnology 2001, 2, 223–229. [Google Scholar] [CrossRef]
  23. Lee, J.H.; Kim, J.M.; Kim, D.S.; Hwang, S.J.; An, K.G. Nutrients and chlorophyll-a dynamics in a temperate reservoir influenced by Asian monsoon along with in situ nutrient enrichment bioassays. Limnology 2010, 11, 49–62. [Google Scholar] [CrossRef]
  24. Jones, J.R.; Knowlton, M.F.; An, K.G. Trophic state, seasonal patterns and empirical models in South Korean Reservoirs. Lake Reserv. Manag. 2003, 19, 64–78. [Google Scholar] [CrossRef]
  25. Liang, Z.; Soranno, P.A.; Wagner, T. The role of phosphorus and nitrogen on chlorophyll a: Evidence from hundreds of lakes. Water Res. 2020, 185, 116236. [Google Scholar] [CrossRef] [PubMed]
  26. Cheng, K.S.; Lei, T.C. Reservoir trophic state evaluation using Landsat TM images. JAWRA 2001, 37, 1321–1334. [Google Scholar]
  27. Ling, T.Y.; Gerunsin, N.; Soo, C.L.; Nyanti, L.; Sim, S.F.; Grinang, J. Seasonal changes and spatial variation in water quality of a large young tropical reservoir and its downstream river. J. Chem. 2017, 2017, 8153246. [Google Scholar] [CrossRef] [Green Version]
  28. Markad, A.T.; Landge, A.T.; Nayak, B.B.; Inamdar, A.B.; Mishra, A.K. Trophic state modeling for shallow freshwater reservoir: A new approach. Environ. Monit. Assess. 2019, 191, 586. [Google Scholar] [CrossRef]
  29. Rowland, F.E.; North, R.L.; McEachern, P.; Obrecht, D.V.; Gurung, T.B.; Jones, S.B.; Jones, J.R. Phytoplankton nutrient deficiencies vary with season in sub-tropical lakes of Nepal. Hydrobiologia 2019, 833, 157–172. [Google Scholar] [CrossRef]
  30. Arunbabu, E.; Ravichandran, S.; Sreeja, P. Sedimentation and internal phosphorus loads in Krishnagiri Reservoir, India. Lakes Reserv. Res. Manag. 2014, 19, 161–173. [Google Scholar] [CrossRef]
  31. Filstrup, C.T.; Downing, J.A. Relationship of chlorophyll to phosphorus and nitrogen in nutrient-rich lakes. Inl. Waters 2017, 7, 385–400. [Google Scholar] [CrossRef]
  32. Atique, U.; Iqbal, S.; Khan, N.; Qazi, B.; Javeed, A.; Anjum, K.M.; Haider, M.S.; Khan, T.A.; Mahmood, S.; Sherzada, S. Multivariate Assessment of Water Chemistry and Metals in a River Impacted by Tanning Industry. Fresenius Environ. Bull. 2020, 29, 3013–3025. [Google Scholar]
  33. Haque, M.A.; Paul, S.; Jewel, M.A.S.; Atique, U.; Ahmed, Z.; Paul, A.K.; Iqbal, S.; Mahboob, S. Seasonal analysis of food items and feeding habits of endangered riverine catfish Rita rita (Hamilton, 1822). Braz. J. Biol. 2022, 82, 1–11. [Google Scholar] [CrossRef]
  34. Abell, J.M.; Özkundakci, D.; Hamilton, D.; Miller, S. Relationships between land use and nitrogen and phosphorus in New Zealand lakes. Mar. Freshw. Res. 2011, 62, 162–175. [Google Scholar] [CrossRef] [Green Version]
  35. Atique, U.; Byungjin, L.; Johee, Y.; An, K.-G. Biological Health Assessments of Lotic Waters by Biotic Integrity Indices and their Relations to Water Chemistry. Water 2019, 11, 436. [Google Scholar] [CrossRef] [Green Version]
  36. Bae, D.-Y.; Atique, U.; Yoon, J.; Lim, B.; An, K.-G. Ecological Risk Assessment of Urban Streams Using Fish Biomarkers of DNA Damages and Physiological Responses. Polish J. Environ. Stud. 2020, 29, 1–10. [Google Scholar] [CrossRef]
  37. Knowlton, M.F.; Jones, J.R. Temporal and spatial dynamics of suspended sediment, nutrients, and algal biomass in Mark Twain Lake, Missouri. Arch. Hydrobiol. 1995, 135, 145–178. [Google Scholar] [CrossRef]
  38. Ma, M.; Jia, J.; Hu, Y.; Yang, J.; Lu, Y.; Shi, K.; Gao, Y. Changes in chlorophyll a and its response to nitrogen and phosphorus characteristics over the past three decades in Poyang Lake, China. Ecohydrology 2020, 14, e2270. [Google Scholar] [CrossRef]
  39. Sterner, R.W. On the phosphorus limitation paradigm for lakes. Int. Rev. Hydrobiol. 2008, 93, 433–445. [Google Scholar] [CrossRef]
  40. Morris, D.P.; Lewis, W.M. Phytoplankton nutrient limitation in Colorado mountain lakes. Freshw. Biol. 1988, 20, 315–327. [Google Scholar] [CrossRef]
  41. Maberly, S.C.; Pitt, J.A.; Davies, P.S.; Carvalho, L. Nitrogen and phosphorus limitation and the management of small productive lakes. Inl. Waters 2020, 10, 159–172. [Google Scholar] [CrossRef] [Green Version]
  42. Dzialowski, A.R.; Wang, S.-H.; Lim, N.-C.; Spotts, W.W.; Huggins, D.G. Nutrient limitation of phytoplankton growth in central plains reservoirs, USA. J. Plankton Res. 2005, 27, 587–595. [Google Scholar] [CrossRef]
  43. Dubourg, P.; North, R.L.; Hunter, K.; Vandergucht, D.M.; Abirhire, O.; Silsbe, G.M.; Guildford, S.J.; Hudson, J.J. Light and nutrient co-limitation of phytoplankton communities in a large reservoir: Lake Diefenbaker, Saskatchewan, Canada. J. Great Lakes Res. 2015, 41, 129–143. [Google Scholar] [CrossRef]
  44. Walker, J.; Zipper, C.; Shabman, L.; Younos, T. A Literature Review for Use in Nutrient Criteria Development for Freshwater Streams and Rivers in Virginia; SR28-2006; Virginia Water Resources Research Center: Blacksburg, VA, USA, 2006. [Google Scholar]
  45. Klippel, G.; Macêdo, R.L.; Branco, C.W.C. Comparison of different trophic state indices applied to tropical reservoirs. Lakes Reserv. Res. Manag. 2020, 25, 214–229. [Google Scholar] [CrossRef]
  46. Mamun, M.; Kim, J.Y.; An, K.-G. Trophic Responses of the Asian Reservoir to Long-Term Seasonal and Interannual Dynamic Monsoon. Water 2020, 12, 2066. [Google Scholar] [CrossRef]
  47. Ingole, N.P.; An, K.-G. Modifications of nutrient regime, chlorophyll-a, and trophic state relations in Daechung Reservoir after the construction of an upper dam. J. Ecol. Environ. 2016, 40, 5. [Google Scholar] [CrossRef] [Green Version]
  48. An, K.-G. Long-term Seasonal and Interannual Variability of Epilimnetic Nutrients (N, P), Chlorophyll-a, and Suspended Solids at the Dam Site of Yongdam Reservoir and Empirical Models. Korean J. Ecol. Environ. 2011, 44, 214–225. [Google Scholar]
  49. APHA. Standard Methods for the Examination of Water and Wastewater, 21st ed.; American Public Health Association: New York, NY, USA, 2005. [Google Scholar]
  50. Carlson, R.E. A trophic state index for lakes. Limnol. Oceanogr. 1977, 22, 361–369. [Google Scholar] [CrossRef] [Green Version]
  51. Nürnberg, G.K. Trophic state of clear and colored, soft- and hardwater lakes with special consideration of nutrients, anoxia, phytoplankton and fish. Lake Reserv. Manag. 1996, 12, 432–447. [Google Scholar] [CrossRef]
  52. Downing, J.A.; Watson, S.B.; McCauley, E. Predicting cyanobacteria dominance in lakes. Can. J. Fish. Aquat. Sci. 2001, 58, 1905–1908. [Google Scholar] [CrossRef]
  53. Chorus, I.; Bartram, J. Toxic Cyanobacteria in Water: A Guide to Their Public Health Consequences, Monitoring and Management; World Health Organization: Geneva, Switzerland, 1999; ISBN 0419239308. [Google Scholar]
  54. Li, S.; Wang, X.; Qiao, B.; Li, J.; Tu, J. First flush characteristics of rainfall runoff from a paddy field in the Taihu Lake watershed, China. Environ. Sci. Pollut. Res. 2017, 24, 8336–8351. [Google Scholar] [CrossRef]
  55. Morales-Marín, L.A.; Wheater, H.S.; Lindenschmidt, K.E. Assessment of nutrient loadings of a large multipurpose prairie reservoir. J. Hydrol. 2017, 550, 166–185. [Google Scholar] [CrossRef]
  56. Kim, J.Y.; Atique, U.; An, K.-G. Relative Abundance and Invasion Dynamics of Alien Fish Species Linked to Chemical Conditions, Ecosystem Health, Native Fish Assemblage, and Stream Order. Water 2021, 13, 158. [Google Scholar] [CrossRef]
  57. Moon, W.-K.; Atique, U.; An, K.-G. Ecological risk assessments and eco-toxicity analyses using chemical, biological, physiological responses, DNA damages and gene-level biomarkers in Zebrafish (Danio rerio) in an urban stream. Chemosphere 2019, 239, 124754. [Google Scholar] [CrossRef]
  58. Atique, U.; Kwon, S.; An, K.-G. Linking weir imprints with riverine water chemistry, microhabitat alterations, fish assemblages, chlorophyll-nutrient dynamics, and ecological health assessments. Ecol. Indic. 2020, 117, 106652. [Google Scholar] [CrossRef]
  59. Quinlan, R.; Filazzola, A.; Mahdiyan, O.; Shuvo, A.; Blagrave, K.; Ewins, C.; Moslenko, L.; Gray, D.K.; O’Reilly, C.M.; Sharma, S. Relationships of total phosphorus and chlorophyll in lakes worldwide. Limnol. Oceanogr. 2020, 66, 392–404. [Google Scholar] [CrossRef]
  60. Sharip, Z.; Zaki, A.T.A.; Shapai, M.A.H.M.; Suratman, S.; Shaaban, A.J. Lakes of Malaysia: Water quality, eutrophication and management. Lakes Reserv. Res. Manag. 2014, 19, 130–141. [Google Scholar] [CrossRef]
  61. Qian, S.S. Environmental and Ecological Statistics with R, 2nd ed.; Chapman and Hall/CRC: London, UK, 2016; ISBN 9781498728720. [Google Scholar]
  62. Sun, W.; Xia, C.; Xu, M.; Guo, J.; Sun, G. Application of modified water quality indices as indicators to assess the spatial and temporal trends of water quality in the Dongjiang River. Ecol. Indic. 2016, 66, 306–312. [Google Scholar] [CrossRef]
  63. Lee, J.; Lee, S.; Yu, S.; Rhew, D. Relationships between water quality parameters in rivers and lakes: BOD5, COD, NBOPs, and TOC. Environ. Monit. Assess. 2016, 188, 1–8. [Google Scholar] [CrossRef]
  64. Dhanya, S.; Joseph, A. Assessment of physico-chemical properties of water and phytoplankton bloom formation in a eutrophic pond using multivariate analysis. Lakes Reserv. Res. Manag. 2019, 24, 153–161. [Google Scholar] [CrossRef]
  65. Welch, E.B.; Brattebo, S.K.; Overland, C. Four decades of diluting phosphorus to maintain lake quality. Water Environ. Res. 2020, 92, 26–34. [Google Scholar] [CrossRef]
Figure 1. Study area map of Yongdam Reservoir showing four study sites and the location of the water intake tower.
Water 13 01720 g001
Figure 2. Seasonal trend analysis using the box and whisker plots of nutrients (TP, TN, and their ratio), organic matter (BOD, TOC), total suspended solids (TSS), ambient ratios of CHL-a:TP, CHL-a:TN, and CHL-a (Red line denotes the mean value).
Water 13 01720 g002
Figure 3. Linear regression models of log-transformed CHL-a, nutrients, and ambient ratio (color meaning: blue–site 1, brown–site 2, green–site 3, pink–site 4).
Water 13 01720 g003
Figure 4. Conditional plots on each range of TP (a) and TN (b) for relationships between CHL-a vs. TN, and CHL-a vs. TP.
Water 13 01720 g004
Figure 5. Pearson correlation analysis between measured water quality parameters.
Water 13 01720 g005
Figure 6. Biplot on the first two principal components (color meaning: blue–site 1, brown–site 2, green–site 3, purple–site 4).
Water 13 01720 g006
Figure 7. Trophic state index based on total phosphorus (TP), chlorophyll-a (CHL-a), and Secchi depth (SD) of the Yongdam Reservoir during the (a) pre-monsoon, (b) monsoon, and (c) post-monsoon seasons over the period 2013–2019.
Water 13 01720 g007
Figure 8. Trophic state deviation (TSID) during pre-monsoon, monsoon, and post-monsoon seasons in Yongdam Reservoir.
Water 13 01720 g008
Table 1. The measured water quality parameters at the study sites in Yeongdam Reservoir throughout 2013–2019 (Lz–lacustrine zone, Tz–transition zone, Rz–riverine zone).
Water Quality ParameterLzTzRz
S1S2S3S4
Mean ± SD (Min–Max)Mean ± SD (Min–Max)Mean ± SD (Min–Max)Mean ± SD (Min–Max)
WT (℃)9.39 ± 3.083.0–16.79.55 ± 3.193.0–17.711.08 ± 4.283.0–19.813.57 ± 6.063.7–24.3
EC (μS/cm)126.4 ± 3.5990–161126.4 ± 3.7790–156127.6 ± 4.8676–171135.9 ± 8.2182–210
TSS (mg/L)0.92 ± 0.210.3–2.91.03 ± 0.230.3–3.81.10 ± 0.290.3–4.61.89 ± 0.650.3–6.1
BOD (mg/L)0.94 ± 0.070.5–1.90.95 ± 0.050.5–1.81.00 ± 0.080.4–1.91.18 ± 0.140.7–2.3
COD (mg/L)2.61 ± 0.081.9–3.72.61 ± 0.081.9–3.92.71 ± 0.121.8–3.93.05 ± 0.202–5.3
TOC (mg/L)1.64 ± 0.081.2–2.21.63 ± 0.081.1–2.21.71 ± 0.151–2.61.88 ± 0.221.2–3.1
DO (mg/L)9.45 ± 1.305.6–12.59.53 ± 1.425.6–12.59.38 ± 1.674.3–12.79.23 ± 2.124.1–13.4
pH7.39 ± 0.116.0–8.17.40 ± 0.105.8–8.37.46 ± 0.086.6–8.17.56 ± 0.096.4–8.4
TN (mg/L)1.67 ± 0.081.15–2.221.68 ± 0.081.18–2.411.74 ± 0.111.17–2.571.81 ± 0.200.68–3.39
TDN (mg/L)1.59 ± 0.081.01–2.161.60 ± 0.081.01–2.161.66 ± 0.111.04–2.551.73 ± 0.200.64–3.29
NH4-N (mg/L)0.05 ± 0.020–0.460.04 ± 0.010.00–2.410.06 ± 0.020.00–0.460.06 ± 0.010.003–0.32
NO3-N (mg/L)1.29 ± 0.080.53–1.921.29 ± 0.100.73–1.981.34 ± 0.150.69–2.201.33 ± 0.250.32–2.91
TP (µg/L)8.02 ± 1.382.0–168.10 ± 1.133–169.76 ± 2.643–3517.09 ± 7.596–97
TDP (µg/L)4.74 ± 1.000–294.43 ± 1.260–155.85 ± 2.530–269.89 ± 5.371–61
PO4-P (µg/L)1.48 ± 0.800–71.51 ± 0.690–72.36 ± 2.180–204.39 ± 3.590–43
TN:TP243 ± 52192–354231 ± 30183–278212 ± 54141–324141 ± 3962–221
TCB (CFU/100mL)124.5 ± 91.22–1409159.7 ± 111.22–1708156.2 ± 124.71–1656192.9 ± 137.34–1870
CHL-a (µg/L)2.88 ± 1.100.4–12.22.68 ± 1.410.2–14.32.90 ± 1.330.6–9.64.89 ± 1.730.5–17
Table 2. The variance analysis of nutrients, organic matters (BOD, TOC), and CHL-a for spatial (A) and seasonal-monsoon (B) patterns in the reservoir.
ParametersKruskal–Wallis Test (A)Mean ± Standard Deviation (Range)Kruskal–Wallis Test (B)
PremonsoonMonsoonPostmonsoon
TSS (mg/L)H = 16.5 ***1.04 ± 0.69
(0.3–4.9)
1.45 ± 1.20
(0.3–6)
1.40 ± 1.02
(0.3–6.1)
H = 13.10 **
BOD (mg/L)H = 14.9 **0.97 ± 0.20
(0.6–1.6)
1.09 ± 0.35
(0.6–2)
1.04 ± 0.37
(0.4–2.3)
H = 3.45
TOC (mg/L)H = 11.9 *1.61 ± 0.24
(1.1–2.4)
1.72 ± 0.33
(1–2.5)
1.85 ± 0.30
(1.4–3.1)
H = 42.58 ***
CHL-a (ug/L)H = 10.4 *2.33 ± 2.06
(0.2–15.7)
3.05 ± 2.47
(0.7–15.1)
4.90 ± 3.52
(1.1–17)
H = 59.64 ***
TN (mg/L)H = 4.51.72 ± 0.35
(1.22–3.39)
1.76 ± 0.34
(1.15–2.67)
1.72 ± 0.26
(0.68–2.55)
H = 2.11
TP (ug/L)H = 22.6 ***8.98 ± 3.71
(3–22)
13.20 ± 15.23
(2–97)
11.92 ± 7.94
(5–52)
H = 12.75 **
TN:TPH = 21. 2 **222 ± 93.2
(81–612)
214 ± 121.4
(34–363)
182 ± 72.3
(30–361)
H = 9.59 *
H—Kruskal–Wallis ANOWA for non-parameter method, * significant is <0.01, ** significant is <0.005, *** significant is <0.001).
Table 3. Long-term trend analysis of limnological variables in the reservoir over the period 2013–2019 (S–Statistic, Z–Standardized variable, (+)–significantly upward trend, (0)–no trend, (−)–significantly downward trend, PP–particulate phosphate, TCB–total coliform bacteria).
VariableSZp-ValueTrend
WT16206.255<0.001+
EC4381.688 0
TSS 7863.034<0.01+
BOD4691.811 0
COD6242.408<0.05+
TOC16086.216<0.001+
DO−1790−6.912<0.001
pH7042.718<0.01+
TN−11−0.038 0
TDN −36−0.135 0
NH4-N1510.579 0
NO3-N−732−2.824<0.01
TP 2991.152 0
TDP5762.223<0.05+
PO4-P 6372.48<0.05+
PP −190−0.731 0
TCB10894.203<0.001+
CHL-a12184.702<0.001+
Table 4. The monsoon-seasonal responses of log-transformed TP and TN to Log10 (TN:TP).
Empirical ModelSeasonSizeEquationR2F Value
Log10 (TN:TP) vs. Log10 (TP, ug/L)Premonsoon24TN:TP = 0.134 − (0.860 * TP)0.896190.48 ***
Monsoon8TN:TP = 0.0219 − (0.702 * TP)0.944100.84 ***
Postmonsoon16TN:TP = 0.112 − (0.845 * TP)0.913147.17 ***
Log10 (TN:TP) vs. Log10 (TN, mg/L)Premonsoon24TN:TP = −0.565 − (0.460 * TN)0.0030.40
Monsoon8TN:TP = 1.066 − (7.278 * TN)0.74617.62 **
Postmonsoon16TN:TP = −0.784 + (0.0727 * TN)0.0000.002
* Significance of regressions is <0.05, ** significance of the regressions is <0.01, *** significance of regression is <0.001.
Table 5. Loadings of the water quality variables, precipitation, and inflow in the significant PCs (PP–particulate phosphorus).
ParametersPC 1PC 2PC 3PC 4
WT (℃)0.770.24−0.43−0.12
Cond (µS/cm)0.510.500.150.44
pH0.500.24
DO (mg/L)−0.75 0.470.21
BOD (mg/L)0.85−0.160.30−0.17
COD (mg/L)0.82−0.220.140.16
TSS (mg/L)0.87 0.20
TOC (mg/L)0.80−0.52
TN (mg/L)0.490.690.34
TDN (mg/L)0.480.720.320.11
NH4-N (mg/L)0.12−0.140.710.13
NO3-N (mg/L) 0.840.41
TP (ug/L)0.87−0.230.36 −0.10
TDP (ug/L)0.84−0.290.17−0.15
PO4-P (ug/L)0.79−0.28 −0.34
PP (ug/L)0.680.110.49
TCB (Bact/100mL)0.70 −0.59−0.22
CHL-a (ug/L)0.78 −0.280.42
TN:TP−0.790.42−0.32
CHL-a:TP0.210.13−0.670.59
CHL-a:TN0.42−0.11−0.260.53
Rainfall (mm)0.440.65−0.25−0.43
Inflow (cm/s)0.460.45−0.24−0.46
Eigenvalue9.853.492.991.72
% variance48.3116.6815.178.13
Cumulative % variance48.3164.9980.1688.29
Publisher’s Note: MDPI stays neutral with regard to jurisdictional claims in published maps and institutional affiliations.

