Abstract
Blooms of cyanobacteria are frequent in Brazilian water reservoirs used for drinking water. The warning for the presence of potential toxin-producing cyanobacteria is typically based on time-consuming microscopy, rather than specific molecular detection of toxic genes in cyanobacteria. In this study, we developed a quantitative PCR assay for the detection of cyanobacteria producing the neurotoxin saxitoxin (STX). The assay targets the sxtA gene in the sxt gene cluster. Potential and dominant STX-producers in the Itupararanga reservoir were the genera Raphidiopsis, Aphanizomenon and Geitlerinema. Numbers of the sxtA gene varied from 6.76 × 10³ to 7.33 × 10⁵ cells mL−1 and correlated positively with SXT concentrations in the water. Concentrations of STX and the sxtA gene also correlated positively with TN:TP ratio and pH, but correlated negatively with inorganic nutrients and turbidity, confirming that regulation of the SXT production was impacted by environmental variables. In contrast, the occurrence of another cyanotoxin, microcystin, did not correlate with any environmental variables. The developed qPCR assay was found to be a rapid and robust approach for the specific quantification of potential STX-producing cyanobacteria and should be considered in future investigations on toxic cyanobacteria to provide an early warning of potential toxin episodes.
1. Introduction
Cyanobacteria may cause a multitude of water quality concerns. Among these concerns is the potential risk of toxin production, since cyanotoxins in drinking water reservoirs and in recreational water pose a serious risk to human health but also to ecosystem functioning [1]. The most studied cyanotoxin is the hepatotoxic microcystin (MC), which consists of more than 240 structural variants and is produced by several cyanobacterial genera [2,3], including Dolichospermum (basionym Anabaena) [4], Microcystis and Planktothrix. Another important cyanotoxin is saxitoxin (STX), a neurotoxin that occurs in more than 50 variants, and 15 of these variants have so far not been detected in cyanobacteria [5]. The STX-producing freshwater genera include, among others, Raphidiopsis (basionym Cylindrospermopsis) [6], Dolichospermum, and Aphanizomenon.
The physiological and ecological function of cyanotoxins in cyanobacteria is not clear, but some researchers believe that the toxins have a protective function against zooplankton grazing, or are related to interspecies competition for resources, or may improve the cell physiology [7,8]. However, specific factors that stimulate and/or control the production of cyanotoxin by cyanobacteria remain to be determined [9]. Similarly, the fact that the same cyanobacterial strain is capable of synthesizing more than one toxic metabolite makes it even more difficult to understand a cause-effect relationship [10].
The identification and quantification of cyanobacteria by traditional microscopy is not adequate for the identification of toxic populations, since toxic and nontoxic strains are morphologically identical [11]. For the detection of toxin-producing strains, PCR-targeting genes that encode specific toxins may be a fast and useful approach [12]. If the number of potentially toxin-producing cyanobacteria is needed, e.g., in environmental studies, quantitative PCR (qPCR) can be applied and serve as a powerful and sensitive tool [13,14,15,16,17].
In Brazil, relatively few studies have focused on molecular approaches for the detection of toxic genes for early warning of cyanotoxin episodes, despite the frequent occurrence of cyanobacterial blooms [12,18,19,20,21]. In most cases, traditional PCR was used to detect the presence of potentially cyanotoxin-producing strains, but the application of qPCR-targeting genes in the MC synthesis was performed by Lorenzi [19], Pimentel and Giani [11] and Guedes et al. [22] to quantify the mcyA gene in Salto Grande reservoir, the mcyD gene in Furnas reservoir and the mcyB in Funil reservoir, respectively. For production of SXT by cyanobacteria, no qPCR approaches targeting genes in the sxt cluster have so far been applied in Brazilian freshwaters to our knowledge.
The Itupararanga reservoir is located in a subtropical urbanized region of São Paulo State, Brazil, and is one of the most important reservoirs of ecological and economic interests in the state. Water from the reservoir serves many purposes, such as a source of drinking water for approximately one million people, for hydroelectric power and for irrigation of crops [23]. The reservoir has suffered from water quality degradation due to growing urbanization, agricultural practices and discharge of untreated wastewater, especially in the tributaries [24,25,26]. Studies have classified this reservoir as meso-eutrophic [27,28]. Increased nutrient levels have not only contributed to the eutrophication process, they have also introduced a risk of water quality deterioration due to the proliferation of cyanobacteria [29,30,31].
In an attempt to better understand the dynamics of toxin-producing cyanobacteria in the Itupararanga reservoir, we related concentrations of STX and MC to the abundance of known toxin producers, as well as to important environmental parameters (nutrients, turbidity and pH). In parallel, to obtain actual numbers of STX-producing cells in the reservoir, we developed a qPCR approach that targets the sxtA gene in the sxt gene cluster. Finally, we hypothesize that numbers of the sxtA gene correlate with concentrations of STX in the water and can be used for early warning of health risk by saxitoxins.
2. Materials and Methods
2.1. Study Area and Sampling
Environmental samples were collected at the riverine and dam zones in the Itupararanga reservoir located in São Paulo State, Brazil (Figure 1). The main characteristics of the reservoir and sampling sites are shown in Table S1. Sampling was carried out in May, August, October 2017 and January 2018. Water samples were collected at two depths (100%—surface and 1%—lower limit of euphotic zone) determined by the photosynthetically active radiation (PAR, μE m−2 s−1) using a light sensor (LI-1400 DataLogger, sensitivity of 400–700 nm, LI-COR Biosciences, Lincoln, NE, USA).
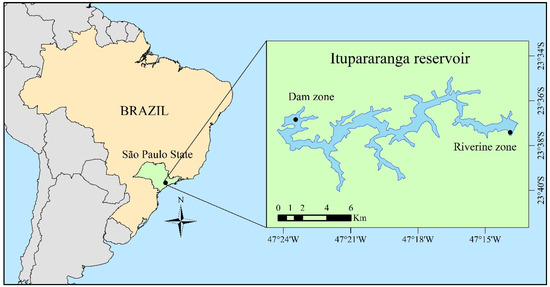
Figure 1.
Sampling sites in the Itupararanga reservoir, São Paulo State, Brazil. Itupararanga riverine zone (23°37′24.8″ S, 47°13′53.4″ W); Itupararanga dam zone (23°36′50.7″ S, 47°23′27.3″ W).
2.2. Environmental Variables
The variables pH, dissolved oxygen (DO, mg L−1), electrical conductivity (EC, µS cm−1), turbidity (NTU) and water temperature (°C) were determined on-site using a HANNA probe (HANNA HI9829, Limena, Italy). Water transparency (m) was determined using a Secchi disk and the lower limit of euphotic zone (Zeu, m) was determined as 1% of PAR. Samples for dissolved nutrients (soluble reactive phosphorus—SRP, nitrate—NO3−-N, nitrite—NO2−-N and ammonium—NH4+-N) were filtered through 0.7 µm-pore-size glass fiber filters (GE Healthcare Life Sciences, Whatman, MA, USA) and the filtrates were kept frozen at −20 °C until analysis. The filters were used for the analysis of chlorophyll a (chl a) and were kept frozen at −20 °C until analysis according to methodology by Nusch [32]. The concentrations of total N (TN) in unfiltered water were determined from sum of Kjeldahl-N and content of nitrite and nitrate, while total P (TP) was determined according to APHA procedure [33]. Nutrient analyses were performed in triplicate by spectrophotometric methods according to APHA [33]. The trophic state index of the sampling sites was calculated considering the annual geometric means of TP and chl a [34].
2.3. Phytoplankton Community
For microscopic phytoplankton analysis, samples were Lugol-fixed for subsequent identification and quantification by the Utermöhl method [35] using an inverted microscope (Olympus CK2) at 400× magnification and sedimentation chambers of 2, 5, or 10 mL, depending on the phytoplankton density in each sample. Sedimentation time was 3 h cm−1 [36]. A counting limit was established by a species-rarefying curve and until reaching 100 individuals (cell, filament, colony and coenobium) of the most common species. Phytoplankton taxa were identified according to specialized literature. Mean cell volume of each taxon (n = 20) was calculated based on geometric models [37,38]. For taxa with relative abundance <10%, mean cell volumes were obtained from the literature. Biovolumes were estimated by multiplying the density of each taxon by its mean cell volume.
Water for the analysis of phytoplankton pigments was filtered through 1.2 µm-pore-size glass fiber filters (GE Healthcare Life Sciences, Whatman, MA, USA) that were kept frozen at −20 °C until pigment extraction. Pigments on the filters were extracted in 3 mL 95% acetone with vitamin E acetate as an internal standard. Initially, the filters were sonicated in an ice-cool sonication bath for 10 min, extracted further at 4 °C for 20 h, and then mixed using a vortex mixer for 10 s. Filters and cell debris were removed from the extracts by filtration through 0.2 µm Teflon syringe filters. Pigment analysis was carried out in a high-performance liquid chromatography system (HPLC) according to Schlüter et al. [39,40] using the Van Heukelem and Thomas method [41]. The HPLC system was calibrated using 22 pigment standards from DHI Lab Products (Table S2). The biomass of the individual phytoplankton groups, detected by the identified pigments, was calculated by CHEMTAX software v.1.95 [42] in units of chlorophyll a (µg chl a L−1). The initial pigment/chl a ratios used in the CHEMTAX software originated from Schlüter et al. [40,43].
2.4. Cyanotoxins
Cyanotoxins were extracted from 50 mL untreated water samples by triplicate freeze-thaw cycles, including freezing at −80 °C for minimum 1 h and sonication at 37 °C for 5–10 min to lyse the cyanobacteria cells. Total saxitoxin (STX) and total microcystin (MC) concentrations were measured by enzyme-linked immune-assay (ELISA), using commercial kits (Analytical System Inc., Beacon, NY, USA) according to procedures by the manufacturer. In the assay, cyanotoxin and cyanotoxin-protein analogues immobilized on the plate compete for binding sites of antibodies in solution. Between washing steps, an antibody-HRP label was added, followed by a color-generating substrate. Color intensities of duplicate samples were measured in an ELISA reader (Expert Plus, ASYS Hitech, Eugendorf, Austria) at 450 nm.
2.5. DNA Extraction, Primer Design and PCR of the sxtA Gene
For DNA extraction, water samples were immediately filtered through 0.22 µm-pore-size mixed cellulose ester membranes (GE Healthcare Life Sciences, Whatman, MA, USA), and the filters were kept frozen at −20 °C until processing. Total genomic DNA was extracted from filters using the DNeasy PowerWater kit (QIAGEN, Hilden, Germany) according to the manufacturer’s instructions. Concentrations of DNA were quantified using a NanoDrop 2000c spectrophotometer (Thermo Scientific, Wilmington, NC, USA) [44]. The DNA purity was determined by the ratio of absorbance at 260 nm to absorbance at 280 nm. Further, the DNA quality was visualized in 1% agarose gel stained with GelRedTM Nucleic Acid Gel Stain (Biotium Inc., Fremont, CA, USA) using a gel documentation system (Bio-Rad Gel Doc™ 2000, Bio-Rad Laboratories, Hercules, CA, USA).
For quantification of SXT-producing cyanobacteria, the qPCR approach by Al-Tebrineh et al. [15] targeting the sxtA gene in Anabaena circinalis and other cyanobacteria was chosen. Unfortunately, repetitive tests showed that multiple amplicons were produced by the primer set, as shown in Figure S1. Therefore, a new primer set for qPCR was designed.
Nucleotide sequences of the saxitoxin synthetase gene sxtA in the selected strains Dolichospermum circinale AWQC131C (EU629179.1), Aphanizomenon flos-aquae NH-5 (EU629175.1) and Raphidiopsis raciborskii T3 (EU629178.1) were obtained from GenBank database and clustered using ClustalW [45]. Regions of high similarity were identified and chosen for primer design using the Primer3Plus [46]. The developed primer pair sxtA-cyano-F (5′-TTATGAAGCGTGCTGTCTGG-3′) and sxtA-cyano-R (5′-TCTGCCGACATGGAATACAC-3′) was tested for specificity (in silico PCR, Table S3) by NCBI Primer-BLAST against the non-redundant database. The dimer prediction was verified with OligoAnalyzer 3.1 (Integrated DNA Technologies Inc., Coralville, IA, USA). The primer set designed for conventional PCR and qPCR assays produced fragments of 153 bp size.
Conventional PCR was performed in triplicate in a Mastercycler Pro thermal cycler (Eppendorf, Hauppauge, NY, USA) with 50 µL total reaction volume containing: 1X Buffer, 2.5 mM MgCl2, 0.2 mM dNTPs, 1 µL (10 pmol µL−1) of each primer (sxtA-cyano-F and sxtA-cyano-R), 0.05 U µL−1 Taq polymerase (VWR International, LLC, Radnor, PA, USA) and 2 µL of template DNA. The thermal cycle program consisted of an initial preheating for 2 min at 95 °C, followed by 35 cycles, each consisting of 30 s at 95 °C, 30 s at 60 °C and 30 s at 72 °C, and a final extension step for 5 min at 72 °C. The amplified PCR products were visualized on 2% agarose gel stained with GelRedTM Nucleic Acid Gel Stain together with a 2-Log DNA Ladder (New England BioLabs Inc., Ipswich, MA, USA) using the Bio-Rad Gel Doc™ 2000 gel documentation system.
To test the specifity of the developed primer set, 4 saxitoxin-producing strains and 5 non-saxitoxin producing strains (Table S3) were analyzed with the PCR assay. Strains were grown at axenic conditions at 24 ± 1 °C, light intensity of 40 µmol photons m−2 s−1, photoperiod of 12-h light/12-h dark, in ASM-1 medium [47]. The cultures were harvested during the exponential growth phase and filtered through 0.22 µm-pore-size mixed cellulose ester membranes under light vacuum. DNA was extracted as mentioned above and amplified with the PCR assay in triplicate. Selected PCR products were purified and sequenced (Eurofins Genomics Company, Ebersberg, Germany) to confirm the specificity of PCR amplification. Sequence identity was determined by BLAST of the NCBI database.
For quantification of the sxtA gene in the environmental samples, the qPCR assay was performed in triplicate by an AriaMx Real-Time PCR System (Agilent Technologies, Santa Clara, CA, USA) using 2 µL of template DNA, 0.4 µL of the sxtA-cyano-F and sxtA-cyano-R primers (10 pmol µL−1), 10 µL of Brilliant III Ultra-Fast SYBR® Green qPCR Master Mix (Agilent Technologies, Santa Clara, CA, USA) and nuclease free water (Sigma-Aldrich, San Luis, MO, USA) for a final volume of 20 µL. The qPCR assay was carried out under the following cycling conditions: initial preheating at 95 °C for 3 min, followed by 40 quantification cycles, each consisting of 30 s at 95 °C, 30 s at 65 °C, 30 s at 72 °C and 10 s at 77.5 °C, and a melt cycle of 30 s at 95 °C, 30 s at 65 °C and 30 s at 95 °C. Fluorescence measurement of generated products was obtained at the end of each cycle at 77.5 °C. Melting curves analysis was performed at the end of each cycle to evaluate the specificity of the newly designed primer set.
To assess the abundance of the sxtA gene in the environmental samples, a standard curve based on cell densities of Raphidiopsis raciborskii T3 (obtained by direct microscopy counts) was established. Dilution series (from 1:10 to 1:107) were performed from the initial DNA concentration of R. raciborskii T3. A standard curve was derived from the correlation between the DNA concentrations (in cell equivalents) and Ct (threshold cycle) values for each dilution.
2.6. Data Analysis
Data were tested for normality using the Shapiro-Wilk test. Canonical correspondence analysis (CCA) was carried out to evaluate the correlation between environmental variables and occurrence of potentially cyanotoxin-producing cyanobacteria genera, considering the sampling sites, months and depths. The environmental variables that showed the highest correlation with axes 1 and 2 (r > 0.5) were retained, whereas the variables that could cause multicollinearity were excluded. Data from the environmental variables were log(x + 1) transformed and the biovolume data were transformed by Hellinger transformation.
Considering the environmental variables, a Mann-Whitney test was performed to evaluate the differences between sites (riverine and dam zones) and depths (100% and 1% of PAR), while a Kruskal-Wallis test was conducted to evaluate the differences between months. Dunn’s post hoc multiple comparison test was performed if significant differences were observed in the Kruskal-Wallis test (p < 0.05). To investigate the relationships between the sxtA gene, STX and MC concentrations and environmental variables, the Spearman’s rank order correlation tests were performed (p < 0.05). Data were analyzed using the PAST version (4.06) [48] and STATISTICA version (13.5) (TIBCO Software Inc., Palo Alto, CA, USA).
3. Results
3.1. Phytoplankton Composition
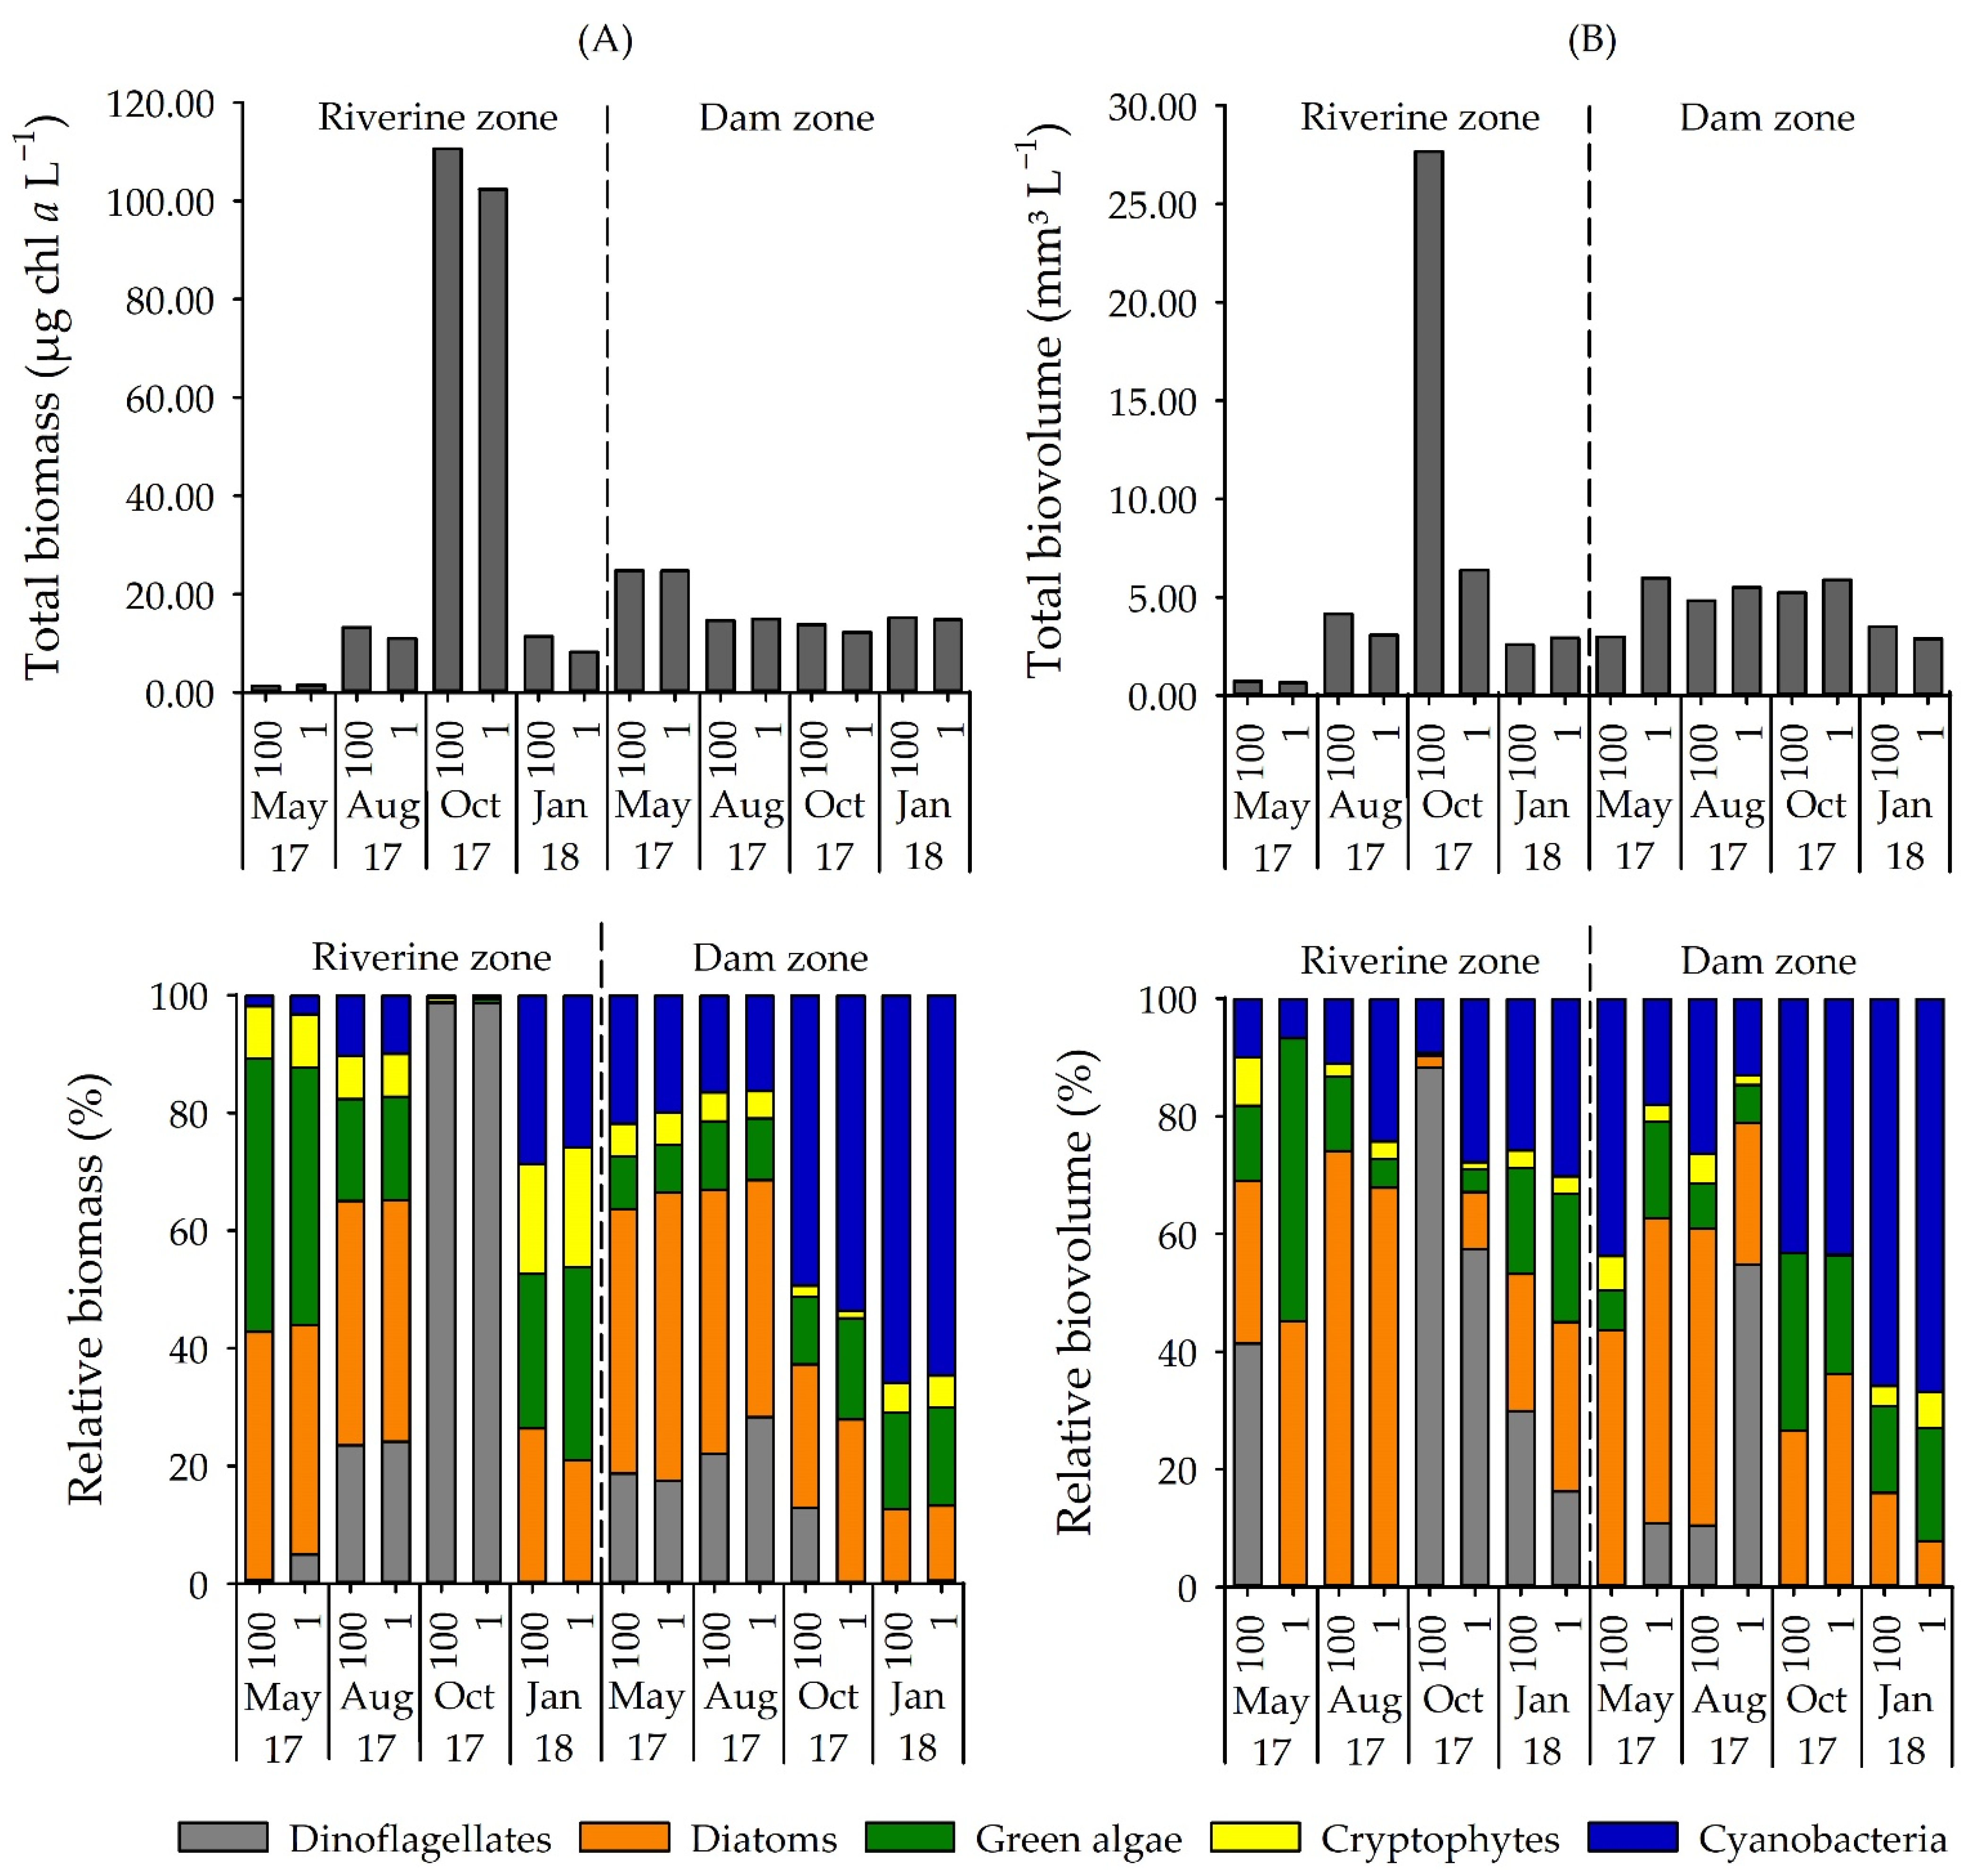
Chromatographic detection of the cyanobacterial-specific pigments confirmed a general presence of cyanobacteria in the reservoir (Figure 2a). Zeaxanthin occurred in all samples, while echinenone, canthaxanthin and aphanizophyll were present in most samples. The presence of euglenophytes and green algae (including classes Chlorophycceae, Trebouxiophyceae and Zygnematophyceae) were identified by chl b, lutein, violaxanthin, and neoxanthin. Alloxanthin showed the presence of cryptophytes. Diatoms and chrysophytes were identified by the presence of fucoxanthin, chl c2, and chl c3, while peridinin revealed the presence of dinoflagellates. Microscopy analysis of the phytoplankton generally confirmed the presence of these groups (Figure 2b) (rho = 0.71, p = 0.002).
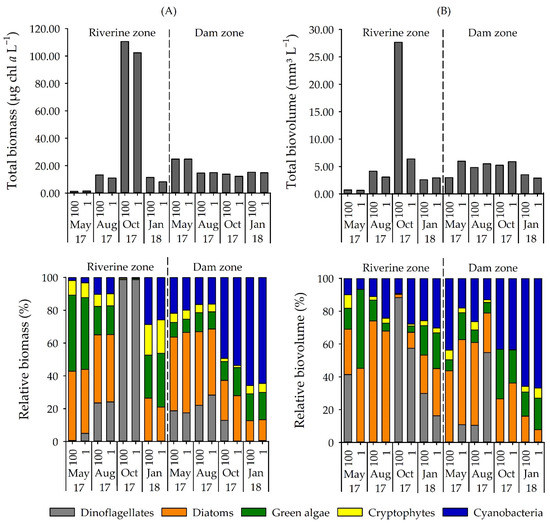
Figure 2.
(A) Total biomass (µg chl a L−1) and relative biomass (%) of phytoplankton groups determined by the pigment method and (B) total biovolume (mm3 L−1) and relative biovolume (%) of phytoplankton groups in Itupararanga reservoir. 100 = surface; 1 = lower limit of euphotic zone.
Diatoms and green algae were common in most samples and constituted an important fraction of the phytoplankton community. Cryptophytes never attained significant contribution in any of the samples. In October 2017 in the riverine zone, a bloom of dinoflagellates was observed (biomass of 105.08 µg chl a L−1 and biovolume of 24.43 mm3 L−1), and Ceratium furcoides was the dominant species. If excluding this occurrence, all the other samples had a chl a biomass of less than 25 µg chl a L−1 and biovolume lower than 7.00 mm3 L−1 (Figure 2).
Among cyanobacteria, microscopy identified 22 species belonging to 16 genera with Aphanizomenon, Aphanocapsa, Dolichospermum, Geitlerinema, Limnothrix, Pseudanabaena, Raphidiopsis, and Synechocystis being the most abundant and frequent genera (Figure 3). Cyanobacteria were present at all samplings but varied significantly between sites (p < 0.01). Based on biovolume, contribution of cyanobacteria to the phytoplankton community was 6–30% in the riverine zone but up to 43% (October 2017) and 67% (January 2018) in the dam zone (Figure 2b). The most dominant cyanobacterium was Raphidiopsis raciborskii (Figure 3). The analysis of group-specific pigments confirmed the high contribution of cyanobacteria in the dam zone during the warmer months (average of 52% in October 2017 and 65% in January 2018). A list of identified phytoplankton taxa in the reservoir is shown in Table S4.
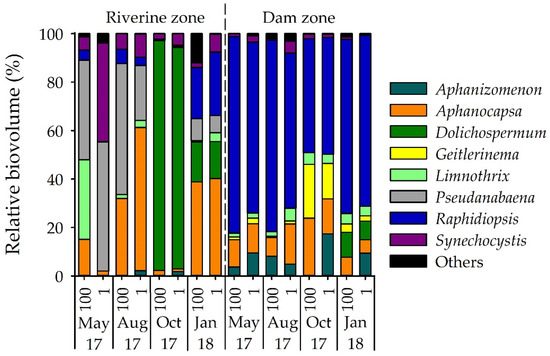
Figure 3.
Relative biovolume (%) of cyanobacterial genera identified in Itupararanga reservoir. Others = Aphanothece, Chroococcus, Cuspidothrix, Merismopedia, Microcystis, Phormidium, Glaucospira and Limnococcus; 100 = surface; 1 = lower limit of euphotic zone.
3.2. Detection of STX Producers: Validation of the sxtA-Cyano Primer Set and Standard Curve
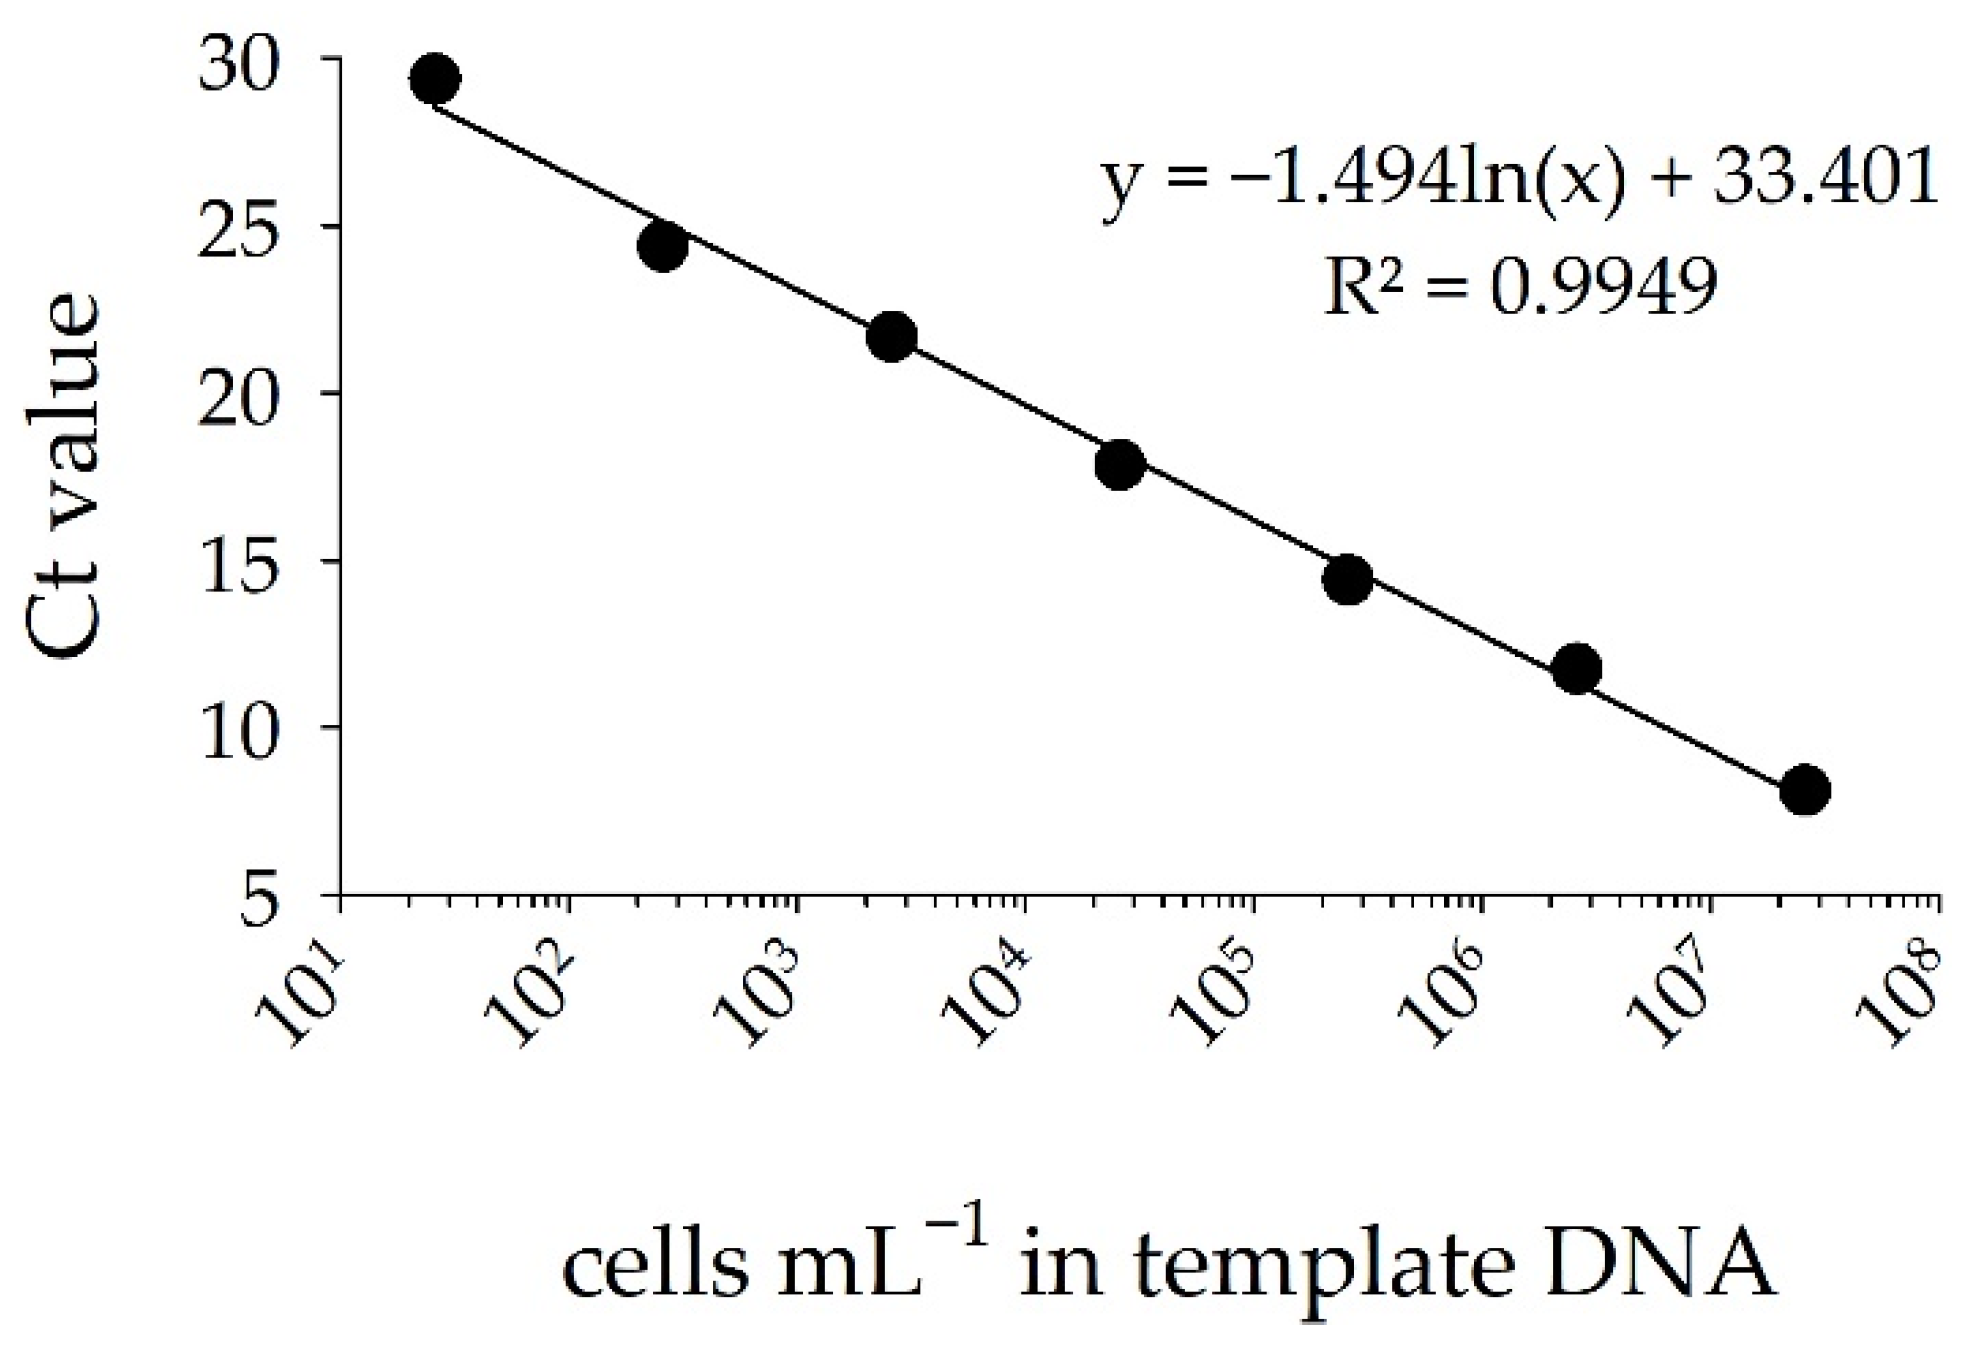
Using qPCR, the designed sxtA primer set produced a standard curve for the saxitoxin-producing cyanobacterium Raphidiopsis raciborskii T3 with a strong and significant linear regression between DNA concentration (as cells mL−1) and Ct values. The efficiency of the qPCR assay was 95% (R2 = 0.99 and slope of −3.44) for cell numbers between 26 and 2.6 × 10⁷ cells mL−1 and Ct values between 8 and 30 (Figure 4). Peaks of melting point profiles occurred between 80.0 and 80.5 °C, indicating presence of a single amplification product (Figure S2).
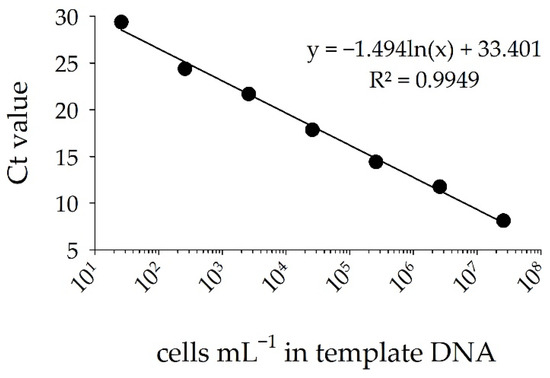
Figure 4.
Standard curve of Ct values for tenfold dilutions of known DNA concentration of Raphidiopsis raciborskii T3 (cells mL−1). Error bars provide standard deviations of triplicate amplifications.
The primer set detected the presence of the sxtA gene in all tested saxitoxin-producing strains. Seven strains were also confirmed positive in silico PCR, indicating a high coverage among different genera. As expected, the non-saxitoxin-producing strains did not yield any PCR products (Table S3). The results demonstrated that the qPCR assay was applicable to quantify potentially saxitoxin-producing cyanobacteria in both cultures and environmental samples. Since the number of sxtA copies per R. raciborskii T3 cell is unknown, numbers of sxtA genes in this study will be expressed in equivalents of R. raciborskii T3 cells.
3.3. Number of STX-Producing Cells and Concentrations of STX and MC
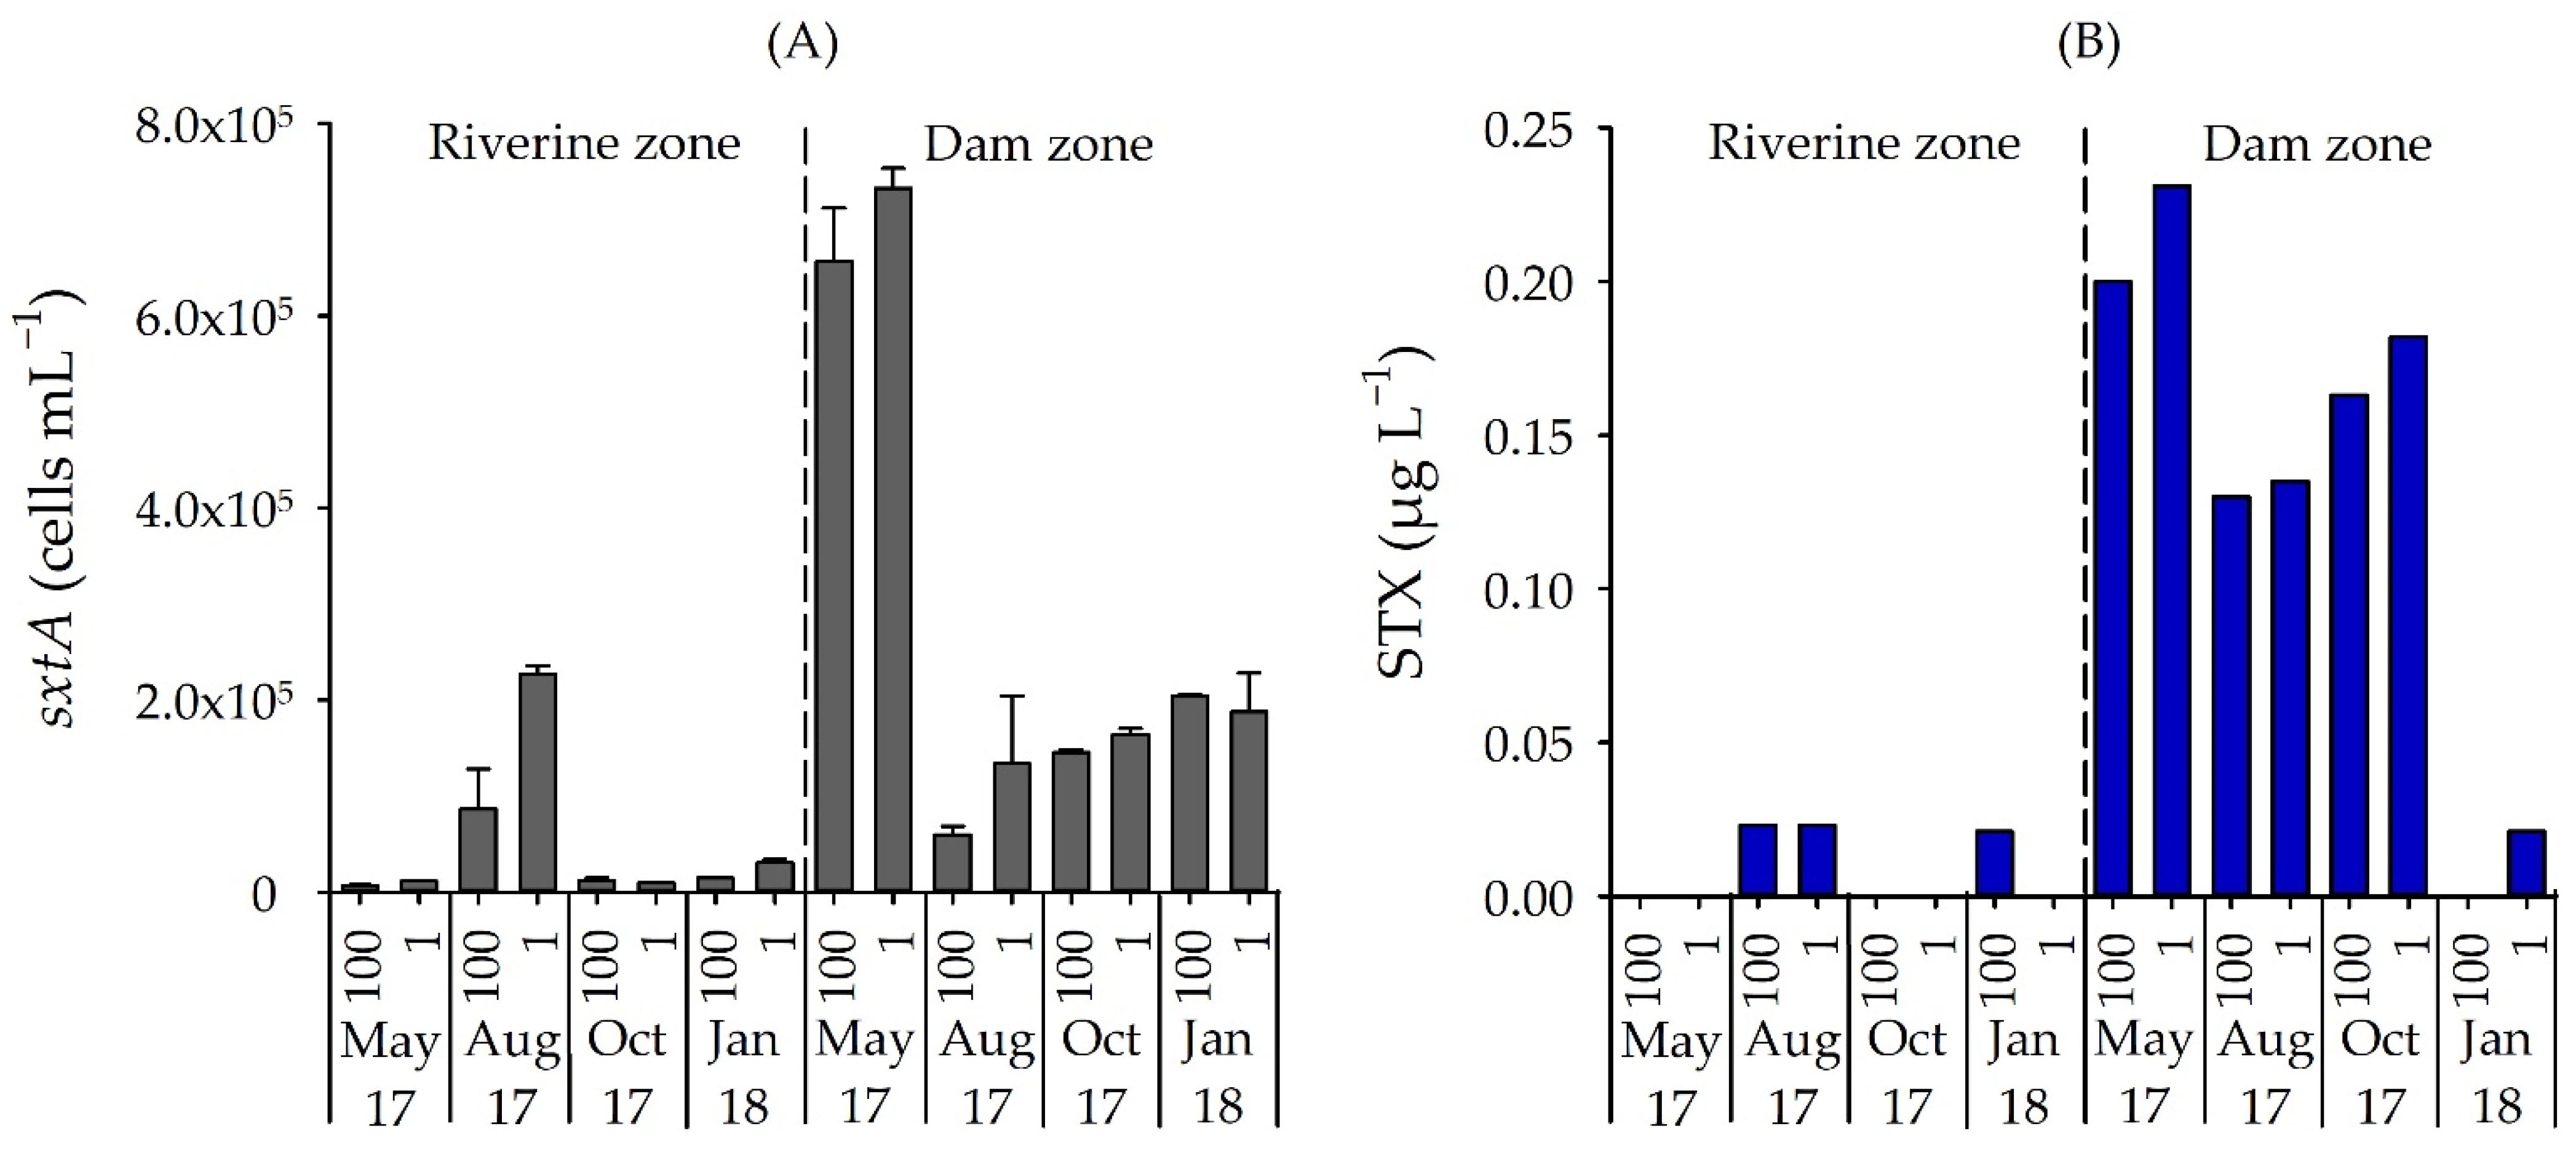
The qPCR analysis confirmed the presence of sxtA genotypes in all samples, but a clear spatial variation occurred (p = 0.009). The lowest number of sxtA genes occurred in the riverine zone in May 2017 (6.76 × 10³ cells mL−1), while the highest number was found for the dam zone in May 2017 (7.33 × 10⁵ cells mL−1) (Figure 5a).

Figure 5.
(A) Number of sxtA gene (cells mL−1) and (B) STX concentration (µg L−1) in samples from two field stations, in four months and two depths in Itupararanga reservoir. Standard deviations of triplicate samples shown. 100 = surface; 1 = lower limit of euphotic zone.
Concentrations of STX measured by ELISA were also significantly higher in the dam zone than in the riverine zone (p = 0.012) and, when detected in the water samples, ranged from 0.02 µg L−1 (riverine zone) to 0.23 µg L−1 (dam zone), but did not vary significantly between depths (p > 0.05) (Figure 5b). The STX concentrations correlated positively with the sxtA gene (rho = 0.70, p = 0.002).
STX was detected in the water when the number of sxtA-positive cells exceeded 1.47 × 10⁴ cells mL−1. However, in two dam surface samples from January 2018 and in all four samples from the lower limit of the eutrophic zone in the riverine zone, no STX was detected even with a high number of sxtA gene (2.04 × 10⁵ and 3.04 × 10⁴ cells mL−1, respectively).
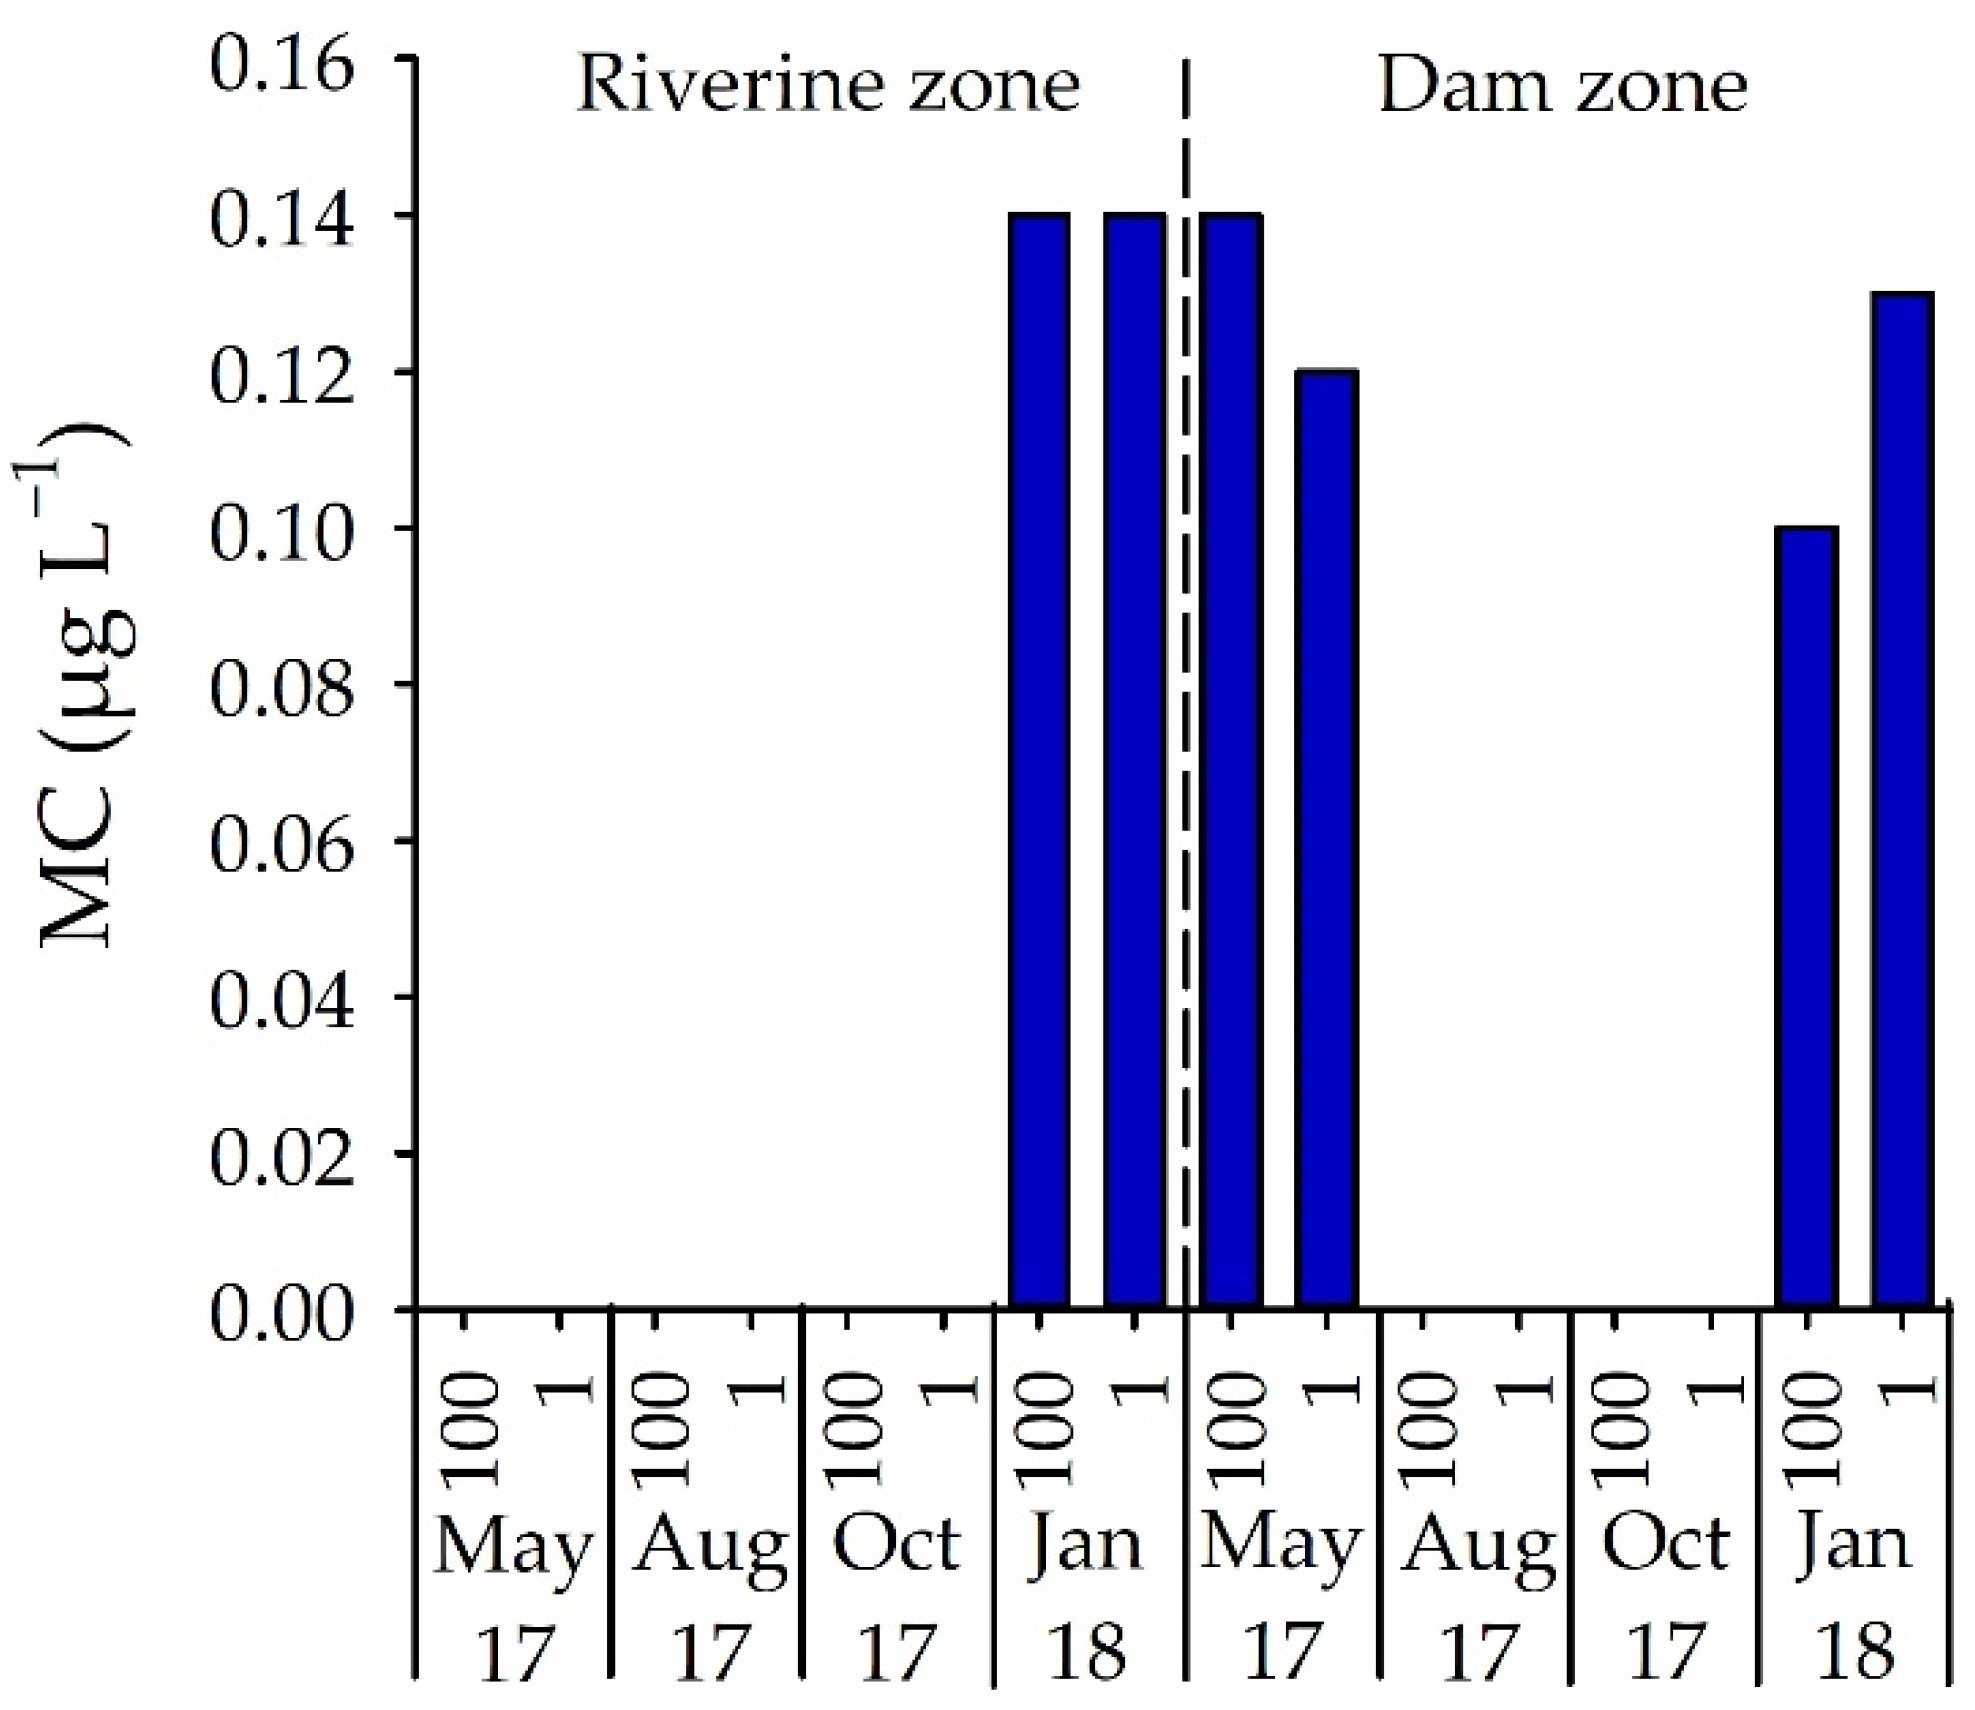
The presence of total microcystin (MC) was only detected in the riverine zone in January 2018 (0.14 µg L−1) but occurred in both May 2017 and January 2018 in the dam zone at concentrations between 0.10 and 0.14 µg L−1 (Figure 6). MC concentrations did not vary significantly between sampling months, depths and sites (p > 0.05).
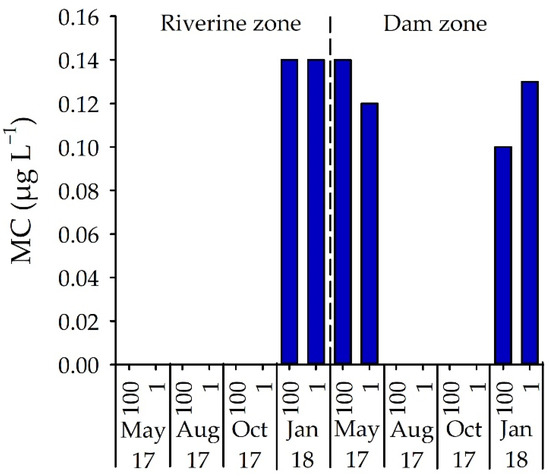
Figure 6.
MC concentration (µg L−1) in samples from two field stations, in four months and two depths in Itupararanga reservoir. 100 = surface; 1 = lower limit of euphotic zone.
Cyanobacterial genera with potential STX and MC production were detected by microscopy in all samples. STX concentrations and sxtA gene copy numbers correlated positively with the biovolume of Raphidiopsis, Geitlerinema and Aphanizomenon, while Dolichospermum was negatively correlated with STX (Table 1). As for MC, Spearman’s rank order correlation tests did not show any significant correlations between potential microcystin-producing genera and toxin concentrations throughout the study period (p > 0.05).

Table 1.
Spearman rank correlation coefficients between the biovolume of four potentially saxitoxin producing genera and sxtA gene and saxitoxin concentration (STX) in Itupararanga reservoir (n = 16). Significant correlations (p < 0.05) are shown in bold.
3.4. Linkage between Environmental Variables, Cyanobacteria and Cyanotoxins
The measured environmental variables showed that the riverine zone had more eutrophic conditions (higher nitrogen and phosphorus levels, higher chlorophyll a concentrations and higher turbidity) than the dam zone, as illustrated in Table S5.
Correlation analyses suggested different variables influencing sxtA gene occurrence and STX production in the reservoir (Table 2). STX concentrations and sxtA gene copy numbers were positively correlated with cyanobacterial biomass and TN:TP ratio, and negatively correlated with turbidity, TP and soluble reactive P. STX concentrations correlated positively with pH, and sxtA gene copy numbers were negatively correlated with nitrate. None of the measured variables succeeded in explaining the MC production in the reservoir (p > 0.05).
Table 2.
Spearman rank correlation coefficients between environmental variables and sxtA gene, saxitoxin (STX) and microcystin (MC) concentrations in Itupararanga reservoir (n = 16). Significant correlations (p < 0.05) are shown in bold.
The ordination obtained in the canonical correspondence analysis (CCA) showed separation of the sampling sites into two groups (riverine and dam zones), with respect to biovolume of cyanobacteria and environmental variables (Figure 7). The first two axes accounted for 85.94% of the variance (CCA 1 = 48.73%; CCA 2 = 37.21%). The permutation based on the Monte Carlo test confirmed that the CCA model was significant (p = 0.001), as were the first two axes (p = 0.001; p = 0.008), that is, the correlation between the environmental variables and potentially cyanotoxin-producing genera was statistically significant for the first two axes indicating an association between matrices.
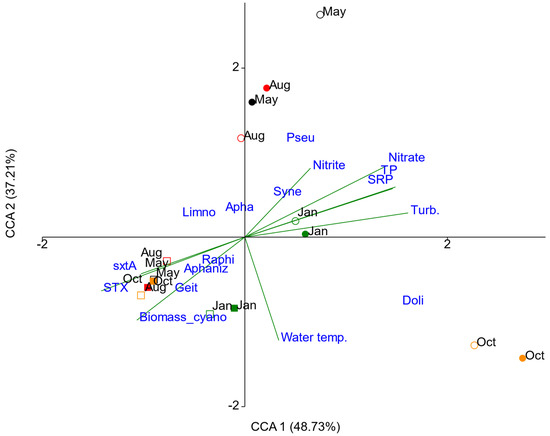
Figure 7.
Canonical correspondence analysis (CCA) biplot of cyanobacteria biovolume and environmental variables in Itupararanga reservoir. The periods of sampling were May (May 2017, black), Aug (August 2017, red), Oct (October 2017, orange) and Jan (January 2018, green); the riverine zone is represented by dot and dam zone is represented by square; filled dot/square represents the depth 100 (surface); empty dot/square represents the depth 1 (lower limit of euphotic zone). Water temp. = water temperature; Biomass_cyano = cyanobacterial biomass determined by pigment analysis; STX = saxitoxin; SRP = soluble reactive phosphorus; TP = total phosphorus; Turb. = turbidity; Geit = Geitlerinema, Aphaniz = Aphanizomenon, Raphi = Raphidiopsis, Limno = Limnothrix, Apha = Aphanocapsa, Syne = Synechocystis, Pseud = Pseudanabaena, Doli = Dolichospermum.
Cyanobacterial biovolumes, STX concentrations and sxtA gene numbers appeared in the same quadrant as Raphidiopsis, Geitlerinema and Aphanizomenon in the dam zone, showing a strong correlation between these variables. On the positive side of CCA 1, turbidity showed a strong correlation with the axis, followed by total P, soluble reactive P and nitrate in the riverine zone in October 2017 and January 2018. Nutrient concentrations were negatively correlated with STX, sxtA, Raphidiopsis, Aphanizomenon and Geitlerinema, that is, the saxitoxin production was higher when nutrients were low. Biovolumes of Synechocystis and Pseudanabaena correlated in samples from May and August 2017 in the riverine zone, when the concentrations of nitrite were higher. The highest water temperatures (October 2017 and January 2018) correlated with the highest biovolume of Dolichospermum. The distribution of Synechocystis, Pseudanabaena and Dolichospermum in the riverine zone showed a temporal pattern. However, the distribution of the cyanobacterial group in the dam zone did not suggest a temporal pattern (Figure 7).
4. Discussion
4.1. Environmental Variables and Cyanobacteria
Deterioration of the water quality has increased the occurrence of cyanobacteria and their toxins in several reservoirs used for water supply, recreational and fishing activities. Therefore, there is a need to better understand population dynamics of cyanobacteria. Several environmental factors, such as nutrient availability, rainfall and water temperature, may control the population structure of cyanobacteria, as well as the presence of toxic strains and their cyanotoxin production [49,50]. In the present study, the cyanobacterial biovolume in the dam zone (dominated by Raphidiopsis) was highest in the riverine zone and correlated with the lowest nutrient levels and the highest TN:TP ratios. This suggests that Raphidiopsis is adapted to low-P nutrient environments, as also observed for R. raciborskii by Casali et al. [31] and Vargas et al. [51]. Supporting this, Kenesi et al. [52] showed that R. raciborskii had a higher growth performance in P-limited environments, but only when inorganic N was available. In the dam zone, the availability of P was low (<15.19 µg L−1), but N was available (0.32–0.42 mg nitrate L−1), which may have favored the growth of R. raciborskii.
Environmental control of Dolichospermum (dominant biovolume among cyanobacteria in the riverine zone in October 2017) might be related to temperature, since the biomass peaked in October, when the water temperature was above 22 °C. An association between Dolichospermum and high-water temperatures has been reported in other studies, which showed optimum growth of Dolichospermum spp. at temperatures above 20 °C [53,54,55].
Besides the influence from environmental variables, composition and abundance of cyanobacteria may also have been affected by competition and interspecies relations between different phytoplankton groups. We speculate as to whether the dinoflagellate Ceratium furcoides outcompeted cyanobacteria in the reservoir. C. furcoides has been found in many Brazilian freshwater systems [56,57,58,59] and in the Itupararanga reservoir since 2010 [60]. Yet, few studies have dealt with the influence of C. furcoides on cyanobacterial population dynamics [61,62]. In the Itupararanga reservoir, the cyanobacterial biomass declined when C. furcoides occurred, and the lowest cyanobacterial biomass (<1.00 µg chl a L−1) coincided with the riverine bloom of C. furcoides in October 2017. Invasion of C. furcoides has previously been shown to overturn the cyanobacterial dominance in a eutrophic tropical reservoir [61], and cause oscillation and reduction in cyanobacterial blooms in an urban lake [62]. These authors correlated the increased biomass of C. furcoides to a high-water transparency and high concentrations of N and P. Their observations appear to support the phytoplankton community modulations in the Itupararanga reservoir. Thus, in the riverine zone in October 2017, the water transparency was ≥1.20 m, and concentrations of TN and TP were 0.86 and 0.54 µg L−1, respectively.
4.2. qPCR Assay, Cyanotoxin and Cyanobacteria
The qPCR assay developed in this study proved valid for the quantification of the sxtA gene in cyanobacteria. The sxtA gene is a core gene in the sxt gene cluster in STX-producing organisms [63]. Primer specificity, melting curve profile and the presence of only one amplicon clearly demonstrated a high sensitivity of the primer set for both cultures and environmental samples. Since several taxa of saxitoxin-producing cyanobacteria may occur in environmental samples [64,65,66], a high-coverage primer set is required for their detection. Our sxtA primer set showed specificity towards the sxtA gene, as demonstrated by both in vitro qPCR and in silico qPCR (Table S3). To the best of our knowledge, the present study is the first report on quantification of the sxtA gene in environmental samples by qPCR in a Brazilian water body. As mentioned earlier (Material and Methods, Section 2.5), testing of published sxtA primer sets [15] was not successful for amplification of the sxtA gene in our samples due to the formation of multiple amplicons. The resason for this is uncertain, but Zupancic et al. [67] report that amplification of the sxtA gene may be affected by geographical sequence variability.
The quantification of potentially saxitoxin-producing cyanobacteria in environmental samples by qPCR targeting the sxtA gene has been performed in few studies [14,15,68,69,70]. In most cases, the sxtA gene abundance correlated positively with STX concentrations, as also observed in our study. However, in the Itupararanga reservoir no STX was measured in some of the samples (surface of dam in January 2018 and lower limit of the euphotic stratum in the riverine zone), despite the sxtA gene being detected. Possibly, the sxt gene expression was down-regulated, resulting in the absence of STX production, as observed in a field study by Savela et al. [17] and in cultures of the potential STX-producing strain Aphanizomenon [71,72,73]. Alternatively, the qPCR-detected population was too small to produce sufficient amounts of STX for detection by ELISA. Nevertheless, the detection of the sxtA gene in the reservoir indicates that the genetic information necessary for the initiation of toxin synthesis was present.
The observed number of sxtA gene in the Itupararanga reservoir varied from 6.76 × 10³ to 7.33 × 10⁵ cells mL−1. This range largely agrees with a recent study of Danish lakes in which 0.8 × 10³ to 117 × 106 sxtA copies per mL were detected, except that a higher sxtA number was determined in the most eutrophic lake [69]. A high number of 2.91 × 10⁹ copies mL−1 was measured by Al-Tebrineh et al. [15] in a quantitative assay for the saxitoxin-producing Anabaena circinalis in a eutrophic dam. The authors report that STX was not detectable in the water until the sxtA gene exceeded 7.61 × 10³ copies mL−1. In our study, STX production was detected when more than 1.47 × 10⁴ sxtA-carrying cells mL−1 occurred, but as mentioned above, in 6 of 16 samples, no STX was detected even though a high number of the sxtA gene occurred (>3.0 × 10⁴ sxtA-carrying cells mL−1). This reinforces the need to understand the influence of environmental factors on the regulation of STX production. Additionally, knowledge on the number of the sxtA gene copies per cell is needed to determine accurate numbers of STX-producing cells. So far, a cell-specific sxtA copy number has only been determined for A. circinalis AWQC131C by Al-Tebrineh et al. [15], who report 3.58 sxtA copies per cell.
Spearman’s rank order correlation analysis and CCA showed significant and positive correlations between STX concentrations and sxtA gene copies to biovolumes of Raphidiopsis, Aphanizomenon and Geitlerinema. Therefore, we consider these cyanobacteria as dominant saxitoxin-producing species in the reservoir. However, the actual cyanobacterial genus or genera being responsible for the STX production in the water cannot be determined, partly because the sxtA gene may have originated from species that were not observed by microscopy. To link a specific genus to saxitoxin (or microcystin) production, isolation of the cyanobacteria followed by a search for the target genes in each cyanobacterial strain would be needed [74].
4.3. Saxitoxin and Environmental Variables
Saxitoxin concentrations and number of sxtA gene copies were highest in the dam zone, correlated negatively with nutrients (TP, SRP and NO3−-N) but correlated positively with the TN:TP ratio. The TN:TP ratio may indicate control of the STX production by available N, but the influence of N on saxitoxin production is controversial. According to Brentano et al. [75], dissolved inorganic nitrogen (DIN) may cause high STX concentrations in populations of R. raciborskii, since DIN favors growth or improves the cellular homeostasis due to a lower metabolic demand, because uptake of DIN requires less energy than N2-fixation. In contrast, Yunes et al. [76] observed a reduced STX level by a culture of R. brookii when DIN concentrations increased. Therefore, further studies are needed to provide a clear view on the influence of N on the STX production.
Regarding phosphorus (P), our results showed an increase in saxitoxin concentrations when P-limitation was observed. For the STX-producing dinoflagellate Alexandrium sp., Granéli and Flynn [77] report that the STX production at low P levels may indicate an adaptation to nutrient limitation. Similarly, Vargas et al. [51] report a high STX production by R. raciborskii at oligotrophic conditions due to adaptation to low-P levels, which might serve as a survival strategy. Frangópulos et al. [78] state that toxin production under P-limitation enhances the interspecific competition by redirecting grazing pressure to non-toxic species. These reports indicate that the availability of P may control the STX production, but the specific mechanisms remain to be determined.
In addition to access to N and P, the STX production appears to also be controlled by pH of the water. In the Itupararanga reservoir, a higher pH coincided with a high STX level. A similar relation was observed for intracellular STX concentrations in R. raciborskii, when pH increased to pH 9 or higher [79]. According to the authors, STX provides an advantage to STX-producing cyanobacteria over non-STX-producing cyanobacteria by maintaining homeostasis at alkaline pH and Na+ stress conditions, e.g., at high salt concentrations. These results might indicate that STX production is an adaptation to non-ideal conditions as reported from other studies [8,31,51].
Water turbidity appeared to also affect the STX production in the reservoir, since no STX was detected above 10 NTU, also when the lowest numbers of sxtA gene were recorded. For microcystin (MC), some studies report a positive and significant correlation between MC production, Microcystis abundance, high turbidity, low water transparency and high concentrations of total suspended solids [80,81,82]. However, no published data are available to verify the effects of turbidity on STX production.
The presence of STX in the Itupararanga reservoir (up to 0.02 and 0.23 µg L−1 in the riverine and dam zones, respectively) appears slightly higher than concentrations measured in other eutrophic freshwaters, e.g., Lake Kabetogama in Minnesota, USA (up to 0.08 µg L−1) [83] and a reservoir in Texas, USA (up to 0.05 µg L−1) [84]. In the Brazilian Alagados reservoir (São Paulo State), highly variable concentrations of STX have previously been measured, ranging from 5 ng L−1 (spring) to 51 ng L−1 (autumn) in 2007–2008 [85], while Calado et al. [86] in 2013–2014 measured significantly higher concentrations of 0.36 µg L−1 (spring) to 5.3 µg L−1 (autumn). The dominant cyanobacterium in the reservoir was R. raciborskii, and blooms of this species was the likely source of the high STX concentrations [86]. Currently, there are no internationally accepted guidelines for maximum concentrations of STX for recreational or drinking water purposes, but concentrations of 0.2–1.5 µg L−1 [87] and 3 µg L−1 [88] have been suggested. Considering these concentrations, the presence of STX in the Itupararanga reservoir appears below critical levels.
4.4. Microcystin and Environmental Variables
Microcystin concentrations in the reservoir were generally low (max. 0.14 µg L−1) and below the limit acceptable for MC content in drinking water (≤1.00 µg L−1) [89], as also recommended by the World Health Organization [90].
Several environmental factors have been shown to control the MC production in cyanobacteria. Thus, microcystin production is reported to vary with salinity [91,92], temperature [93,94], light intensity [95,96], pH [97,98] and nutrients [99,100]. However, in the Itupararanga reservoir, no significant correlations between environmental variables, MC concentrations and potentially toxic genera were found. This agrees with Pimentel and Giani [11] who did not find any correlations between environmental variables and MC production in the Furnas reservoir (Minas Gerais, Brazil), and highlighted the necessity of further studies to understand the factors responsible for its occurrence in particular environmental conditions.
4.5. Pigment Analysis and qPCR Assay as Tools for Monitoring of Toxic Cyanobacteria
Cyanotoxins constitute a potential risk to human health [101] and therefore there is a need for reliable and fast methods for the specific quantification of toxin-producing cyanobacteria in the environment. In the Itupararanga reservoir, the positive correlations between pigment-based biomass of cyanobacteria and sxtA copy numbers demonstrated that pigment analysis may serve as a useful tool to predict the risk of occurrence of potentially toxic cyanobacteria in subtropical reservoirs. Similar results were obtained by Schlüter et al. [40] in a study of Brazilian reservoirs with aquaculture production, where the presence of microcystin also correlated with pigment profiles. The authors stated that pigment analysis can provide fast and reliable data for early warning of risks of cyanobacteria and their toxins in freshwater reservoirs.
The pigment-based biomass of phytoplankton groups correlated positively with biovolumes determined by microscopy, showing that pigment profiles are a powerful tool in taxonomic analyses of phytoplankton. Pigment analyses have the advantage of being fast and reproducible, and no taxonomical expertise is required. Furthermore, all phytoplankton cells, also including pico-sized cells that are not identifiable by standard microscopy methods, are included by the pigment method. Another advantage is that rare species with low densities can be identified by pigment profiles, but may be overlooked by microscopy [39,40,102]. Despite these advantages, the pigment analysis will only detect phytoplankton groups and thus, for the identification of genera and species, microscopic analysis may still be necessary.
If the choice of methods for early warning and analysis of toxin episodes is the identification of potential toxin-producing cyanobacteria by Utermöhl technique or qPCR detection of toxin-encoding genes, calculation of the expenses indicates that qPCR may be a preferred method. Thus, Lorenzi [19] estimated costs of the Utermöhl technique to be about US$ 9 per sample, while expenses for analysis of one sample by qPCR amount to about US$ 8. Although quantification by the Utermöhl technique requires fewer equipments and reagents than the qPCR technique, the analyst’s labor costs make the Utermöhl technique more expensive due to the low processing capacity. The qPCR technique has a higher cost of equipment and reagents, but the total costs, including the analyst’s labor, are distributed among a larger number of samples analyzed. Therefore, it can be concluded that for rapid and large-scale monitoring, qPCR may prove more economically viable than cell counting by microscopy due to its greater sample processing capacity and less time for obtaining the results.
5. Conclusions
The application of the designed qPCR method showed that saxitoxin-producing cyanobacteria were permanently present among phytoplankton in the Itupararanga reservoir during the sampling period and led to measurable concentrations of STX in the water. Records of cyanobacterial blooms and the occurrence of cyanotoxins are common in Brazilian lakes and reservoirs, but this study was the first to apply qPCR for the detection of potentially STX-producing cyanobacteria. The correlation between numbers of the sxtA gene and concentrations of STX in the water showed that the qPCR assay can be used for the early warning of health risk by saxitoxin occurrence. The dominant STX producers in the reservoir appeared to belong to the genera Raphidiopsis, Aphanizomenon and Geitlerinema, and high TN:TP ratios and low availability of P seemed to sustain the STX production. Results from the study can serve as valuable tools in understanding the effects of nutrients on toxin production and ensure that producers of STX are accurately quantified for better monitoring of adverse effects from blooms of cyanobacteria.
Supplementary Materials
The following are available online at https://www.mdpi.com/article/10.3390/w13121716/s1. Table S1. Characteristics of Itupararanga reservoir and sampling sites (riverine and dam zones) [29,30,103]; Table S2. List of phytoplankton pigments included in HPLC analysis and taxonomic designations; Table S3. PCR and in silico PCR with cyanobacteria strains for investigation of specificity of the primer set sxtA-cyano on detection of sxtA gene (+ and − indicate positive or negative PCR reaction, respectively); Figure S1. Agarose gel picture showing the PCR amplicons against 2-log ladder. The PCR was performed using primer pair reported by Al-Tebrineh et al. [15] for targeting the sxtA gene. DNA from several saxitoxin-producing cyanobacteria was used as template. As can be seen on the gel picture, a non-target amplification occurred for some strains when using the sxtA primer set by Al-Tebrineh et al. [15]; Figure S2. Melting curve for the sxtA primer set for standards and environmental samples showing a single peak (Tm = 80–80.5 °C) that indicates amplification of a single amplicon. Tm = melting temperature; Table S4. List of the phytoplankton taxa identified in Itupararanga reservoir; Table S5. Environmental variables summarised as the mean values and ranges, and statistical results (p values) of non-parametric Mann-Whitney test for spatial differences (riverine and dam zone) and non-parametric Kruskal-Wallis for temporal differences (months) of the environmental variables in Itupararanga reservoir.
Author Contributions
Conceptualization, M.C.C. and M.A.B.M.; methodology, M.C.C. and M.A.B.M.; validation, M.A.B.M.; formal analysis, M.A.B.M.; R.A.M.R., R.P. and L.S.; investigation, M.A.B.M.; R.A.M.R. and L.S.; writing—original draft preparation, M.A.B.M. and M.C.C.; writing—review and editing, M.A.B.M., M.C.C., N.O.G.J., L.S. and R.P.; supervision, M.C.C.; project administration, M.C.C. and M.A.B.M.; funding acquisition, M.C.C. All authors have read and agreed to the published version of the manuscript.
Funding
This research was funded by São Paulo Research Foundation (FAPESP), grant number 2016/09405-1. M.A.B.M was funded by FAPESP, grant numbers 2015/21191-4 and 2018/00394-2. R.A.M.R. was funded by Coordenação de Aperfeiçoamento de Pessoal de Nível Superior—Brasil (CAPES), grant number (finance number) 001, and Conselho Nacional de Desenvolvimento e Pesquisa Tecnológica (CNPq), grant number 142176/2016-8.
Acknowledgments
We are very grateful to Sandra Maria Feliciano de Oliveira e Azevedo from Federal University of Rio de Janeiro (UFRJ) for providing Raphidiopsis strains and to Inessa Lacativa Bagatini from Federal University of São Carlos (UFSCar) for providing Microcystis strain that were critical for this research.
Conflicts of Interest
The authors declare no conflict of interest.
References
- Sabart, M.; Crenn, K.; Perrière, F.; Abila, A.; Leremboure, M.; Colombet, J.; Jousse, C.; Latour, D. Co-occurrence of microcystin and anatoxin-a in the freshwater lake Aydat (France): Analytical and molecular approaches during a three-year survey. Harmful Algae 2015, 48, 12–20. [Google Scholar] [CrossRef]
- Spoof, L.; Catherine, A. Appendix 3: Tables of Microcystins and Nodularins. In Handbook of Cyanobacterial Monitoring and Cyanotoxin Analysis; John Wiley & Sons: Hoboken, NJ, USA, 2017; pp. 526–537. [Google Scholar] [CrossRef]
- Bouaïcha, N.; Miles, C.O.; Beach, D.G.; Labidi, Z.; Djabri, A.; Benayache, N.Y.; Nguyen-Quang, T. Structural diversity, characterization and toxicology of microcystins. Toxins 2019, 11, 714. [Google Scholar] [CrossRef] [PubMed] [Green Version]
- Wacklin, P.; Hoffmann, L.; Komárek, J. Nomenclatural validation of the genetically revised cyanobacterial genus Dolichospermum (Ralfs ex Bornet et Flahault) comb, nova. Fottea 2009, 9, 59–64. [Google Scholar] [CrossRef] [Green Version]
- Wiese, M.; D’Agostino, P.M.; Mihali, T.K.; Moffitt, M.C.; Neilan, B.A. Neurotoxic alkaloids: Saxitoxin and its analogs. Mar. Drugs 2010, 8, 2185–2211. [Google Scholar] [CrossRef] [PubMed] [Green Version]
- Aguilera, A.; Gómez, E.B.; Kaštovský, J.; Echenique, R.O.; Salerno, G.L. The polyphasic analysis of two native Raphidiopsis isolates supports the unification of the genera Raphidiopsis and Cylindrospermopsis (Nostocales, Cyanobacteria). Phycologia 2018, 57, 130–146. [Google Scholar] [CrossRef]
- Valério, E.; Chaves, S.; Tenreiro, R. Diversity and impact of prokaryotic toxins on aquatic environments: A review. Toxins 2010, 2, 2359–2410. [Google Scholar] [CrossRef] [PubMed] [Green Version]
- Holland, A.; Kinnear, S. Interpreting the Possible Ecological Role(s) of Cyanotoxins: Compounds for Competitive Advantage and/or Physiological Aide? Mar. Drugs 2013, 11, 2239–2258. [Google Scholar] [CrossRef] [Green Version]
- Calijuri, M.C.; Alves, M.S.A.; dos Santos, A.C.A. Cianobactérias e Cianotoxinas em Águas Continentais; Rima: São Carlos, Brazil, 2006. [Google Scholar]
- Ferrão-Filho, A.D.S.; Kozlowsky-Suzuki, B. Cyanotoxins: Bioaccumulation and effects on aquatic animals. Mar. Drugs 2011, 9, 2729–2772. [Google Scholar] [CrossRef]
- Pimentel, J.S.M.; Giani, A. Estimating toxic cyanobacteria in a Brazilian reservoir by quantitative real-time PCR, based on the microcystin synthetase D gene. J. Appl. Phycol. 2013, 25, 1545–1554. [Google Scholar] [CrossRef]
- Ribeiro, M.S.F.; Tucci, A.; Matarazzo, M.P.; Viana-niero, C.; Nordi, C.S.F. Detection of Cyanotoxin-Producing Genes in a Eutrophic Reservoir (Billings Reservoir, São Paulo, Brazil). Water 2020, 12, 1–13. [Google Scholar] [CrossRef] [Green Version]
- McKindles, K.M.; Zimba, P.V.; Chiu, A.S.; Watson, S.B.; Gutierrez, D.B.; Westrick, J.; Kling, H.; Davis, T.W. A multiplex analysis of potentially toxic cyanobacteria in Lake Winnipeg during the 2013 bloom season. Toxins 2019, 11, 587. [Google Scholar] [CrossRef] [PubMed] [Green Version]
- Al-Tebrineh, J.; Merrick, C.; Ryan, D.; Humpage, A.; Bowling, L.; Neilan, B.A. Community composition, toxigenicity, and environmental conditions during a cyanobacterial bloom occurring along 1,100 kilometers of the Murray River. Appl. Environ. Microbiol. 2012, 78, 263–272. [Google Scholar] [CrossRef] [Green Version]
- Al-Tebrineh, J.; Mihali, T.K.; Pomati, F.; Neilan, B.A. Detection of saxitoxin-producing cyanobacteria and Anabaena circinalis in environmental water blooms by quantitative PCR. Appl. Environ. Microbiol. 2010, 76, 7836–7842. [Google Scholar] [CrossRef] [Green Version]
- Fortin, N.; Munoz-Ramos, V.; Bird, D.; Lévesque, B.; Whyte, L.G.; Greer, C.W. Toxic cyanobacterial bloom triggers in Missisquoi Bay, Lake Champlain, as determined by next-generation sequencing and quantitative PCR. Life 2015, 5, 1346–1380. [Google Scholar] [CrossRef] [PubMed] [Green Version]
- Savela, H.; Spoof, L.; Perälä, N.; Preede, M.; Lamminmäki, U.; Nybom, S.; Häggqvist, K.; Meriluoto, J.; Vehniäinen, M. Detection of cyanobacterial sxt genes and paralytic shellfish toxins in freshwater lakes and brackish waters on Åland Islands, Finland. Harmful Algae 2015, 46, 1–10. [Google Scholar] [CrossRef]
- dos Anjos, F.M.; do Bittencourt-Oliveira, M.C.; Zajac, M.P.; Hiller, S.; Christian, B.; Erler, K.; Luckas, B.; Pinto, E. Detection of harmful cyanobacteria and their toxins by both PCR amplification and LC-MS during a bloom event. Toxicon 2006, 48, 239–245. [Google Scholar] [CrossRef] [PubMed]
- Lorenzi, A.S. Implementação da Técnica de qPCR para o Monitoramento de Microcystis e Genótipos Potencialmente Produtores de Microcistinas; Universidade de São Paulo: São Paulo, Brazil, 2008. [Google Scholar]
- Bittencourt-Oliveira, M.; Santos, D.; Moura, N. Toxic cyanobacteria in reservoirs in northeastern Brazil: Detection using a molecular method. Brazilian J. Biol. 2010, 70, 1005–1010. [Google Scholar] [CrossRef] [Green Version]
- Lorenzi, A.S.; Chia, M.A.; Piccin-Santos, V.; Bittencourt-Oliveira, M.D.C. Microcystins and cylindrospermopsins molecular markers for the detection of toxic cyanobacteria: A case study of northeastern Brazilian reservoirs. Limnetica 2015, 34, 269–282. [Google Scholar] [CrossRef]
- Guedes, I.A.; da Costa Leite, D.M.; Manhães, L.A.; Bisch, P.M.; Azevedo, S.M.F.O.; Pacheco, A.B.F. Fluctuations in microcystin concentrations, potentially toxic Microcystis and genotype diversity in a cyanobacterial community from a tropical reservoir. Harmful Algae 2014, 39, 303–309. [Google Scholar] [CrossRef]
- Da Conceição, F.T.; de Godoy, D.S.S.L.H.; Pedrazzi; Fernandes, A.M.; de Pedrazzi, F.J.M. Influência sazonal no transporte específico de metais totais e dissolvidos nas águas fluviais da bacia do Alto Sorocaba (SP). Geochim. Bras. 2015, 29, 23–34. [Google Scholar] [CrossRef]
- Manfré, L.A.; Da Silva, A.M.; Urban, R.C. Atributos de qualidade de solos sob dois diferentes tipos de manejo no município de Ibiúna/SP, Brazil. Interciencia 2011, 36, 757–763. [Google Scholar]
- de Beghelli, F.G.S.; dos Santos, A.C.A.; Urso-Guimarães, M.V.; do Calijuri, M.C. Relationship between space distribution of the benthic macroinvertebrates community and trophic state in a Neotropical reservoir (Itupararanga, Brazil). Biota Neotrop. 2012, 12, 114–124. [Google Scholar] [CrossRef]
- Taniwaki, R.H.; Rosa, A.H.; De Lima, R.; Rodrigues Maruyama, C.; Ferrari Secchin, L.; do Calijuri, M.C.; Moschini Carlos, V. A influência do uso e ocupação do solo na qualidade e genotoxicidade da água no reservatório de itupararanga, São Paulo, Brasil. Interciencia 2013, 38, 164–170. [Google Scholar]
- de Pedrazzi, F.J.M.; da Conceição, F.T.; de Sardinha, D.S.; Moschini-Carlos, V.; Pompêo, M. Spatial and Temporal Quality of Water in the Itupararanga Reservoir, Alto Sorocaba Basin (SP), Brazil. J. Water Resour. Prot. 2013, 5, 64–71. [Google Scholar] [CrossRef] [Green Version]
- Rodrigues, E.H.C.; Vicentin, A.M.; dos Machado, L.S.; Pompêo, M.L.M.; Moschini-Carlos, V. Phytoplankton, Trophic State and Ecological Potential in reservoirs in the State of São Paulo, Brazil. Rev. Ambient. Agua 2019, 14, 1–12. [Google Scholar] [CrossRef]
- Cunha, D.G.F.; Calijuri, M.D.C. Variação sazonal dos grupos funcionais fitoplanctônicos em braços de um reservatório tropical de usos múltiplos no estado de são paulo (Brasil). Acta Bot. Brasilica 2011, 25, 822–831. [Google Scholar] [CrossRef]
- De Souza Beghelli, F.G.; Frascareli, D.; Pompêo, M.L.M.; Moschini-Carlos, V. Trophic State Evolution over 15 Years in a Tropical Reservoir with Low Nitrogen Concentrations and Cyanobacteria Predominance. Water. Air. Soil Pollut. 2016, 227, 95. [Google Scholar] [CrossRef] [Green Version]
- Casali, S.P.; Dos Santos, A.C.A.; De Falco, P.B.; Do Carmo Calijuri, M. Influence of environmental variables on saxitoxin yields by Cylindrospermopsis raciborskii in a mesotrophic subtropical reservoir. J. Water Health 2017, 15, 509–518. [Google Scholar] [CrossRef] [PubMed] [Green Version]
- Nusch, E.A. Comparison of different methods for chlorophyll and pheopigment determination. Arch. Hydrobiol. 1980, 14, 14–36. [Google Scholar]
- APHA; AWWA; WPCF. Standard Methods for the Examination of Water and Wastewater, 25th ed.; American Public Health Association; American Water Works Association; Water Pollution Control Federation: Washington, DC, USA, 2005. [Google Scholar]
- Cunha, D.G.F.; do Calijuri, M.C.; Lamparelli, M.C. A trophic state index for tropical/subtropical reservoirs (TSItsr). Ecol. Eng. 2013, 60, 126–134. [Google Scholar] [CrossRef]
- Utermöhl, H. Zur Vervollkommnung der quantitativen Phytoplankton-Methodik. Int. Vereinigung Theor. Angew. Limnol. Mitteilungen 1958, 9, 1–38. [Google Scholar] [CrossRef]
- Lund, J.W.G.; Kipling, C.; Le Cren, E.D. The inverted microscope method of estimating algal numbers and the statistical basis of estimations by counting. Hydrobiologia 1958, 11, 143–170. [Google Scholar] [CrossRef]
- Hillebrand, H.; Dürselen, C.D.; Kirschtel, D.; Pollingher, U.; Zohary, T. Biovolume calculation for pelagic and benthic microalgae. J. Phycol. 1999, 35, 403–424. [Google Scholar] [CrossRef]
- Sun, J.; Liu, D. Geometric models for calculating cell biovolume and surface area for phytoplankton. J. Plankton Res. 2003, 25, 1331–1346. [Google Scholar] [CrossRef] [Green Version]
- Schlüter, L.; Behl, S.; Striebel, M.; Stibor, H. Comparing microscopic counts and pigment analyses in 46 phytoplankton communities from lakes of different trophic state. Freshw. Biol. 2016, 61, 1627–1639. [Google Scholar] [CrossRef]
- Schlüter, L.; David, G.S.; Jørgensen, N.O.G.; Podduturi, R.; Tucci, A.; Dias, A.S.; da Silva, R.J. Characterization of phytoplankton by pigment analysis and the detection of toxic cyanobacteria in reservoirs with aquaculture production. Aquac. Environ. Interact. 2018, 10, 35–48. [Google Scholar] [CrossRef] [Green Version]
- Van Heukelem, L.; Thomas, C.S. Computer-assisted high-performance liquid chromatography method development with applications to the isolation and analysis of phytoplankton pigments. J. Chromatogr. A 2001, 910, 31–49. [Google Scholar] [CrossRef]
- Mackey, M.D.; Mackey, D.J.; Higgins, H.W.; Wright, S.W. CHEMTAX—A program for estimating class abundances from chemical markers: Application to HPLC measurements of phytoplankton. Mar. Ecol. Prog. Ser. 1996, 144, 265–283. [Google Scholar] [CrossRef] [Green Version]
- Schlüter, L.; Lauridsen, T.L.; Krogh, G.; Jørgensen, T. Identification and quantification of phytoplankton groups in lakes using new pigment ratios—A comparison between pigment analysis by HPLC and microscopy. Freshw. Biol. 2006, 51, 1474–1485. [Google Scholar] [CrossRef]
- Desjardins, P.; Conklin, D. NanoDrop microvolume quantitation of nucleic acids. J. Vis. Exp. 2010, 45, 1–5. [Google Scholar] [CrossRef] [PubMed] [Green Version]
- Thompson, J.D.; Higgins, D.G.; Gibson, T.J. CLUSTAL W: Improving the sensitivity of progressive multiple sequence alignment through sequence weighting, position-specific gap penalties and weight matrix choice. Nucleic Acids Res. 1994, 22, 4673–4680. [Google Scholar] [CrossRef] [Green Version]
- Untergasser, A.; Nijveen, H.; Rao, X.; Bisseling, T.; Geurts, R.; Leunissen, J.A.M. Primer3Plus, an enhanced web interface to Primer3. Nucleic Acids Res. 2007, 35, 71–74. [Google Scholar] [CrossRef] [Green Version]
- Gorham, P.R.; McLachlan, J.; Hammer, U.T.; Kim, W.K. Isolation and culture of toxic strains of Anabaena flos-aquae (Lyngb.) de Bréb. In SIL Proceedings, 1922–2010; Taylor & Francis: London, UK, 1964; Volume 15, pp. 796–804. [Google Scholar] [CrossRef]
- Hammer, Ø.; Harper, D.A.T.; Ryan, P.D. PAST: Paleontological Statistics Software package for education. Palaeontol. Electron. 2001, 4, 1–9. [Google Scholar]
- Rantala, A.; Rajaniemi-Wacklin, P.; Lyra, C.; Lepistö, L.; Rintala, J.; Mankiewicz-Boczek, J.; Sivonen, K. Detection of microcystin-producing cyanobacteria in Finnish lakes with genus-specific microcystin synthetase gene E (mcyE) PCR and associations with environmental factors. Appl. Environ. Microbiol. 2006, 72, 6101–6110. [Google Scholar] [CrossRef] [Green Version]
- Fortin, N.; Aranda-Rodriguez, R.; Jing, H.; Pick, F.; Bird, D.; Greer, C.W. Detection of microcystin-producing cyanobacteria in Missisquoi Bay, Quebec, Canada, using quantitative PCR. Appl. Environ. Microbiol. 2010, 76, 5105–5112. [Google Scholar] [CrossRef] [Green Version]
- Vargas, S.R.; dos Santos, P.V.; Bottino, F.; do Carmo Calijuri, M. Effect of nutrient concentration on growth and saxitoxin production of Raphidiopsis raciborskii (Cyanophyta) interacting with Monoraphidium contortum (Chlorophyceae). J. Appl. Phycol. 2020, 32, 421–430. [Google Scholar] [CrossRef]
- Kenesi, G.; Shafik, H.M.; Kovács, A.W.; Herodek, S.; Présing, M. Effect of nitrogen forms on growth, cell composition and N2 fixation of Cylindrospermopsis raciborskii in phosphorus-limited chemostat cultures. Hydrobiologia 2009, 623, 191–202. [Google Scholar] [CrossRef]
- Li, R.; Watanabe, M. Physiological properties of planktic species of Anabaena (Cyanobacteria) and their taxonomic value at species level. Algol. Stud. Hydrobiol. Suppl. Vol. 2001, 103, 31–45. [Google Scholar] [CrossRef]
- Nalewajko, C.; Murphy, T.P. Effects of temperature, and availability of nitrogen and phosphorus on the abundance of Anabaena and Microcystis in Lake Biwa, Japan: An experimental approach. Limnology 2001, 2, 45–48. [Google Scholar] [CrossRef]
- Qian, K.; Dokulil, M.; Chen, Y. Do the regular annual extreme water level changes affect the seasonal appearance of Anabaena in Poyang Lake? PeerJ 2019, 7, 1–15. [Google Scholar] [CrossRef] [PubMed]
- Cavalcante, K.P.; Zanotelli, J.C.; Müller, C.C.; Scherer, K.D.; Frizzo, J.K.; Ludwig, T.A.V.; Cardo, L.D.S. First record of expansive Ceratium Schrank, 1793 species (Dinophyceae) in Southern Brazil, with notes on their dispersive patterns in Brazilian environments. Check List 2013, 9, 862–866. [Google Scholar] [CrossRef] [Green Version]
- Jati, S.; Rodrigues, L.C.; Bortolini, J.C.; Paula, A.C.M.; Moresco, G.A.; Reis, L.M.; Zanco, B.F.; Train, S. First record of the occurrence of Ceratium furcoides (Levander) Langhans (Dinophyceae) in the Upper Paraná River floodplain (PR/MS), Brazil. Brazilian J. Biol. 2014, 74, 235–236. [Google Scholar] [CrossRef]
- Moreira, R.; Rocha, O.; Santos, R.; Laudares-Silva, R.; Dias, E.; Eskinazi-Sant’Anna, E. First record of Ceratium furcoides (Dinophyta), an invasive species, in a temporary high-altitude lake in the Iron Quadrangle (MG, Southeast Brazil). Brazilian J. Biol. 2015, 75, 98–103. [Google Scholar] [CrossRef] [PubMed] [Green Version]
- Campanelli, L.C.; Tundisi, J.G.; Abe, D.S.; Sidagis-Galli, C.; Matsumura-Tundisi, T. Record of the occurrence of dinoflagellate Ceratium furcoides in a fish farming lake located in the countryside of São Carlos (SP, Brazil). Brazilian J. Biol. 2017, 77, 426–427. [Google Scholar] [CrossRef] [PubMed] [Green Version]
- CETESB—Companhia Ambiental do Estado de São Paulo. Qualidade das Águas Superficiais no Estado de São Paulo 2010; CETESB: São Paulo, Brazil, 2011. [Google Scholar]
- Crossetti, L.O.; de Bicudo, D.C.; Bini, L.M.; Dala-Corte, R.B.; Ferragut, C.; de Mattos Bicudo, C.E. Phytoplankton species interactions and invasion by Ceratium furcoides are influenced by extreme drought and water-hyacinth removal in a shallow tropical reservoir. Hydrobiologia 2019, 831, 71–85. [Google Scholar] [CrossRef]
- Da Silva, L.N.; De Medeiros, C.M.; Cavalcante, K.P.; Cardoso, L.D.S. Invasion and establishment of Ceratium furcoides (Dinophyceae) in an urban lake in Porto Alegre, RS, Brazil. Acta Bot. Brasilica 2019, 33, 654–663. [Google Scholar] [CrossRef]
- Hackett, J.D.; Wisecaver, J.H.; Brosnahan, M.L.; Kulis, D.M.; Anderson, D.M.; Bhattacharya, D.; Gerald Plumley, F.; Erdner, D.L. Evolution of saxitoxin synthesis in cyanobacteria and dinoflagellates. Mol. Biol. Evol. 2013, 30, 70–78. [Google Scholar] [CrossRef] [PubMed] [Green Version]
- Fonseca, J.R.; Vieira, P.C.S.; Kujbida, P.; Costa, I.A.S.D. Cyanobacterial occurrence and detection of microcystins and saxitoxins in reservoirs of the Brazilian semi-arid. Acta Limnol. Bras. 2015, 27, 78–92. [Google Scholar] [CrossRef] [Green Version]
- Lopes, I.K.C.; Barros, M.U.G.; Pestana, C.J.; Capelo Neto, J. Prevalence of paralytic shellfish poison-producing Planktothrix agardhii and Cylindrospermopsis raciborskii in a Brazilian semi-arid reservoir. Acta Limnol. Bras. 2015, 27, 238–246. [Google Scholar] [CrossRef] [Green Version]
- Lu, J.; Zhu, B.; Struewing, I.; Xu, N.; Duan, S. Nitrogen–phosphorus-associated metabolic activities during the development of a cyanobacterial bloom revealed by metatranscriptomics. Sci. Rep. 2019, 9, 1–11. [Google Scholar] [CrossRef] [Green Version]
- Zupancic, M.; Kogovšek, P.; Šter, T.; Remec Rekar, Š.; Cerasino, L.; Baebler, Š.; Krivograd Klemencic, A.; Eleršek, T. Potentially Toxic Planktic and Benthic Cyanobacteria in Slovenian Freshwater Bodies: Detection by Quantitative PCR. Toxins 2021, 13, 133. [Google Scholar] [CrossRef] [PubMed]
- Kramer, B.J.; Davis, T.W.; Meyer, K.A.; Rosen, B.H.; Goleski, J.A.; Dick, G.J.; Oh, G.; Gobler, C.J. Nitrogen limitation, toxin synthesis potential, and toxicity of cyanobacterial populations in Lake Okeechobee and the St. Lucie River Estuary, Florida, during the 2016 state of emergency event. PLoS ONE 2018, 13, e0196278. [Google Scholar] [CrossRef] [Green Version]
- Chaffin, J.D.; Mishra, S.; Kane, D.D.; Bade, D.L.; Stanislawczyk, K.; Slodysko, K.N.; Jones, K.W.; Parker, E.M.; Fox, E.L. Cyanobacterial blooms in the central basin of Lake Erie: Potentials for cyanotoxins and environmental drivers. J. Great Lakes Res. 2019, 45, 277–289. [Google Scholar] [CrossRef]
- Podduturi, R.; Schlüter, L.; Liu, T.; Osti, J.A.S.; de Moraes, M.A.B.; Jørgensen, N.O.G. Monitoring of saxitoxin production in lakes in Denmark by molecular, chromatographic and microscopic approaches. Harmful Algae 2021, 101, 101966. [Google Scholar] [CrossRef]
- Ballot, A.; Fastner, J.; Wiedner, C. Paralytic shellfish poisoning toxin-producing cyanobacterium Aphanizomenon gracile in Northeast Germany. Appl. Environ. Microbiol. 2010, 76, 1173–1180. [Google Scholar] [CrossRef] [Green Version]
- Casero, M.C.; Ballot, A.; Agha, R.; Quesada, A.; Cirés, S. Characterization of saxitoxin production and release and phylogeny of sxt genes in paralytic shellfish poisoning toxin-producing Aphanizomenon gracile. Harmful Algae 2014, 37, 28–37. [Google Scholar] [CrossRef]
- Cirés, S.; Wörmer, L.; Ballot, A.; Agha, R.; Wiedner, C.; Velázquez, D.; Casero, M.C.; Quesada, A. Phylogeography of cylindrospermopsin and paralytic shellfish toxin-producing Nostocales cyanobacteria from Mediterranean Europe (Spain). Appl. Environ. Microbiol. 2014, 80, 1359–1370. [Google Scholar] [CrossRef] [Green Version]
- Moreira, C.; Ramos, V.; Azevedo, J.; Vasconcelos, V. Methods to detect cyanobacteria and their toxins in the environment. Appl. Microbiol. Biotechnol. 2014, 98, 8073–8082. [Google Scholar] [CrossRef]
- Brentano, D.M.; Giehl, E.L.H.; Petrucio, M.M. Abiotic variables affect STX concentration in a meso-oligotrophic subtropical coastal lake dominated by Cylindrospermopsis raciborskii (Cyanophyceae). Harmful Algae 2016, 56, 22–28. [Google Scholar] [CrossRef]
- Yunes, J.S.; De La Rocha, S.; Giroldo, D.; Da Silveira, S.B.; Comin, R.; Bicho, M.D.S.; Melcher, S.S.; Sant’Anna, C.L.; Vieira, A.A.H. Release of carbohydrates and proteins by a subtropical strain of Raphidiopsis brookii (Cyanobacteria) able to produce saxitoxin at three nitrate concentrations. J. Phycol. 2009, 45, 585–591. [Google Scholar] [CrossRef]
- Granéli, E.; Flynn, K. Chemical and Physical Factors Influencing Toxin Content. Ecol. Harmful Algae 2006, 189, 229–241. [Google Scholar] [CrossRef] [Green Version]
- Frangópulos, M.; Guisande, C.; DeBlas, E.; Maneiro, I. Toxin production and competitive abilities under phosphorus limitation of Alexandrium species. Harmful Algae 2004, 3, 131–139. [Google Scholar] [CrossRef]
- Pomati, F.; Rossetti, C.; Manarolla, G.; Burns, B.P.; Neilan, B.A. Interactions between intracellular Na+ levels and saxitoxin production in Cylindrospermopsis raciborskii T3. Microbiology 2004, 150, 455–461. [Google Scholar] [CrossRef] [Green Version]
- Graham, J.L.; Jones, J.R.; Jones, S.B.; Downing, J.A.; Clevenger, T.E. Environmental factors influencing microcystin distribution and concentration in the Midwestern United States. Water Res. 2004, 38, 4395–4404. [Google Scholar] [CrossRef]
- Te, S.H.; Gin, K.Y.H. The dynamics of cyanobacteria and microcystin production in a tropical reservoir of Singapore. Harmful Algae 2011, 10, 319–329. [Google Scholar] [CrossRef]
- Cunha, D.G.F.; Dodds, W.K.; Loiselle, S.A. Factors related to water quality and thresholds for microcystin concentrations in subtropical Brazilian reservoirs. Inland Waters 2018, 8, 368–380. [Google Scholar] [CrossRef]
- Christensen, V.G.; Maki, R.P.; Stelzer, E.A.; Norland, J.E.; Khan, E. Phytoplankton community and algal toxicity at a recurring bloom in Sullivan Bay, Kabetogama Lake, Minnesota, USA. Sci. Rep. 2019, 9, 1–11. [Google Scholar] [CrossRef] [PubMed]
- Subbiah, S.; Karnjanapiboonwong, A.; Maul, J.D.; Wang, D.; Anderson, T.A. Monitoring cyanobacterial toxins in a large reservoir: Relationships with water quality parameters. PeerJ 2019, 7, e7305. [Google Scholar] [CrossRef]
- Clemente, Z.; Busato, R.H.; Oliveira Ribeiro, C.A.; Cestari, M.M.; Ramsdorf, W.A.; Magalhães, V.F.; Wosiack, A.C.; Silva de Assis, H.C. Analyses of paralytic shellfish toxins and biomarkers in a southern Brazilian reservoir. Toxicon 2010, 55, 396–406. [Google Scholar] [CrossRef]
- de Calado, S.L.M.; Wojciechowski, J.; Santos, G.S.; de Magalhães, V.F.; Padial, A.A.; Cestari, M.M.; de Assis, H.C.D.S. Neurotoxins in a water supply reservoir: An alert to environmental and human health. Toxicon 2017, 126, 12–22. [Google Scholar] [CrossRef]
- Miller, T.R.; Beversdorf, L.J.; Weirich, C.A.; Bartlett, S.L. Cyanobacterial toxins of the Laurentian great lakes, their toxicological effects, and numerical limits in drinking water. Mar. Drugs 2017, 15, 160. [Google Scholar] [CrossRef] [Green Version]
- WHO—World Health Organization. Cyanobacterial Toxins: Saxitoxins. Background Document for Development of WHO Guidelines for Drinking-Water Quality and Guidelines for Safe Recreational Water Environments; WHO: Geneva, Switzerland, 2020. [Google Scholar]
- Brasil Portaria MS 2914 de 12 de Dezembro de 2011. Dispõe Sobre os Procedimentos de Controle e de Vigilância da Qualidade da Água para Consumo Humano e seu Padrão de Potabilidade; Ministério da Saúde: Brasília, Brazil, 2011; 38p.
- WHO—World Health Organization. Guidelines for Drinking-Water Quality, 4th ed.; WHO: Geneva, Switzerland, 2011. [Google Scholar]
- Jia, J.; Chen, Q.; Wang, M.; Zhang, J.; Yi, Q.; Hu, L. The production and release of microcystin related to phytoplankton biodiversity and water salinity in two cyanobacteria blooming lakes. Environ. Toxicol. Chem. 2018, 37, 2312–2322. [Google Scholar] [CrossRef] [PubMed]
- Vergalli, J.; Fayolle, S.; Combes, A.; Franquet, E.; Comte, K. Persistence of microcystin production by Planktothrix agardhii (Cyanobacteria) exposed to different salinities. Phycologia 2020, 59, 24–34. [Google Scholar] [CrossRef]
- Bui, T.; Dao, T.S.; Vo, T.G.; Lürling, M. Warming affects growth rates and microcystin production in tropical bloom-forming microcystis strains. Toxins 2018, 10, 123. [Google Scholar] [CrossRef] [PubMed] [Green Version]
- Walls, J.T.; Wyatt, K.H.; Doll, J.C.; Rubenstein, E.M.; Rober, A.R. Hot and toxic: Temperature regulates microcystin release from cyanobacteria. Sci. Total Environ. 2018, 610–611, 786–795. [Google Scholar] [CrossRef] [PubMed]
- Xie, L.; Rediske, R.R.; Gillett, N.D.; O’Keefe, J.P.; Scull, B.; Xue, Q. The impact of environmental parameters on microcystin production in dialysis bag experiments. Sci. Rep. 2016, 6, 1–10. [Google Scholar] [CrossRef] [PubMed]
- Wang, Z.; Zhang, Y.; Huang, S.; Peng, C.; Hao, Z.; Li, D. Nitrogen limitation significantly reduces the competitive advantage of toxic Microcystis at high light conditions. Chemosphere 2019, 237, 124508. [Google Scholar] [CrossRef]
- Francy, D.S.; Brady, A.M.G.; Ecker, C.D.; Graham, J.L.; Stelzer, E.A.; Struffolino, P.; Dwyer, D.F.; Loftin, K.A. Estimating microcystin levels at recreational sites in western Lake Erie and Ohio. Harmful Algae 2016, 58, 23–34. [Google Scholar] [CrossRef]
- Huang, Y.; Pan, H.; Liu, H.; Xi, Y.; Ren, D. Characteristics of growth and microcystin production of Microcystis aeruginosa exposed to low concentrations of naphthalene and phenanthrene under different pH values. Toxicon 2019, 169, 103–108. [Google Scholar] [CrossRef]
- Barros, M.U.G.; Wilson, A.E.; Leitão, J.I.R.; Pereira, S.P.; Buley, R.P.; Fernandez-Figueroa, E.G.; Capelo-Neto, J. Environmental factors associated with toxic cyanobacterial blooms across 20 drinking water reservoirs in a semi-arid region of Brazil. Harmful Algae 2019, 86, 128–137. [Google Scholar] [CrossRef]
- Brandenburg, K.; Siebers, L.; Keuskamp, J.; Jephcott, T.G.; van de Waal, D.B. Effects of nutrient limitation on the synthesis of N-rich phytoplankton toxins: A meta-analysis. Toxins 2020, 12, 221. [Google Scholar] [CrossRef] [PubMed] [Green Version]
- Christensen, V.G.; Khan, E. Freshwater neurotoxins and concerns for human, animal, and ecosystem health: A review of anatoxin-a and saxitoxin. Sci. Total Environ. 2020, 736, 139515. [Google Scholar] [CrossRef] [PubMed]
- Zapata, M. Recent advances in pigment analysis as applied to picophytoplankton. Vie Milieu 2005, 55, 233–248. [Google Scholar]
- Cunha, D.G.F. Heterogeneidade Espacial e Variabilidade Temporal no Reservatório de Itupararanga: Uma Condição ao Manejo Sustentável dos Recursos Hídricos da Bacia do Rio Sorocaba (SP); Universidade de São Paulo: São Paulo, Brazil, 2012. [Google Scholar]


Publisher’s Note: MDPI stays neutral with regard to jurisdictional claims in published maps and institutional affiliations. |
© 2021 by the authors. Licensee MDPI, Basel, Switzerland. This article is an open access article distributed under the terms and conditions of the Creative Commons Attribution (CC BY) license (https://creativecommons.org/licenses/by/4.0/).