Article

The Story of a Steep River: Causes and Effects of the Flash Flood on 24 July 2017 in Western Norway

Department of Civil and Environmental Engineering, Norwegian University of Science and Technology (NTNU), N-7491 Trondheim, Norway
*
Author to whom correspondence should be addressed.
Water 2021, 13(12), 1688; https://doi.org/10.3390/w13121688
Submission received: 7 May 2021 / Revised: 14 June 2021 / Accepted: 15 June 2021 / Published: 18 June 2021
(This article belongs to the Special Issue Recent Advances in Flood Hazard and Risk Science)

Abstract

:
Flash floods can cause great geomorphological changes in ephemeral fluvial systems and result in particularly severe damages for the unprepared population exposed to it. The flash flood in the Storelva river in Utvik (western Norway) on 24 July 2017 was witnessed and documented. This study assessed the causes and effects of the 2017 flood and provides valuable information for the calibration and validation of future modelling studies. The flooded area at peak discharge, maximum wetted and dry areas during the entire event, critical points and main flow paths were reconstructed using on-site and post-event (i) visual documentation, such as photographs and videos, and (ii) aerial surveying, such as orthophotographs and laser scanning, of the lowermost reach. The steep longitudinal slope together with the loose material forming the valley and riverbed contributed to a large amount of sediment transport during this extreme event. Steep rivers such as the Storelva river have very short response times to extreme hydrologic conditions, which calls for exhaustive monitoring and data collection in case of future events, as well as modelling tools that can emulate the hydro-morphodynamics observed during events such as the 2017 flash flood.

1. Introduction

Europe is currently experiencing one of the most intense flood-rich periods in the past five centuries and flood seasonality is accentuated, with increasing flood events occurring in all regions in their flood-rich season [1]. However, the flood-rich period we are currently experiencing is anomaly separated temporally from previous flood-rich periods–there are circa (ca.) 100 years of historical flood registry with very few events–the most recent flood-rich period is significantly warmer than its interflood period–unlike all the previous flood-rich periods–and floods occur 15% more frequently than during the flood seasons of previous flood-rich periods. These factors explain the unpreparedness of civilians and stakeholders to unexpectedly frequent, severe and spatially extended floods. More than half of the 1500 flood events reported in Europe in the last 150 years were flash floods and information on human or monetary losses was available in most cases, whereas the total flooded area was available for only 10% of all the events [2]. Particularly in ephemeral fluvial systems, flash floods can be responsible for great geomorphological changes, such as channel widening and incision, channel migration, erosion and transport of large volumes of sediment, as well as their deposition downstream in the channel and on floodplains [3,4,5,6]. Understanding the causes and consequences of such phenomena is crucial to both increase preparedness and improve flood mitigation. The impacts of a recent flash flood (or “debris flood” according to the classification proposed by [7]) in a small, steep Norwegian river were witnessed and documented. This paper portraits its story with the aim to provide insights into its causes and effects and to facilitate the use of such a flash flood as a case study for future modelling of the observed backwater effect as well as an effective flood risk communication of future flood events to save lives and cost.

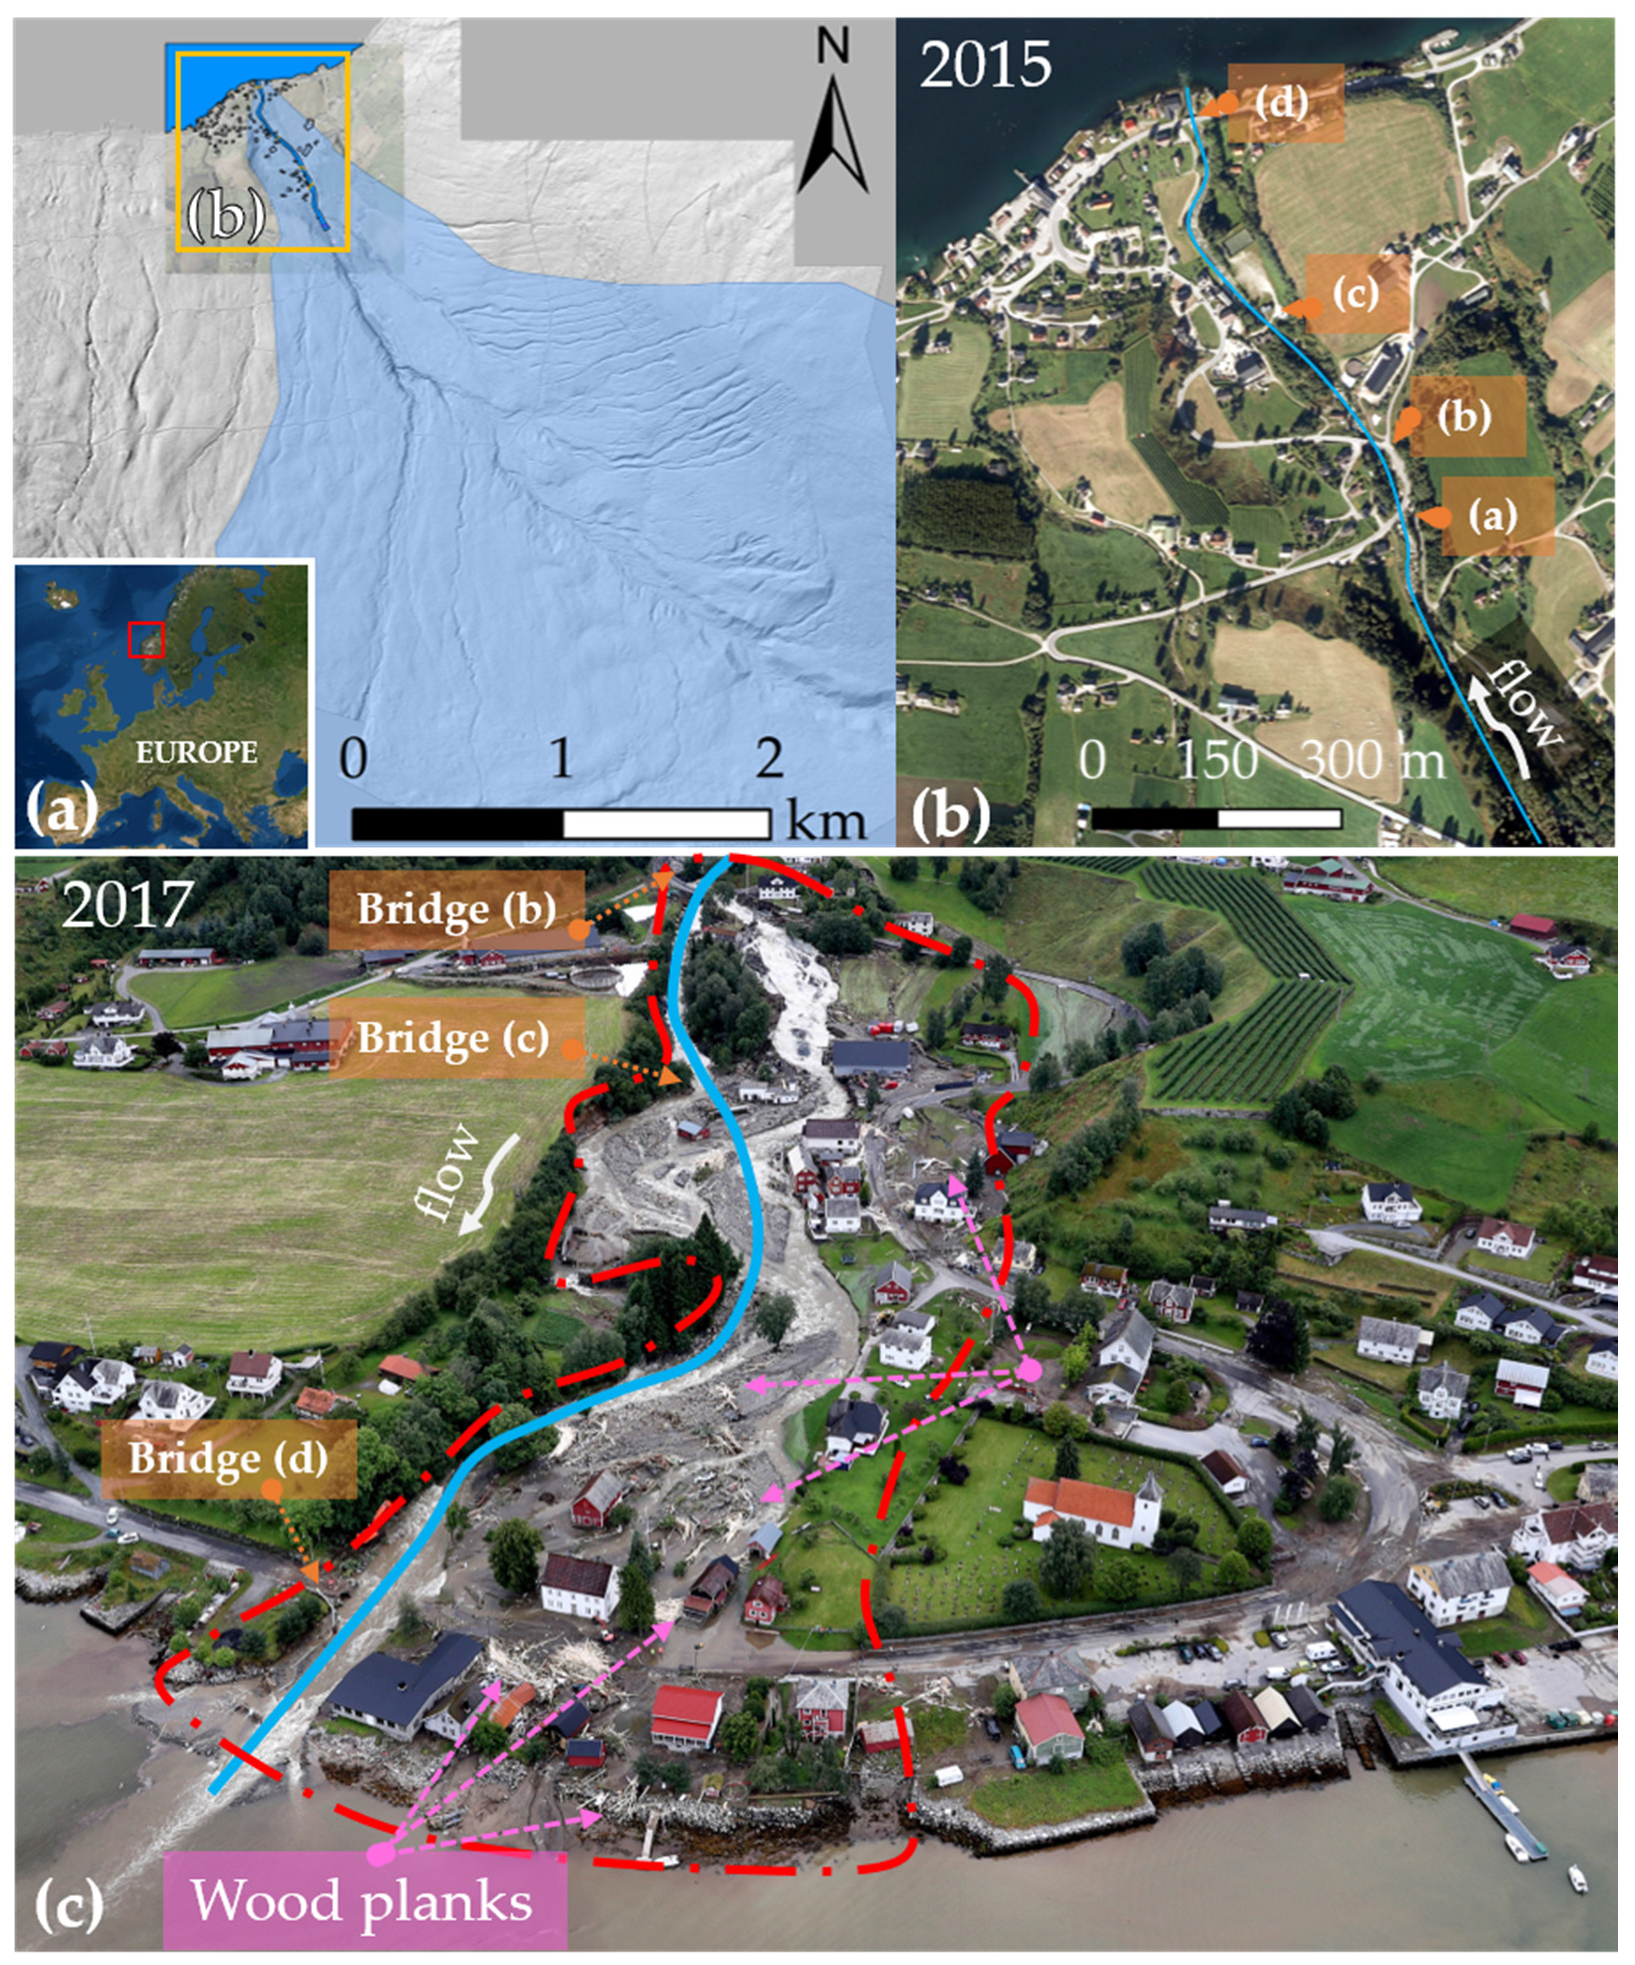
Flash Flood in the Storelva River (Western Norway) in 2017

The extreme event presented herein affected several rivers; however, this study focuses on the Storelva river, located in Utvik, western Norway (Figure 1a). The Storelva river flooded on 24 July 2017, when ca. 4 h of heavy rainfall resulted in a peak discharge estimated to be in the range of 130–280 m3/s, with a higher expectancy for Q = 200 m3/s [8,9]. The Storelva river flows for 10.6 km in a steep valley, with cultivated land, open landscape, forest and a lot of Quaternary fine material (i.e., moraine upstream and glacial-fluvial and fluvial deposits downstream). Its catchment area is 24.75 km2 [10] and the river goes from 1553 m.a.s.l. to 0 m.a.s.l. (the river mouth is by the fjord). This river is, therefore, small and steep [11], with an average slope of 14.33% in the lowermost 5.2 km mapped before the flood [12] and of 10.52% in the 775 m-long reach where most of the residential area is concentrated (“area of interest” hereafter; Figure 1b). There are three mini hydropower plants (HPPs) along the river, i.e., Utvik I, II and III, installed in 1914, 1948 and 1980, respectively. The mini HPPs do not regulate the Storelva river’s 1.6 m3/s average discharge nor the flow during a flood, nevertheless [8,13].
The river flooded in the early morning on 24 July 2017, waking up the local habitants and many of them documented the flash flood on-site. The extreme weather also affected several neighbouring municipalities in the West of Utvik, and the Brulandselva river, 1 km West of the Storelva river, also flooded. On the day of the flood, the Norwegian national landslide database [14] registered a “debris flow” at 6.00 a.m. by the Storelva and Brulandselva rivers, ca. 1.25 km upstream in the first case and ca. 1 km upstream in the latter [13]. There were also two non-specified landslides registered in the center of Utvik village and three non-specified landslides upstream in the mountains near Utvik. Tverrelva river, a tributary to the Storelva river, changed paths into a new 100 m-long reach, contributing to the Storelva river with large amounts of debris. Additionally, several rock falls were registered in the same mountainous area and along the road E39 to Sandane (26 km West of Utvik). The fine and loose material constituting the steep valley slid and the banks were eroded due to the heavy rainfall, contributing to a large volume of material being deposited in the lower reach (i.e., 500–600 m from the river mouth) and in the fjord [13]. The sequence of natural hazards instigated the local and national media channels to also document its consequences (Figure 1c). Some of these photographs and videos were used as reference to assess the impacts and to estimate the damage caused by the flood. Furthermore, post-event aerial documentation consisting of orthophotographs and LiDAR (Light Detection and Ranging) scan was performed by the Norwegian Mapping Authority on the 3rd of August 2017, 10 days after the flood event [15].
The cost of the flood damages lists over seven million euros-worth of property, over five million euros-worth for the reparation of the main road, additional costs for the safety measures implemented to secure the river after the flood, business financial loss due to road damage, the value of the 100-year-old mini hydropower plant destroyed and the damage to historical buildings [8].
The aim of this study is to document and analyze the hydro-morphodynamic processes during the flash flood that affected the Storelva river in Utvik (western Norway) in 2017. An overview of the hydrologic context for the flood is presented in Section 2.1, followed by the reconstruction of the flood inundation area in Section 2.2 and the reconstruction of the preferred flow paths and formation of the new channel in Section 2.3. The main outcomes of these steps are described in Section 3 and discussed in Section 4 together with the main implications and future work. Conclusions are presented in Section 5. Numerical modelling is out of the scope of this paper. However, the analysis and data herewith presented could serve as basis for future numerical modelling studies.

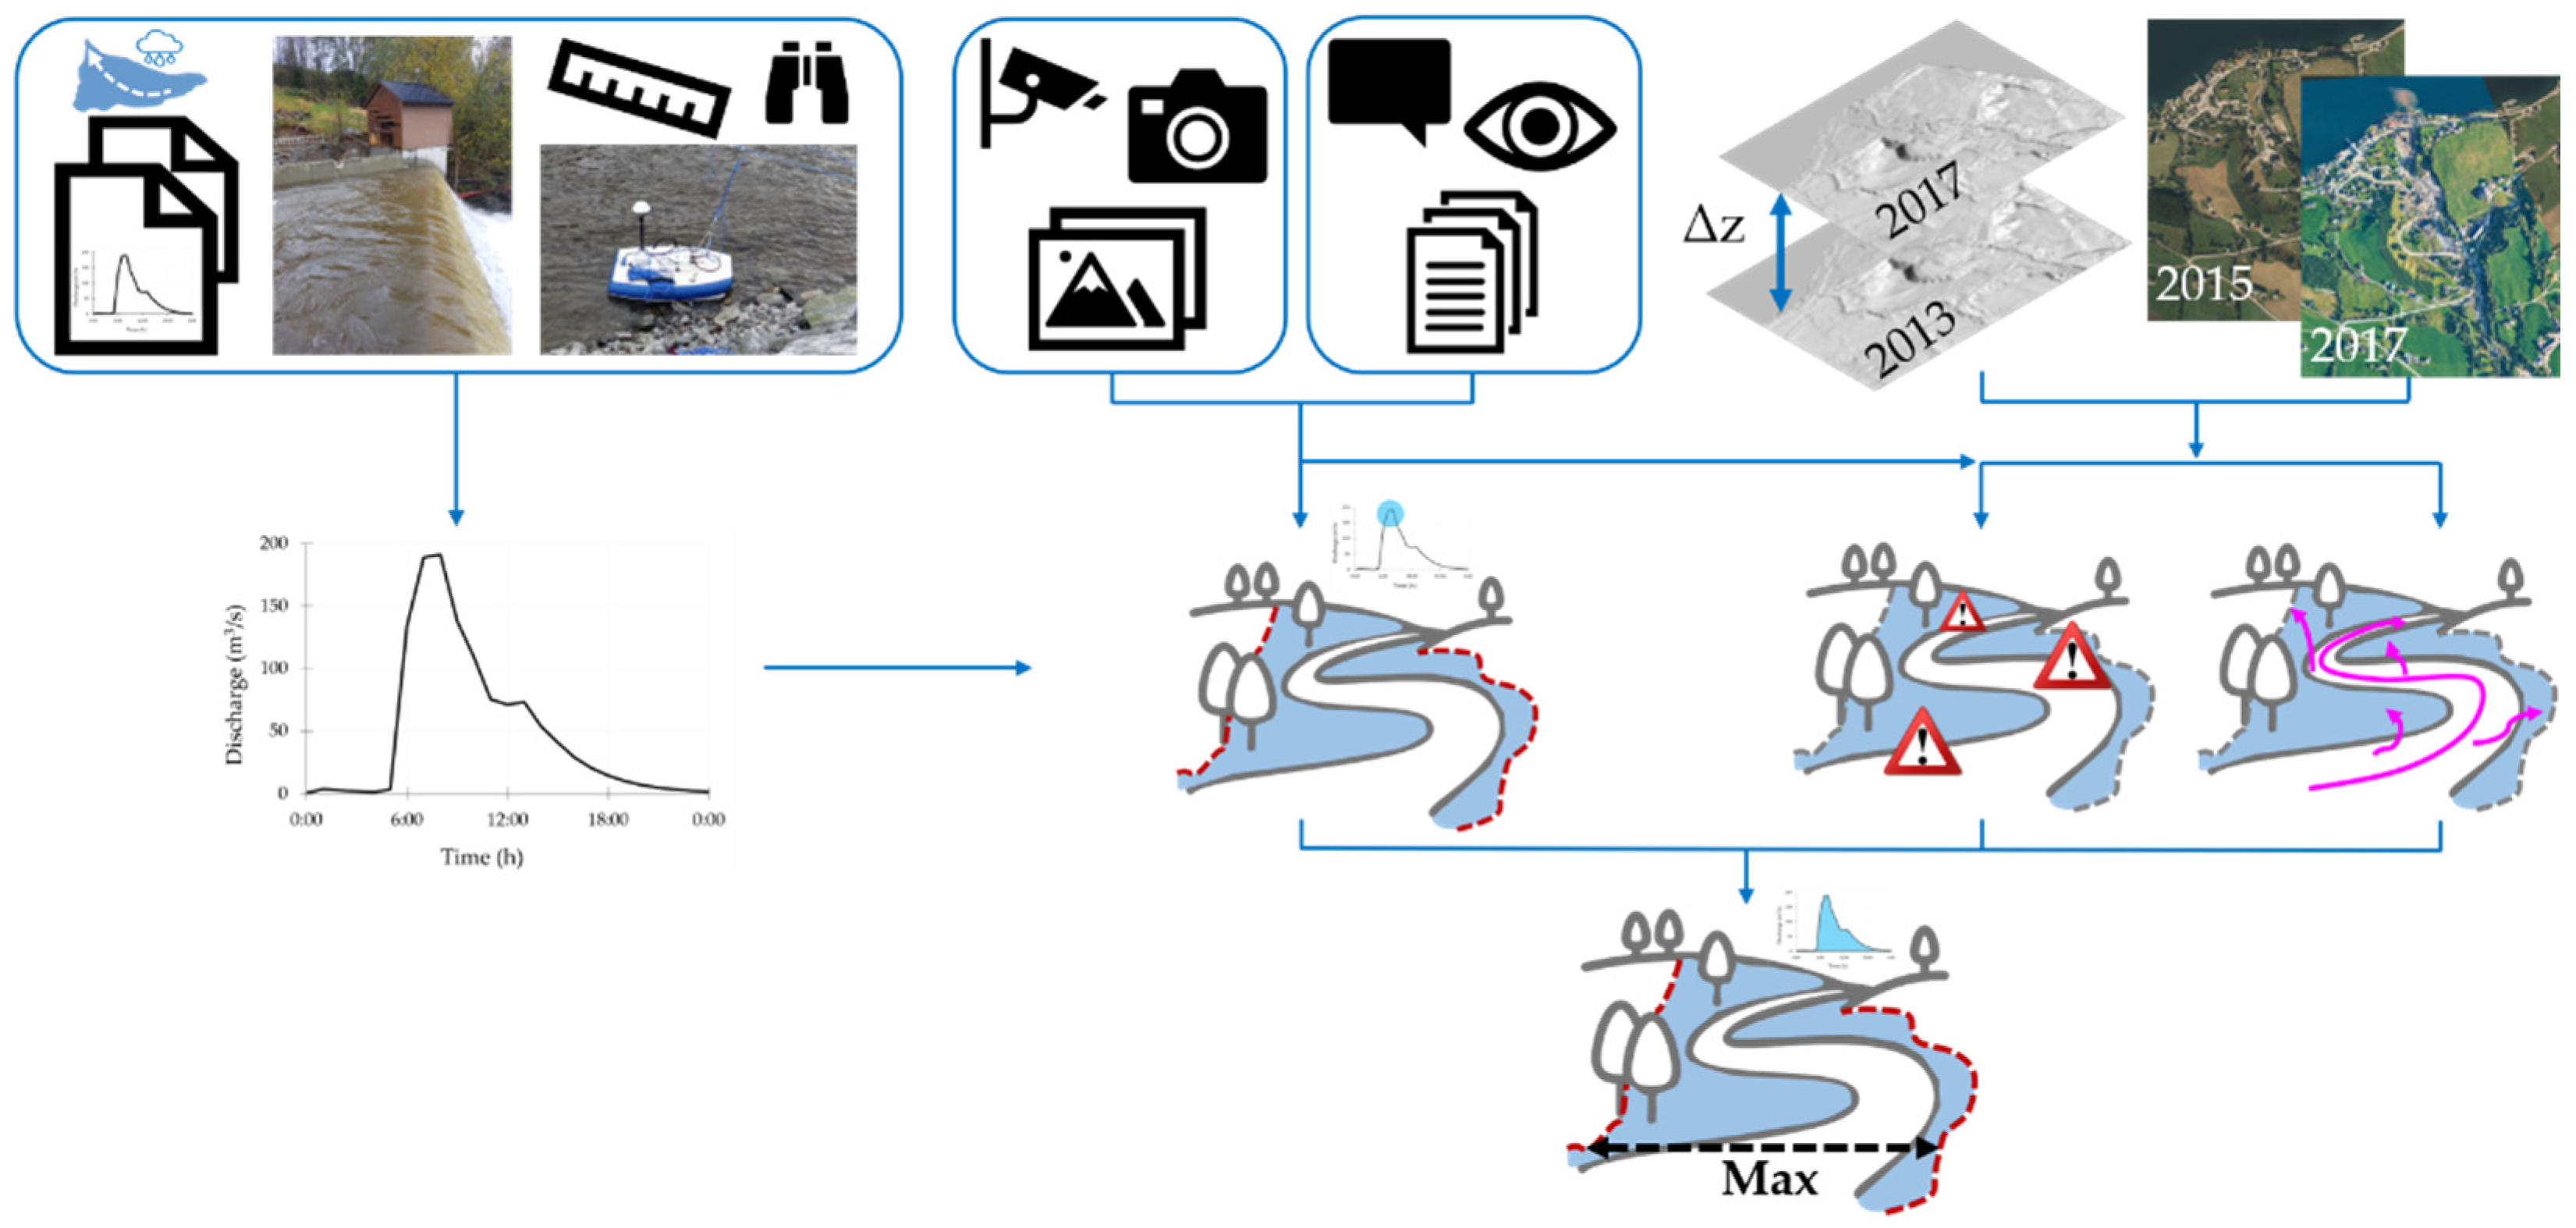
2. Materials and Methods

This section introduces an overview of the available historic flood documentation as well as a photographic and geographic analysis of this documentation to (i) obtain a detailed flood map, (ii) unveil the impact of the flood on infrastructure in the studied reach, and (iii) estimate the effect of observed processes on the river’s response. The procedure followed in this study is summarized in Figure 2 and described in detail in the following sections.

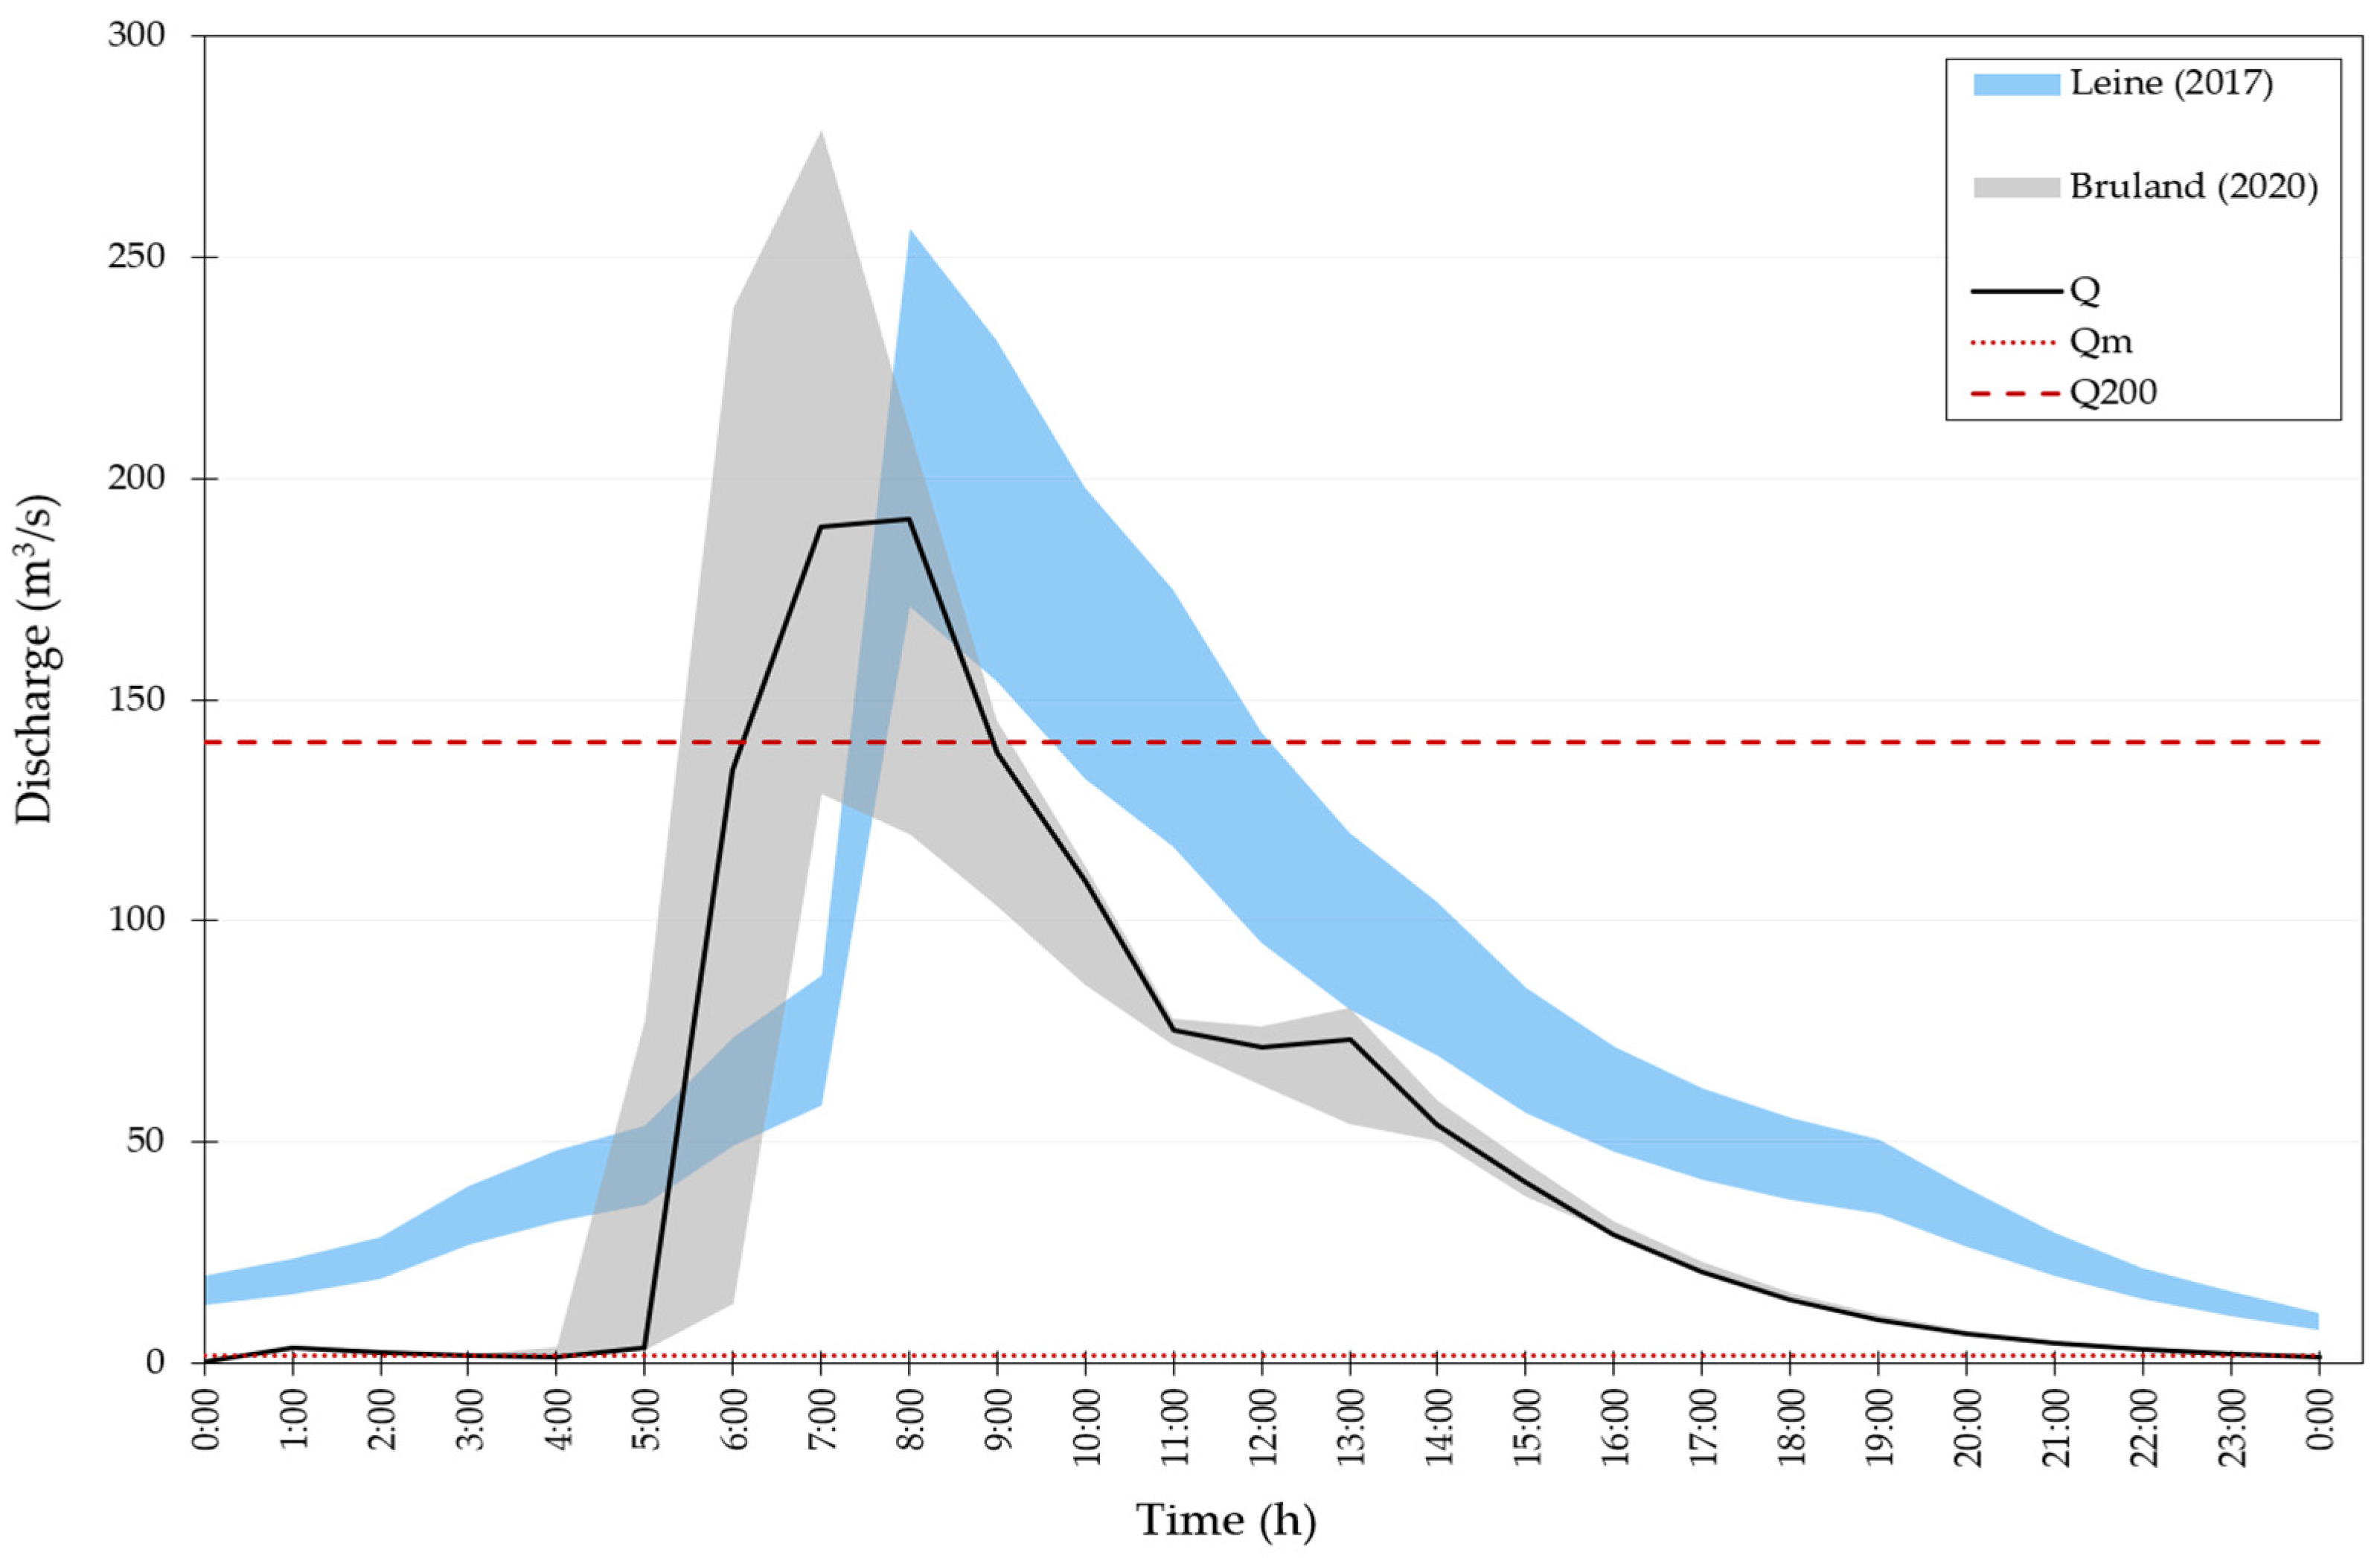
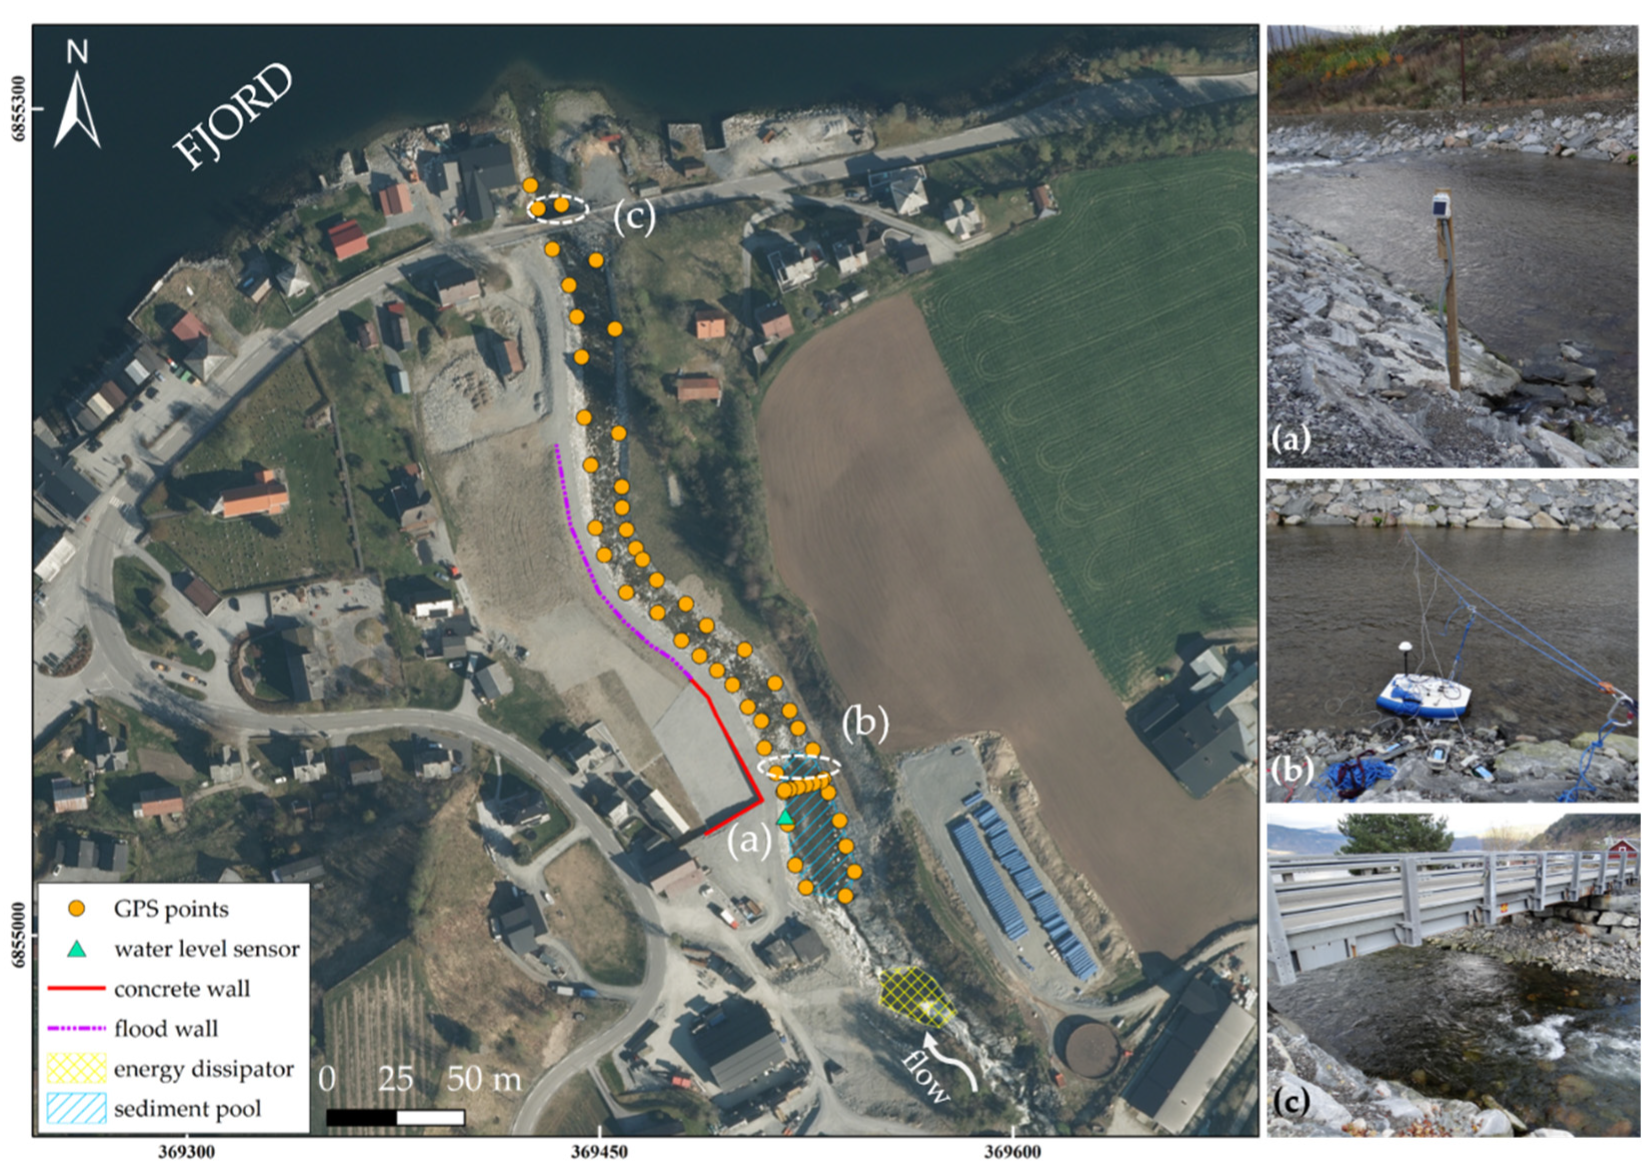
2.1. Hydrologic Modelling and Estimation of Hydraulic Forces for the 2017 Flood

The complex hydrology of the flood event in the Storelva river in 2017 was characterized in Leine [9] and Bruland [8] (Figure 3). Leine estimated a peak discharge of 170–250 m3/s [9] (Figure 3, blue area). Bruland tested peak discharges between 130–270 m3/s with various friction coefficients (Manning number) in HEC-RAS 2D based on observed peak discharge water levels and concluded on peak discharges between 200 and 250 m3/s (shown in gray in Figure 3) when simulated in a distributed HBV model [8]. This corresponds to a return period of 300 to 1000 years in the current climate, and to a 100 to 500-year return period considering up to 40% higher climate change-related estimates for small Norwegian rivers in 2100 [17]. There is consistency in the literature: the flash flood affecting the Storelva river in 2017 exceeded the discharge expected for a flood with a 200-year return period (Q200 in Figure 3, i.e., 140.3 m3/s in [9]).
As it is the case for most of the flood events reported in small mountain rivers, the lack of (i) gauging stations in the river, (ii) long term hydrologic and hydraulic high-resolution data series and (iii) on-site direct measurements during the flood, together with (iv) a large topographic variability, make the uncertainty of the hydrologic estimates large. The visual documentation during the flood served, however, to complement and help assess qualitatively the precision of the hydrologic and hydrodynamic models used for the hydrologic estimates.
Stream power (SP, in W/m, defined as the product of the specific water weight, flood peak discharge and channel slope gradient; [18]) and unit stream power (USP, in W/m2, defined as the SP divided by the channel width; [18]) are significant controlling factors of bank erosion during floods in selected European rivers [19]. The estimates of the abovementioned peak discharge can be used to assess the lower and upper bounds of SP and USP (before and after the flood for the latter), which can be used as reference measurements of the geomorphic effectiveness of this flash flood, for the lowermost 5.2 km-long reach mapped in [12]. In study cases where the flood peak discharge is not available, the stream power index (SPI, dimensionless, estimated using the catchment area instead of the flood peak discharge in the USP equation) is often used as a proxy of the USP. The values of SP, USP and SPI give insights into whether a flood can lead to large-scale geomorphic changes (i.e., contrasting with the widely used threshold of USP > 300 W/m2; [20]). These three hydraulic forces were estimated for the 2017 flash flood and compared with the SPI (SP and USP were not available) for the 2013 flood affecting sub-reaches of the Garona river (Spanish Pyrenees; [19]) of a similar slope range that the Storelva river has, i.e., a longitudinal slope between 4–21%.

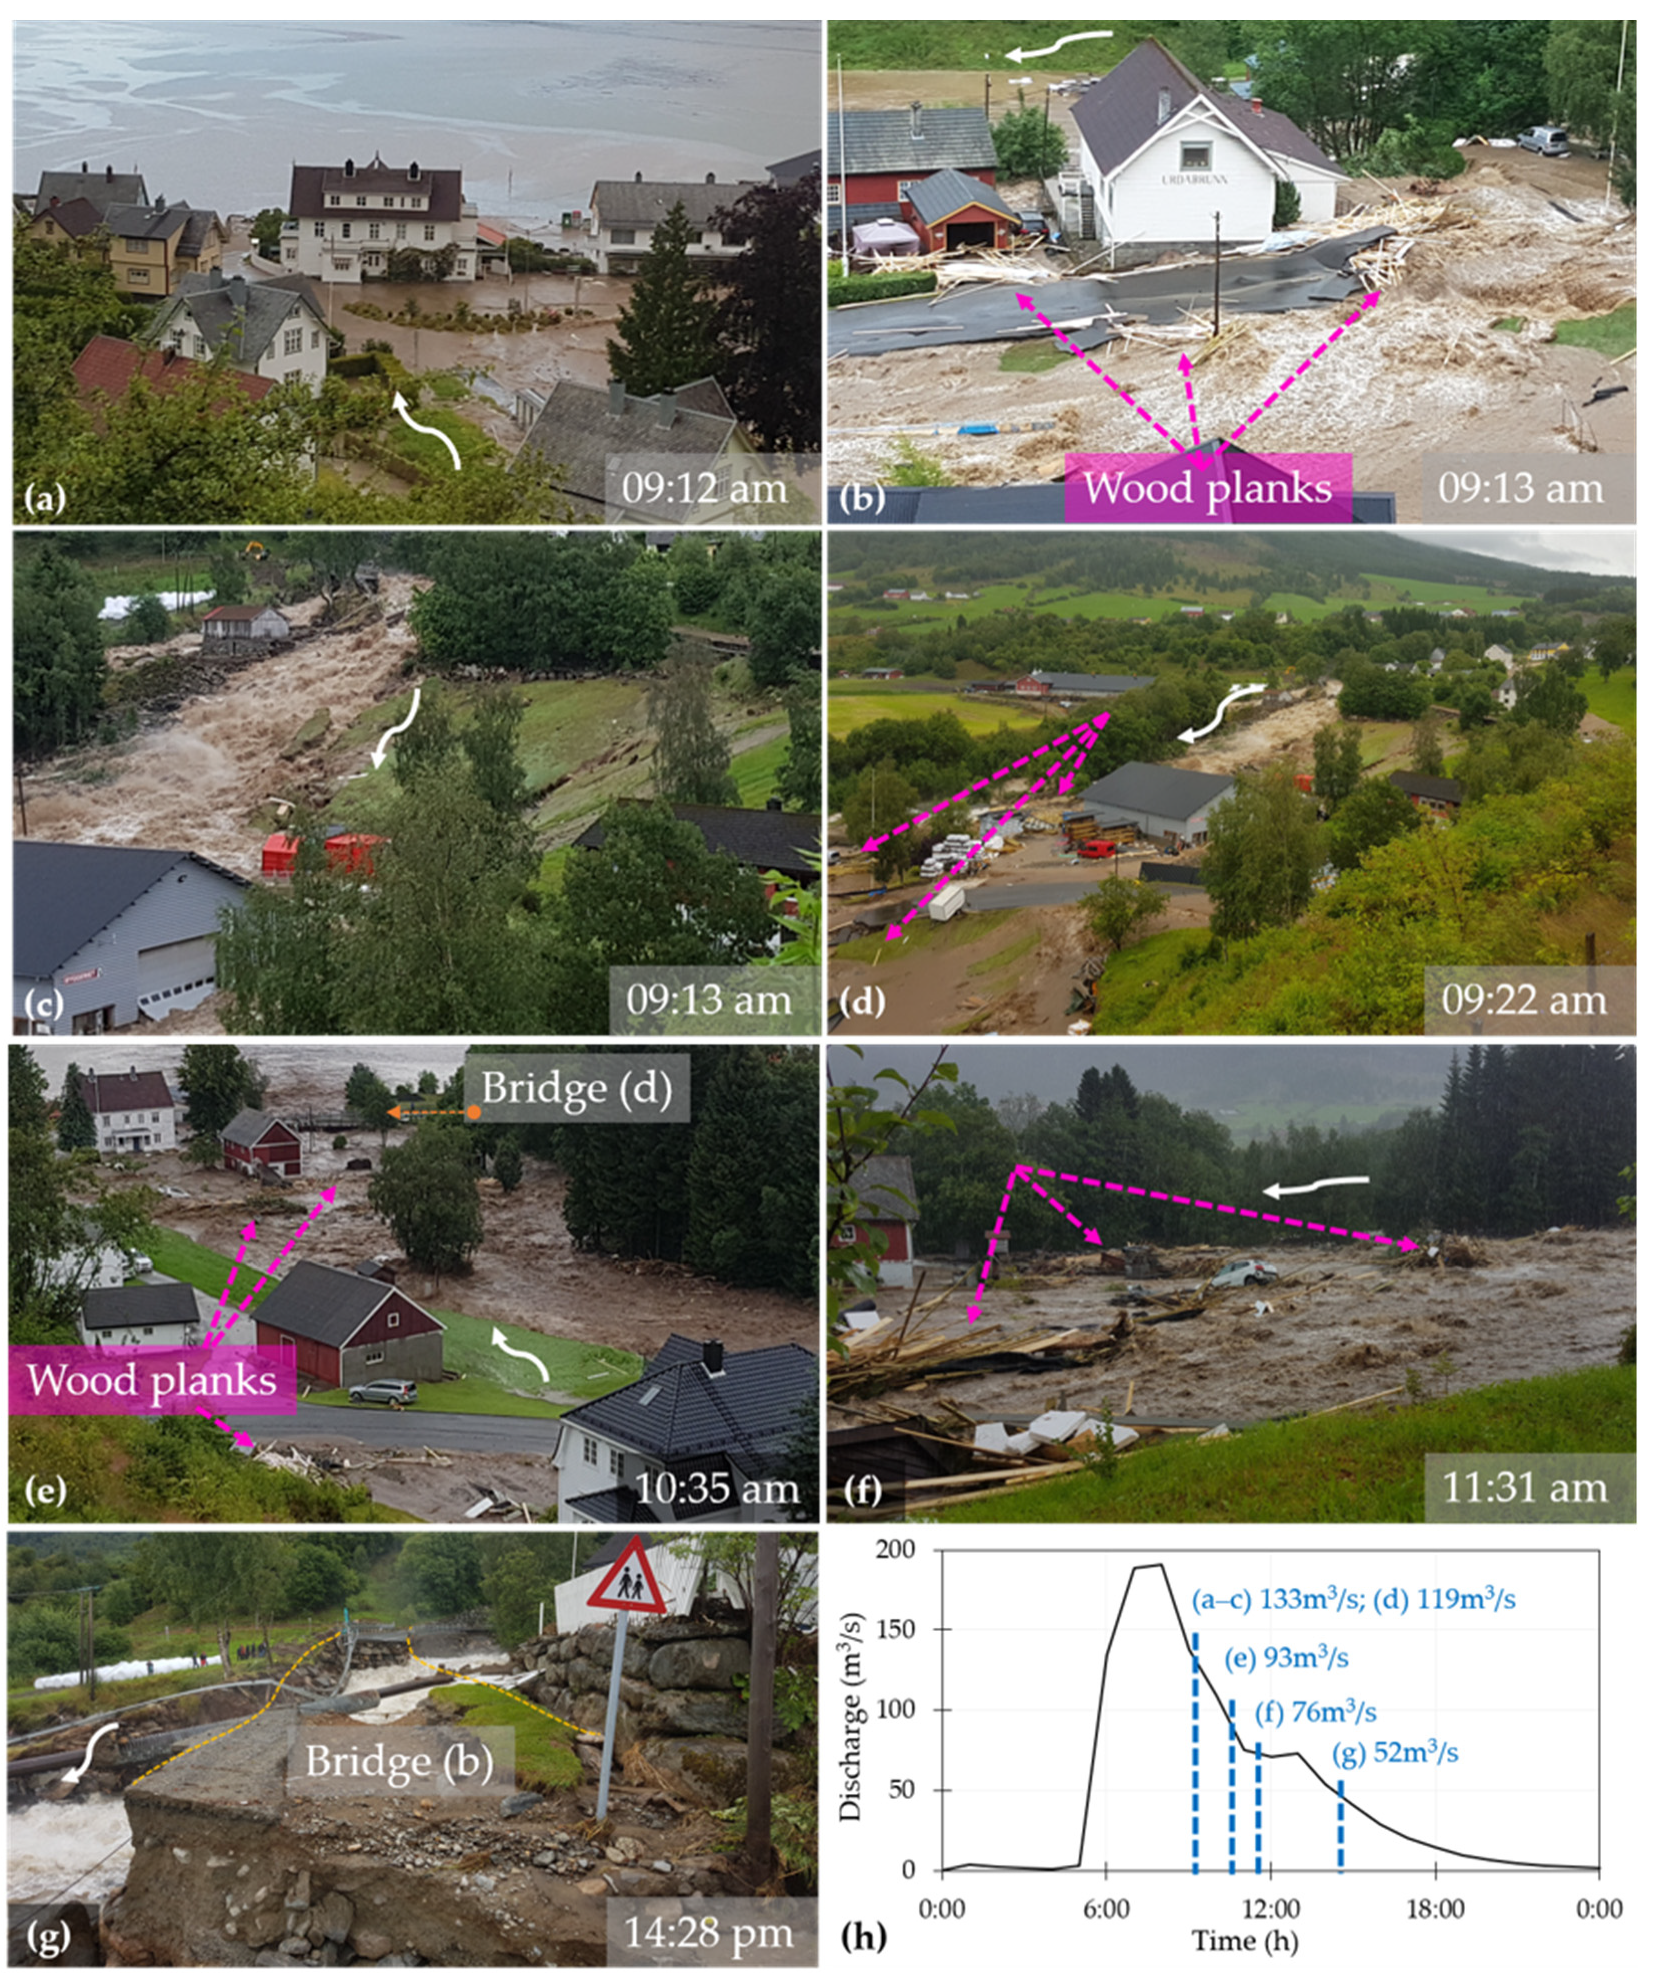
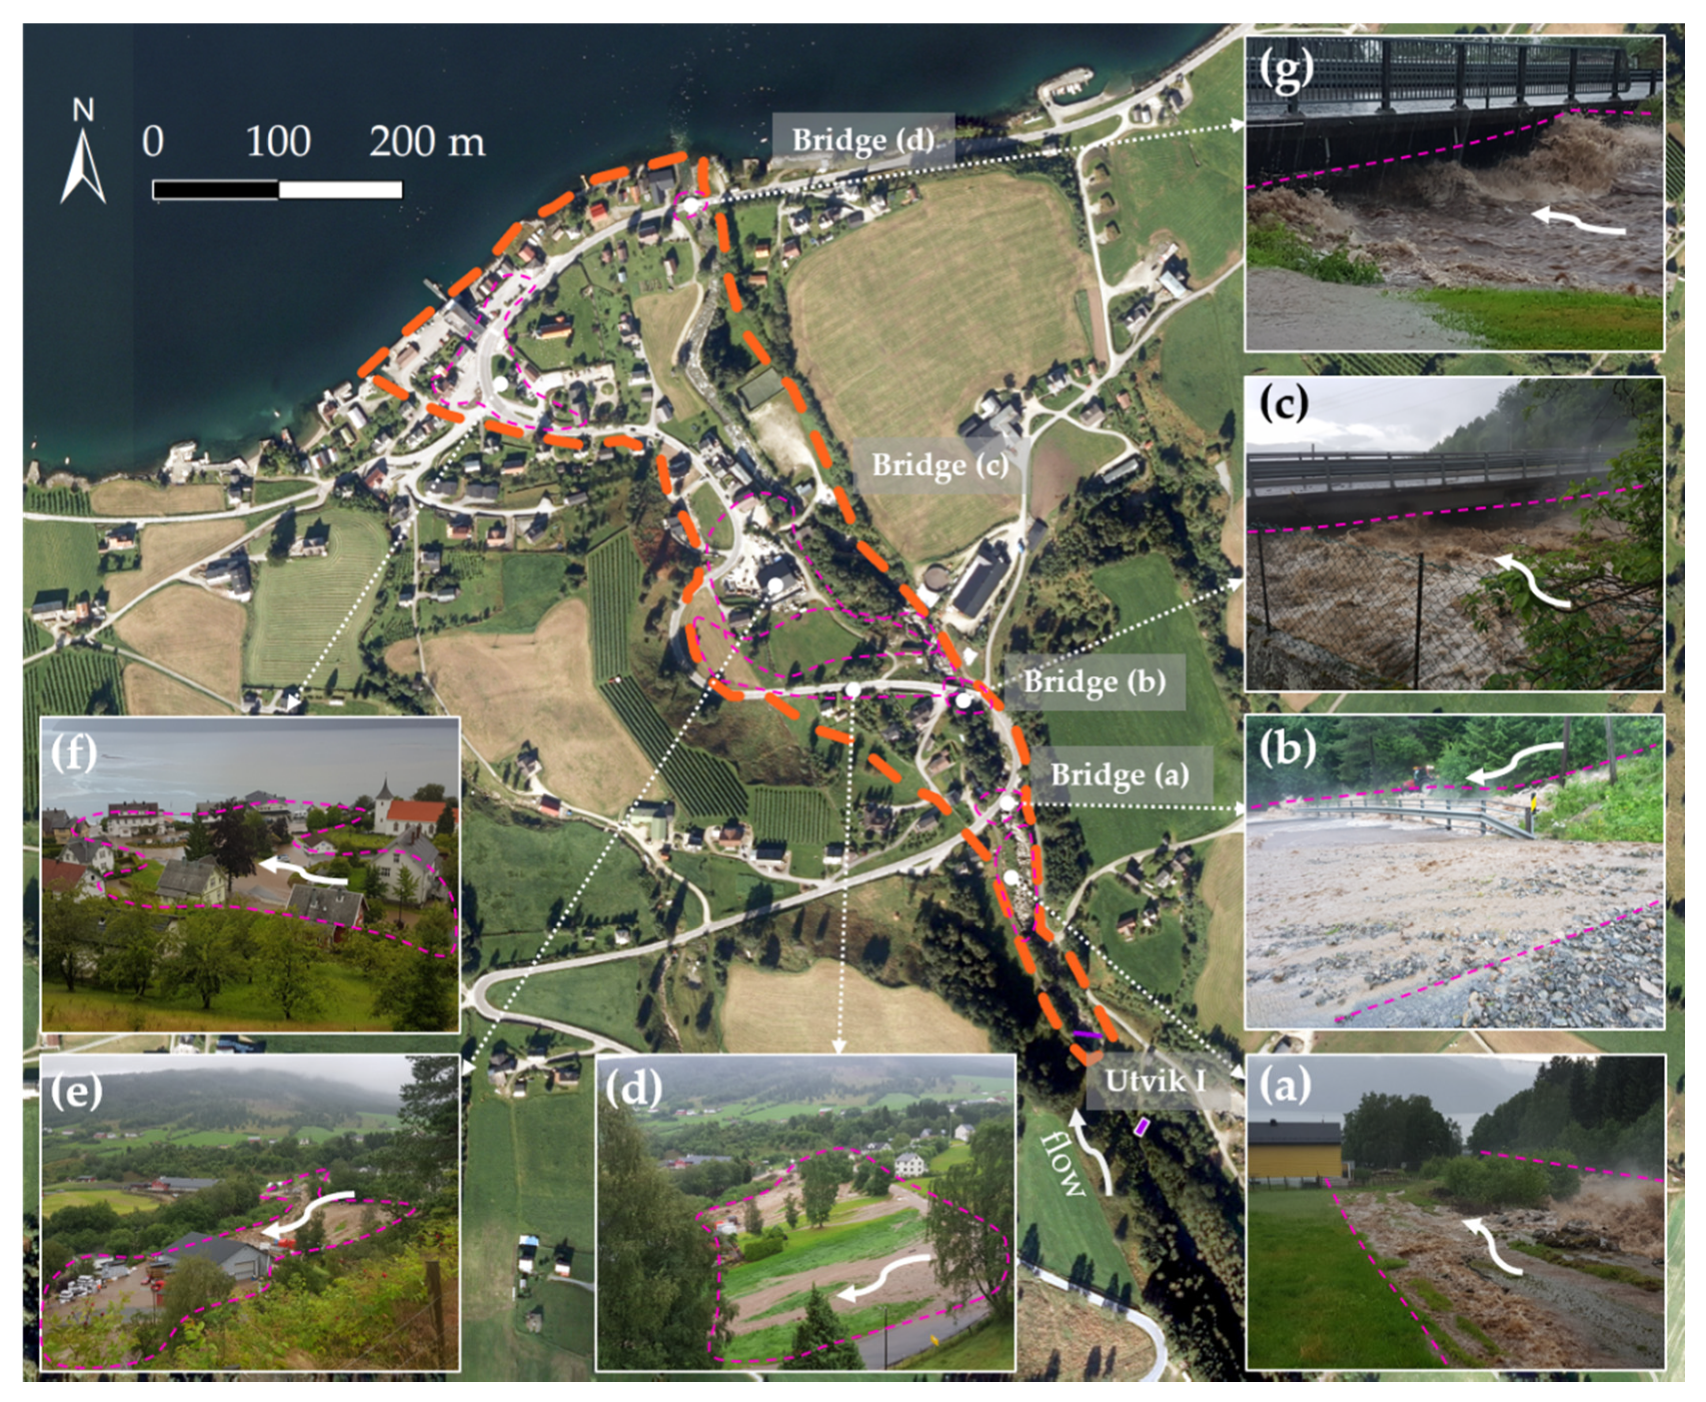
2.2. Visual Documentation and Flooded Area Reconstruction

Mapping the observed flooded area can facilitate both implementing protection measures in case of future floods and numerical model validation. Nearly 200 photographs and videos in original resolution together with more than 25 different news articles documenting the flash flood in the Storelva river were available to assemble the flood extension (e.g., Figure 4) and provide a preliminary overview of the hydrodynamics during the flood event. After an initial screening, 18 news articles that included visual recordings from a helicopter and photographs by eyewitnesses (Figure 1c and Figure 4, Table A1) and 63 high-resolution images and videos taken by O. Bruland on-site were used to reconstruct the inundation area at the peak of the hydrograph. Previous hydrologic studies indicate that the peak of the hydrograph was most likely at 7:00–8:00 a.m. [8] or 8:00–9:00 a.m. [9] (Figure 3). Given the usual flood data scarcity, inherent uncertainty of hydrologic flood analyses and the calibration of the hydrologic and hydraulic modelling with field measurements, the observations available in both temporal intervals were used for the reconstruction of the inundation area (n.b. the documented photographs are available from 7:30 a.m. onwards).
The visual documentation was contrasted with pre-event high-resolution satellite images (e.g., [16], Google Earth) and post-event on-site observations to obtain control points in the most downstream 775 m-long reach, i.e., area of interest (cf. [21]), from the fjord to the dam crest used by Bruland [8] to hydrologically estimate the flash flood. For instance, the main buildings in the residential area, bridges and road were often used as control points, as they were georeferenced and mapped before the flood. The same procedure was used to create the basis for the maximum flooded area, i.e., all the wetted areas identified throughout the entire duration of the flood event. The recreation of the maximum flooded area required using all the visual documentation available, i.e., ca. 200 photographs and videos, in combination with the outcomes of the morphodynamic analysis described in the next section.

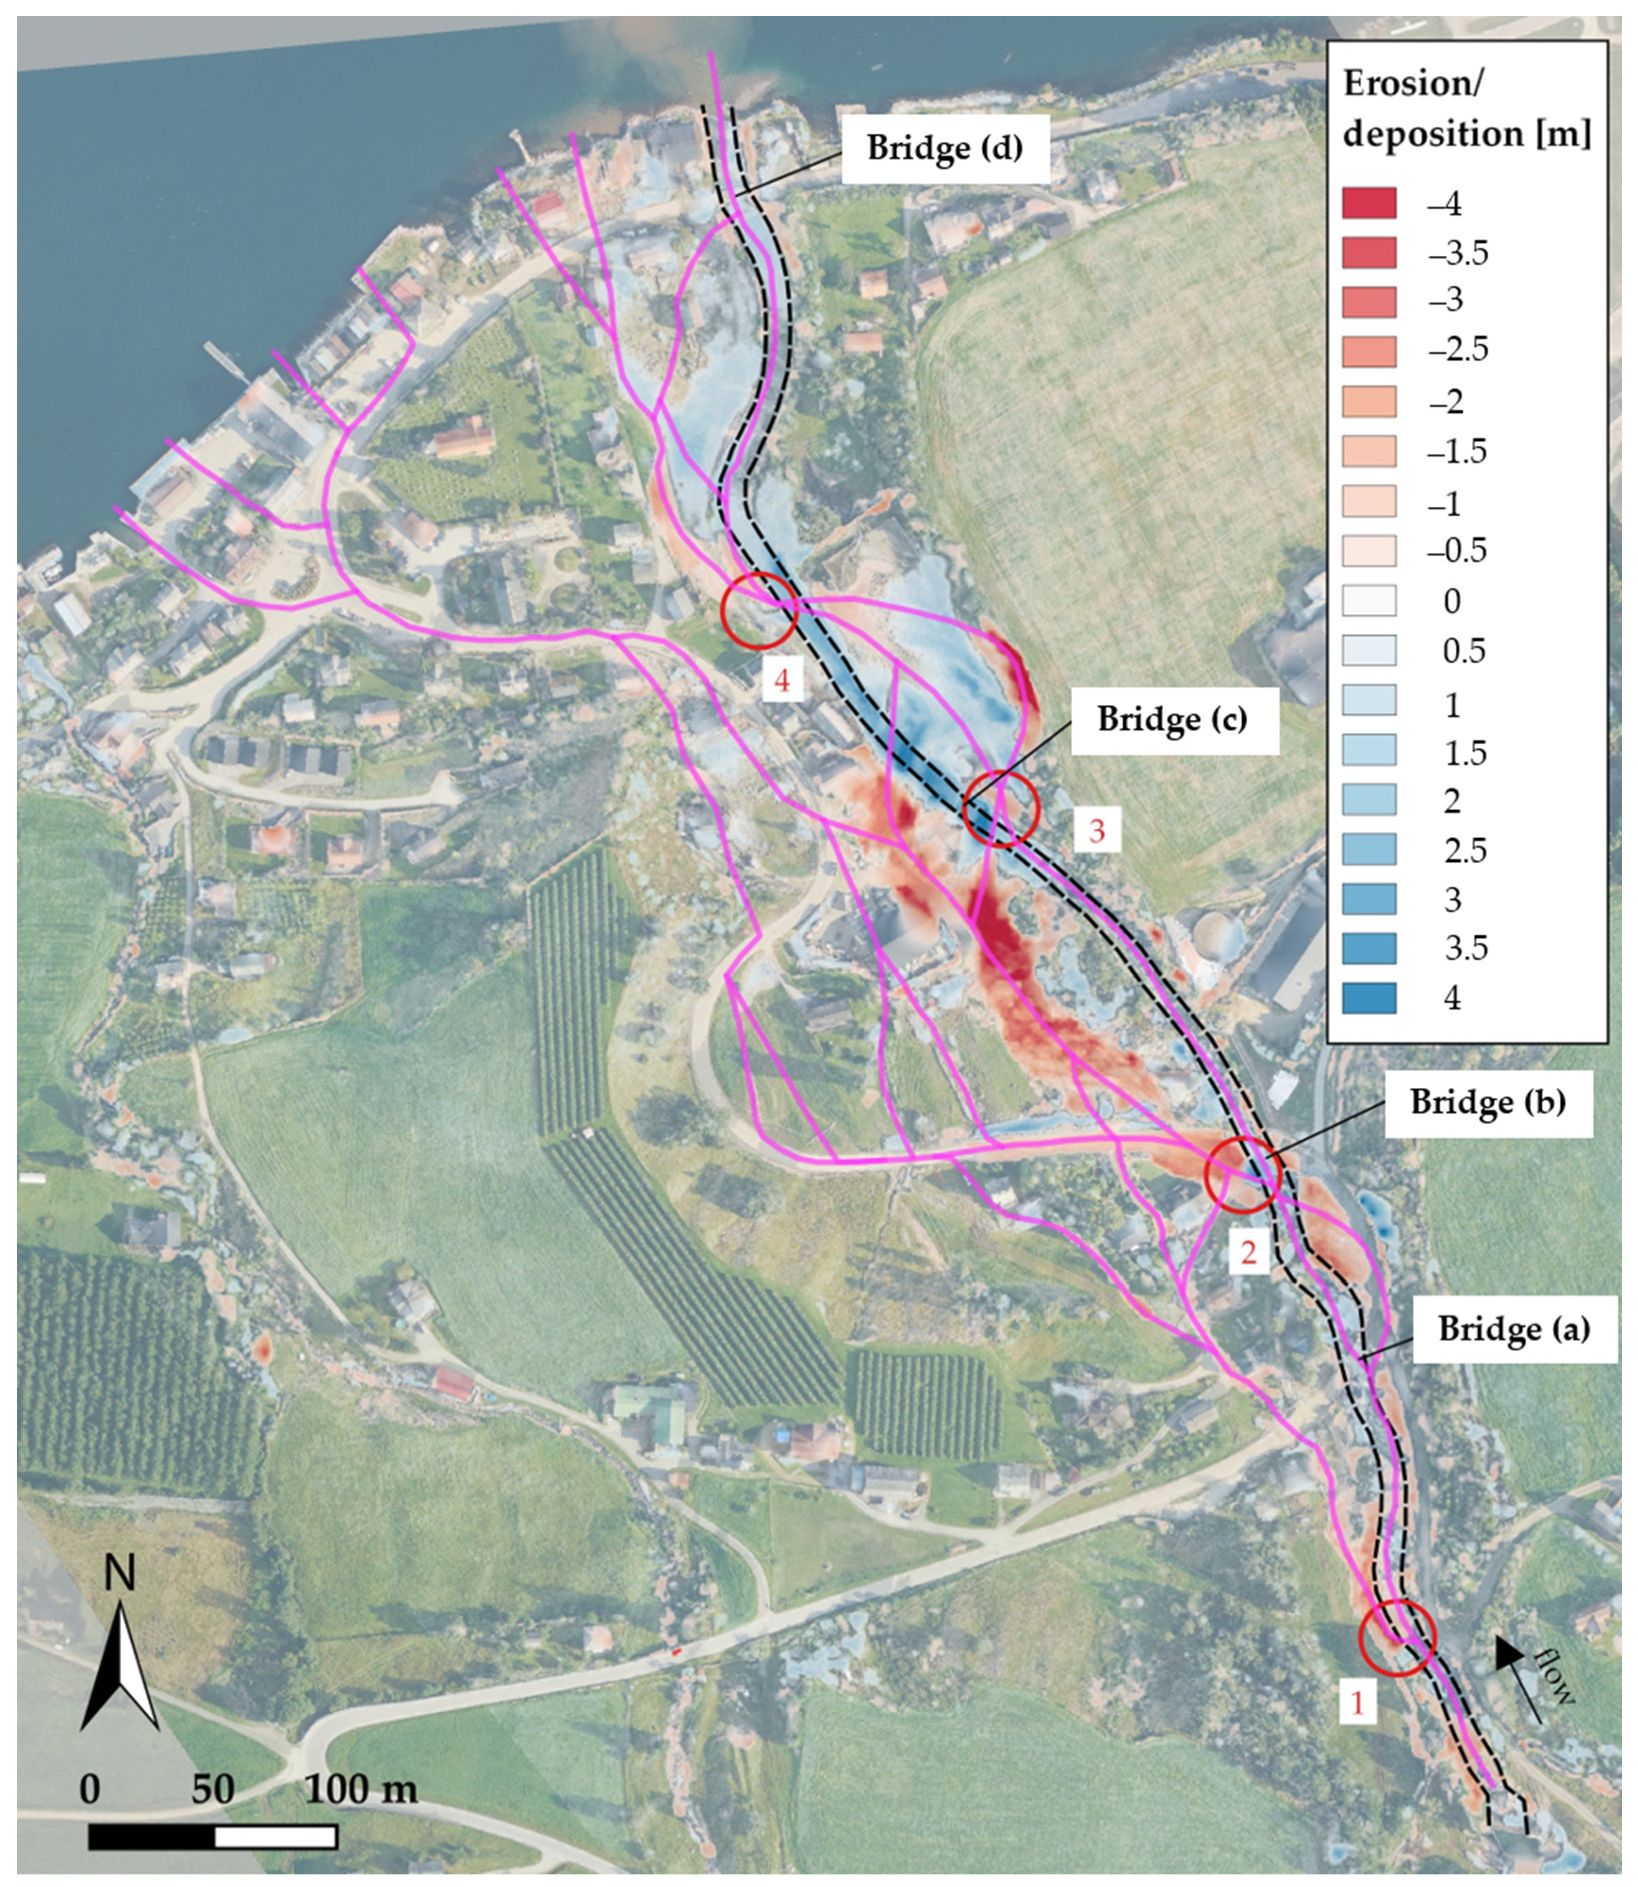
2.3. Morphodynamic Analysis and Reconstruction of Flow Paths

The flood documentation showed significant effects due to morphological processes, as suggested by the dark color of the water (high-concentration of sediment), the sound of stones dragged in the water, the observation of wood planks floating from the construction material shop located near the left bank in the middle of the reach (Figure 4b–f; pink dashed arrows) and the damage to infrastructure upstream, among other factors. These observations supported further analysis on the morphodynamics during the flash flood. This section aims to describe the methods used to reconstruct the preferential flow paths and the erosion and deposition processes observed during the flood. The combination of this information allowed identifying the critical points. In this paper, critical points are locations where the river experienced backwater effect or bank failure during the flood, presumably due to the original river channel’s morphological characteristics, which lead to erosion and deposition of sediments [22]. Furthermore, the maximum flooded area of the flood event was obtained.
A large amount of sediments was transported from the catchment to the village and the fjord during the flood event. Although the volumes of the small landslides triggered by the extreme rainfall in the vicinities of Utvik were estimated, this was not the case for the landslide ca. 600 m upstream from the Storelva river’s mouth [13]. The same study mapped the areas suffering erosion and deposition due to the flood but did not quantify the volume of transported sediments nor classified the sediment fraction. The soil types in the catchment of the Storelva river are mostly moraine deposits and fluvial deposits in the area of interest (i.e., in the village of Utvik by the fjord) [23]. The river channel consists of rock bed and coarse sediments (i.e., pebbles, cobbles and boulders). LiDAR scans and orthophotographs were captured by the Norwegian Mapping Authority before and after the flood (i.e., pre-flood in 2013 and post-flood 10 days after the event in 2017). Digital Elevation Models (DEMs) generated from the LiDAR scans are available online in the resolution of 0.5 m and 0.25 m for pre-flood and post-flood scenarios, respectively [12,24].
In order to assess the creation of the new flow paths, maximum flooded area and critical points during the flood, an erosion and deposition map was obtained by comparing pre- and post-flood DEMs (i.e., subtracting the DEMs in GIS software). Subsequently, the flow paths and the critical points were estimated by using a qualitative assessment of the (i) erosion and deposition map, (ii) orthophotos and (iii) visual documentation and testimonies for the entire duration of the flood event. In the erosion and deposition map, the erosion locations were considered indicators of the position of the flow paths. In the same erosion and deposition map, the locations where the deposition occurred in the river channel and caused the river diversion (i.e., seen as erosion in the map) were considered critical points. The maximum flooded area was primarily assumed in the locations where erosion and deposition exceeded the value of ca. 0.5 m (preliminary value assumed for this specific case based on the overall range of post-flood erosion and deposition in the area of interest). Then the observable flood marks in the visual flood documentation and the post-flood orthophoto, such as erosion of the sediments of the rock bed outside of the original channel, damage on structures, wood planks transported by the water, eroded lawn, etc. were used together with the on-site testimonies to refine the reconstruction of the flow paths, maximum flooded area and critical points.

3. Results

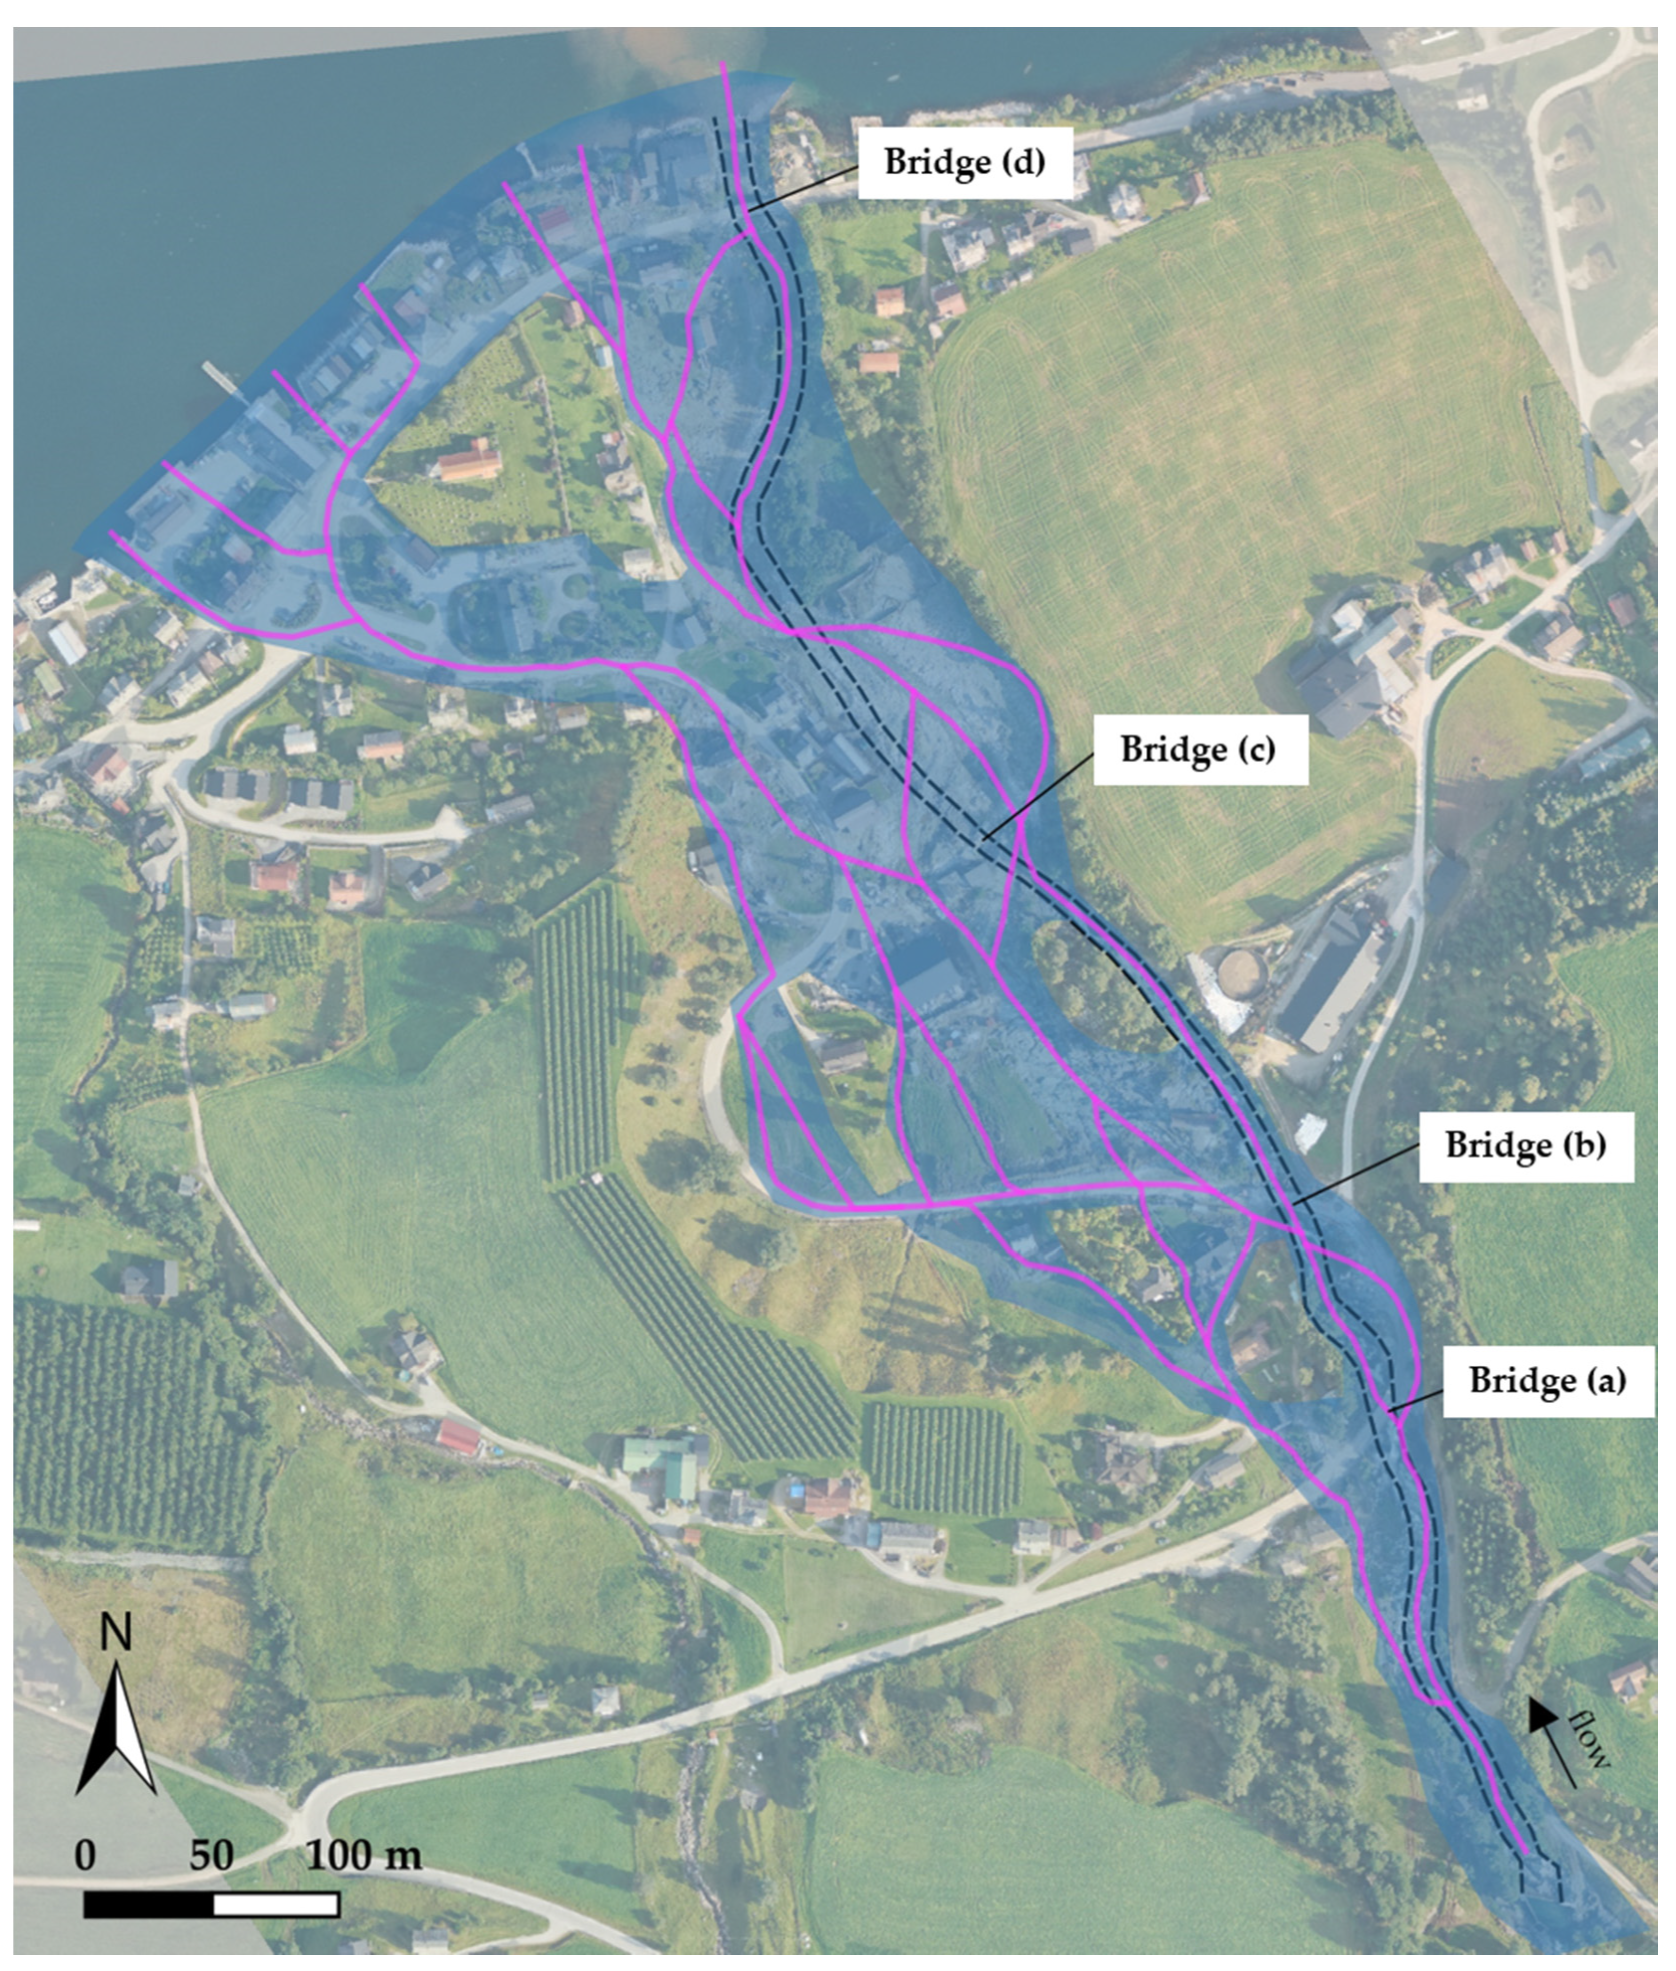
3.1. Final Flooded Area at Qpeak

The observed flooded area, i.e., set of wetted and dry areas affected by the flood, in the area of interest was 101,552 m2 (Figure 5, thick dashed orange polygon), including flooding near all four bridges (marked “a” to “d” streamwise) and in the lower areas of both sides of the floodplain, according to the documentation of the historical flood. Figure 5 shows examples of documentation of flooded areas and water levels (i.e., thin pink dashed marks in subfigures) during the peak of the hydrograph.
The uppermost bridge (Figure 5b, “bridge (a)”), which was severely damaged due to erosion processes enhanced by the flood, served as the main county road (Rv60 connected to road E39). The road by bridge (a) was washed away, interrupting the connection with neighboring villages southwards. This location seemed to be critical, as the water left the channel and made its way to (i) the left floodplain and the houses located in the upper reach (Figure 5a), as well as to (ii) the right floodplain due to failure on the right-hand side of the bridge (a) and guided by the road until bridge (b) (Figure 5b,c and lowermost right floodplain). A bit more downstream, by the bridge (b), the waterway between the piers of the bridge clogged, leading to a local rise of the water level. The riverbank was overtopped and consequently eroded, which resulted in the collapse of the flood protection wall along the river reach. Subsequently, the road embankment by bridge (b) broke down, guiding the water coming from upstream and overflowing bridge (b) to follow the road and continue downwards on the floodplain all the way westwards downstream (Figure 4 and Figure 5c–f). This location seemed to be the most critical.
According to reports and testimonies (Table A1), it is believed that the water flowed following shortcuts in between the houses along the left floodplain. Moreover, a great amount of wood planks from the construction material shop located on the left bank were transported along the left floodplain all the way to the fjord (light colored clusters by the front row of houses marked by pink dashed arrows in Figure 1 and Figure 4e) when the breakage by bridge (b) occurred and the road was eroded away. Witness testimonies suggest that on the right floodplain, near bridge (b), the owner of the property created a barrier with sacks and successfully blocked the water from taking a new direction and potentially eroding out a channel in the direction of his property. There was a very small bridge close to the construction material shop (Figure 5e, “bridge (c)”). This third bridge was completely eroded together with the left bank. The houses in the center of the village were affected and, to minimize the damage, an excavator was used to divert the water back to the original river channel between bridge (c) and the downstream channel kink. The efforts put on-site into reducing the flood damage did not prevent the collapse of the most downstream bridge by the fjord at 10:36 a.m. (Figure 4 and Figure 5g, “bridge (d)”), leaving the village completely isolated by land [8].
The damages were not limited to the area of interest of this study, nevertheless. One of the oldest mini HPP located on the right bank upstream of the study reach (i.e., Utvik I, Figure 5 purple rectangle) was destroyed [8,13] and its rebuilding process started in 2019 downstream in the right floodplain between bridges (c) and (d), where the sports pitch used to be [25]. Moreover, the county road suffered numerous rock- and landslides in the upstream reach, outside the limits of the study area (not shown, [13]).

3.2. Main Flow Paths and New Channel Formation

The erosion and deposition map (Figure 6) obtained from comparing DEMs, together with orthophotos and visual documentation and testimonies, resulted in the preferential flow paths (purple lines in Figure 6) and main critical points (red circles in Figure 6) for the maximum flooded area of the 2017 flood. From upstream to downstream of the area of interest, four critical points were identified: (i) upstream of bridge (a), (ii) by bridge (b), (iii) in the middle of the reach between bridges (b) and (c), (iv) downstream of bridge (c), and near the channel kink (locations 1 to 4 in Figure 6).
The erosion occurred mainly on the left floodplain. For instance, ca. 100 m upstream bridge (a), intensive erosion of the left bank resulted in water overflowing and originating a new flow path (critical point 1) all the way to the main road crossing the village. Moreover, on the right bank between bridges (a) and (b), there was a short flow path that eroded ca. 2 m of material while following the bend of the road to bridge (b). As described in the previous section, the water followed the road from bridge (b) and found shortcuts across the village, reaching its core residential area and the fjord (purple lines in the farthermost left floodplain). On the left bank by bridge (b), the road embankment breached (critical point 2) and created the new river channel out of the original one between bridges (b) and (c). The erosion in the new river channel reached the rock bed (i.e., erosion 1.5–5 m). The most critical location was the new channel created between critical points 2 and 3 because most of the water was diverted from the original river channel (black dashed lines in Figure 6) and part of the water flow was inclined towards the core residential area in the village, causing property damage. For instance, the construction material shop located in the left floodplain (Figure 5e) got damaged and wood planks were transported along the aforementioned new flow paths.
Due to a gentler longitudinal slope, the material eroded during the creation of the new river channel was deposited especially in the original river channel downstream of bridge (c), reaching deposition values between 2.5–4 m. The new flow direction (caused by the diversion of the water from the original channel in critical point 2) resulted in the new channel crossing the original one upstream of the bridge (c) (critical point 3). Then the new channel hit and eroded the steep slope in the right floodplain and, following the topography, bent back towards the village between critical points 3 and 4. The flow returned from the right floodplain to the left one by eroding its way across the original channel (critical point 4) and flooding several houses on the left floodplain before reaching the fjord.
In summary, the combination of the information provided by the visual flood documentation and eye witness testimonies, together with the erosion and deposition map obtained by the DEMs of difference resulted in the reconstruction of the preferential flow paths during the flood, the identification of the critical points caused by erosion and deposition processes, as well as a refined mapping of the maximum wetted and dry areas during the entire flood event (Figure 2 and Figure 7). The maximum estimated wetted area was 93,658 m2 (in blue in Figure 7). The discrepancies between observations (i.e., visual documentation and erosion and deposition map) and maximum estimated wetted area vary along the area of interest. In some cases, especially in the urban area, the presence of reference objects (houses, fences, road, etc.) in the visual documentation facilitated the mapping process, whereas in locations where such references were not available (especially in the right floodplain) the erosion and deposition map and post-event orthophoto were the main reference. Therefore, the discrepancies depend on the expertise and subjectivity of the user, as well as the resolution of the visual documentation and DEMs. The Norwegian national flood viewer [26] does not list any flood event for any return period between 10–1000 years in the Storelva river and thus the 2017 flood event was not mapped previously by any authority and the estimations from this study cannot be contrasted with official flood maps for the study area.
The geomorphic effectiveness of the 2017 flash flood was estimated to be 284,490 W/m < SP < 355,612 W/m, i.e., for 200 < Qpeak < 250 m3/s for the 3.6 km-long reach upstream of bridge (b). Another indicator of geomorphic effectiveness of the flash flood is USP, which was estimated to be 17,158 W/m2 < USPbf < 21,448 W/m2 (before the flood) and 1794 W/m2 < USPaf < 2243 W/m2 (after the flood) for the same reach. According to the threshold of USP > 300 W/m2 proposed by [20], the 2017 flood in the Storelva river was considered capable of causing large-scale geomorphic changes. For reference, the SPI for the Storelva river during the 2017 flood was 2123 (SPI, dimensionless), which is relatively low compared to the average SPI estimated for the steepest uppermost areas of the Garona river in the Spanish Pyrenees (i.e., slope between 4–21% for a sub-reach of ca. 2.5 km) during the 2013 flood [19], i.e., 13,927. However, it is noteworthy that the active channel after the 2017 flood was nearly 10 times wider by bridge (b) than the width of the original channel of the Storelva river. In contrast, the Garona river suffered in average a widening of ca. 3.5 times its original width in the abovementioned sub-reach.

4. Discussion

4.1. Identification of Critical Points and Uncertainty

The current study has estimated and mapped the observed flooded area of the 2017 summer flash flood in the most downstream 775 m-long reach of the Storelva river in Utvik (western Norway) and highlighted the locations that suffered the most critical damage due to the extreme precipitation (see Results). The intensity of the erosion and deposition processes generated critical points where the effects of the flood were amplified, as shown by the locations 1 to 4 in Figure 6. Location 1 experienced material accumulation and clogging of the waterway, location 2 suffered backwater effect and subsequent erosion of the left bank, location 3 experienced deposition of eroded material into the original channel and flow diversion to the right bank, and location 4 suffered erosion of the original channel and left bank. Bridges (a), (c) and (d) were eroded away, and the road embankment by bridge (b) was eroded and damaged on the left bank (Figure 4 and Figure 5). Moreover, the severe erosion generated a new river channel and several secondary flow paths during the flood (Figure 6), affecting most of the residential area exposed. Although the effects of such critical points were identified by on-site observations and visual documentation, the geomorphic causes of such critical points were identified when combining such observation with the erosion and deposition map. This study case stresses the importance of monitoring steep rivers and documenting flash flood events. The visual documentation during- and the laser scan post-event provided essential information on the morphologic processes during the flood event, improving our understanding of it and directing our focus to the core issue: the erosion, transport and deposition capacity of steep rivers during flash floods. The procedure followed in this study (Figure 2) was a preliminary attempt to develop a methodology to investigate the causes and effects of similar flash floods affecting steep rivers in other regions.
As mentioned in Section 3.2, some of the discrepancies between field observations and estimated flood extension (i.e., maximum flooded area in Figure 7) were due to inherent uncertainties in the flood mapping process (e.g., inadequate data resolution, insufficient data available, or expertise and subjectivity of the user) and partial spatial and/or temporal coverage of the observations, as some locations were hardly accessible at the peak of the flood event (i.e., timestep used for the validation of control points; [27]). As most of the village was devastated, the damages caused by the 2017 event were promptly repaired, which concealed most of the marks left by the flood. Therefore, GPS measurements of such traces are not available. The uncertainty inherent to the hydrologic input data for this study case was addressed in previous studies (e.g., [8,28]), so we will limit to a short overview of the topographic input data.
There is a large variability in the quantity and quality of the data available before the event and after it occurred. For instance, the pre-flood DEM for the Storelva river has a low-resolution, i.e., 2 points/m2 or 0.5 m, whereas the post-flood DEM has a high-resolution, i.e., 10 points/m2 or 0.25 m [12,24,29]. The Storelva river was laser-scanned only once before the flood and twice after it. This trend is also observable for the aerial photographs, where the Storelva river used to be surveyed in average every 6 years during the ca. 50 years before the 2017 flash flood and was surveyed twice in the 3 years after the flood event. Moreover, the pixel size of the most recent orthophoto before the flood was of 0.25 m and it increased resolution to 0.10 m after the flood [15,16]. This improvement in resolution was, however, probably not due to technological or methodological improvements, as suggested by the availability of aerial photographs with a higher resolution in previous surveys than that immediately before the flood (e.g., 0.10 m in 2013 or 0.20 m in 2006). The actual density of points in the DEMs is generally 2–3 times higher than the nominal point density originally planned, nevertheless, due to the high overlap of parallel scans during the laser surveying [29], and collecting high-resolution bathymetric data can be very costly. Recently developed discharge and terrain correction techniques have been proven to provide reasonable flood estimates in the absence of high-resolution topographic data, as long as water levels during floods are available [30]. It might be, therefore, more cost-effective to dedicate field surveys to obtaining high-resolution calibration data, such as water edge points or discharge, than to improve the existing bathymetric data. We will address this again in Section 4.3.

4.2. Severity of Flash Floods in Steep Rivers

The Storelva river has very complex hydrodynamics due to its steep longitudinal slope (i.e., 10.52% in the area of interest and 14.33% in the lowermost 5.2 km [12]) and low relative submergence (i.e., coarse sediment bed and low average discharge) [11]. The flow resistance of steep rivers tends to be underestimated in flood studies. Steep rivers such as the Storelva river have very high roughness and, as opposed to mild-sloped rivers, the threshold between sub- and supercritical flow is very narrow for steep rivers. Such characteristics enable a very rapid transition from normal to extreme conditions in steep rivers, resulting in a quick catchment response even during a gentler rainfall event than the one that originated the 2017 flash flood.
The rainfall intensity originating the 2017 flash flood was 3–5 times higher than the estimated 200-year return period for the same rain event duration [8]. The Storelva river had originally a narrow channel and few flood protections distributed along its length. Consequently, the river response to the 2017 flood, in terms of erosion, channel widening and incision, was unparallel. Although the geomorphic effectiveness of the 2017 flash flood, in terms of SPI before and after the flood, seemed to be low in comparison to the 2013 flood affecting uppermost areas of the Garona river in the Spanish Pyrenees of a similar longitudinal slope [19], the 2017 flash flood had a larger eroding capacity as indicated by the nearly three times larger channel widening observed in the Storelva river. Considering that both rivers had similar channel widths before their respective flooding, the lower SPI values for the Storelva river can be explained by a smaller catchment area (i.e., ca. 25 km2 for the Storelva river versus > 250 km2 for the reference reach of the Garona river), which is included in the calculation of the SPI. Although the Garona river has a catchment area over 10 times larger than the Storelva river, the SPI for the 2013 flood in the Garona river was only 6.5 times higher than that of the 2017 flood in the Storelva river. Furthermore, the USP and, consequently, the SPI tends to reach maximum values near the headwaters [18]. SPI was estimated near the headwaters in the Garona river [19], whereas this study has analyzed the SPI of the 2017 flood in the lowermost reach of the Storelva river. In addition, erosion and deposition processes play an important role during flash floods in steep rivers by creating new flow paths out of the river channel. The valley of the Storelva river is steep although less entrenched near the river mouth, by the fjord, where most of the urbanization is allocated. This provided a larger area in which the river could move laterally, a process that was enhanced by the steep longitudinal slope. The material composing the valley and riverbanks and bed in the Storelva river is loose and easily erodible, leading to a large potential for sediment transport. The high flow velocity and erosional power observed in this study case, enhanced by the steep slope even in the residential area, where the houses determine the flow paths together with the steep terrain, can result in unexpected damages to an unprepared population in a very short time span. The management of such rivers could be facilitated by forecasting models and studies that improve our understanding of their response to floods.

4.3. Implications and Future Work

The hydro-morphodynamics characterizing this extreme event are very different from those expected in larger, mild-sloped rivers. This is most likely due to the steep longitudinal slope and large contribution of loose material to the Storelva river. The flooded area at the peak of the hydrograph could not be refined by revisiting the flood documentation at different timesteps with supporting GPS field measurements due to immediate post-event restoration of the damaged locations. Combining the flooded area at the peak of the hydrograph with the main identified flow paths and erosion and deposition map, however, helped to identify dry and wet areas during the 2017 flood event. Such a combined map could be used complementarily to calibrate and validate future modelling studies. The hydraulics should be modelled numerically using tools designed for such steep gradients and with a very good representation of the complex topography. Further efforts need to address the erosion and sediment transport during the 2017 flood, nevertheless, as the integration of morphodynamics in the model might increase its precision.
Recent field inspections allowed documenting the progress of post-disaster recovery and current state of the Storelva river. Besides the reconstruction of bridge (d) (Figure 8c), some of the safety measures implemented post-flood include concrete and flood walls on the left floodplain, access road on the left floodplain, partial channelization of the river downstream using riprap on both river banks, a sediment deposition pool and an energy dissipator upstream of the sediment pool [31] (Figure 8). Furthermore, it is essential to dedicate field surveys to obtaining high-resolution calibration data and better the understanding of future floods in small, ungauged steep rivers such as the Storelva river.
Several drone surveys of the 400 m-long most downstream reach of the Storelva river (Figure 8) were performed throughout 2019 (i.e., spring and autumn) and 2020 (i.e., summer and autumn) in order to find the most suitable dataset for the creation of a DEM from Structure-from-Motion photogrammetry (cf. [33]). The surveys were performed at low-flow conditions, i.e., 1.8–3.6 m3/s, when the Storelva river had very clear and shallow water, and the DEM and orthophoto were generated with the commercial software Agisoft Photoscan. An orthogonal inspection at different cross-sections of the different surveyed datasets overlapped helped to identify the dataset with the lowest water level (i.e., 10 October 2020, when the water level was <7 cm and a large gravel bar was exposed in the downstream pool). At very similar hydrological conditions, on a posterior field survey (i.e., 6 November 2020), water levels and water edge points were measured on both banks (Figure 8, orange dots). In the central part of the sediment pool, most accessible for wading, river bed elevation was measured along the cross-section where a water level sensor operating since 28 July 2020 is located (green triangle in Figure 8). The DEM and orthophotos had resolutions of 0.015 m and 0.007 m, respectively. Additionally, the Norwegian Mapping Authority surveyed with red LiDAR a 1.8 km-long reach of the Storelva river by the end of summer 2020, producing a DEM of 0.25 m resolution.
During the same field survey when water edge points were measured with a Leica Viva RTK GPS receiver and a posterior field survey carried out few weeks later (i.e., 25 November 2020; not shown), the discharge in the river was measured using an ADCP (Acoustic Doppler Current Profiler) Sontek M9 River Surveyor (cf. [34]) by the sediment pool (Figure 8b), which provided a final measurement of 2.1 m3/s with an error relative to the mean of 0.02%. The water level that day was 0.27 m, indicating that the channel was sufficiently dry on 10 October 2020, and that the DEM obtained that day is suitable for future analyses in the new channel. The ADCP measured a discharge of 3.63 m3/s in the subsequent field survey on 25 November 2020. Water edge points were also measured in this latter survey (not shown). Additionally, a pressure transducer (HOBO RX2100 Station) installed on the left bank by the lowermost pool in the river (61.8059° N, 6.52411° E; Figure 8a) provides real-time water levels at 15 min intervals. The water levels measured manually with the RTK GPS can serve as validation for those provided by the pressure transducer on the days of the surveys. Additionally, a backup pressure transducer has been installed recently by the dam crest in the upper boundary of the studied area (Figure 5, in purple). The information provided by the more downstream transducer can then be validated with that measured more upstream. Preliminary attempts of the authors of this study have gauged with salt dilution Tracer System TQ-S Sommer Messtechnik (cf. [35,36]) by bridge (d) (Figure 8c). Additionally, ongoing efforts are being made to monitor the reach visually in an automatized manner and extract water edges with GIS and image processing techniques. To do so, surveillance cameras have been installed in the study area.

5. Conclusions

An extreme flood event affecting an ungauged, small steep river has been documented to learn from its causes and consequences, as well as to have a dataset ready to (i) test numerical prediction tools and (ii) back calculate hydraulic and hydrological characteristics of the flood event. The flash flood affecting the Storelva river in Utvik (western Norway) during 2017 was mainly caused by a very intense rainfall that followed very warm weather during the early morning of a summer day. The rainfall exceeded the 200-year return period and caused several rock falls, landslides and the debris flood herein documented. The effect of the rainfall was enhanced by the steep longitudinal slope of the Storelva river and the very loose Quaternary material its valley is composed of. The flash flood was characterized by sufficient energy to erode and transport significant amounts of sediment (as indicated by the visual characteristics of the flow and the post-event documentation). The erosion was such that the original river migrated into a new channel and washed away several bridges, the main regional road and a mini hydropower plant. The valley was wide enough to allow multiple preferential flow paths and damage to most of the urban area in the village (i.e., the channel widened 10 times its original width). The village was isolated by land due to the devastating event and its inhabitants needed to be evacuated during the flood. The visual documentation and testimonies of the eyewitnesses, however, have contributed to a better understanding of the potential characteristics of a flash flood in an ephemeral mountain river in a Nordic region. The 2017 flash flood seemed to have characteristics of Mediterranean rivers.
All the data needed to build, calibrate and validate a numerical model of the study case described herein (i.e., flood hydrograph, DEMs, orthophotos, shapefiles of catchment, roads, buildings, dam weir crest, bridges dimensions, maximum observed wetted and dry areas, critical points and preferential flow paths), are provided in the publicly available Zenodo dataset.

Author Contributions

Conceptualization: A.M., M.P., O.B. and N.R.; methodology, validation and formal analysis: A.M. and M.P.; investigation and resources: A.M., M.P. and O.B.; writing—original draft preparation: A.M. and M.P.; writing—review and editing: A.M., M.P., O.B. and N.R.; visualization: A.M. and M.P.; supervision: O.B. and N.R.; project administration and funding acquisition: O.B. All authors have read and agreed to the published version of the manuscript.

Funding

This publication is part of the World of Wild Waters (WoWW) project, which falls under the umbrella of Norwegian University of Science and Technology (NTNU)’s Digital Transformation initiative.

Data Availability Statement

All the data reported in this study are openly available in Zenodo at DOI:10.5281/zenodo.4739024 or in the external sources referred to in the manuscript and Appendix A.

Acknowledgments

K. Alfredsen (NTNU) is acknowledged for his help with field work and post-processing in Agisoft Photoscan. We thank two anonymous reviewers for their careful reading and their insightful comments and suggestions; we feel that this has resulted in a stronger manuscript.

Conflicts of Interest

The authors declare no conflict of interest. The funders had no role in the design of the study; in the collection, analyses, or interpretation of data; in the writing of the manuscript, or in the decision to publish the results.

Appendix A

Table A1. Selected multimedia coverage of the flash flood event on 24 July 2017 in Norway. The flood was covered during, immediately after and reminisced a year later.
Source NameCoverageDateAccess Link
ABC NyheterNational24 July 2017https://www.abcnyheter.no/nyheter/verden/2017/07/24/195319157/store-flom-odeleggelser-pa-vestlandet (accessed on 28 June 2019).
AftenpostenNational24 July 2017https://www.aftenposten.no/norge/i/KVRV6/regnvaer-skaper-problemer-flere-steder-i-landet (accessed on 18 November 2018).
25 July 2017https://www.aftenposten.no/norge/i/7rwM3/utvik-kan-vaere-begynnelsen-paa-ny-flomfare (accessed on 30 January 2019).
https://www.aftenposten.no/norge/i/7rwyK/nve-prognosene-i-utvik-er-gode (accessed on 30 January 2019).
https://www.aftenposten.no/norge/i/oqQOg/professor-i-hele-fjor-advarte-jeg-om-flomfare (accessed on 24 July 2019).
https://www.aftenposten.no/norge/i/WV15L/han-serverer-mat-til-flomrammede-hele-bygda-staar-sammen-og-hjelper (accessed on 12 January 2021).
NRKNational24 July 2017https://www.nrk.no/video/heli-flom-utvik-240717w_a9e1378c-3e13-4595-a137-8c3e132595e6 (accessed on 18 November 2018).
24 July 2018https://www.nrk.no/vestland/eitt-ar-sidan-flaum-utvik-1.14102263 (accessed on 12 January 2021).
VGNational24 July 2017https://www.vg.no/nyheter/innenriks/i/LVG6V/flere-bygninger-flyttet-av-flommen-i-utvik-dette-er-forferdelig (accessed on 18 November 2018).
https://www.vg.no/nyheter/innenriks/i/dV8vB/store-flom-oedeleggelser-paa-vestlandet (accessed on 18 November 2018).
25 July 2017https://www.vg.no/nyheter/innenriks/i/RVwpx/flommen-i-utvik-vann-ekspert-varslet-om-flomfare (accessed on 18 November 2018).
https://www.vg.no/nyheter/innenriks/i/7rgeB/kaotiske-tilstander-paa-vestlandet-etter-massive-nedboersmengder (accessed on 24 July 2019).
https://www.vg.no/nyheter/innenriks/i/GVbeQ/per-inge-verlos-58-hus-sto-midt-i-flommen-helt-ufattelig (accessed on 12 January 2021).
https://www.vg.no/nyheter/innenriks/i/zqyjq/frakter-reserve-bro-til-utvik-haaper-veien-kan-aapnes-igjen-torsdag (accessed on 12 January 2021).
FirdaRegional24 July 2017https://www.firda.no/bildeseriar/flaum/utvik/sja-fleire-bilde-fra-flaumen-i-utvik/g/5-15-433413 (accessed on 12 January 2021).
FjordabladetRegional27 July 2017https://www.fjordabladet.no/nyhende/2017/07/27/Fv.-60-Byrkjelo-%E2%80%93-Stryn-stengd-ved-Utvik-15072013.ece (accessed on 12 January 2021).
SunnmørspostenRegional24 July 2017https://www.smp.no/nyheter/2017/07/24/Rundt-20-personer-har-ikke-f%C3%A5tt-avklart-bosituasjon-i-Utvik-15062146.ece (accessed on 12 January 2021).

References

  1. Blöschl, G.; Kiss, A.; Viglione, A.; Barriendos, M.; Böhm, O.; Brázdil, R.; Coeur, D.; Demarée, G.; Llasat, M.C.; Macdonald, N.; et al. Current European flood-rich period exceptional compared with past 500 years. Nature 2020, 583, 560–566. [Google Scholar] [CrossRef] [PubMed]
  2. Paprotny, D.; Sebastian, A.; Morales-Nápoles, O.; Jonkman, S.N. Trends in flood losses in Europe over the past 150 years. Nat. Commun. 2018, 9, 1985. [Google Scholar] [CrossRef] [PubMed]
  3. Scorpio, V.; Crema, S.; Marra, F.; Righini, M.; Ciccarese, G.; Borga, M.; Cavalli, M.; Corsini, A.; Marchi, L.; Surian, N.; et al. Basin-scale analysis of the geomorphic effectiveness of flash floods: A study in the northern Apennines (Italy). Sci. Total Environ. 2018, 640–641, 337–351. [Google Scholar] [CrossRef] [PubMed]
  4. Ruiz-Villanueva, V.; Badoux, A.; Rickenmann, D.; Böckli, M.; Schläfli, S.; Steeb, N.; Stoffel, M.; Rickli, C. Impacts of a large flood along a mountain river basin: The importance of channel widening and estimating the large wood budget in the upper Emme River (Switzerland). Earth Surf. Dyn. 2018, 6, 1115–1137. [Google Scholar] [CrossRef] [Green Version]
  5. Hooke, J.M. Variations in flood magnitude-effect relations and the implications for flood risk assessment and river management. Geomorphology 2015, 251, 91–107. [Google Scholar] [CrossRef]
  6. Grove, J.R.; Croke, J.; Thompson, C. Quantifying different riverbank erosion processes during an extreme flood event. Earth Surf. Process. Landforms 2013, 38, 1393–1406. [Google Scholar] [CrossRef]
  7. Brenna, A.; Surian, N.; Ghinassi, M.; Marchi, L. Sediment–water flows in mountain streams: Recognition and classification based on field evidence. Geomorphology 2020, 371. [Google Scholar] [CrossRef]
  8. Bruland, O. How extreme can unit discharge become in steep Norwegian catchments? Hydrol. Res. 2020, 51, 290–307. [Google Scholar] [CrossRef]
  9. Leine, A.-L.Ø. Flomberegning for Storelva i Utvik (087.4Z) (Flood Estimates for Storelva in Utvik (087.4Z); 94/2017; Norwegian Water and Energy Directorate: Oslo, Norway, 2017; p. 20. [Google Scholar]
  10. Norwegian Water and Energy Directorate (NVE). NEVINA Nedbørfelt-Vannføring-INdeks-Analyse (NEVINA Catchment area-Water Flow-Index-Analysis). Available online: http://nevina.nve.no/ (accessed on 26 March 2019).
  11. Comiti, F.; Mao, L. Recent Advances in the Dynamics of Steep Channels. In Gravel Bed Rivers: Processes, Tools, Environments; Church, M., Biron, P., Roy, A., Eds.; Wiley-Blackwell: Chichester, UK; Hoboken, NJ, USA, 2012; pp. 353–377. ISBN 978-1-119-95425-5. [Google Scholar]
  12. Norwegian Mapping Authority (Høydedata). Digital Elevation Model (DEM) Stryn, Resolution 0.5 m. Available online: https://hoydedata.no/LaserInnsyn/ (accessed on 18 November 2018).
  13. Rønningen, E.S.S. Utløsende Årsaker til Løsmasseskred i Utvik og Stordalen 24 Juli 2017 (Triggering Causes of Landslides in Utvik and Stordalen on 24 July 2017); Norwegian University of Science and Technology: Trondheim, Norway, 2018; p. 78. [Google Scholar]
  14. Norwegian Water and Energy Directorate (NVE). Norwegian National Landslides Database (Online). Available online: https://temakart.nve.no/tema/SkredHendelser (accessed on 8 February 2021).
  15. Norwegian Mapping Authority (Kartverket). Orthophotographs Sogn, Pixel Size 0.25 m (Online). Available online: https://norgeibilder.no/ (accessed on 8 February 2021).
  16. Norwegian Mapping Authority (Kartverket). Orthophotographs Flaum Storelva Utvik, Pixel Size 0.1 m (Online). Available online: https://norgeibilder.no/ (accessed on 8 February 2021).
  17. Hanssen-Bauer, I.; Førland, E.J.; Haddeland, I.; Hisdal, H.; Lawrence, D.; Mayer, S.; Nesje, A.; Sandven, S.; Sandø, A.B.; Sorteberg, A. Climate in Norway 2100—A Knowledge Base for Climate Adaptation; 1/2017; Norwegian Environmental Agency: Oslo, Norway, 2017; p. 47. [Google Scholar]
  18. Knighton, A.D. Downstream variation in stream power. Geomorphology 1999, 29, 293–306. [Google Scholar] [CrossRef]
  19. Moraru, A. Streambank Erosion and Channel Widening: Implications for Flood Hazard; University of Barcelona-Autonomous University of Barcelona: Barcelona, Spain, 2017; p. 25. [Google Scholar]
  20. Magilligan, F.J. Thresholds and the spatial variability of flood power during extreme floods. Geomorphology 1992, 5, 373–390. [Google Scholar] [CrossRef]
  21. Ruiz-Villanueva, V.; Bürkli, L.; Mazzorana, B.; Mao, L.; Ravazzolo, D.; Iribarren, P.; Wohl, E.; Nakamura, F.; Stoffel, M. Defining and characterizing wood-laden flows in rivers using home videos. In Proceedings of the 9th International Conference on Fluvial Hydraulics (River Flow 2018), Lyon, France, 5–8 September 2018; Paquier, A., Rivière, N., Eds.; E3S Web of Conferences: Lyon-Villeurbanne, France, 2018; Volume 40, pp. 1–5. [Google Scholar]
  22. Moraru, A.; Rüther, N.; Bruland, O. Current trends in the optimization of hydraulic flood simulations in ungauged steep rivers. In Proceedings of the 10th International Conference on Fluvial Hydraulics (River Flow 2020), Online, 6–10 July 2020; Uijttewaal, W., Franca, M., Valero, D., Chavarrias, V., Ylla Arbos, C., Schielen, R., Crosato, A., Eds.; Taylor & Francis Group: Delft, The Netherlands, 2020; pp. 1231–1238. [Google Scholar]
  23. Geological Survey of Norway (NGU). Superficial Deposits-National Database (Online). Available online: http://geo.ngu.no/kart/losmasse_mobil/ (accessed on 16 September 2020).
  24. Norwegian Mapping Authority (Høydedata). Digital Elevation Model (DEM) NVE Laser Flaum Utvik i Stryn, Resolution 0.25 m. Available online: https://hoydedata.no/LaserInnsyn/ (accessed on 29 March 2019).
  25. Norwegian Water and Energy Directorate (NVE). Norwegian Hydrologic Database: Built and Non-Built Hydropower Plants. Available online: https://atlas.nve.no/ (accessed on 8 February 2021).
  26. Norwegian Water and Energy Directorate (NVE). Norwegian National Flood Viewer-Map of 10 to 1000 Years Return Period Flood Events. Available online: https://temakart.nve.no/link/?link=flomsone (accessed on 4 June 2021).
  27. Bales, J.D.; Wagner, C.R. Sources of uncertainty in flood inundation maps. J. Flood Risk Manag. 2009, 2, 139–147. [Google Scholar] [CrossRef]
  28. Dam, G. Simulating the Flooding in Utvik on 24 July 2017 Using a High-Resolution 2D Hydro- and Morphological Model.; Dam Engineering: Bergen, Norway, 2018; p. 38. [Google Scholar]
  29. Smart, G. LiDAR resolution for catchment-inclusive hydrodynamic models. In Proceedings of the 9th International Conference on Fluvial Hydraulics (River Flow 2018), Lyon, France, 5–8 September 2018; Paquier, A., Rivière, N., Eds.; E3S Web of Conferences: Lyon-Villeurbanne, France, 2018; Volume 40, p. 06031. [Google Scholar]
  30. Choné, G.; Biron, P.M.; Buffin-Bélanger, T. Flood hazard mapping techniques with LiDAR in the absence of river bathymetry data. In Proceedings of the 9th International Conference on Fluvial Hydraulics (River Flow 2018), Lyon, France, 5–8 September 2018; Paquier, A., Rivière, N., Eds.; E3S Web of Conferences: Lyon-Villeurbanne, France, 2018; Volume 40, p. 06005. [Google Scholar]
  31. Ejigu, D.K. Vannlinjeberegning for Storelva i Utvik i Stryn Kommune (Waterline Calculation for Storelva in Utvik in Stryn Municipality; 8/2020; Norwegian Water and Energy Directorate: Oslo, Norway, 2020. [Google Scholar]
  32. Norwegian Mapping Authority (Kartverket). Orthophotographs Stryn Mellombels, Pixel Size 0.1 m (Online). Available online: https://norgeibilder.no/ (accessed on 8 February 2021).
  33. Tonina, D.; McKean, J.A.; Benjankar, R.M.; Wright, C.W.; Goode, J.R.; Chen, Q.; Reeder, W.J.; Carmichael, R.A.; Edmondson, M.R. Mapping river bathymetries: Evaluating topobathymetric LiDAR survey. Earth Surf. Process. Landf. 2019, 44, 507–520. [Google Scholar] [CrossRef]
  34. Foerst, M.; Rüther, N. Bank retreat and streambank morphology of a meandering river during summer and single flood events in northern Norway. Hydrology 2018, 5, 68. [Google Scholar] [CrossRef] [Green Version]
  35. Hauet, A.C. Uncertainty of Salt Discharge Measurement: The SUNY Framework; 29/2020; Norwegian Water and Energy Directorate: Oslo, Norway, 2020; p. 23. [Google Scholar]
  36. Hauet, A.C. SUNY User Manual; 24/2020; Norwegian Water and Energy Directorate: Oslo, Norway, 2020; p. 10. [Google Scholar]
Figure 1. (a) Context map and catchment area [10] imposed over the hillshade of the hydrologic network of the Storelva river in Utvik (western Norway) [12], (b) aerial view of the area of interest before [16] and (c) during the flood (VG/H. Vågenes). Labels in (d) mark the bridges; original river thalwegs in blue lines; preferential flow zone during the flood marked by red dashed line.
Water 13 01688 g001
Figure 2. Schematic workflow followed. From left to right and top to bottom: (left) hydrologic study [8] provided the hydrograph for the 2017 flash flood, which was used together with visual documentation and testimonies (center) to assess the flood area at Qpeak; (right) the topographic difference and orthophotos contributed to identifying critical points and preferential flow paths during the flood, which were later refined using the aforementioned flood documentation. The combination of the flood area at Qpeak, critical points and preferential flow paths resulted in the estimated maximum flooded area during the whole event (bottom).
Water 13 01688 g002
Figure 3. Discharge range proposed by Bruland [8] (gray area), with Q (black line) having the highest expectancy, and discharge range proposed by Leine [9] (blue area) for the 2017 flash flood. Red lines mark annual average Qmean (Qm) and discharge for a return period of 200 years (Q200) in the Storelva river [9].
Water 13 01688 g003
Figure 4. Examples of visual documentation of the flash flood in the Storelva river in Utvik on 24 July 2017 ((ag), photographed by O. Bruland after Qpeak), sorted temporally and referenced in the hydrograph with highest expectancy (h) from [8]. Flow direction indicated by white arrows.
Water 13 01688 g004
Figure 5. Assessment of the flooded area at Qpeak (orange dashed polygon) using visual documentation of the event (e.g., pink dashed marks in subfigures). Photographs, sorted from upstream to downstream, were taken on 24 July 2017 between 7:30 a.m. and 9:00 a.m. (i.e., near Qpeak) by O. Bruland. Flow direction marked by white arrows. Dam crest and Utvik I mini-HPP in purple. Orthophoto from [16].
Water 13 01688 g005
Figure 6. Flow paths and critical points on the erosion and deposition map obtained from pre- and post-flood LiDAR scans. Bridges are labeled (ad); black dashed line represents the original river channel; red circles represent the critical points; purple lines represent flow paths during flood event. Post-event orthophoto from [15].
Water 13 01688 g006
Figure 7. Maximum flooded area, i.e., wetted area in blue and dry areas as gaps in the blue area, throughout the 2017 flash flood. Bridges are labeled (ad); flow paths (purple lines) as in Figure 6. Post-event orthophoto from [16].
Water 13 01688 g007
Figure 8. Flood protections and field survey in the restored the Storelva river in Utvik; (a) pressure transducer installed by the pool, (b) cross-section for discharge measurement with ADCP, (c) reconstructed bridge. Orthophoto in ETRS89, UTM33 [32]. Field photos taken by A. Moraru.
Water 13 01688 g008
Publisher’s Note: MDPI stays neutral with regard to jurisdictional claims in published maps and institutional affiliations.

