Article

Aquifer Depletion in the Arlit Mining Area (Tim Mersoï Basin, North Niger)

1
Laboratoire de Génie Civil, Géosciences et Sciences Géographiques (UMRI 68), Institut National Polytechnique Houphouët-Boigny (INPH-B), Yamoussoukro BP 1093, Côte d’Ivoire
2
Laboratoire des Eaux Souterraines et Géo-Ressources, Département de Géologie, Faculté des Sciences, Université Abdou Moumouni (UAM), BP 10 662, Niamey 8000, Niger
3
NASA Goddard Space Flight Center, Hydrological Sciences Laboratory, Code 617, Greenbelt, MD 20771, USA
4
Universities Space Research Association, Goddard Earth Sciences Technology and Research Studies and Investigations, Columbia, MD 20771, USA
*
Author to whom correspondence should be addressed.
Water 2021, 13(12), 1685; https://doi.org/10.3390/w13121685
Submission received: 18 May 2021 / Revised: 9 June 2021 / Accepted: 13 June 2021 / Published: 18 June 2021
(This article belongs to the Special Issue Human Impact on Water Resources)

Abstract

:
Located in northwestern Niger, the Tim Mersoï Basin (TMB) is an important mining region in the scale of West Africa. Groundwater is considered the main source of fresh water in the basin, especially for mining activities. It, therefore, appears essential to monitor their responses to these activities. However, no study has been carried out in the Tim Mersoï Basin. This study aims to evaluate the groundwater storage changes (GWSC) of the TMB and to analyze the spatio-temporal evolution of the Tarat aquifer under the effect of mining activities in the Arlit region. For this purpose, Gravity Recovery And Climate Experiment (GRACE), Global Land Data Assimilation System (GLDAS), and in-situ data were used. The results show a variation of the GWS from 2002 to 2019 of about −0.1310 cm/year on the scale of the basin and −0.0109 cm/year in the Arlit mining area. The GWSC at the basin scale and the one at the Arlit region scale were shown to be linked with an RMSE between the two datasets of 0.79. This shows the potential of GRACE for contextualizing studies in small areas. The study also highlighted that the groundwater flow direction was highly modified; the drawdown of the Tarat water table was more than 50 m in the areas heavily impacted by mining activities, with an increasing intensity from the northwest to the southeast of Arlit.

1. Introduction

Mining activities are an important part of the Nigerien economy. Uranium is the flagship of the country’s mining sector, which places Niger among the world’s leading uranium producers. Combined with the other activities of the secondary sector, the contribution of the mining sector to the national gross domestic product (GDP) is around 16.6% in 2020. The Tim Mersoï Basin (TMB), located in the northern part of Niger, is well known because it contains all of Niger’s known uranium mineralization. For more than 50 years, the TMB has been the ultimate mining area in Niger. Its most famous part is the Arlit region, being the longest-exploited mining region (1968–2020). In this region, as in the other arid and semi-arid regions of the world, surface water resources are highly scarce. Thus, groundwater is considered the only perennial source of fresh water and must be managed sparingly [1].
Globally, stresses on groundwater resources due to urban, agricultural, and industrial water demands have increased under continual population growth and climatic variability. Impacts of industrial and agricultural activities on groundwater resources have been widely reported [2,3,4,5,6,7,8,9,10]. Mining activities highly modify the stability of the groundwater scheme, having, therefore, an impact on the hydrology of the surrounding areas [11]. These impacts include groundwater pollution, water level drops, etc. [12,13,14,15,16].
The Tarat aquifer is the main water supply aquifer for both industrial activities and drinking-water supply in the Arlit region. Groundwater from the Tarat aquifer has been used since 1968 for industrial installations, ore treatment, mine dewatering, drinking, and agricultural water supply. However, studies carried out on the Tarat aquifer were mainly focused on determining the aquifer characteristics, including hydrodynamic and hydrogeochemical properties, aquifer geometry and extension, and groundwater recharge, but also on optimization of open pit and galleries dewatering for the mining activities needs [17,18,19,20,21,22].
Since the early 1960s, mining activities in the TMB have generated significant economic interest both nationally and internationally. Numerous mining companies have been interested in the area, and exploration and exploitation missions have been carried out. The Arlit region is the area where the first mining companies settled. Today, in this region, mining is reaching its end, and the mining companies are reducing their operations, and for some of them, closure is inevitable. It is, therefore, time to take a look at the impacts of mining activities on the aquifers of the TMB. However, the TMB is a difficult area to study. It is a difficult area to access due to its vast expanse, hostile climate, and lack of data. A good starting point would be to consider the Tarat aquifer as a pilot and test impact assessment methodologies in the context of a data-scarce area. In this context, global remote sensing data are extremely useful [23,24,25,26].
The Gravity Recovery And Climate Experiment (GRACE), was used in many recent studies in different regions of the world for analyzing changes in groundwater. This includes the USA (High Plains Aquifer, Mississippi Bbasin, Central Valley) [27,28,29], the Middle East [30,31,32], Asia [33,34,35], and Africa [36,37,38]. A study carried out by [39] shows the potential of GRACE for monitoring groundwater storage changes in a mining environment.
The present study aims to evaluate groundwater storage changes and induced aquifer depletion in the TMB and assess the magnitude of Tarat aquifer depletion at a local scale. To achieve these objectives, groundwater storage changes over the TMB were estimated by removing soil water acquired from the Global Land Data Assimilation System (GLDAS) from total water storage changes observed from GRACE. From the three types of solutions of GRACE data available, the mascon solutions were used, based on previous studies [39]. Then, in-situ data from 95 monitoring wells were used in the Arlit mining area to analyze the spatiotemporal evolution of the Tarat aquifer.

2. Materials and Methods
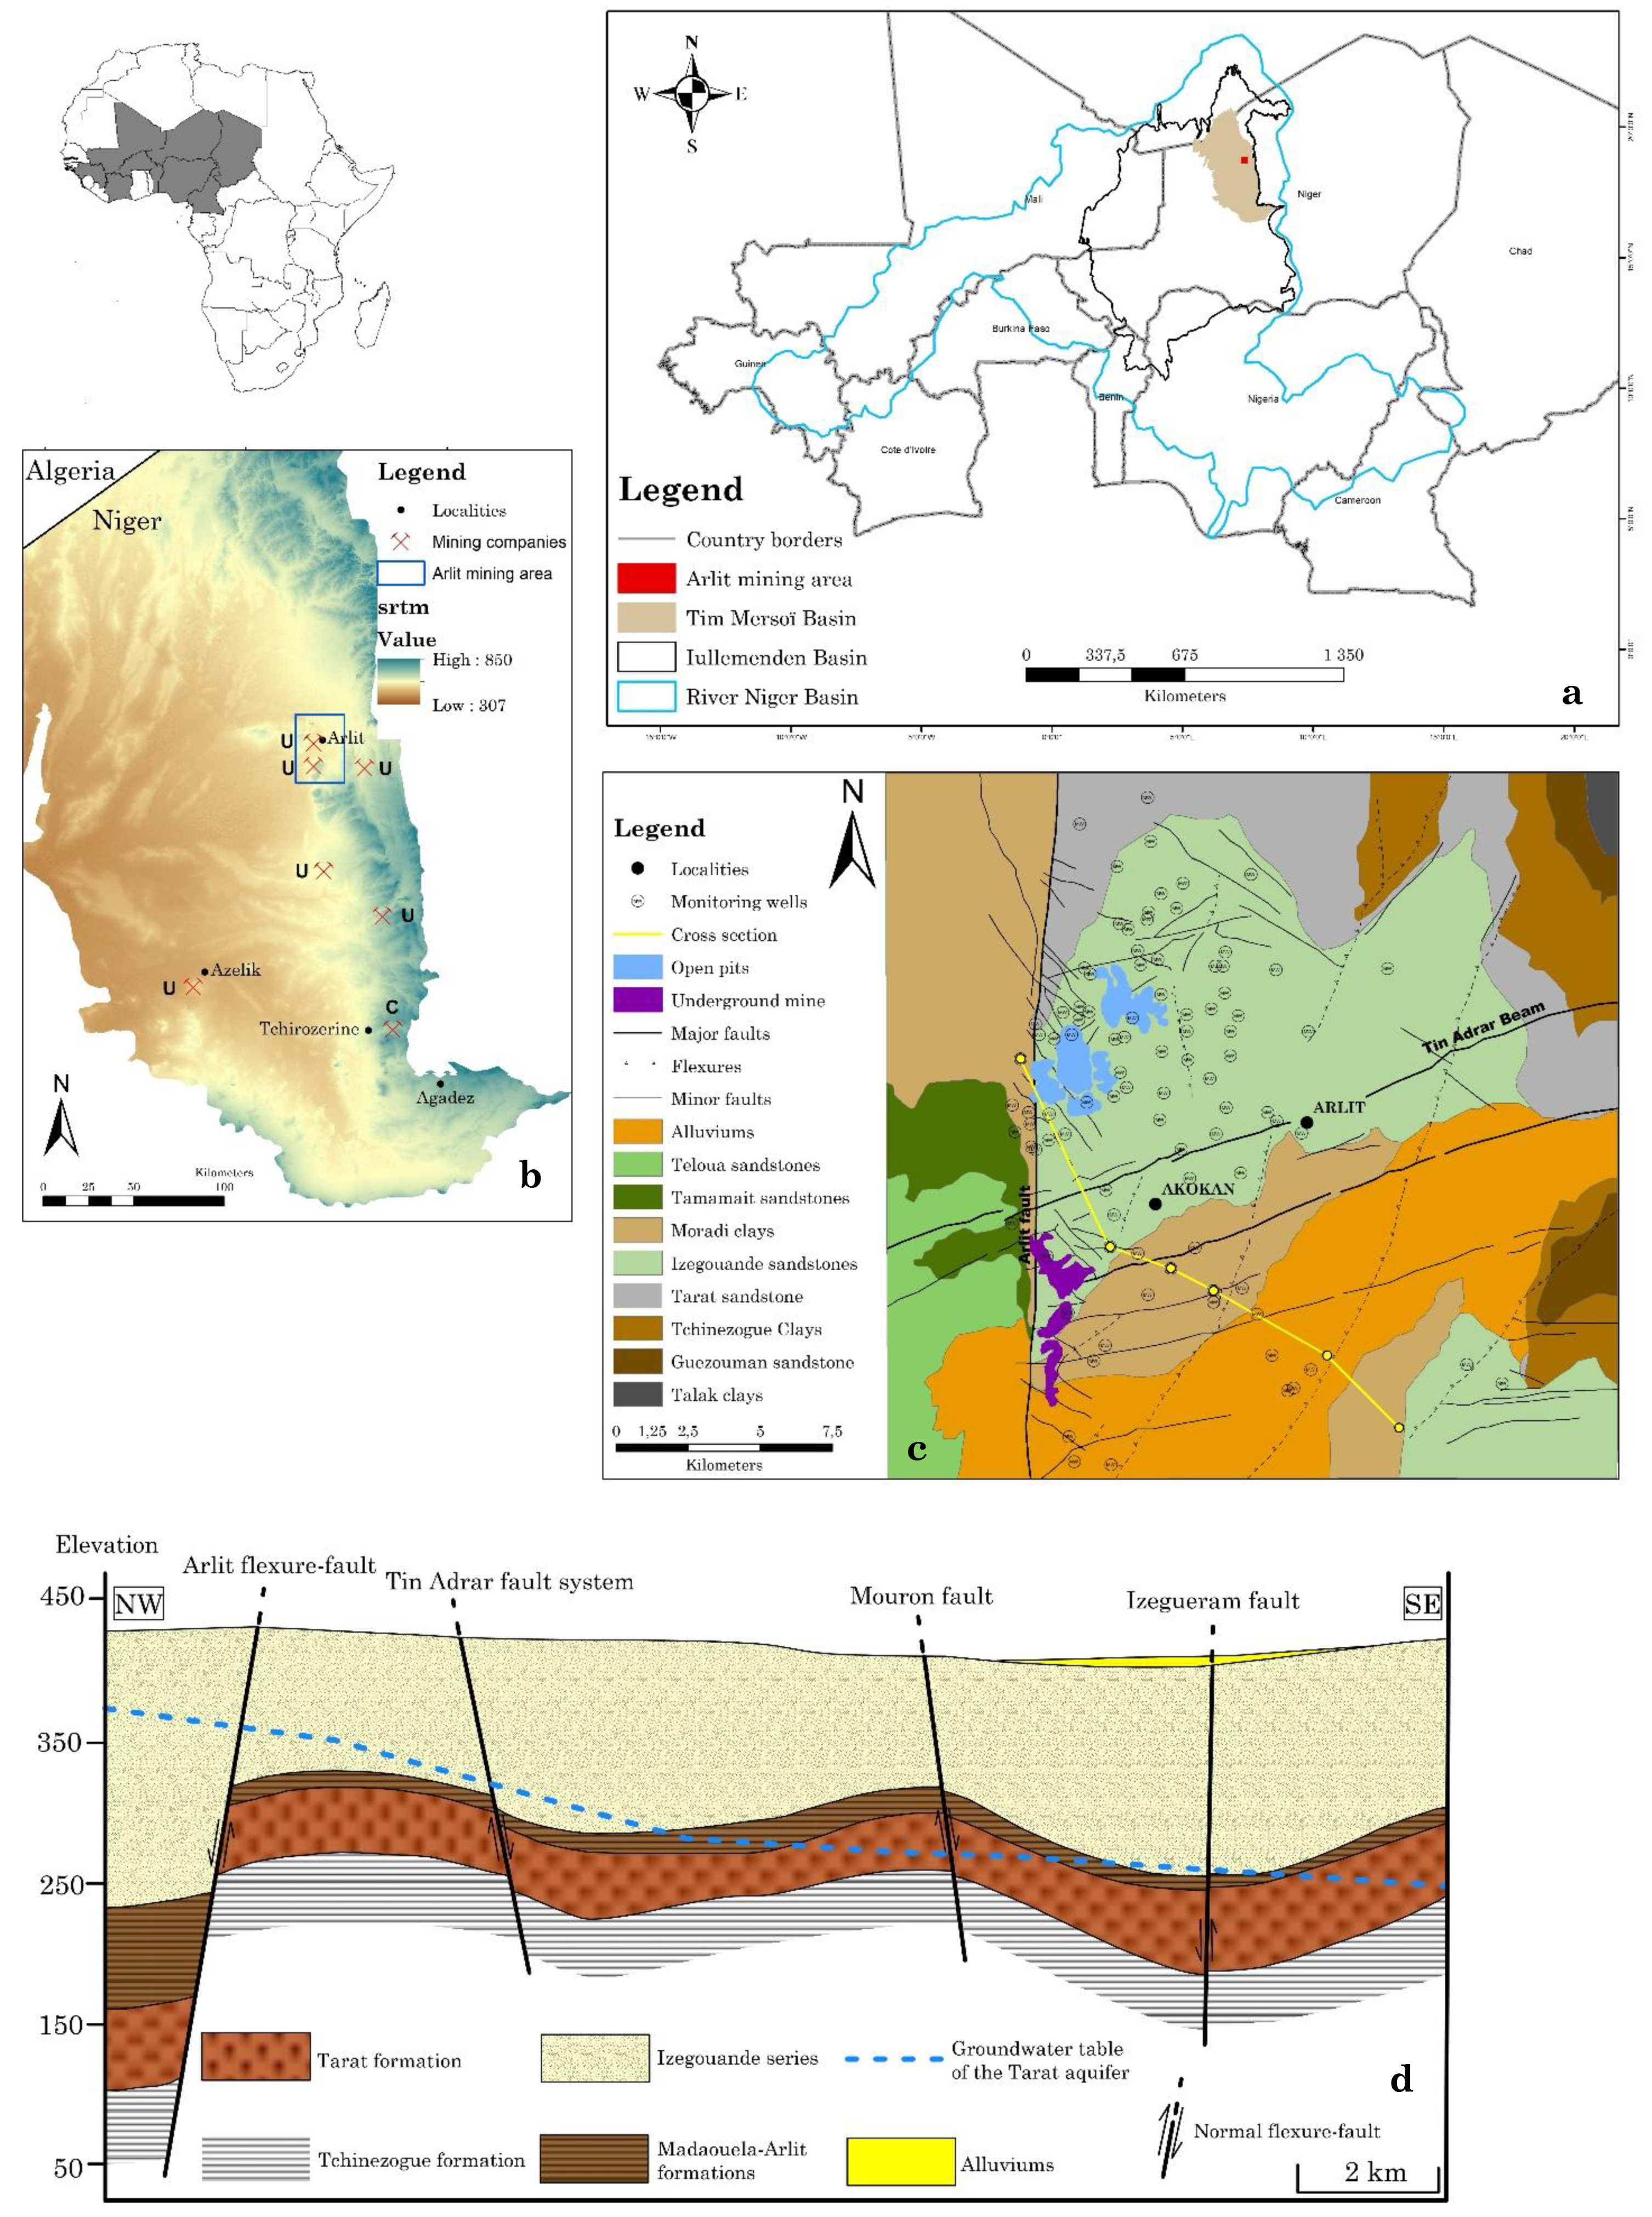
2.1. Study Area

The TMB is the northeastern extension of the Iullemenden basin (671,000 km2) and covers approximately 100,000 km2 (Figure 1). From the digital elevation model of the area, the land-surface elevation ranges from 850 m in the eastern part to less than 307 m in the central to the western part of the basin.
Based on data obtained from the National Meteorological Office of Niger from 1960 to 2019, the TMB has an arid/semi-arid continental climate with annual average temperatures ranging from 7.6 °C to 43.7 °C. In this region, the average annual precipitation is approximately 101.83 mm, decreasing from south (136.57 mm) to north (59.88 mm), and rainfall occurs mainly from July to September. The potential evapotranspiration in the basin goes up to 2650 mm/an, which is ten times greater than the annual precipitation [40].
The ephemeral streams that flow during the rainy season are the only surface water resource in the basin.
The Tarat aquifer is essentially formed of terrigenous detrital rocks ranging from coarse sandstones and even micro-conglomerates to clayey siltstones. It is a confined aquifer with an average thickness ranging between 30 and 50 m.

2.2. Datasets and Methodology

In this study, GRACE data were used with Global Land Data Assimilation System (GLDAS) and in-situ data. Our objective is to use the regional context to analyze the evolution of an aquifer at a local scale. The timeframe of the GRACE data goes from April 2002 to December 2019 on a monthly resolution, and the spatial resolution is 0.25° × 0.25°. The total water storage is equivalent to any form of water on or below the earth’s surface. The vertically integrated total water storage changes estimated by the GRACE datasets consist of changes in soil water, snow water equivalent, surface water reservoir storage, and groundwater [41] and can be expressed as:
T W S = S W R S + G W S + S W + S W E
where ∆TWS refers to the variation of the total water storage, ∆SWRS to the surface water reservoir storage variation, ∆GWS to the groundwater storage variation, ∆SW to the soil water changes, and ∆SWE to the snow water equivalent changes. In the context of our study, area (1) becomes:
T W S = G W S + S W
From (2), we compute the variation in groundwater storage as:
G W S = T W S S W

2.2.1. GRACE Data

Launched in March 2002, GRACE twin satellites are used to measure the Earth’s gravity field change and provide data to investigate changes in water resources [42]. The month-to-month changes in the Earth’s gravity field can be used to detect the vertically integrated terrestrial water storage changes according to the relationship between gravity field changes and mass changes at the Earth’s surface [35]. Note that GRACE can only deliver variations in water storage, not the total water storage itself. Besides, the lower bound on its resolution means that GRACE cannot also determine precisely where the mass change within the region is coming from. Even though the recommended area when using GRACE is 200,000 km2, studies, such as [9], showed the efficiency of GRACE-derived data in smaller catchments.
While comparing the groundwater storage changes (GWSC) results from different GRACE solutions and the in-situ GWSC, [39] showed the GWSC from mascon solutions match best with in-situ GWSC in a similar arid area. Therefore, the Release 6 (RLO6) GRACE/GRACE-FO mascon of the Jet Propulsion Laboratory (JPL/NASA) made available (http://grace.jpl.nasa.gov, accessed on 25 September 2020) data asequivalent water heights [43]. Some preprocessing was used for the mascon solutions, including replacing the second degree and 0 order coefficients, adding the first-degree coefficients, and correcting the glacial isostatic adjustments. Missing data in the time series were chosen to leave blank, so the interpolation often used in this case [44,45] will not increase the uncertainty relative to the resolution of the GRACE measurements.

2.2.2. GLDAS Data

Global Land Data Assimilation System (GLDAS) provides datasets of hydrological variables in high spatial and temporal resolution. It is considered to be a better performer than other land-surface models [39,45]. Therefore, it has been widely used for numerous previous hydrological studies [46,47,48,49].
The NOAH land surface model of GLDAS is used in our study to acquire the soil-water data. The NOAH model is separated into 4 soil layers and corresponds to a 2 m depth. Then, the soil-water data is obtained by adding the soil water values from the four layers. Due to a compliance issue, the missing months in the GRACE time series have also been eliminated in the GLDAS dataset.

2.2.3. Groundwater-Monitoring Wells in the Arlit Mining Area

Without ground data covering the TMB, it is impossible to make a comparison between GRACE data and ground measurements, which does not correspond to any of the objectives of this study. This issue has been widely discussed in the literature, and the majority of the authors find a good match between GRACE and in-situ measurements [9,31,50,51,52].
For that purpose, the monthly groundwater level data from 95 monitoring wells were obtained in the Arlit region, all located in the Tarat aquifer (Figure 1) from 1977 to 2020. The water table evolution was analyzed on the whole timeline, and the data from April 2002 to December 2019 were used for assessing the GWSC in the area. For the second analysis, the well water levels were converted into GWSC using Equation (4) [39,45]:
G W S = j N S j C j h j ÷ j N C j
where N refers to the number of subareas or zones divided in the study region; S j are the specific yield values of the unconfined aquifers; C j are the sizes of subareas; and h j refer to the mean values of the well water-level variations in each subarea. Considering the size of our area (the Arlit area) and the small variation of the hydrodynamic parameters of our aquifer in the zone, Equation (4) can be expressed as:
G W S n = S × h n
where n is the month index.

3. Results

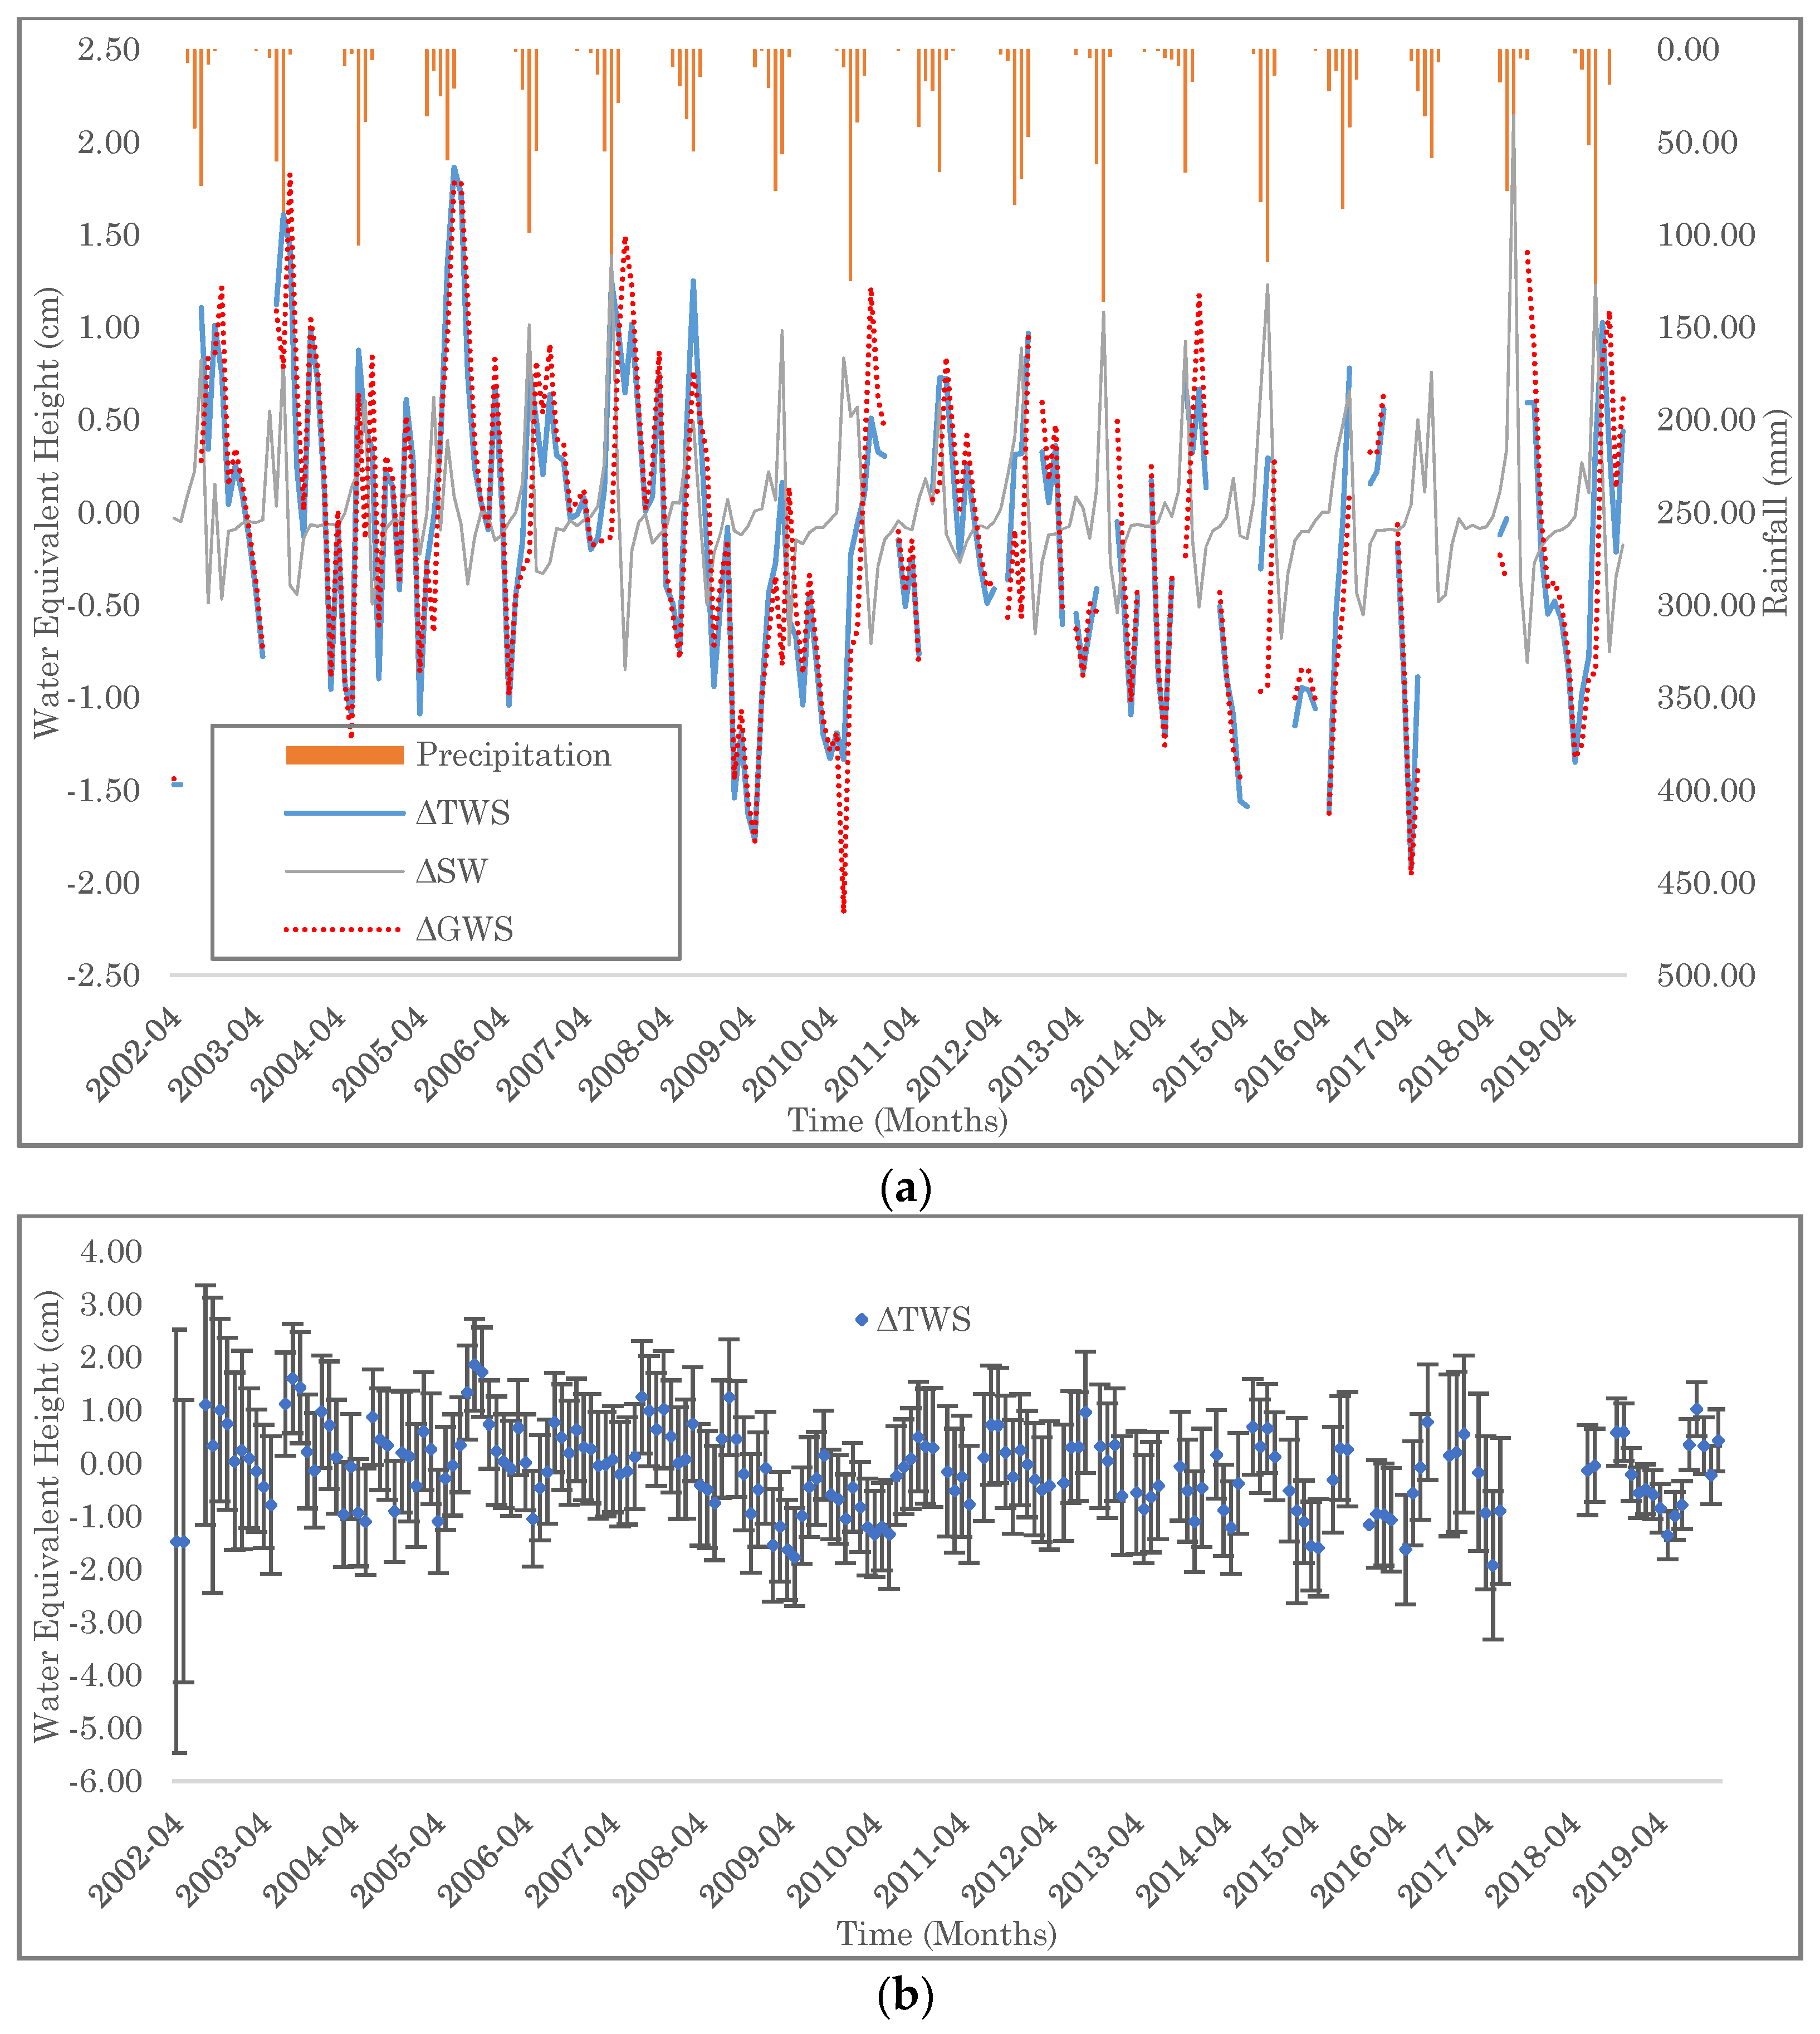
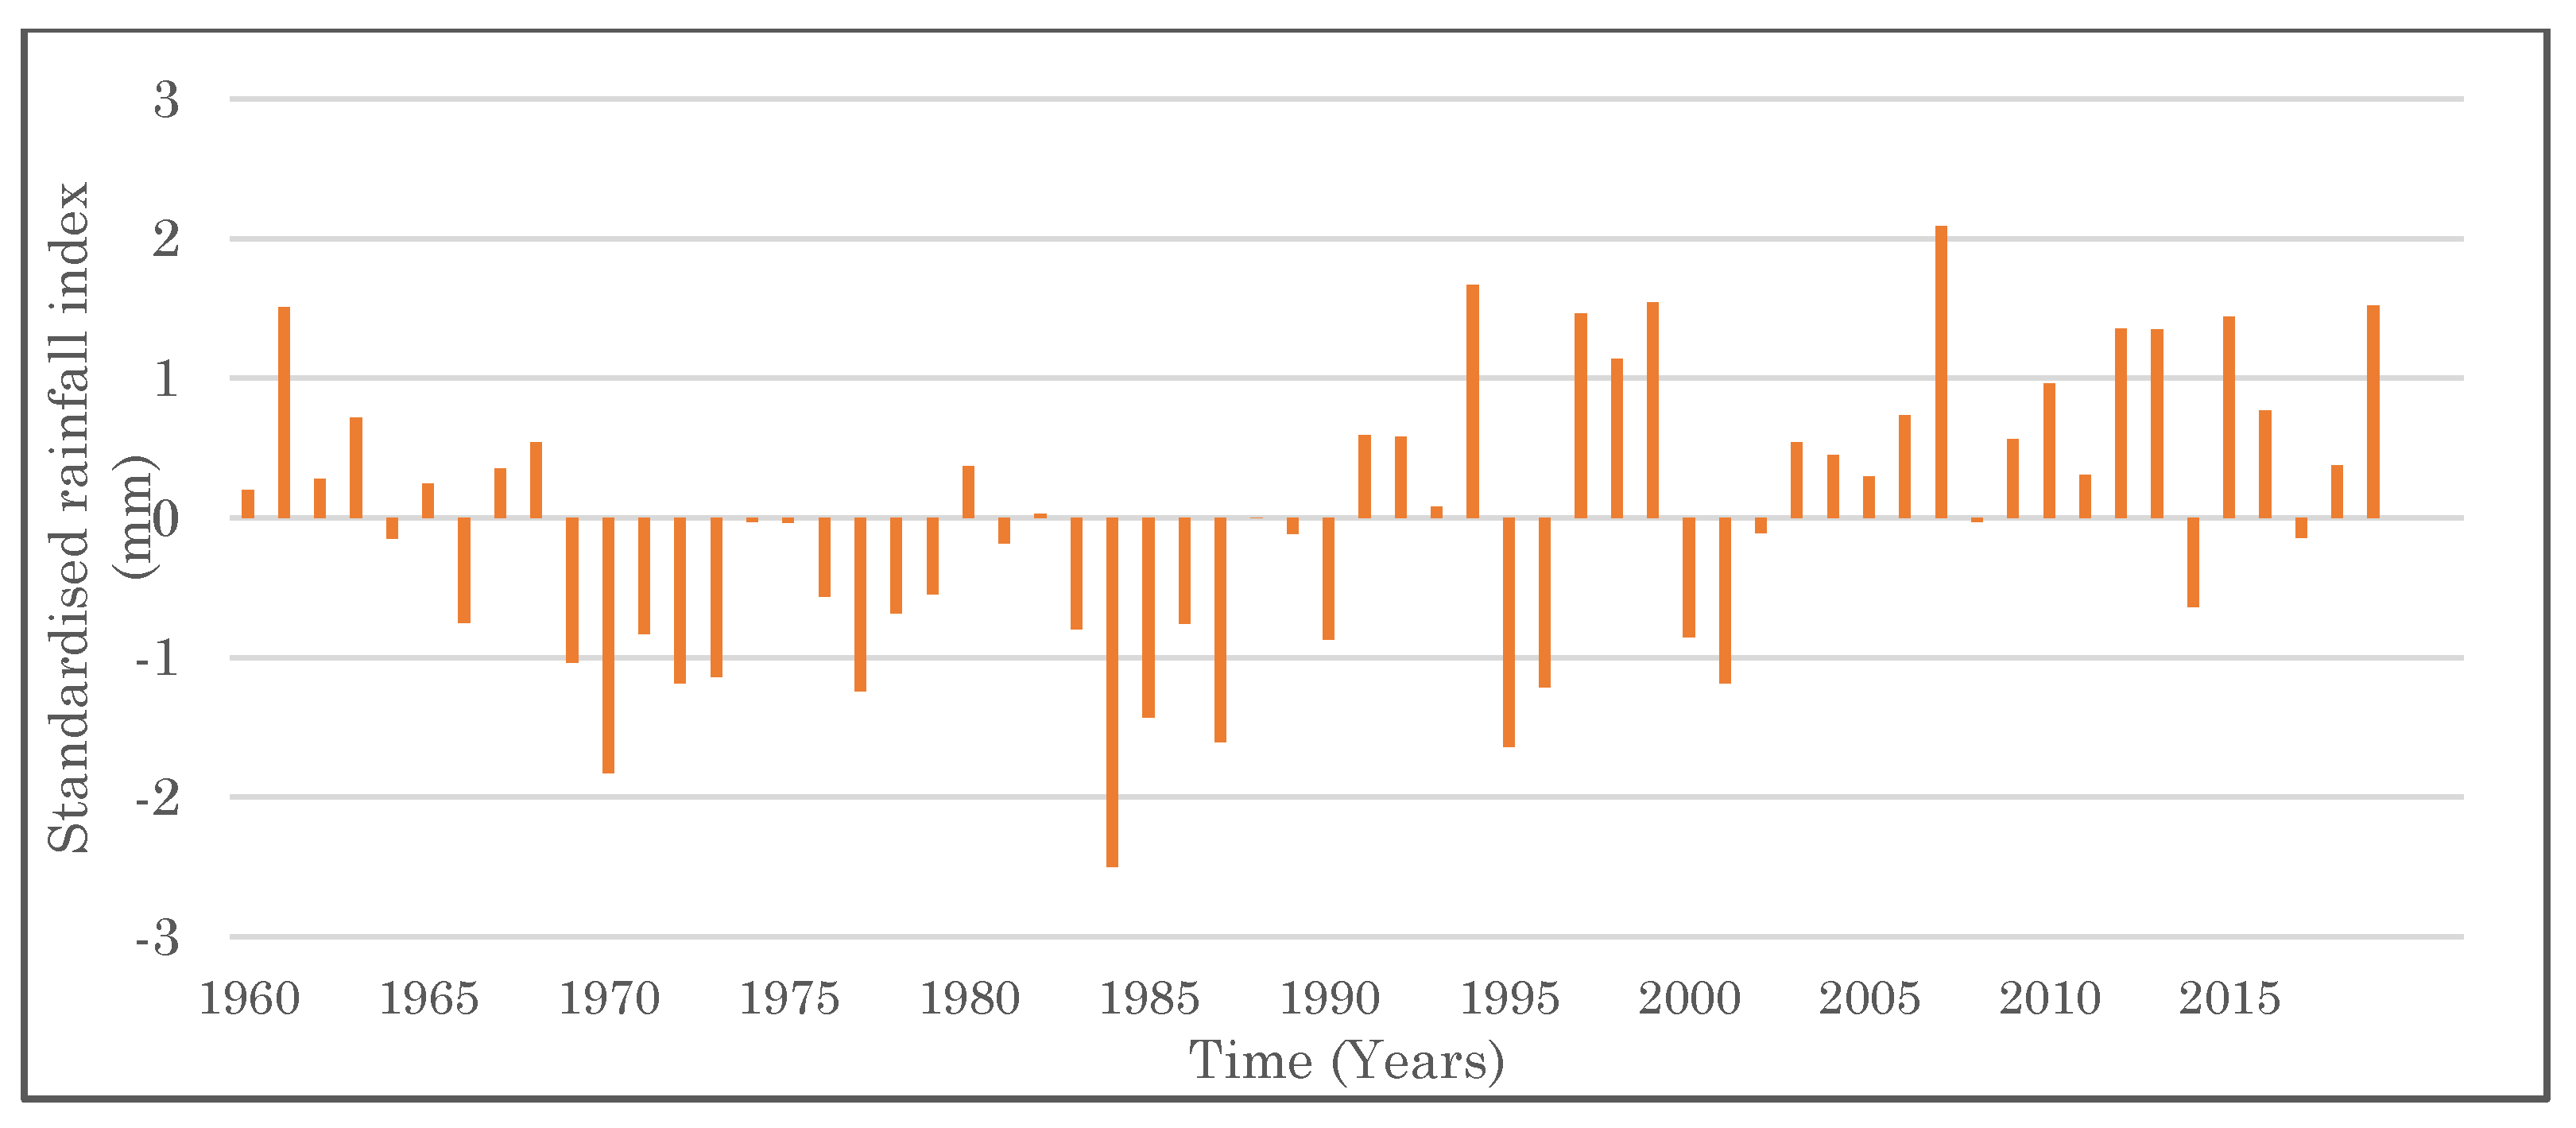
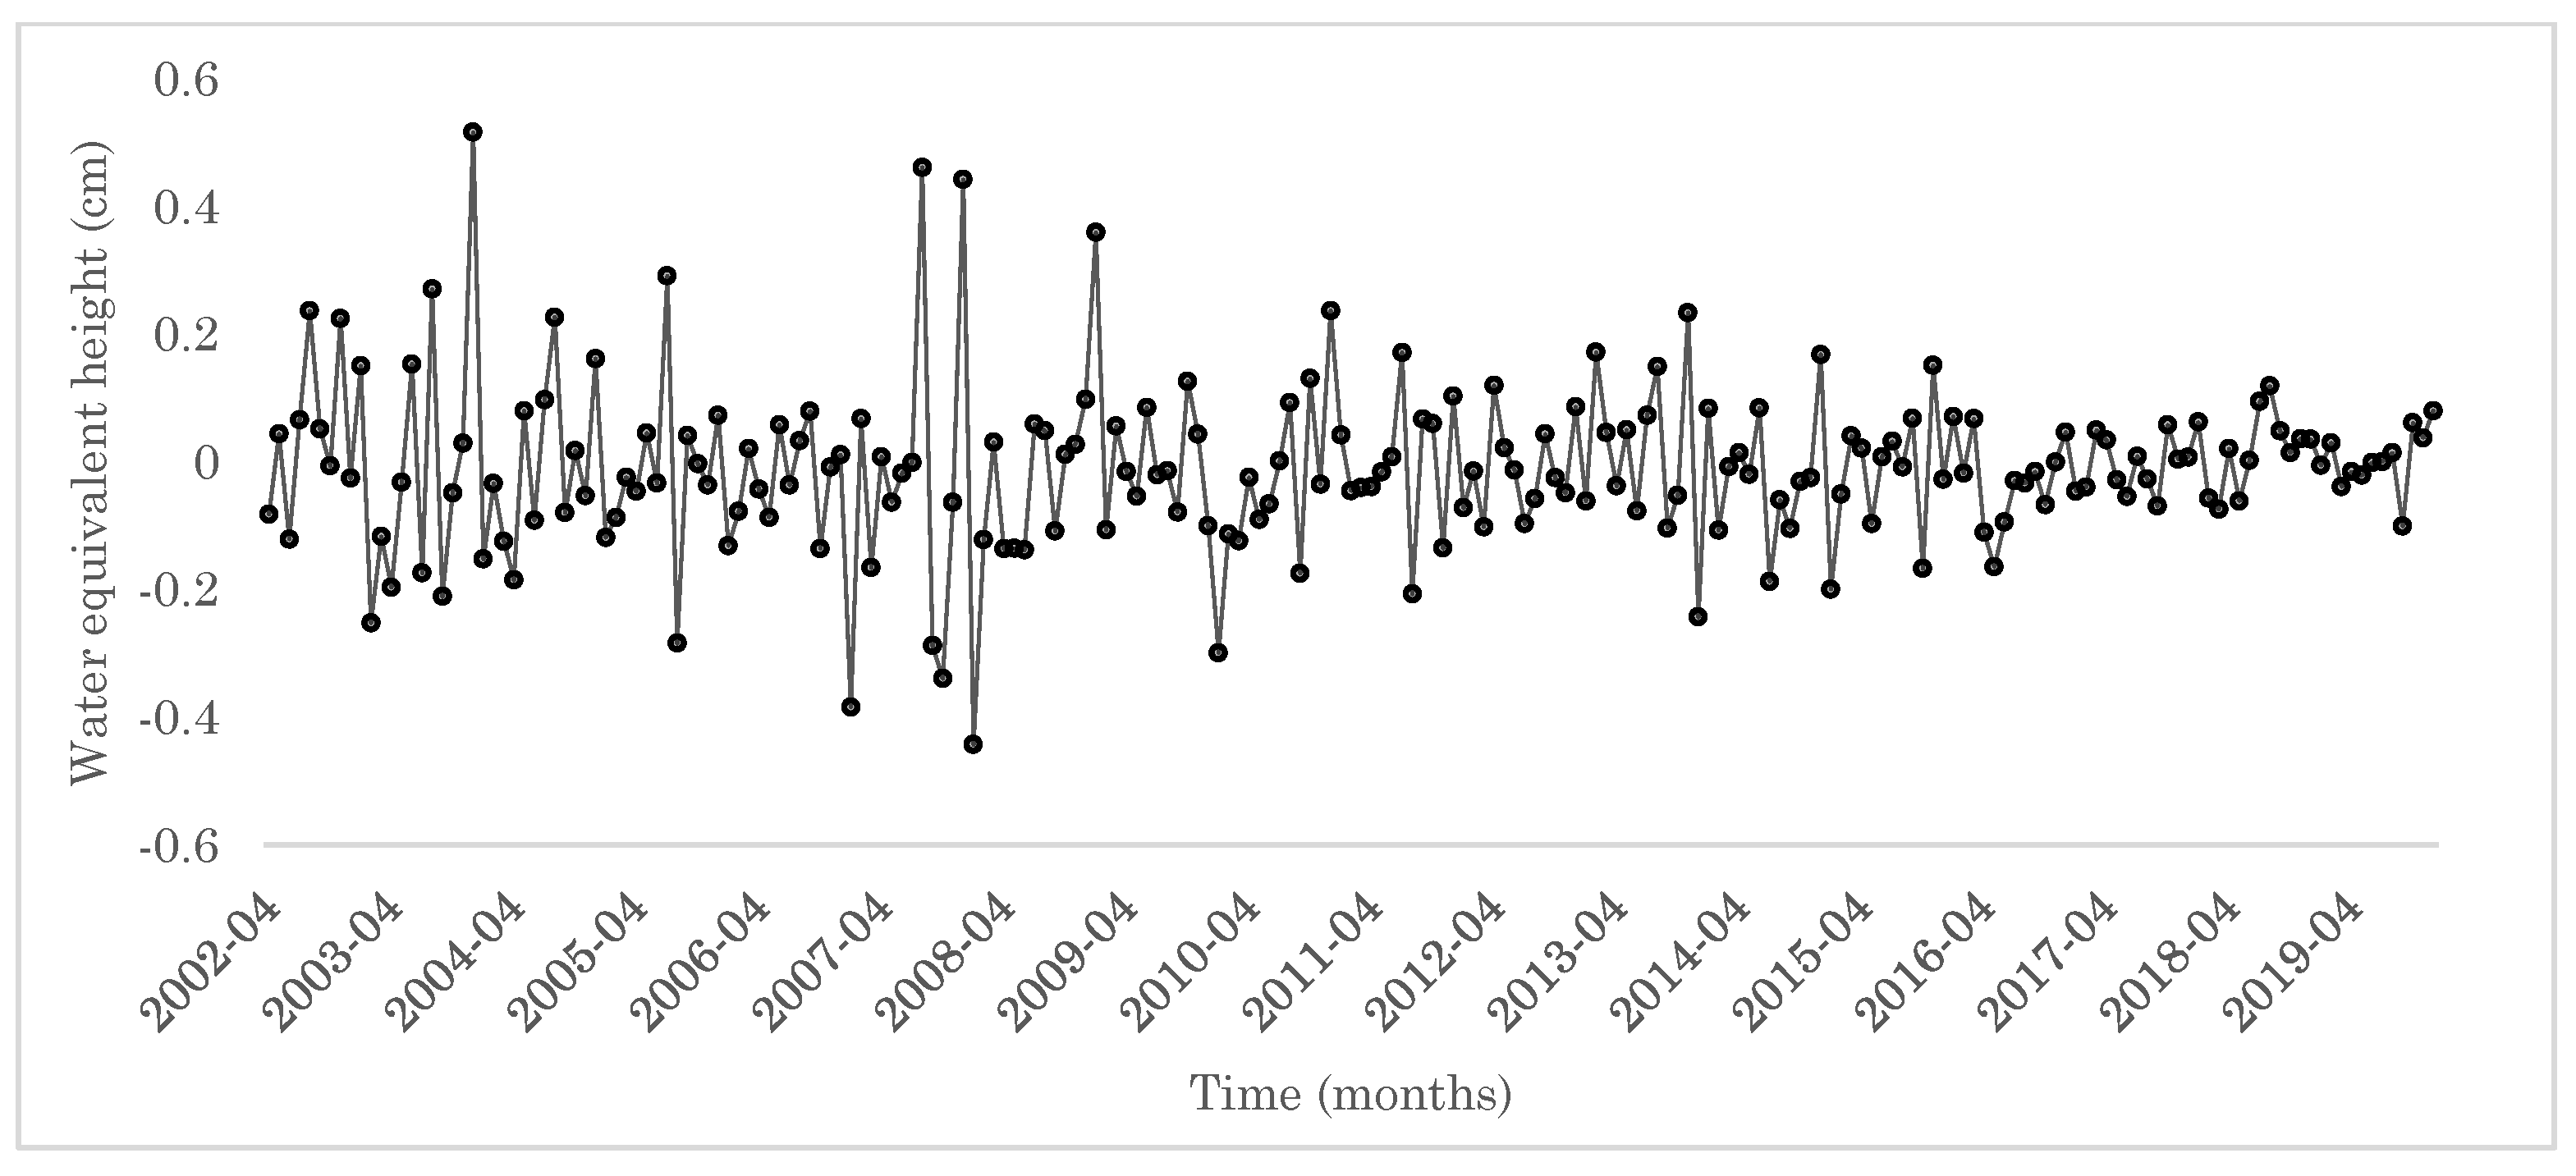
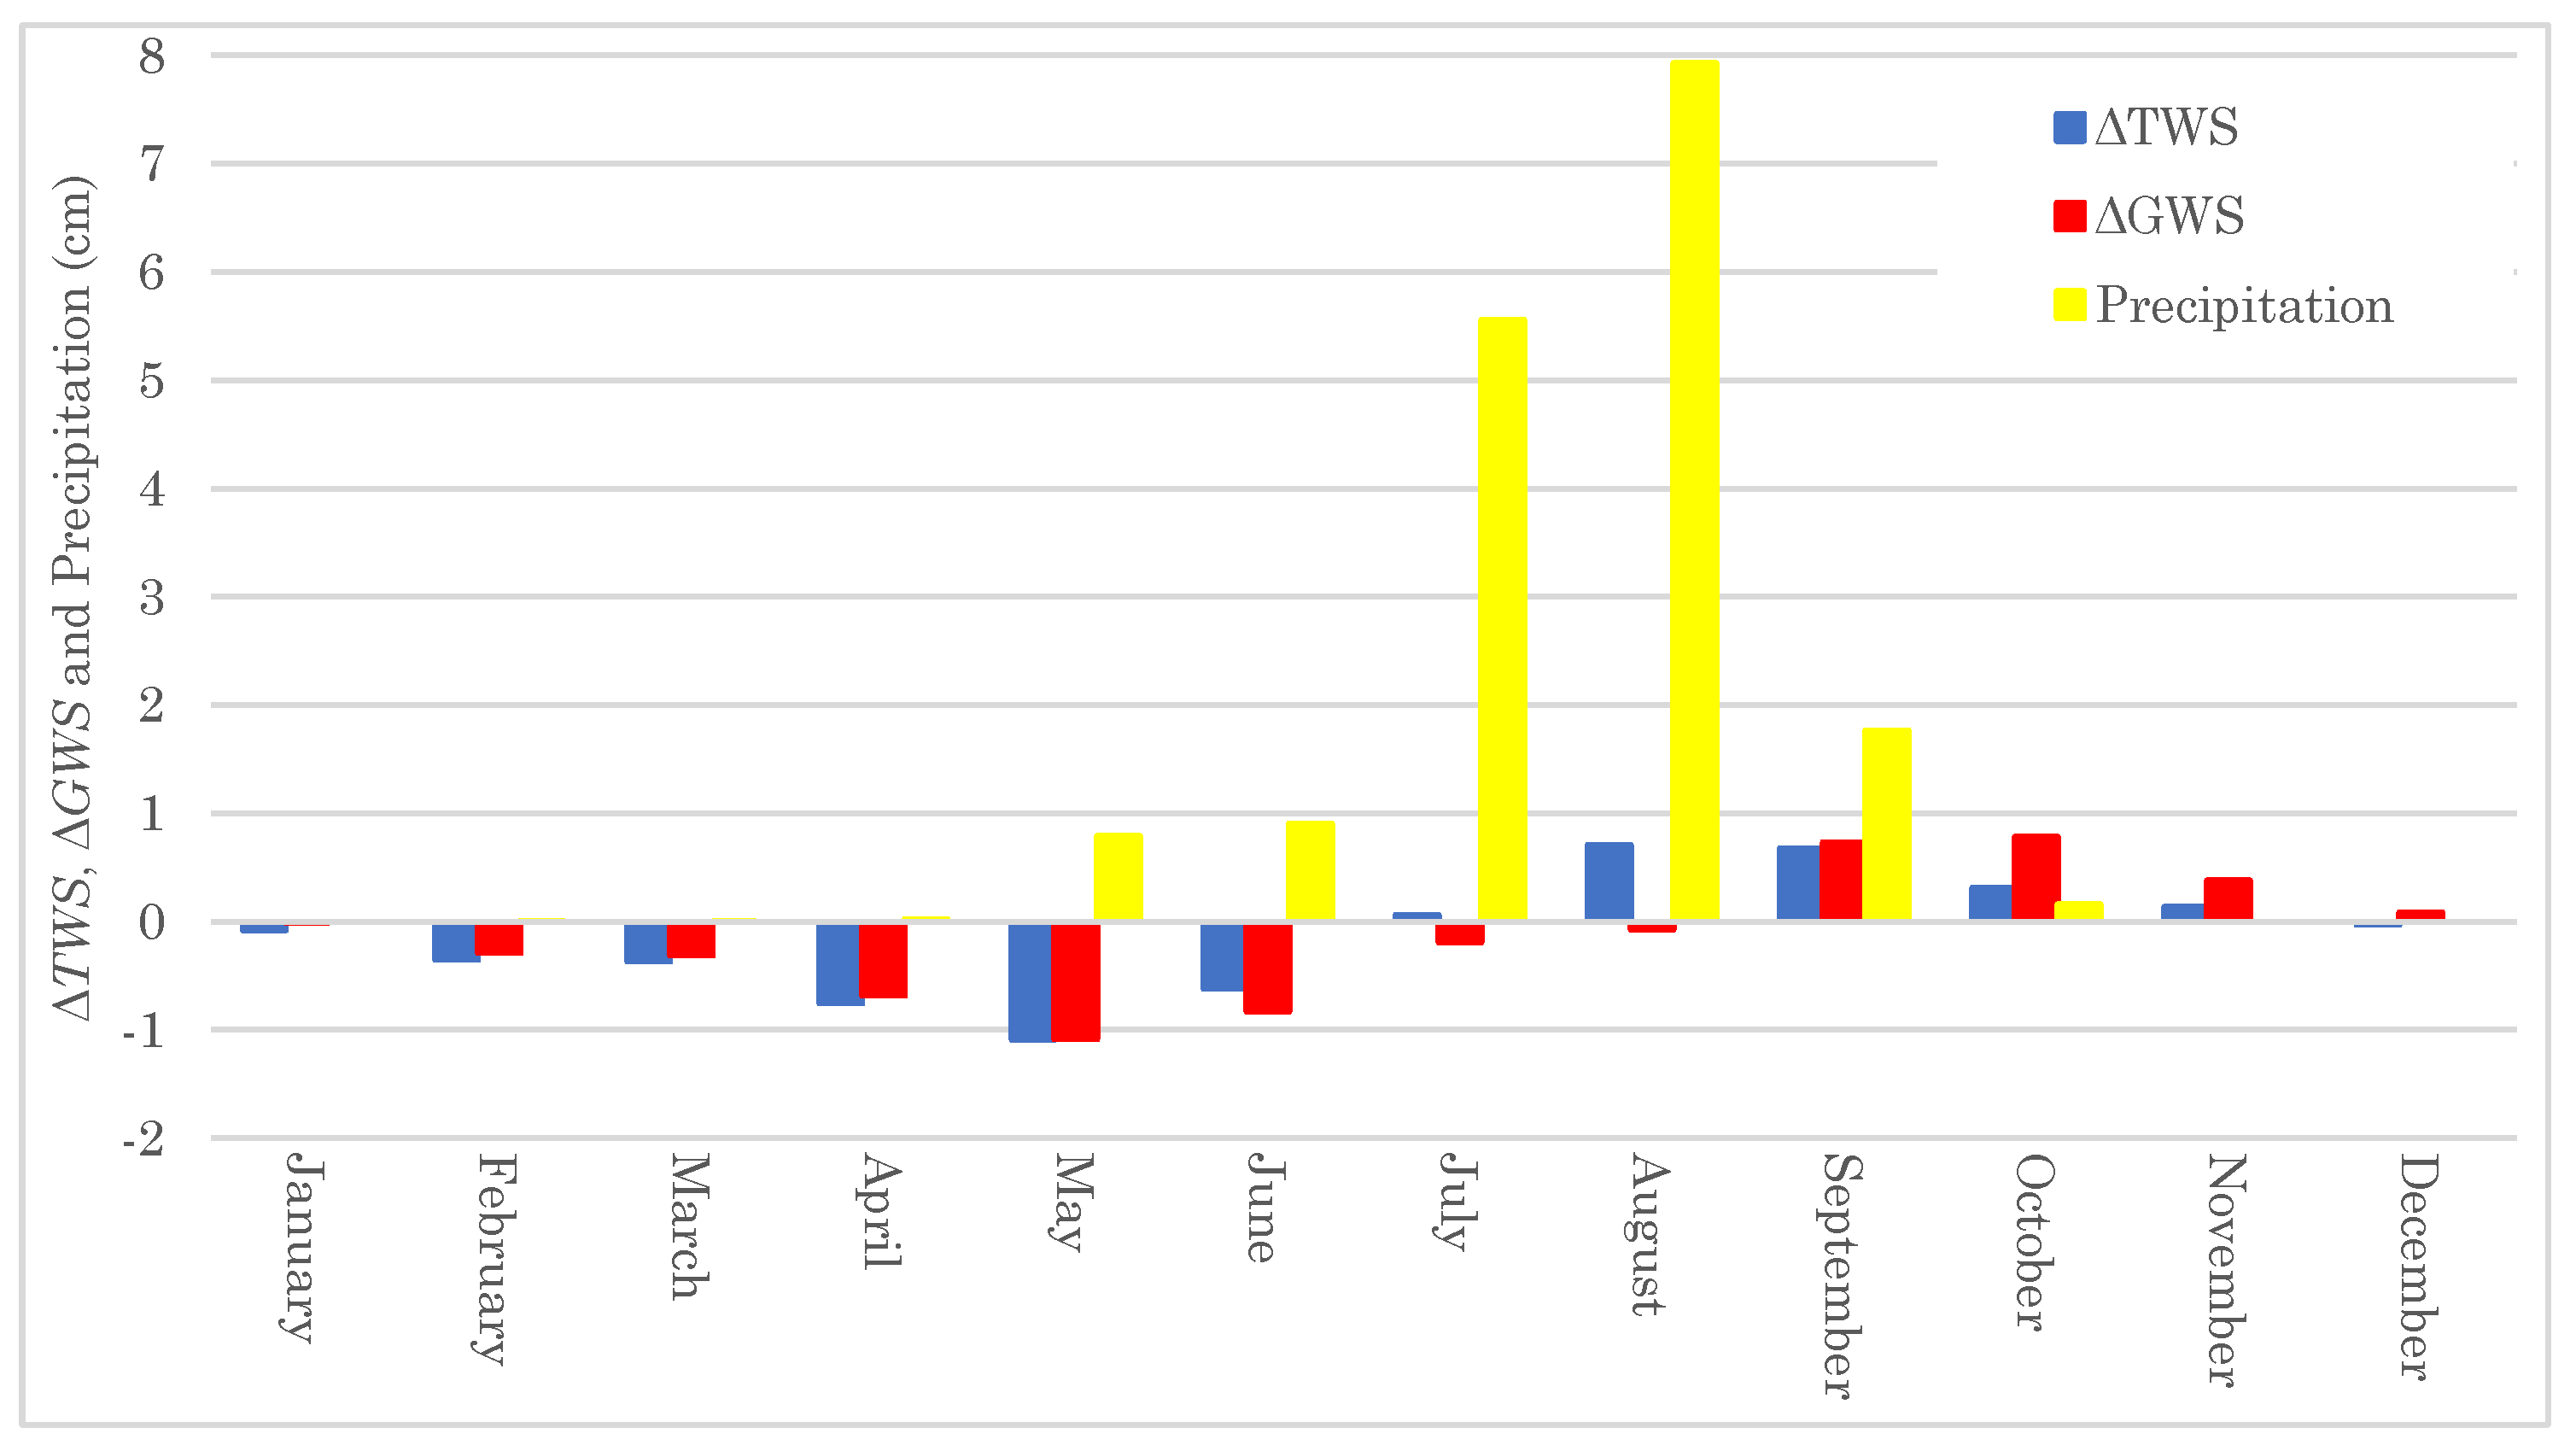
3.1. Analysis of GWSC with Time in the TMB

The monthly time series of the total water storage changes (TWSC) (blue line) for which related uncertainties are shown in Figure 2b, soil water changes (SWC) (grey line), GWSC (red dots), and the precipitation data (orange bars) over the TMB from 2002 to 2019 are shown in Figure 2a. The rainy season in the basin goes from June to September, leaving the rest of the year dry. Correspondingly, TWSC, SWC, and GWSC show increases in the rainy season and decrease the rest of the year. This pattern indicates that rainfall plays an important role in the seasonal variation of the GWS. Also, considering the rainfall variability from 1960 to 2019, represented in Figure 3 our study period is a wet season. Within this wet season, there are three major positive trends in 2007, 2015, and 2019 representing increases of more than 50 mm in rainfall records, where all the variables showed obvious increases. While the negative rainfall index represents decreases in rainfall records in 2008 and 2014 of more than 100 mm, the variables TWSC, SWC, and GWSC have shown an increase.
Other disagreements between the variables were also detected while analyzing the variation trends of the four-time series in Table 1. First, the annual variation trends of the TWSC, SWC, GWSC, and precipitation time series from 2002 to 2019, with SWC and precipitation show increasing trends, respectively, of 0.0069 cm/year and 0.51 cm/year, while the TWSC and GWSC show decreasing trends, respectively, of −0.1235 cm/year and −0.1310 cm/year. Second, these trends for TWSC, SWC, and GWSC indicate that GWSC and TWSC trends are very close, but GWSC decreased more in the third period, and the SWC is lower than the other variables and shows the opposite trend in the third period. Therefore, we can conclude that rainfall greatly influences the soil water but is not the main reason for groundwater consumption in the TMB; thus, anthropogenic activities may play an important role in groundwater consumption.

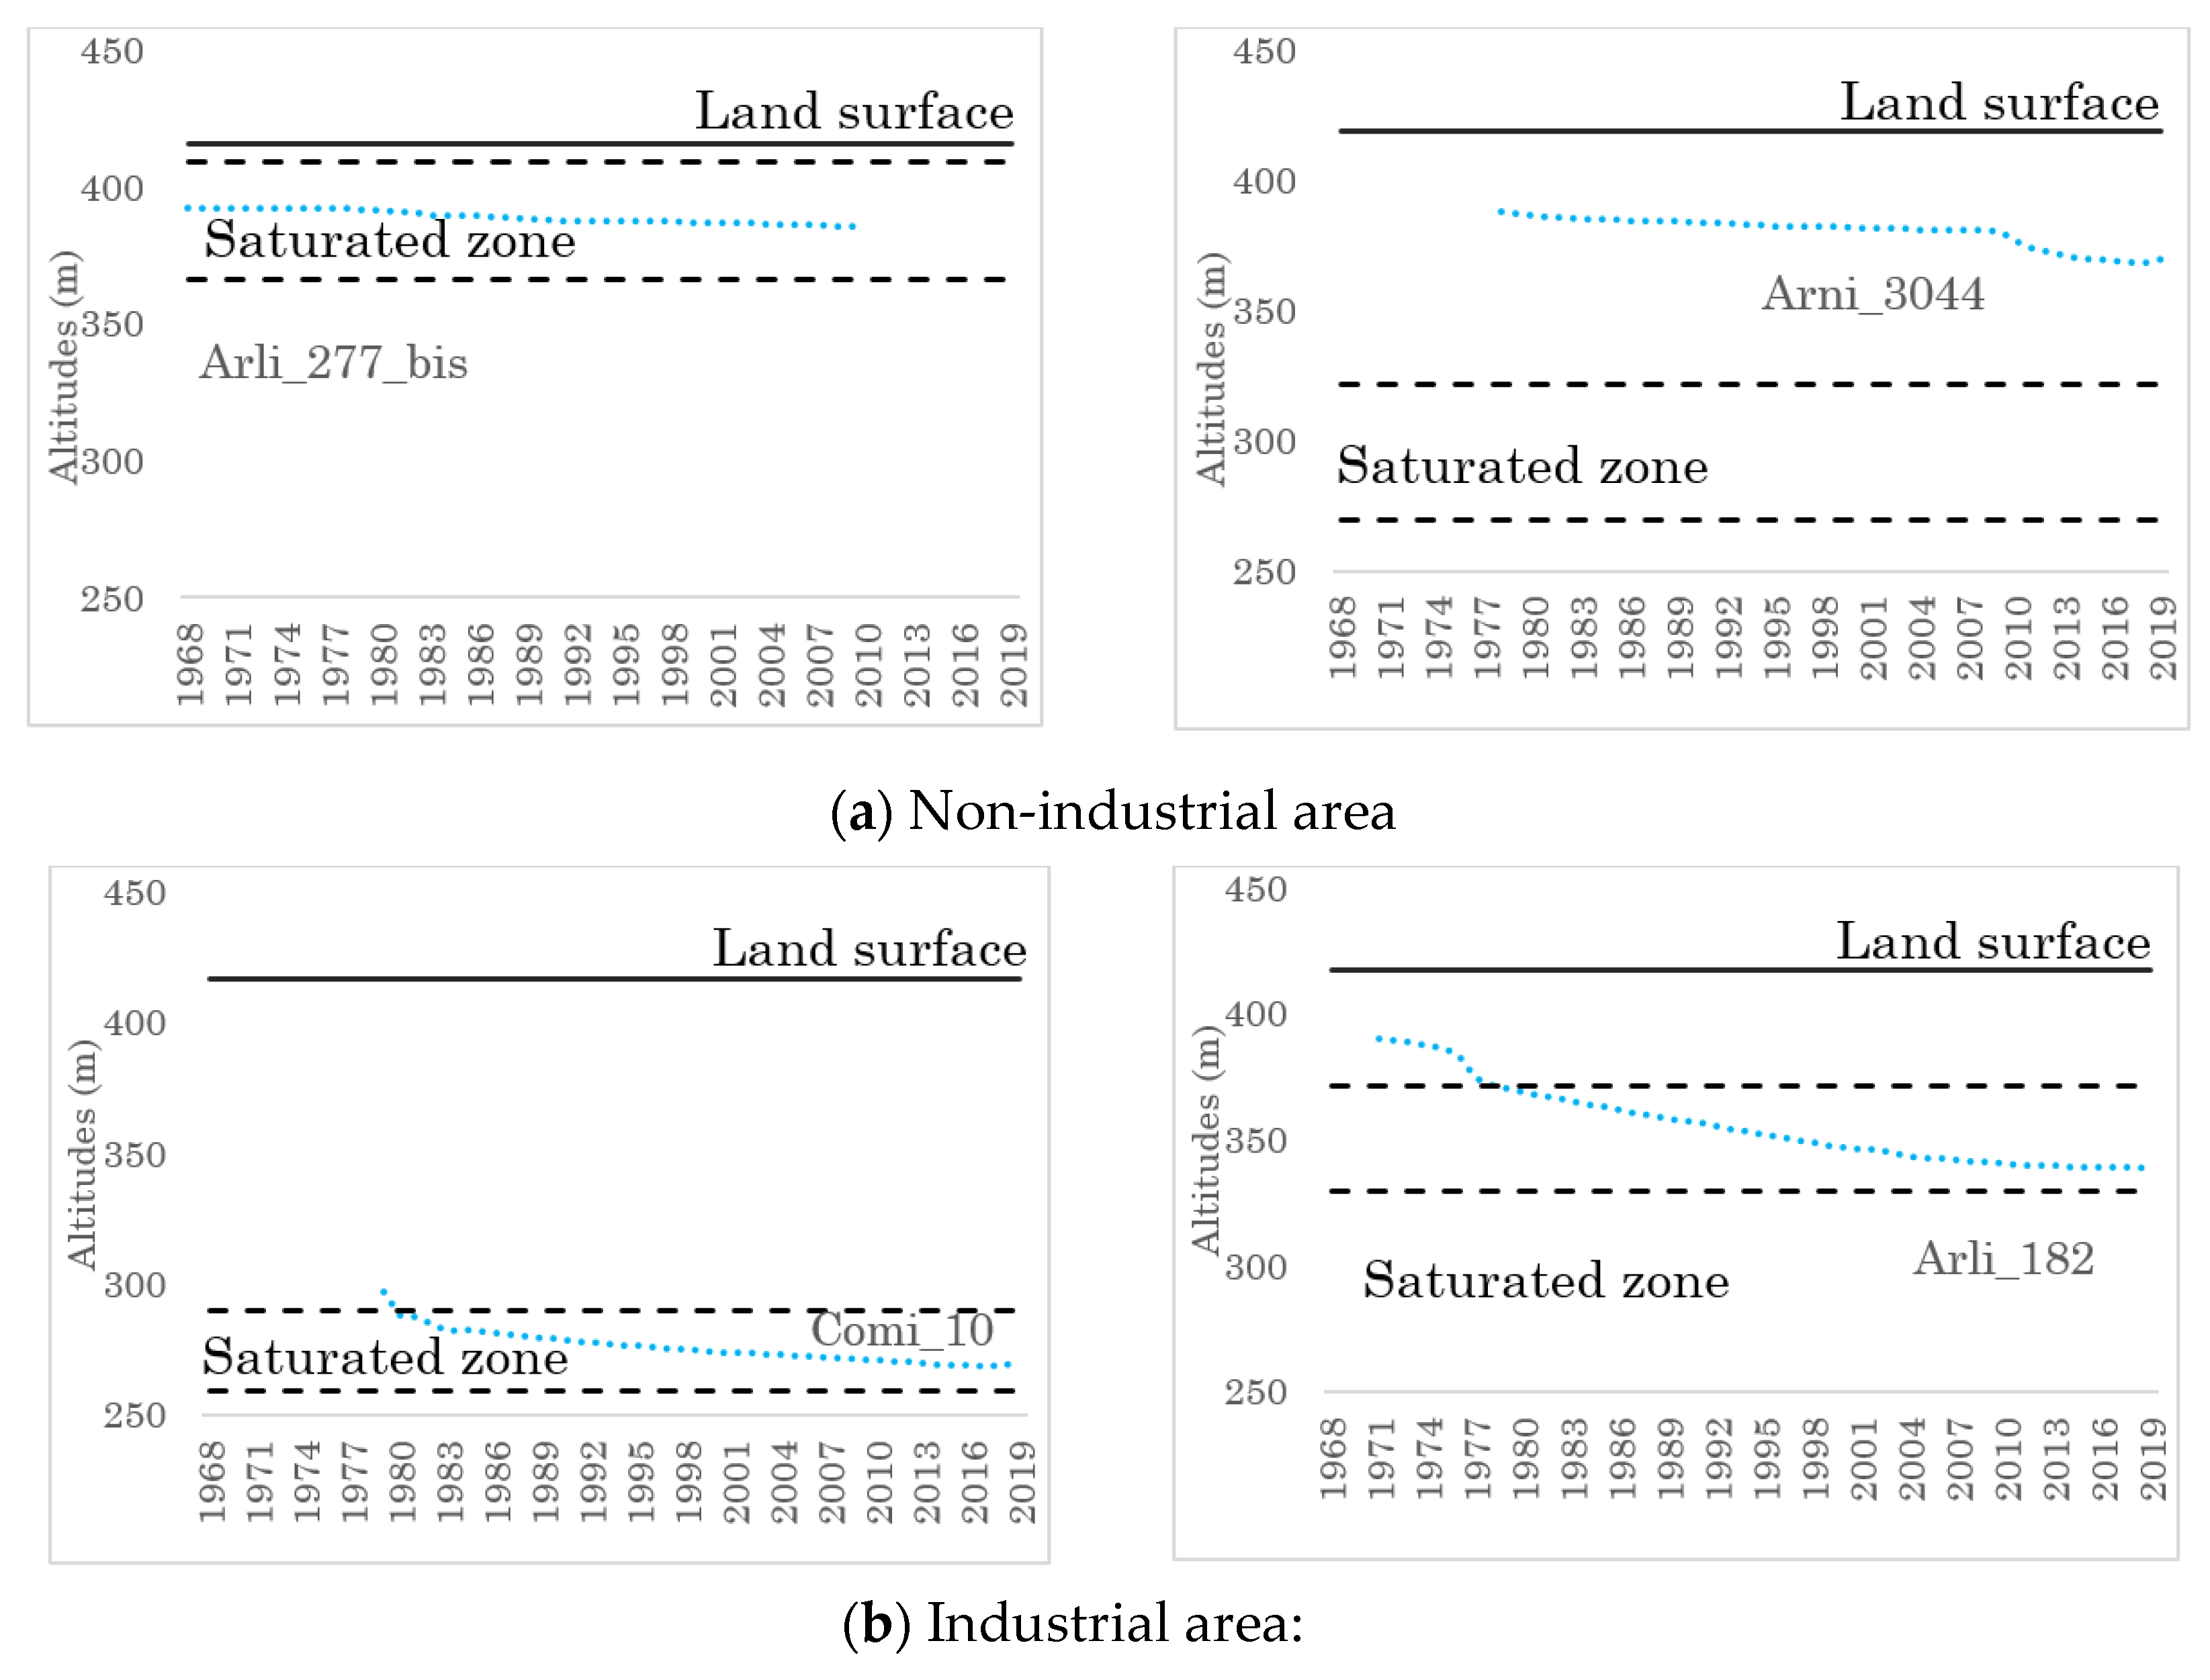
3.2. GWSC in the Arlit Mining Area

As demonstrated by [39], mining operations may have a different impact on the GWS estimates, for instance, (i) by the changes caused by mining that may directly affect the estimations of groundwater from GRACE data and (ii) by destroying the aquifer, which causes serious groundwater losses, etc. In our study area, the mass changes due to uranium mining are neglected because the actual loss of mass is equivalent to a few thousand tons. Thus, the main cause of groundwater consumption in the study area is supposed to be water withdrawals from mines and mining drainage. Since no specific amount of groundwater loss can be acquired for the whole basin, the Arlit mining region being the oldest exploited area in the basin is considered in this study.
At the end of 2019, water production records indicated that more than 400 billion m3 had been extracted from Tarat since 1968. An analysis of the evolution of GWSC in Figure 4 shows two periods: (i) from April 2002 to January 2010, the GWS varies with a greater amplitude, which translates into a trend of −0.014, and then (ii) declines from February 2010 to December 2019 with a trend of −0.0063. This is the opposite for the GWSC from GRACE as presented in Section 3.1 and with a coefficient of 0.08, which shows no linear correlation between the two datasets. The comparison of ground-based GWS anomalies in the Arlit area and those based on GRACE in the whole basin was made in terms of RMSE. The RMSE value of 0.79 shows a good fit between the GRACE and those obtained in situ, despite the difference in scale.

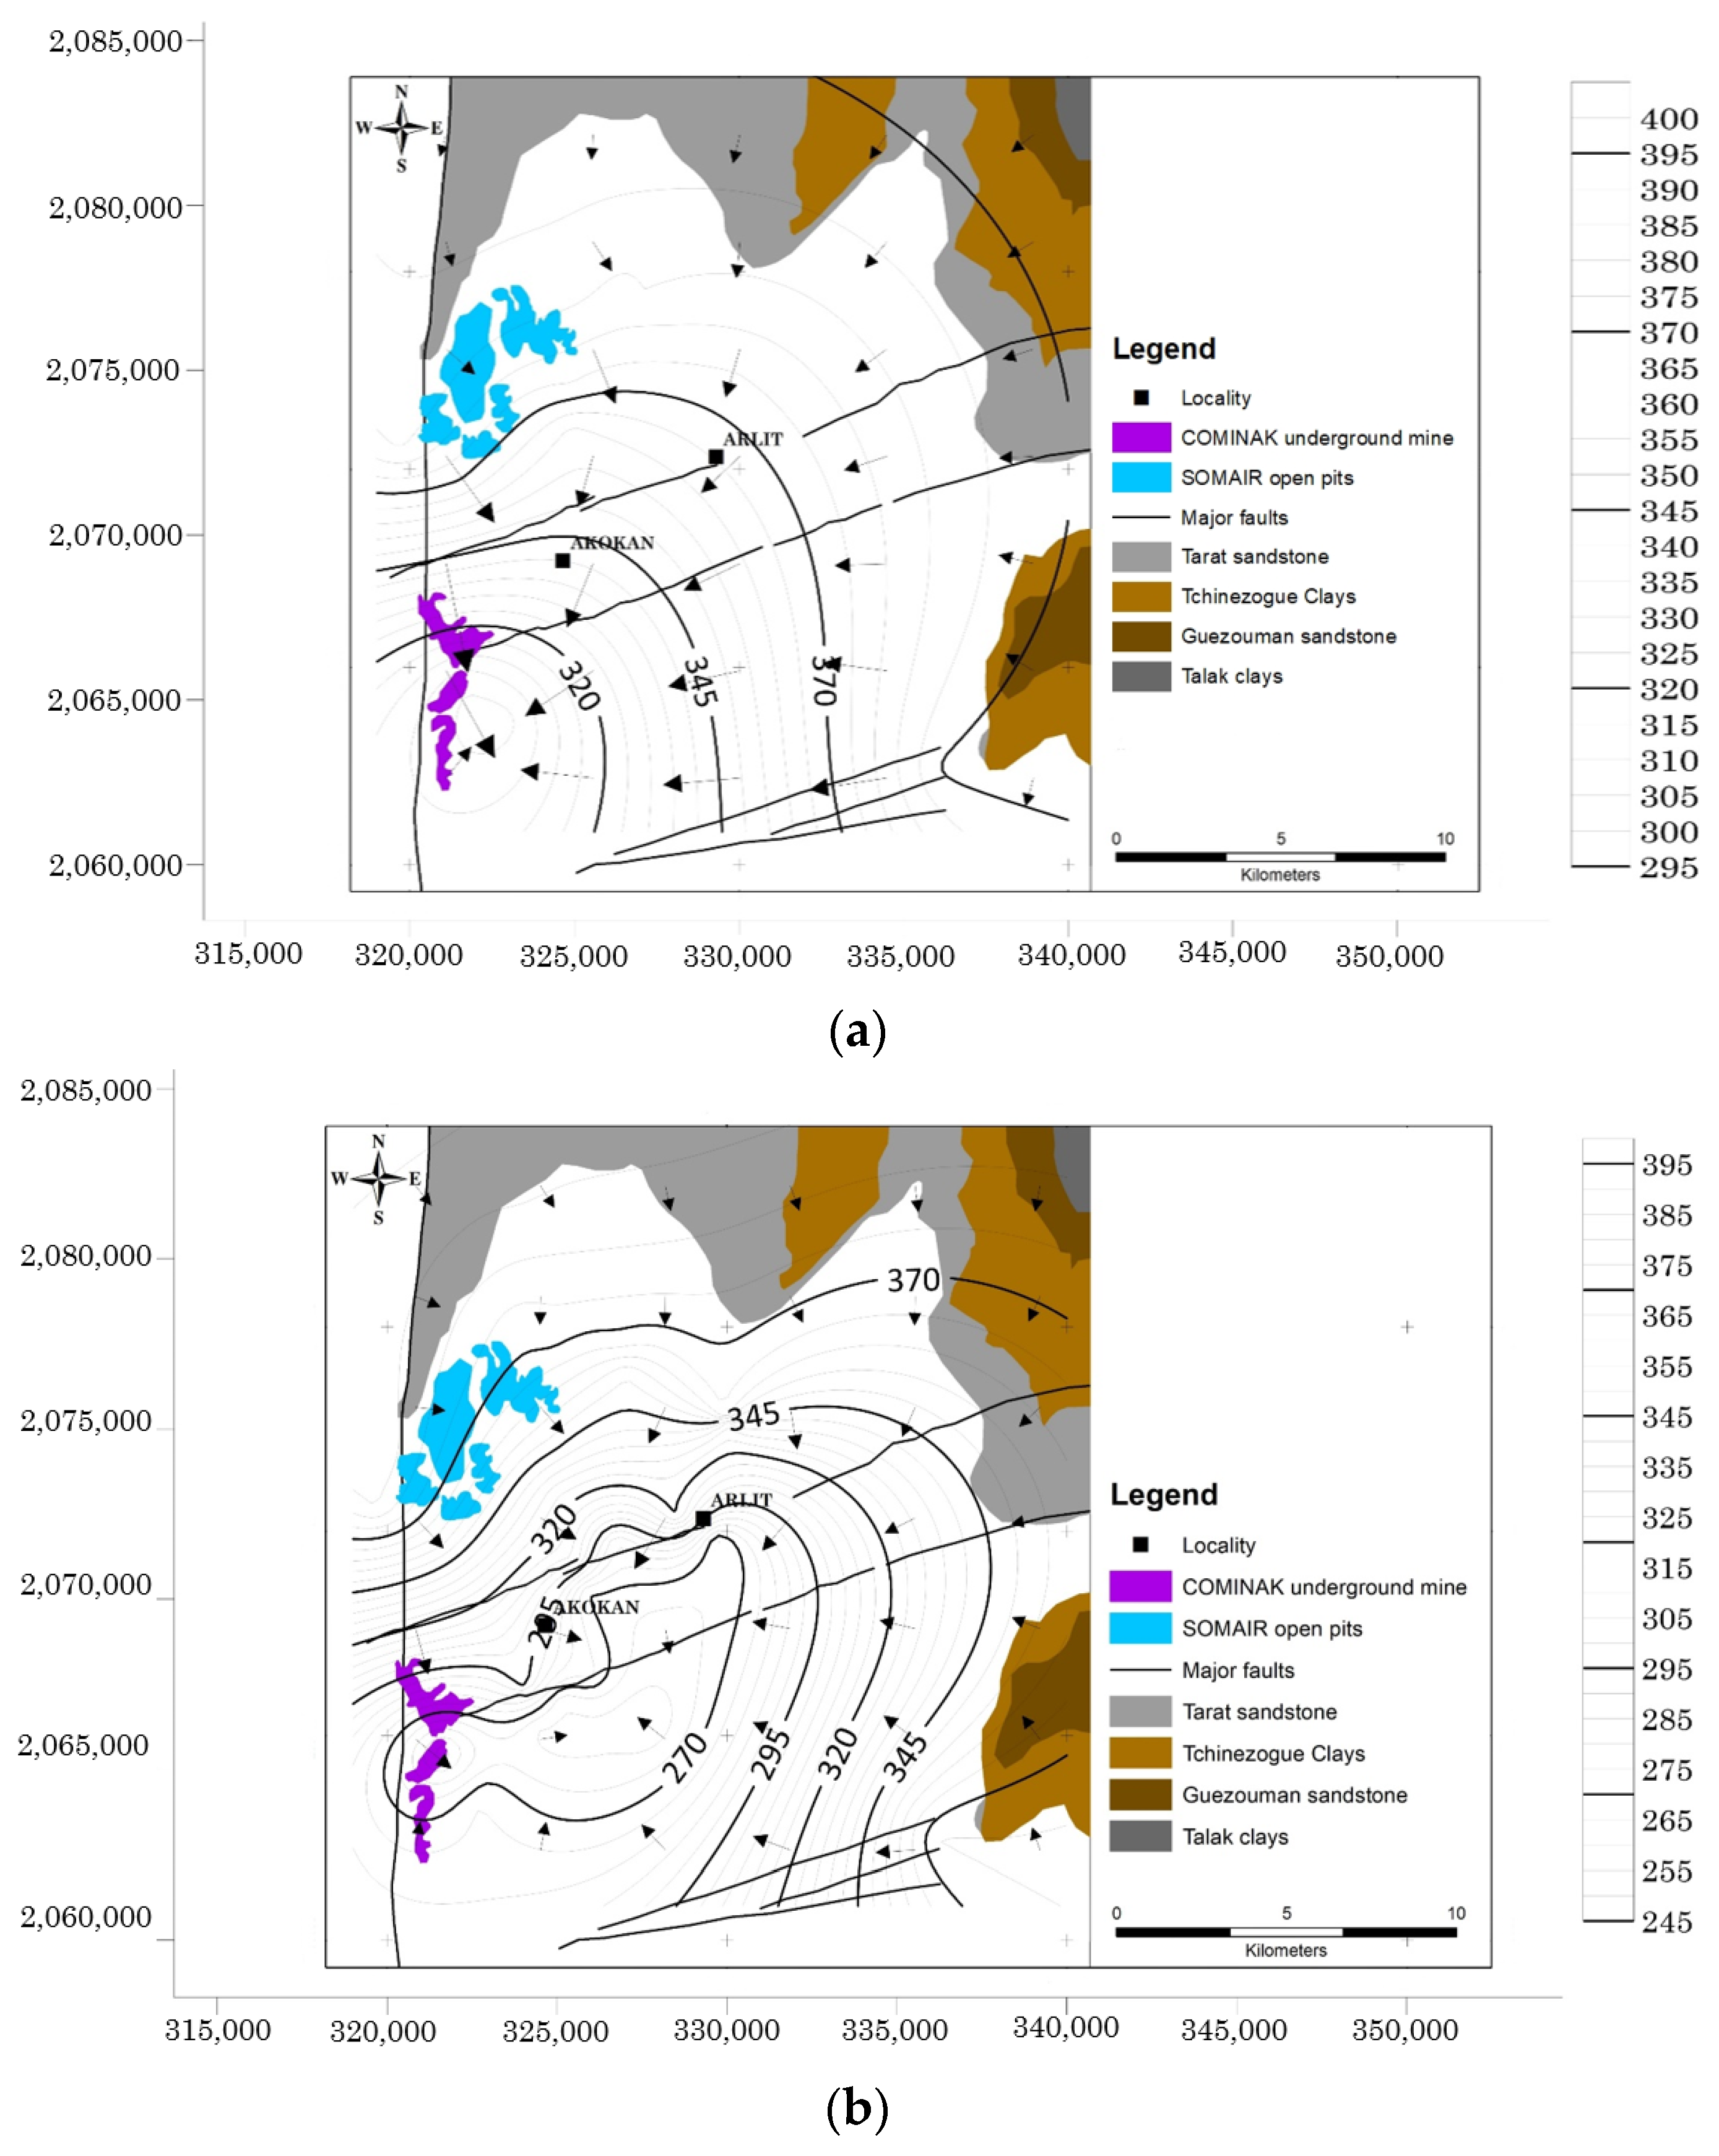
3.3. Tarat Water Table Flow Pattern Disturbance

In the context of an over-exploited aquifer, the contour lines configuration and the circulation mode are strongly modified (Figure 5). The initial conditions (prior mining activities) of the Tarat aquifer are not well known. Some interpretations resulting from some measures taken in the 1960s would indicate a general regular flow headed from the southeast to the northwest [19]. Since these measurements are unreliable, and there is not enough data to map the aquifer’s configuration in the 1960s, the present study will use 1977 as the base year.
The water level contourmap (Figure 5a) based on measurements from 19 wells taken in 1977 shows flow direction headed from the northeast to the southwest. The hydraulic heads decrease southwest toward a depression cone. The lowest measured water level is 290 m and occurred at the center of this latter, and the highest measured water levels occurred in the north-northwest part. The 1999 map (Figure 5b), with an overall similar look to the 1970 version, shows a widening of the depression cone previously observed. The 2019 map (Figure 5c) is based on water-level measurements in more than 100 wells. The circulation model after more than 50 years is strongly modified. The flow direction is no more one-way. The depression cone from the 1970s (Figure 5a) shifted to the south and still recorded the lowest water level at 230.22 m. Besides, three new depression cones were formed in the north and the center. On a global note, the water level measurements values are still highest in the northern part.
A general look at the Tarat water table variation shows a general drawdown on different scales (Figure 6 and Figure 7). Figure 6 shows the evolution of the difference in hydraulic heads of 17 piezometers from 1977 to 2009. Most of these piezometers have been destroyed by the expansion of mining activity or are no longer monitored, making it impossible to continue the surveys until 2019. For the period from 1977 to 2009, the Tarat water table decreased drastically from the southeast (up to 46 m) to northwest (12 m) (Figure 6d). From 1979, a more pronounced collapse was observed in the southern part. This depression remained over time and extends to the southeast, south-west, and deepens in the central part.
For an overview of the drawdown since the beginning of mining activities (1968 to 2019), the evolution of the water table from a few representative piezometers of the whole area is presented by the hydrographs of Figure 7.
In the northern (ARLI_277_bis) part, the Tarat depletion goes around 7 m from 1968 to 2010. The same trend was observed in the western part (Arni_3044) until 2010, when the drawdown reached 18m. On the other hand, the piezometers ARLI_182 (1971–2019) and COMI_10 (1979–2019) showed a decrease of, respectively, 52 and 30 m. The latter two were located in the industrial zone.

4. Discussion

Groundwater storage analyses using GRACE-based and in-situ GWS estimates are performed worldwide. In most of the analysis, aquifers located in arid/semi-arid areas showed large depletion rates resulting from an excess of water extraction due to intensive pumping when compared with the natural recharge from infiltration [53]. The literature review shows the potential of the GRACE-based approach for GWS analysis for regional groundwater assessments in data-lacking regions of the world [35,54,55,56]. Taking the African context, increased groundwater abstraction is important to economic development and the achievement of many sustainable development goals. There, groundwater assessment is extremely important, but there is little information on long-term or seasonal groundwater trends due to a lack of in-situ monitoring, which makes the use of global remote sensing tools such as GRACE essential [57,58]. An investigation of long-term changes in TWS of the Niger River basin was provided by [59]. For the whole Niger basin (2,118,000 km2), a rise in groundwater stocks was estimated to be 93 ± 61 km3 between January 2003 and December 2013. Small, consistent, increasing trends in estimated GWSC in the Iullemenden basin (eastern part of the Niger basin, 671,000 km2) from 2002 to 2016 were indicated by [57]. These results show a general increase in GWS in the area, while the results of the present study indicate a general decrease in GWS. This can be explained by the hostile arid and semiarid climate conditions of the TMB, the low groundwater recharge rate, and high rate of groundwater abstraction for mining activities, agriculture, and drinking water supply.
As shown by [57], the Iullemenden Sahelian aquifer basin presents a strong water storage seasonal response compared to the southern African basins. A range of 30 to 75% of the TWSC found there can be explained by the seasonal response. This seasonal behavior matches well with estimates of groundwater recharge in the Iullemenden basin [60,61]. However, the estimated seasonal GWS trend does not appear plausible for the hyper-arid basins, where seasonal groundwater recharge has been estimated to be negligible using environmental tracers [62]. However, regular seasonal groundwater recharge is detected through GRACE [63,64,65,66]. Studies such as [67] highlighted the uncertainty of groundwater seasonal behavior while comparing GRACE to groundwater level variations in southern and eastern Africa. It should be noted that the GRACE output variables are not directly impacted by point rainfall anomalies. It is long-term analyses that allow a strong link between these parameters to be defined. In the present study, the average monthly trends depict a clear seasonality of storage in the study area (Figure 8). Also, the seasonal variation confirms a general water storage loss trend in the TMB. Concerning the recharge of the aquifers, the water storage evolves according to the rainfall. Indeed, considering the average annual trend over the study period, we note that the GWSC increases to a maximum in September–October (end of the rainy season) and begins to decrease in October–November (beginning of the dry season) until its maximum in May. It can be assumed that recharge takes place two months after the rainy season, which is consistent with the results of [68] in the southwestern part of the Iullemenden basin. It should be noted that even if groundwater recharge can be explained by the seasonality of rainfall, this is not the only factor to be taken into account. Indeed, vegetation in Sahelian zones is scarce and diminishes over the years, which favors infiltration and runoff [69]. Locally, in the Arlit area, the fracturing system has also been shown to play a key role in the groundwater recharge process and the hydrodynamic functioning of the aquifers [19,21].
The study area has been mapped as a region with high groundwater storage but a low recharge rate by [1]. In such areas, groundwater withdrawals lead to a considerable groundwater drawdown and highly impact the groundwater flow pattern. The lowering of the water table and groundwater flow pattern were identified by [70] as a significant impact of mining activities on groundwater resources. Indeed, pumping is an integral part of mining for preventing water inflow in open pits and galleries, creating a depression cone in the groundwater table, thereby reducing the groundwater level [13]. In the Arlit area, pumping for the needs of mining companies has led to a drop in level of about 50m and the formation and evolution of depression cones. Spatial analysis of the aquifer depletion also shows a greater decrease in the south-eastern part, which could correspond to a groundwater recharge area.
Mapping and monitoring groundwater storage is expensive and, considering the high spatial variability in aquifer systems’ hydraulic properties, unreliable. However, water managers need practical information on the dynamics and the current status of groundwater storage for better planning of groundwater resources management in the framework of sustainable development through the implementation of appropriate strategies and infrastructures. It is then essential to explore indirect and reliable methods for understanding the impact of rainfall and pumping on groundwater storage changes. GRACE has been demonstrated to be useful to develop insights into how groundwater storage varies [9,39,65,71,72]. In the present study, GRACE allowed more or less correct assessments of the dynamics of TWS in the TMB, a semi-arid area with scarce data. However, the reliability of derived groundwater storage changes from GRACE depends on the accuracy of the estimations of the other water components of the TWS. Then, errors in groundwater storage estimates, derived from this process, may stem from the summation of the errors in the GRACE total water storage changes, the soil moisture values, and the surface water estimates [65]. The efforts to minimize potential bias in this study were to use the mascon data product to overcome the potential noises of the GRACE data [56], and since the scaling coefficients were used in processing the data for the current study, adjustments to incorporate these errors were already made to the data and, hence, no additional error analysis was needed.

5. Conclusions

In this study, GRACE, GLDAS, and in-situ data were used to evaluate the evolution of the TMB GWSC and the spatiotemporal depletion of the Tarat water table in the Arlit mining region. Based on previous work, GRACE mascon data were used.
Based on the GWS estimated from the mascon solutions, we analyzed the temporal and spatial variations of the groundwater in the TMB. We found that the GWS shows a strong seasonal variation, with increases in the rainy season and decreases in the dry season. Then, the groundwater of the TMB showed serious depletion during 2014–2019, and the annual variation trend was −0.3998 cm/year. Also, an analysis of the precipitation data and GWSC data showed that rainfall is the main reason for the seasonal variations of groundwater but is not the cause for the persistent consumption of groundwater, and that groundwater loss is mainly due to anthropogenic activities.
The GWSC of the Tarat aquifer decreases from 2002 to 2010 with an annual variation trend of −0.014 cm/year. This corresponds, according to mining operating data, to a period of high mining activity and thus a period of high demand on the water table. Also, the in-situ GWSC data fit rather well with the GWSC data from GRACE, with an RMSE of 0.79. The groundwater flow direction changed drastically, and the formation and evolution of depression cones highlighted the fact that pumping from mines is heavily impacting groundwater storage. Additionally, the temporal analysis of the evolution of the Tarat water table level showed a significant drop from 1968 to 2019 of up to 50 m. Spatially, this drop is mainly concentrated in the mining areas representing the main consuming activities but also in the south-eastern part, which is supposed to be the aquifer recharge zone.
This study is a prelude to a more in-depth study of the TMB’s hydrogeological system. In future studies, the complexity of hydrological processes in the TMB should be addressed. This is indispensable for groundwater management and can provide decision support for the sustainable development of mining activities and the protection of groundwater resources.

Author Contributions

The authors contributed to this publication as follows: Conceptualization, F.B.D., B.A.B., F.Z.M., and Y.N.; methodology, F.B.D., F.Z.M., and B.A.B.; data acquisition and treatment, F.B.D., F.Z.M., B.A.B., and S.N.E.; writing original draft, F.B.D.; writing—review & editing, B.A.B., F.Z.M., Y.N., E.K.K., and M.K.; supervision, Y.N., E.K.K., and M.K. All authors have read and agreed to the published version of the manuscript.

Funding

This research was funded by the CEA-MEM and ACE Partner/Réseau Activité Minière Responsable et Développement Durable projects through a Ph.D. fellowship to the first author.

Institutional Review Board Statement

Not applicable.

Informed Consent Statement

Not applicable.

Data Availability Statement

Remote sensing GRACE and GLDAD data used in the present study are respectively available on https://grace.jpl.nasa.gov/data/get-data/jpl_global_mascons/ and https://disc.gsfc.nasa.gov/datasets/GLDAS_NOAH025_M_2.1/ (accessed on 25 September 2020). Data regarding the study area are part of the dataset of the PhD work of the first author, therefore can’t be shared.

Acknowledgments

A special acknowledgment to the LAFMAAL Foundation, the LMI-MINERWA, and the mining companies in the Arlit region.

Conflicts of Interest

The authors declare no conflict of interest.

References

  1. MacDonald, A.M.; Lark, R.M.; Taylor, R.G.; Abiye, T.; Fallas, H.C.; Favreau, G.; Goni, I.B.; Kebede, S.; Scanlon, B.R.; Sorensen, J.P.R.; et al. Mapping groundwater recharge in Africa from ground observations and implications for water security. Environ. Res. Lett. 2021, 16, 14. [Google Scholar] [CrossRef]
  2. McGuire, V.L.; Johnson, M.R.; Schieffer, R.L.; Stanton, J.S.; Sebree, S.K.; Verstraeten, I.M. Water in Storage and Approaches to Ground-Water Management, High Plains Aquifer; U.S. Geological Survey: Reston, VA, USA, 2003; p. 66.
  3. Konikow, L.F.; Kendy, E. Groundwater depletion: A global problem. Hydrogeol. J. 2005, 13, 317–320. [Google Scholar] [CrossRef]
  4. Rodell, M.; Velicogna, I.; Famiglietti, J.S. Satellite-based estimates of groundwater depletion in India. Nature 2009, 460, 999–1002. [Google Scholar] [CrossRef] [Green Version]
  5. Scanlon, B.R.; Longuevergne, L.; Long, D. Ground referencing GRACE satellite estimates of groundwater storage changes in the California Central Valley, USA. Water Resour. Res. 2012, 48. [Google Scholar] [CrossRef] [Green Version]
  6. Werner, A.D.; Zhang, Q.; Xue, L.; Smerdon, B.D.; Smerdon, B.D.; Li, X.; Zhu, X.; Yu, L.; Li, L. An Initial Inventory and Indexation of Groundwater Mega-Depletion Cases. Water Resour. Res. 2013, 27, 507–533. [Google Scholar] [CrossRef]
  7. Knowling, M.J.; Werner, A.D.; Herckenrath, D. Quantifying climate and pumping contributions to aquifer depletion using a highly parameterised groundwater model: Uley South Basin (South Australia). J. Hydrol. 2015, 523, 515–530. [Google Scholar] [CrossRef]
  8. Ahmed, M.; Abdelmohsen, K. Quantifying Modern Recharge and Depletion Rates of the Nubian Aquifer in Egypt. Surv. Geophys. 2018, 39, 729–751. [Google Scholar] [CrossRef]
  9. Abou Zaki, N.; Torabi Haghighi, A.; Rossi, P.M.; Tourian, M.J.; Klove, B. Monitoring Groundwater Storage Depletion Using Gravity Recovery and Climate Experiment (GRACE) Data in the Semi-Arid Catchments. Hydrol. Earth Syst. Sci. Discuss. 2018, 1–21. [Google Scholar] [CrossRef]
  10. Duan, W.; Takara, K. Impacts of Climate and Human Activities on Water Resources and Quality: Integrated Regional Assessment; Springer: Singapore, 2020. [Google Scholar]
  11. Howladar, M.F. Coal mining impacts on water environs around the Barapukuria coal mining area, Dinajpur, Bangladesh. Environ. Earth Sci. 2013, 70, 215–226. [Google Scholar] [CrossRef]
  12. Duan, W.; He, B.; Nover, D.; Yang, G.; Chen, W.; Meng, H.; Zou, S.; Liu, C. Water Quality Assessment and Pollution Source Identification of the Eastern Poyang Lake Basin Using Multivariate Statistical Methods. Sustainability 2016, 8, 133. [Google Scholar] [CrossRef] [Green Version]
  13. Jhariya, D.C.; Khan, R.; Thakur, G.S. Impact of Mining Activity on Water Resource: An Overview study. In Proceedings of the Recent Practices, and Innovations in Mining Industry, Raipur, India, 19–20 February 2016; pp. 19–20. [Google Scholar]
  14. Liu, P.; Hoth, N.; Drebenstedt, C.; Sun, Y.; Xu, Z. Hydro-geochemical paths of multi-layer groundwater system in coal mining regions—Using multivariate statistics and geochemical modeling approaches. Sci. Total Environ. 2017, 601–602, 1–14. [Google Scholar] [CrossRef] [PubMed]
  15. Singh, U.K.; Ramanathan, A.L.; Subramanian, V. Groundwater chemistry and human health risk assessment in the mining region of East Singhbhum, Jharkhand, India. Chemosphere 2018, 204, 501–513. [Google Scholar] [CrossRef]
  16. Lyu, Z.; Chai, J.; Xu, Z.; Qin, Y. Environmental Impact Assessment of Mining Activities on Groundwater: Case Study of Copper Mine in Jiangxi Province, China. J. Hydrol. Eng. 2019, 24. [Google Scholar] [CrossRef]
  17. Dodo, A.; Zuppi, G.M. Quaternary climatic variability in the Tarat aquifer (Arlit, Niger). Comptes Rendus Acad. Sci. Ser. IIA Earth Planet. Sci. 1999, 6, 371–379. [Google Scholar]
  18. Issa, S.; Alassane, A.; Natatou, I.; Sohounhloué, D.; Mama, D. Caractéristique hydrogéochimique des eaux souterraines des aquifères de l’Izegouandé et du Tarat au voisinage de la Somaïr à Arlit au Niger. J. Société Ouest Afr. Chim. 2015, 39, 57–63. [Google Scholar]
  19. Boko, B.A.; Konaté, M.; Rabani, A.; Abdoulaye, A. Contribution du système de fracturation à la recharge des aquifères du bassin de Tim Mersoï (Nord Niger). Rev. Cames 2017, 5, 64–72. [Google Scholar]
  20. Boko, B.A.; Konaté, M.; Rabani, A.; Abdoulaye, A. Influence du système de drainage sur la vulnérabilité à la pollution des aquifères du bassin de Tim Mersoï, Nord Niger. Afr. Sci. 2017, 13, 261–274. [Google Scholar]
  21. Illias, A.; Babaye, M.S.A.; Baraou, I.S.; Ousmane, B. Influence du système de fracturation sur le fonctionnement hydrodynamique de la nappe du Tarat, Bassin de Tim Mersoï, Nord Niger. Afr. Sci. 2019, 15, 81–95. [Google Scholar]
  22. Anthony, L.B.; Amadou, B.; Farook, A.; Pierre, G. Open Pit Dewatering in Niger, from Groundwater Modeling Forecast to in-pit Water Management. In IMWA “Conference Mine Water: Technological and Ecological Challenges”; Wolkersdorfer, C., Khayrulina, E., Polyakova, S., Bogush, S., Eds.; Perm State University: Perm, Rusia, 2019; pp. 585–590. [Google Scholar]
  23. Becker, M.W. Potential for Satellite Remote Sensing of Ground Water. Groundwater 2006, 44, 306–318. [Google Scholar] [CrossRef]
  24. Machiwal, D.; Jha, M.K.; Mal, B.C. Assessment of Groundwater Potential in a Semi-Arid Region of India Using Remote Sensing, GIS, and MCDM Techniques. Water Resour. Manag. 2011, 25, 1359–1386. [Google Scholar] [CrossRef]
  25. Duan, W.; Maskey, S.; Chaffe, P.L.B.; Luo, P.; He, B.; Wu, Y.; Hou, J. Recent Advancement in Remote Sensing Technology for Hydrology Analysis and Water Resources Management. Remote Sens. 2021, 13, 1097. [Google Scholar] [CrossRef]
  26. De Andrade, B.C.C.; De Andrade Pinto, E.J.; Ruhoff, A.; Senay, G.B. Remote sensing-based actual evapotranspiration assessment in a data-scarce area of Brazil: A case study of the Urucuia Aquifer System. Int. J. Appl. Earth Obs. Geoinf. 2021, 98, 16. [Google Scholar] [CrossRef]
  27. Strassberg, G.; Scanlon, B.R.; Chambers, D. Evaluation of groundwater storage monitoring with the GRACE satellite: Case study of the High Plains aquifer, central United States. Water Resour. Res. 2009, 45. [Google Scholar] [CrossRef] [Green Version]
  28. Wada, Y.; Wisser, D.; Bierkens, M.F. Global modeling of withdrawal, allocation and consumptive use of surface water and groundwater resources. Earth Syst. Dyn. 2014, 5, 15–40. [Google Scholar] [CrossRef] [Green Version]
  29. Seyoum, W.M.; Milewski, A.M. Monitoring and comparison of terrestrial water storage changes in the northern high plains using GRACE and in-situ based integrated hydrologic model estimates. Adv. Water Resour. 2016, 94, 31–44. [Google Scholar] [CrossRef]
  30. Voss, K.A.; Famiglietti, J.S.; Lo, M.; De Linage, C.; Rodell, M.; Swenson, S.C. Groundwater depletion in the Middle East from GRACE with implications for transboundary water management in the Tigris-Euphrates-Western Iran region. Water Resour. Res. 2013, 49, 904–914. [Google Scholar] [CrossRef] [Green Version]
  31. Joodaki, G.; Wahr, J.; Swenson, S. Estimating the human contribution to groundwater depletion in the Middle East, from GRACE data, land surface models, and well observations. Water Resour. Res. 2014, 50, 2679–2692. [Google Scholar] [CrossRef]
  32. Lezzaik, K.; Milewski, A. A quantitative assessment of groundwater resources in the Middle East and North Africa region. Hydrogeol. J. 2018, 26, 251–266. [Google Scholar] [CrossRef]
  33. Feng, W.; Zhong, M.; Lemoine, J.-M.; Biancale, R.; Hsu, H.-T.; Xia, J. Evaluation of groundwater depletion in North China using the Gravity Recovery and Climate Experiment (GRACE) data and ground-based measurements: Groundwater depletion in north china. Water Resour. Res. 2013, 49, 2110–2118. [Google Scholar] [CrossRef]
  34. Ebead, B.; Ahmed, M.; Niu, Z.; Huang, N. Quantifying the anthropogenic impact on groundwater resources of North China using Gravity Recovery and Climate Experiment data and land surface models. J. Appl. Remote Sens. 2017, 11, 13. [Google Scholar] [CrossRef]
  35. Hu, Z.; Zhou, Q.; Chen, X.; Chen, D.; Li, J.; Guo, M.; Yin, G.; Duan, Z. Groundwater Depletion Estimated from GRACE: A Challenge of Sustainable Development in an Arid Region of Central Asia. Remote Sens. 2019, 11, 21. [Google Scholar] [CrossRef] [Green Version]
  36. Deus, D.; Gloaguen, R.; Krause, P. Water balance modelling in a semi-arid environment with limited in-situ data: Remote sensing coupled with satellite gravimetry, Lake Manyara, East African Rift, Tanzania. Hydrol. Earth Syst. Sci. Discuss. 2011, 8, 8737–8792. [Google Scholar] [CrossRef] [Green Version]
  37. Ahmed, M.; Sultan, M.; Wahr, J.; Yan, E. The use of GRACE data to monitor natural and anthropogenic induced variations in water availability across Africa. Earth Sci. Rev. 2014, 136, 289–300. [Google Scholar] [CrossRef]
  38. Jung, H.C.; Getirana, A.; Arsenault, K.R.; Kumar, S.; Maigary, I. Improving surface soil moisture estimates in West Africa through GRACE data assimilation. J. Hydrol. 2019, 575, 192–201. [Google Scholar] [CrossRef]
  39. Xie, X.; Xu, C.; Wen, Y.; Li, W. Monitoring Groundwater Storage Changes in the Loess Plateau Using GRACE Satellite Gravity Data, Hydrological Models and Coal Mining Data. Remote Sens. 2018, 10, 18. [Google Scholar] [CrossRef] [Green Version]
  40. Joseph, A. L’Aïr, « château d’eau » de la bande désertique des Ténérés (Niger). Rev. Géographie Alp. 1991, 79, 71–86. [Google Scholar] [CrossRef]
  41. Castellazzi, P.; Martel, R.; Rivera, A.; Huang, J.; Pavlic, G.; Calderhead, A.I.; Chaussard, E.; Garfias, J.; Salas, J. Groundwater depletion in Central Mexico: Use of GRACE and InSAR to support water resources management. Water Resour. Res. 2016, 52, 5985–6003. [Google Scholar] [CrossRef]
  42. Tapley, B.D.; Bettadpur, S.; Ries, J.C.; Thompson, P.F.; Watkins, M.M. GRACE Measurements of Mass Variability in the Earth System | Science. Sciences 2004, 305, 503–505. [Google Scholar] [CrossRef] [PubMed] [Green Version]
  43. Scanlon, B.R.; Zhang, Z.; Save, H.; Wiese, D.N.; Landerer, F.W.; Long, D.; Longuevergne, L.; Chen, J. Global evaluation of new GRACE mascon products for hydrologic applications: Global analysis of grace mascon products. Water Resour. Res. 2016, 52, 9412–9429. [Google Scholar] [CrossRef]
  44. Ouma, Y.O.; Aballa, D.O.; Marinda, D.O.; Tateishi, R.; Hahn, M. Use of GRACE time-variable data and GLDAS-LSM for estimating groundwater storage variability at small basin scales: A case study of the Nzoia River Basin. Int. J. Remote Sens. 2015, 36, 5707–5736. [Google Scholar] [CrossRef]
  45. Xiao, R.; He, X.; Zhang, Y.; Ferreira, V.G.; Chang, L. Monitoring Groundwater Variations from Satellite Gravimetry and Hydrological Models: A Comparison with in-situ Measurements in the Mid-Atlantic Region of the United States. Remote Sens. 2015, 7, 686. [Google Scholar] [CrossRef] [Green Version]
  46. Awange, J.L.; Gebremichael, M. Characterization of Ethiopian mega hydrogeological regimes using GRACE, TRMM, and GLDAS datasets. Adv. Water Resour. 2014, 74, 64–78. [Google Scholar] [CrossRef] [Green Version]
  47. Yang, P.; Chen, Y. An analysis of terrestrial water storage variations from GRACE and GLDAS: The Tianshan Mountains and its adjacent areas, central Asia. Quat. Int. 2015, 358, 106–112. [Google Scholar] [CrossRef]
  48. Purdy, A.J.; David, C.H.; Sikder, M.S.; Reager, J.T.; Chandanpurkar, H.A.; Jones, N.L.; Matin, M.A. An Open-Source Tool to Facilitate the Processing of GRACE Observations and GLDAS Outputs: An Evaluation in Bangladesh. Front. Environ. Sci. 2019, 7. [Google Scholar] [CrossRef]
  49. Wu, Q.; Si, B.; He, H.; Wu, P. Determining Regional-Scale Groundwater Recharge with GRACE and GLDAS. Remote Sens. 2019, 11, 154. [Google Scholar] [CrossRef] [Green Version]
  50. Sun, A.Y.; Green, R.; Rodell, M.; Swenson, S. Inferring aquifer storage parameters using satellite and in situ measurements: Estimation under uncertainty: Robust optimization using grace data. Geophys. Res. Lett. 2010, 37. [Google Scholar] [CrossRef] [Green Version]
  51. Wang, X.; De Linage, C.; Famiglietti, J.; Zender, C.S. Gravity Recovery and Climate Experiment (GRACE) detection of water storage changes in the Three Gorges Reservoir of China and comparison with in situ measurements: Grace detection of water storage changes in tgr. Water Resour. Res. 2011, 47, 47. [Google Scholar] [CrossRef]
  52. Bhanja, S.N.; Mukherjee, A. In situ and satellite-based estimates of usable groundwater storage across India: Implications for drinking water supply and food security. Adv. Water Resour. 2019, 126, 15–23. [Google Scholar] [CrossRef]
  53. Frappart, F.; Ramillien, G. Monitoring Groundwater Storage Changes Using the Gravity Recovery and Climate Experiment (GRACE) Satellite Mission: A Review. Remote Sens. 2018, 10, 829. [Google Scholar] [CrossRef] [Green Version]
  54. Rodell, M.; Chen, J.; Kato, H.; Famiglietti, J.S.; Nigro, J.; Wilson, C.R. Estimating groundwater storage changes in the Mississippi River basin (USA) using GRACE. Hydrogeol. J. 2007, 15, 159–166. [Google Scholar] [CrossRef] [Green Version]
  55. Tangdamrongsub, N.; Steele-Dunne, S.C.; Gunter, B.C.; Ditmar, P.G.; Sutanudjaja, E.H.; Sun, Y.; Xia, T.; Wang, Z. Improving estimates of water resources in a semi-arid region by assimilating GRACE data into the PCR-GLOBWB hydrological model. Hydrol. Earth Syst. Sci. 2017, 21, 2053–2074. [Google Scholar] [CrossRef] [Green Version]
  56. Wang, S.; Liu, H.; Yu, Y.; Zhao, W.; Yang, Q.; Liu, J. Evaluation of groundwater sustainability in the arid Hexi Corridor of Northwestern China, using GRACE, GLDAS and measured groundwater data products. Sci. Total Environ. 2020, 705, 135829. [Google Scholar] [CrossRef] [PubMed]
  57. Bonsor, H.C.; Shamsudduha, M.; Marchant, B.P.; MacDonald, A.M.; Taylor, R.G. Seasonal and Decadal Groundwater Changes in African Sedimentary Aquifers Estimated Using GRACE Products and LSMs. Remote Sens. 2018, 10, 904. [Google Scholar] [CrossRef] [Green Version]
  58. Hasan, E.; Tarhule, A.; Hong, Y.; Moore, B. Assessment of Physical Water Scarcity in Africa Using GRACE and TRMM Satellite Data. Remote Sens. 2019, 11, 904. [Google Scholar] [CrossRef] [Green Version]
  59. Werth, S.; White, D.; Bliss, D.W. GRACE Detected Rise of Groundwater in the Sahelian Niger River Basin. J. Geophys. Res. Solid Earth 2020, 122, 10459–10477. [Google Scholar] [CrossRef]
  60. Leduc, C.; Favreau, G.; Schroeter, P. Long-term rise in a Sahelian water-table: The Continental Terminal in South-West Niger. J. Hydrol. 2001, 243, 43–54. [Google Scholar] [CrossRef] [Green Version]
  61. Conway, D.; Persechino, A.; Ardoin-Bardin, S.; Hamandawana, H.; Dieulin, C.; Mahé, G. Rainfall and Water Resources Variability in Sub-Saharan Africa during the Twentieth Century. J. Hydrometeorol. 2009, 10, 41–59. [Google Scholar] [CrossRef]
  62. Edmunds, W.M.; Gaye, C.B. Estimating the spatial variability of groundwater recharge in the Sahel using chloride. J. Hydrol. 1994, 156, 47–59. [Google Scholar] [CrossRef]
  63. Henry, C.M.; Allen, D.M.; Huang, J. Groundwater storage variability and annual recharge using well-hydrograph and GRACE satellite data. Hydrogeol. J. 2011, 19, 741–755. [Google Scholar] [CrossRef]
  64. Mohamed, A.; Sultan, M.; Ahmed, M.; Yan, E. Quantifying Modern Recharge to the Nubian Sandstone Aquifer System: Inferences from GRACE and Land Surface Models. In American Geophysical Union, Fall Meeting; Moscone Center: San Francisco, CA, USA, 2014; p. G23A-0465. [Google Scholar]
  65. Chinnasamy, P.; Maheshwari, B.; Prathapar, S. Understanding Groundwater Storage Changes and Recharge in Rajasthan, India through Remote Sensing. Water 2015, 7, 5547. [Google Scholar] [CrossRef] [Green Version]
  66. Chatterjee, R.S.; Pranjal, P.; Jally, J.; Kumar, B.; Dadhwal, V.K.; Srivastav, S.K.; Kumar, D. Potential groundwater recharge in north-western India vs spaceborne GRACE gravity anomaly based monsoonal groundwater storage change for evaluation of groundwater potential and sustainability. Groundw. Sustain. Dev. 2020, 10, 10. [Google Scholar] [CrossRef]
  67. Kolusu, S.R.; Shamsudduha, M.; Todd, M.C.; Taylor, R.G.; Seddon, D.; Kashaigili, J.J.; Ebrahim, G.Y.; Cuthbert, M.O.; Sorensen, J.P.R.; Villholth, K.G.; et al. The El Niño event of 2015–2016: Climate anomalies and their impact on groundwater resources in East and Southern Africa. Hydrol. Earth Syst. Sci. 2019, 23, 1751–1762. [Google Scholar] [CrossRef] [Green Version]
  68. Hassane, A.B.; Leduc, C.; Favreau, G.; Bekins, B.A.; Margueron, T. Impacts of a large Sahelian city on groundwater hydrodynamics and quality: Example of Niamey (Niger). Hydrogeol. J. 2016, 24, 407–423. [Google Scholar] [CrossRef]
  69. Favreau, G.; Cappelaere, B.; Massuel, S.; Leblanc, M.; Boucher, M.; Boulain, N.; Leduc, C. Land clearing, climate variability, and water resources increase in semiarid southwest Niger: A review. Water Resour. Res. 2009, 45. [Google Scholar] [CrossRef] [Green Version]
  70. Karmakar, H.; Das, P.K. Impact of Mining on Ground and Surface Waters. In Proceedings of the 4th International Mineral Water Association Congress, Ljulbjana, Slovenia, September 1991; pp. 187–198. [Google Scholar]
  71. Zou, F.; Tenzer, R.; Jin, S. Water Storage Variations in Tibet from GRACE, ICESat, and Hydrological Data. Remote Sens. 2019, 11, 1103. [Google Scholar] [CrossRef] [Green Version]
  72. Chen, H.; Zhang, W.; Nie, N.; Guo, Y. Long-term groundwater storage variations estimated in the Songhua River Basin by using GRACE products, land surface models, and in-situ observations. Sci. Total Environ. 2019, 649, 372–387. [Google Scholar] [CrossRef] [PubMed]
Figure 1. Location of the study area within the west African context (a). Distribution of the mining areas (U, uranium; C, coal), including the Arlit mining area within it; the elevations in this area are color-coded (b). The geological setting of the Arlit region and the spatial repartition of the monitoring wells are presented (c). A hydrogeological cross-section of the Tarat aquifer is presented with the groundwater heads measured in December 2019 (d).
Water 13 01685 g001
Figure 2. (a) Monthly precipitation and in TWSC, GWSC, and, SWC in the TMB and (b) GRACE data uncertainty band.
Water 13 01685 g002
Figure 3. Variability of rainfall patterns from 1960 to 2019.
Water 13 01685 g003
Figure 4. GWSC from monitoring wells in the Arlit mining area.
Water 13 01685 g004
Figure 5. Water level contour maps, measured in (a) December 1977, (b) December 1999, and (c) December 2019, showing the dynamic of depression cones evolution in the study area.
Water 13 01685 g005aWater 13 01685 g005b
Figure 6. Spatiotemporal drawdown of Tarat water table from (a) 1977 to 1979, (b) 1977 to 1989, (c) 1977 to 1999, and (d) 1977 to 2009.
Water 13 01685 g006
Figure 7. Hydrographs for selected piezometers. See Figure 5 for the piezometers’ location.
Water 13 01685 g007
Figure 8. Annual distributions of water storage variations in terms of equivalent water thickness (cm) and precipitation (cm) on the TMB by the means of monthly averages from August 2002 to December 2019.
Water 13 01685 g008
Table 1. Trends of TWSC, SWC, and GWSC.
Variables04/2002–12/200701/2008–12/201301/2014–12/201904/2002–12/2019
TWSC-trend0.22−0.30−0.3597−0.1235
SWC-trend0.0080−0.00180.01460.0069
GWSC-trend0.23−0.29−0.3998−0.1310
Publisher’s Note: MDPI stays neutral with regard to jurisdictional claims in published maps and institutional affiliations.

