Abstract
The key contribution of this paper is to embed the analysis of the network in a framework based on a mapping from the input space whose elements are nodes of a graph or the entire graph into an information space whose elements are probability distributions associated to objects in the input space. Specifically, a node is associated to the probability distribution of its node-to-node distances and the whole graph to the aggregation of these node distributions. In this space two distances are proposed for this analysis: Jensen-Shannon and Wasserstein, based respectively on information theory and optimal transport theory. This representation allows to compute the distance between the original network and the one obtained by the removal of nodes or edges and use this distance as an index of the increase in vulnerability induced by the removal. In this way a new characterization of vulnerability is obtained. This new index has been tested in two real-world water distribution networks. The results obtained are discussed along those which relate vulnerability to the loss of efficiency and those given by the analysis of the spectra of the adjacency and Laplacian matrices of the network. The models and algorithms considered in this paper have been integrated into an analytics framework which can also support the analysis of other networked infrastructures among which power grids, gas distribution, and transit networks are included.
1. Introduction
1.1. Overview and Motivation
The main motivation of this paper is two-fold. The first is theoretical, meaning the introduction of a “rich” representation of a graph underlying a water distribution network as an element in a space of probability distributions. This space can be endowed with different distance measures which allow the computation of a new index of the dissimilarity between networks. The second is to show that the vulnerability index derived from this representation can offer additional insights to those derived from the loss of efficiency and the eigenvalue analysis of the adjacency and Laplacian matrices.
Indeed, the availability of new vulnerability measures is important in the analysis of networked infrastructures, as water, energy, and transport, which have developed similar functional and structural features in their evolution over time: spatial, but also financial, constraints have significantly restricted their connectivity, robustness, and their capability to deliver their service with failed or damaged components, in short, their robustness. The above constraints have also generated systemic risk and cascading effects exacerbated by the complexity of the infrastructure with a large number of components: pipes, valves, pumping stations, tanks and consumption points in the case of water distribution networks; generation structures, switching substations and high voltage connections in power grids and pipes, pumping and switching stations, storage facilities and refineries for other distribution networks, like gas and oil.
Both robustness and resilience describe the capability of the network to withstand failures and perturbations in its components and keep delivering services regardless of disruptive events, either random or malicious, as, in a Water Distribution Network (WDN), failures in pumping stations or valves, and severe bursts in the main pipes.
Resilience, robustness, reliability, and vulnerability are terms strictly linked and often confusingly used. Ref. [1] gives a comprehensive analysis of the different contexts in which the above terms are used.
The term resilience is more common in the literature about engineered network infrastructures and it often takes a more general meaning that vulnerability, also implying the capacity of the network to bounce back, to regain a new stable position close to the original state after perturbations and adapt to the new situation [2]. Reliability is linked to the concept of risk which implies the use of a measure of the probability that the network will keep working under certain circumstances.
The structure and functions of the network rely on the existence of paths between pairs of nodes: the failure of components is simulated by the removal from the network of the corresponding nodes/edges. When nodes and/or links are removed, the length of such paths will increase and eventually some couples of nodes will become disconnected.
One relevant question is this: which are the critical components (i.e., nodes/edges) whose failure impairs the functioning of the network and how much does this failure impact the ensuing increase in vulnerability?
In this paper, the drop in the network robustness is measured by the increase in vulnerability of the perturbed network with respect to the original one. This first analysis of vulnerability is carried out by using different measures of the connectivity of the graph as they are expressed by centrality indices.
According to a widely used metric [3], an increase in vulnerability is the loss of efficiency as a consequence of the failure of a set of nodes/edges and their removal from the network.
Another analysis can be carried out using spectral graph theory. The use of spectral methods in networks and graph theory has a long tradition [4,5].
Algebraic connectivity was introduced in [6]. The larger the algebraic connectivity is, the more difficult it is to cut the network into disconnected components.
The key argument in this paper is that beside the vulnerability measures based on centrality indices, average value of node–node distances, and spectral analysis, new insights could be obtained through an additional analysis based on the node-to-node distance distributions aggregated at network level and the computation of their distance. The advantage of these measures is that they enable the comparison between probability distributions taking into account not only the average values, but all the information presented by the distributions.
There are many distance measures between distributions. Two such measures are considered in this paper: the Jensen-Shannon (JS) divergence, based on Kullback-Leibler (KL) divergence, and the Wasserstein (WST) distance.
Distances between distributions are an important tool in machine learning. Entropy- based distances like KL and JS are the most widely used [7]. Recently the WST distance, which is based on optimal transport theory, gained increasing importance due to its properties mainly in natural language processing [8] and imaging [9].
The Wasserstein distance has a strong mathematical basis [10], can be adapted to different situations and offers a smooth and naturally interpretable distance, in particular between discrete distributions.
This paper is of interest to the water research community because it offers a vulnerability measure which can be used along other measures and give additional insight into the structural features of the network. It can be also of interest to the machine learning community in offering an important specific instance of a distributional graph representation suitable for learning.
1.2. Related Works
The related concepts of vulnerability, robustness, and resilience in WDN have spawned a line of research originated by [11] using graph theoretic and complex network principles; the paper argues that reliability in the water distribution network is largely defined by the network layout and reports the results of extensive computational studies for four benchmark networks examining two important topological features, robustness, and path redundancy. In the same paper are also studied the cumulative distributions of the edge lengths and geodesic distance. It also hints at the issue of how much the WDN structure deviates from a “small world” network, indicating as a possible cause of deviation the near-planarity of the network.
Papers [12,13] use the network and spectral approach in [11] jointly with clustering techniques and hydraulic simulation.
The approach in [14], also a graph theoretic, is based on analyzing the K-shortest paths between each demand node and water sources, where paths are weighted by the hydraulic attributes of the supply routes and propose a resilience index based on a surrogate measure of the energy loss associated to each path.
More recently [15] proposed a hydraulically informed measure of criticality called water flow edge betweenness centrality.
An alternative approach is termed flow entropy [16] which measures the strength of supply to a node in terms of the number of connections and their similarity.
The demand-adjusted entropic degree in [17] is another approach that uses demand on nodes and volume capacity to compute a weighted entropic degree.
Spectral analysis has been also used for WDNs [18,19,20], which propose a graph theoretic framework for assessing the resilience in sectorized WDN.
Ref. [21] also focuses on graph spectral techniques and proposes a novel tool set adapted to improve main water management tasks. The key point is to show how spectral metrics and algorithms support critical tasks of WDN management by just using topological and geometric information. Spectral analysis also helps for the efficient and automatic definition of district metered areas and to facilitate the localization of water losses through the definition of an optimal network partitioning.
More recently [22] proposed a metric based on robustness and redundancy to evaluate resilience along with an optimization framework. A basic recent reference is [23].
A related line of research is carried out by [24], which proposes a graph-based analysis, including hydraulic simulation, in order to estimate the energy balance components, which has been tested on 20 real networks. [25] and [26] discriminate between different water consumption in order to detect abnormal events (e.g., leaks, illegal use, and metering inaccuracy).
Ref. [27] is a wide survey of quantitative resilience methods of WDNs including network-based approaches. [28] extends this analysis to multiscale resilience in water distribution and drainage systems.
1.3. The Contributions of This Paper
The main contribution of this paper is to propose a novel vulnerability measure which can be used along other measures in order to give additional insight into the structural features of the network.
This result is based on the introduction of a mapping from an “input” space where the elements are graphs or graph elements like nodes or edges to a probabilistic space whose elements are probability distributions associated to elements in the input space. The use of a probabilistic distance—Wasserstein distance in particular—between elements in the probabilistic space, can be specialized to discrete distributions and particularly histograms.
Histograms are suitable to represent node-to-node distance distributions in the graph model of the WDN. This allows the introduction of a new set of vulnerability metrics given by the distance between the probability distributions of node-node distances between the original network and that resulting from the removal of nodes/edges.
Two such probabilistic measures have been analyzed: Jensen-Shannon (JS), based on information theory, and the Wasserstein (WST) distance, an instance of optimal transport. The computational results confirm that the value of the distances JS and WST is strongly related to the criticality of the removed edges.
There are two major advantages of the Wasserstein distance: the first is that JS might become undefined in many situations while WST distances are generally well defined and provide an interpretable distance metric between distributions.
The second is that, under quite general conditions, the WST distance is a differentiable function of the parameters of the distributions which makes possible its use to assess the sensitivity of the network robustness to distributional perturbations.
A general methodological scheme is proposed connecting different modelling and computational elements, concepts, and analysis tools; it enables an analysis framework suitable for assessing robustness also of other networked infrastructure like energy, gas, and transport.
This framework has been designed, implemented, and tested on two real-life urban networks; it can support decision-making both at the design stage, to simulate alternative network layouts of different robustness, and at the operational stage where it is necessary to make a decision about which nodes/edges are to be temporarily removed for maintenance and rehabilitation.
1.4. Organization of the Paper
The structure of this paper is as follows: Section 2 gives background notions on graph models and network analysis; Section 3 contains background material on the spectral analysis, including spectral clustering, and the measures of vulnerability based on the notion of efficiency. Section 4 introduces the new methodology based on probabilistic measures of distance between networks. Section 5 describes the different WDNs used in this study, the computational results, and their discussion. Section 6 describes the modeling and algorithmic structure of the analysis framework proposed. Finally, Section 7 contains some conclusions and perspectives.
2. Mathematical Background
Graph theory is the mathematical basis to provide a unifying language for the study of networks. With this in mind, it is useful to give some basic definitions which will be used in the sequel. For a wide-ranging analysis of the role of graph theory in the analysis of networks the reader is advised to look at [29].
2.1. Graph Theory
Let us denote a graph with , where V is the set of nodes and E is the set of edges. Each edge of G is represented by a pair of nodes with , and and with and . If and are called adjacent nodes. A graph is undirected if and represent the same edge. A graph is simple if no self-loops are admitted (edges starting from a node and ending on the same node) and only one edge can exist between each pair of nodes , with . The adjacency relationship between the nodes of can be represented through a non-negative matrix (i.e., the adjacency matrix of ). The entry of the adjacency matrix is 1 if and are adjacent nodes (i.e., ), and 0 otherwise. Furthermore, if is undirected and (entries on the diagonal) are 0 if is simple.
- The degree of the node i, is the number of edges having i as one of the two nodes on the edge: . Any of the edges having i as one of its nodes is called incident on i.
- When G is directed, meaning that the order of the two nodes of an edge is relevant for its definition, the can be split into out-degree (number of edges having i as first node) and in-degree (number of edges having i as second node).
- A path in a graph is a sequence of nodes connected by edges and the length of the path is the number of edges. A connected component is a maximal subgraph when all nodes can be reached from every other.
- The shortest path between and is the path with the smallest length. This length is called the distance between and . The largest distance among each possible pair of nodes in is named diameter .
- The characteristic path length is the average distance for every possible pair of nodes .
A useful representation is to arrange the distances in the distance matrix .
The maximum entry of row is also known as the eccentricity of node .
The maximum eccentricity among the nodes is equal to .
- A subgraph of is a graph such that and ; a connected component of is maximal if is the largest possible subgraph for which you could not find another node in the graph that could be added to the graph with all the nodes be still connected.
The core concept is centrality which addresses the question “which are the most important nodes in a network?”. There are many centrality measures from the simplest like node degree, which can anyway be illuminating, to eigenvector-based measures like Page Rank.
2.2. Network Analysis: The Basic Measures
The density of the network is the fraction of edges which are present in the network:
The number of edges .
If is the mean node degree, and we get and .
The density is in the range .
A cut-set, specifically a node cut-set, is a set of nodes whose removal disconnects and . A minimum cut-set is the smallest cut-set, analogously for edge cut-set.
The centrality measures address the issue of the relative importance of nodes/edges. The most widely used measures are:
- Closeness centrality : is based on the mean distance from to averaged on all nodes.
- Betweenness centrality: let be if node lies on the shortest path from to and 0 otherwise. Then, betweenness centrality is given by It measures the extent to which a node lies on the paths between other nodes. An edge betweenness that counts the number of shorter paths that run along the edge can be similarly defined.
- Link-per-node ratio (e), as the number of edges of a graph with respect to the number of its nodes. .
- Central point dominance, based on betweenness centrality is a measure for characterizing the organization of a network according to its path-related connectivity; where is the betweenness centrality of the node and is the maximum value of betweenness centrality over all the nodes of the network.
- The clustering coefficient (CC) is the number of triangles with respect to the overall number of possible connected triples, where a triple consists of three nodes connected at least by two edges while a triangle consists of three nodes connected exactly by three edges:
There are other definitions of CC for which the reader is addressed to [29]. To compute the centrality indices in this paper, the open-source software Cytoscape has been adopted [30]. This point will be further discussed in Section 3.
3. Background on Vulnerability and Spectral Analysis
This section introduces background notions about the analysis of the graph eigen structure and how it is exploited to compute connectivity-based vulnerability measures.
3.1. Vulnerability Analysis Based on Efficiency
The performance of the network is often evaluated as the change of the efficiency, as defined in [3]:
where the represent the distance between and . Normalization by ensures that , in case of unweighted graph. The maximum value , is assumed if and only if the graph is complete.
A way to measure the vulnerability of the network is using the loss of efficiency [3,31] observed when some nodes/edges are removed. The relative drop in the network efficiency (loss of efficiency) caused by the removal of a node from the graph is defined as
where denotes the network without the node and is called the loss of efficiency of . The maximum and the mean loss, over all the nodes, are given by:
Analogous formulas can be written removing the edges.
Another useful reference for the analysis and generalization of efficiency measures is [31].
3.2. Spectral Analysis
Spectral graph theory studies the eigenvalues of matrices that embody the graph structure. One of the main objectives in spectral graph theory is to deduce structural characteristics of a graph from such eigenvalue spectra.
In case of undirected graphs, the adjacency matrix is symmetric and all its eigenvalues are real. The eigenvalues … of are called the spectrum of G. The largest eigenvalue of the adjacency matrix is called spectral radius of G and is denoted by . An important property is given by the following inequality [32] where that relates the spectral radius with the maximum degree of the nodes.
The spectrum of A(G) allows to define the Eigenvector centrality of the node , is . Katz centrality and Page Rank algorithm are just parametrized version of eigenvector centrality [29].
The difference between the spectral radius of and the second largest eigenvalue of the adjacency matrix is called the spectral gap of G [33]. A small value of is usually observed through low connectivity, and the presence of bottlenecks and bridges whose removal cuts the graph into disconnected parts. A spectral distance between two networks has been proposed in [34] as the sum of the absolute differences of the eigenvalues of the adjacency matrix.
The Laplacian matrix of is an matrix , where . The matrix is positive semi-definite in case of simple graphs. The eigenvalues of are called the Laplacian eigenvalues of G. The Laplacian eigenvalues are all real and nonnegative. The smallest eigenvalue is always equal to 0 with multiplicity equal to the number of connected components of . The second smallest eigenvalue is called the algebraic connectivity of which is one of the most widely used measures of connectivity. Larger values ) represent higher robustness against efforts to disconnect the graph, so the larger it is, the more difficult it is to cut a graph into independent components. An important inequality for the algebraic connectivity [6] is:
that relates it with the minimum degree of the nodes . In case of a connected graph, also the following inequality can be proved [35]
that relates the algebraic connectivity with the diameter of the graph.
Another spectral distance is based on the analysis of the eigenvectors of the Laplacian [4].
3.3. Graph Clustering
Given two disjointed subsets of , , and , an n-dimensional vector i.e., is used to represent the association of each node to cluster or
The graph clustering problem can be formulated as the minimization of the following function :
where are the entries of the Laplacian matrix.
The important feature of spectral clustering methods is that they produce a set of balanced clusters. An elegant solution, conceptually simple but computationally inefficient, to the problem was proposed in [6] which identified the eigenvector corresponding to (usually known as the Fiedler vector) as the vector z which provides the optimal bi-partitioning of the graph.
An effective computational scheme, proposed in [36], uses a data representation in the lower dimensional space spanned by the most relevant eigenvectors and has spawned many new methods analyzed in [37].
The basic steps are:
- Construct an affinity matrix S(G) = I + A(G) whose eigenvalues are the same as .
- Construct the matrix where , where is the degree of node .
- Compute the eigenvalues of and the eigenvectors corresponding to the largest eigenvalues of and denote them by .
- Build the matrix such that the k-th column of is and normalize the rows such that each row has unit length.
- Treating the rows as points in the K-dimensional space and perform -means clustering of these points in clusters.
The implementation of this method is given in the plugin ClusterMaker2 of Cytoscape.
The main option is to set K manually either before the clustering process or after the eigenvalue calculation.
ClusterMaker2 offers an option to select the number of clusters automatically evaluating the eigenvalues , of . K is the smallest integer such that the ratio is larger than .
The parameter can be tuned; smaller values imply a few larger clusters while larger values generate more fine-grained clusters.
3.4. Vulnerability Analysis Using Spectral Analysis
There is no specific formula, contrary to those reported in the previous subsections, linking spectral analysis to a measure of vulnerability related to the removal of a node. However, both algebraic connectivity the second smallest eigenvalue of the Laplacian and spectral gap , the difference between the spectral radius of and the second eigenvalue of the adjacency matrix , are indicators of the difficulty of splitting the graph. The larger the algebraic connectivity, the more difficult it is to disconnect the graph. It is also related to the min-cut problem in spectral clustering [26]. A large value of the spectral gap, together with a uniform degree distribution, results in higher robustness against node and link failures. The larger the spectral gap the more robust is the network.
4. Probabilistic Measure of Distance between Networks
The measures introduced in Section 3 are based on distances and their average values. In this section a new analysis is performed in terms of node–node discrete distance distributions whose values are the fraction of nodes which are connected to at a distance with each node of the graph .
The distance distribution over the whole graph is given by
Two graphs and are considered with their distributions and that will be referred to as and .
In order to give an instance of the computation of the node-to-node distributions, a small synthetic water distribution network, Anytown (Figure 1), is considered [38]. The associated graph consists of 25 nodes and 44 edges. is the graph without the red edge.
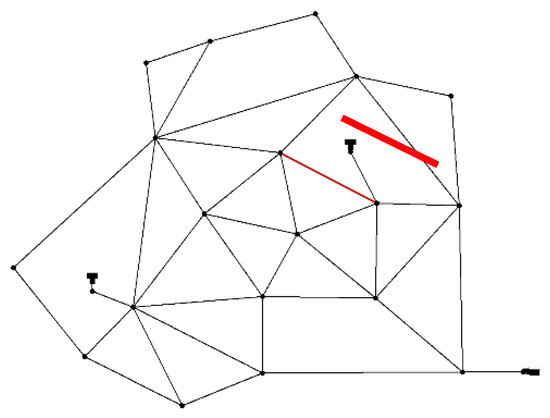
Figure 1.
Anytown (two tanks and one pumping station).
The support of and are respectively the integers (analougsly for ). When is derived from removing some edges then Since the distributions are represented by histograms (Figure 2) one can extend to the support of setting for .
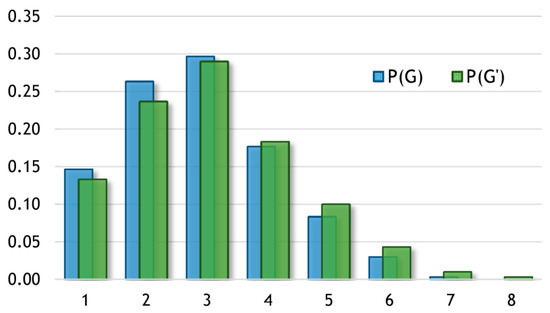
Figure 2.
Node–node distance distributions.
In order to compare two probability distributions one can use many distance and divergence measures [28].
In this paper the following distances are considered:
- The Kullback-Leibler (KL) divergence:
- The Jensen-Shannon (JS) divergence
Information-theoretic measures like KL and JS might become undefined if the compared distributions do not have identical support.
- The Wasserstein distance is:where denotes the set of all joint distributions whose marginals are respectively and . The Wasserstein distance is also called the Earth Mover (EM) distance. Intuitively, indicates how much mass must be transported from to in order to transform the distributions into the distribution . The Earth Mover’s distance is the minimum energy cost of moving and transforming a pile of sand in the shape of p to the shape of p’. The cost is quantified by the amount of sand moved times the moving distance.
The EM distance then is the cost of the optimal transport plan.
Generally, can be by generalized by an index q to become
Let’s now consider the case of 2 discrete distributions f(x) and g(x):
where and is the Kronecker delta.
The unit cost of transport between and is defined as the q-th power of the Euclidean distance . The transport plan represents the mass transported from to .
The WST distance between discrete distributions and is:
The constraints above ensure that the total mass transported from and the total mass to matches respectively and .
There are some particular cases, very relevant in applications, where WST can be written in an explicit form. Let and be the cumulative distribution for one-dimensional distributions and on the real line and and be their quantile functions. Then
In the case of water distribution networks, the distributions of node–node distances are discrete and 1-dimensional with the same number of samples, and the computation of WST reduces to the comparison of two 1-dimensional histograms which can be performed by a simple sorting and the application of Formula (22).
where and are the sorted samples. In this paper, .
A key advantage of EM over JS is its differentiability with respect to distribution parameters, as shown by the following example.
Let us consider the uniform distribution on the unit interval. Let be the distribution of (0 on the x-axis and the random variable on the axis and .
- if and 0 if .
- if and 0 if .
- if and 0 if .
Therefore, Wasserstein provides a smooth measure which is useful for any optimization and learning process using gradient descent [39].
The Wasserstein distance can be traced back to the works of Gaspard Monge [40] and Lev Kantorovich [41].
Recently it has also been used in the generation of adversarial networks [42]. Important references are [10,43] which also give an up-to-date survey of numerical methods.
Wasserstein distances are generally well defined and provide an interpretable distance metric between distributions. Computing Wasserstein distances requires in general the solution of a constrained linear optimization problem which has, when the support of the probability distributions is multidimensional, a very large number of variables and constraints.
The square root of the Jensen-Shannon divergence is a metric ().
The software used is the Wasserstein function from the python library SciPy.
5. Experimental Setting
5.1. The Network Models
In this section, two WDNs are analyzed.
- Neptun is the WDN of the Romanian city of Timisoara (Figure 4), with an associated graph of 333 nodes and 339 edges, analyzed in the European project Icewater [44].
- Abbiategrasso refers to a pressure management zone in Milan (namely, Abbiategrasso) with an associated graph consisting of 1213 nodes and 1391 edges, analyzed in the European project Icewater [44].
In analyzing WDNs one must consider that most of the end-users are supplied by single connections. To avoid a bias in the analysis, a preliminary preprocessing has been performed by cutting the final connections.
5.2. Clustering
Graph clustering approaches, such as Spectral Clustering, can be used to identify the specific edges (pipes) whose removal may induce a disconnection of the network. In this paper, Spectral Clustering has been performed (through Cytoscape’s plug-in named ClusterMaker2) to identify sub-networks connected by a limited (minimal) number of edges, that are pipes whose breakage implies the disconnection of some WDN portion. The number of clusters K is set according to context information about the districtualization adopted by the water utility. In the following figures these pipes are highlighted; it is important to note that breakages must occur, at the same time, on all the different red edges to imply a hydraulic disconnection. Breakages affecting only one pipe may imply a reduction in the efficiency of the network and an increase in vulnerability.
5.3. Computational Results over the Networks
5.3.1. Neptun
Table 1 exhibits the basic measures of Neptun (Figure 3). It is evident that WDNs have specific features: the density is very low and correspondingly the link/node ratio is close to one.

Table 1.
Topological measures.
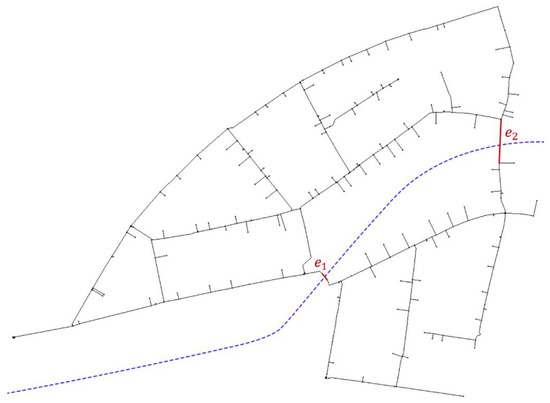
Figure 3.
Critical edges (red) highlight a cut-set in Neptun consisting of 2 edges (bridges) whose simultaneous removal generates a disconnection.
Table 2 exhibits the efficiency-related measures as defined in Section 3.1 by Equations (4), (6), and (7) and the algebraic connectivity defined in Section 3.2.
Table 2.
Vulnerability measures.
Table 3 exhibits the probabilistic distances and loss of efficiency. By Jensen-Shannon we mean the distance . Wasserstein is the distance . Loss of efficiency is defined by Equation (5) in Section 3.1.
Table 3.
Probabilistic distances vs. loss of efficiency.
5.3.2. Abbiategrasso
Table 4 exhibits the basic measures of Abbiategrasso (Figure 4). It is evident that WDNs have specific features: the density is very low and correspondingly the link/node ratio is close to one.
Table 4.
Topological measures.
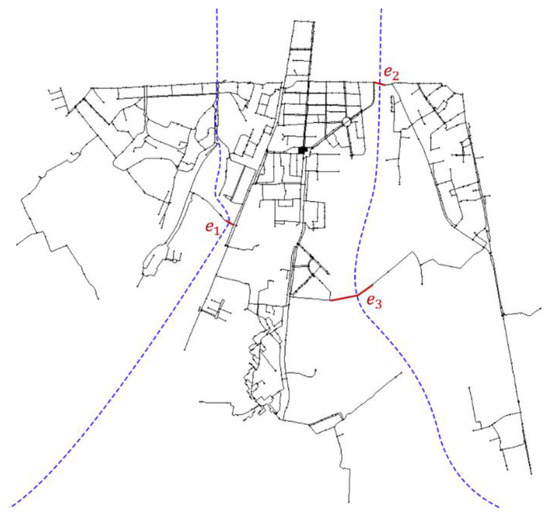
Figure 4.
Critical edges (red) highlight a cut-set in Abbiategrasso consisting of 3 edges (bridges) whose simultaneous removal generates a disconnection.
Table 5 exhibits the efficiency-related measures as defined in Section 3.1 by Equations (4), (6), and (7) and the algebraic connectivity defined in Section 3.2.
Table 5.
Vulnerability measures.
Table 6 exhibits the probabilistic distances and loss of efficiency. By Jensen-Shannon we mean the distance . Wasserstein is the distance . Loss of efficiency is defined by Equation (5) in Section 3.1.
Table 6.
Probabilistic distances vs. loss of efficiency.
5.4. Discussion of the Computational Results
WDN have their own specific features: the two real-world WDNs analyzed are very sparse (with density lower or equal to 0.006). In particular, their degree distribution does not follow a power law and their connectivity measures, given in Table 1 and Table 5 respectively for Neptun and Abbiategrasso, really set them apart from other kinds of networks like transportation, communications, and social. The near-planarity of WDNs, as suggested in [11], might be the reason behind this deviation. Indeed, WDNs are sparse near-planar graphs whose structure is the result of urban growth and unplanned expansion.
The computational results show that probabilistic distance measures have a good capacity to discriminate between different networks not only globally but also edge-wise.
They can support critical tasks of WDN management by just using topological and geometric information.
This remarkable result is displayed in Figure 5 and Figure 6 respectively for Neptun and Abbiategrasso. Given the graph associated to the network, each edge is represented by a pair of adjacent nodes . The removal of yields for which we compute the aggregate node–node distance distribution and the Wasserstein distance , whose value is represented by the the color associated to each edge by the Wasserstein distance.
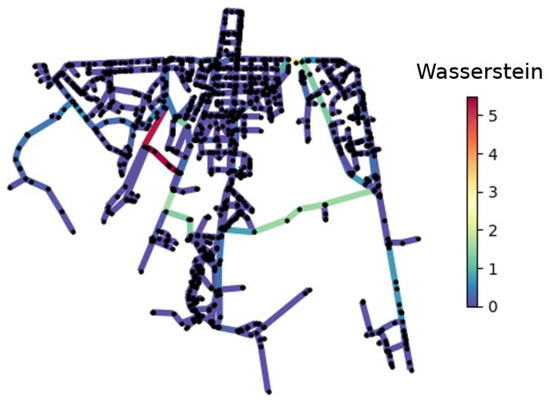
Figure 5.
Heatmap of the Wasserstein distance for all edges in Abbiategrasso.
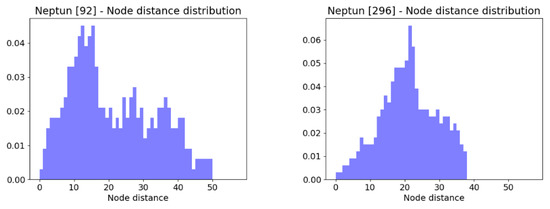
Figure 6.
The node-to-node distance distribution of node 92 (left) (mean = 20.74, std = 12.18) and node 296 (right) (mean = 20.72, std = 8.19).
The graphs in Neptun (Table 3) and G′′′′ in Abbiategrasso (Table 5) are disconnected and they have not been represented in the Figure 5 and Figure 7.
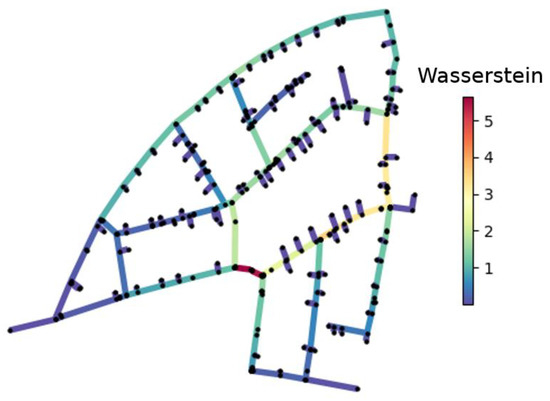
Figure 7.
Heatmap of the Wasserstein distance for all edges in Neptun.
The Wasserstein metric can be regarded as a natural extension of the Euclidean distance to statistical distributions via a single metric while still exploiting all the information present in the distributions. An instance in which the node-to-node distribution carries information not captured by the mean is given in Figure 6.
6. The Analysis Framework
The following schema in Figure 8 summarizes the proposed analytical framework, and how network theory measures, graph clustering, and probabilistic distance measures are combined with the aim to (i) identify critical links (i.e., WDN’s pipes) and (ii) quantify the impact implied by their individual removal (i.e., pipe breakage) in terms of loss of efficiency and distance between the original and induced graph (i.e., structural difference between the original WDN and the damaged one). As the main result, this supports the water utility in defining a preventive rehabilitation plan to improve WDN’s robustness, targeting the most relevant WDN components, under budget constraints. All the different elements, concepts, and tools are connected among them to create an analysis framework which has been tested not only on synthetic networks, but on two real-life urban networks.
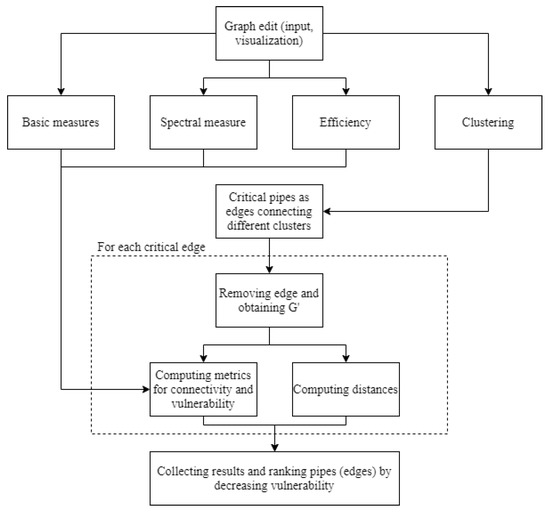
Figure 8.
Analysis framework.
- This analysis framework supports decision-making at the design stage to simulate alternative network layouts of different robustness and also at operational stage where the decision to be taken can be, which nodes/edges are to be temporarily removed for maintenance and rehabilitation. The differentiability of the Wasserstein distance is important to assess the sensitivity of the network robustness.
- The main findings in this paper as well as the modeling and algorithmic framework platform developed can be straightforwardly translated to many networked infrastructures among which power grids, transit networks and also global supply chains whose vulnerability has been exposed in the recent COVID crisis.
According to the schema, as a first step, all the relevant network metrics are computed on the graph G associated with WDN. Then, Spectral Clustering is performed to identify the links whose removal leads to a disconnection of the graph. Iteratively, each one of these critical links is removed from G leading to a graph G′. Both network measures for G′ and distance between G and G′ are computed and collected to rank the critical links with respect to the impact of their removal from G, in terms of loss of efficiency and distance.
It is important to remark that, for the purposes of this study, the analysis has been performed by considering all the edges of G, to empirically prove that the critical ones are actually those whose removal imply the highest loss of efficiency and distance value.
7. Conclusions
Topological network techniques offer significant answers regarding the structure and functions of WDNs. As remarked in [11] “a realistic assessment of the network structure, efficiency or vulnerability should avoid attempting an exclusive characterization of network structure of using only single (or even a few) network measurements as ultimate indicators.” The goal of this paper is to add to the already existing measures another characterization of the network robustness.
The main conclusions from the results reported in this paper can be synthetized as follows:
- The main result of this paper is that probabilistic measures based on the probability distribution of node–node distances, yield a distance between the original network and that resulting from the removal, which can provide a set of new indicators of the increase in vulnerability.
- The first such measure is given by the Jensen-Shannon divergence, based on Kullback-Leibler divergence; the second is the Wasserstein-1 (also called the “Earth-Mover”) distance, an instance of optimal transport. The computational results confirm that the value of the distances JS and WST is strongly related to the criticality of the removed edges.The key advantage of the Wasserstein distance is that is generally well defined and provides an interpretable distance metric between distributions. Moreover, under quite general conditions, it is a differentiable function of the parameters of the distributions. The differentiability of the Wasserstein distance is important to assess the sensitivity of the network robustness.
- All the different elements, concepts, and tools are connected among them to create an analysis framework which has been tested not only on synthetic networks, but on two real-life urban networks.
- This analysis framework supports decision-making at the design stage to simulate alternative network layouts of different robustness and also at the operational stage where it should be decided which nodes/edges are to be temporarily removed for maintenance and rehabilitation. Indeed, critical tasks of WDN management can be supported by just using topological and geometric information.
Author Contributions
All authors contributed equally to the paper. All authors have read and agreed to the published version of the manuscript.
Funding
This study has been partially supported by the Italian project “PERFORM-WATER 2030”—programma POR (Programma Operativo Regionale) FESR (Fondo Europeo di Sviluppo Regionale) 2014–2020, innovation call “Accordi per la Ricerca e l’Innovazione” (“Agreements for Research and Innovation”) of Regione Lombardia, (DGR N. 5245/2016—AZIONE I.1.B.1.3—ASSE I POR FESR 2014–2020)—CUP E46D17000120009.
Institutional Review Board Statement
Not applicable.
Informed Consent Statement
Not applicable.
Data Availability Statement
The data related to the network Anytown are available in the literature. The data of Neptun and Abbiategrasso are available from the authors on demand.
Acknowledgments
F.A. acknowledges the “contribution” of his son Davide whose early fascination with the “life of a droplet” might have kindled the father’s enduring interest in the things water. The contribution of DEMS Data Science Lab for supporting this work by providing computational resources (DEMS—Department of Economics, Management and Statistics) is gratefully acknowledged.
Conflicts of Interest
The authors declare no conflict of interest.
References
- Scholz, R.W.; Blumer, Y.B.; Brand, F.S. Risk, Vulnerability, Robustness, and Resilience from a Decision-Theoretic Perspective. J. Risk Res. 2012, 15, 313–330. [Google Scholar] [CrossRef]
- Pan, X.; Wang, H. Resilience of and Recovery Strategies for Weighted Networks. PLoS ONE 2018, 13, e0203894. [Google Scholar] [CrossRef]
- Latora, V.; Marchiori, M. A Measure of Centrality Based on Network Efficiency. New J. Phys. 2007, 9, 188. [Google Scholar] [CrossRef]
- Shimada, Y.; Hirata, Y.; Ikeguchi, T.; Aihara, K. Graph Distance for Complex Networks. Sci. Rep. 2016, 6, 1–6. [Google Scholar] [CrossRef] [PubMed]
- Chung, F.R.; Graham, F.C. Spectral Graph Theory; American Mathematical Society: Washington, DC, USA, 1997. [Google Scholar]
- Fiedler, M. Algebraic Connectivity of Graphs. Czechoslov. Math. J. 1973, 23, 298–305. [Google Scholar] [CrossRef]
- Claici, S.; Yurochkin, M.; Ghosh, S.; Solomon, J. Model Fusion with Kullback-Leibler Divergence. In Proceedings of the International Conference on Machine Learning;PMLR, Vienna, Austria, 12–18 July 2020; pp. 2038–2047. [Google Scholar]
- Huang, G.; Quo, C.; Kusner, M.J.; Sun, Y.; Weinberger, K.Q.; Sha, F. Supervised Word Mover’s Distance. In Proceedings of the 30th International Conference on Neural Information Processing Systems, Barcelona, Spain, 5–10 December 2016; pp. 4869–4877. [Google Scholar]
- Bonneel, N.; Peyré, G.; Cuturi, M. Wasserstein Barycentric Coordinates: Histogram Regression Using Optimal Transport. ACM Trans. Graph. 2016, 35, 71:1–71:10. [Google Scholar] [CrossRef]
- Villani, C. Optimal Transport: Old and New; Springer Science & Business Media: Berlin/Heidelberg, Germany, 2008; Volume 338. [Google Scholar]
- Yazdani, A.; Jeffrey, P. Complex Network Analysis of Water Distribution Systems. Chaos Interdiscip. J. Nonlinear Sci. 2011, 21, 016111. [Google Scholar] [CrossRef]
- Archetti, F.; Candelieri, A.; Soldi, D. Network Analysis for Resilience Evaluation in Water Distribution Networks. Environ. Eng. Manag. J. 2015, 14, 1261–1270. [Google Scholar]
- Soldi, D.; Candelieri, A.; Archetti, F. Resilience and Vulnerability in Urban Water Distribution Networks through Network Theory and Hydraulic Simulation. Procedia Eng. 2015, 119, 1259–1268. [Google Scholar] [CrossRef]
- Herrera, M.; Abraham, E.; Stoianov, I. A Graph-Theoretic Framework for Assessing the Resilience of Sectorised Water Distribution Networks. Water Resour. Manag. 2016, 30, 1685–1699. [Google Scholar] [CrossRef]
- Ulusoy, A.-J.; Stoianov, I.; Chazerain, A. Hydraulically Informed Graph Theoretic Measure of Link Criticality for the Resilience Analysis of Water Distribution Networks. Appl. Netw. Sci. 2018, 3, 1–22. [Google Scholar] [CrossRef]
- Raad, D.N.; Sinske, A.N.; Van Vuuren, J.H. Comparison of Four Reliability Surrogate Measures for Water Distribution Systems Design. Water Resour. Res. 2010, 46. [Google Scholar] [CrossRef]
- Yazdani, A.; Jeffrey, P. Water Distribution System Vulnerability Analysis Using Weighted and Directed Network Models. Water Resour. Res. 2012, 48. [Google Scholar] [CrossRef]
- Diao, K.; Sweetapple, C.; Farmani, R.; Fu, G.; Ward, S.; Butler, D. Global Resilience Analysis of Water Distribution Systems. Water Res. 2016, 106, 383–393. [Google Scholar] [CrossRef] [PubMed]
- Candelieri, A.; Giordani, I.; Archetti, F. Supporting Resilience Management of Water Distribution Networks through Network Analysis and Hydraulic Simulation. In Proceedings of the 2017 21st International Conference on Control Systems and Computer Science (CSCS), Bucharest, Romania, 7 July 2017; pp. 599–605. [Google Scholar]
- Herrera, M.; Izquierdo, J.; Pérez-García, R.; Montalvo, I. Water Supply Clusters Based on a Boosting Semi-Supervised Learning Methodology. In Proceedings of the 7th International Conference on Engineering Computational Technology, Valencia, Spain, 14–17 September 2010. [Google Scholar]
- Di Nardo, A.; Giudicianni, C.; Greco, R.; Herrera, M.; Santonastaso, G.F. Applications of Graph Spectral Techniques to Water Distribution Network Management. Water 2018, 10, 45. [Google Scholar] [CrossRef]
- Assad, A.; Moselhi, O.; Zayed, T. A New Metric for Assessing Resilience of Water Distribution Networks. Water 2019, 11, 1701. [Google Scholar] [CrossRef]
- Jung, D.; Kim, J.H. Emerging Issues and Methodologies for Resilient and Robust Water Distribution Systems. Water 2020, 12, 769. [Google Scholar] [CrossRef]
- Lipiwattanakarn, S.; Kaewsang, S.; Charuwimolkul, N.; Changklom, J.; Pornprommin, A. Theoretical Estimation of Energy Balance Components in Water Networks for Top-Down Approach. Water 2021, 13, 1011. [Google Scholar] [CrossRef]
- Bathrellos, G.D.; Skilodimou, H.D.; Chousianitis, K.; Youssef, A.M.; Pradhan, B. Suitability Estimation for Urban Development Using Multi-Hazard Assessment Map. Sci. Total Environ. 2017, 575, 119–134. [Google Scholar] [CrossRef]
- Yu, J.; Zhang, L.; Chen, J.; Xiao, Y.; Hou, D.; Huang, P.; Zhang, G.; Zhang, H. An Integrated Bottom-Up Approach for Leak Detection in Water Distribution Networks Based on Assessing Parameters of Water Balance Model. Water 2021, 13, 867. [Google Scholar] [CrossRef]
- Shuang, Q.; Liu, H.J.; Porse, E. Review of the Quantitative Resilience Methods in Water Distribution Networks. Water 2019, 11, 1189. [Google Scholar] [CrossRef]
- Diao, K. Multiscale Resilience in Water Distribution and Drainage Systems. Water 2020, 12, 1521. [Google Scholar] [CrossRef]
- Newman, M. Networks: An Introduction; Oxford University Press: Oxford, UK, 2010; ISBN 978-0-19-159417-5. [Google Scholar]
- Morris, J.H.; Apeltsin, L.; Newman, A.M.; Baumbach, J.; Wittkop, T.; Su, G.; Bader, G.D.; Ferrin, T.E. ClusterMaker: A Multi-Algorithm Clustering Plugin for Cytoscape. BMC Bioinform. 2011, 12, 1–14. [Google Scholar] [CrossRef] [PubMed]
- Criado, R.; Romance, M. Structural vulnerability and robustness in complex networks: Different approaches and relationships between them. In Handbook of Optimization in Complex Networks; Springer: Berlin/Heidelberg, Germany, 2012; pp. 3–36. [Google Scholar]
- Cvetkovic, D.; Cvetković, D.M.; Rowlinson, P.; Simic, S. Eigenspaces of Graphs; Cambridge University Press: Cambridge, UK, 1997. [Google Scholar]
- Estrada, E. Network Robustness to Targeted Attacks. The Interplay of Expansibility and Degree Distribution. Eur. Phys. J. B-Condens. Matter Complex Syst. 2006, 52, 563–574. [Google Scholar] [CrossRef]
- Jovanović, I.; Stanić, Z. Spectral Distances of Graphs. Linear Algebra Appl. 2012, 436, 1425–1435. [Google Scholar] [CrossRef]
- Mohar, B.; Alavi, Y.; Chartrand, G.; Oellermann, O.R. The Laplacian Spectrum of Graphs. Graph Theory Comb. Appl. 1991, 2, 12. [Google Scholar]
- Ng, A.; Jordan, M.; Weiss, Y. On Spectral Clustering: Analysis and an Algorithm. Adv. Neural Inf. Process. Syst. 2001, 14, 849–856. [Google Scholar]
- Von Luxburg, U. A Tutorial on Spectral Clustering. Stat. Comput. 2007, 17, 395–416. [Google Scholar] [CrossRef]
- Farmani, R.; Walters, G.A.; Savic, D.A. Trade-off between Total Cost and Reliability for Anytown Water Distribution Network. J. Water Resour. Plan. Manag. 2005, 131, 161–171. [Google Scholar] [CrossRef]
- Arjovsky, M.; Chintala, S.; Bottou, L. Wasserstein GAN. arXiv 2017, arXiv:1701.07875 [cs, stat]. [Google Scholar]
- Monge, G. Mémoire Sur La Théorie Des Déblais et Des Remblais. Hist. l’Académie Royale Sci. Paris 1781, 666–704. [Google Scholar]
- Kantorovich, L. On the Transfer of Masses. Manag. Sci. 1942, 37, 227–229. (In Russian) [Google Scholar]
- Weng, L. From Gan to Wgan. arXiv 2019, arXiv:1904.08994. [Google Scholar]
- Peyré, G.; Cuturi, M. Computational Optimal Transport: With Applications to Data Science. Found. Trends 2019, 11, 355–607. [Google Scholar] [CrossRef]
- Candelieri, A.; Soldi, D.; Archetti, F. Cost-Effective Sensors Placement and Leak Localization–the Neptun Pilot of the ICeWater Project. J. Water Supply Res. Technol. AQUA 2015, 64, 567–582. [Google Scholar] [CrossRef]


Publisher’s Note: MDPI stays neutral with regard to jurisdictional claims in published maps and institutional affiliations. |
© 2021 by the authors. Licensee MDPI, Basel, Switzerland. This article is an open access article distributed under the terms and conditions of the Creative Commons Attribution (CC BY) license (https://creativecommons.org/licenses/by/4.0/).