Article

Discovering Water Quality Changes and Patterns of the Endangered Thi Vai Estuary in Southern Vietnam through Trend and Multivariate Analysis

1
State Agency for Agriculture, Environment and rural Areas Schleswig-Holstein (LLUR), Department 41 River Ecology, Hamburger Chaussee 25, 24220 Flintbek, Germany
2
Leichtweiß-Institute for Hydraulic Engineering and Water Resources (LWI), Department Hydrology, Water Management and Water Protection, Technische Universität Braunschweig, Beethovenstraße 51 a, 38106 Braunschweig, Germany
3
Institute for Circular Economy Development, Vietnam National University-Ho Chi Minh City, 01 Marie Curie, VNU Campus, Linh Trung, Thu Duc District, Ho Chi Minh City 71308, Vietnam
4
Center of Water Management and Climate Change, Institute for Environment and Resources, Vietnam National University-Ho Chi Minh City, Ho Chi Minh City 71308, Vietnam
5
Faculty of Resources & Environment, University of Thu Dau Mot, 06 Tran Van On Street, Binh Duong 75151, Vietnam
6
School of the Environment and Chemistry Department, Trent University, Peterborough, ON K9L 0G2, Canada
*
Authors to whom correspondence should be addressed.
Water 2021, 13(10), 1330; https://doi.org/10.3390/w13101330
Submission received: 31 March 2021 / Revised: 28 April 2021 / Accepted: 5 May 2021 / Published: 11 May 2021

Abstract

:
Temporal and spatial water quality data are essential to evaluate human health risks. Understanding the interlinking variations between water quality and socio-economic development is the key for integrated pollution management. In this study, we applied several multivariate approaches, including trend analysis, cluster analysis, and principal component analysis, to a 15-year dataset of water quality monitoring (1999 to 2013) in the Thi Vai estuary, Southern Vietnam. We discovered a rapid improvement for most of the considered water quality parameters (e.g., DO, NH4, and BOD) by step trend analysis, after the pollution abatement in 2008. Nevertheless, the nitrate concentration increased significantly at the upper and middle parts and decreased at the lower part of the estuary. Principal component (PC) analysis indicates that nowadays the water quality of the Thi Vai is influenced by point and diffuse pollution. The first PC represents soil erosion and stormwater loads in the catchment (TSS, PO4, and Fetotal); the second PC (DO, NO2, and NO3) determines the influence of DO on nitrification and denitrification; and the third PC (pH and NH4) determines point source pollution and dilution by seawater. Therefore, this study demonstrated the need for stricter pollution abatement strategies to restore and to manage the water quality of the Thi Vai Estuary.

1. Introduction

Population growth and economic development are often associated with contamination risks that often exceed the environment’s self-purification potential [1,2]. The aquatic ecosystems are often subject to combined impacts of multiple polluting stressors, including nutrients, pathogens, plastics, and other xenobiotic chemicals such as antibiotics, heavy metals, and pesticides [3]. Anthropogenic activities are responsible for river pollution in most countries [4,5]. For example, the potash industry was the primary anthropogenic source of salts in rivers in Germany, with the dominant ions being Cl, PO43−, Na+, Mg2+, and SO42− [6,7]; pesticide residues and nutrients runoff from agriculture activities to surface water also threaten freshwater biodiversity in the European Union [8,9]; pesticides and other chemicals also enter into rivers from a point source, e.g., wastewater treatment plants [10,11,12].
Pollution in rivers and water bodies may result in biodiversity loss and degradation of aquatic ecosystem functions. Nitrogen (N) and phosphorus (P) are directly related to eutrophication and harmful algal blooms [13], one of the major factors altering the ecosystem’s health. The aquatic organisms, including invertebrates communities, can also be significantly affected by rising salinity [14,15]. Moreover, insecticides (e.g., neonicotinoids, pyrethroid, and fipronil) have a devastating impact on aquatic insects and crustaceans due to their acute and chronic toxicity [16,17,18], leading to disturbed freshwater ecosystems [19]. Besides, river pollution has been one of the leading causes of various severe health problems in humans. In 2000, water sanitation and hygiene-associated diseases (diarrheas, schistosomiasis, trachoma, and intestinal helminth infections) killed more than 2,200,000 people [20]. Approximately 65 million people in the West Bengal suffer from fluorosis, a crippling disease caused by high amounts of fluoride, whereas 5 million were estimated to be affected by arsenicosis due to high arsenic concentrations [21].
Surface water pollution is also one of the primary environmental concerns in Vietnam, particularly in the Southeast of Vietnam, recognized as one of the vital regions for industrial and agricultural development [22]. Although there are numerous efforts from the government in developing legislative documents such as the Law of Environmental Protection and the Law of Water Resources, successful stories are still very limited, and in some areas the problems has even worsened [23]. Limited investment in water treatment facilities (e.g., domestic wastewater) or water quality monitoring are typical reasons, apart from governance-related issues [23,24]. For example, in terms of surface water quality monitoring, it is highly recommended by the Ministry of Natural Resources and Environment to have quite a range of monitored parameters (physical parameters, nutrients, metals, and pesticides) and a certain monitoring frequency (from automatic to monthly or quarterly). Nevertheless, the extent of the surface water quality monitoring program of different provinces or cities is highly dependent on budget availability [25].
The Thi Vai River located in this region was heavily contaminated by the discharge of a large volume of untreated industrial wastewater [26,27,28]. Illegal discharge of wastewater from manufacturing activities, especially the Vedan factory (a Taiwanese producer of monosodium glutamate), was determined as one of the major sources responsible for the poor water quality in the Thi Vai River. The Vedan factory was responsible for approximately 80–90% of the pollutant loads [29]. In 2008, the Vedan factory was forced to stop its operation. Moreover, the construction and extension of wastewater treatment plants at other industrial zones have further improved the water quality of the Thi Vai River [22]. However, the estuary is still considered as polluted and does not meet national water quality standards. This observation demonstrates the need to further evaluate the interlinks between water quality and socio-economic development in the watershed.
There are quite a number of approaches, which have been developed by studies to analyze and improve water quality, especially in data-driven perspectives. Multivariate statistical analysis was applied to identify potential sources of pollutants entering surface water [30,31,32,33], whereas others applied two statistical models to predict the combined effect of land use and climate change on river and stream chemistry [34]. Deterministic mathematic modeling is also another effort in water quality management at both the river and catchment scale [35,36,37,38,39,40]. Besides, numerous real-time monitoring systems have been designed based on in situ sensors to control the water quality 24 h per day, such as nutrient fluxes estimation, ecological assessment of rivers, or detection of domestic wastewater impacts [41,42,43,44,45].
Therefore, this study aims to assess the short- and long-term changes in water quality and the major drivers causing water quality deterioration in the Thi Vai River before and after the Vedan scandal. Since the primary pollution source and the period when the pollution was stopped were well known, a step trend analysis was applied to investigate spatial and temporal changes in water quality parameters over 15 years of socio-economic development history and water quality monitoring data [46]. Multivariate statistical methods (cluster analysis and principal component analysis) were applied to investigate the spatial and seasonal (dry and rainy season) variations of water quality parameters and identify their main drivers. Besides, we also suggest abatement solutions to improve the water quality.

2. Materials and Methods
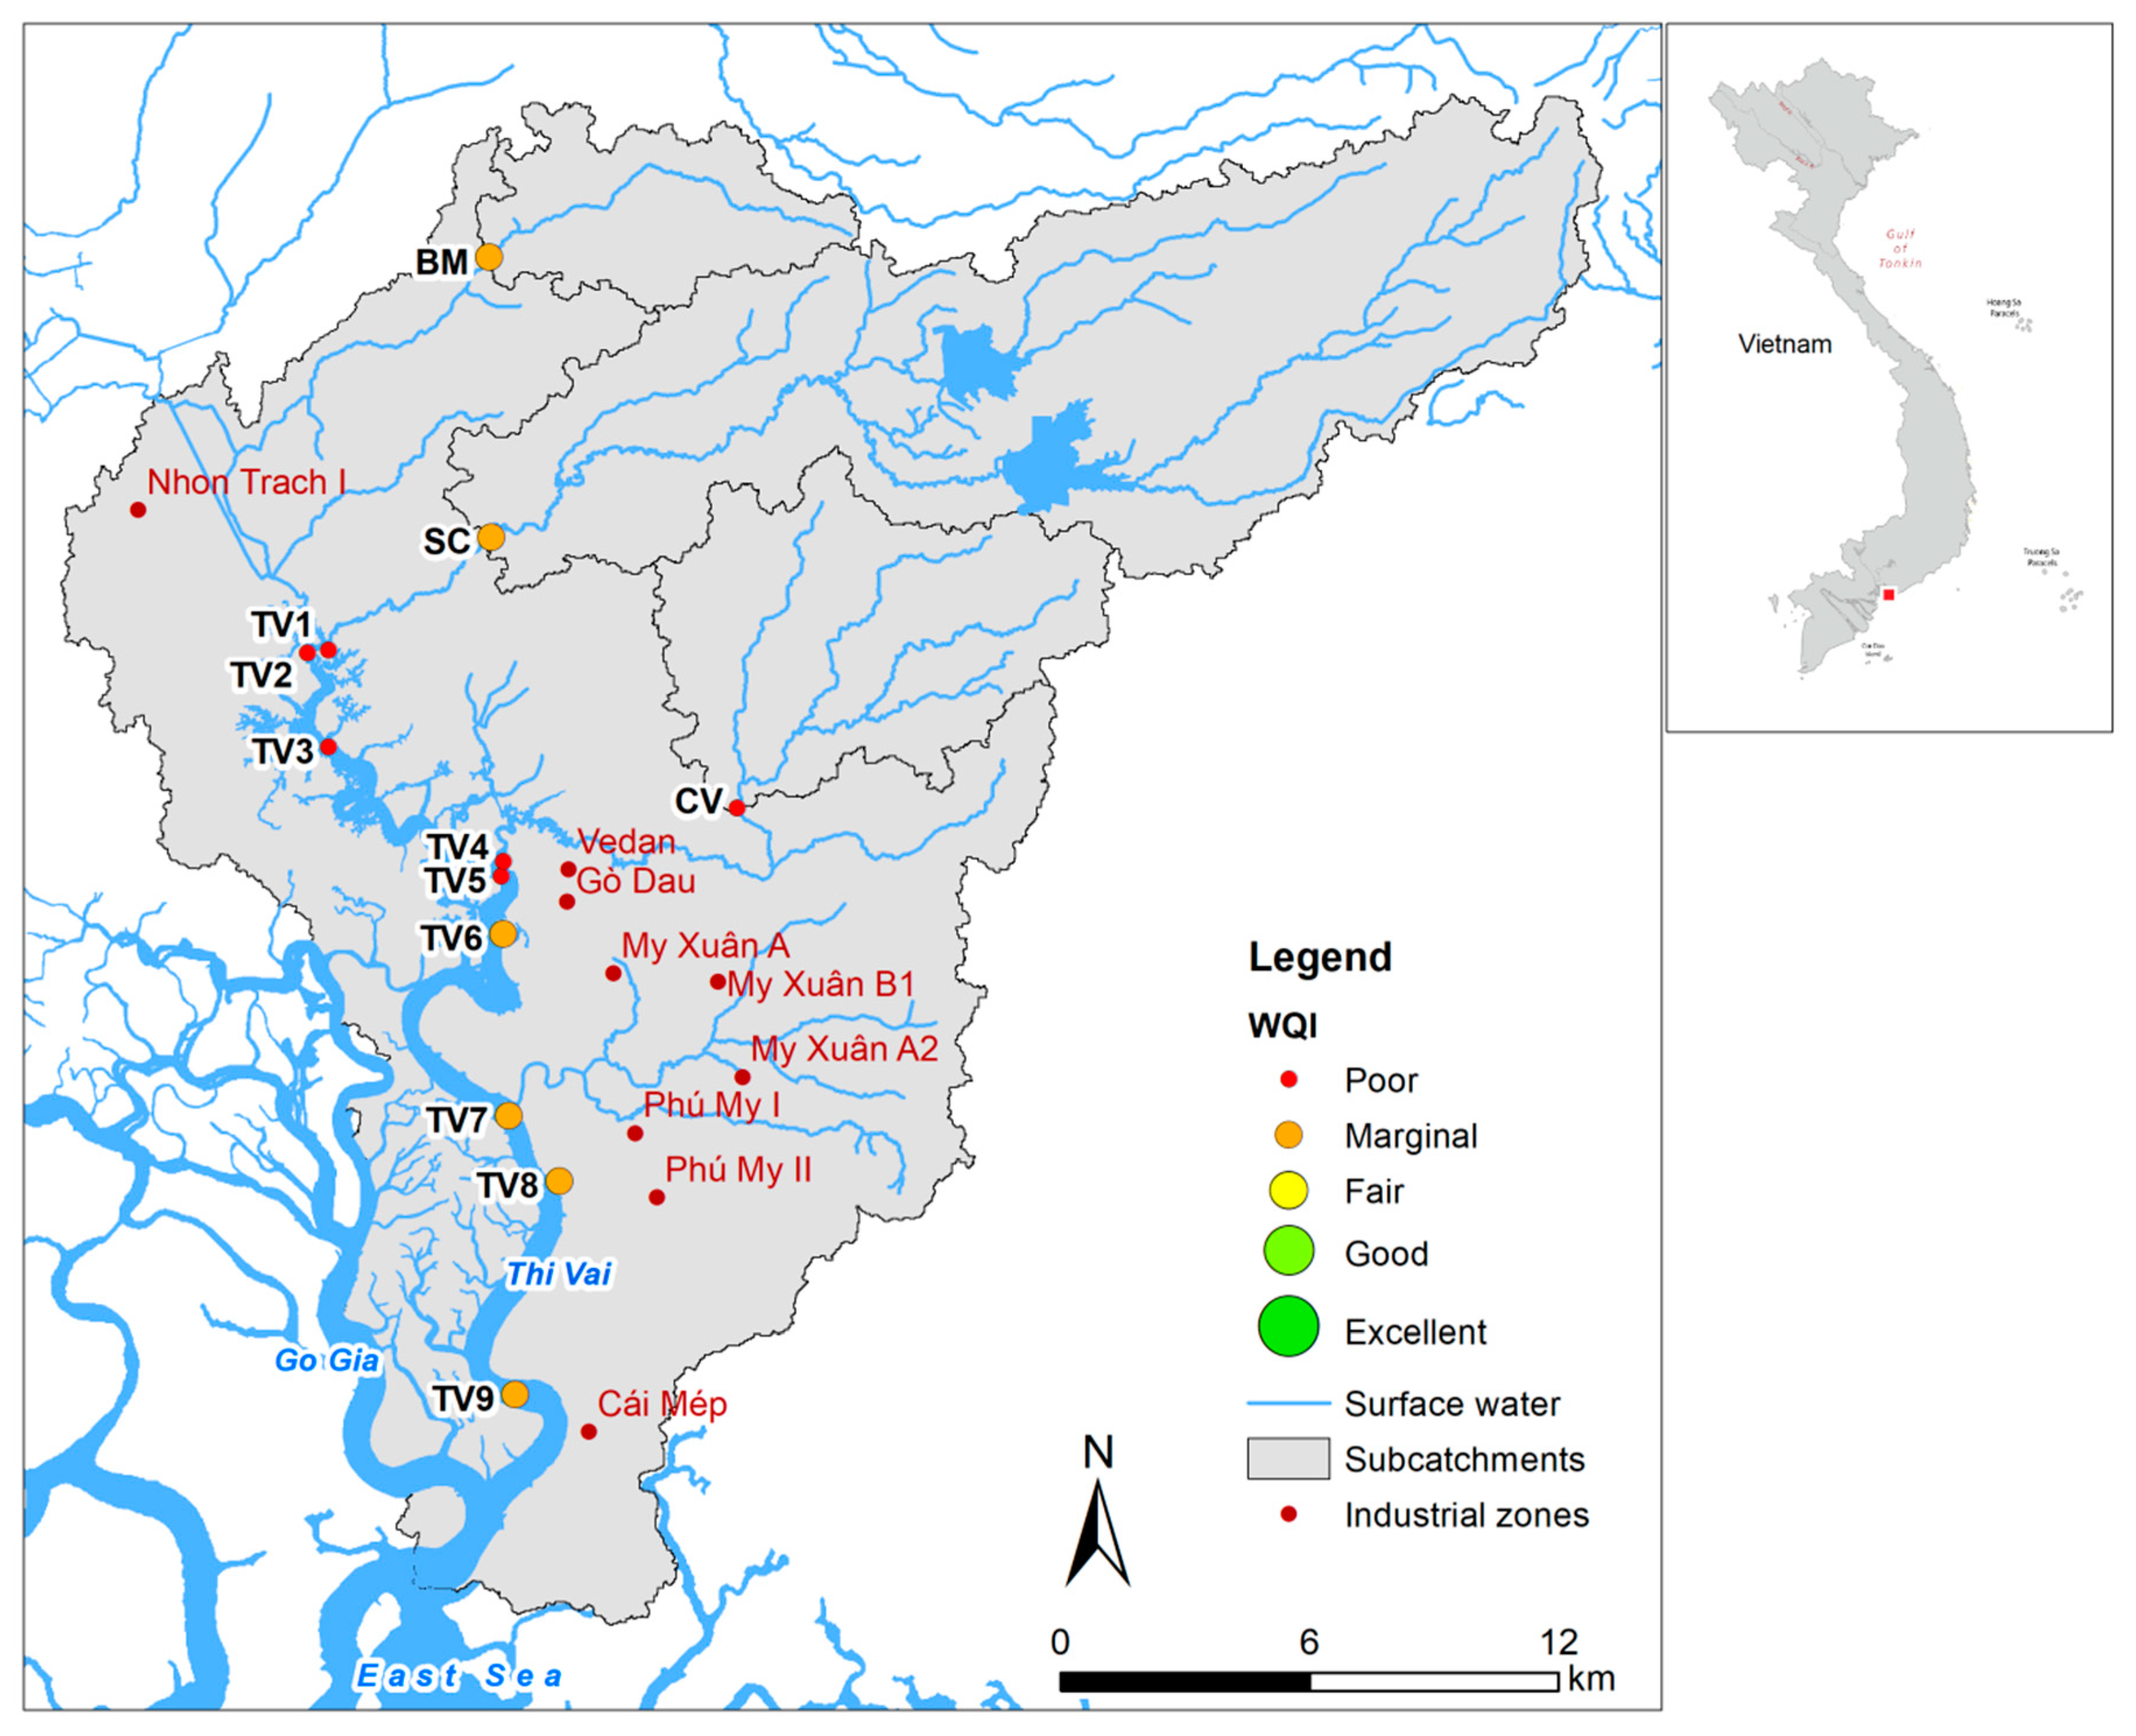
2.1. Study Area

The Thi Vai estuary and its tributaries are located in Dong Nai, Ba Ria-Vung Tau, and Ho-Chi-Minh City in Southern Vietnam. The river catchment size is 625 km2, with the lower part influenced by a semi-diurnal tidal regime. Seawater can intrude up to 32 km from the river mouth. The main tributaries are the Bung Mon, Suoi Ca, and Cau Vac River (Figure 1). The region is subject to a tropical monsoon climate, with a distinct rainy season from May to November and a dry season from December to April. The mean annual rainfall is 1800 mm, of which 80% falls in the rainy season.
Besides a high density of industrial parks (10% of the catchment area) along the Thi Vai River, the catchment also hosts intense agricultural activities, especially rubber plantations (42% of the catchment area) and aquaculture in the downstream areas [22]. Other important crops and land use types in the catchment are rice (5%), annual plants (6.7%), mangrove forest (7%), and country housing areas (10%). Acidic soil types, such as acrisols, dominate the catchment (e.g., arenic acrisol 23.4%, ferric acrisol 9.4%, gleyic acrisol 8.3%, and plintic acrisol 8.1%). Other important soil types are rhodic ferals (14.7%) and thionic fluvisols (10.9%) [22,26,27,47].

2.2. Data Collection

Water quality data, including ammonia (NH4), nitrite (NO2), nitrate (NO3), biological oxygen demand (BOD5), dissolved oxygen (DO), orthophosphate (PO43−), and total iron (Fetotal) were investigated for (i) a long-term and (ii) a short-term trend. Concentrations of N and P species were determined as weight concentrations based on N and P (i.e., NH4-N, NO2-N, NO3-N, and PO4-P). Hereafter, their concentrations will be referred to as NH4, NO2, NO3, and PO4. The locations of the 11 considered monitoring sites are presented in Figure 1. We investigated the upper (stations TV1 to TV3), middle (TV4 to TV6), and lower (TV7 to TV9) parts of the estuary. The other stations (BM, SC, and CV) were installed on the main tributaries of the Thi Vai estuary [47].
To assess the historical variations of water quality within the study region, we obtained a long-term and quarterly dataset from the Department Of Natural Resources and Environment (DONRE) of Dong Nai province. The data were available at four stations: TV2 (Long Tho), TV4 (Go Dau), TV8 (Phu My), and TV9 (Phao 13) (Figure 1) from 1999 to 2013. The DONRE also provided estimated BOD5 and total nitrogen (TN) loads in 2006, 2008, and 2009 from several industrial point sources along the estuary in their monitoring program (dark red circles in Figure 1). We compiled this dataset here (Table 1) to support the interpretation of our results.
To evaluate short-term variations of water quality, we also collected high temporal resolution data in the Thi Vai estuary and its main tributaries. Samples were collected from March 2013 to January 2014 in the project EWATEC-COAST. We installed six monitoring stations in total: three in the Thi Vai Estuary including TV2 (Long Tho), TV5 (Vedan), and TV8 (Phu My) and three in the main tributaries (Bung Mon (BM), Suoi Ca (SC), and Cau Vac (CV)) (Figure 1). Stations TV2 (Long Tho) and TV8 (Phu My) are similar to the monitoring sites considered by the DONRE. Water samples (grab sampling) were collected weekly for the analysis of river water quality. Physical–chemical parameters, including temperature, pH, electric conductivity (EC), turbidity, and DO were directly measured in the field using a multiparameter probe (V2 6600, YSI). Other parameters (NH4, NO2, NO3, PO4, and Fetotal) were quantified spectrometrically (NOVA 60, Merck) not later than 24 h after sampling. The total suspended solids (TSS) were analyzed gravimetrically [49]. In addition, data provided by the local Department of Nature and Resources at five monitoring stations (TV1, TV3, TV4, TV6, and TV7) were also used for short-term analysis.

2.3. Data Analysis

Box and whisker plots were used to visualize temporal and spatial variations of water quality parameters. We calculated the Water Quality Index (WQI) defined by the Canadian Council of Ministers of the Environment [48] to classify the overall water quality. The Canadian WQI is applied worldwide as one of its main strengths is that site-specific objectives, rather than universal guidelines, are used in the calculation process. Furthermore, the Canadian WQI is not affected by the weight of a single water quality parameter, which is the case with other WQI calculations [50]. The Canadian WQI quantifies the number of parameters that exceed a reference value (scope), the number of records in a dataset that exceed a reference value (frequency), and the extent to which the reference value is not met (amplitude). The WQI is normalized between 0 and 100; sites with excellent water quality score toward 100, whereas sites with poor water quality have their scores close to zero [48]. Our data were compared to the Vietnamese water quality standards [51], as shown in Table 2, using the standard A2 as a reference value for residential use with proper treatment, preservation of aquatic plants, or other purposes.
Only the parameters pH, DO, TSS, NH4, NO2, NO3, PO4, and Fetotal were considered in multivariate analyses (cluster analysis and principal component analysis, CA and PCA, respectively) of the river water quality. Water temperature was not included in the analysis as it remained spatially and temporally constant in the catchment because of the tropical climate. Besides, salinity and electrical conductivity were also not considered in this analysis because these two parameters showed strong natural spatial patterns in the catchment, which would influence the CA and PCA results.

2.3.1. Trend Analysis

The main focus of this study lies in the spatial and temporal changes of water quality parameters before and after the Vedan scandal in 2008 [52]. Therefore, step trend analysis was applied to identify changes in water quality patterns. The nonparametric rank-sum test (Mann–Whitney U test) and associated Hodges–Lehmann estimator were used to analyze the magnitude of the step-trend [46,53]. The Mann–Whitney U test determined a significant difference between the two periods (α = 0.05), identified in each figure by an asterisk (Figure 2, Figure 3, Figure 4, Figure 5 and Figure 6). We used the Hodges–Lehmann estimator of step trend to determine the magnitude of the step (ΔY). This was specified in each figure together with the 95% confidence interval. The step trend analysis was applied to the long-term dataset.

2.3.2. Cluster Analysis

Cluster analysis is an approach to group objects (cases) into classes (clusters) based on similarities within a class and dissimilarities between different classes [54]. In this study, the derived clusters were profiled in terms of the monitoring sites to identify their similarity. This is expressed by the Euclidean distance, which describes the difference between the environmental factors of the monitoring sites [54,55]. The Ward method, considered the most suitable method for quantitative variables, was used to determine the similarity between observations. The variance of each variable was standardized with the Z-scale transformation to avoid misclassification due to wide variances in data dimensionality on Euclidean distances [54,55,56]. CA was used to examine the short-term data -set.

2.3.3. Principal Component Analysis

Principal component analysis (PCA) is a multivariate statistical approach to reduce the number of dimensions and complexity in a dataset [57]. The method helps to identify the most important water quality parameters and investigate the possible sources of different pollutants [30]. In addition, the PCA was applied to clarify the temporal (seasonal) difference of the water quality parameters. Before applying PCA, the data were standardized for the entire period as well as for each season. Then Kaiser–Meyer–Olkin (KMO) and Bartlett’s tests were performed to examine the suitability of the datasets for PCA [57]. Principal components (PCs) were computed from covariance or other cross-product matrixes, which describe the dispersion of the measured parameters to obtain eigenvalues and eigenvectors. Only the components exhibiting an eigenvalue greater than 1 were retained [57]. After extracting the most important components, the PCA solution was rotated using VARIMAX rotation to facilitate the interpretation of the principal components. All calculations and graphics were performed in MATLAB 8.1 (R2013a) [58]. PCA was used to examine the short-term dataset.

3. Results and Discussion

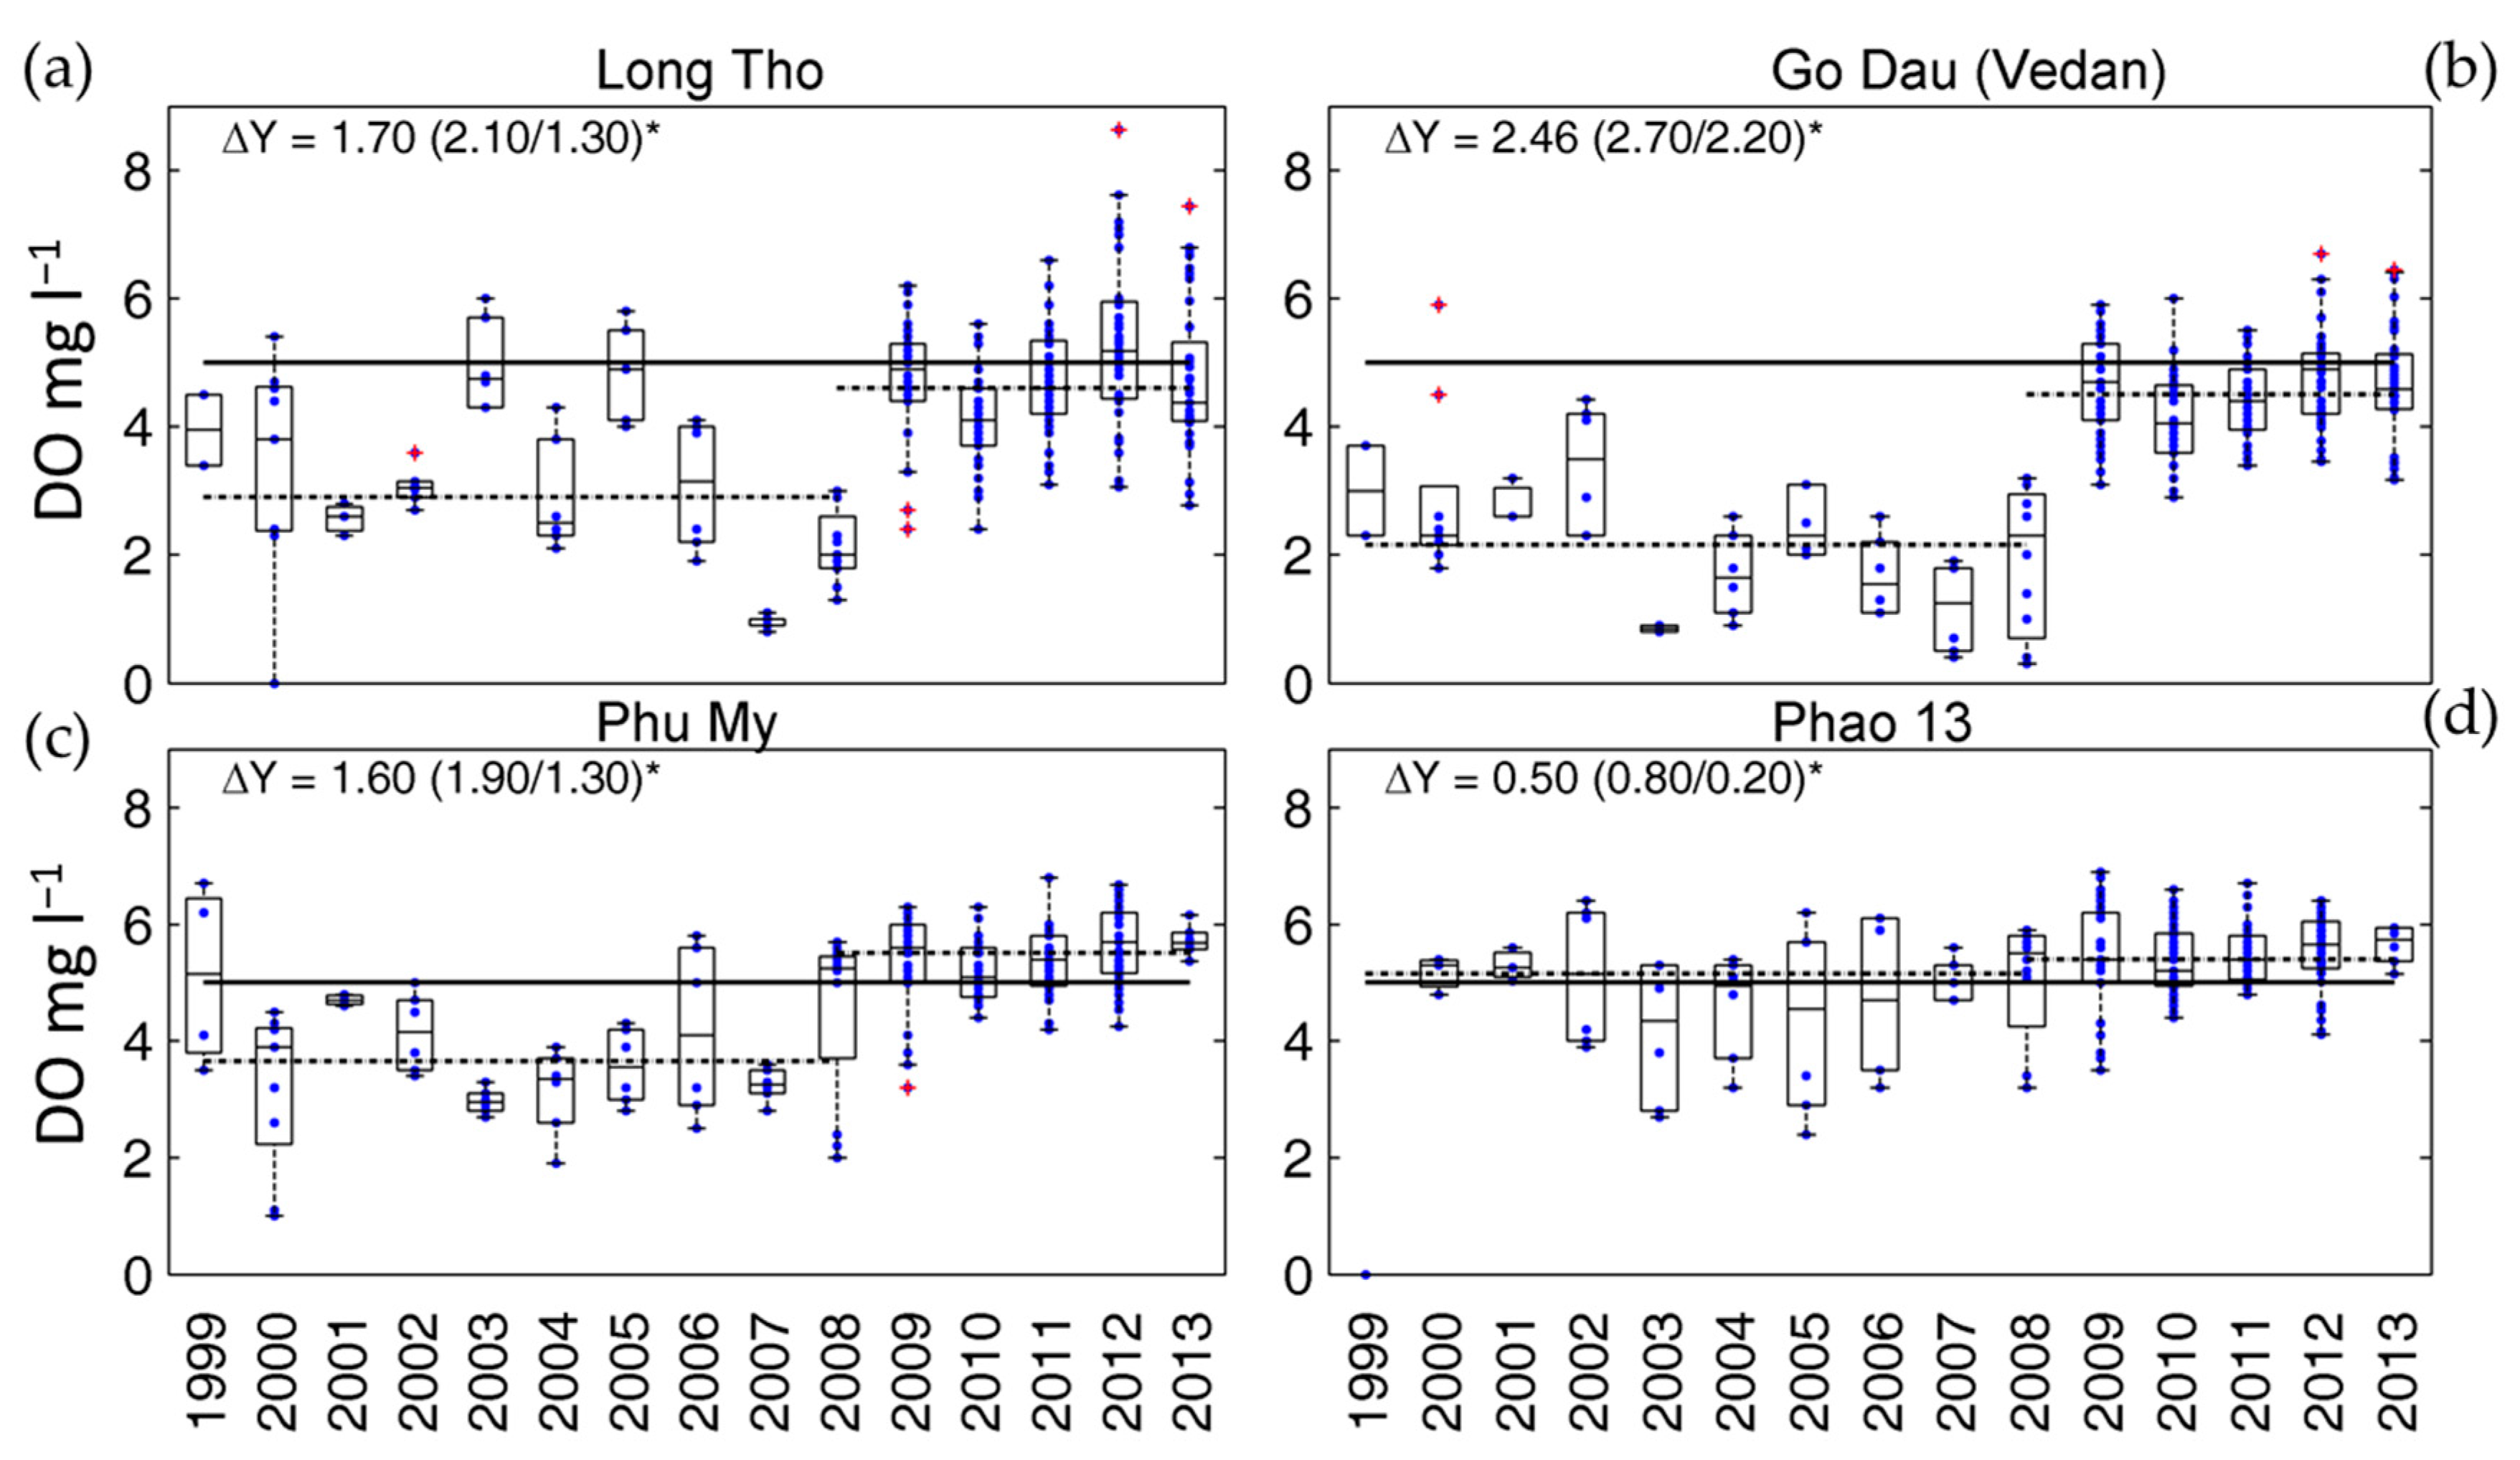
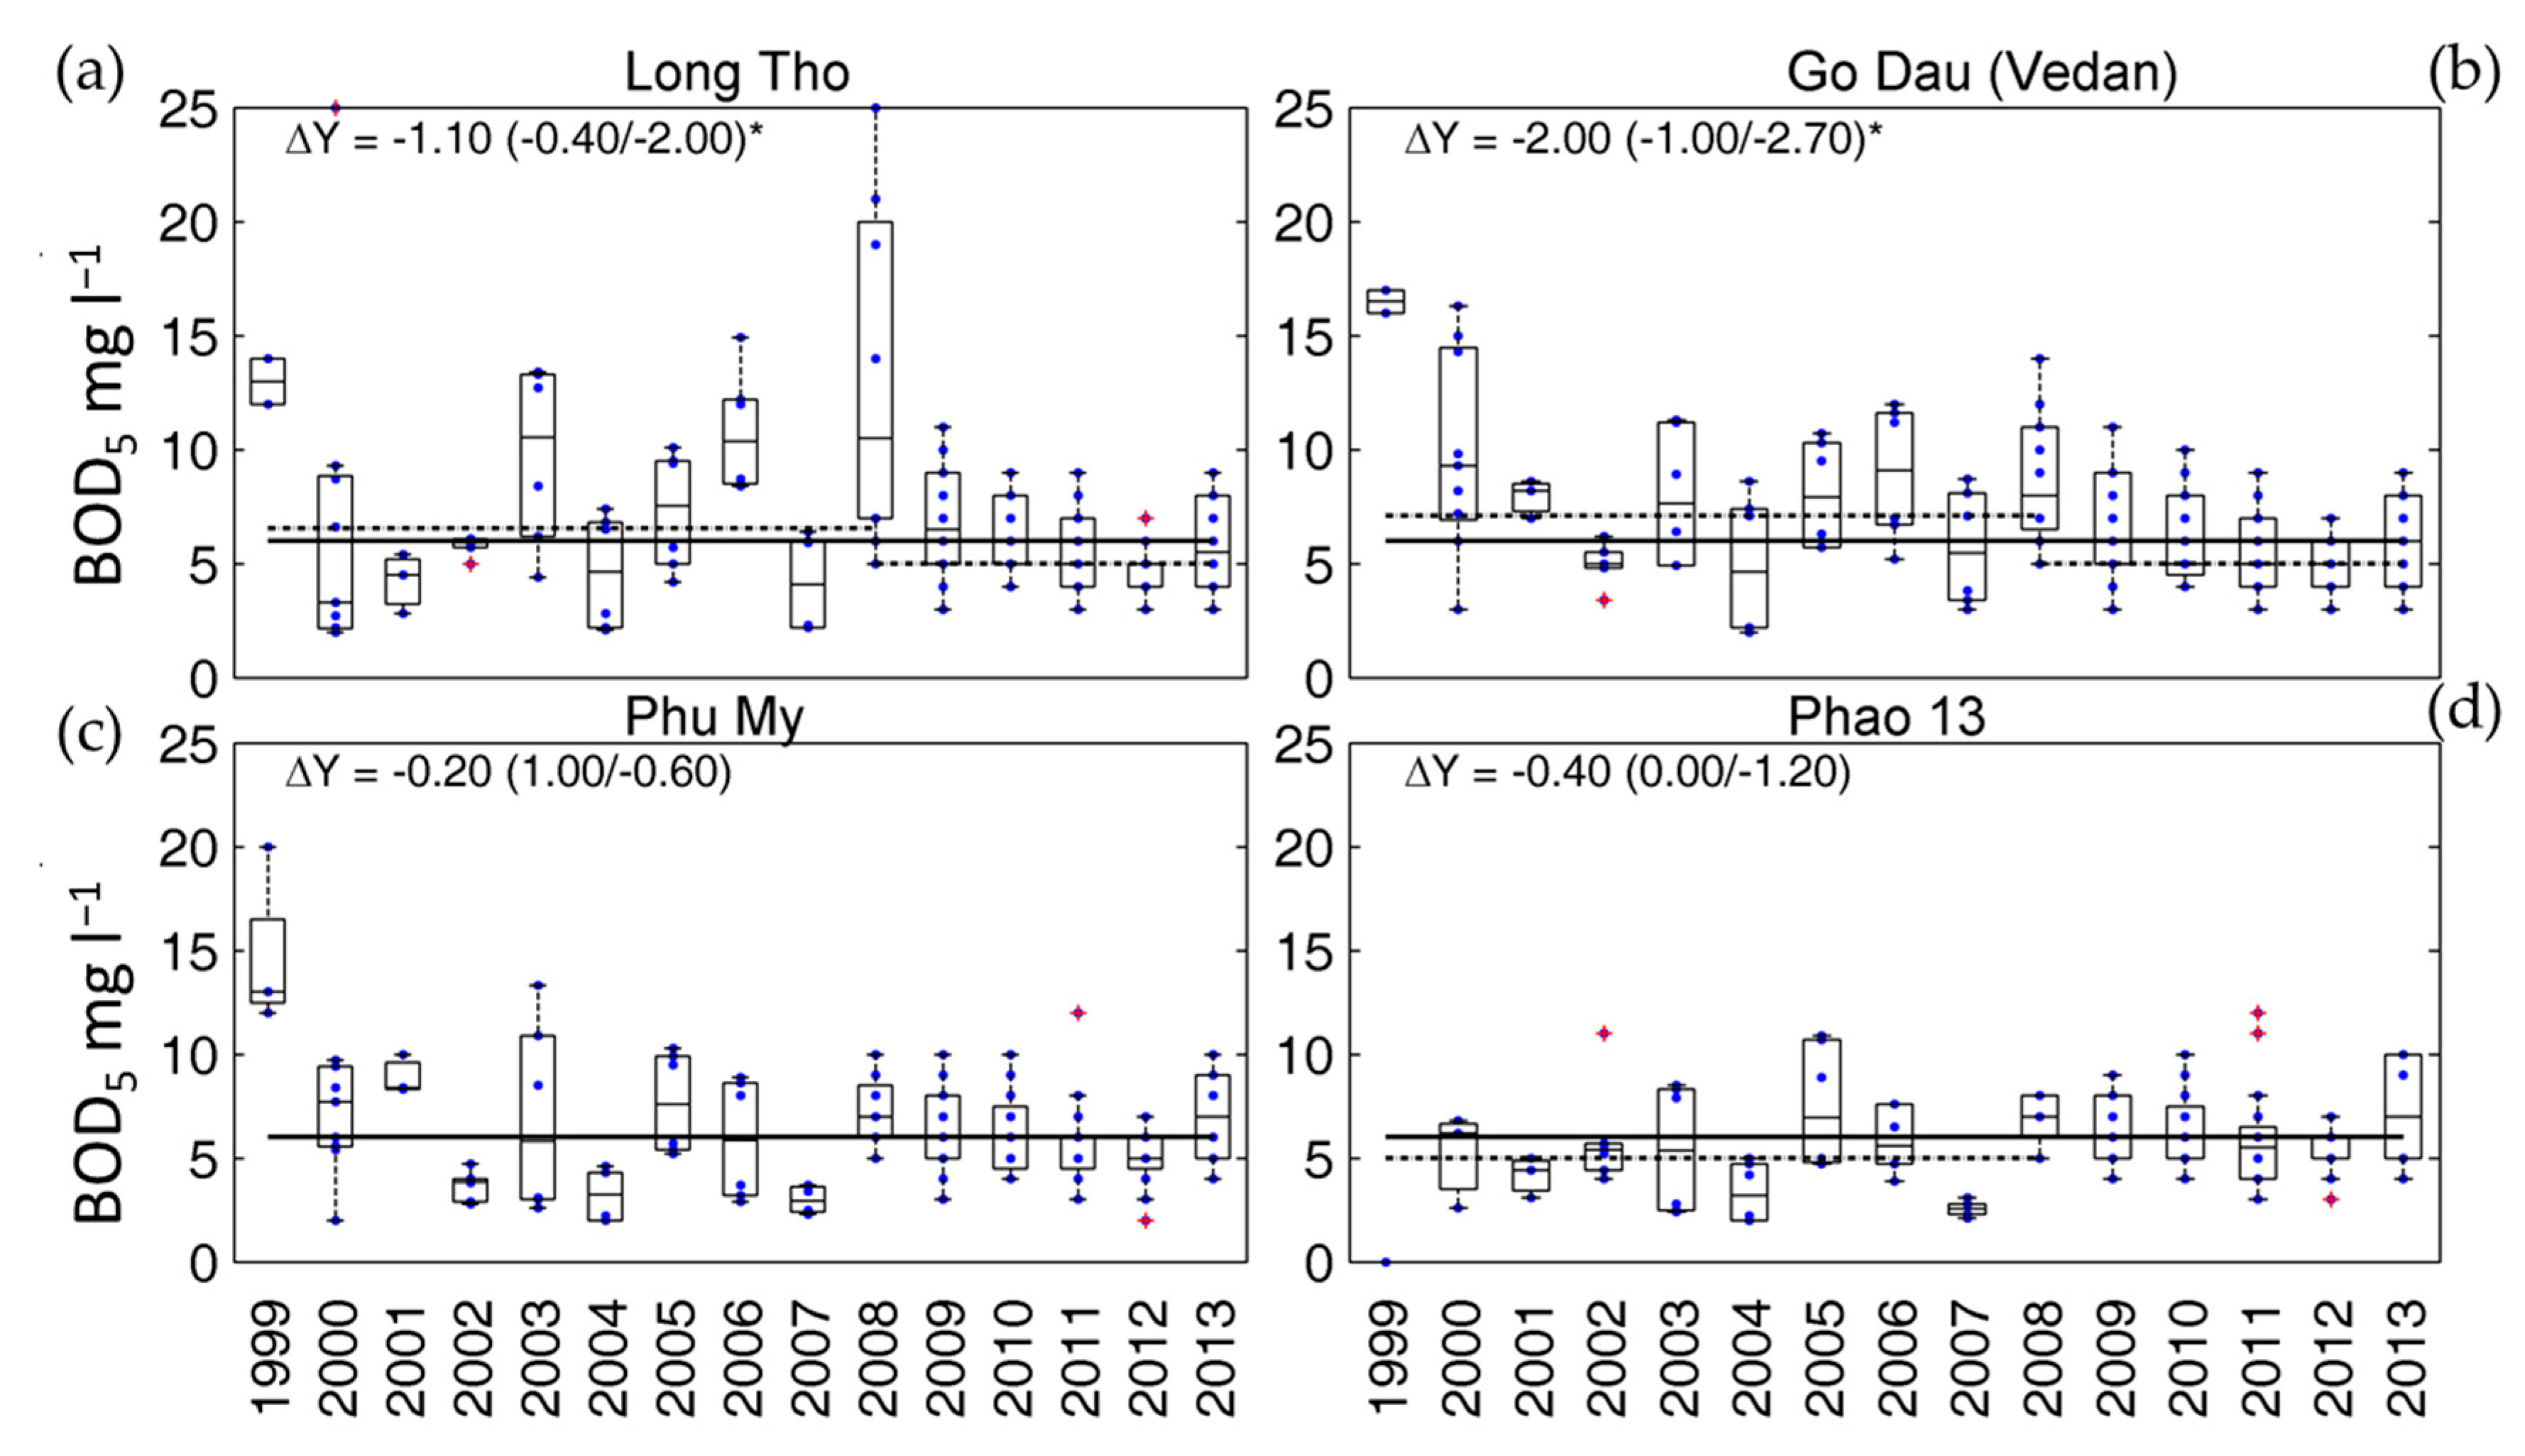
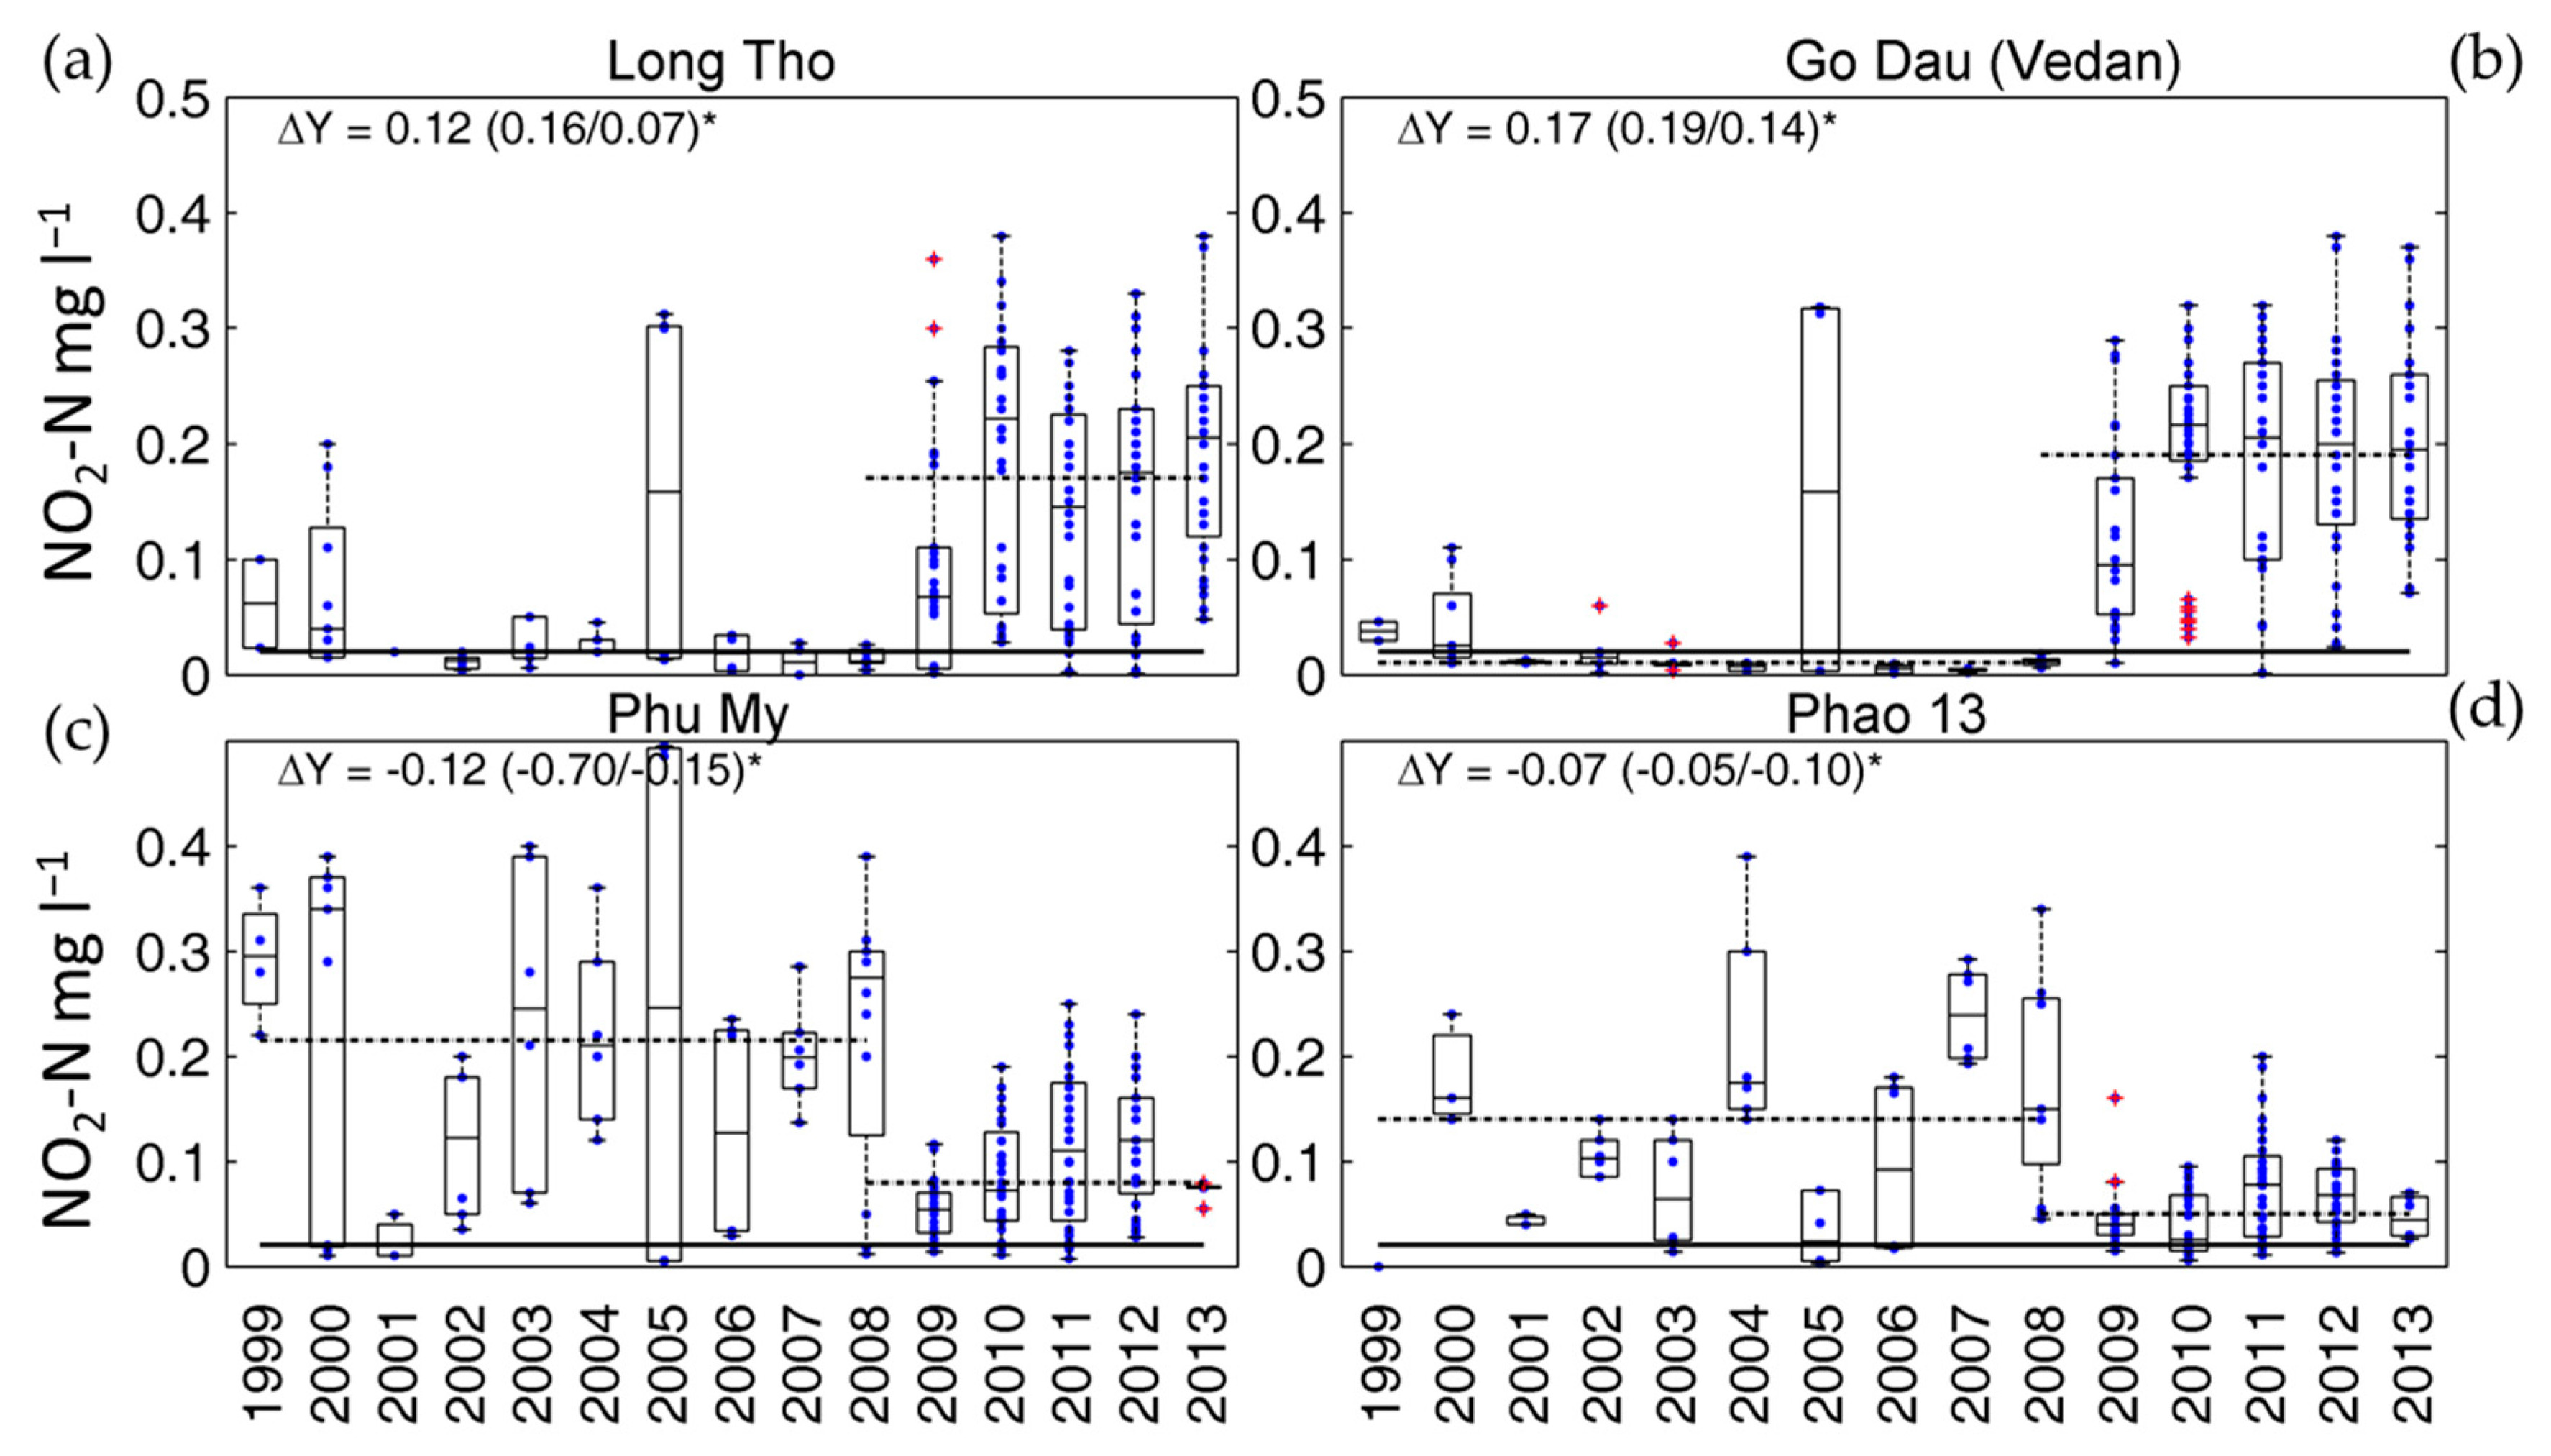
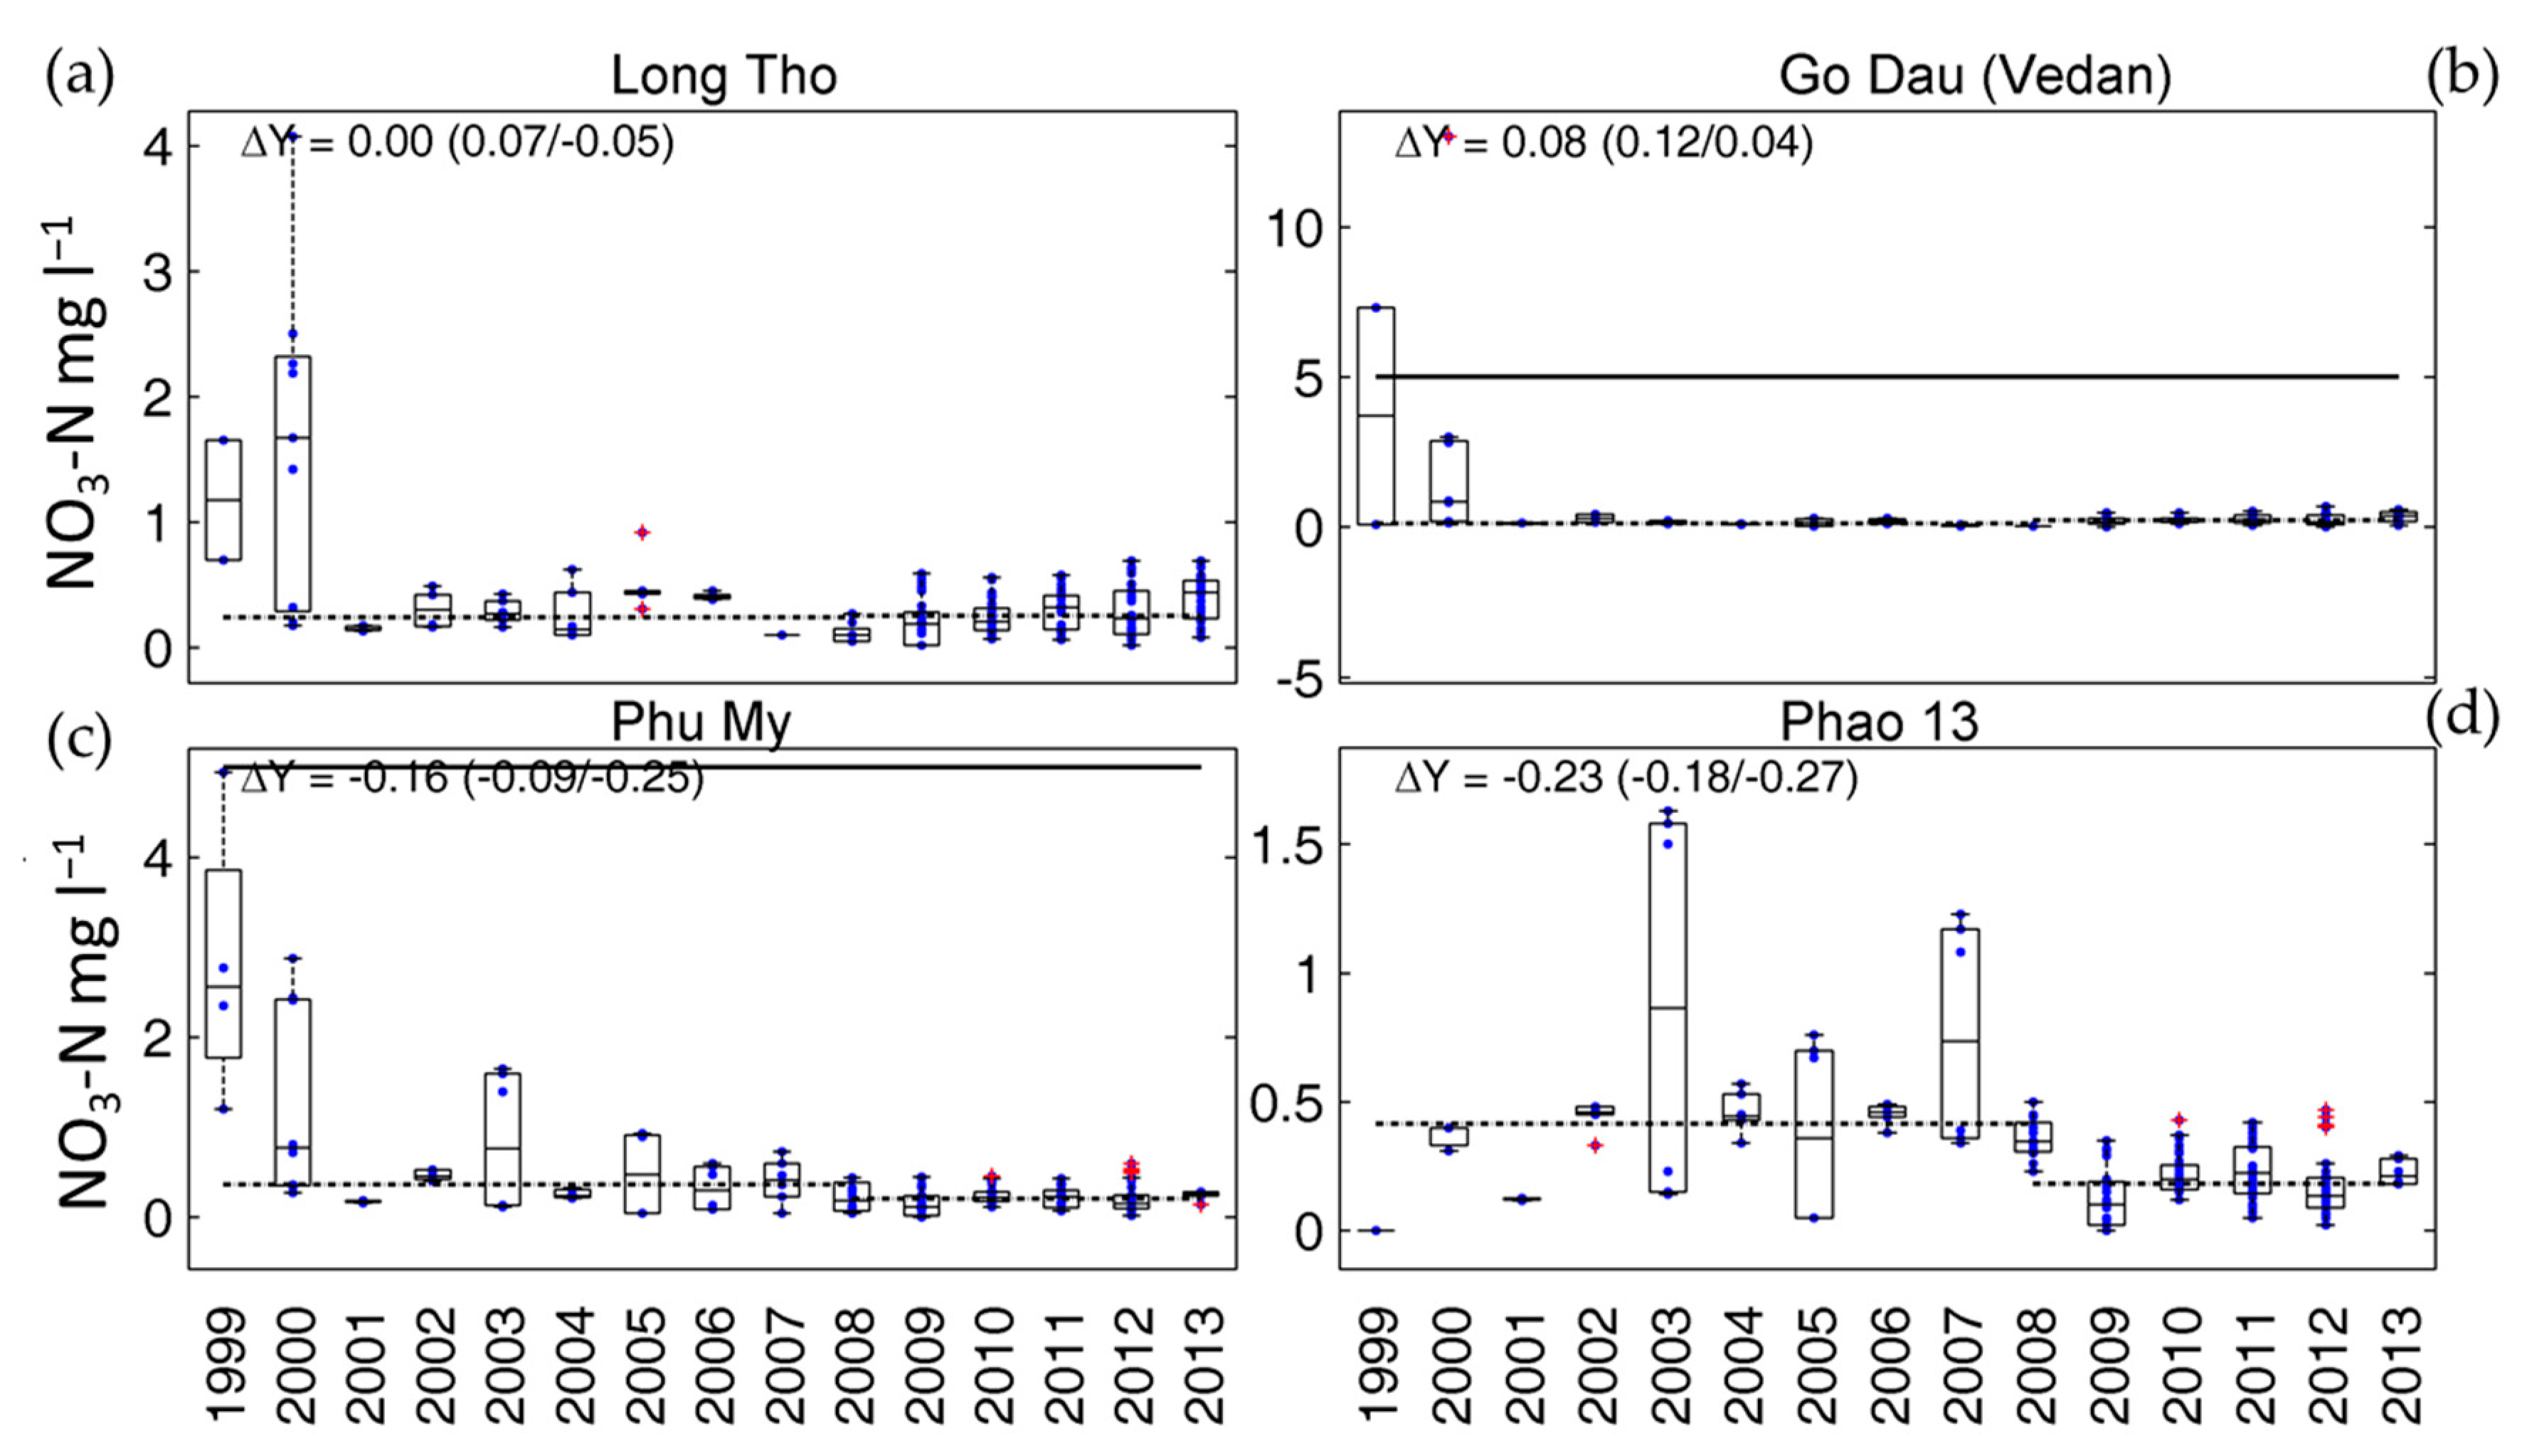
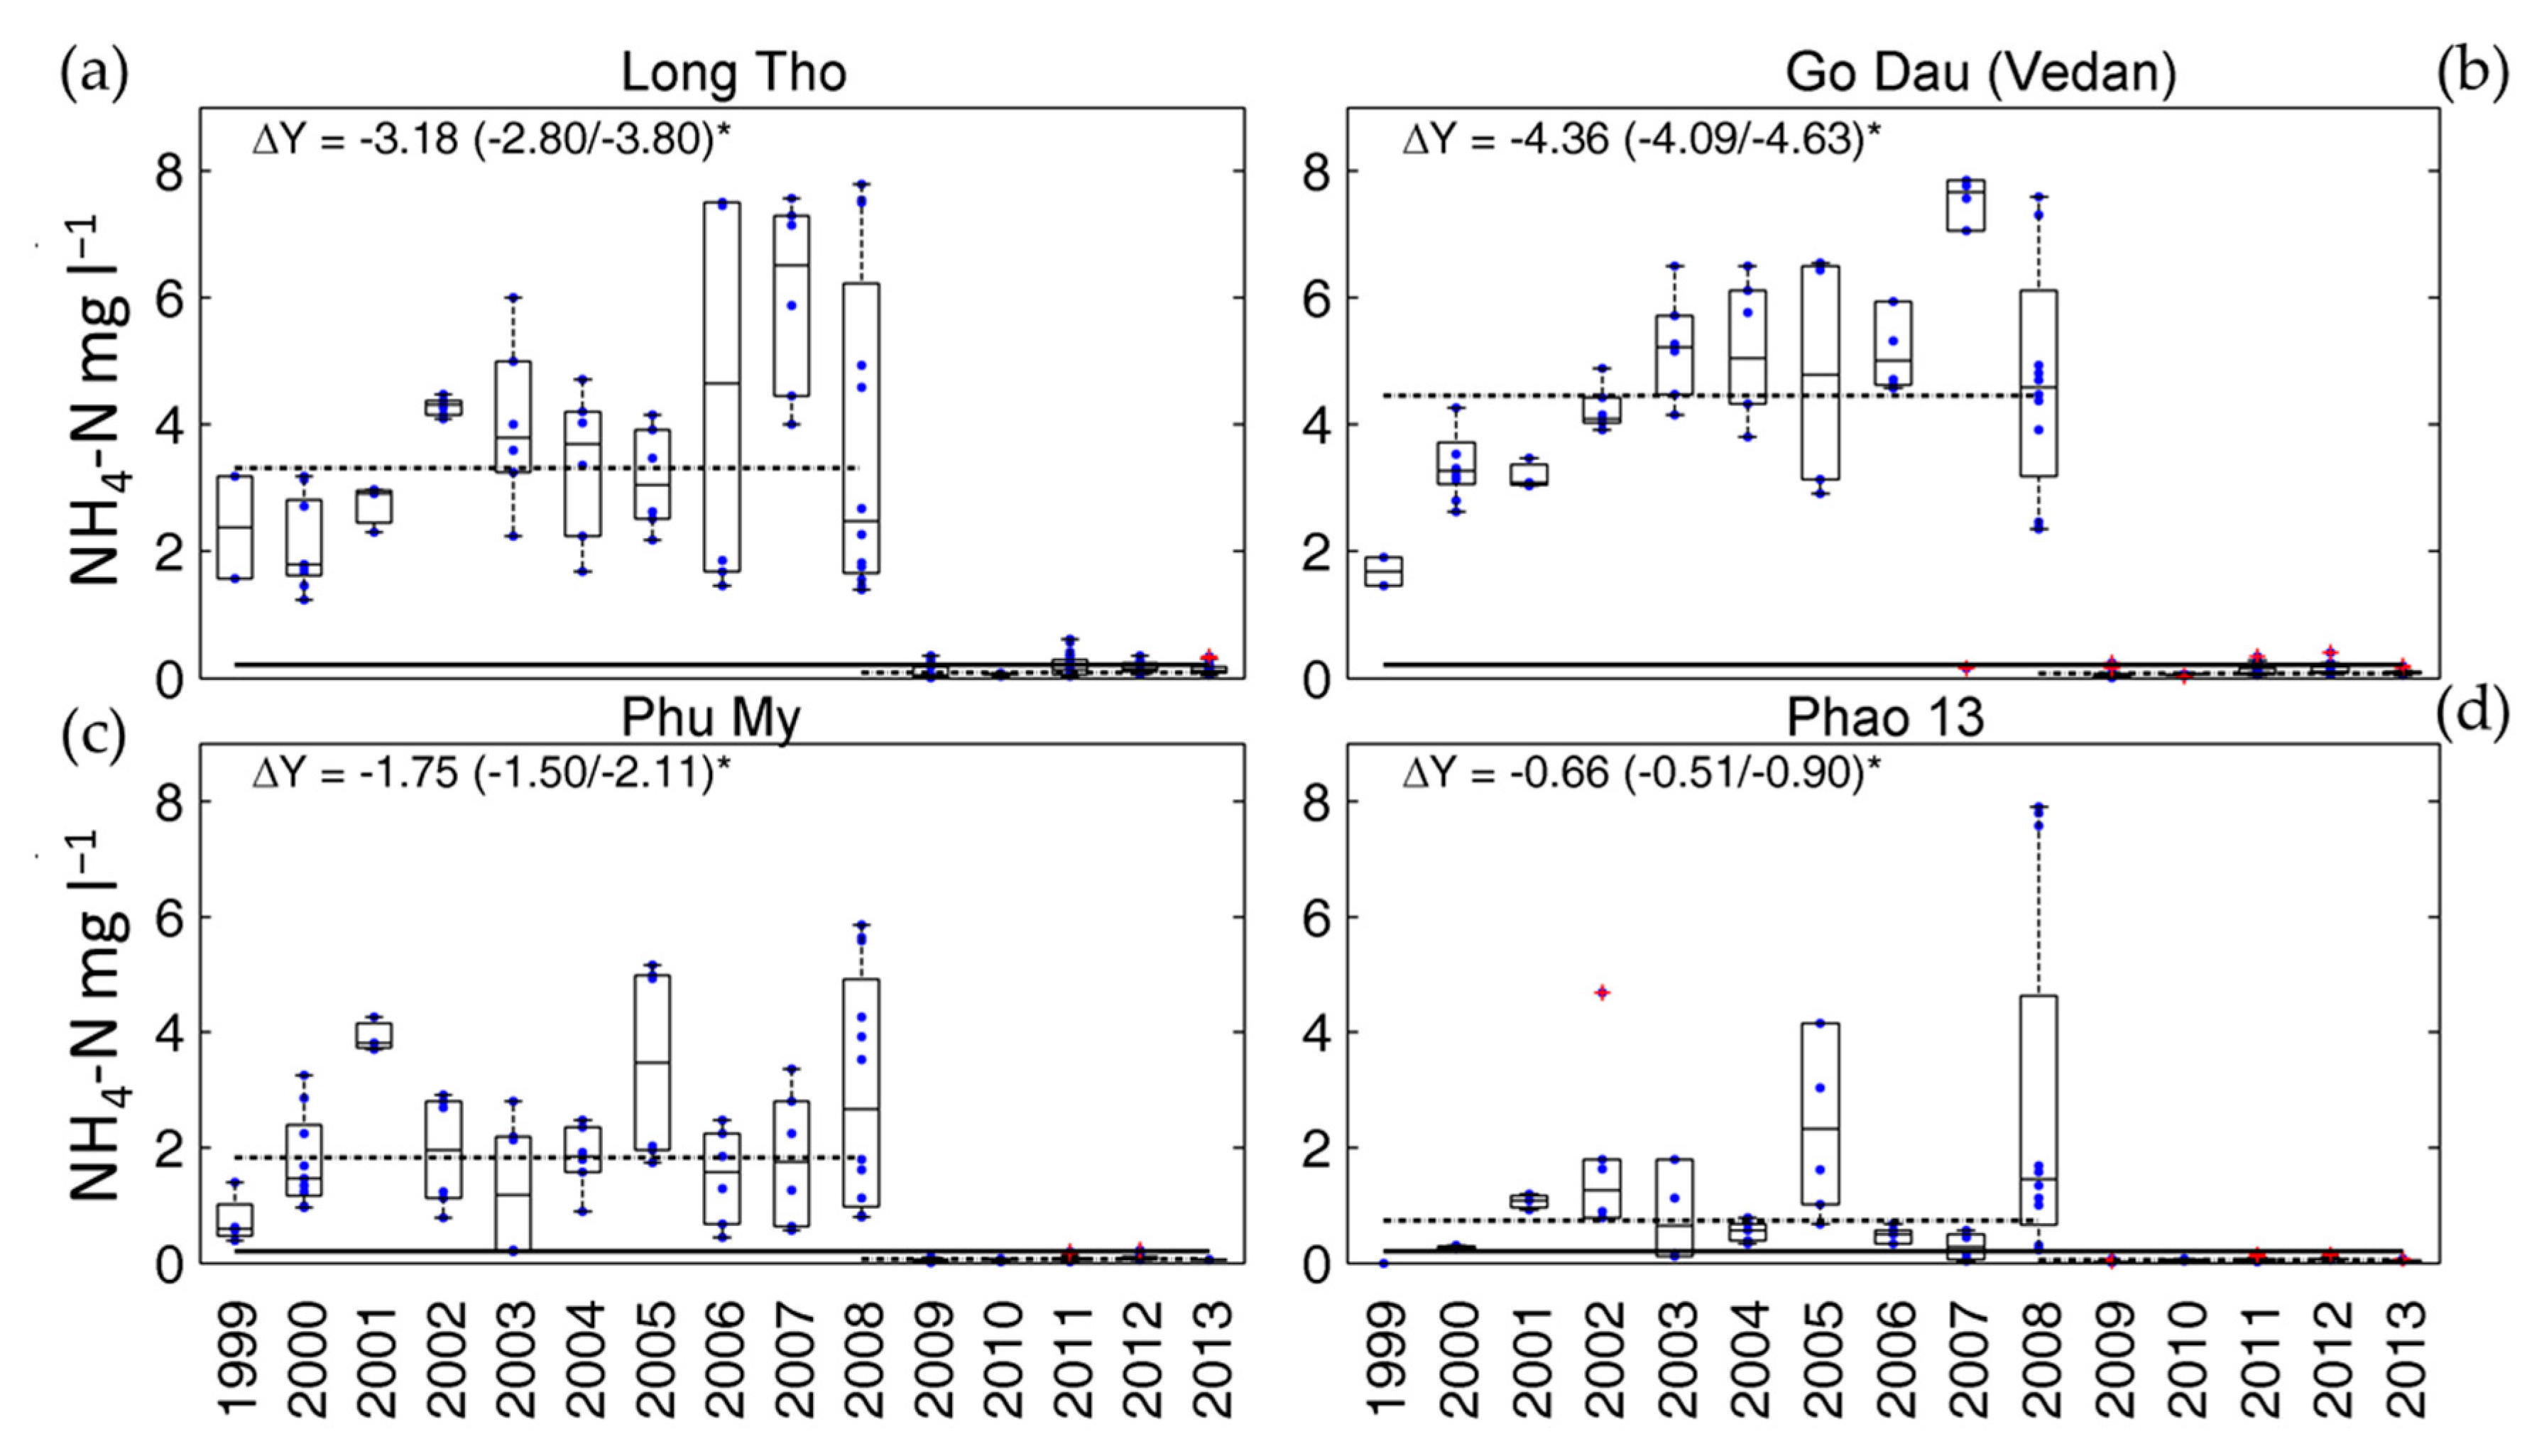
3.1. Quarterly and Long-Term (1999–2013) Evolution of Water Quality

A significant event that marked the history of the Thi Vai watershed’s socio-economic development was the revelation of illegal untreated wastewater discharge from the Vedan factory into the river in 2008. Based on monitoring data compiled by the Institute for Environment and Resources (IER) and DONRE Dong Nai in 2006, 2008 and 2009 (Table 1), the estuary received approximately 84,800 and 19,600 kg day−1 of BOD5 and TN, respectively, before 2008; the Vedan factory was responsible for approximately 80–90% of the pollutant loads (Table 1). As a consequence of removing this point source, the pollutant loads into the estuary were massively reduced by 98% in 2009 (Table 1). To reveal the temporal and spatial variations in water quality within the Thi Vai estuary, we plotted the concentrations of DO, BOD5, NH4, NO2, and NO3 (Figure 2, Figure 3, Figure 4, Figure 5 and Figure 6, respectively) over time (1999–2013) at four stations: Long Tho (TV2), Go Dau (TV4), Phu My (TV8), and Phao 13 (TV9) (Figure 1). As 2008 marked a sharp breakpoint in the water quality data for most of the investigated water quality parameters (e.g., Figure 2 for DO), we subdivided the whole dataset into two periods (1999–2008 and 2009–2013). We also calculated the median and relevant percentiles for each water quality parameter and sampling station (Table 2).

3.1.1. Period before the Vedan Scandal (1999–2008)

Data before 2008 allowed an assessment of the variations in water quality associated with a long-term and recurring pollution period. Untreated wastewater discharge from manufacturing factories directly to the Thi Vai River through illegal pipes was responsible for the input of these pollutants into the water [26]. According to the national news reporting on the legal investigation [59], approximately 35,000 to 45,000 m3 per day of untreated effluents were directly discharged into the Thi Vai River by the Vedan factory for over 15 years. Besides, other factories, such as Phuoc Long (textile), Cofidec (seafood processing), and Mai Tan (paper), discharged ca. 1500, 90, and 300 m3, respectively, of untreated wastewater per day into the river [59]. Consequently, the median concentrations of most water quality parameters exceeded the A2 VNWQS across the estuary (Table 1).
The worst conditions prevailed at Long Tho (TV2) and Go Dau (TV4), the two stations located in the upper and middle part of the estuary (Figure 1). These locations were characterized by depleted DO concentrations (Figure 2) and elevated BOD5 and NH4 (Figure 3 and Figure 4). Go Dau station, located near the Vedan factory, showed the lowest median DO concentrations but highest median NH4 concentrations. At all stations, 89 to 99% of NH4 concentrations were higher than the threshold value (A2 VNWQS) of 0.2 mg L−1. Their median concentrations exceeded the standard by 16, 22, 9, and 7 times at Long Tho, Go Dau, Phu My, and Phao 13, respectively.
Median concentrations of NO2 were slightly elevated at Long Tho and Go Dau station (Figure 5). A substantial increase in NO2 concentrations was observed at the stations located at the lower parts of the estuary. At the station Phu My and Phao 13, 84 and 87% of the measured NO2 concentrations were higher than the threshold value. The highest median concentration of NO2 was found at the station Phu My, exceeding the threshold concentration by 11 times.
In contrast to NH4, NO3 concentrations remained low (Figure 6). The median and 95th percentile of NO3 concentrations were below the threshold value of 5 mg L−1 at all stations. This observation can be attributed to ammonium oxidation inhibition due to the very low DO (Figure 2). According to Baisan [60], oxygen concentrations below 0.5 mg/L in stream waters significantly decrease nitrifying bacteria growth. Wheaton et al. [61] also suggested 2 mg/L as the minimum oxygen level to maintain nitrification in aquaculture. At Go Dau station, 98% of the DO measurements were below 5 mg L−1, and 48% were below 2 mg L−1, while at Long Tho station, 92% of the DO measurements were below 5 mg L−1 and 21% were below 2 mg L−1 (Figure 2). This suggests the effects of deficient oxygen levels in the Thi Vai estuary on ammonium oxidation.

3.1.2. Recovery Period after the Vedan Scandal (2009–2013)

A clear improvement in the Thi Vai estuary’s water quality was observed between 2009 and 2013. The step trend analysis showed a significant increase in DO after 2008 at all stations (Figure 2). The most significant change was observed at Go Dau, followed by Long Tho and Phu My, with a relative ΔY of 114, 59, and 44%, respectively. The slightest change was found at Phao 13 (ΔY = 10%). DO concentrations were only slightly below the VNWQS of 5 mg L−1 at Long Tho and Go Dau stations. The improvement in DO is coherent with a decrease in BOD5 concentrations at the stations Long Tho (ΔY = −17%) and Go Dau (ΔY = −28%), whereas no significant step trend was detected for the stations Phy My and Phao 13 (Figure 3). BOD5 concentrations ranged from 5 to 6 mg L−1 at all stations; approximately 70% of the measurements were below the threshold of 6 mg L−1.
Relative to the 1993–2008 period, NH4 concentrations were significantly reduced; these remained below the threshold value of 0.2 mg L−1 at all stations from 2009 to 2013 (Figure 4) with relative ΔY ranging from −98 to −91%. The highest NH4 concentrations were found at the station Long Tho but with only 24% of the measurements above the threshold. On the other hand, there was a significant increase in NO2 concentrations at Long Tho (ΔY = 580%) and Go Dau (ΔY = 1700%) station, whereas NO2 concentrations decreased at Phy My (ΔY = −56%) and Phao 13 (ΔY = −55%) (Figure 4). The strong increase in NO2 at the upper and middle parts of the Thi Vai estuary can be attributed to the increase in DO concentrations at these parts of the estuary, favoring the ammonium oxidation process. Finally, NO3 concentrations remained well below the VNWQS from 2009 to 2013. However, we observed a significant increase in NO3 concentration at Go Dau (ΔY = 67%) but no significant variation at Long Tho (Figure 5). At Phu My and Phao 13, nitrate concentrations decreased by −45 and −55%, respectively.
Overall, the decrease in point source emissions along the Thi Vai estuary after the Vedan scandal resulted in a general improvement of the aquatic environment, including decreased BOD5 and increased dissolved oxygen. This promoted the oxidation of NH4 towards nitrite and consequently reduced N toxicity, as the most toxic N species (unionized ammonia) are interrelated with NH4+ through pH and water temperature [61]. However, despite the improved water quality, nitrite concentrations remained above the guideline values for all four stations (Figure 5), and thus became the species of most significant environmental concern.
The overall positive trends for the inorganic nitrogen fractions indicated an increase in nitrogen loads from point and/or diffuse sources into the Thi Vai estuary from 2009 to 2013, reflecting the rapid economic growth in the Thi Vai catchment. The increase in industrial enterprises in the districts Long Thanh and Nhon Trach, bordering the Thi Vai estuary, were responsible for point source pollution [62]. Besides, the growing population, fertilizer application, the number of poultry and pigs, and aquaculture production resulted in increased diffuse pollution in the catchment [62].

3.2. Temporal and Spatial Analysis—Short Term

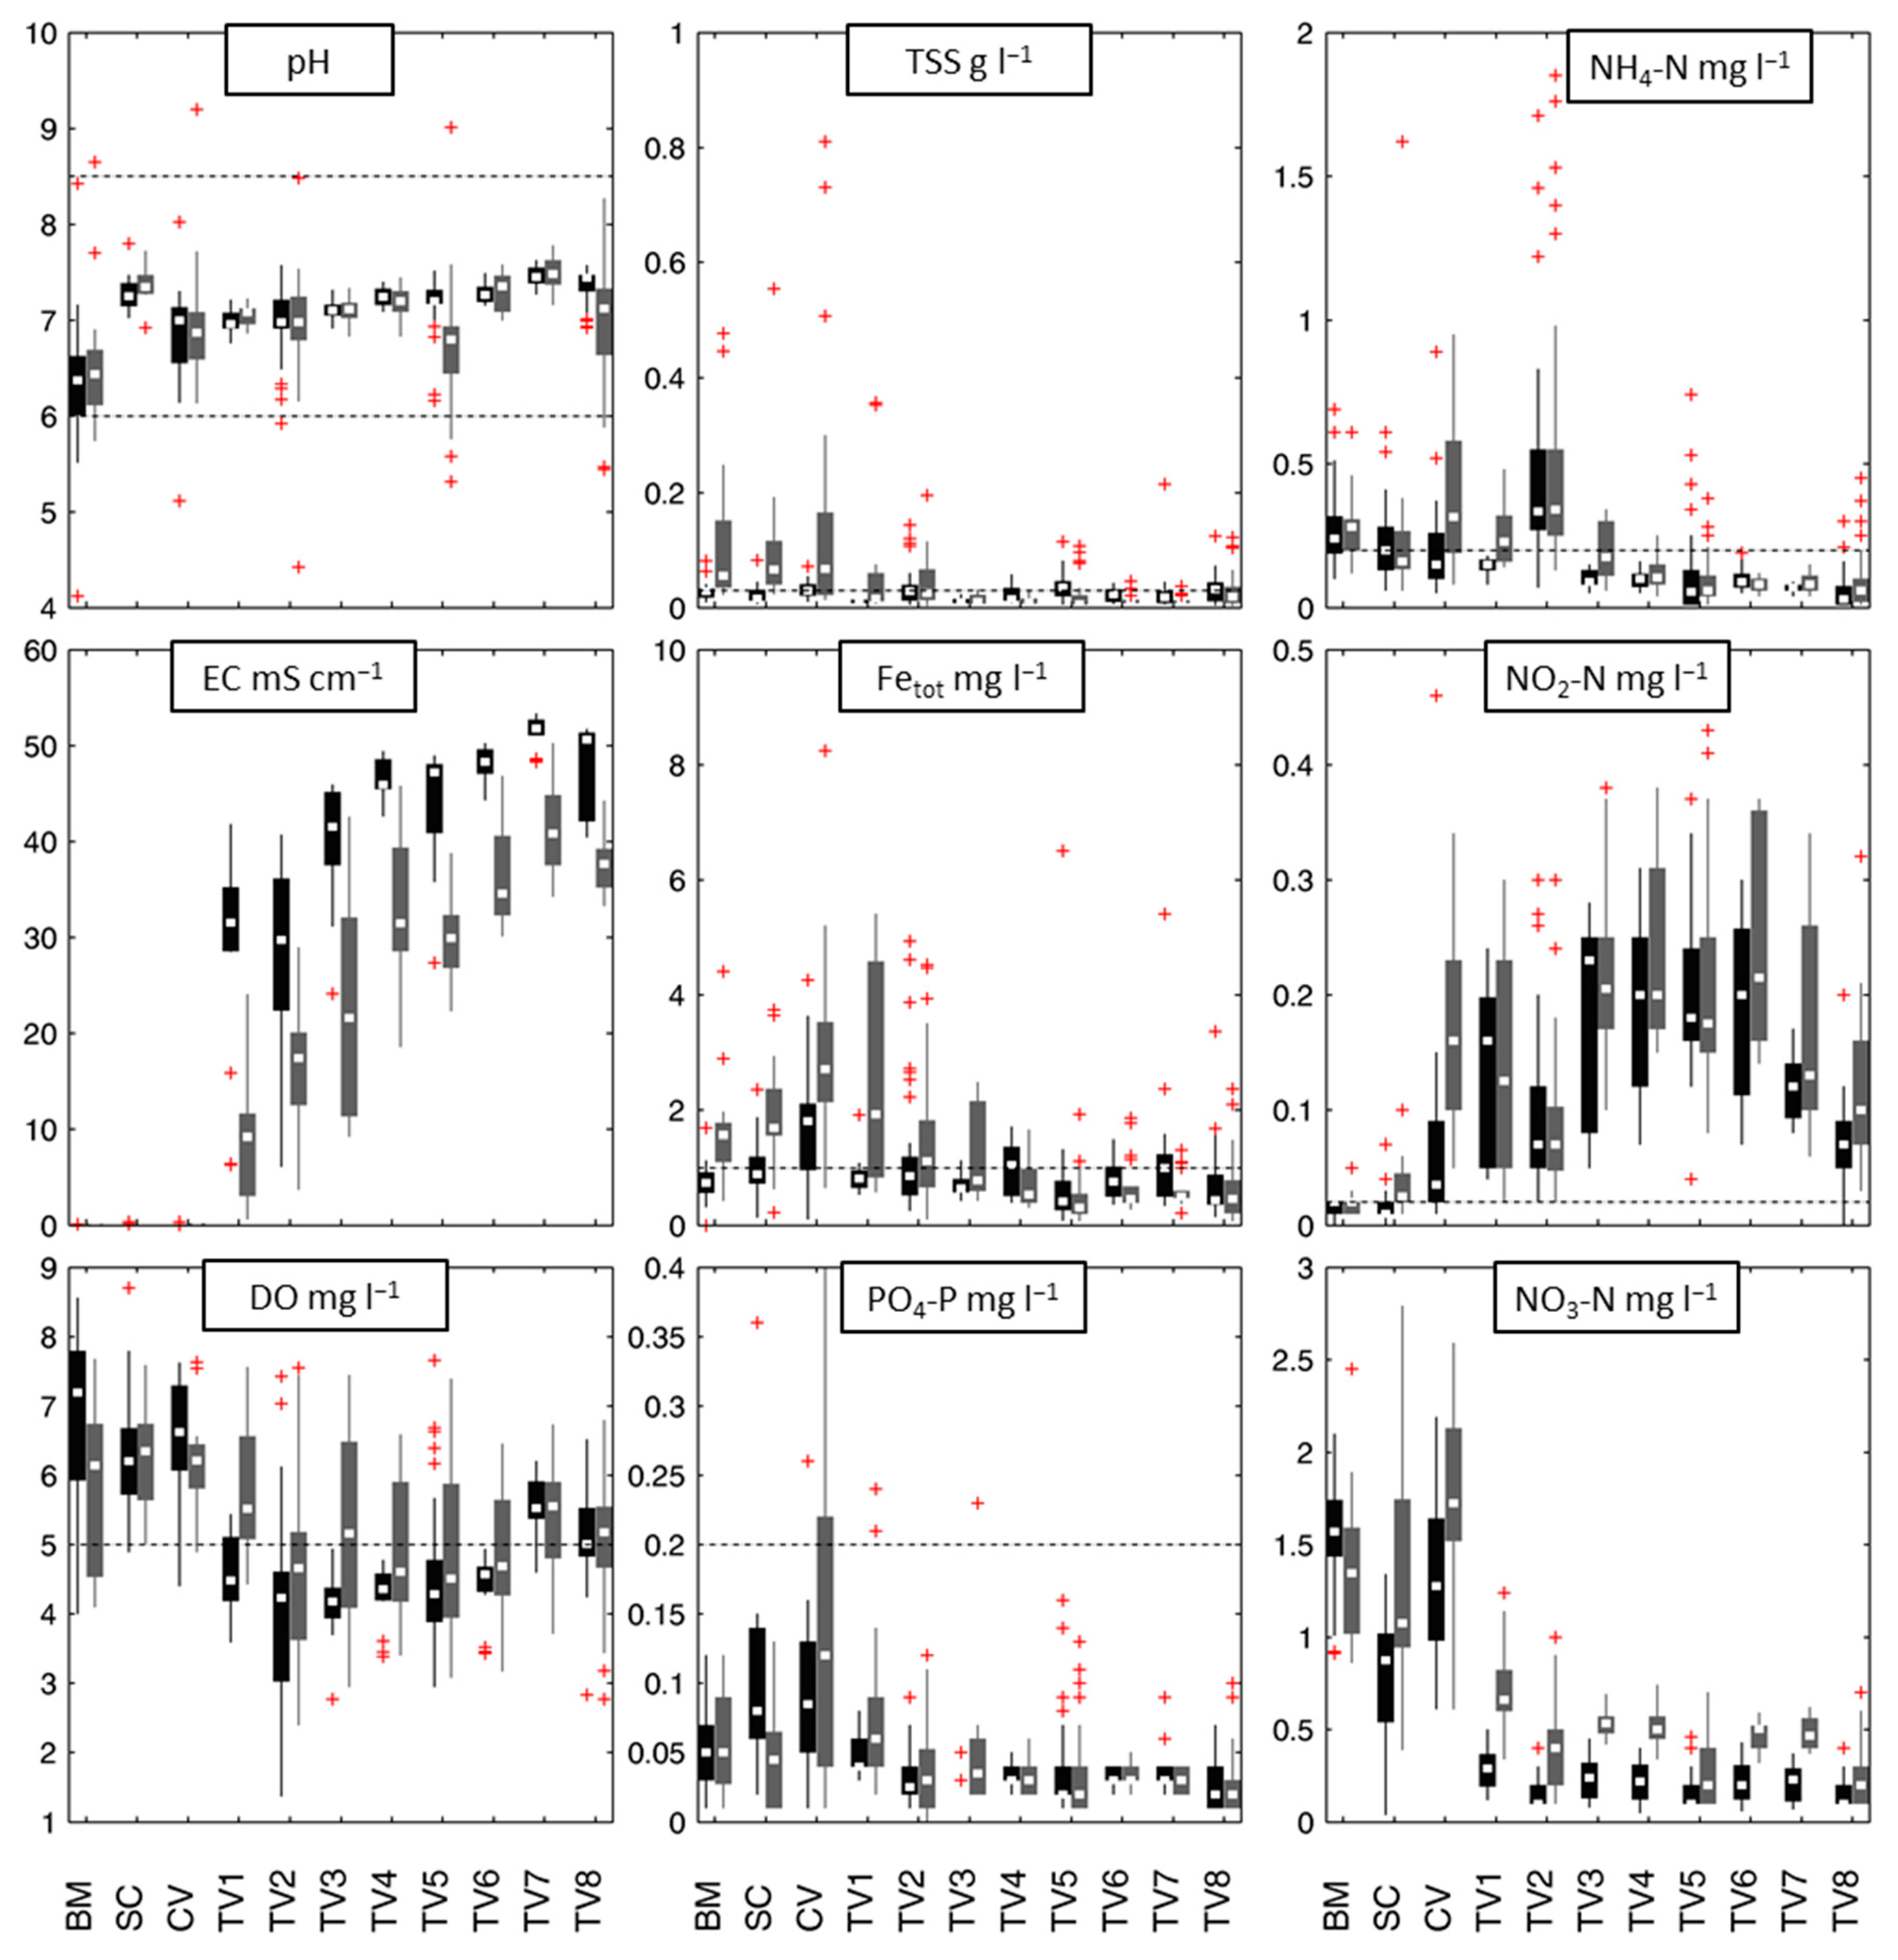
3.2.1. Descriptive Statistics of Short-Term Water Parameters

The statistical analysis of water quality parameters for the short-term dataset (March 2013 to September 2014) is shown in detail in Table 3. The spatial and temporal (dry and rainy season) variations in the water quality parameters are shown in Figure 7. Water temperature averages ranged from 28 to 31 °C and showed only slight variations between the sampling sites. Low EC values of the tributary sites (BM, SC, and CV) were typical of freshwater sources, whereas the increasing trend of EC from stations TV1 to TV8 revealed the mixing with seawater. In the dry season, EC was remarkably higher in the estuary than in the rainy season, revealing brackish water in the estuary. We also observed a significant correlation between EC and pH (Pearson’s r = 0.78, p < 0.05). This reflects the natural dilution of seawater by freshwater from the tributaries [63]. Other parameters, including pH, PO4, NO2, and NO3 were below the levels of the Vietnamese water quality standards. Averaged dissolved oxygen concentrations of the estuary stations (TV1 to TV6) were below the threshold level (5 mg L−1) in both seasons, in contrast to marine stations (TV7 and TV8). In general, the DO concentrations in the estuary were, on average, lower in the dry season than the rainy season. We also observed a positive but not significant correlation between DO and EC (Pearson’s r = 0.22, p = 0.59). Under environmental conditions, increasing salinity often decreases DO concentrations, resulting in a negative correlation [40]. This indicates that the DO balance of the Thi Vai estuary is still negatively affected by anthropogenic processes. Finally, the tributary stations and the upper estuary stations (TV1 and TV2) showed elevated TSS and Fetotal, which was more noticeable during the rainy season. This observation was coherent with an enhanced surface runoff associated with abundant precipitation in the rainy season.

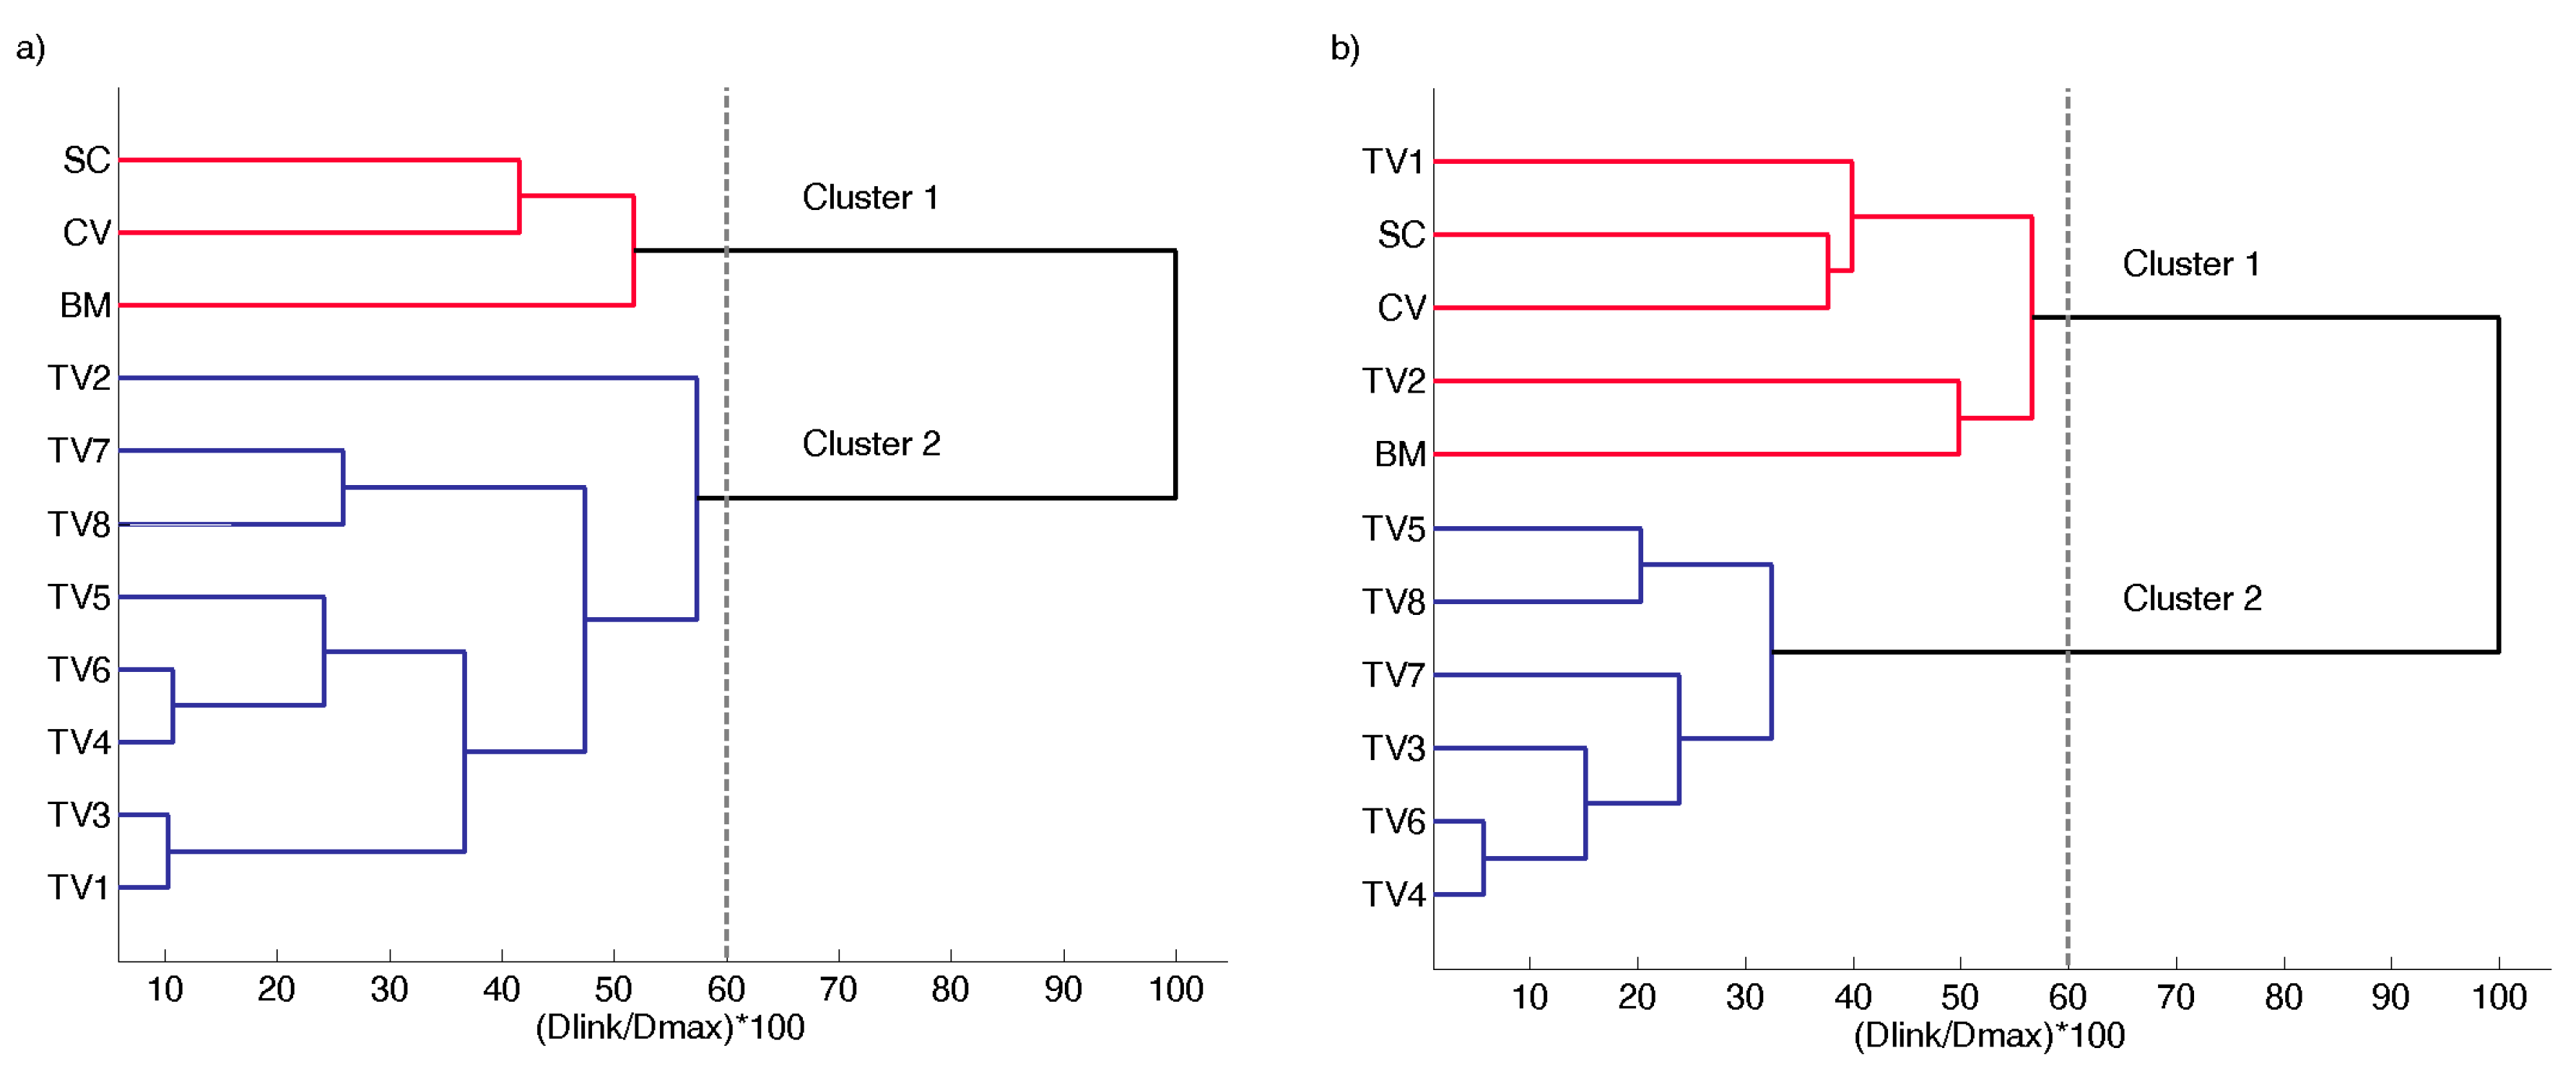
3.2.2. Cluster Analysis of Short-Term Temporal and Spatial Variations in Water Quality

Hierarchical agglomerative cluster analysis was applied to the river water quality dataset to identify spatial and temporal variations of water quality in the estuary and its tributaries. The resulting dendrograms for the dry and the rainy season are shown in Figure 8. For both seasons, CA classified the 11 sampling stations into two distinct clusters at (Dlink/Dmax) × 100 < 60. It is also important to note that water temperature, EC, and salinity were not considered in this analysis as they were either constant or primarily driven by water mixing, as stated in Section 3.2.
A clear distinction between the tributaries and the estuary can be observed in the dry season. This is related to the spatial variations of DO, NO3, and NO2. During the dry season, the tributary stations had higher DO and NO3 but lower NO2 concentrations than the estuary stations. In fact, cluster 1 comprised the three tributaries (Bung Mon, Suoi Ca, and Cau Vac). The stations TV1 to TV8, located along the estuary, were grouped in Cluster 2 according to their location in the estuary. The upper (TV1, TV3), middle (TV4–TV6) and lower parts (TV7–TV8) were mainly clustered according to their spatial similarities in DO and NO2. The middle part of the estuary, however, showed the lowest DO and highest NO2 concentrations. Moreover, station TV2 remained separate because of elevated concentrations of pollutants associated with numerous industrial point sources close to this site.
In the rainy season, stations TV1 and TV2 joined the tributary stations in Cluster 1 (Figure 8b). Cluster 1 showed high concentrations of TSS, PO4, and Fetotal. This observation could be related to the increased freshwater discharge into the estuary’s upper part from the catchment during the rainy season, leading to significantly higher terrigenous material loads. The other stations in the estuary were grouped in Cluster 2. We observed a much higher dissimilarity between the two clusters in the rainy season than the dry season. This will be further discussed through principal component analysis in the following section.

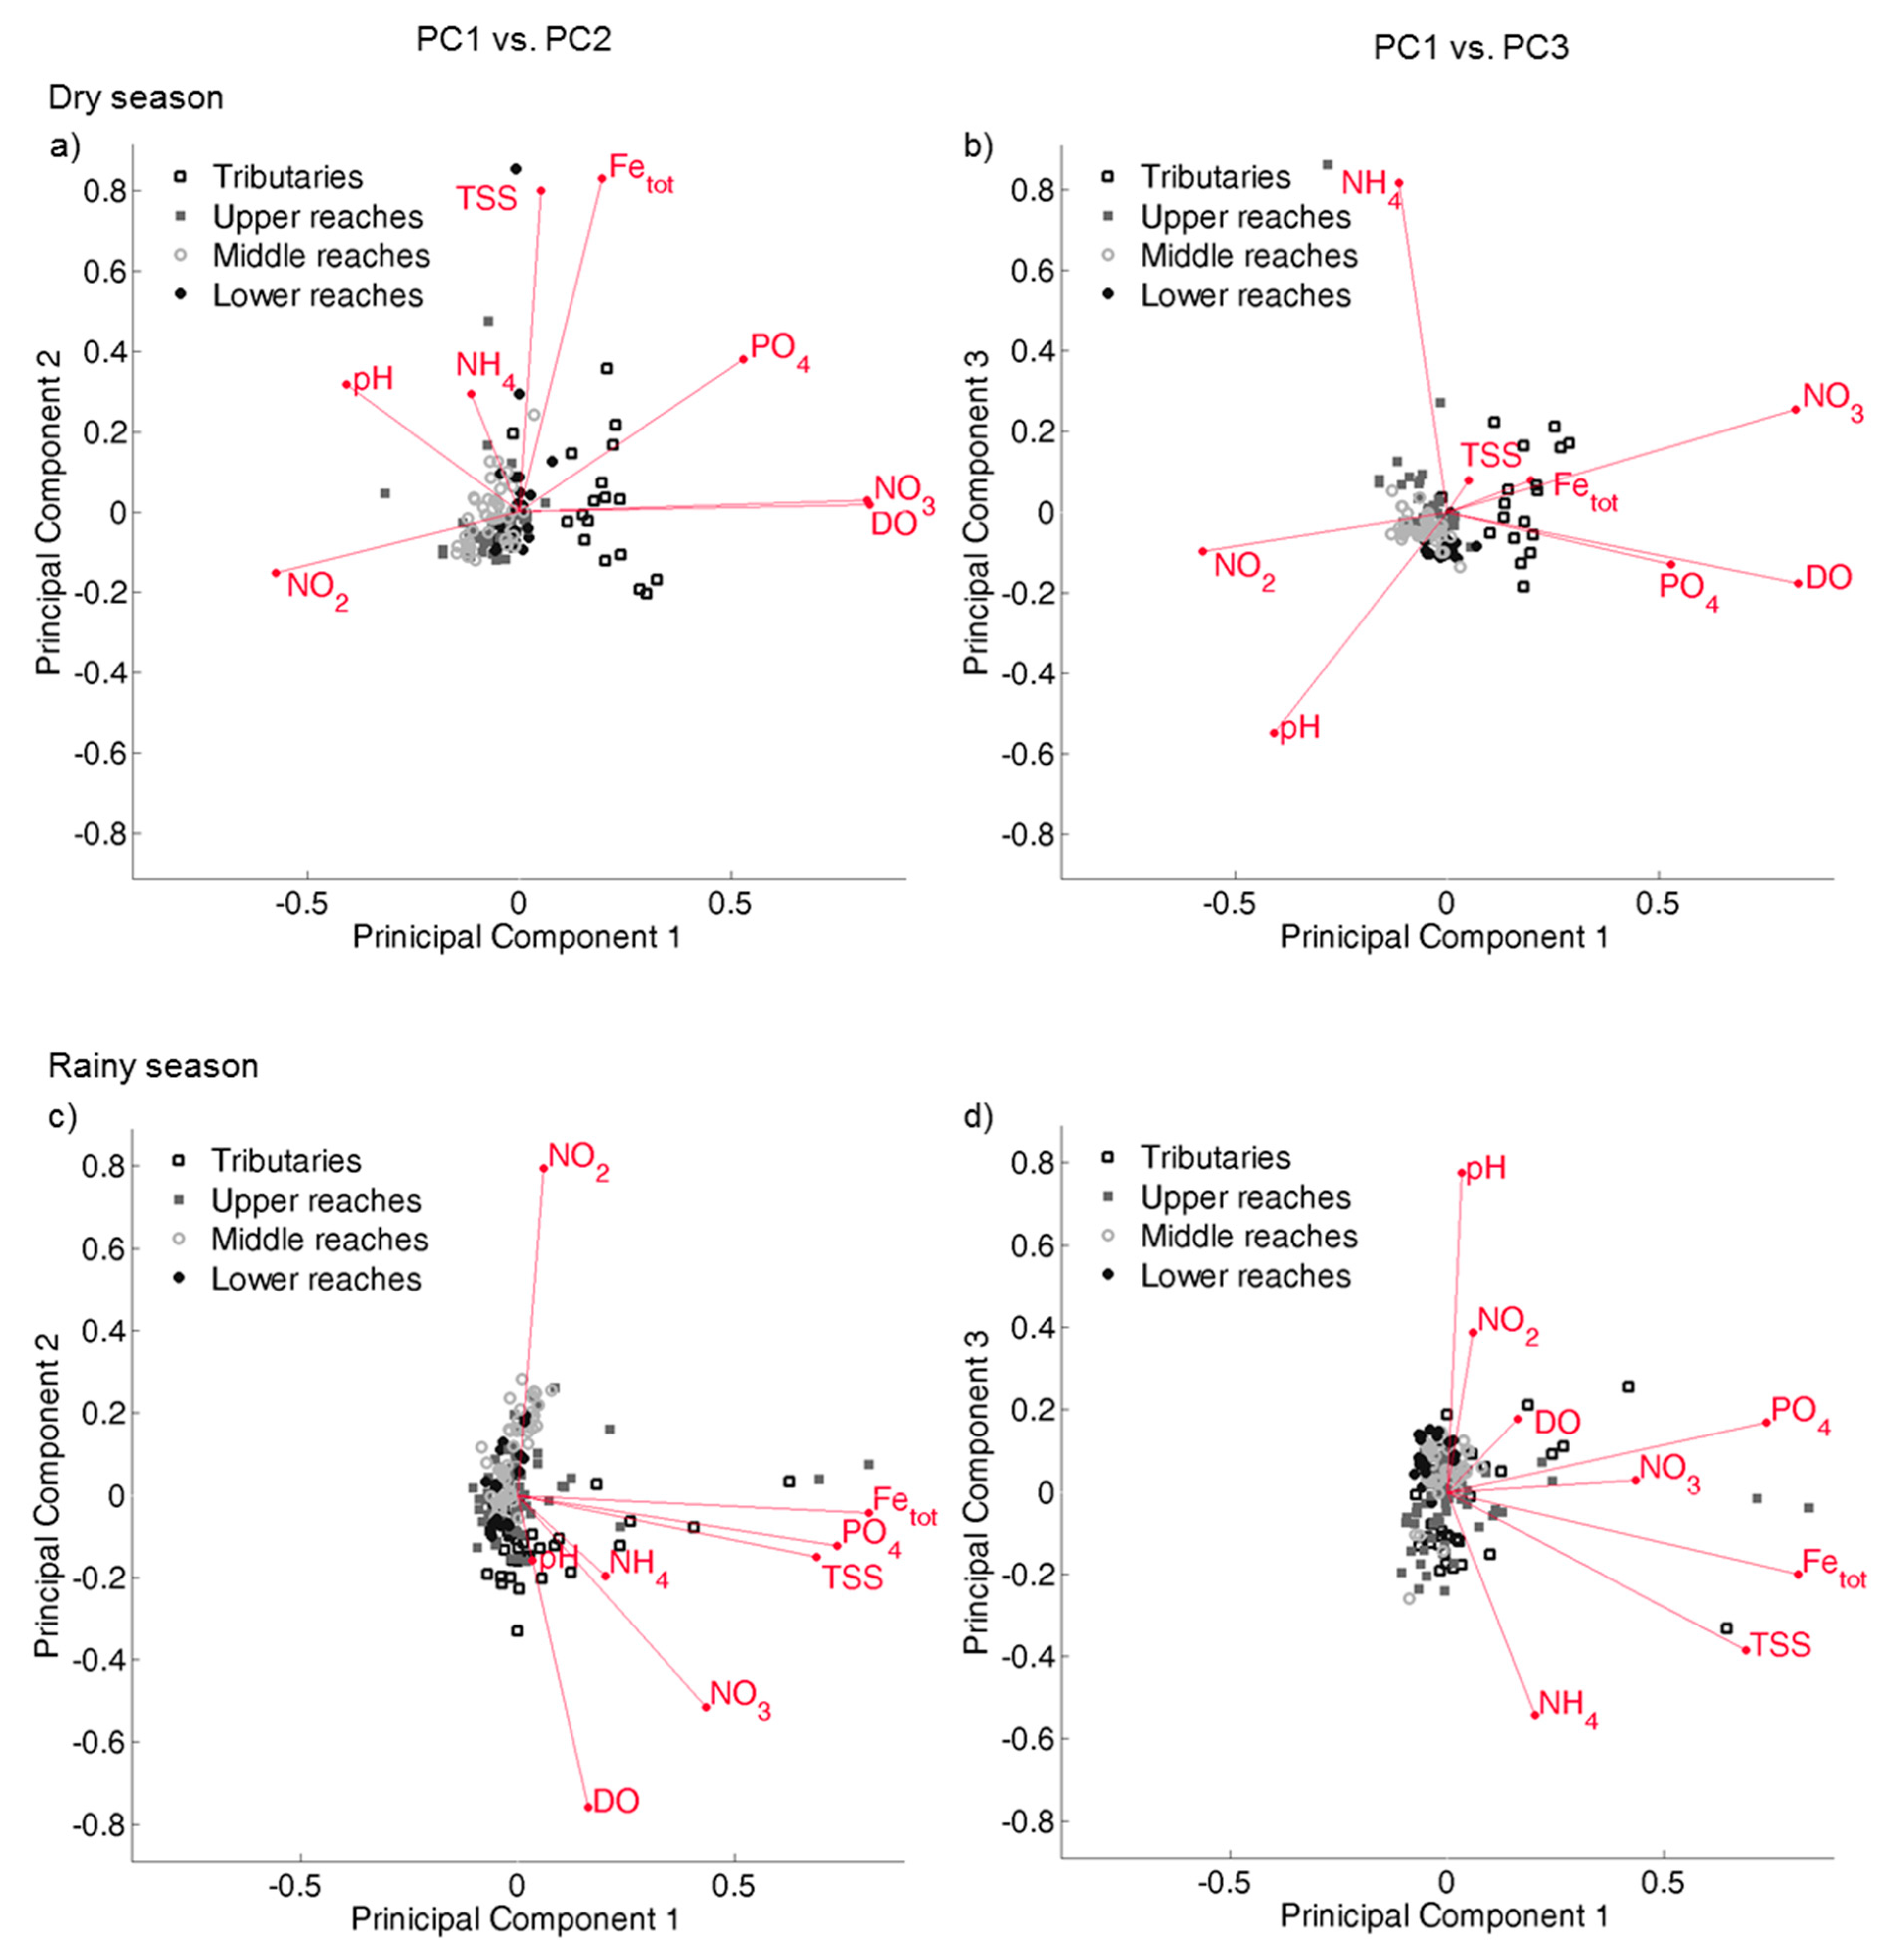
3.2.3. Principal Component Analysis on Current Drivers of Pollution in the Thi Vai River

Principal component analysis was conducted to provide an in-depth assessment of the dataset. To test whether this was an appropriate data treatment approach, we calculated KMO values, which ranged from 0.57 to 0.62. This confirmed the applicability of this multivariate approach [32]. The results of Bartlett’s test of sphericity also showed significant relationships between the variables (p < 0.05). Accordingly, Table 4 below summarizes loadings and eigenvalues of three principal components (PCs), as well as variance and cumulative variance explained by each component.
Overall, the three principal components described 58.9, 62.4, and 60.0% of the observed variation in water quality over the entire period, the dry season, and rainy season, respectively. The loadings represent the correlation between the PCs and original variables. Liu et al. [31] classified the component loadings as “strong”, “moderate”, and “weak”, corresponding to absolute loading values of > 0.75, 0.75 to 0.5, and 0.50 to 0.30, respectively. A strong positive or negative loading of a parameter indicates it was highly involved in the corresponding PC [64]. Loadings of the PCs are presented with the normalized scores in Figure 9.
In the rainy season, the first principal component (PC1) explained approximately 24% of the total variance, with strong positive loadings of TSS (0.69), PO4 (0.74), and Fetotal (0.81). As indicated by their scores, the tributaries and upper part of the Thi Vai estuary were associated with PC1 during the rainy season (Figure 9c). This confirms the results of the cluster analysis. In the Thi Vai catchment area, the rainy season is associated with nearly 80% of the annual rainfall [36]. Accordingly, this PC could represent soil erosion processes by enhanced surface runoff in the catchment, which are especially important in the rainy season [31,32]. This results in large amounts of eroded organic and inorganic soil components, including TSS, PO4, and total Fe. It is important to note that the soils in the Thi Vai catchment predominantly consist of acrisols and ferrasols, known for their high iron contents [36]. The second principal component, accounting for approximately 20% of the total variance, was strongly related to DO (0.76), NO2 (−0.79), and NO3 (0.52). Therefore, this PC could be associated with the influence of dissolved oxygen on the N cycle, as discussed previously (Section 3.1.2). This was further supported by the negative correlation between DO and NO2 (Figure 9a,c). It is also worth noting that the study area hosts intensive agriculture activities, e.g., rubber and a small proportion of rice crop area in the upper catchment, leading to high amounts of nutrients, which enter the estuary through the tributaries via diffuse pollution [65]. These findings are in good agreement with Le et al. [30], who also investigated a catchment area in South Vietnam using PCA and CA. They also identified a PC related to erosion, associated with Fe, TSS, and PO4, and a PC associated with DO and NO3 processes during the rainy season. Similar results have also been found for estuaries in other tropical regions (e.g., Malaysia and India), relating surface runoff to elevated Fe, TSS, and nutrient loads by applying PCA [63,66,67]. The third component had strong loadings on pH (0.78) and medium loadings on NH4 (−0.54) (Figure 9b,d). It is well known that marine water is more alkaline than the Thi Vai tributaries due to the dominance of acid soils in the catchment [63,68]. Besides, tributary water sites had lower NH4 concentrations than the estuarine and marine stations because of major N emission sources downstream (Table 1).
In the dry season, the first component was characterized by nutrient parameters with positive loadings of DO (0.83), NO2 (−0.58), NO3 (0.82), and PO4 (0.53). This observation indicated that smaller water volumes associated with decreasing precipitation in the dry season resulted in insignificant dilution effects on nutrients discharged from point sources, e.g., wastewater from industrial facilities, aquacultures, or urban areas [69]. Besides, this principal component described the influence of DO on the processes of nitrification and denitrification, which determine the transformation of nitrite and nitrate [70]. High DO and NO3 concentrations were observed, whereas less NO2 occurred in the tributaries. The stations in the estuary showed lower DO and NO3 concentrations while NO2 concentrations were elevated, especially in the middle part, supporting the results of the CA. Parameters such as soil erosion were explained in the second component, which described 21.1% of the total variance. Similar to the rainy season, pH and NH4 were presented by the third component.

3.2.4. Implications for Water Quality Management

Currently, the management strategy of the Thi Vai water quality focuses only on industrial zones bordering the water shores. Clearly, untreated industrial and domestic wastewater were responsible for the input of NO2, NO3, PO4, and NH4 in the Thi Vai estuary in the past. The worst conditions at the stations Long Tho and Go Dau (1999 to 2008) were associated with manufacturing factories directly discharging untreated industrial effluent through illegal pipes [26]. Therefore, abating nutrient pollution should first aim at enhancing the treatment of effluents from manufacturing factories. This could be encouraged by incentives such as awarding grants for environmental management programs (inspection, supervision, and monitoring) and stricter regulation and environmental liability through Environmental Damage and/or Hazardous Products Acts [71].
Human activities, such as construction, logging, mining, and other activities, increase soil exposure and reduce vegetation coverage [72]. Besides, agricultural activities could also contribute to the currently poor water quality, although it remains challenging to quantify their contributions relative to the industrial emission [73]. The Thi Vai river was also polluted by N compounds (especially NO2 and NO3); the situation was shown to be worsened in the rainy season [69]. Therefore, although industrial point sources’ emissions could have been abated after the Vedan scandal in 2008, nutrient management practices should be improved to minimize non-point sources (e.g., agriculture) [36]. To minimize the emission of TSS, nutrients, and Fe caused by runoff, it is timely and important to establish green corridors and infrastructure (e.g., stormwater retention ponds) along the river stream to prevent terrestrial particles from entering the aquatic environment [48]. Green corridors (e.g., trees, shrubs, and grasses along the edges of fields) are especially important as they contribute to abate the nutrient loads by absorbing or filtering out nutrients before reaching the surrounding water bodies. Other strategies should also be considered to improve soil health improvement and decrease erosion, runoff, and soil compaction to reduce the frequency and amplitude of field tillage [74].

4. Conclusions

The analysis of trends, changes, and water quality patterns over 15 years in the Thi Vai estuary and its main tributaries represented a novel approach to identify the effects of anthropogenic activities on river water quality. After the environmental scandal of illegal wastewater discharge of a major industrial factory in 2008, a general improvement was observed for most of the water quality parameters. On the other hand, the multivariate analysis results also pointed out non-point emission sources in this area. Especially, surface runoff in the catchment and stormwater loads from impervious areas contribute to an enhanced TSS and Fe delivery into the tributaries and the upper part of the estuary during the rainy season.
Given that anthropogenic activities could intimately affect the environmental quality of the surrounding ecosystem, this research demonstrated the need to combine long-term environmental monitoring data, history of socio-economic development, and environmental regulation and enforcement strategy. The outcome is essential to evaluate the impacts of anthropogenic stressors on the environment, determine the efficiency of environmental policy in place, and guide future management strategies. In the Thi Vai estuary, adopting multiple approaches for assessing spatial–temporal water dynamics is imperative for integrated water quality management. Environmental enforcement had an evident and positive impact on abating illegal industrial discharge. However, several non-point sources persist, and therefore, further approaches should be adapted to prevent contaminants from reaching water bodies.

Author Contributions

Conceptualization and methodology, M.L. and H.Q.N.; analysis, M.L., H.L., and S.Z.; data curation, M.L., T.D.H.L., H.L., S.Z., and H.Q.N.; writing—original draft preparation, M.L. and H.Q.N.; writing—review and editing, M.L., H.Q.N., T.D.H.L., H.L., S.Z., D.H.D., Q.D.L., and G.M. All authors have read and agreed to the published version of the manuscript.

Funding

This research was funded by the Bundesministerium für Bildung und Forschung (BMBF), grant number 02WCL1217A; by the Vietnam National University-Ho Chi Minh City (VNU-HCMC), grant number NDT2012-24-01/HD-KHCN; by the Vietnamese Ministry of Natural Resources and Environment (MONRE) via Center of Environmental Monitoring of Southern Vietnam, grant number TNMT.2019.04.01; and the APC was funded by the German Research Foundation and the Open Access Publication Funds of Technische Universität Braunschweig.

Institutional Review Board Statement

Not applicable.

Informed Consent Statement

Not applicable.

Data Availability Statement

Data developed in this study will be made available on request to the corresponding authors.

Acknowledgments

This study is part of the EWATEC-COAST project. The authors would like to thank the Bundesministerium für Bildung und Forschung (BMBF, Grants No.: 02WCL1217A), Germany and the Vietnam National University-Ho Chi Minh City (VNU-HCMC, Grants No.: NDT2012-24-01/HD-KHCN) for funding this study. The second author received recent funding from the Vietnamese Ministry of Natural Resources and Environment (MONRE) for the project “Water quality forecasting and warning system for Thi Vai river basin management” code: TNMT.2019.04.01 via Center of Environmental Monitoring of Southern Vietnam. Finally, we acknowledge support by the German Research Foundation and the Open Access Publication Funds of Technische Universität Braunschweig for financing the APC expense.

Conflicts of Interest

The authors declare no conflict of interest.

References

  1. Liang, W.; Yang, M. Urbanization, economic growth and environmental pollution: Evidence from China. Sustain. Comput. Inform. Syst. 2019, 21, 1–9. [Google Scholar] [CrossRef]
  2. Zinia, N.J.; Kroeze, C. Future trends in urbanization and coastal water pollution in the Bay of Bengal: The lived experience. Environ. Dev. Sustain. 2015, 17, 531–546. [Google Scholar] [CrossRef]
  3. Kroeze, C.; Gabbert, S.; Hofstra, N.; A Koelmans, A.; Li, A.; Löhr, A.; Ludwig, F.; Strokal, M.; Verburg, C.; Vermeulen, L.; et al. Global modelling of surface water quality: A multi-pollutant approach. Curr. Opin. Environ. Sustain. 2016, 23, 35–45. [Google Scholar] [CrossRef]
  4. Bojarczuk, A.; Jelonkiewicz, L.; Lenart-Boroń, A. The effect of anthropogenic and natural factors on the prevalence of physicochemical parameters of water and bacterial water quality indicators along the river Białka, southern Poland. Environ. Sci. Pollut. Res. 2018, 25, 10102–10114. [Google Scholar] [CrossRef] [PubMed] [Green Version]
  5. Soares, A.L.C.; Pinto, C.C.; Oliveira, S.C. Impacts of anthropogenic activities and calculation of the relative risk of violating surface water quality standards established by environmental legislation: A case study from the Piracicaba and Paraopeba river basins, Brazil. Environ. Sci. Pollut. Res. 2020, 27, 1–5. [Google Scholar] [CrossRef]
  6. Schulz, C.-J.; Cañedo-Argüelles, M. Lost in translation: The German literature on freshwater salinization. Philos. Trans. R. Soc. B Biol. Sci. 2019, 374, 20180007. [Google Scholar] [CrossRef] [Green Version]
  7. Ziemann, H.; Schulz, C.-J. Methods for biological assessment of salt-loaded running waters–fundamentals, current positions and perspectives. Limnologica 2011, 41, 90–95. [Google Scholar] [CrossRef] [Green Version]
  8. Malaj, E.; Von Der Ohe, P.C.; Grote, M.; Kuehne, R.; Mondy, C.P.; Usseglio-Polatera, P.; Brack, W.; Schaefer, R.B. Organic chemicals jeopardize the health of freshwater ecosystems on the continental scale. Proc. Natl. Acad. Sci. USA 2014, 111, 9549–9554. [Google Scholar] [CrossRef] [Green Version]
  9. Stehle, S.; Schulz, R. Pesticide authorization in the EU—Environment unprotected? Sci. Pollut. Res. 2015, 22, 19632–19647. [Google Scholar] [CrossRef]
  10. Campo, J.; Masiá, A.; Blasco, C.; Picó, Y. Occurrence and removal efficiency of pesticides in sewage treatment plants of four Mediterranean River Basins. J. Hazard. Mater. 2013, 263, 146–157. [Google Scholar] [CrossRef]
  11. Gerecke, A.C.; Schärer, M.; Singer, H.P.; Müller, S.R.; Schwarzenbach, R.P.; Sägesser, M.; Ochsenbein, U.; Popow, G. Sources of pesticides in surface waters in Switzerland: Pesticide load through waste water treatment plants—Current situation and reduction potential. Chemosphere 2002, 48, 307–315. [Google Scholar] [CrossRef]
  12. Preisner, M. Surface Water Pollution by Untreated Municipal Wastewater Discharge Due to a Sewer Failure. Environ. Process. 2020, 7, 767–780. [Google Scholar] [CrossRef]
  13. Conley, D.J.; Paerl, H.W.; Howarth, R.W.; Boesch, D.F.; Seitzinger, S.P.; Havens, K.E.; Lancelot, C.; Likens, G.E. Controlling Eutrophication: Nitrogen and Phosphorus. Science 2009, 323, 1014–1015. [Google Scholar] [CrossRef]
  14. Braukmann, U.; Böhme, D. Salt pollution of the middle and lower sections of the river Werra (Germany) and its impact on benthic macroinvertebrates. Limnologica 2011, 41, 113–124. [Google Scholar] [CrossRef] [Green Version]
  15. Kefford, B.J.; Buchwalter, D.; Cañedo-Argüelles, M.; Davis, J.; Duncan, R.P.; Hoffmann, A.; Thompson, R. Salinized rivers: Degraded systems or new habitats for salt-tolerant faunas? Biol. Lett. 2016, 12, 20151072. [Google Scholar] [CrossRef] [Green Version]
  16. Beketov, M.A.; Liess, M. Acute and delayed effects of the neonicotinoid insecticide thiacloprid on seven freshwater arthropods. Environ. Toxicol. Chem. Int. J. 2008, 27, 461–470. [Google Scholar] [CrossRef]
  17. Kasai, A.; Hayashi, T.I.; Ohnishi, H.; Suzuki, K.; Hayasaka, D.; Goka, K. Fipronil application on rice paddy fields reduces densities of common skimmer and scarlet skimmer. Sci. Rep. 2016, 6, 23055. [Google Scholar] [CrossRef] [PubMed] [Green Version]
  18. Roessink, I.; Merga, L.B.; Zweers, H.J.; Brink, P.J.V.D. The neonicotinoid imidacloprid shows high chronic toxicity to mayfly nymphs. Environ. Toxicol. Chem. 2013, 32, 1096–1100. [Google Scholar] [CrossRef]
  19. Van Dijk, T.C.; Van Staalduinen, M.A.; Van Der Sluijs, J.P. Macro-invertebrate decline in surface water polluted with imidacloprid. PLoS ONE 2013, 8, e62374. [Google Scholar] [CrossRef] [PubMed] [Green Version]
  20. UN-Water. United Nations UN World Water Development Report 2003; Unesco: Fontenoy, France, 2003. [Google Scholar]
  21. Chabba, A.P.S. Water-Borne Diseases in India 2013. Available online: https://en.reset.org/blog/water-borne-diseases-india (accessed on 1 March 2021).
  22. Meon, G.; Pätsch, M.; Van Phuoc, N.; Hong Quan, N. EWATEC-COAST: Technologies for environmental and water protection of coastal regions in vietnam. In Proceedings of the 4th International Conference for Environment and Natural Resources–ICENR, Ho-Chi-Minh City, Vietnam, 17–18 June 2014. [Google Scholar]
  23. Nguyen, H.Q. Modeling of Nutrient Dynamics during Flood Events at Catchment Scale in Tropical Regions, in Leichtweiß-Institute for Hydraulics and Water Resources (LWI). Ph.D. Thesis, University of Braunschweig, Braunschweig, Germany, 2010. [Google Scholar]
  24. Nguyen, M.S. Water Quality Component. Sub-Project from Vietnam Water Sector Review Project; Institute of Environmental Technology, VAST: Ha Noi, Vietnam, 2009. [Google Scholar]
  25. CEM. Current Environmental Monitoring Status in Vietnam (Thực trạng hệ thống quan trắc Môi trường ở Việt Nam). 2018. Available online: http://cem.gov.vn/mang-luoi-quan-trac-moi-truong/thuc-trang-he-thong-quan-trac-moi-truong-o-viet-nam (accessed on 22 April 2021).
  26. Prilop, K.; Quan, N.H.; Lorenz, M.; Le, H.; Hien, L.T.; Meon, G. Integrated water quality monitoring of the Thi Vai River: An assessment of historical and current situation. EWATEC-COAST: Technologies for Environmental and Water Protection of Coastal Zones in Vietnam. In Proceedings of the 4th International Conference for Environment and Natural Resources, ICENR 2014, Hochiminh, Vietnam, 17–18 June 2014. [Google Scholar]
  27. Quan, N.H.; Hieu, N.Q.; Nga, D.T.Q.; Lorenz, M. Long-Term Water Quality Assessment of the Thi Vai River, Vietnam: Impacts of Pollution Management. In Proceedings of the International Workshop on Environment and Climate Change—Challenge and Response, and Lession Learnt, Hochiminh, Vietnam, 17–18 December 2016. [Google Scholar]
  28. Nguyen, H.P.; Pham, H.T. The dark side of development in Vietnam: Lessons from the killing of the Thi Vai River. J. Macromarket. 2012, 32, 74–86. [Google Scholar] [CrossRef]
  29. Nguyen, V.P.; Nguyen, T.H.; Bui, T.L. Method on estimating damages to economy and environment from polluted catchment catchment—A case study of Thi Vai river (Phương pháp tính toán thiệt hại về kinh tế và môi trường đối với một lưu vực sông bị ônhiễm—Trường hợp điển hình: Lưu vực sông Thị Vải). VNU-HCM J. Sci. Technol. Dev. 2011, M1, 2–5. [Google Scholar]
  30. Le, T.T.H.; Zeunert, S.; Lorenz, M.; Meon, G. Multivariate statistical assessment of a polluted river under nitrification inhibition in the tropics. Environ. Sci. Pollut. Res. 2017, 24, 13845–13862. [Google Scholar] [CrossRef] [Green Version]
  31. Liu, C.-W.; Lin, K.-H.; Kuo, Y.-M. Application of factor analysis in the assessment of groundwater quality in a blackfoot disease area in Taiwan. Sci. Total. Environ. 2003, 313, 77–89. [Google Scholar] [CrossRef]
  32. Shrestha, S.; Kazama, F. Assessment of surface water quality using multivariate statistical techniques: A case study of the Fuji river basin, Japan. Environ. Model. Softw. 2007, 22, 464–475. [Google Scholar] [CrossRef]
  33. Abdullah, P.; Haque, M.Z.; Rahim, S.A.; Embi, A.F.; Elfithri, R.; Lihan, T.; Khali, W.W.M.; Khan, F.; Mokhtar, M. Multivariate Chemometric Approach on the Surface Water Quality in Langat Upstream Tributaries, Peninsular Malaysia. J. Environ. Sci. Technol. 2016, 9, 277–284. [Google Scholar] [CrossRef]
  34. Olson, J.R. Predicting combined effects of land use and climate change on river and stream salinity. Philos. Trans. R. Soc. B 2018, 374. [Google Scholar] [CrossRef] [Green Version]
  35. Hesse, C.; Krysanova, V. Modelling Climate and Management Change Impacts on Water Quality and In-Stream Processes in the Elbe River Basin. Water 2016, 8, 40. [Google Scholar] [CrossRef] [Green Version]
  36. Lorenz, M.; Zeunert, S.; Nguyen, H.Q.; Meon, G. Eco-hydrological modeling of a tropical catchment exposed to anthropogenic pressure and climate impact. Hydrol. Wasserbewirtsch. 2017, 61, 408–423. [Google Scholar]
  37. Gao, X.P.; Li, G.N.; Zhang, C. Modeling the effects of point and non-point source pollution on a diversion channel from Yellow River to an artificial lake in China. Water Sci. Technol. 2015, 71, 1806–1814. [Google Scholar] [CrossRef]
  38. Hu, Y.; Salles, C.; Cernesson, F.; Perrin, J.; Tournoud, M. Nutrient load modelling during floods in intermittent rivers: An operational approach. Environ. Model. Softw. 2008, 23, 768–781. [Google Scholar]
  39. Quan, N.H.; Meon, G. Nutrient Dynamics During Flood Events in Tropical Catchments: A Case Study in Southern Vietnam. Clean Soil Air Water 2014, 43, 652–661. [Google Scholar] [CrossRef]
  40. Chapra, S.C. MCGraw-Hill Sries in Water Resources and Environmental Engineering. In Surface Water-Quality Modelling; MCGraw-Hill Education: New York, NY, USA, 1997. [Google Scholar]
  41. O’Flynn, B.; O’Flynn, B.; Regan, F.; Lawlor, A.; Wallace, J.; Torres, J.; O′mathuna, C. Experiencesand recommendations in deploying a real-time, water quality monitoring system. Meas. Sci. Technol. 2010, 21, 124004. [Google Scholar] [CrossRef]
  42. Ungureanu, F.; Lupu, R.G.; Stan, A.; Craciun, I.; Teodosiu, C. Towards real time mon-itoring of water quality in river basins. Environ. Eng. Manag. J. 2010, 9, 1267–1274. [Google Scholar]
  43. Shore, M.; Murphy, S.; Mellander, P.E.; Shortle, G.; Melland, A.R.; Crockford, L.; O’Flaherty, V.; Williams, L.; Morgan, G.; Jordan, P. Influence of stormflow and baseflowphosphorus pressures on stream ecology in agricultural catchments. Sci. Total Environ. 2017, 590–591, 469–483. [Google Scholar] [CrossRef]
  44. Boёnne, W.; Desmet, N.; Van Looy, S.; Seuntjens, P. Use of online water qualitymonitoring for assessing the effects of WWTP overflows in rivers. Environ. Sci. Process. Impacts 2014, 16, 1510–1518. [Google Scholar] [CrossRef]
  45. Bowes, M.J.; Loewenthal, M.; Read, D.S.; Hutchins, M.G.; Prudhomme, C.; Armstrong, L.K.; Harman, S.A.; Wickham, H.D.; Gozzard, E.; Carvalho, L. Identifying multiplestressor controls on phytoplankton dynamics in the River Thames (UK) using high-frequency water quality data. Sci. Total Environ. 2016, 569–570, 1489–1499. [Google Scholar] [CrossRef] [Green Version]
  46. Helsel, D.R.; Hirsch, R.M.; Ryberg, K.R.; Archfield, S.A.; Gilroy, E.J. Statistical Methods in Water Resources: US Geological Survey Techniques and Methods; US Geological Survey: Reston, VA, USA, 2020; Book 4, Chapter A3.
  47. Le, T.T.H.; Lorenz, M.; Zeunert, S.; Nguyen, C.V.; Meon, G. Spatial and temporal variability of water quantity and water quality of the Thi Vai catchment in southern Vietnam-Data analysis of a monitoring program. Hydrol. Wasserbewirtsch. 2017, 61, 370–382. [Google Scholar]
  48. Canada Council of Ministers of the Environment. Canadian Environmental Quality Guidlines for the Protection of Aquatic Life; Environment and Climate Change Canada: Montreal, QC, Canada, 2001.
  49. ASTM International. ASTM D2007 19 Standard Test. Method for Characteristic Groups in Rubber Extender and Processing Oils and Other Petroleum-Derived Oils by the Clay-Gel Absorption Chromatographic Method; ASTM International: West Conshohocken, PA, USA, 2007. [Google Scholar]
  50. CCME. Synthesis of Research and Application of the CCME Water Quality Index; Canadian Council of Ministers of the Environment (CCME): Winnipeg, MB, Canada, 2012; p. 64. [Google Scholar]
  51. MONRE. QCVN 08-2008 BTNMT National Technical Regulation on Surface Water Quality; MONRE: Hanoi, Vietnam, 2008.
  52. IER. Báo cáo kết quả thực hiện Nhiệm vụ "Kết quả xác định phạm vi, mức độ ô nhiễm và ảnh hưởng đến môi trường do hành vi gây ô nhiễm của Công ty Vedan đối với sông Thị Vải" (Report on Identification of Areas, Pollution Levels and Impacts of Vedan Company to Thi Vai river); Institute for Environment and Natural Resources (IER), Vietnam National University—Ho Chi Minh City (VNU—HCM): Hochiminh, Vietnam, 2009.
  53. Ballantine, D.J.; Davies-Colley, R.J. Water quality trends in New Zealand rivers: 1989–2009. Environ. Monit. Assess. 2013, 186, 1939–1950. [Google Scholar] [CrossRef]
  54. Cloutier, V.; Lefebvre, R.; Therrien, R.; Savard, M.M. Multivariate statistical analysis of geochemical data as indicative of the hydrogeochemical evolution of groundwater in a sedimentary rock aquifer system. J. Hydrol. 2008, 353, 294–313. [Google Scholar] [CrossRef]
  55. Güler, C.; Thyne, G.D.; McCray, J.E.; Turner, A.K. Evaluation of graphical and multivariate statistical methods for classification of water chemistry data. Hydrogeol. J. 2002, 10, 455–474. [Google Scholar] [CrossRef]
  56. Li, D.; Wan, J.; Ma, Y.; Wang, Y.; Huang, M.; Chen, Y. Stormwater Runoff Pollutant Loading Distributions and Their Correlation with Rainfall and Catchment Characteristics in a Rapidly Industrialized City. PLoS ONE 2015, 10, e0118776. [Google Scholar]
  57. Jolliffe, I.T.; Cadima, J. Principal component analysis: A review and recent developments. Philos. Trans. R. Soc. Math. Phys. Eng. Sci. 2016, 374, 20150202. [Google Scholar] [CrossRef] [PubMed]
  58. Matlab. MATLAB Runtime. 2013. Available online: https://jp.mathworks.com/products/compiler/matlab-runtime.html (accessed on 12 March 2019).
  59. Thanh Nien News. Pollution Soon to Render Dong Nai River Unusable; Thanhnien: Hochiminh, Vietnam, 2009. [Google Scholar]
  60. Bansal, M.K. Nitrification in natural streams. J. Water Pollut. Control. Fed. 1976, 48, 2380–2393. [Google Scholar]
  61. Wheaton, F.W.H.; Hochheimer, J.N.; Kaiser, G.E.; Krones, M.J.; Libey, G.S.; Easter, C.C. Nitrification filter principles, in Aquaculture reuse systems: Engineering design and management. In Developments in Aquaculture and Fisheries Science; Elsevier Science: New York, NY, USA, 1994; pp. 101–126. [Google Scholar]
  62. Dong Nai Statistic Office. Statistcal Yearbook; Gerneral Statistics Offiice of Vietnam: Hanoi, Vietnam, 2013.
  63. Joseph, S.; Ouseph, P.P. Assessment of nutrients using multivariate statistical techniques in estuarine systems and its management implications: A case study from Cochin Estuary, India. Water Environ. J. 2010, 24, 126–132. [Google Scholar] [CrossRef]
  64. Haag, I.; Westrich, B. Processes governing river water quality identified by principal component analysis. Hydrol. Process. 2002, 16, 3113–3130. [Google Scholar] [CrossRef]
  65. Mishra, A. Assessment of water quality using principal component analysis: A case study of the river Ganges. J. Water Chem. Technol. 2010, 32, 227–234. [Google Scholar] [CrossRef]
  66. Alkarkhi, A.F.M.; Ahmad, A.; Easa, A.M. Assessment of surface water quality of selected estuaries of Malaysia: Multivariate statistical techniques. Environment 2008, 29, 255–260. [Google Scholar] [CrossRef]
  67. Kumar, J.N. Assessment of Spatial and Temporal Fluctuations in Water Quality of a Tropical Permanent Estuarine System—Tapi, West Coast India. Appl. Ecol. Environ. Res. 2009, 7, 267–276. [Google Scholar] [CrossRef]
  68. Mitra, S.; Ghosh, S.; Satpathy, K.K.; Bhattacharya, B.D.; Sarkar, S.K.; Mishra, P.; Raja, P. Water quality assessment of the ecologically stressed Hooghly River Estuary, India: A multivariate approach. Mar. Pollut. Bull. 2018, 126, 592–599. [Google Scholar] [CrossRef]
  69. Stallard, R.; Edmond, J. Geochemistry of the Amazon.: 2. The influence of geology and weathering environment on the dissolved load. J. Geophys. Res. Ocean. 1983, 88, 9671–9688. [Google Scholar] [CrossRef]
  70. Ruiz, G.; Jeison, D.; Rubilar, O.; Ciudad, G.; Chamy, R. Nitrification–denitrification via nitrite accumulation for nitrogen removal from wastewaters. Bioresour. Technol. 2006, 97, 330–335. [Google Scholar] [CrossRef] [PubMed]
  71. Shortle, J.S.; Mihelcic, J.R.; Zhang, Q.; Arabi, M. Nutrient control in water bodies: A systems approach. J. Environ. Qual. 2020, 49, 517–533. [Google Scholar] [CrossRef] [PubMed] [Green Version]
  72. Perlman, H. Why Is the Ocean Salty? US Geological Survey. 2013. Available online: http://ga.water.usgs. gov/edu/whyoceansalty. html (accessed on 24 January 2021).
  73. Nave, R. Resistance and Resistivity. Available online: http://hyperphysics.phy-astr.gsu.edu/hbase/electric/resis.html#c1 (accessed on 23 January 2021).
  74. López-Vicente, M.; Calvo-Seas, E.; Álvarez, S.; Cerdà, A. Effectiveness of Cover Crops to Reduce Loss of Soil Organic Matter in a Rainfed Vineyard. Land 2020, 9, 230. [Google Scholar] [CrossRef]
Figure 1. Location of the sampling sites along the Thi Vai estuary and key industrial zones (dark red circles). Water quality data from each sampling site were used to calculate the water quality index (WQI, [48]).
Water 13 01330 g001
Figure 2. Long-term variations and step trend analysis of dissolved oxygen at the stations (a) Long Tho, (b) Go Dau (Vedan), (c) Phu My, (d) Phao13. The dashed lines show the averages of the two assessed periods (1999–2008 and 2009–2013) while the full line demarks the Vietnamese Water Quality Standard A2 [51]. ΔY is the magnitude of the step trend together with the upper and lower bounds of the 95% confidence interval. The asterisk identifies a significant difference between the two time periods (α = 0.05).
Water 13 01330 g002
Figure 3. Long-term variations and step trend analysis of BOD5 at the stations (a) Long Tho, (b) Go Dau (Vedan), (c) Phu My, (d) Phao13.. The dashed lines show the averages of the two assessed periods (1999–2008 and 2009–2013) while the full line demarks the Vietnamese Water Quality Standard A2 [51]. ΔY is the magnitude of the step trend together with the upper and lower bounds of the 95% confidence interval. The asterisk identifies a significant difference between the two time periods (α = 0.05)
Water 13 01330 g003
Figure 4. Long-term variations and step trend analysis of NH4 at the stations (a) Long Tho, (b) Go Dau (Vedan), (c) Phu My, (d) Phao13.. The dashed lines show the averages of the two assessed periods (1999–2008 and 2009–2013) while the full line demarks the Vietnamese Water Quality Standard A2 [51]. ΔY is the magnitude of the step trend together with the upper and lower bounds of the 95% confidence interval. The asterisk identifies a significant difference between the two time periods (α = 0.05)
Water 13 01330 g004
Figure 5. Long-term variations and step trend analysis of NO2 at the stations (a) Long Tho, (b) Go Dau (Vedan), (c) Phu My, (d) Phao13.. The dashed lines show the averages of the two assessed periods (1999–2008 and 2009–2013) while the full line demarks the Vietnamese Water Quality Standard A2 [51]. ΔY is the magnitude of the step trend together with the upper and lower bounds of the 95% confidence interval. The asterisk identifies a significant difference between the two time periods (α = 0.05)
Water 13 01330 g005
Figure 6. Long-term variations and step trend analysis of NO3 at the stations (a) Long Tho, (b) Go Dau (Vedan), (c) Phu My, (d) Phao13.. The dashed lines show the averages of the two assessed periods (1999–2008 and 2009–2013) while the full line demarks the Vietnamese Water Quality Standard A2 [51]. ΔY is the magnitude of the step trend together with the upper and lower bounds of the 95% confidence interval. The asterisk identifies a significant difference between the two time periods (α = 0.05)
Water 13 01330 g006
Figure 7. Spatial and temporal variations of nine water quality parameters measured from 2013 to 2014 in the Thi Vai estuary and its catchment. Black and grey box plots refer to the dry (December to April) and rainy (May to November) seasons, respectively (red crosses are outliers). Dashed lines denote the Vietnamese Water Quality Standard A2 (MONRE 2008) [51].
Water 13 01330 g007
Figure 8. Dendrograms showing clustering of sampling sites according to surface water quality characteristics of the Thi Vai catchment during the (a) dry and (b) rainy season.
Water 13 01330 g008
Figure 9. Biplots of PCA results showing the loadings and normalized scores of the three selected components for the Thi Vai catchment for the (a,b) dry season (December to April) and (c,d) rainy season (May to November).
Water 13 01330 g009
Table 1. Estimated BOD5 and total nitrogen (TN) loads from industrial point sources along the Thi Vai estuary before 2008 (2006 and 2008) and 2009. Data are compiled from the monitoring program of the IER and DONRE Dong Nai.
BOD5 (kg d−1)TN (kg d−1)
Before 20082009Before 20082009
Go Dau20541455
Vedan75,86210215,74525
NhonTrach 113221714737
NhonTrach 2240013111521
NhonTrach 3—Tin Nghia960471135
NhonTrach 3—Formosa2661063692
NhonTrach 5381011784
Det may NhonTrach4272317
My Xuan A40681597075
My Xuan A21301065923
My Xuan B12211
Phu My I67280228435
Phu My II-193-47
CaiMep2222146
Total84,799137919,619313
Table 2. Summary of the median and percentiles of the water quality parameters monitored at the sampling stations at the Thi Vai estuary (TV2 Long Tho, TV4 Go Dau, TV8 Phu My, and TV9 Phao 13) (long-term dataset (i)). N = number of samples (N1 1999–2008; N2 2009–2013). All units are in mg L−1.
StationPercentile1999–20082009–2013
DOBOD5NH4NO2NO3DOBOD5NH4NO2NO3
Long Tho (TV2)51.02.21.460.0040.053.03.00.030.0040.02
N1 = 62252.15.01.930.0110.104.14.00.050.0540.13
N2 = 174Median2.96.63.310.0200.244.65.00.090.1700.25
754.310.04.470.0300.435.37.50.200.2480.44
955.520.97.510.1992.166.89.00.340.3100.58
Go Dau (TV4)50.43.02.350.0020.053.33.00.030.0360.06
N1 = 62251.15.33.280.0050.054.04.00.060.1100.13
N2 = 174Median2.27.14.460.0100.124.55.00.070.1900.22
752.610.25.940.0160.245.07.00.110.2500.40
954.215.07.750.1102.735.99.00.240.3200.52
Phu My (TV8)52.02.20.400.0100.054.23.00.030.0190.02
N1 = 64253.03.70.980.0500.155.05.00.050.0440.12
N2 = 144Median3.76.01.820.2150.365.56.00.060.0790.20
754.78.92.820.3000.725.87.00.080.1430.27
955.712.95.130.3992.446.39.00.170.2000.44
Phao 13 (TV9)52.92.20.110.0110.094.33.00.010.0120.02
N1 = 54253.83.30.340.0500.315.05.00.030.0260.11
N2 = 144Median5.25.00.730.1400.425.46.00.050.0500.18
755.77.01.570.1900.485.97.00.070.0800.24
956.19.67.650.2951.326.59.80.100.1200.40
Vietnamese Water Quality StandardsA1≥640.10.012
A2≥560.20.025
B1≥4150.50.0410
B2≥22510.0515
Note: A1: For residential use and other purposes; A2: For residential use with proper treatment, preservation of aquatic plants, or other purposes; B1: For irrigation or other purposes requiring a similar quality of water; B2: For water transport and other purposes requiring low quality (MONRE (2008) [51]).
Table 3. Summary of mean and standard deviation of water quality parameters monitored at the sampling sites at the Thi Vai estuary and its catchment during 2013–2014 (short-term dataset).
Sampling SiteTpHECDOTSSNH4NO2NO3PO4Fetotal
BM (Bung Mon)29.8 (1.2)6.4 (0.7)0.07 (0.02)6.3 (1.4)121 (298)0.29 (0.13)0.02 (0.01)1.45 (0.37)0.05 (0.03)1.09 (0.73)
SC (Suoi Ca)29.9 (1.3)7.3 (0.2)0.11 (0.05)6.3 (0.9)58 (90)0.25 (0.27)0.03 (0.02)1.04 (0.56)0.07 (0.07)1.38 (0.83)
CV (Cau Vac)28.8 (1.9)6.9 (0.7)0.13 (0.05)6.4 (0.9)90 (162)0.29 (0.22)0.12 (0.10)1.51 (0.53)0.12 (0.10)2.84 (3.99)
TV130.6 (1.5)7.0 (0.1)18.1 (13.5)5.2 (1.0)39 (83)0.21 (0.10)0.14 (0.09)0.52 (0.29)0.06 (0.05)3.60 (7.65)
TV2 (Long Tho)29.8 (1.0)7.0 (0.5)23.8 (9.8)4.3 (1.4)39 (38)0.52 (0.48)0.09 (0.06)0.26 (0.19)0.03 (0.02)1.30 (1.10)
TV331.0 (1.0)7.1 (0.1)30.3 (12.9)4.7 (1.2)13 (7)0.15 (0.09)0.20 (0.09)0.40 (0.18)0.04 (0.04)0.98 (0.62)
TV4 (Go Dau)30.8 (1.2)7.2 (0.14)38.7 (9.6)4.6 (0.9)18 (14)0.11 (0.05)0.21 (0.08)0.38 (0.18)0.03 (0.01)0.84 (0.45)
TV5 (Vedan)30.5 (0.9)7.0 (0.5)38.9 (8.5)4.6 (1.1)32 (26)0.10 (0.12)0.20 (0.07)0.19 (0.13)0.03 (0.03)0.54 (0.70)
TV630.9 (1.1)7.3 (0.2)41.8 (7.2)4.6 (0.9)17 (12)0.09 (0.04)0.21 (0.09)0.36 (0.16)0.03 (0.01)0.74 (0.44)
TV731.3 (1.2)7.5 (0.2)45.9 (6.3)5.4 (0.7)21 (36)0.08 (0.03)0.15 (0.08)0.35 (0.16)0.03 (0.01)0.91 (0.92)
TV8 (Phu My)31.0 (1.1)7.2 (0.5)43.2 (6.3)5.1 (0.8)31 (27)0.07 (0.08)0.09 (0.05)0.19 (0.14)0.03 (0.02)0.61 (0.53)
VN-Standard A1 6–8.5 ≥6200.10.0120.10.5
VN-Standard A2 6–8.5 ≥5300.20.0250.21
VN-Standard B1 5–5.9 ≥4500.50.04100.31.5
VN-Standard B2 5–5.9 ≥21001.00.05150.52
Number of samples743523509502522555556555556581
Note: A1: For residential use and other purposes; A2: For residential use with proper treatment, preservation of aquatic plants, or other purposes; B1: For irrigation or other purposes requiring a similar quality of water; B2: For water transport and other purposes requiring low quality (MONRE (2008)) [51]. Temperature T (°C), electrical conductivity (mS/cm), dissolved oxygen (DO), total suspended solids (TSS), ammonia (NH4), nitrite (NO2), nitrate (NO3), orthophosphate (PO4), and total iron (Fetotal), all in mg/L.
Table 4. Loadings of the principal components for the entire period, the dry season (December to April), and rainy season (May to November). Values greater than 0.5 are marked in bold.
ParametersEntire PeriodDry SeasonRainy Season
PC1PC2PC3PC1PC2PC3PC1PC2PC3
pH0.038−0.0870.640−0.4090.318−0.5490.0340.1580.775
DO0.0990.8190.1670.8280.018−0.1780.1630.7590.178
TSS0.7800.076−0.2390.0500.8010.0790.6880.150−0.386
NH40.1910.000−0.719−0.1140.2930.8180.2020.196−0.543
NO20.032−0.6840.348−0.577−0.152−0.0980.060−0.7940.387
NO30.3020.654−0.1070.8230.0290.2550.4340.5150.028
PO40.6030.3040.1660.5290.381−0.1300.7370.1230.169
Fetotal0.8670.034−0.0780.1960.8300.0780.8090.042−0.200
Eigenvalue1.861.671.182.201.691.111.931.581.30
Total variance [%]23.320.914.727.521.113.824.119.716.2
Cumulative variance [%]23.344.258.927.548.662.424.143.860.0
Publisher’s Note: MDPI stays neutral with regard to jurisdictional claims in published maps and institutional affiliations.

