Abstract
This article describes a unique industrial symbiosis employing an algae cultivation unit (ACU) at the core of a novel eco-industrial park (EIP) integrating fossil-fuel fired power generation, carbon capture, biofuel production, aquaculture, and wastewater treatment. A new modelling framework capable of designing and evaluating materials and energy exchanges within an industrial eco-system is introduced. In this scalable model, an algorithm was developed to balance the material and energy exchanges and determine the optimal inputs and outputs based on the industrial symbiosis objectives and participating industries. Optimizing the functionality of the ACU not only achieved a substantial emission reduction, but also boosted aquaculture, biofuel, and other chemical productions. In a power-boosting scenario (PBS), by matching a 660 MW fossil fuel-fired power plant with an equivalent solar field in the presence of ACU, fish-producing aquaculture and biofuel industries, the net CO2 emissions were cut by 60% with the added benefit of producing 39 m3 biodiesel, 6.7 m3 bioethanol, 0.14 m3 methanol, and 19.55 tons of fish products annually. Significantly, this article shows the potential of this new flexible modelling framework for integrated materials and energy flow analysis. This integration is an important pathway for evaluating energy technology transitions towards future low-emission production systems, as required for a circular economy.
1. Introduction
Industrial and manufacturing agglomeration (co-location) in so-called ‘eco-industrial parks’ has created valuable synergies among adjacent firms enabling them sharing natural and economic resources to improve the sustainability and economic benefits in urban and regional planning [1]. Extensive industrial growth driven by capital investment comes with high consumption of raw materials resulting in uncontrolled negative environmental effects [2]. Current reliance on fossil fuels for energy and natural material resource inputs is environmentally unsustainable, contributing to significant GHG emissions, waste generation and unprecedented pollutions [3]. Industries that rely on fossil fuels and unsustainable material inputs must therefore shift on a global scale to a circular economy model to minimize further emissions and reduce those already excreted. One attractive way for achieving this is through creating industrial symbioses, phenomena inspired by natural ecosystems in which disparate organisms collaborate for mutual benefit. Recent successful examples for eco-industrial park (EIP) were demonstrated by the green transformation in China [4], unfold niche-building processes in Italy [5], and the superstructure optimization for a Mongstad, Norway case study [6].
As described by Chertow’s seminal studies [7,8], industrial symbiosis is the concept of traditionally distinct entities engaging collectively for “competitive advantage involving physical exchange of materials, energy, water, and by-products”. When those distinct industrial entities come together and achieve a measure of industrial symbiosis, the resulting entity is commonly termed an “Eco-Industrial Park” (EIP) [9]. EIPs are also referred to as the “concrete realization” [7] or manifestation of the industrial symbiosis concept [10] and a system for the broader field of industrial ecology (IE) [11], the field of studying industries with a whole-systems view. A vital distinction between industrial symbiosis and EIPs can be found in referring to the highly cited works of Chertow [7] and Lowe [12], where the former emphasizes that industrial symbioses are not necessarily confined by the strict boundaries of a park and can include synergies between industrial entities and the wider community, while the latter defines EIP as “a community of manufacturing and service businesses located together on a common property” [7,12]. In more recent works, Bakshi et al. [13] outlined a techno-ecological system (TES) concept for assessing interconnected technological-ecological systems that build synergistic relationships between industrial and natural systems. This TES expands the system boundary to harmonize industry with nature by explicitly accounting for demand that technological systems place on natural ecosystems and the supply of ecosystem services that nature can provide.
In the last few decades, several EIPs have been established and achieved evident economic, environmental, and social benefits [14,15,16,17]. Some of these EIPs evolved in somewhat ad-hoc ways as the advantages of industrial symbiosis were realized over time. The interdisciplinary approach of IE is required designing new EIPs [7]. This draws from a combination of knowledge in engineering, economics, sociology, toxicology, and the natural sciences. Despite varying definitions of the IE field since it was introduced several decades ago [18,19,20,21], there is a great scope for the use of its framework in guiding the development and appraisal of novel energy and materials systems that feature circularity and low emissions.
This is becoming widely recognized, as evidenced by an increase in research publications on the subject in recent years. IE networks across the world such as the United States, Europe, Asia and Australia have been studied [9,10,22,23,24], many of which are underpinned by material and energy balances with implications across scales from the individual plant level to region-wide [19]. Recent reviews cover a range of analysis methods which adapt material and energy balances into IE tools, including material flow analysis (MFA) [25], substance flow analysis (SFA) [26], life cycle analysis (LCA) [27], carbon accounting [28], and pinch analysis to optimize resource utilization [29]. Modern implementations of these tools use modelling and optimization methods found in the field of process systems engineering (PSE), such as mixed integer programming, fuzzy logic methods, and agent-based modelling. These tools enable industrial parks to achieve industrial symbiosis, uncovering opportunities for integration in an industrial network that facilitate resource exchanges and thus improve material productivity, reduce the demand for raw materials, minimize wastes, and reduce GHG and other pollutants’ emissions [30,31].
In the power production industry, fossil fuel-fired power plants have historically been positioned near major material resources, such as locations that provide access to coal and water. For future renewable energy systems however, they are more scalable and can flexibly operate in decentralized mode. The need to minimize carbon emissions and comply with more stringent controls on other environmental pollutants means that the renewable energy systems have the potential to adapt an EIP approach and may prove a stronger determinant of their locations. In establishing an EIP, potential byproduct exchanges and process integrations need systematic and quantitative modelling to validate the sustainable and systemic benefits for involved industries. Many uncertainties hovering around large-scale algae cultivation unit (ACU) viability and the downstream processing of algae, water and land usage, stabilized production technology, market forces and government policies on alternative energy and carbon credits [32]. However, only few studies seem to have presented such models to demonstrate tangible energy and material savings and those that demonstrate pollution reduction benefits are particularly rare [15,33,34,35,36,37,38]. The absence of such studies becomes apparent when compared with broader literature on EIPs, covering qualitative approaches that target social, cultural, and business factors, aimed at aiding the development of associated policies and planning prospects [11,39,40,41,42]. A detailed and quantitative model of the potential material and energy exchanges in a proposed EIP would enable the following advantages:
- Consistent integration of sub-models of different industries capable of matching compatible input and output energy and material streams. This can also be used to build a rich database containing the sub-models of all existing processes and modeled configurations which can be extended with ease.
- Sensitivity analysis of the dynamic network to provide a better understanding of the interdependence among the EIP members. This is critical in EIP planning, as any change in the production or consumption of one member may impact the performances of others and subsequently the balance for the entire EIP system.
- Comparison of economic costs and environmental benefits in different configurations and the extent of tradeoffs among the EIP members. Thus, an optimal EIP design may be realized.
- Use of various IE analytical methods (i.e., MFA, SFA, LCA, etc.) to uncover new insights into the operation of the EIP, particularly how to best realize circular economy principles into the EIP operations and how to develop circular business models.
The modelling framework presented in this study is versatile in combining two or more analytical methods to better optimize the water–energy–food–emissions nexus for more sustainable EIP. In this setup, the ACU plays a central role in integrating downstream industries and creating a value-added supply chain for circular economy. In this study, we apply the EIP concept to several industrial activities to minimize pollution and waste generation by closing the material loops. Such activities increase process efficiency and material productivity and create positive value from the waste streams that may otherwise have adverse environmental impacts. Today, it is widely anticipated that if each of these individual industries operates independently, their activities can no longer be deemed to be sustainable. In this context, we propose a modelling framework that demonstrates the potential of a generic EIP approach of an algal bio-refinery scheme with an algae cultivation unit (ACU) at the center. The algal biological process placed at the center represents a manageable ecological system similar to the techno-ecological synergy (TES) framework proposition by Bakshi [13]. This algae-centered eco-industrial park (AC-EIP) (Figure 1) consists of major complementary industries such as a fossil-fuel fired power plant, post-combustion carbon capture (PCC) plant, solar field, biofuel production unit, aquaculture farm, desalination plant, wastewater treatment plant, and several other undefined industries as placeholders for expansion.
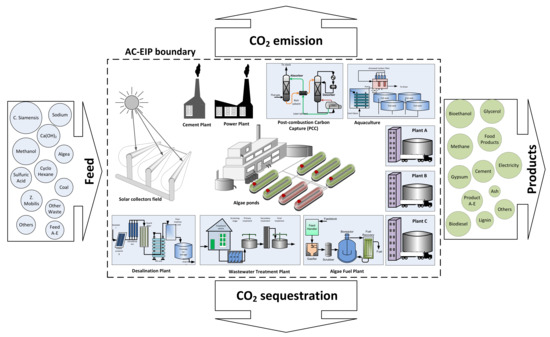
Figure 1.
Conceptual framework of Algae-Centered Eco-Industrial Park (AC-EIP).
First, the concept of the modelling framework is described and the key parameters for the AC-EIP are defined. Then, we present a theoretical case study with computable input and output values that largely depend on the capacity of energy production, either from the power plant, solar field, or both. Six scenarios are projected based on the size and energy production capacity of the power plant and the solar field and their total CO2 emissions and biofuel productions compared. In this proof-of-concept model, we demonstrate that through appropriate sizing and integration of compatible industries, 100% renewable energy and zero CO2 emissions can be achieved, while all materials are internally consumed within the defined boundaries of this unique AC-EIP.
2. A Novel Algae-Centered EIP
The focus of this conceptual AC-EIP is to transform various industrial processes from linear ‘open loop’ systems, where wastes are unwanted and disposed of, into a closed loop system where wastes are treated as resources and are reused as inputs for other processes. This notion underpins the circular economy (CE) concept, in which resources at their traditional end-of-life stage are sustainably cycled back into use, maximizing triple bottom line benefits of social, economic and environmental outcomes [43,44,45,46]. The ACU plays a critical role in managing the primary wastes in the park, particularly the CO2 emitted from various industrial processes, while simultaneously providing input materials for other industries.
The use of algae in this eco-industrial park design reflects on the recent ideas of Bakshi et al. [13] in their proposed TES (Figure 2). Algae culture resembles the role of the natural ecological system to a great extent, although, with a minor environmental footprint caused by establishing the infrastructure in the form of ponds, photo-bioreactors, pumps, piping, etc. The ACU often operates at low temperatures to uptake and biologically process materials excreted by the technological system. At the same time, the algae process provides services, for example, capturing CO2, treating wastewater, and generates a myriad of possible products, such as aquaculture feed, biofuels, lipids, and nutraceuticals.
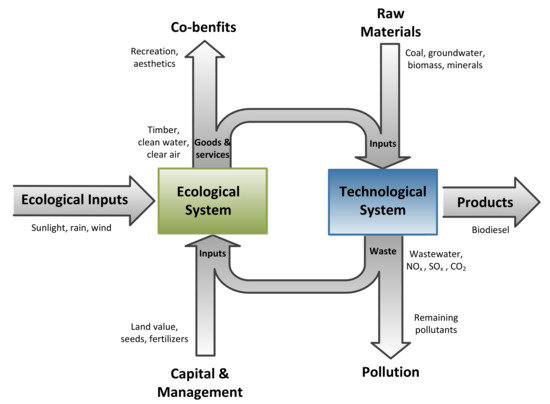
Figure 2.
The TES system coupling ecological systems and technological ones (adapted from [13]).
Along with the ACU, major industries like biofuel production, fossil fuel-fired power station, PCC, aquaculture, and wastewater treatment are included in the model. For simplicity, the desalination and other undefined industries illustrated in Figure 1 have been excluded from this boundary, but they can be easily integrated later in the expandable model. Multiple feeds are utilized and converted to multiple products, including electricity, biodiesel, biogas, food products, animal feeds, hydrogen and nutraceuticals. Importantly, the net CO2 emissions are expected to be significantly reduced through recycling and utilization of captured CO2 in the algae feed. The individual industrial processes in the process flow diagram shown in Figure 1 are described in detail below. Each of the industrial plants in the proposed AC-EIP was individually analyzed by applying the material and energy balances presented in the following subsections. The algorithm of this model was built in VBA and run on Microsoft Excel (Microsoft Corporation, Albuquerque, CA, USA). Figure 3 shows the block diagram of the inputs and outputs for each industry and collectively identifies which outputs can be potential inputs for other industries. Using the model developments, parametric justifications, process optimization plan, and the simple process flow diagram (PFD), the design of the AC-EIP can be later modified into a more structured process diagram to suit a specific AC-EIP implementation. For each processing step, alternative technologies are selected based on techno-economic preferences and energy analyses to arrive at an appropriate AC-EIP design.
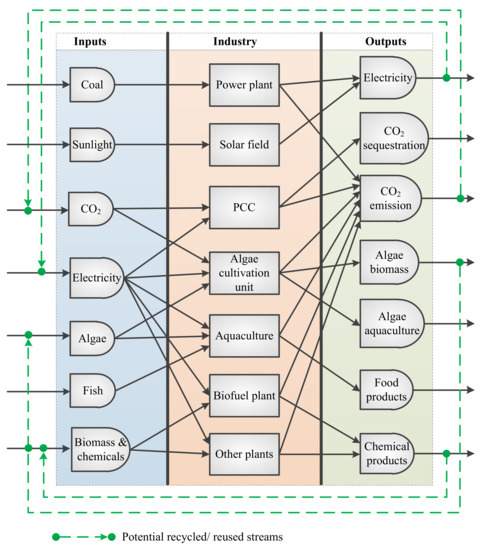
Figure 3.
Potential matches of inputs/outputs for different industries considered in this AC-EIP. Outputs may be circulated back into the park as feedstock when beneficial to the consortia.
2.1. Power Plant and Solar Field
The power plant is conceived as retrofittable with PCC to mitigate CO2 emissions and provide reliable low-carbon power. The solar plant proposed for the AC-EIP is assigned to boost the power plant power production (power-boosting scenario) and to replace a certain amount of energy from the power plant (power-saving scenario). Details are provided in the case-study and methodology sections below. For simplicity, it is assumed that the average carbon emission for 660 MW coal-fired power plant is around 595 t/h of CO2 [47], while an equivalent solar field hypothetically has zero emission. This carbon intensity is derived from the power plant mass balance, where the inputs and outputs are shown in Figure 3. Coal feed is calculated from Equation (1) and the carbon emission is calculated from a polynomial equation (Equation (2)) derived from real power plant load data [48] at 330 and 660 MW.
where MW is the power plant net power outcome (kW); is the conversion efficiency of the power plant; is the low heating value of coal (kJ/kg); A, B, C, and D are the polynomial constants and x is the electricity produced. To provide baseline figures for these variables, power generation in New South Wales, Australia in 2018 was approximately 72 TWh, 77% of which was generated from black coal [49], consequently emitting approximately 51 Mt of CO2 [50].
2.2. Carbon Capture and Sequestration (CCS)
Carbon capture and sequestration (CCS) refer to a broad range of technologies designed for the capture, transportation, and storage of CO2 in geological formations. CCS can be retrofitted to coal and gas-fired power plants and other emission-intensive industrial processes like cement, iron, and steel plants [51,52]. The CCS process delivers low-emission power or industrial products by preventing the release of CO2 that is typically produced during coal combustion (for post-combustion capture processes) or gasification (for pre-combustion capture processes). This goal is achieved by selectively capturing the CO2 gas from other components of the flue gas. The captured CO2 is then dehydrated and pressurized in such a way that it can be transported in pipelines and injected into deep geological formations or utilized in alternative value-added processes [53,54,55,56,57].
Three types of CO2 capture systems exist: post-combustion (PCC), pre-combustion, and oxyfuel combustion [58]. The selection of a particular capture technology depends on a number of parameters including the fuel type, CO2 concentration, and operation pressure and temperature to purify the produced CO2 and remove impurities to below target levels [59]. This study focuses on PCC technology as it is widely accessible and technically mature for retrofitting in existing coal-fired power plants. The captured CO2 via PCC would be a highly concentrated stream and can be directly recycled back into the AC-EIP system to be consumed by the ACU. The biggest barrier for this proposal is the added cost and power consumption for the carbon capture process itself which is addressed next.
2.3. Algae Cultivation Unit (ACU)
Algae cultivation in open pond biomass production systems has been used since the 1950s [60]. Depending on water accessibility, these systems can be applied in natural water bodies (e.g., lakes and lagoons) or artificial ponds or containers. Artificial ponds are typically made of a closed loop in oval-shaped recirculation channels. Water circulation in those channels (0.2–0.5 m deep) ensures adequate mixing and aeration as necessary for stable algae growth and productivity [61]. Studies have demonstrated that microalgae can sustainably grow in an atmosphere containing between 0.03% and 40% of CO2 concentrations, with an optimum pH of 5.5 to 6.0, and an optimum temperature of 30 °C (it can be carefully assumed that the flue gas can be cooled down in a heat integration design) [62,63]. The ACU plays a pivotal role in the current AC-EIP as it corresponds to the main three principles of the IE, namely: technological innovation, lifecycle thinking and use of a multidisciplinary approach [19]. Moreover, the ACU generates valuable products from CO2 in a new practice that may significantly improve the process economics [64].
Algae are a very diverse group of eukaryotic organisms and currently are a well-known medium for third-generation biofuel production [65]. They exhibit the following beneficial characteristics relevant for industrial exploitation:
- Rapid growth potential and tolerance to harsh conditions in comparison to higher organisms due to their unicellular or simple multicellular structures.
- Compatibility as feedstock for different types of renewable fuels, such as biodiesel, methane, hydrogen and ethanol [64].
- Potential for bioremediation applications and as nitrogen-fixing biofertilizers [66].
- Production of high value products such as omega 3 fatty acids and various phytochemicals [67].
In this AC-EIP, it is assumed that algae are grown in an open pond and are used for both algae-fuel and aquaculture feed. Thousands of algae types can be used, and it is assumed a 70% oil content of dried algae is used when other chemical contents are determined by using a linear equation [68] as follows: cellulose 0.0729 wt%, hemicellulose 0.1677 wt%, lignin 0.0171 wt%, ash 0.0189 wt%, and water 0.0234 wt%. The remaining dried algae components are 48.9% saturated fatty acids, 20.9% monounsaturated fatty acids, 23.7% polyunsaturated fatty acids, 4.9% trans-isomers, 5% omega-3, 12.5% omega-6, and 2.3% linolenic acid.
The modelling framework proposed in this article (Figure 1) divides algae products into multiple outputs, such as nutrition (for human and animal consumption), fertilizers, bioremediation and pharmaceuticals, energy source (for bioethanol, biogas, and biodiesel), pollution control, and wastewater treatment purposes. The case study presented in this article particularly focuses on biodiesel production. The amount of CO2 needed per kg of algae is calculated based on the type of algae, growth factor, and its flow rate () presented in Equation (3). The carbon fixation rate assumed for this study is 10 g/L/d at 15% CO2 concentration [62,63].
2.4. Aquaculture and Wastewater Treatment with Microalgae
Aquaculture is the farming of aquatic organisms such as fish, crustaceans, molluscs and aquatic plants including microalgae [69]. Animal-based aquaculture systems involving microalgae production and wastewater treatment exploit a synergy in terms of promoting microalgae growth and reducing eutrophication potential in the environment. Microalgae additionally provide an important source of nutrition for various farmed aquatic animals, including marine fish species, adding to their synergistic value within animal-based aquaculture. Some details relevant to modelling the aquaculture system such as growth inhibition, water loss, space constraints and efficiency are outside the scope of this article. Using the average weight assumption of ±200 g per fish [70,71], animal-based aquaculture in this AC-EIP study are calculated using the following equation.
2.5. Algae Biofuel
The conversion process of algae into energy is not a groundbreaking practice, although researchers are continuously exploring more productive and innovative techniques to obtain bioenergy from algae [72]. The research on converting algae into biofuels was, however, was barely evident until the beginning of the 21st century [73]. Since then, the generation of research and publications on microalgae and biodiesel have followed an almost exponential trend. Investigation over the past few years has led to significant improvements in optimizing the production efficiency for targeted biofuels, by focusing on biogenetics, species analysis, and/or economic efficiencies. For instance, in the field of biogenetics, it is possible to manipulate gene expression in algae, in order to accumulate specific metabolites for biofuel development [74] and the biosynthesis of algae lipids (triacylglycerol) [75]. The conversion of algal biomass into a form of energy is done via established thermochemical or biochemical routes. Factors that influence the choice of conversion technology include the type and quantity of the algae and the desired energy carrier product(s) [76]. Various inputs and outputs are possible in the algae biofuel plant, as shown in Figure 4.
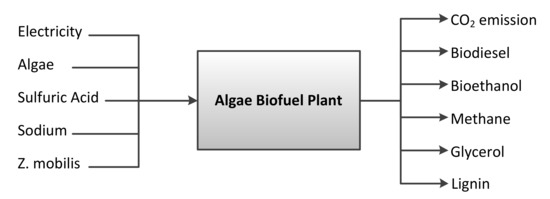
Figure 4.
Potential inputs/outputs for the algae biofuel plant.
It is assumed that algae biofuel is obtainable through both hydrolysis fermentation (Equation (5)) and transesterification (Equation (6)) processes for the conversion of microalgae oil into bioethanol, biodiesel and other by-products.

It is assumed that the algae are dried and pressed with an algae expeller to extract 70% of the oils. The remaining pulp is mixed with streams of cyclohexane at 25 °C and 101.3 kPa, allowing a total 97% algae oil extraction. The algae solids are fed into two-stage hydrolysis reactors with 0.01% sulfuric acid at a specified temperature and pressure, converting most of the cellulose and hemicellulose into xylose and glucose. Detoxification with Ca(OH)2 follows, prior to feeding the liquid into another reactor with Zymomonas mobilis biocatalyst at 41 °C and 101.3 kPa to produce bioethanol. The 97% of algae oil obtained from the extraction process is fed into a reactor with methanol and sodium methanolate at 65 °C and 101.3 kPa. The reaction is required to neutralize the fatty acids, removing the glycerin and creating an alcohol ester. After the transesterification process, a simple high vacuum is used to separate glycerol and methyl esters. The full details of the main reactions governing the production of various products included in this model can be found in the Supplementary Materials.
2.6. Flexibility for Further Process Integrations
The AC-EIP model offers various ways of evaluating and encompassing other industries, such as a cement plant, a desalination plant, a pulp plant, a paper plant, and a rubber plant in the analysis framework. For simplicity, the calculations for these supplementary processes are not considered in this current work. Of note however, in the generic AC-EIP process flow diagram (Figure 1), the cement and desalination plants are very well suited for integration in this boundary. Cement is one of the most important commodities used today, yet it is exceptionally detrimental to the environment [77], with a 2018 report from think tank Chatham House noting that the cement industry alone produces approximately 8% of global man-made CO2 emissions [78]. If emitted within this proposed AC-EIP model, these CO2 emissions would be a valued feedstock for algae cultivation. Additionally, a desalination plant is a preferred candidate due to its benefits in terms of generating clean water and preserving existing freshwater resources [79]. It is well known that the Earth’s freshwater supply is limited, while the process and development of a desalination plant can have a severe environmental impact [80], hence this integration can further enhance the concept of this AC-EIP.
3. Calculation Methodology
The overall AC-EIP calculation is carried out within a framework based on a mathematical model illustrated in Figure 5. The main purpose of this integrated framework is to comprise all the data of the overall process flow chart and make multiple outputs for the purpose of optimizing the EIP, where algae processing is in the center. As Figure 3 suggests, we identified those products and by-products that can be recycled back within the boundary (i.e., CO2, electricity, and algae biomass) to feed other industries.
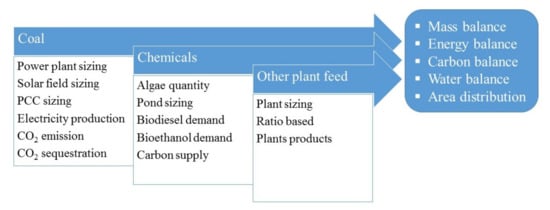
Figure 5.
The three sub-models outlining their key simulation objectives to solve the overall model.
The algorithm of this model is divided into three different sub-models: (1) the power plant/s, (2) the ACU, and (3) other plants. After parameter initializations, the algorithm may adopt one of the three sub-models at a time. Once it completes that sub-model, it has the option to end the process or go back to the beginning step to complete other sub-models. This means that the calculation process can be allocated for a stand-alone plant or be able to include all the symbiotic plants. The power plant sub-model is designated for two different scenarios. The first scenario is designed for a user who knows the coal feed input but does not know the total electricity produced. Meanwhile, the second scenario is for the other way around, where the user does not know the coal feed input but has determined the total electricity production demand. Other parameters such as the energy efficiency, carbon capture rate, capacity factor, and parasitic energy used locally are specified by the user as well. The outcome of this sub-model would depend on the chosen scenario to calculate either the amount of energy produced or the required coal feed quantity per hour. Carbon emissions from the power plant and the amount of carbon captured through the PCC are also estimated by this sub-model. The algae plant sub-model is divided into five different scenarios. The first scenario occurs when a user specifies the total quantity of algae harvested per year. The second scenario happens when the user specifies the size of the pond or the photo-bioreactor. The third scenario arises when the fuel demand in liters per year is a priority. The fourth scenario occurs when the user decides that a specified amount of carbon is injected into the system. The last scenario is when the algae-centered system is not used at all (algae pond or photo-bioreactor does not exist). After one of these setups is chosen, the next step is to understand whether algae are to be used for fuel production, aquaculture, or both. The amount of CO2 demand to grow algae is calculated based on the type of algae, the growth factor, and its flowrate.
The next step in the algae plant sub-model is to specify the input of the algae type, fish feed in aquaculture and the temperature specification for the bio-ethanol hydrolysis process and bio-diesel transesterification process. Most of the parameters are constants adopted from various authors, such as Turton et al. [81], Seader et al. [82], Peters et al. [83], and the National Renewable Energy Laboratory (NREL) [84,85]. This sub-model adds all the missing parameters in the overall framework. For instance, if a user specifies the size of the pond or the photo-bioreactor, the outcome of this sub-model will be the algae quantity harvested per year, the amount of fuel produced, and the amount of carbon injected into the system. The oil content, aquaculture products, and various chemicals and by-products are calculated in this sub-model as well. The third sub-model accounts for the other plants. This sub-model has only one simple setup to specify the plant name, feeds, products, and the ratio of input-output process. At this stage, it is limited to five different plants, but can be expanded to include more industries when required. With this simple setting, products and costs can be easily estimated through a simple fraction design calculation. All three sub-models are then combined to estimate the fundamental chemical engineering calculations, such as mass balance, energy balance, carbon balance, and water balance. Furthermore, based on participating industries, the model is able to combine the land sizes into a single patch of land and calculate the minimal land size of this EIP. The overall results from the framework are also validated and optimized. The percentage conversion of more than 30 chemical reactions is calculated through different polynomial equations and constants, as reported in the Supplementary Materials.
Case Study
A conceptual case study has been developed to demonstrate the potential of this modelling framework for the conceptual design of EIPs using material and energy flow analysis. This is illustrated in Figure 6, where the AC-EIP boundary is drawn around a power plant, a solar field, PCC, algae pond, biofuel plant, and aquaculture.
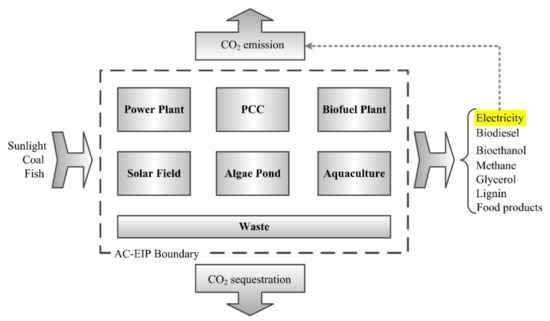
Figure 6.
Block diagram of the AC-EIP case study.
Among many possible scenarios, the carbon emissions of six different scenarios are compared in this case study with main outputs of electricity, aquaculture, and biofuel products. Each of the AC-EIP scenarios was analyzed using material and energy balances. The parasitic/operational power demand, and the Supplementary Materials, nutrients, and byproducts are deemed to be minor in comparison to the main streams of products, energy, and emissions calculations. For simplicity, only key parameters are computed in this case study, and these minor influences are neglected in this current AC-EIP framework. However, this analytical framework is versatile and can accommodate the finest details for precise modelling outcomes.
Scenario ‘A’ is the first scenario (base case scenario) where the power supply comes from a stand-alone 660 MW power plant burning pulverized black coal to produce electricity using steam-driven turbo generators at 33% efficiency. The block diagram of this scenario is shown in Figure 7A [86].
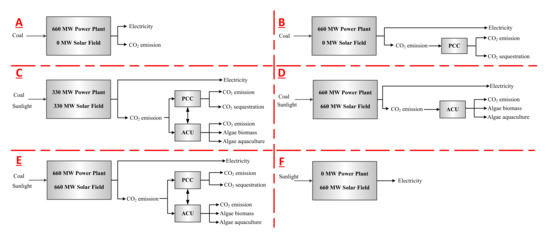
Figure 7.
Comparison of six different scenarios: Scenario ‘A’ (100% fossil), Scenario ‘B’ (100% fuel with CO2 capture and storage), Scenario ‘C’ (fuel saving), Scenario ‘D’ (AC-EIP minus PCC), Scenario ‘E’ (power boasting), and Scenario ‘F’ (100% renewable energy).
In the second scenario (scenario ‘B’), the power supply also comes from a 660 MW coal-fired power plant retrofitted with a PCC, where 90% of the CO2 content is captured and sequestered in the subsequent CCS procedure (Figure 7B). Each scenario with a PCC integration assumes the flue gas from the economizer is cooled and passes through a flue gas desulfurizer (FGD) before being sent to the stack. Another assumption is that an area of 0.5 ha is needed to build each megawatt of the power plant [87,88] and 26 m2 is needed for each megawatt to build the PCC plant [89]. The energy efficiency in the power plant is set at 33%, the PCC capacity is set to 90% CO2 capture rate, 85% capacity factor, and 5% energy used for auxiliary power demand [86]. In this scenario, the entire three million t/y of the CO2 produced in the power plant goes into the PCC process.
For scenario ‘C’ labeled as the fuel-saving scenario (FSS), the concept of AC-EIP is integrated with a 330 MW coal-fired power plant. While another 330 MW is produced from a solar plant integration, the total power generated in scenario ‘C’ is still equal to 660 MW. In this scenario, the production of algae bioethanol and biodiesel is computed by our algorithm according to the material and energy balance principles and as outlined in the Supplementary Materials. For the aquaculture pond, the average weight assumption is of 200 g per fish [71]. For CO2 balance, only the CO2 portion that is not consumed in the algae pond is captured and sequestered, as shown in Figure 7C.
Scenario ‘D’ is a scenario where the AC-EIP is sized to consume most of the CO2 emitted by a 660 MW coal-fired power plant. Moreover, an equivalent 660 MW solar power plant has been added to the power supply and the PCC and a consequent sequestration process has been eliminated. In comparison to the above three scenarios, the total power production in scenario ‘D’ is doubled to equal 1320 MW (Figure 7D). The implication of this scenario is to test the ability of the ACU as a standalone emission mitigating strategy. However, by eliminating the CCS process, the amount of CO2 emitted from the coal-fired power plant that is not being digested by ACU is directly released to the atmosphere. Hence, the lifecycle carbon emission for this scenario is equivalent to the CO2 directly emitted into the atmosphere, as in scenario ‘A’.
The fifth scenario (scenario ‘E’) also integrates the AC-EIP into a 660 MW coal-fired power plant and an equivalent solar plant (660 MW), but with the addition of PCC. Similar to scenario ‘D’, the total power attained in scenario ‘E’ also doubled to 1320 MW; hence, it is called the power-boosting scenario (PBS). As in scenario ‘C’, the amount of CO2 not consumed by the ACU is captured and sequestered in the CCS process (Figure 7E).
The last scenario (scenario ‘F’) is all renewable and consists of a standalone solar power plant. The solar field parameters are calculated based on Qadir et al. [47], where an area of 0.0065 km2 is allocated for each MW of the solar field. Theoretically, no CO2 is emitted from the power plant in this 100% renewable process; hence, the ACU is neglected and the AC-EIP concept would not be applicable in this scenario (Figure 7F).
The feeds and products for each scenario are calculated using our AC-EIP methodology. Apart from scenarios D and E, where the power input capacity from the power plant and solar field was doubled, the other four scenarios were set at 660 MW capacity, sourced either from the coal-fired power plant, solar power plant, or both. Scenarios D and E are analyzed for power-boosting to test the influence of increasing power input on the performance of other EIP members without and with CCS, respectively. Three outcomes for the CO2 are assessed for each scenario:
- CO2 sequestered as a result of the carbon capture process.
- CO2 emitted only from the AC-EIP boundary as shown in Figure 6 (i.e., internal-to-boundary and does not include emissions from downstream processes like biodiesel combustion).
- CO2 emission that is external-to-boundary (total CO2 emitted from AC-EIP processes including emissions from the downstream products).
There is ongoing debates within the scientific community on the preferred analytical methods for LCA studies. The most common and basic analytical methods used in the eco-design discipline are “Cradle-to-Cradle” and “Cradle-to-Grave”, which relate to the life cycle of a product from raw materials (cradle) to disposal (grave) [90]. In the early days, the carbon is released directly to the atmosphere by raw materials extraction or immediately after first processing technology of those raw materials (in the cradle). Today, with increasing awareness of GHG environmental impact, more sustainable routes are offered for carbon capture, conversion, and utilization [91]. Accounting for both analytical methods in our modelling framework is a necessary step to analyze the emission implications within the EIP boundary (internal-to-boundary), or down the track at the end of the products life (external-to-boundary). It is crucial to compare the performance of these scenarios on both platforms to gain a clearer picture on the potential environmental impacts. These adapted scenarios are outlined as block diagrams in Figure 7.
4. Results and Discussion
Table 1 shows the results for CO2 emissions in this six-scenario comparison (scenario ‘A’ a standalone power plant, scenario ‘B’ power plant + PCC, scenario ‘C’ Fuel-saving scenario, scenario ‘D’ AC-EIP minus PCC, scenario ‘E’ Power-boosting scenario, and scenario ‘F’ 100% renewable). The CO2 emissions of scenario ‘B’ are approximately 304,002 t/year (Table 1), while the land size is estimated at 3.32 km2—slightly larger than its counterpart of scenario ‘A’ to account for the PCC retrofit estimated at 17,200 m2.

Table 1.
Parameters and results of the six scenarios.
In the fuel-saving scenario (scenario ‘C’), the coal feed is almost halved to 1.575 million tons per year as a result of solar power shouldering the other half, and the carbon emitted to the atmosphere is much less than in other scenarios. While the levelized emission in scenario ‘A’ is 4606 t/MW/year, it was reduced to 460.6 t/MW/year in scenario ‘B’—this value has been noticeably reduced to only 29.4 t/MW/year in scenario ‘C’, although the land size requirement is almost tripled as a result of including the solar field and the central ACU.
The coal feeds in scenarios ‘D’ and ‘E’ are the same as in scenarios ‘A’ and ‘B’, which is 3.15 million tons per year used for the same 660 MW power plant capacity. However, the total power output is doubled by deploying an equivalent solar power plant, and they only differ by having the PCC plant. The implication of such setups is to verify the extent of ACU productivity, while maximizing the power production. The levelized CO2 emissions of scenarios ‘D’ and ‘E’ are found to be higher than in scenarios ‘B’ and ‘C’ but lower than scenario ‘A’, accounting for 919 t/MW/year and 859 t/MW/year, respectively. Similar to scenarios ‘A’ and ‘B’, the land size is 3.3 km2, including the power plant with an equivalent capacity of 660 MW, but adding enormous land size attributed to that extra 660 MW solar field and the central ACU. The last scenario (scenario ‘F’) excludes the coal-fired power plant and the ACU and would only rely on solar field for power input. Therefore, the land size is mainly reflective to the solar field, eliminating the power plant, PCC, ACU, and other related industries. Consequently, the levelized CO2 emissions theoretically decline to zero.
Apart from electricity production, most other outputs in Table 1 are linked to the ACU production as in scenarios ‘C’, ‘D’, and ‘E’. For scenario ‘C’, the biodiesel production is ~31.8 million L/year and the bioethanol production is approximately 5.3 million L/year. These two products have increased to ~39.1 million L/year and ~6.7 for scenarios ‘D’ and ‘E’, respectively. All other products such as methanol, glycerol, and lignin are equivalent in scenarios ‘C’, ‘D’, and ‘E’, respectively. The fish production calculation is based on 42.5 million fish per year, with an average of 200 g per fish [71] and is found to gain 19,550 t/year for scenarios ‘C’, ‘D’, and ‘E’, respectively. The PCC plant size in scenario ‘C’ (FSS scenario) is calculated to be 1.65 km2, with a solar plant size of 2.15 km2 and algae pond size of 2.59 km2. Hence, in scenario ‘C’, a minimum land area of 6.4 km2 in addition to other plants (i.e., aquaculture and biofuel plants) of the total land area is needed. Likewise, because of the larger power plant (3.3 km2) and solar plant (4.29 km2), the scenario ‘E’ (PBS scenario) area requirement starts from 10.18 km2 adding those additional industrial plants. In PBS (scenario ‘E’), although the power output of the power plant is boosted from 660 to 1320 MW, the amount of CO2 emitted into the air is way below that of the stand-alone power plant (scenario ‘A’). This is not attributed only to the boost of renewable solar power, but also to the addition of emission reduction measures in the form of PCC and ACU. Conversely, the last scenario (scenario ‘F’) is completely different from other scenarios as it entirely relies on renewable energy. Hence, the ACU and the relevant plants are missed their main feed input (CO2 stream) and, therefore, were eliminated. Accordingly, zero emissions is achieved, while no value-adding materials are produced. All the scenarios shown in the framework can work out very detailed calculations describing the AC-EIP setup. The framework calculates all the necessary outputs based on mass balance, energy balance, carbon balance, water balance, techno-economics, land area distributions, and growth rate. Figure 8 compares the CO2 emission in both categories; external and internal to the boundary, CO2 sequestered, and the production of biodiesel and bioethanol in all six scenarios.
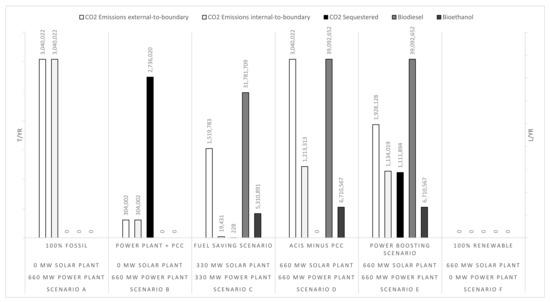
Figure 8.
Detailed CO2 emission/sequestration and biodiesel/bioethanol production comparison for six scenarios (scenario ‘A’ standalone power plant, scenario ‘B’ power plant + PCC, scenario ‘C’ Fuel-saving scenario, scenario ‘D’ AC-EIP minus PCC, scenario ‘E’ power-boosting scenario, scenario ‘F’ 100% renewable).
As shown in Figure 8, in comparing scenarios ‘A’ and ‘D’ in the external-to-boundary scale, it is found that these two scenarios are identical in passing all the emission back to the environment as per the mass balance principle. This is an interesting result attributed to the absence of a permanent CO2 locking mechanism offered by CCS technologies. From emission viewpoint, the only difference is that CO2 emitted directly in scenario ‘A’, while in scenario ‘D’ most of the CO2 will be re-emitted later after the product end-of-life. However, scenario ‘D’ prevails by recycling the carbon in downstream products, which ultimately reduces the reliance on raw materials for new products. For example, by producing biodiesel and methanol from sustainable sources, the extraction of fossil fuels for the purpose of production of these two substances will be reduced. Accordingly, scenario ‘D’ would still be accounted as a sustainable approach in comparison to the conventional scenario ‘A’. Scenario ‘B’ is characterized by the CCS technology that is conceptually able to capture and permanently sequester 90% of the CO2 emissions. Therefore, the CO2 emissions in both internal-to-boundary and external-to-boundary categories are theoretically identical. Because of the 90% capture rate target and sequestration process in scenario ‘B’, only 10% (304,002 t/year) CO2 is emitted into the atmosphere.
Scenario ‘C’ is a fuel-saving scenario, where half of the fossil-based energy production is replaced by renewable energy. Therefore, only half of the coal is used for this process, which means that about half of the CO2 emission of scenario ‘A’ (1,519,000 t/year) is theoretically emitted into the atmosphere after the product end-of-life as in the external-to-boundary category. However, in this scenario, a synchronization between the ACU and PCC exists. This means that a portion of captured CO2 in the PCC is directly fed to the ACU based on demand. The option of feeding the almost pure CO2 from the PCC in to the ACU system is most appealing because the rate and compositions of the input species to the ACU is manageable and, consequently, the algae product quality and quantity. Meanwhile, in scenario ‘D’, for example, the ACU relies on direct flue gas feed from the coal-fired power plant, which requires a high level of tolerance to the flue gas species and contaminants. The level of synchronization between the ACU and PCC in scenario ‘C’ would depend on CO2 demand by the ACU and require a rigorous techno-economic optimization. In an extreme case where all the captured CO2 stream in the PCC is digested by the ACU, the CO2 emission at the product end-of-life will be 1,519,000 t/year, as reported in Figure 8. However, any proportion of the CO2 stream is permanently locked by sequestration, and will reduce the total CO2 emissions in the external-to-boundary category.
Scenario ‘E’ also engages a high level of synchronization between the ACU and PCC as in scenario ‘C’. However, as the power output from the coal-fired power plant is relatively doubled, the flue gas production and CO2 captured in the PCC are also doubled. Accordingly, as the ACU and subsequent downstream industries (e.g., biodiesel and bioethanol) reach their nominal production capacity, evidently more captured CO2 would be sequestered (Figure 8). In comparison to scenario ‘C’ that has a similar setting, while the CO2 emission is doubled in scenario ‘E’, but the CO2 emissions in the external-to-boundary category is only marginally higher (1,519,718 vs. 1,928,128 tCO2/year).
Scenario ‘F’ shows zero CO2 emission in the external-to-boundary category, because it consists of a 100% renewable process. Overall, carbon emission in the internal-to-boundary is easier to compute and compare than that in the external-to-boundary category, as there is no requirement to analyze the post CO2 emission from the downstream production parts. It just comprises a simple calculation of the CO2 input in the system and the CO2 emitted from the system.
Overall, scenario ‘A’ directly emitted all the CO2 into the atmosphere, as it is a standalone power plant without integration with a PCC or ACU system. The CO2 emitted from the power plant in scenario ‘B’ is not being used in ACU or downstream industries, thus, CO2 emissions calculated in both categories is identical. In this scenario, only 10% CO2 is emitted to the atmosphere as a result of the PCC presence at 90% capture capacity. Scenario ‘C’ produced the lowest CO2 internal-to-boundary emission because of the implementation of both ACU and the sequestration process. However, the external-to-boundary emissions are quite high, as most of the captured CO2 stream is digested by the ACU and converted to downstream products. In scenario ‘D’, and in the absence of PCC, the amount of CO2 emission is just the volume of CO2 that cannot be absorbed by the ACU. However, the external-to-boundary emissions in this scenario show an unsustainable pathway similar to scenario ‘A’. The hidden advantage of this scenario is in the saving of raw materials and fossil fuels usually used for a similar quantity of downstream products. Scenario ‘E’ (PBS) uses both ACU and PCC processes as in scenario ‘C’ but marginally emitted more CO2 into the atmosphere because of the doubling capacity of power usage. Finally, scenario ‘F’ offers zero emission in both categories because of the standalone solar plant.
Comparing the permanent lockdown of CO2 emission via the sequestration process, as in Figure 8, scenario ‘B’ offers the highest capacity, as all the CO2 emitted from the power plant goes straight into the PCC and then 90% of the CO2 is captured and proceeded to the sequestration pathway. Scenarios ‘A’, ‘D’, and ‘F’ have no carbon to be sequestered, as the CCS process is not integrated into the system. Scenario ‘E’ shows the second highest sequestration quantity after scenario ‘B’, because this scenario consumes more coal and energy beyond the consumption capacity of the ACU system. Biodiesel and bioethanol production for scenarios ‘A’, ‘B’, and ‘F’ does not exist at all, because the concept of AC-EIP integration does not apply to those scenarios. Scenarios ‘D’ and ‘E’ produce more biofuels than scenario ‘C’ because of the power production and CO2 emission from the power plant is doubled (FSS vs. PBS). In comparing the base-case scenario (scenario ‘A’) with the PBS (scenario ‘D’) for instance, we found that by matching the power plant with an equivalent solar power plant in the presence of ACU, aquaculture, biofuel industries, the net CO2 emissions were cut by 60%, along with annual production of 39 kL (m3) biodiesel, 6.7 kL (m3) bioethanol, 0.14 kL (m3) methanol, and 19.55 tons of fish products.
In summary, AC-EIP integration fosters a sustainable interconnection to exchange energy, materials, and low emission between EIP members, as visually demonstrated in Figure 9. By using most of the CO2 emitted from the coal-fired power plant in the AC-EIP, this interconnection will result in more material productions, where most of the direct CO2 emissions are converted to the external-to-boundary emissions at a significantly lower carbon footprint. On the other hand, capturing and sequestering most of the CO2 emitted from the coal-fired power plant will result in the permanent lockdown of CO2 at no significant external-to-boundary emissions, but no materials to be produced downstream. This means that demand for those downstream materials will be attained from alternative individual industries at a much greater carbon footprint.
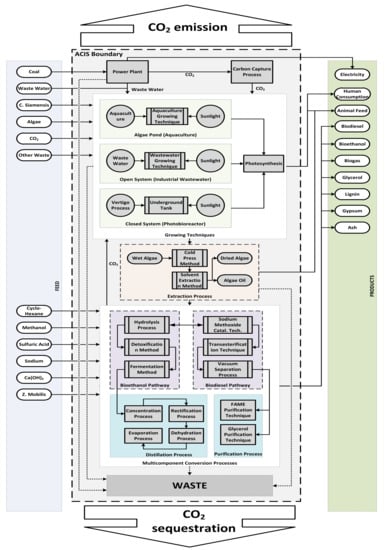
Figure 9.
Conceptual flow diagram of AC-EIP.
5. Conclusions and Recommendations
This study presents a new modelling framework for the conceptual design of EIPs using material and energy flow analysis. This is important for evaluating energy and circular materials technology transitions for future low emission production systems compatible with the circular economy. A new conceptual algae-centered EIP was introduced, demonstrating the tangible value-adding potential of algae production in creating more sustainable industrial symbioses. This new sustainable synergy offers potential recycling of CO2 from the flue gas emissions back into the EIP system via deploying ACU at the center with/without PCC synchronization. Accordingly, a number of relevant industries can economically benefit from this synergy and reduce carbon footprint on the environment. Multiple combination possibilities for the algae-centered EIP integration were realized in-line with available resources, energy, and materials and according to the market demand. By using a 100% renewable option, although zero CO2 emissions can theoretically be achieved (on the internal-to-boundary scale category), value-added materials generation and by-products recycling would be eliminated. Without such evocative synergy, the demand for those downstream materials will be attained from alternative individual industries at much greater carbon footprint. Nevertheless, at the right balance of technologies and feedstocks, an optimized integration of participating industries scaled appropriately within the AC-EIP system can achieve the lowest CO2 emissions combined with maximum material productivity.
Using this versatile modelling framework, further industries can be integrated to improve the social, economic and environmental outcomes from the AC-EIP. For example, taking into consideration an aquaculture integrated with a desalination plant and/or wastewater treatment plant can bring enormous benefits to this AC-EIP concept evolving a more structured PFD, as shown in Figure 9. This can be carried forward towards detailed process design and integration including rigorous mass/energy balance supported by an advanced pinch analysis, parametric justifications and process optimization plans. The simplicity and versatility of our model moreover allow for rapid scenario creation and comparisons to uncover insights into future EIP developments to better inform and aid decision makers.
Supplementary Materials
The supplementary materials are available online at https://www.mdpi.com/2073-4441/13/1/69/s1.
Author Contributions
Conceptualization, A.S.T. and A.A.; data curation, A.S.T.; methodology, A.S.T., D.M., N.F., and A.A.; software, A.S.T.; validation, D.M., Z.C., and A.A.; formal analysis, A.S.T., D.M., and A.A.; investigation, D.M., Z.C., and A.A.; writing—original draft preparation, A.S.T., D.M., and Z.C.; writing—review and editing, D.M., N.F., and A.A.; visualization, D.M.; supervision, A.A. All authors have read and agreed to the published version of the manuscript.
Funding
This research received no external funding.
Institutional Review Board Statement
Not applicable.
Informed Consent Statement
Not applicable.
Data Availability Statement
Not applicable.
Conflicts of Interest
The authors declare no conflict of interest.
Abbreviations
| AC-EIP | Algae-centered eco-industrial park |
| ACU | Algae cultivation unit |
| CCS | Carbon capture and sequestration |
| FSC | Fuel saving scenario |
| IE | Industrial ecology |
| GHG | Greenhouse gases |
| LCA | Lifecycle assessment |
| PBS | Power-boosting scenario |
| Pc | Critical pressure |
| PCC | Post-combustion carbon capture |
| SG | Specific gravity |
| Tb | Boiling temperature |
| Tc | Critical temperature |
| TES | Techno-ecological synergy |
| TMC | Total material consumption |
| TME | Total material emission |
| Vc | Critical volume |
References
- Puga, D. The magnitude and causes of agglomeration economies. J. Reg. Sci. 2010, 50, 203–219. [Google Scholar] [CrossRef]
- Shen, N.; Peng, H. Can industrial agglomeration achieve the emission-reduction effect? Soc. Econ. Plan. Sci. 2020, 100867. [Google Scholar] [CrossRef]
- Butturi, M.; Lolli, F.; Sellitto, M.A.; Balugani, E.; Gamberini, R.; Rimini, B. Renewable energy in eco-industrial parks and urban-industrial symbiosis: A literature review and a conceptual synthesis. Appl. Energy 2019, 255, 113825. [Google Scholar] [CrossRef]
- Zeng, D.Z.; Cheng, L.; She, L.; Luetkenhorst, W. China’s green transformation through eco-industrial parks. World Dev. 2020, 105249. [Google Scholar] [CrossRef]
- Susur, E.; Martin-Carrillo, D.; Chiaroni, D.; Hidalgo, A. Unfolding eco-industrial parks through niche experimentation: Insights from three Italian cases. J. Clean. Prod. 2019, 239, 118069. [Google Scholar] [CrossRef]
- Boix, M.; Montastruc, L.; Ramos, M.; Gentilhomme, O.; Domenech, S. Benefits analysis of optimal design of eco-industrial parks through life cycle indicators. Comput. Aided Chem. Eng. 2017, 40, 1951–1956. [Google Scholar]
- Chertow, M.R. Industrial symbiosis: Literature and taxonomy. Annu. Rev. Energy Environ. 2000, 25, 313–337. [Google Scholar] [CrossRef]
- Chertow, M.R. “Uncovering” industrial symbiosis. J. Ind. Ecol. 2007, 11, 11–30. [Google Scholar] [CrossRef]
- Belaud, J.-P.; Adoue, C.; Vialle, C.; Chorro, A.; Sablayrolles, C. A circular economy and industrial ecology toolbox for developing an eco-industrial park: Perspectives from French policy. Clean Technol. Environ. Policy 2019, 21, 967–985. [Google Scholar] [CrossRef]
- ElMassah, S. Industrial symbiosis within eco-industrial parks: Sustainable development for Borg El-Arab in Egypt. Bus. Strateg. Environ. 2018, 27, 884–892. [Google Scholar] [CrossRef]
- Saavedra, Y.M.B.; Iritani, D.; Pavan, A.L.R.; Ometto, A.R. Theoretical contribution of industrial ecology to circular economy. J. Clean. Prod. 2018, 170, 1514–1522. [Google Scholar] [CrossRef]
- Lowe, E. Eco-Industrial Park Handbook for Asian Developing Countries: Report to Asian Development Bank; Environment Department, Indigo Development: Oakland, CA, USA, 2001. [Google Scholar]
- Bakshi, B.R.; Ziv, G.; Lepech, M.D. Techno-ecological synergy: A framework for sustainable engineering. Environ. Sci. Technol. 2015, 49, 1752–1760. [Google Scholar] [CrossRef] [PubMed]
- Zhu, Q.; Lowe, E.A.; Barnes, D. Industrial symbiosis in China: A case study of the Guitang Group. J. Ind. Ecol. 2007, 11, 31–42. [Google Scholar] [CrossRef]
- Jacobsen, N.B. Industrial symbiosis in Kalundborg, Denmark—A quantitative assessment of economic and environmental aspects. J. Ind. Ecol. 2006, 10, 239–255. [Google Scholar] [CrossRef]
- Gibbs, D.; Deutz, P. Implementing industrial ecology? Planning for eco-industrial parks in the USA. Geoforum 2005, 36, 452–464. [Google Scholar]
- Roberts, B.H. The application of industrial ecology principles and planning guidelines for the development of eco-industrial parks: An Australian case study. J. Clean. Prod. 2004, 12, 997–1010. [Google Scholar] [CrossRef]
- Hoffmann, J.; Rudra, S.; Toor, S.S.; Holm-Nielsen, J.B.; Rosendahl, L.A. Conceptual design of an integrated hydrothermal liquefaction and biogas plant for sustainable bioenergy production. Biores. Technol. 2013, 129, 402–410. [Google Scholar] [CrossRef]
- Ayres, R.U.; Ayres, L.W. A Handbook of Industrial Ecology; Edward Elgar Publishing Limited: Cheltenham, UK, 2002. [Google Scholar]
- Allenby, B. The ontologies of industrial ecology. Int. J. Environ. Pollut. 2006, 3, 13. [Google Scholar] [CrossRef]
- Corder, G.D.; Golev, A. Industrial Ecology in Australia: Barriers and Enablers. Resour. Conserv. Recycl. 2014, 3, 340–361. [Google Scholar] [CrossRef]
- Van Den Bergh, J.C.J.M.; Janssen, M.A. (Eds.) Economics of Industrial Ecology: Materials, Structural Change, and Spatial Scales; MIT Press: London, UK, 2004. [Google Scholar]
- Bourg, D.; Erkman, S. (Eds.) Perspectives on Industrial Ecology; Greenleaf Publishing Ltd.: Austin, TX, USA, 2003. [Google Scholar]
- Graedel, T.E.; Allenby, B.R. (Eds.) Industrial Ecology, 2nd ed.; Prentice Hall: Englewood Cliffs, NJ, USA, 2003; p. 363. [Google Scholar]
- Graedel, T.E. Material flow analysis from origin to evolution. Environ. Sci. Technol. 2019, 53, 12188–12196. [Google Scholar] [CrossRef]
- Rahman, S.; Chowdhury, R.B.; D’Costa, N.G.; Milne, N.; Bhuiyan, M.; Sujauddin, M. Determining the potential role of the waste sector in decoupling of phosphorus: A comprehensive review of national scale substance flow analyses. Resour. Conserv. Recycl. 2019, 144, 144–157. [Google Scholar] [CrossRef]
- Campos-Guzmán, V.; Carcia-Cáscales, M.S.; Espinosa, N.; Urbina, A. Life Cycle Analysis with Multi-Criteria Decision Making: A review of approaches for the sustainability evaluation of renewable energy technologies. Renew. Sustain. Energy Rev. 2019, 104, 343–366. [Google Scholar] [CrossRef]
- Kasbun, N.F.; Ong, T.S.; Muhamad, H.; Said, R.M. Conceptual Framework to Improve Carbon Performance via Carbon Strategies and Carbon Accounting. J. Environ. Manag. Tour. 2019, 10, 1918–1923. [Google Scholar]
- Venkatesh, G. Pinch analysis, as a technique for optimising resource utilisation and promoting environmental sustainability: A review of recent case studies from the developing world and transition economies. Resour. Environ. Inf. Eng. 2019, 1, 1–17. [Google Scholar] [CrossRef]
- Kastner, C.A.; Lau, R.; Kraft, M. Quantitative tools for cultivating symbiosis in industrial parks; a literature review. Appl. Energy 2015, 155, 599–612. [Google Scholar] [CrossRef]
- Yeo, Z.; Masi, D.; Low, J.S.C.; Ng, Y.T.; Tan, P.S.; Barnes, S. Tools for promoting industrial symbiosis: A systematic review. J. Ind. Ecol. 2019, 23, 1087–1108. [Google Scholar] [CrossRef]
- De Bhowmick, G.; Sarmah, A.K.; Sen, R. Zero-waste algal biorefinery for bioenergy and biochar: A green leap towards achieving energy and environmental sustainability. Sci. Total Environ. 2019, 650, 2467–2482. [Google Scholar] [CrossRef]
- Geng, Y.; Liu, Z.; Xue, B.; Dong, H.; Fujita, T.; Chiu, A. Emergy-based assessment on industrial symbiosis: A case of Shenyang Economic and Technological Development Zone. Environ. Sci. Pollut. Res. 2014, 21, 13572–13587. [Google Scholar] [CrossRef]
- Wen, Z.; Meng, X. Quantitative assessment of industrial symbiosis for the promotion of circular economy: A case study of the printed circuit boards industry in China’s Suzhou New District. J. Clean. Prod. 2015, 90, 211–219. [Google Scholar] [CrossRef]
- Walmsley, T.G.; Ong, B.H.Y.; Klemeš, J.J.; Tan, R.R.; Varbanov, P.S. Circular Integration of processes, industries, and economies. Renew. Sustain. Energy Rev. 2019, 107, 507–515. [Google Scholar] [CrossRef]
- Shi, H.; Chertow, M.; Song, Y. Developing country experience with eco-industrial parks: A case study of the Tianjin Economic-Technological Development Area in China. J. Clean. Prod. 2010, 18, 191–199. [Google Scholar] [CrossRef]
- Kim, H.W.; Dong, L.; Choi, A.E.S.; Fugii, M.; Fugii, T.; Park, H.S. Co-benefit potential of industrial and urban symbiosis using waste heat from industrial park in Ulsan, Korea. Resour. Conserv. Recycl. 2018, 135, 225–234. [Google Scholar] [CrossRef]
- Ohnishi, S.; Fujii, M.; Ohata, M.; Rokuta, I.; Fujita, T. Efficient energy recovery through a combination of waste-to-energy systems for a low-carbon city. Resour. Conserv. Recycl. 2018, 128, 394–405. [Google Scholar] [CrossRef]
- Arbolino, R.; Simone, L.D.; Carlucci, F.; Yigitcanlar, T.; Loppolo, G. Towards a sustainable industrial ecology: Implementation of a novel approach in the performance evaluation of Italian regions. J. Clean. Prod. 2018, 178, 220–236. [Google Scholar] [CrossRef]
- Govindan, K.; Hasanagic, M. A systematic review on drivers, barriers, and practices towards circular economy: A supply chain perspective. Int. J. Prod. Res. 2018, 56, 278–311. [Google Scholar] [CrossRef]
- Kalmykova, Y.; Sadagopan, M.; Rosado, L. Circular economy—From review of theories and practices to development of implementation tools. Resour. Conserv. Recycl. 2018, 135, 190–201. [Google Scholar] [CrossRef]
- Song, X.; Geng, Y.; Dong, H.; Chen, W. Social network analysis on industrial symbiosis: A case of Gujiao eco-industrial park. J. Clean. Prod. 2018, 193, 414–423. [Google Scholar] [CrossRef]
- Geng, Y.; Sarkis, J.; Ulgiati, S.; Zhang, P. Measuring China’s Circular Economy. Science 2013, 339, 1526. [Google Scholar] [CrossRef] [PubMed]
- Kirchherr, J.; Piscielli, L.; Bour, R.; Kostense-Smit, E.; Muller, J.; Huibrechtse-Trijens, A.; Hekkert, M. Barriers to the Circular Economy: Evidence From the European Union (EU). Ecol. Econ. 2018, 150, 264–272. [Google Scholar] [CrossRef]
- Reike, D.; Vermeulen, W.J.V.; Witjes, S. The circular economy: New or Refurbished as CE 3.0?—Exploring Controversies in the Conceptualization of the Circular Economy through a Focus on History and Resource Value Retention Options. Resour. Conserv. Recycl. 2018, 135, 246–264. [Google Scholar] [CrossRef]
- Prieto-Sandoval, V.; Jaca, C.; Ormazabal, M. Towards a consensus on the circular economy. J. Clean. Prod. 2018, 179, 605–615. [Google Scholar] [CrossRef]
- Qadir, A.; Mokhtar, M.; Khalilpour, R.; Milani, D.; Vassallo, A.; Chiesa, M.; Abbas, A. Potential for solar-assisted post-combustion carbon capture in Australia. Appl. Energy 2013, 111, 175–185. [Google Scholar] [CrossRef]
- Khalilpour, R. Design and Integration of Post-Combustion Carbon Capture Processes: Retrofitting to Coal-Fired power Plants. In School of Chemical &Biomolecular Engineering; University of Sydney: Camperdown, NSW, Australia, 2012. [Google Scholar]
- Australian Energy Statistics. Table O Electricity Generation by Fuel Type 2018-19 and 2019. Available online: https://www.energy.gov.au/publications/australian-energy-statistics-table-o-electricity-generation-fuel-type-2018-19-and-2019 (accessed on 15 June 2020).
- NSW Emissions. Australian Greenhouse Emissions Information System (AGEIS). 2018. Available online: https://climatechange.environment.nsw.gov.au/About-climate-change-in-NSW/NSW-emissions (accessed on 15 June 2020).
- Ebrahimi, A.; Saffari, M.; Milani, D.; Montoya, A.; Valix, M.; Abbas, A. Sustainable transformation of fly ash industrial waste into a construction cement blend via CO2 carbonation. J. Clean. Prod. 2017, 156, 660–669. [Google Scholar] [CrossRef]
- Ebrahimi, A.; Saffari, M.; Hong, Y.; Milani, D.; Montoya, A.; Valix, M.; Minett, A.; Abbas, A. Mineral sequestration of CO2 using saprolite mine tailings in the presence of alkaline industrial wastes. J. Clean. Prod. 2018, 188, 686–697. [Google Scholar] [CrossRef]
- Milani, D.; Khalilpour, R.; Zahedi, G.; Abbas, A. A model-based analysis of CO2 utilization in methanol synthesis plant. J. CO2 Util. 2015, 10, 12–22. [Google Scholar] [CrossRef]
- Luu, M.T.; Milani, D.; Bahadori, A.; Abbas, A. A comparative study of CO2 utilization in methanol synthesis with various syngas production technologies. J. CO2 Util. 2015, 12, 62–76. [Google Scholar] [CrossRef]
- Algae Link. 2014. Available online: www.algaelink.com (accessed on 9 November 2014).
- Li, L.; Zhao, N.; Wei, W.; Sun, Y. A review of research progress on CO2 capture, storage, and utilization in Chinese Academy of Sciences. Fuel 2013, 108, 112–130. [Google Scholar] [CrossRef]
- Hasan, M.F.; Boukouvala, F.; First, E.L.; Floudas, C.A. Nationwide, regional, and statewide CO2 capture, utilization, and sequestration supply chain network optimization. Ind. Eng. Chem. Res. 2014, 53, 7489–7506. [Google Scholar] [CrossRef]
- Parvareh, F.; Sharma, M.; Qadir, A.; Milani, D.; Khalilpour, R.; Chiesa, M.; Abbas, A.L. Integration of solar energy in coal-fired power plants retrofitted with carbon capture: A review. Renew. Sustain. Energy Rev. 2014, 38, 1029–1044. [Google Scholar] [CrossRef]
- Global CCS Institute. The Global Status of CCS: 2011; Global CCS Institute: Canberra, NSW, Australia, 2011; p. 156. [Google Scholar]
- Kadam, K.L. Environmental implications of power generation via coal-microalgae cofiring. Energy 2002, 27, 905–922. [Google Scholar] [CrossRef]
- Brennan, L.; Owende, P. Biofuels from microalgae—A review of technologies for production, processing, and extractions of biofuels and co-products. Renew. Sustain. Energy Rev. 2009, 14, 557–577. [Google Scholar] [CrossRef]
- Chang, W.-T.; Lee, M.; Den, W. Simultaneous carbon capture, biomass production, and diary wastewater purification by Spirulina maxima photobioreaction. Ind. Eng. Chem. Res. 2013, 52, 2046–2055. [Google Scholar] [CrossRef]
- Hirata, S.; Hayashitani, M.; Taya, M.; Tone, S. Carbon dioxide fixation in batch culture of Chlorella sp. using a photobioreactor with a sunlight-cellection device. J. Ferment. Bioeng. 1996, 81, 470–472. [Google Scholar] [CrossRef]
- Mata, T.M.; Martins, A.A.; Caetano, N.S. Microalgae for biodiesel production and other applications: A review. Renew. Sustain. Energy Rev. 2010, 14, 217–232. [Google Scholar] [CrossRef]
- Alaswad, A.; Dassisti, M.; Prescott, M.; Olabi, A.G. Technologies and developments of third generation biofuel production. Renew. Sustain. Energy Rev. 2015, 51, 1446–1460. [Google Scholar] [CrossRef]
- Cristi, Y. Biodiesel from microalgae. Biotechnol. Adv. 2007, 25, 294–306. [Google Scholar]
- Chi, Z.; Zheng, Y.; Jiang, A.; Chen, S. Lipid production by culturing oleaginous yeast and algae with food waste and municipal wastewater in an integrated process. Appl. Biochem. Biotechnol. 2011, 165, 442–453. [Google Scholar] [CrossRef]
- Ververis, C.; Georghiou, K.; Danielidis, D.; Hatzinikolaou, D.G.; Santas, P.; Santas, R.; Corleti, V. Cellulose, hemicelluloses, lignin and ash content of some organic materials and their suitability for use as paper pulp supplements. Bioresour. Technol. 2006, 98, 6. [Google Scholar] [CrossRef]
- Shields, R.J.; Lupatsch, I. Algae for Aquaculture and Animal Feeds. Theor. Praxis 2012, 21, 23–37. [Google Scholar]
- Jayakumar, R.; Abdul Nazar, A.K.; Tamilmani, G.; Sakthivel, M.; Rameshkumar, P.; Antikuttan, K.K.; Johnson, B.; Hanumanta Rao, G. Silver Pompano, Trachinotus blochii—A potential fish for coastal aquaculture in India. Aquac. Spectrum 2019, 2, 9–16. [Google Scholar]
- Hilborn, R.; Kearney, B. Australian Seafood Consumers Mislead by Prophets of Doom and Gloom. Available online: http://damnationfilm.com/uploads/websites/330/wysiwyg/Australian_seafood_consumers_misled_by_prophets_of_doom_and_gloom_Feb_2012.pdf (accessed on 30 December 2020).
- Khan, M.I.; Shin, J.H.; Kim, J.D. The promising future of microalgae: Current status, challenges, and optimization of a sustainable and renewable industry for biofuels, feed, and other products. Microb. Cell Fact. 2018, 17, 36. [Google Scholar] [CrossRef] [PubMed]
- Demirbas, A. Biomass resource facilities and biomass conversion processing for fuels and chemicals. Energy Convers. Manag. 2001, 42, 1357–1378. [Google Scholar] [CrossRef]
- McGill, R. Algae as a Feedstock for Transportation Fuels—The Future of Biofuels? Presented to the 35th Executive Committee Meeting, Vienna, Austria, May 2008; A White Paper Prepared for the IEA Advanced Motor Fuels Implementing Agreement. Available online: https://amf-tcp.org/app/webroot/files/file/Annex%20Reports/AMF_Annex_34-2_white%20paper.pdf (accessed on 30 December 2020).
- Hu, Q.; Sommerfeld, M.; Jarvis, E.; Ghirardi, M.; Posewitz, M.; Seibert, M.; Dazins, A. Microalgal triacylglycerols as feedstocks for biofuel production: Perspectives and advances. Plant J. 2008, 54, 621–639. [Google Scholar] [CrossRef] [PubMed]
- McKendry, P. Energy production from biomass (part 2): Conversion technologies. Bioresour. Technol. 2002, 83, 47–54. [Google Scholar] [CrossRef]
- Nisbet, M.A.; VanGeem, M.G.; Gajda, J.; Marceau, M. Environmental Life Cycle Inventory of Portland Cement Concrete; P.C. Association: Skokie, IL, USA, 2000. [Google Scholar]
- Gao, T.; Shen, L.; Shen, M.; Chen, F.; Liu, L.; Gao, L. Analysis on differences of carbon dioxide emission from cement production and their major determinants. J. Clean. Prod. 2015, 103, 160–170. [Google Scholar] [CrossRef]
- Sim, V.S.T.; She, Q.; Chong, T.H.; Tang, C.Y.; Fane, A.G.; Krantz, W.B. Strategic co-location in a Hybrid Process involving desalination and Pressure Retarded Osmosis (PRO). Membranes 2013, 3, 98–125. [Google Scholar] [CrossRef]
- Wang, M.; Wang, K.K.; Jia, Y.X.; Ren, Q.C. The reclamation of brine generated from desalination process by bipolar membrane electrodialysis. J. Membr. Sci. 2014, 452, 54–61. [Google Scholar] [CrossRef]
- Turton, R.; Baillie, R.C.; Whiting, W.B.; Shaeiwiz, J.A. Analysis, Synthesis and Design of Chemical Processes; Pearson Education: New York, NY, USA, 2008. [Google Scholar]
- Sieder, W.; Seader, J.; Lewin, D. Product and Process Design Principles; John Wiley & Sons: Hoboken, NJ, USA, 2004. [Google Scholar]
- Peters, M.S.; Timmerhaus, K.D.; West, R.E. Plant Design and Economics for Chemical Engineers, 5th ed.; McGrawhill: New York, NY, USA, 2003. [Google Scholar]
- Aden, A.; Ruth, M.; Ibsen, K.; Jechura, J.; Neeves, K.; Sheehan, J.; Wallace, B. Lignocellulosic Biomass to Ethanol Process Design and Economics Utilizing Co-Current Dilute Acid Prehydrolysis and Enzymatic Hydrolysis for Corn Stover; National Renewable Energy Laboratory (NREL): Golden, CO, USA, 2002; p. 154. [Google Scholar]
- Pienkos, P.T. The Potential for Biofuels from Algae. In Algae Biomass Summit; National Renewable Energy Laboratory (NREL): San Francisco, CA, USA, 2007. [Google Scholar]
- Khalilpour, R.; Abbas, A. HEN optimization for efficient retrofitting of coal-fire power plants with post-combustion carbon capture. Int. J. Greenh. Control 2011, 5, 189–199. [Google Scholar] [CrossRef]
- Pasqualetti, M.J. Decommissioning Nuclear Power Plants. In Controlling the Atom in the 21st Century; O’Very, D.P., Paine, C.E., Reicher, D.W., Eds.; Westview Press: Boulder, CO, USA, 1994. [Google Scholar]
- Pasqualetti, M.J.; Miller, B.A. Land Requirements for the Solar and Coal Options. Geogr. J. 1984, 150, 192–212. [Google Scholar] [CrossRef]
- Florin, N.; Fennel, P. Assessment of the Validity of―Approximate Minimum Land Footprint for Some Types of CO2 Capture Plant; CCR Land Footprint Review; Department of Energy & Climate Change, 2010. Available online: https://www.gov.uk/government/publications/assessment-of-the-validity-of-approximate-minimum-land-footprint-for-some-types-of-co2-capture-plant (accessed on 30 December 2020).
- El Haggar, S. Sustainable Industrial Design and Waste Management: Cradle-to-Cradle for Sustainable Development; Elseiver Academic Press: Oxford, UK, 2007. [Google Scholar]
- Rafiee, A.; Khalilpour, K.R.; Milani, D. CO2 conversion and utilization pathways. In Polygeneration with Polystorage for Chemical and Energy Hubs; Elsevier: Amsterdam, The Netherlands, 2019; pp. 213–245. [Google Scholar]
Publisher’s Note: MDPI stays neutral with regard to jurisdictional claims in published maps and institutional affiliations. |
© 2020 by the authors. Licensee MDPI, Basel, Switzerland. This article is an open access article distributed under the terms and conditions of the Creative Commons Attribution (CC BY) license (http://creativecommons.org/licenses/by/4.0/).