A Meta-Analysis of Environmental Tradeoffs of Hydropower Dams in the Sekong, Sesan, and Srepok (3S) Rivers of the Lower Mekong Basin

 , , and
Abstract
1. Introduction
2. Study Area and Methods
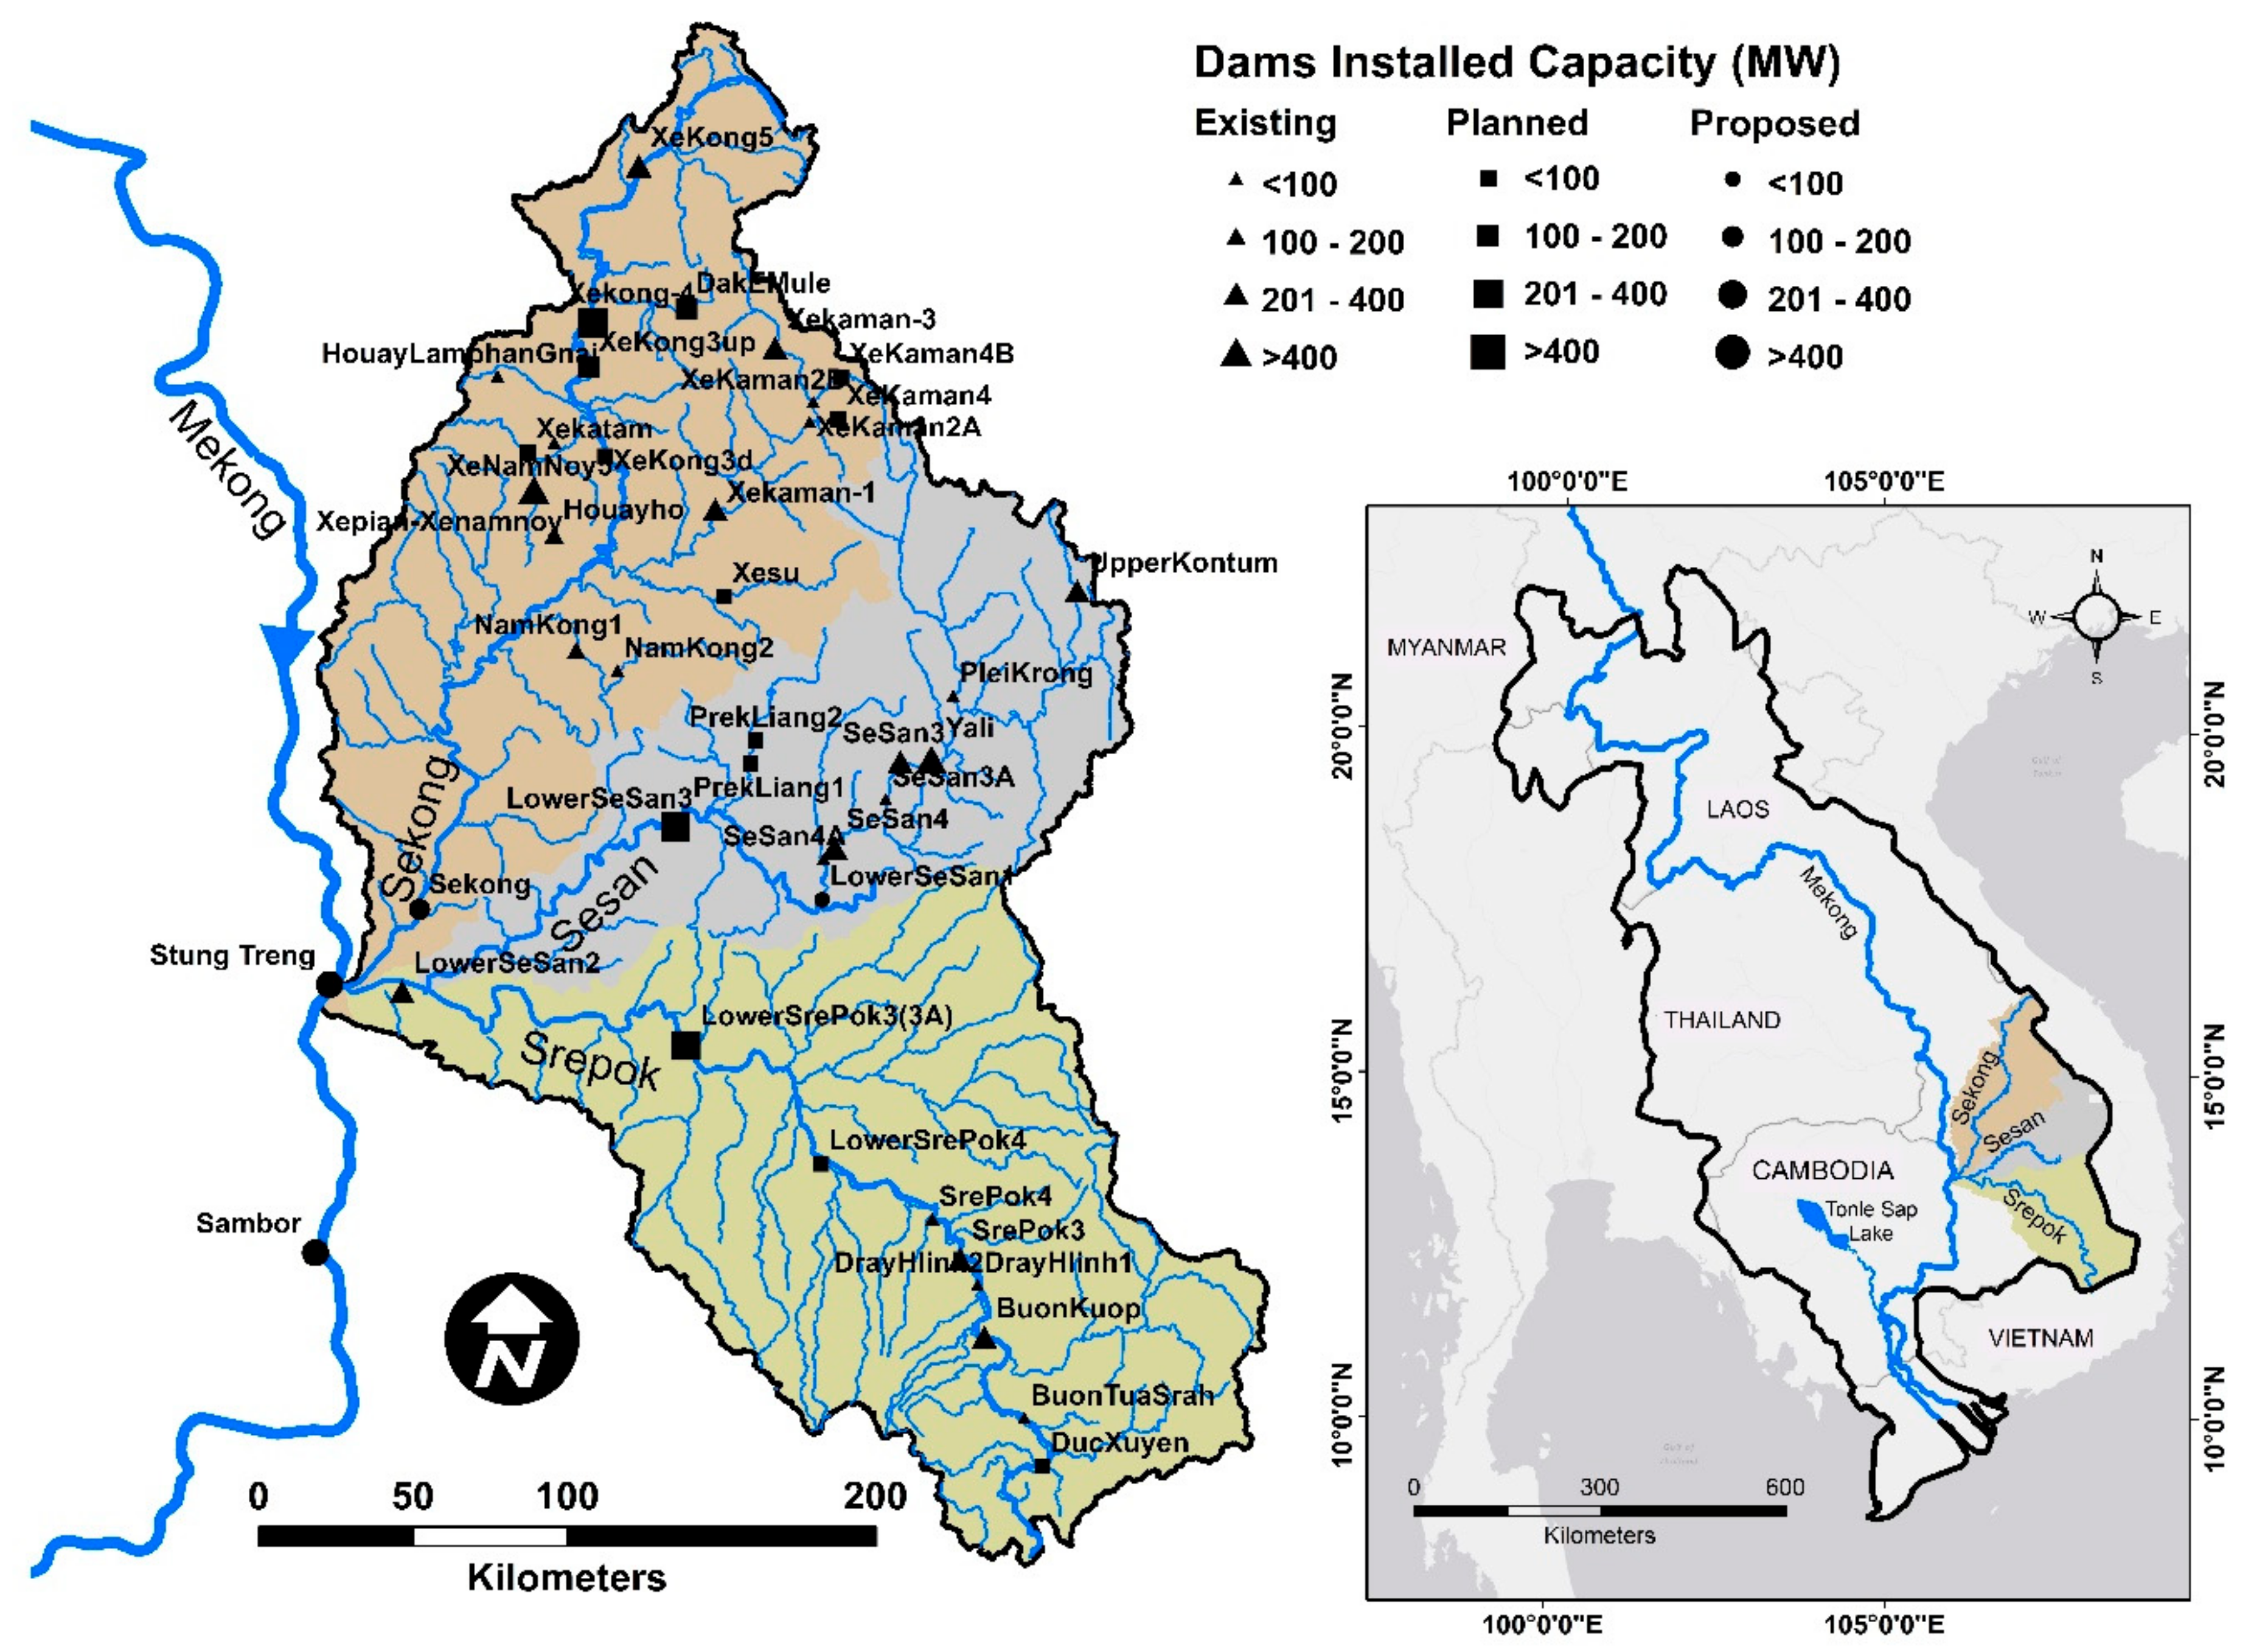
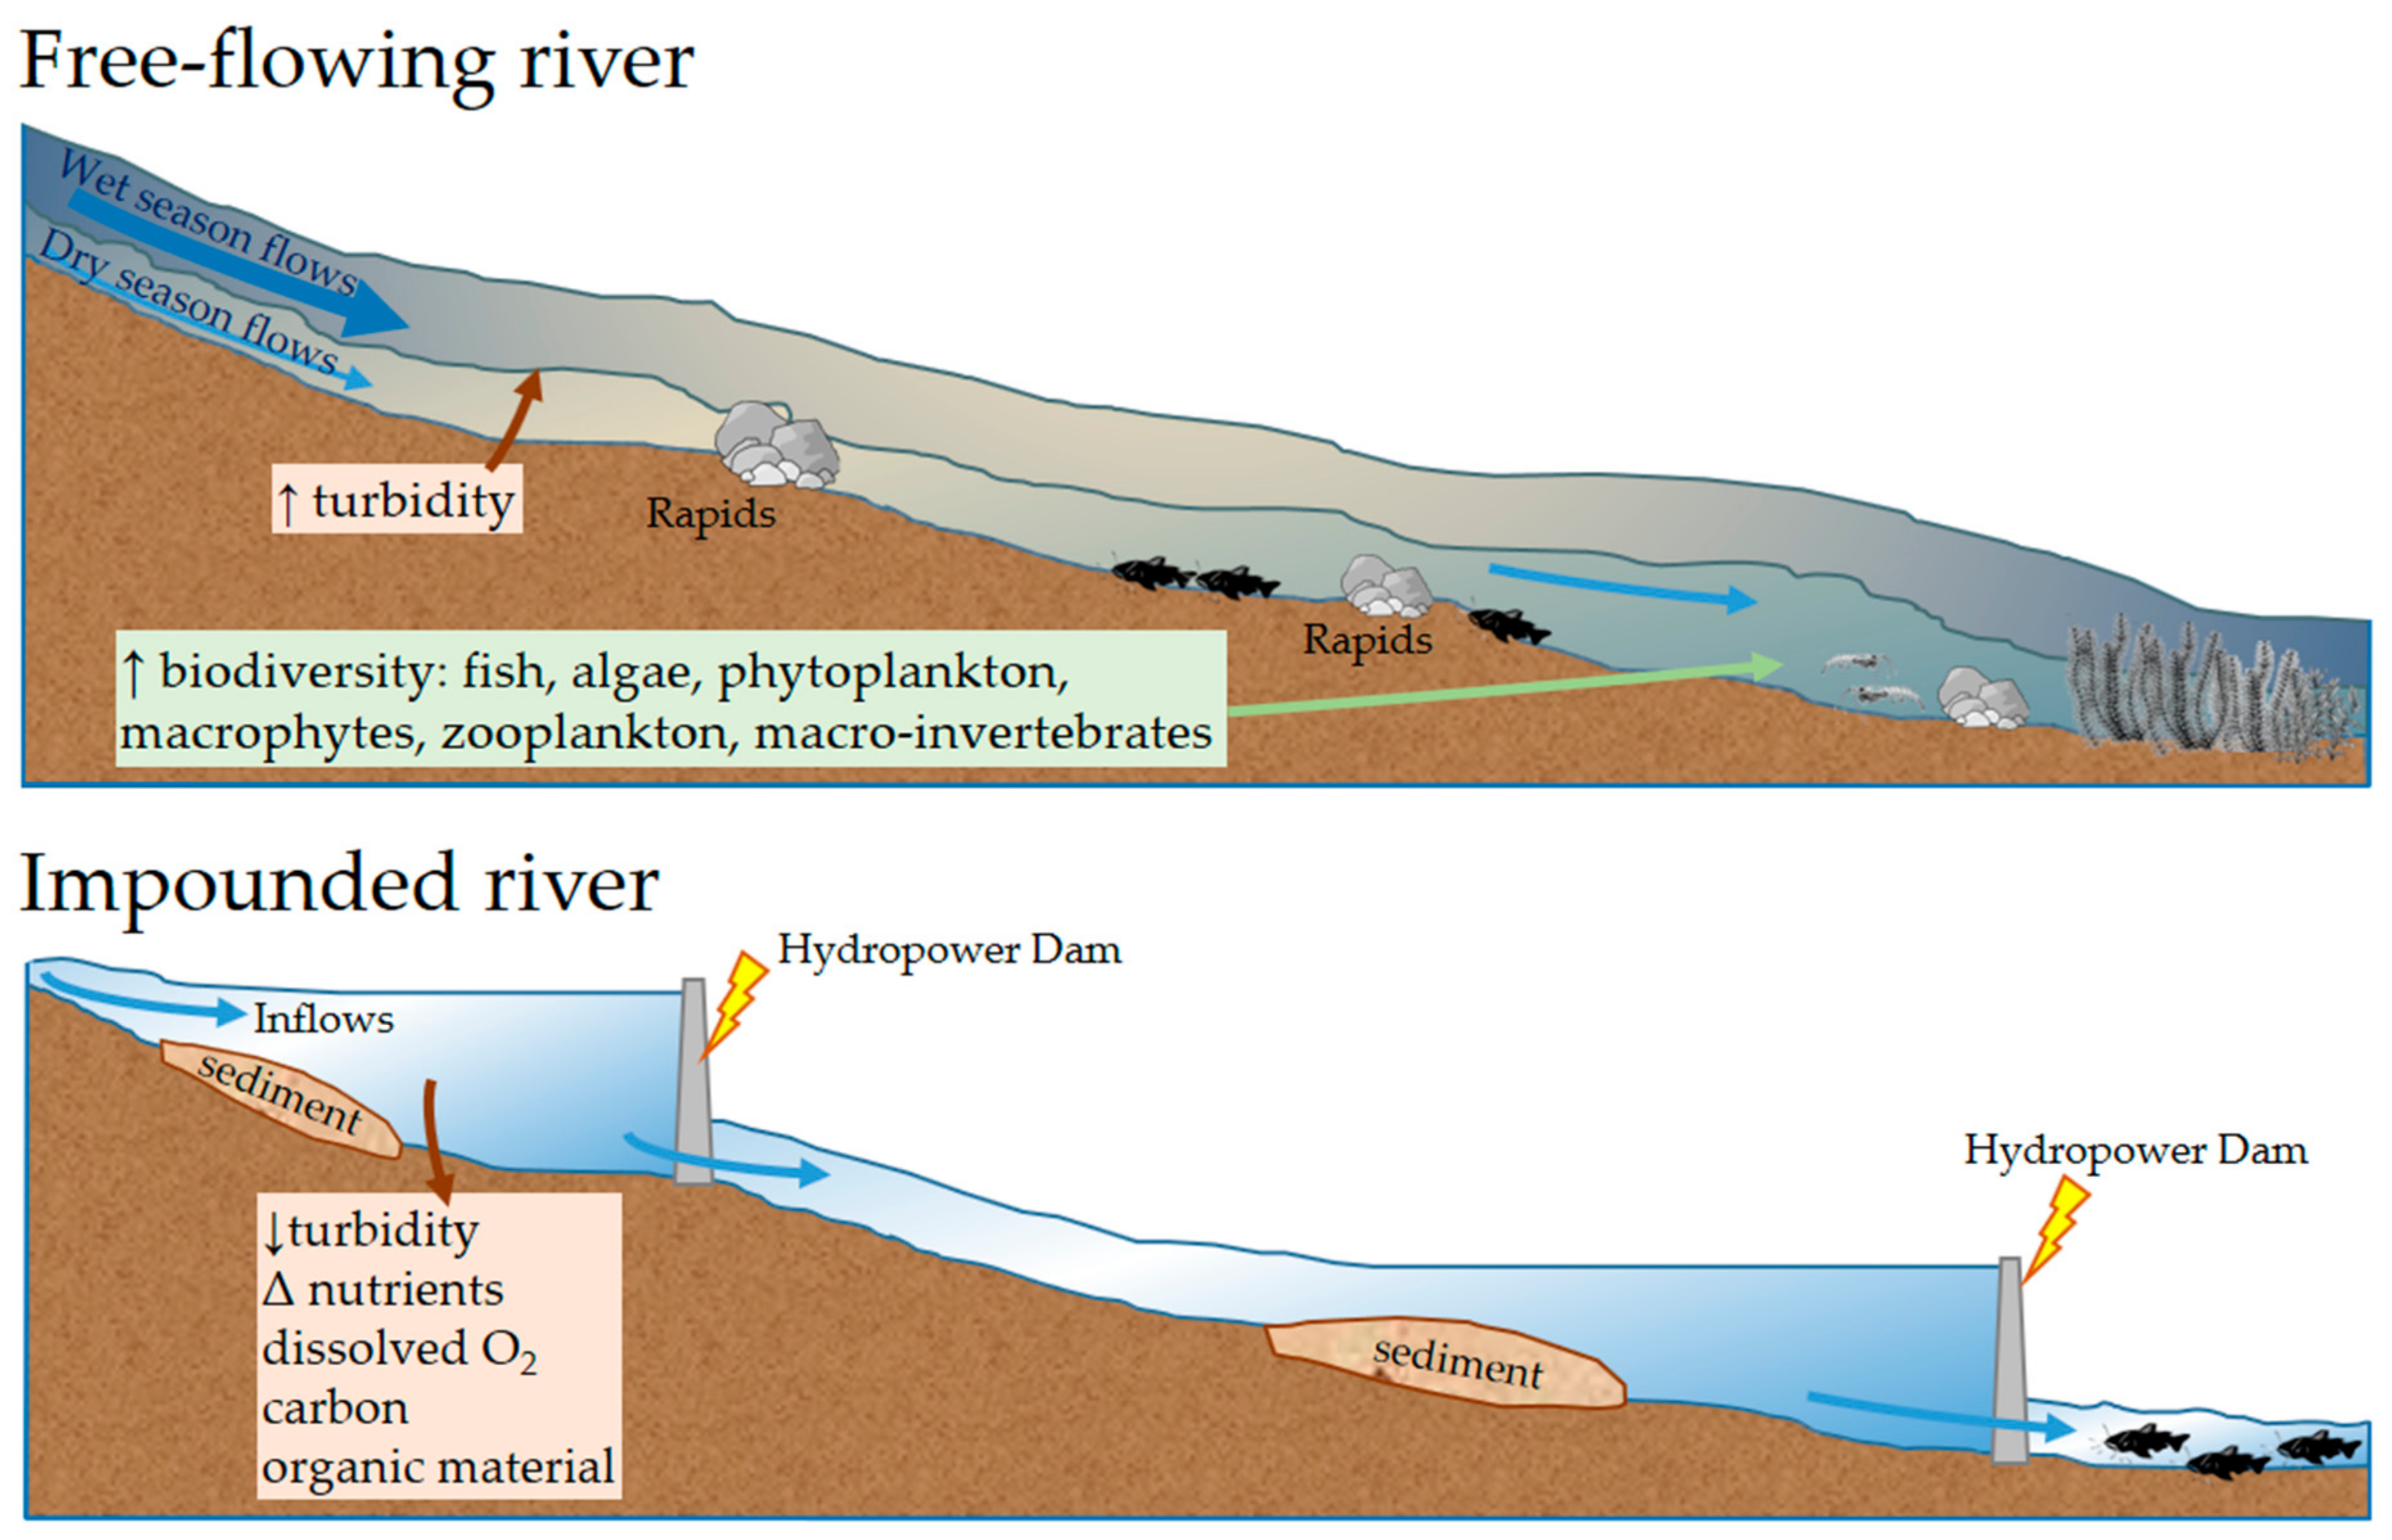
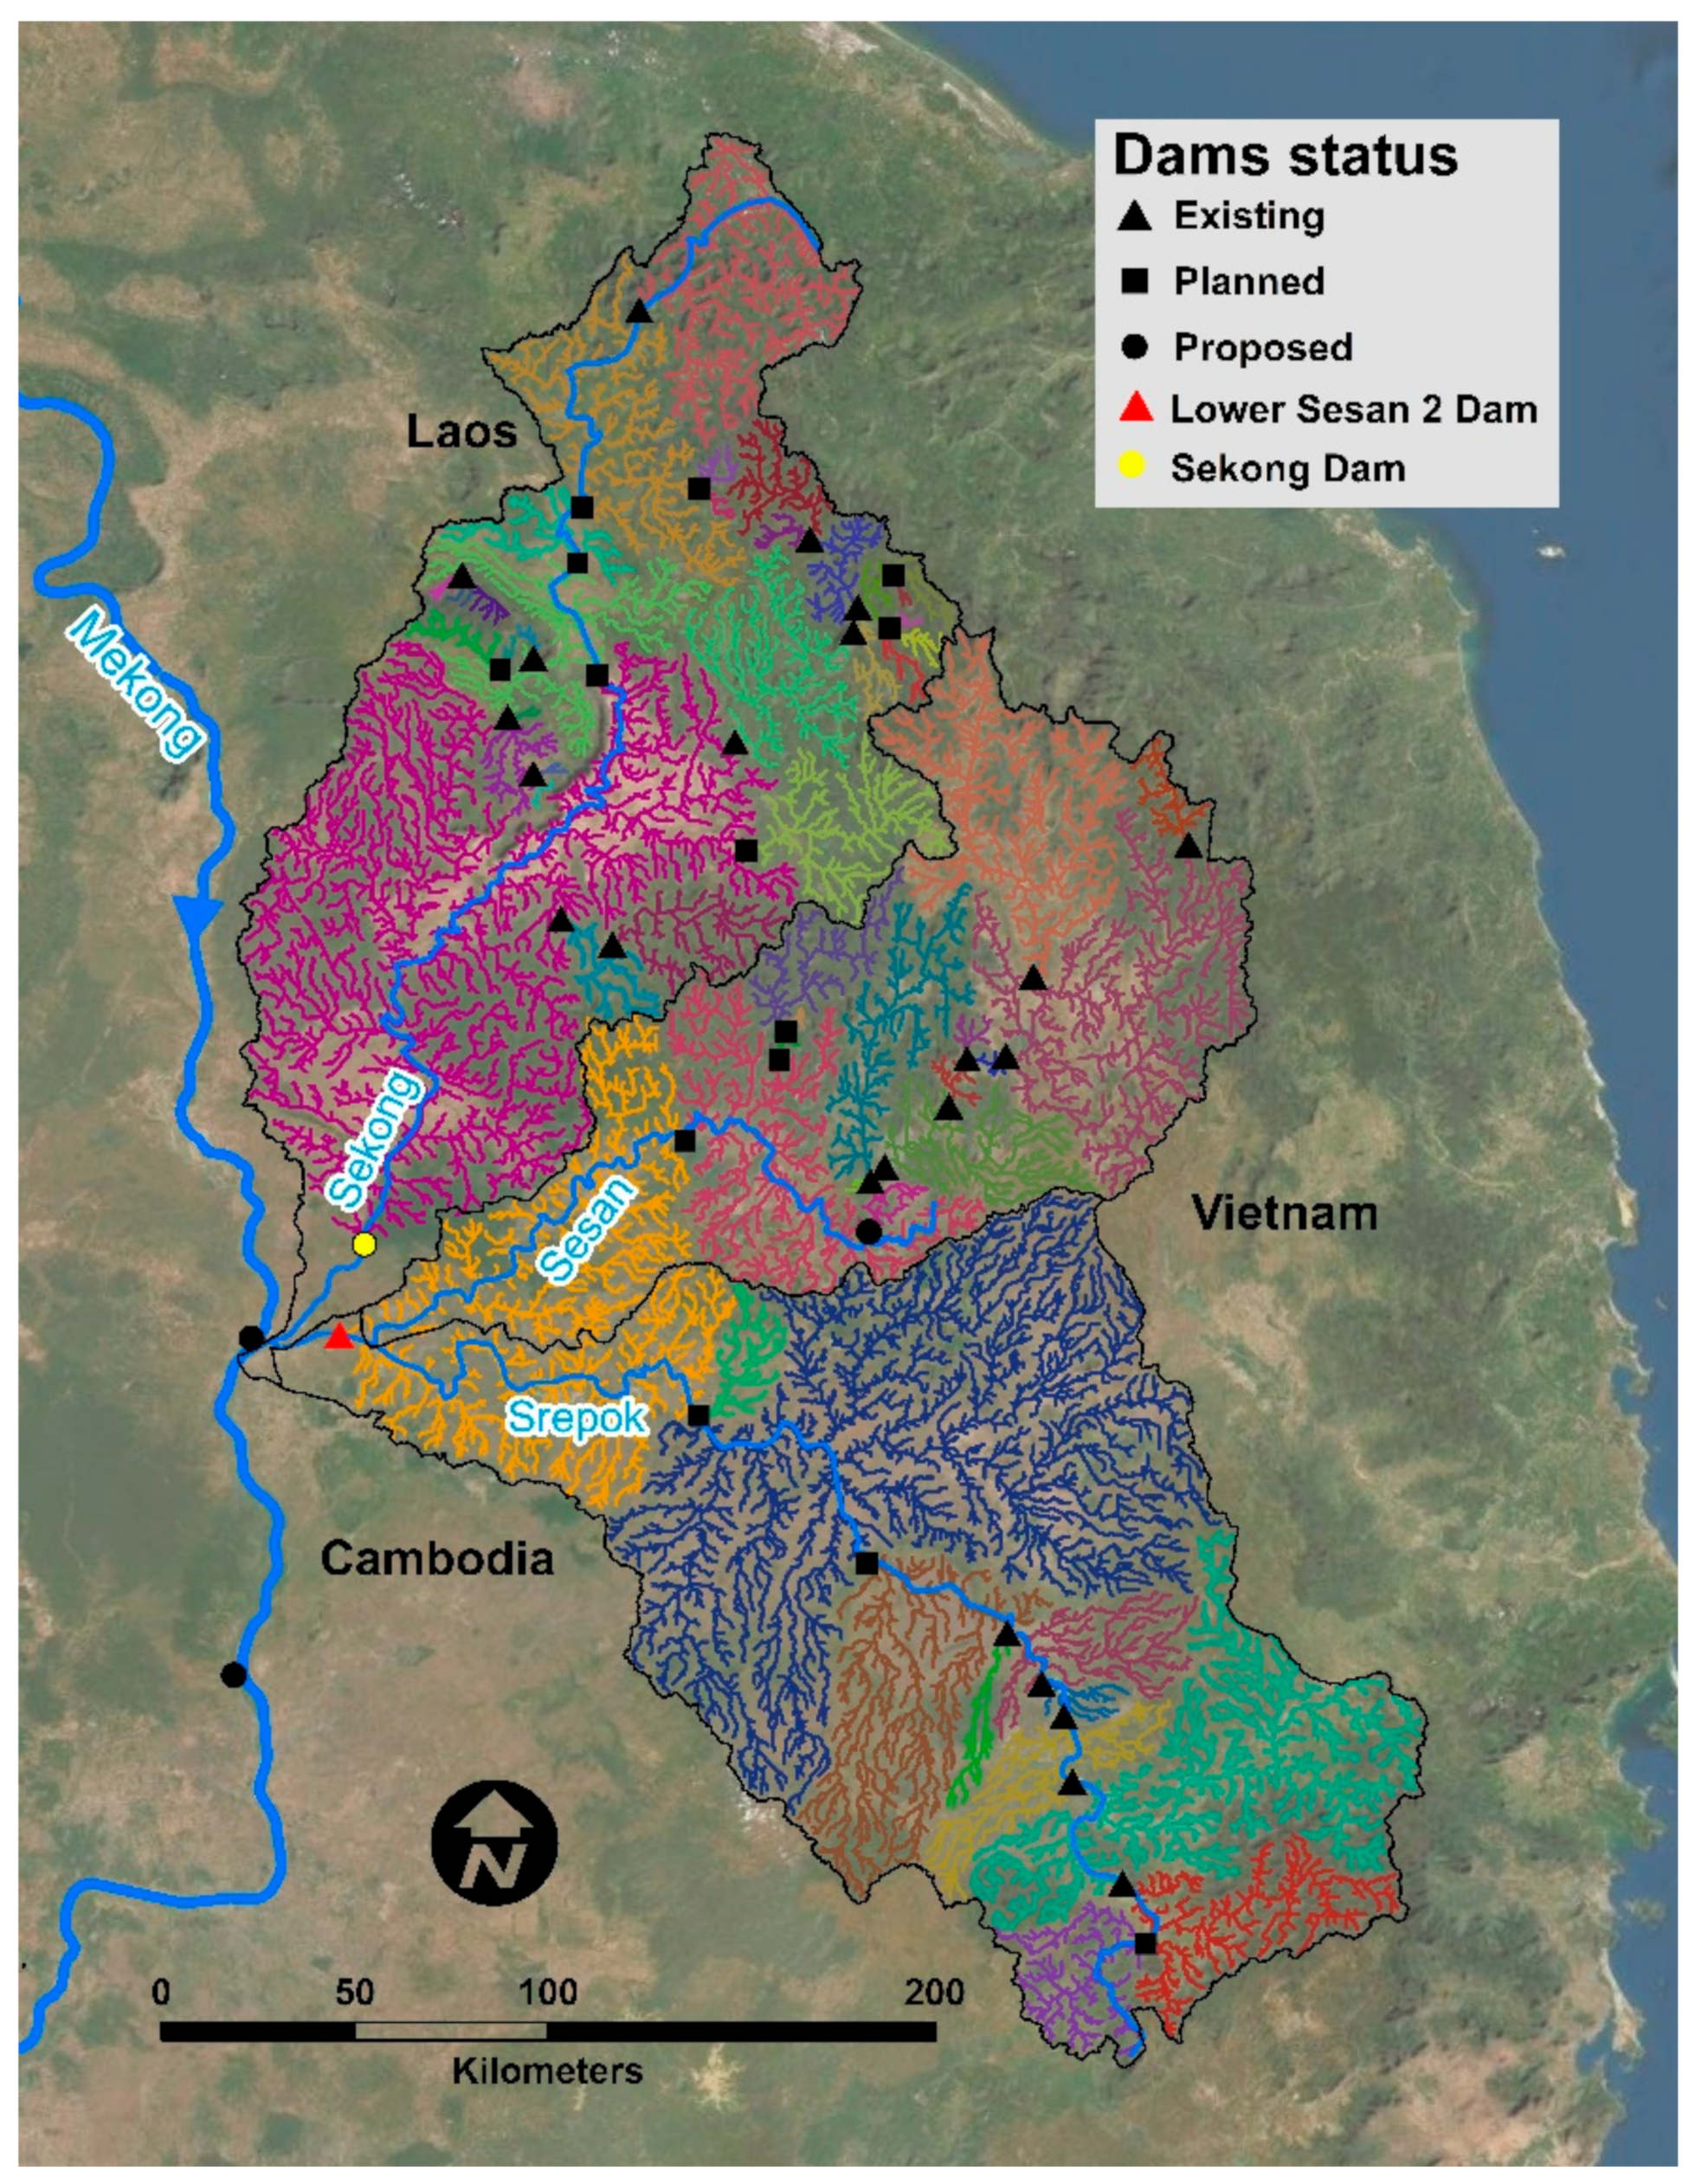
2.1. Study Area Background
2.2. Literature Search
2.3. Data Analysis
2.3.1. Dam Building and Publication Patterns
2.3.2. Human and Environmental Objectives in Tradeoff Analyses
2.3.3. Tradeoff Meta-Analysis
2.3.4. 3S Habitat Fragmentation
3. Results
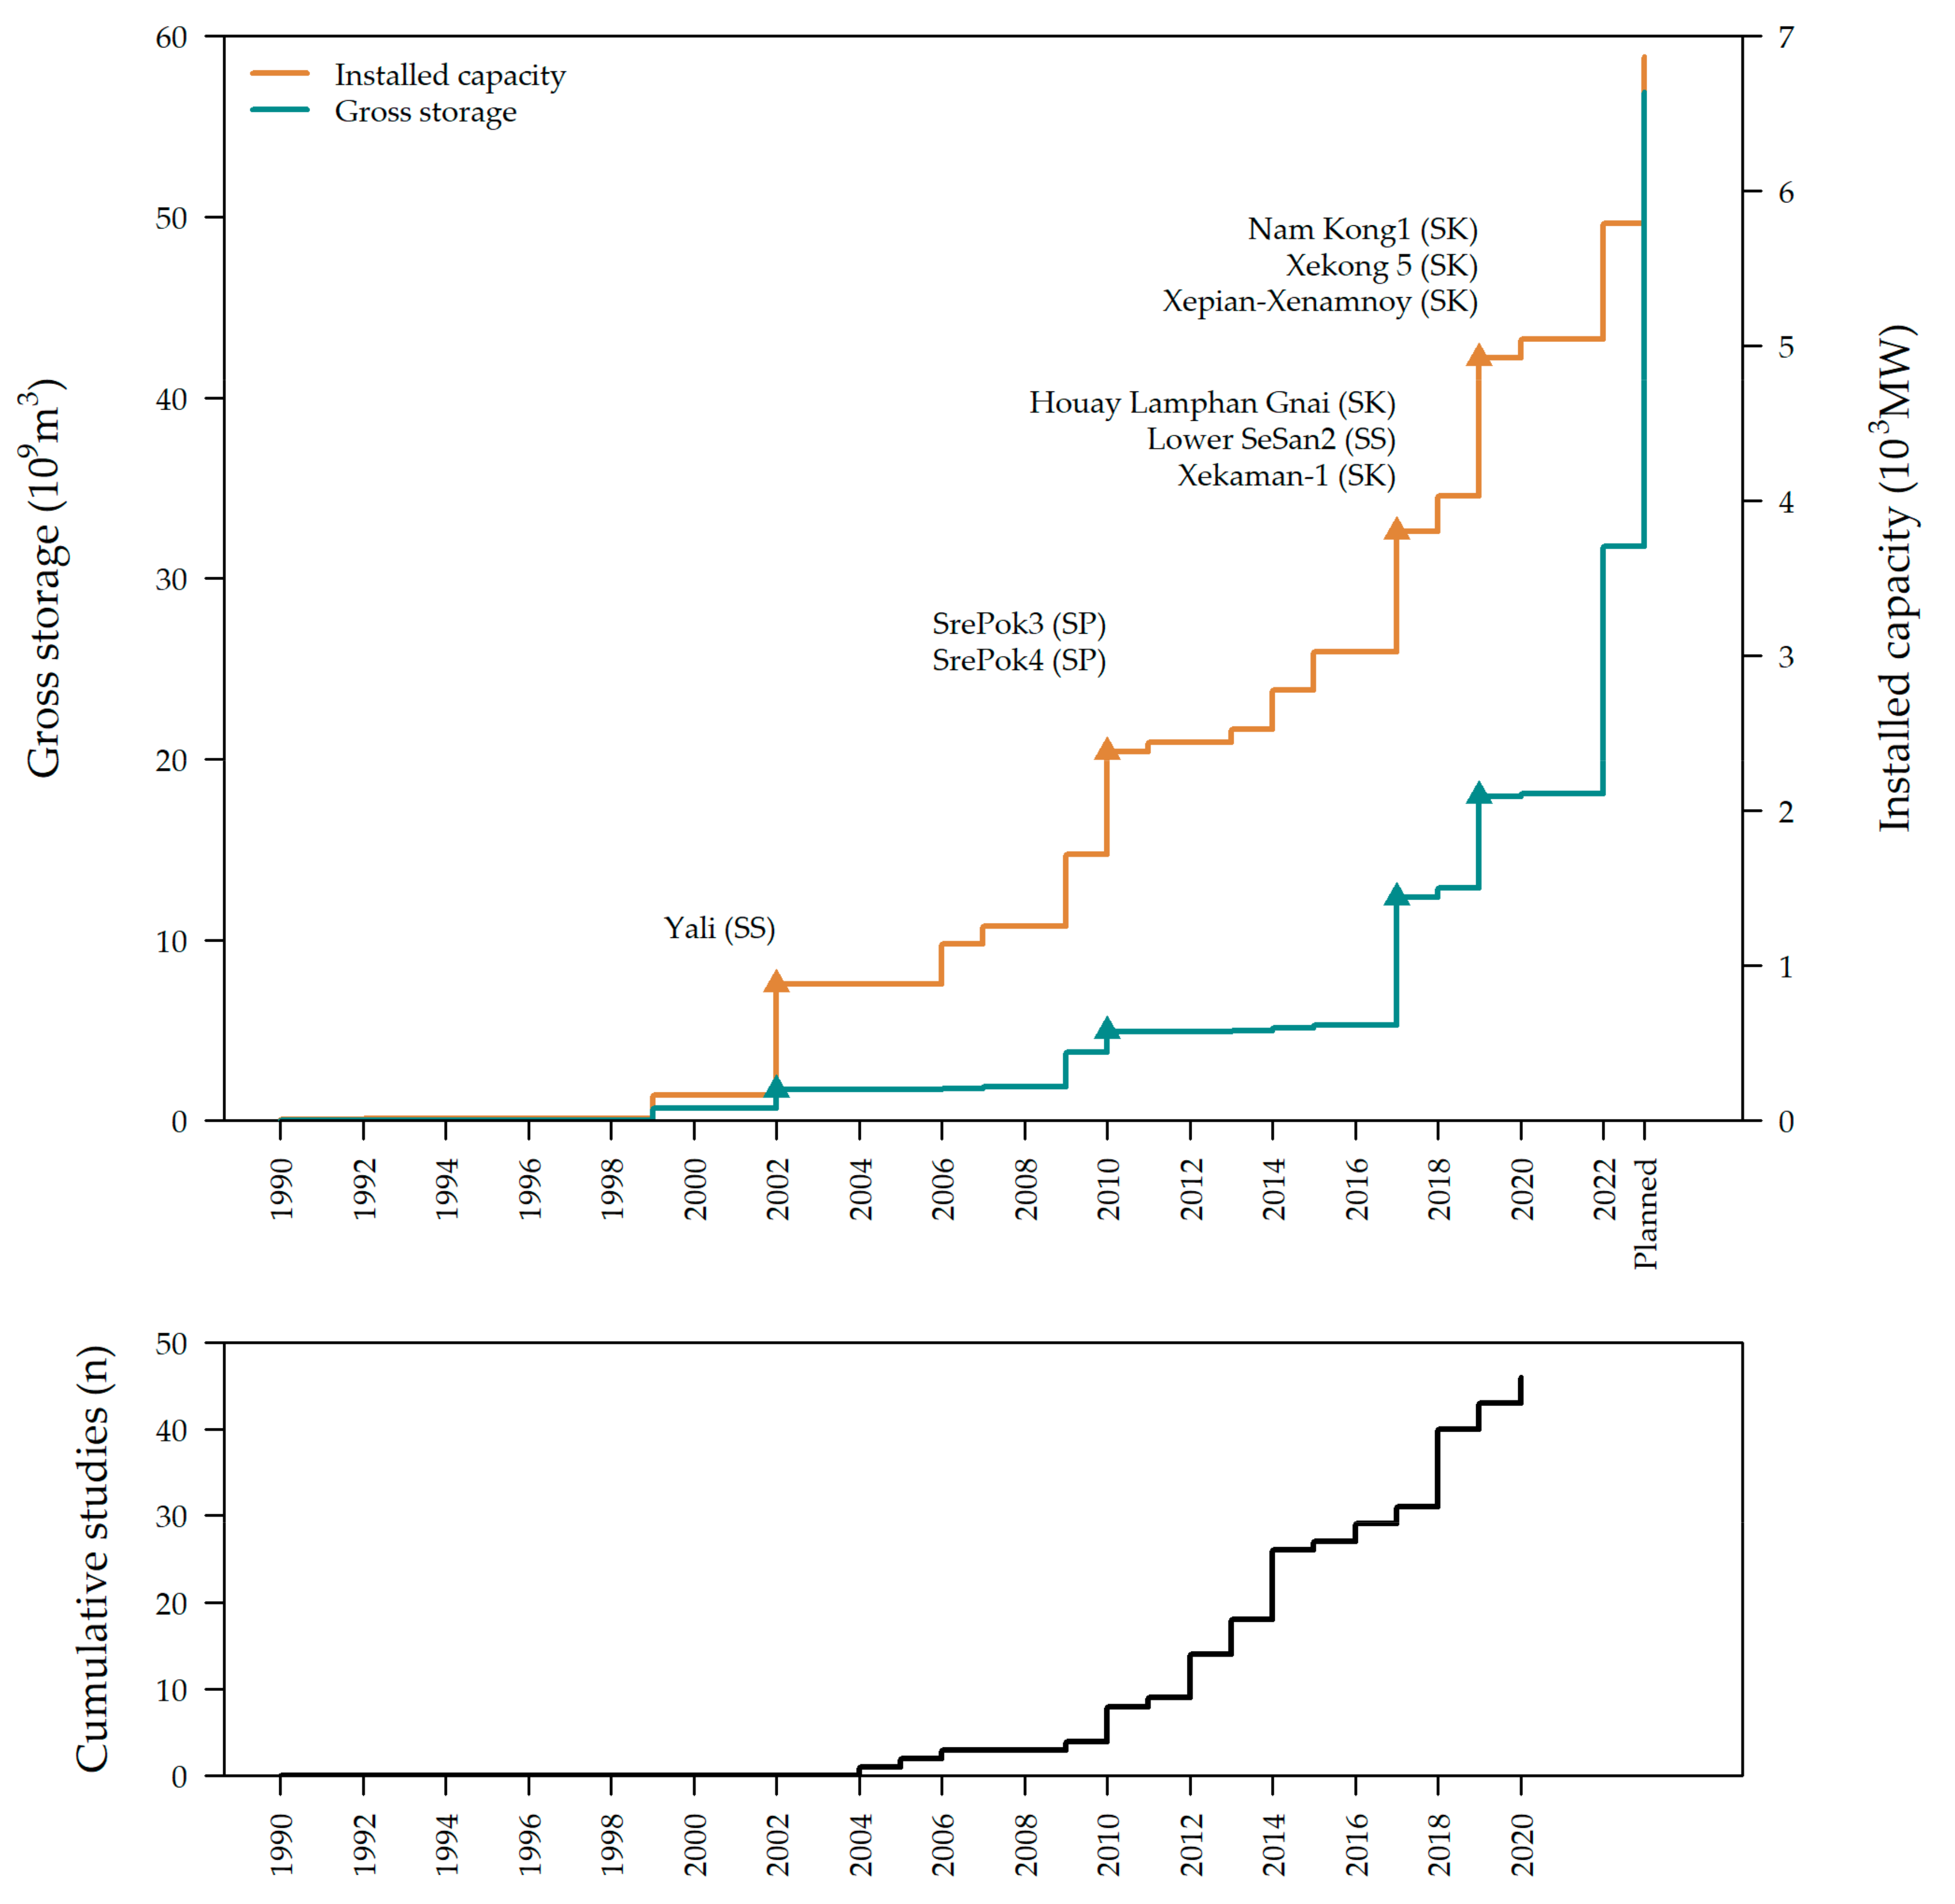
3.1. Dam Building and Publication Patterns
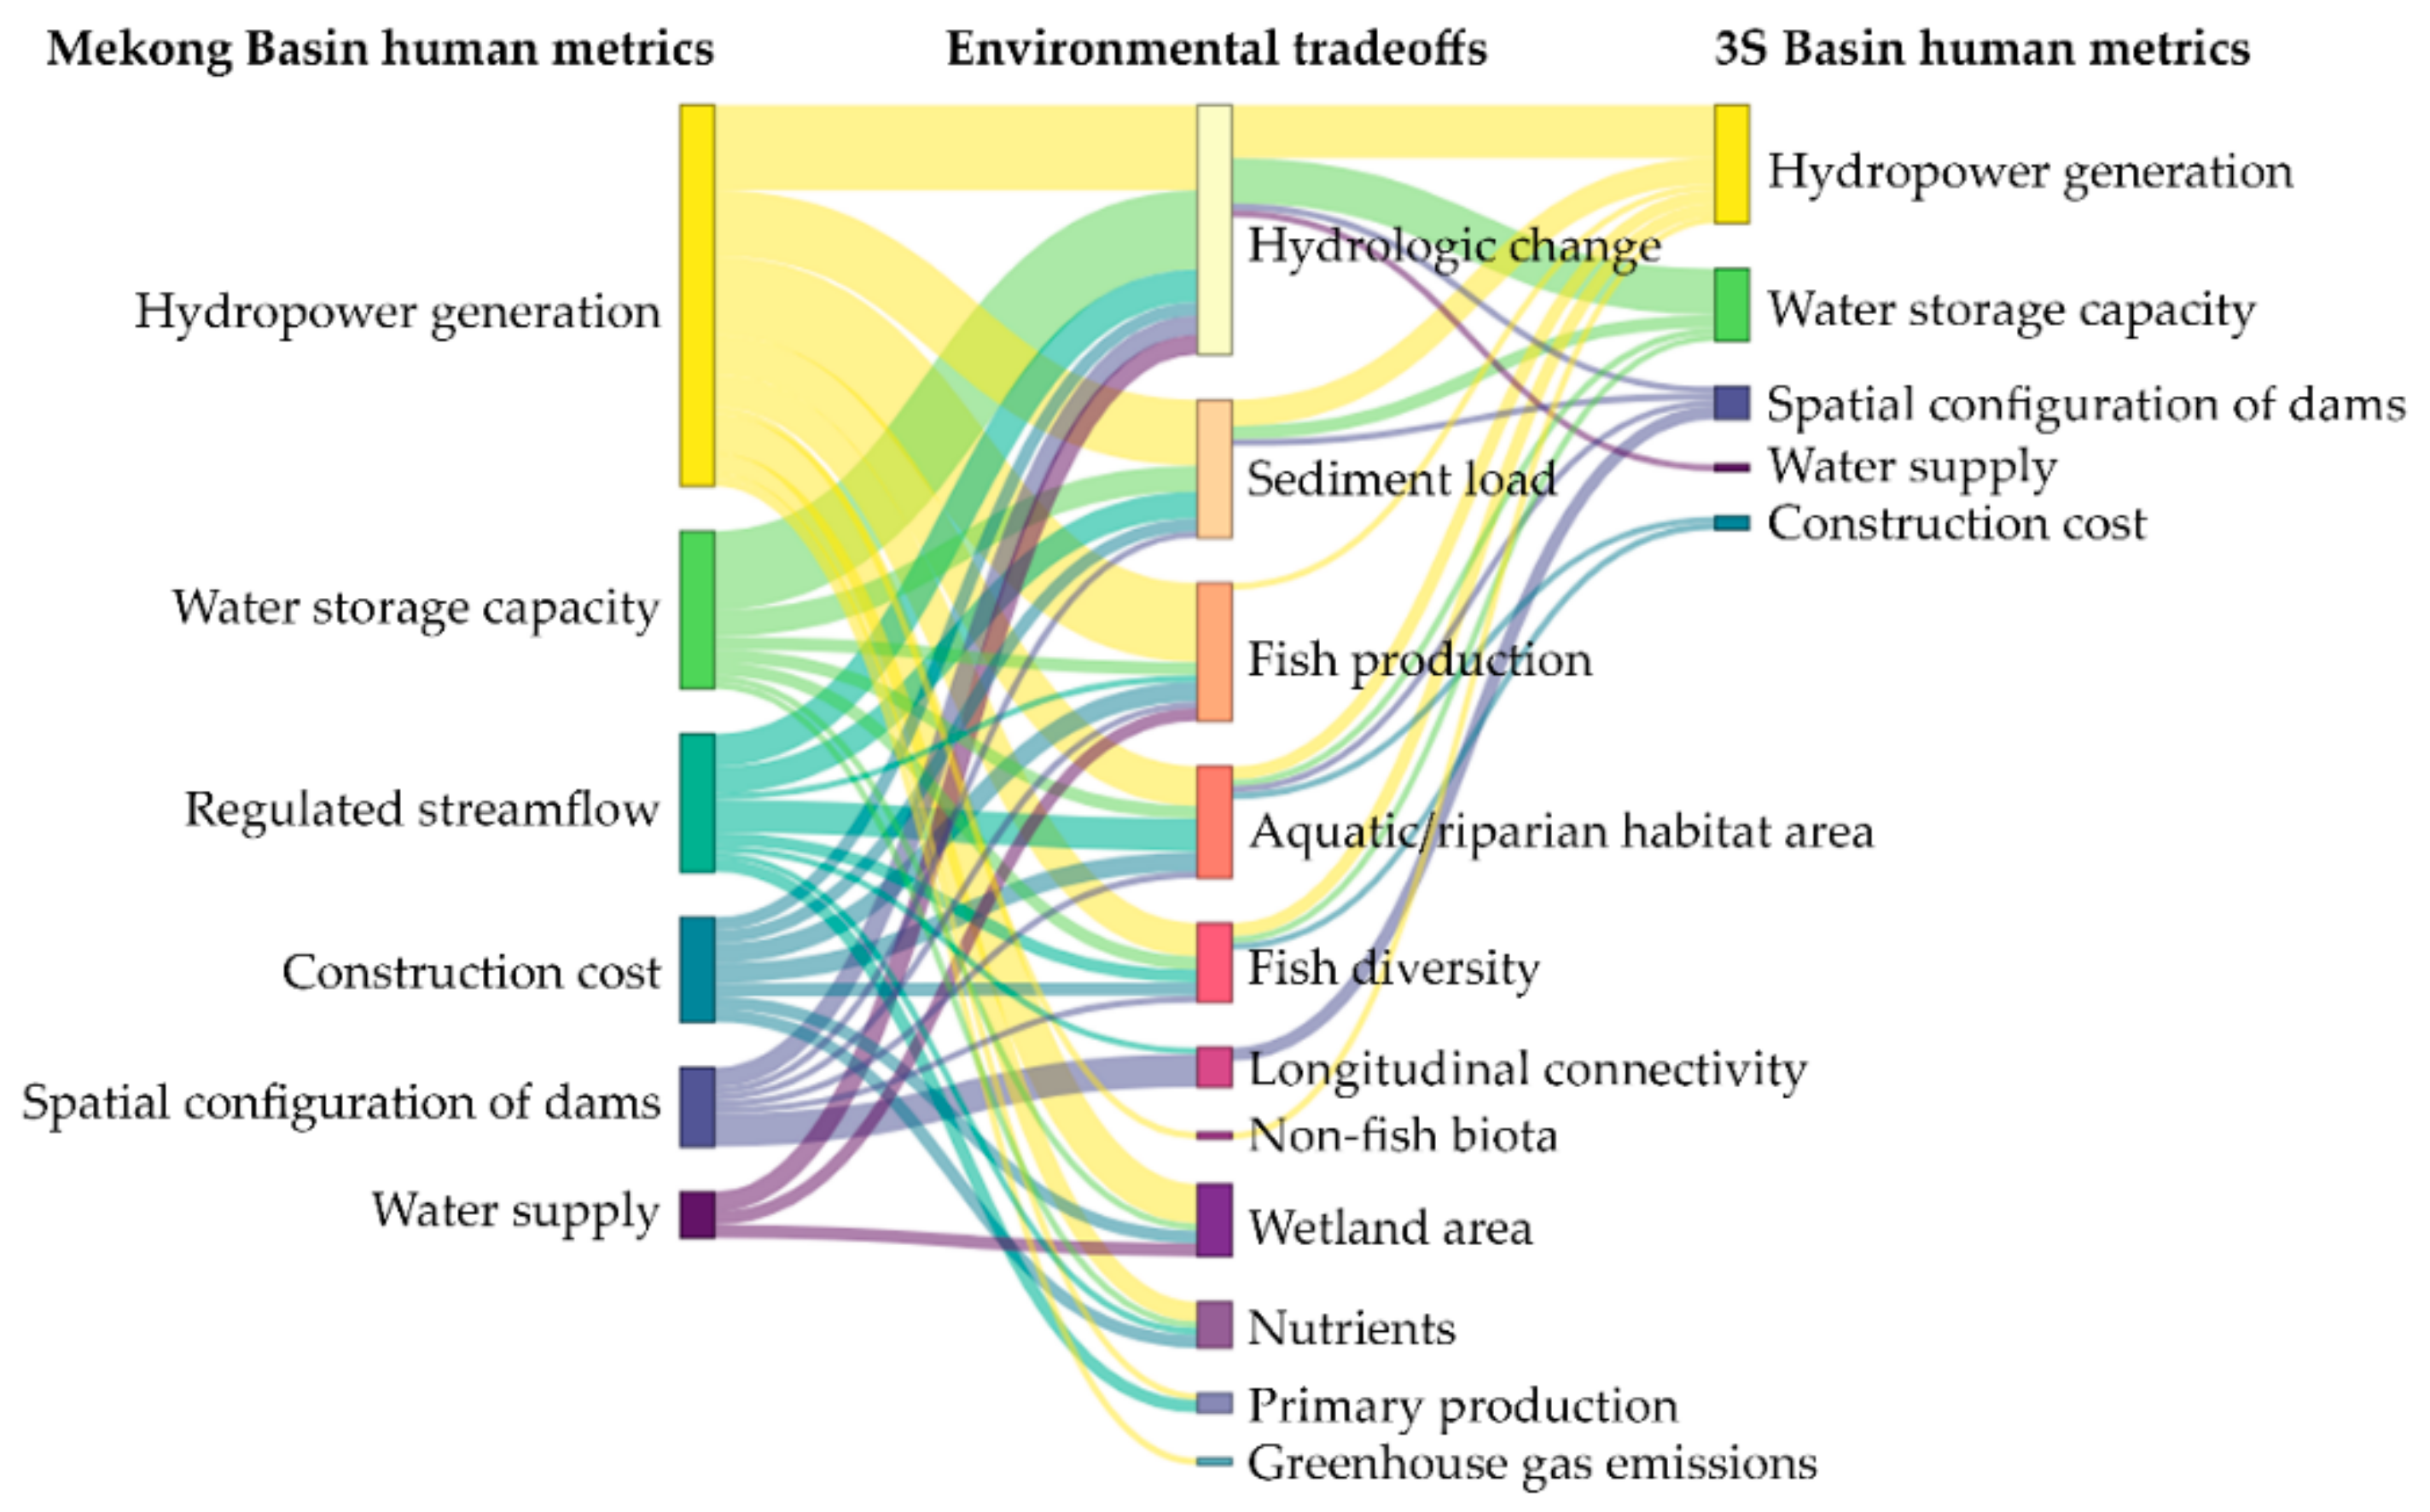
3.2. Human and Environmental Objectives in Tradeoff Analyses
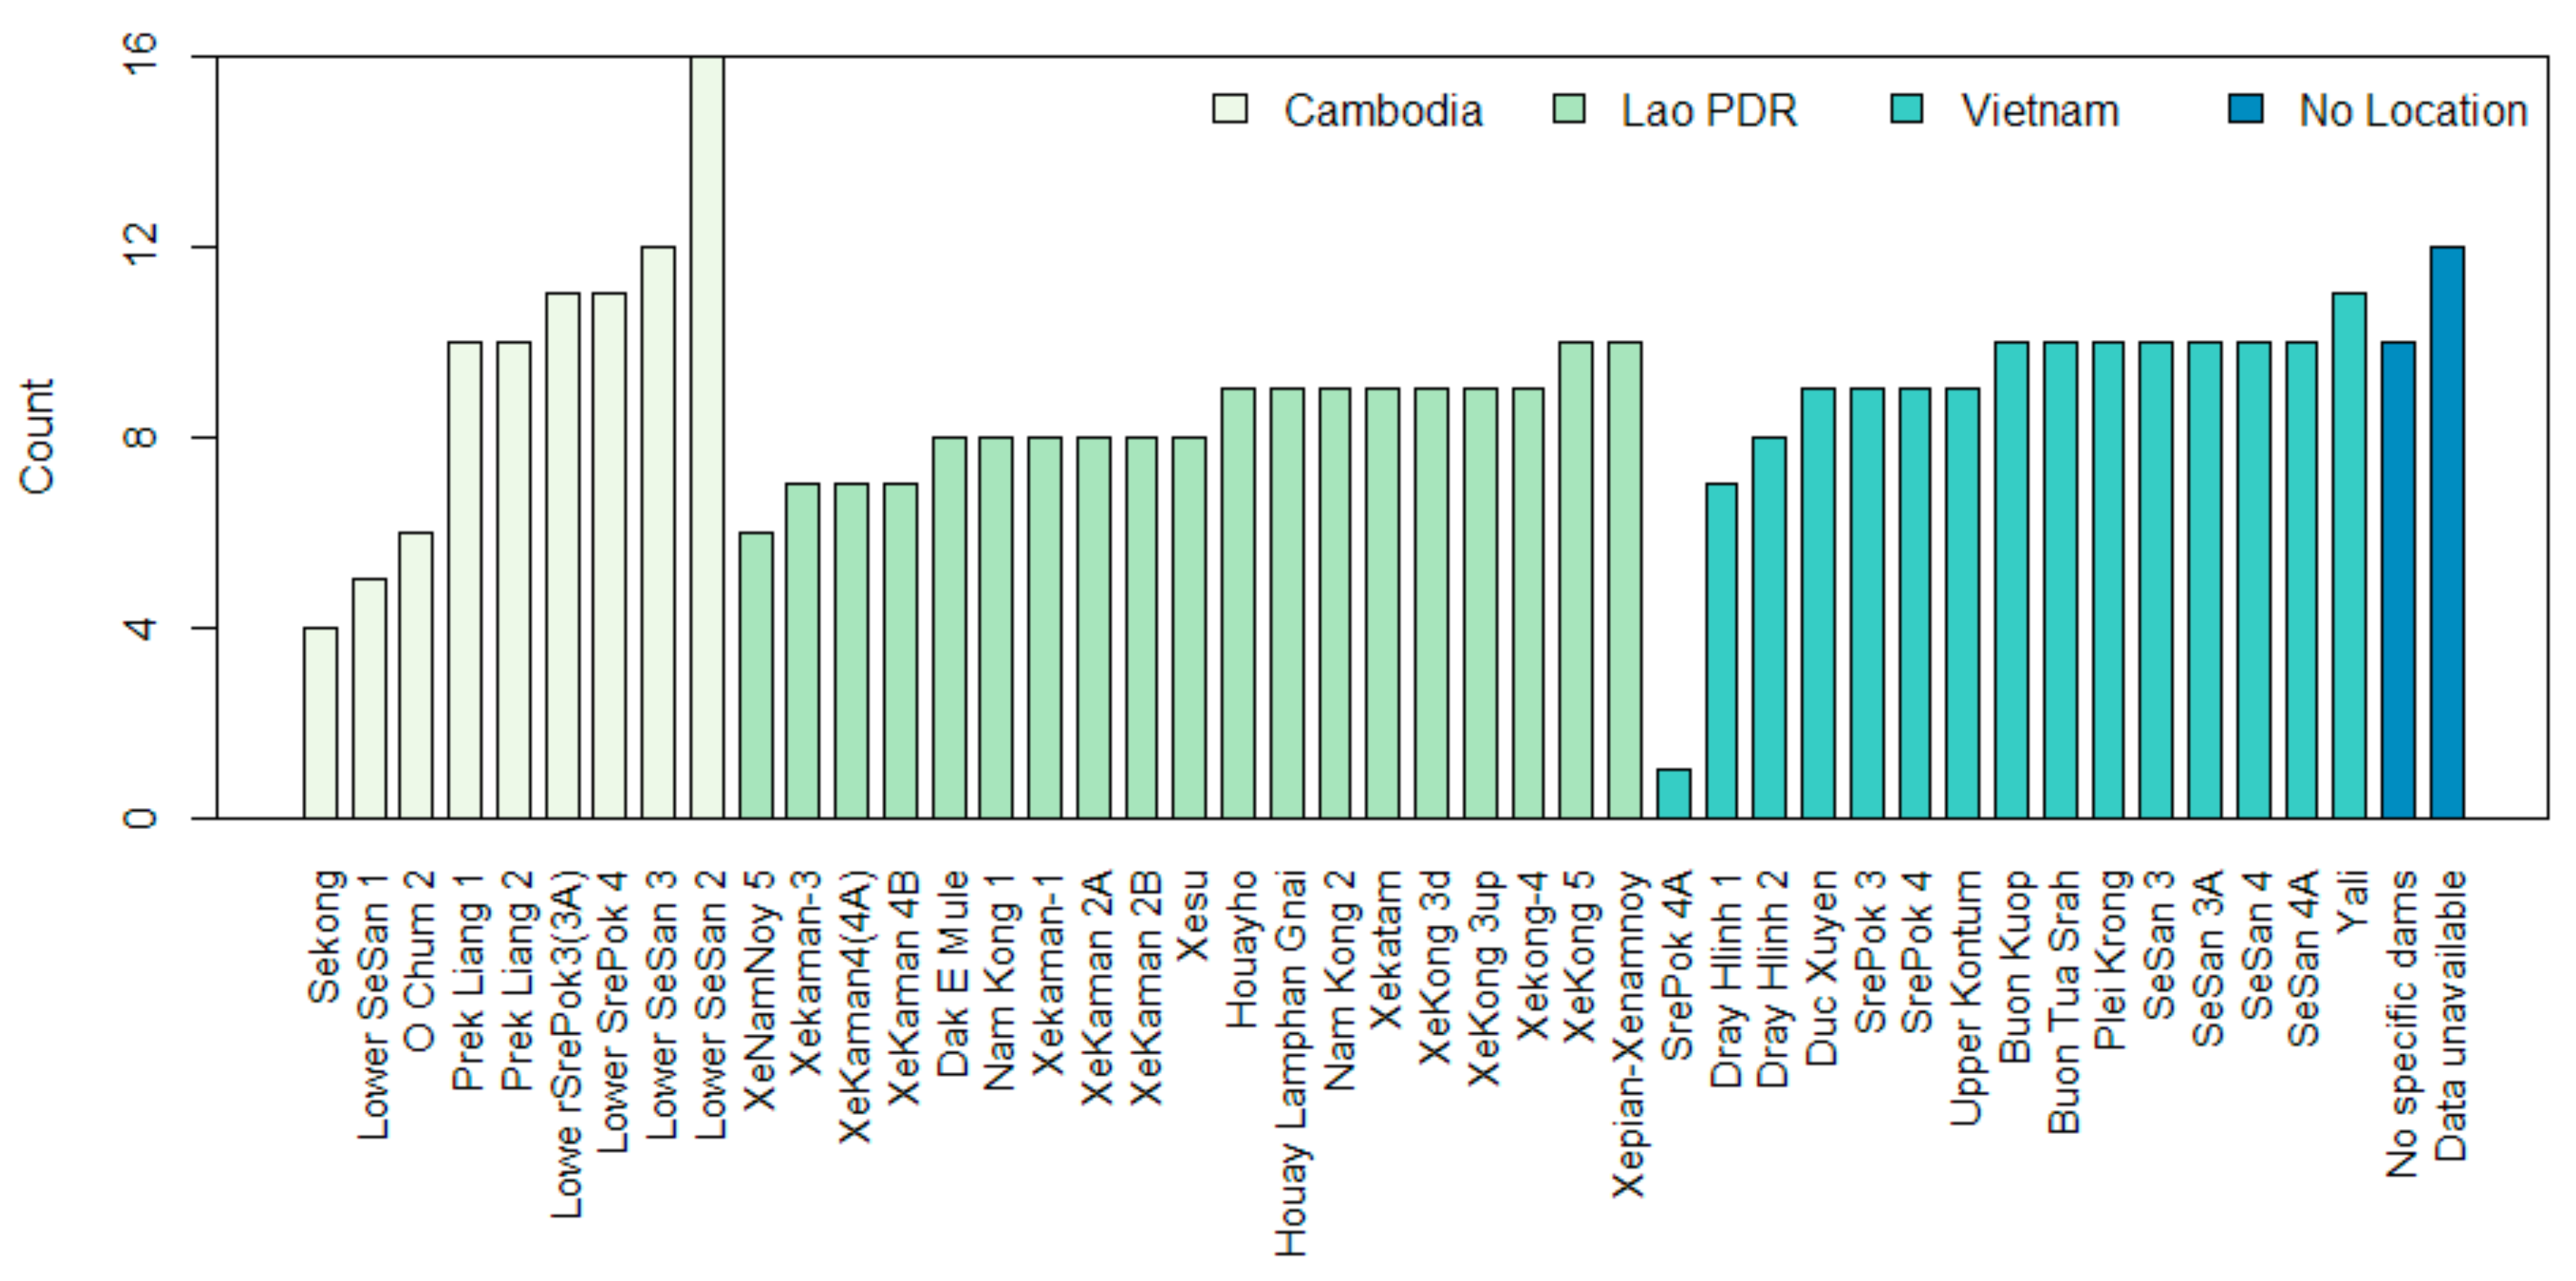
3.3. Decision Variables in Tradeoff Analyses
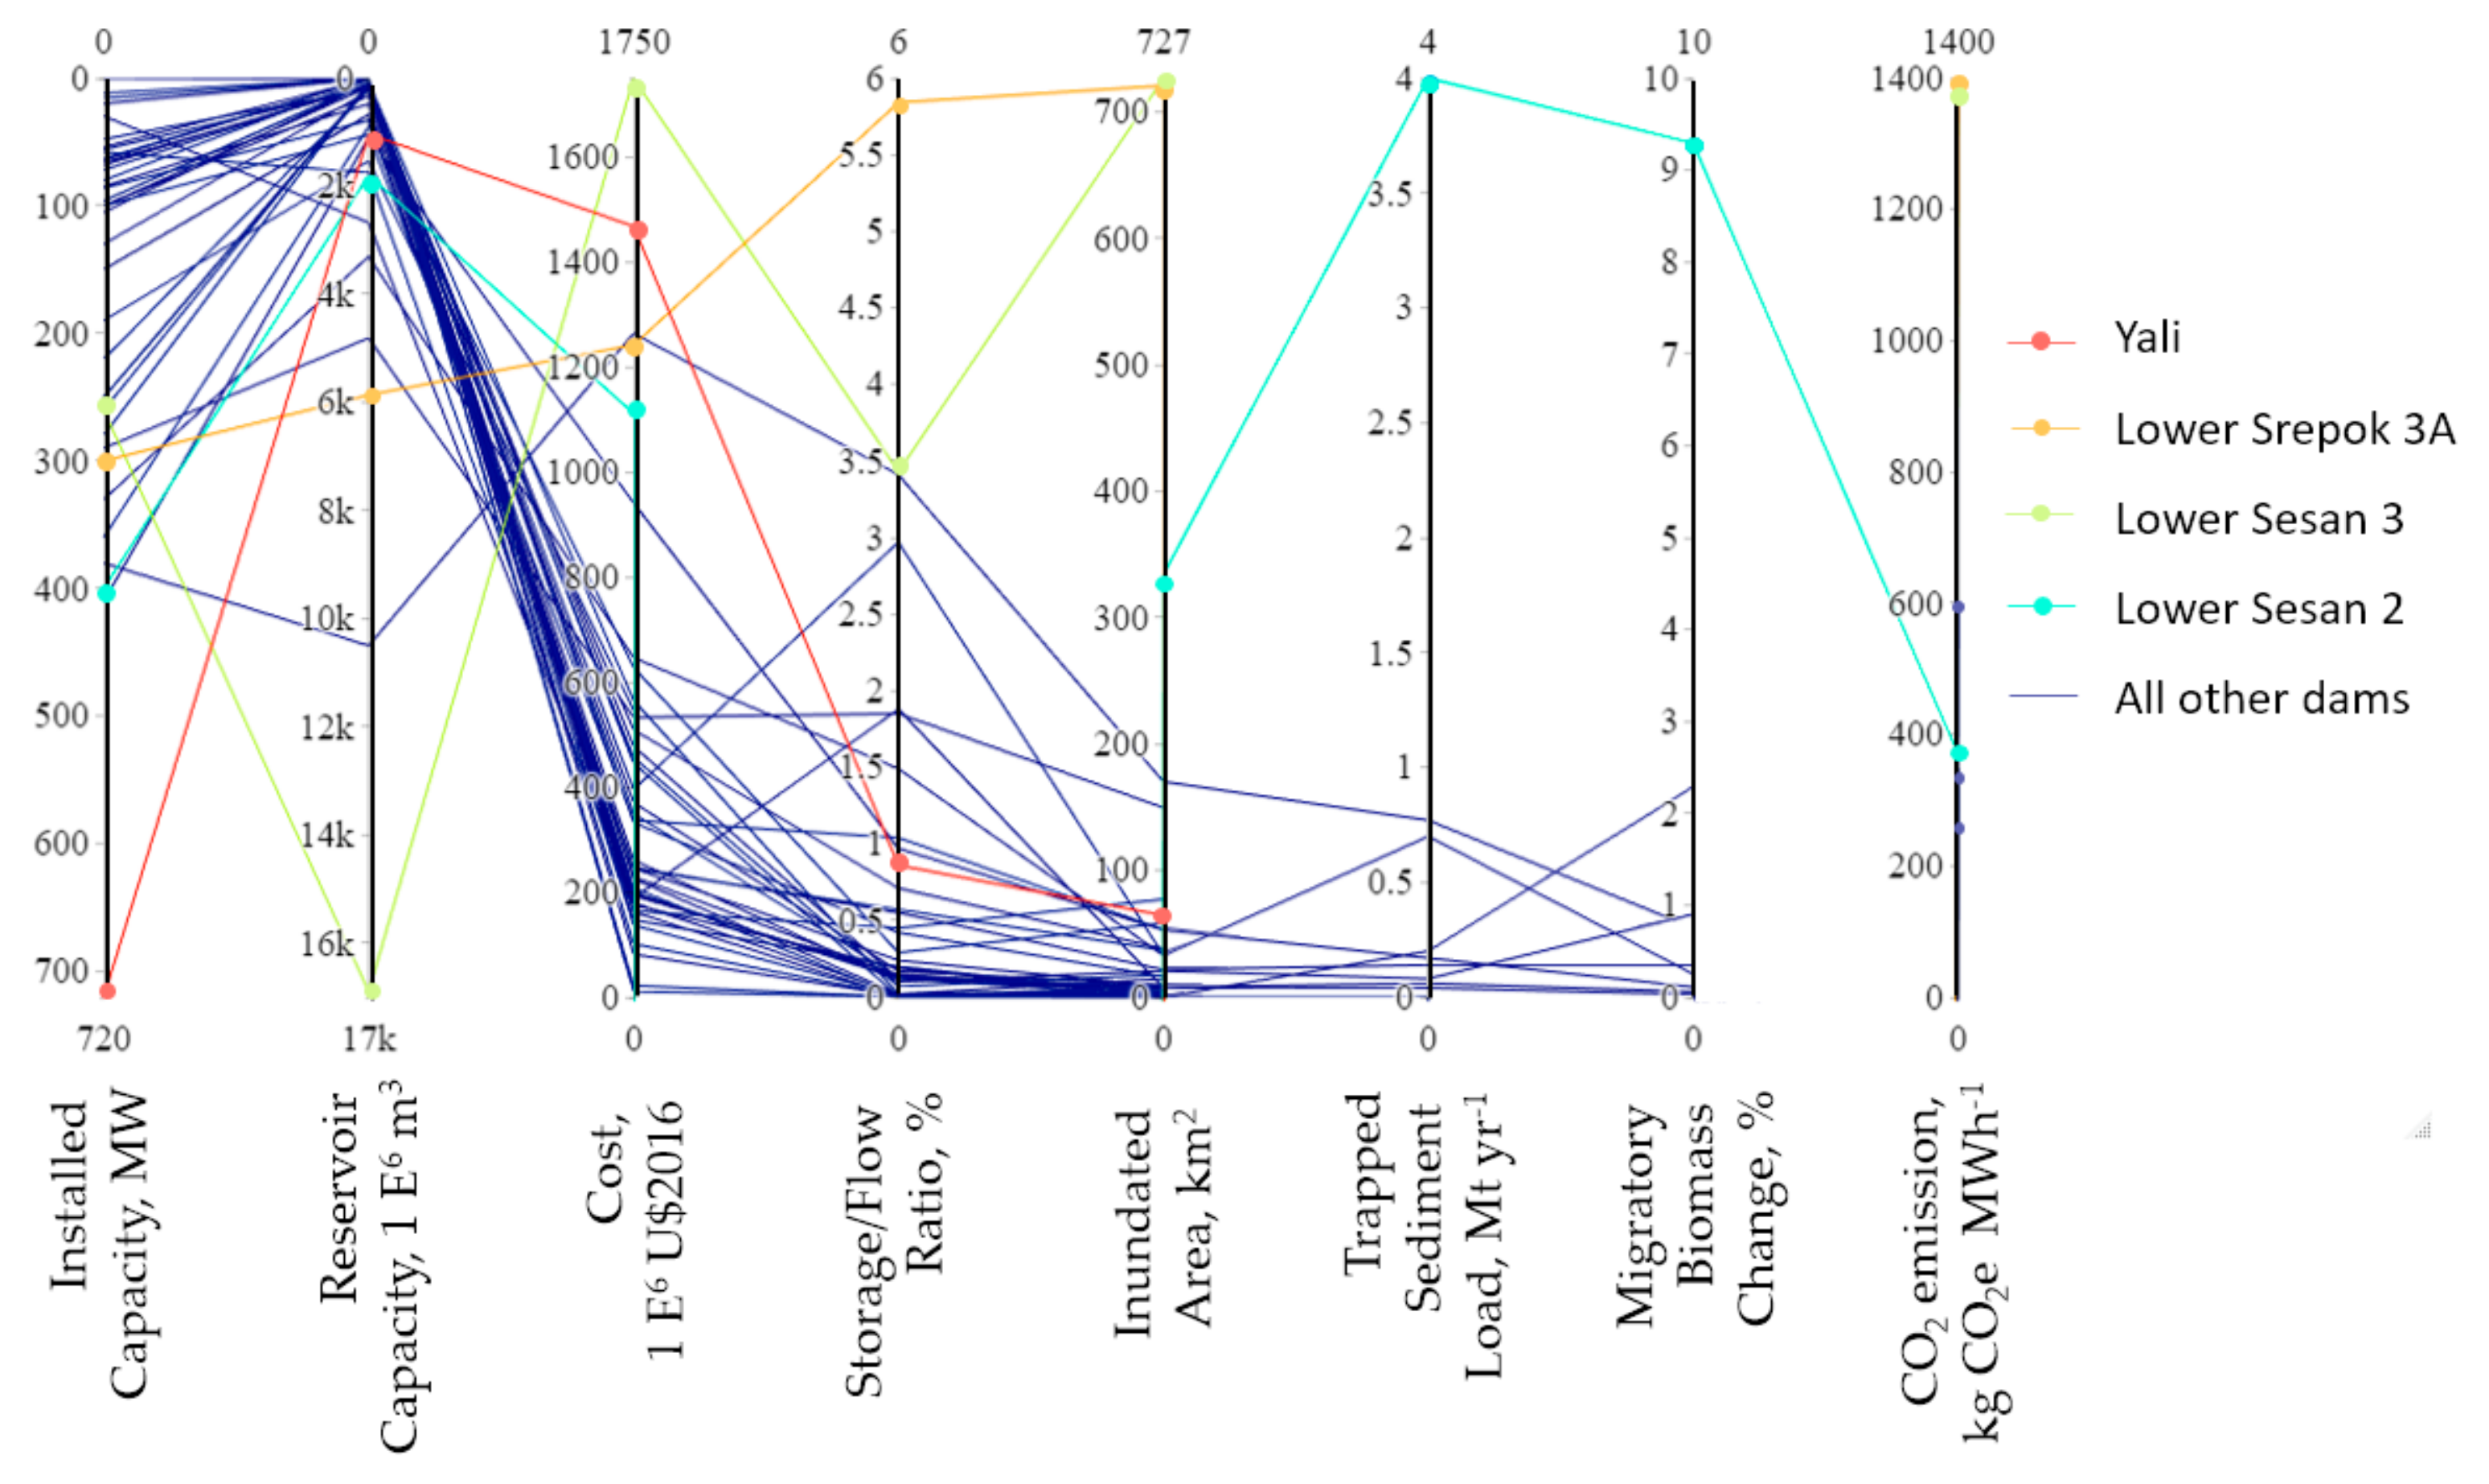
3.4. Tradeoff Meta-Analysis
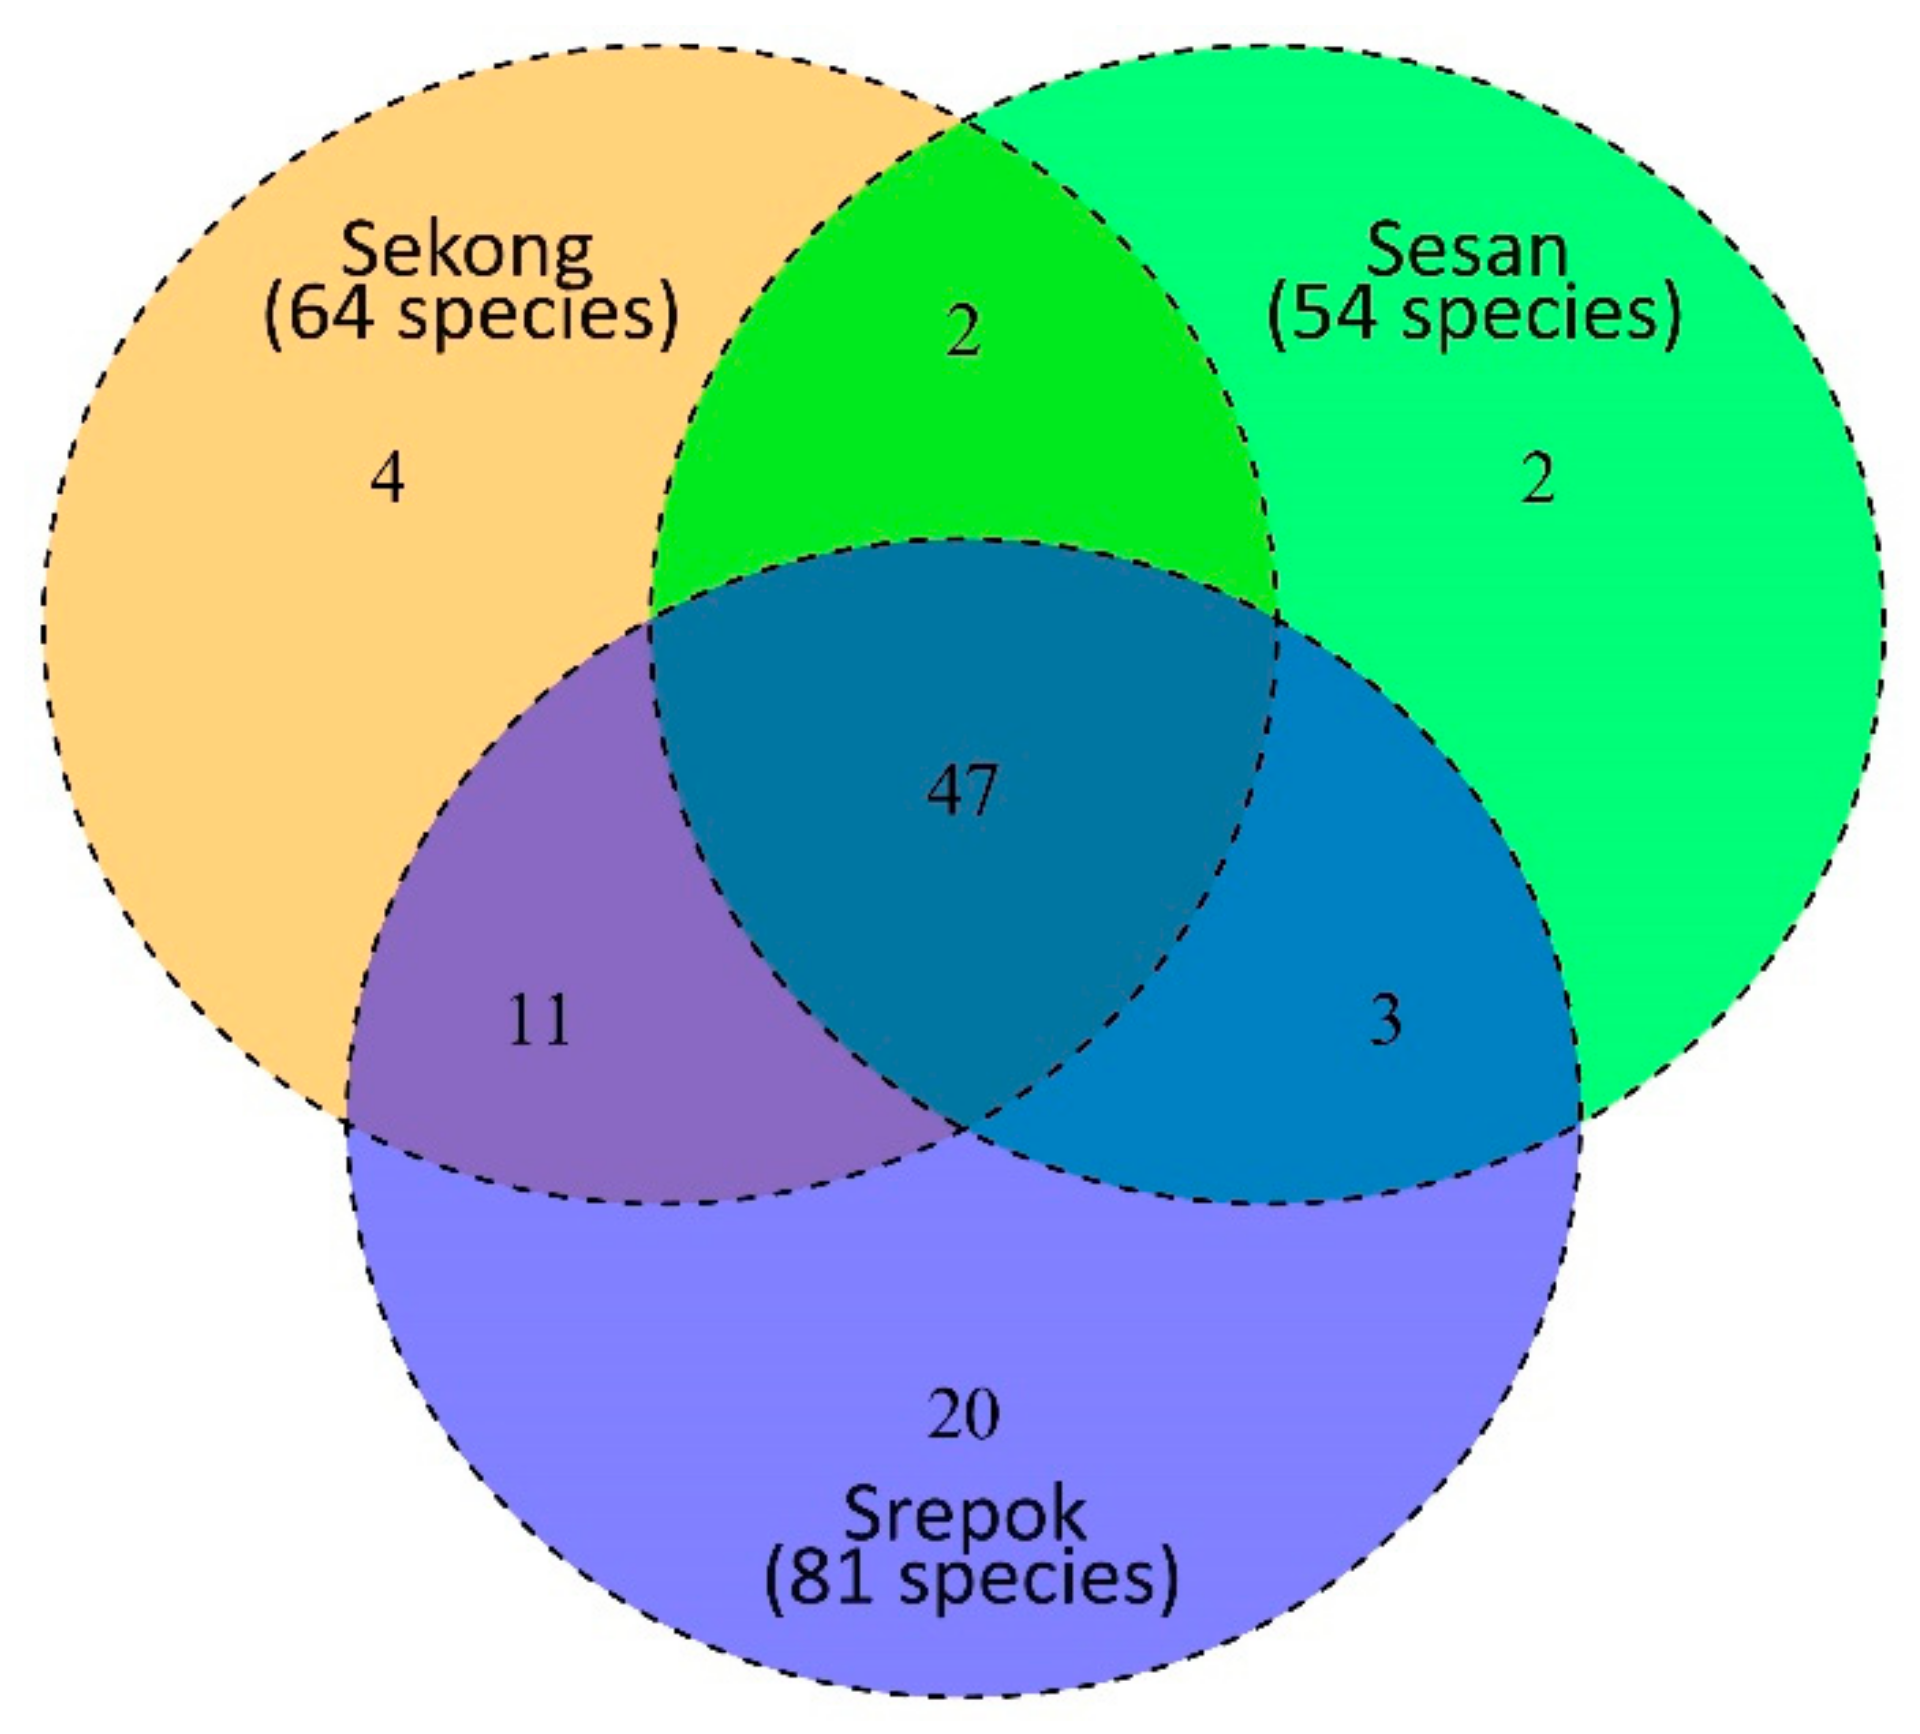
3.5. 3S Habitat Fragmentation
4. Discussion
4.1. Redundancy of Hydrologic Modeling and Future Recommendations
4.2. History and Future of Tradeoff Analyses in Dam Planning and Operations
Supplementary Materials
Author Contributions
Funding
Institutional Review Board Statement
Informed Consent Statement
Data Availability Statement
Acknowledgments
Conflicts of Interest
References
- Winemiller, K.O.; McIntyre, P.B.; Castello, L.; Fluet-Chouinard, E.; Giarrizzo, T.; Nam, S.; Baird, I.G.; Darwall, W.; Lujan, N.K.; Harrison, I.; et al. Balancing hydropower and biodiversity in the Amazon, Congo, and Mekong. Science 2016, 351, 128–129. [Google Scholar] [PubMed]
- Schmitt, R.J.P.; Bizzi, S.; Castelletti, A.; Kondolf, G.M. Improved trade-offs of hydropower and sand connectivity by strategic dam planning in the Mekong. Nat. Sustain. 2018, 1, 96–104. [Google Scholar]
- Ziv, G.; Baran, E.; Nam, S.; Rodríguez-Iturbe, I.; Levin, S.A. Trading-off fish biodiversity, food security, and hydropower in the Mekong River Basin. Proc. Natl. Acad. Sci. USA 2012, 109, 5609–5614. [Google Scholar] [PubMed]
- Mekong River Commission. State of the Basin Report 2018; Lao PDR: Vientiane, Laos, 2019. [Google Scholar]
- Poff, N.L.; Allan, J.D.; Bain, M.B.; Karr, J.R.; Prestegaard, K.L.; Richter, B.D.; Sparks, R.E.; Stromberg, J.C. The Natural Flow Regime. Bioscience 1997, 47, 769–784. [Google Scholar]
- Null, S.E.; Olivares, M.A.; Cordera, F.; Lund, J.R. Pareto Optimality and Compromise for Environmental Water Management; American Geophysical Union: Washington, DC, USA, 2020; Available online: https://search.proquest.com/docview/2451147242?pq-origsite=gscholar&fromopenview=true (accessed on 14 October 2020).
- Schmitt, R.J.P.; Bizzi, S.; Castelletti, A.; Opperman, J.J.; Kondolf, G.M. Planning dam portfolios for low sediment trapping shows limits for sustainable hydropower in the Mekong. Sci. Adv. 2019, 5, eaaw2175. [Google Scholar]
- ICEM. MRC Strategic Environmental Assessment (SEA) of hydropower on the Mekong mainstream. Hanoi Viet Nam, ICEM, Aust. 2010. Available online: http://www.mrcmekong.org/assets/Publications/Consultations/SEA-Hydropower/SEA-Main-Final-Report.pdf (accessed on 10 December 2020).
- Hydropower Thematic Team and Multi-consult. Thematic Report on the Positive and Negative Impacts of Hydropower Development on the Social, Environmental, and Economic Conditions of the Lower Mekong River Basin. Prepared by Hydropower Thematic Team and Multi-consult. 2017. Available online: http://www.mrcmekong.org/assets/Publications/Council-Study/Council-study-Reports-Thematic/Impacts-of-Hydropower-Development-29-December-2017.pdf (accessed on 10 December 2020).
- Ngor, P.B.; Legendre, P.; Oberdorff, T.; Lek, S. Flow alterations by dams shaped fish assemblage dynamics in the complex Mekong-3S river system. Ecol. Indic. 2018, 88, 103–114. [Google Scholar]
- Intralawan, A.; Wood, D.; Frankel, R.; Costanza, R.; Kubiszewski, I. Tradeoff analysis between electricity generation and ecosystem services in the Lower Mekong Basin. Ecosyst. Serv. 2018, 30, 27–35. [Google Scholar]
- Wild, T.B.; Loucks, D.P. Managing flow, sediment, and hydropower regimes in the Sre Pok, Se San, and Se Kong Rivers of the Mekong basin. Water Resour. Res. 2014, 50, 5141–5157. [Google Scholar]
- Campbell, T.; Pin, K.; Ngor, P.B.; Hogan, Z. Conserving Mekong Megafishes: Current Status and Critical Threats in Cambodia. Water 2020, 12, 1820. [Google Scholar]
- Hortle, K.G. Fisheries of the Mekong River Basin. In The Mekong: Biophysical Environment of an International River Basin; Elsevier: Amsterdam, The Netherlands, 2009; pp. 197–249. [Google Scholar]
- Dugan, P.J.; Barlow, C.; Agostinho, A.A.; Baran, E.; Cada, G.F.; Chen, D.; Cowx, I.G.; Ferguson, J.W.; Jutagate, T.; Mallen-Cooper, M.; et al. Fish migration, dams, and loss of ecosystem services in the Mekong basin. Ambio 2010, 39, 344–348. [Google Scholar]
- Reuss, M. Is it time to resurrect the Harvard Water Program? J. Water Resour. Plan. Manag. 2003, 129, 357–360. [Google Scholar] [CrossRef]
- Piman, T.; Cochrane, T.A.; Arias, M.E. Effect of proposed large dams on water flows and hydropower production in the Sekong, Sesan and Srepok rivers of the Mekong Basin. River Res. Appl. 2016, 32, 2095–2108. [Google Scholar] [CrossRef]
- Baran, E. Fish migration triggers in the Lower Mekong Basin and other freshwater tropical systems. MRC Tech. Paper 2006, 14, 56. [Google Scholar]
- Baran, E.; Samadee, S.; Teoh, S.J.; Tran, T.C. Fish and fisheries in the Sekong, Sesan and Srepok basins (3S rivers, Mekong watershed), with special reference to the Sesan River; International Centre for Environmental Management (ICEM): Hanoi, Vietnam, 2013; pp. 1–74. [Google Scholar]
- Arias, M.E.; Cochrane, T.A.; Kummu, M.; Lauri, H.; Holtgrieve, G.W.; Koponen, J.; Piman, T. Impacts of hydropower and climate change on drivers of ecological productivity of Southeast Asia’s most important wetland. Ecol. Modell. 2014, 272, 252–263. [Google Scholar] [CrossRef]
- Hecht, J.S.; Lacombe, G.; Arias, M.E.; Dang, T.D.; Piman, T. Hydropower dams of the Mekong River basin: A review of their hydrological impacts. J. Hydrol. 2019, 568, 285–300. [Google Scholar] [CrossRef]
- Wild, T.B.; Reed, P.M.; Loucks, D.P.; Mallen-Cooper, M.; Jensen, E.D. Balancing hydropower development and ecological impacts in the Mekong: Tradeoffs for sambor mega dam. J. Water Resour. Plan. Manag. 2019, 145, 5018019. [Google Scholar] [CrossRef]
- Kondolf, G.M.; Rubin, Z.K.; Minear, J.T. Dams on the Mekong: Cumulative sediment starvation. Water Resour. Res. 2014, 50, 5158–5169. [Google Scholar] [CrossRef]
- Kummu, M.; Lu, X.; Wang, J.J.; Varis, O. Basin-wide sediment trapping efficiency of emerging reservoirs along the Mekong. Geomorphology 2010, 119, 181–197. [Google Scholar] [CrossRef]
- Baran, E.; So, N.; Degen, P.; Chen, X.Y.; Starr, P. Updated information on fish and fisheries in the Mekong Basin. Catch Cult. 2013, 19, 24–25. [Google Scholar]
- Barbarossa, V.; Schmitt, R.J.P.; Huijbregts, M.A.J.; Zarfl, C.; King, H.; Schipper, A.M. Impacts of current and future large dams on the geographic range connectivity of freshwater fish worldwide. Proc. Natl. Acad. Sci. USA 2020, 117, 3648–3655. [Google Scholar] [CrossRef] [PubMed]
- Dudgeon, D. Large-scale hydrological changes in tropical Asia: Prospects for riverine biodiversity: The construction of large dams will have an impact on the biodiversity of tropical Asian rivers and their associated wetlands. Bioscience 2000, 50, 793–806. [Google Scholar] [CrossRef]
- Thul, P.C. Cambodia halts mainstream Mekong River dam plans for 10 years, official says. Reuters, 18 March 2020. [Google Scholar]
- Mekong Region Futures Institute. Dataset on the Dams of the Greater Mekong; Mekong Region Futures Institute: Bangkok, Thailand, 2020. [Google Scholar]
- Japan International Cooperation Agency. The Master Plan Study on Rural Electrification by Renewable Energy in the Kingdom of Cambodia; Japan International Cooperation Agency: Tokyo, Japan, 2006.
- Japan International Cooperation Agency. Data Collection Survey on Water Resources Management in Central Highlands; Japan International Cooperation Agency: Tokyo, Japan, 2018.
- Allaire, J.J.; Gandrud, C.; Russell, K.; Yetman, C.J. networkD3: D3 JavaScript Network Graphs from R. R Package Version 0.4 2017. [Google Scholar]
- Mekong River Commission. Basin Development Plan Programme, Phase 2: Assessment of Basin-wide Development Scenarios. Mekong River Comm. 2011, 1, 1–119. [Google Scholar]
- Grill, G.; Dallaire, C.O.; Chouinard, E.F.; Sindorf, N.; Lehner, B. Development of new indicators to evaluate river fragmentation and flow regulation at large scales: A case study for the Mekong River Basin. Ecol. Indic. 2014, 45, 148–159. [Google Scholar] [CrossRef]
- Orr, S.; Pittock, J.; Chapagain, A.; Dumaresq, D. Dams on the Mekong River: Lost fish protein and the implications for land and water resources. Glob. Environ. Chang. 2012, 22, 925–932. [Google Scholar] [CrossRef]
- Shaad, K.; Souter, N.J.; Farrell, T.; Vollmer, D.; Regan, H.M. Evaluating the sensitivity of dendritic connectivity to fish pass efficiency for the Sesan, Srepok and Sekong tributaries of the Lower Mekong. Ecol. Indic. 2018, 91, 570–574. [Google Scholar] [CrossRef]
- Ou, C.; Winemiller, K.O. Seasonal hydrology shifts production sources supporting fishes in rivers of the Lower Mekong Basin. Can. J. Fish. Aquat. Sci. 2016, 73, 1342–1362. [Google Scholar] [CrossRef]
- Arias, M.E.; Piman, T.; Lauri, H.; Cochrane, T.A.; Kummu, M. Dams on Mekong tributaries as significant contributors of hydrological alterations to the Tonle Sap Floodplain in Cambodia. Hydrol. Earth Syst. Sci. 2014, 18, 5303–5315. [Google Scholar] [CrossRef]
- Arias, M.E.; Cochrane, T.A.; Piman, T.; Kummu, M.; Caruso, B.S.; Killeen, T.J. Quantifying changes in flooding and habitats in the Tonle Sap Lake (Cambodia) caused by water infrastructure development and climate change in the Mekong Basin. J. Environ. Manag. 2012, 112, 53–66. [Google Scholar] [CrossRef]
- Cochrane, T.A.; Arias, M.E.; Teasley, R.L.; Killeen, T.J. Simulated changes in water flows of the Mekong River from potential dam development and operations on the Se San and Sre Pok tributaries. In Proceedings of the IWA World Water Congress and Exhibition, Montreal, QC, Canada, 19–24 September 2010; pp. 19–24. [Google Scholar]
- Golden, C.D.; Shapero, A.; Vaitla, B.; Smith, M.R.; Myers, S.S.; Stebbins, E.A.; Gephart, J.A. Impacts of Hydropower Development on Fisheries and Human Nutrition in the Lower Mekong. Front. Sustain. Food Syst. 2019, 3, 93. [Google Scholar] [CrossRef]
- Yu, W.; Kim, Y.; Lee, D.; Lee, G. Hydrological assessment of basin development scenarios: Impacts on the Tonle Sap Lake in Cambodia. Quat. Int. 2019, 503, 115–127. [Google Scholar] [CrossRef]
- Baird, I.; Mean, M. Sesan river fisheries monitoring in Ratanakiri province, northeast Cambodia: Before and after the construction of the Yali Falls dam in the Central Highlands of Viet Nam. In 3S Rivers Protection Network and the Global Association for People and the Environment; 3S Rivers Protection Network: Ban Lung, Cambodia, 2005; p. 92. [Google Scholar]
- Räsänen, T.A.; Varis, O.; Scherer, L.; Kummu, M. Greenhouse gas emissions of hydropower in the Mekong River Basin. Environ. Res. Lett. 2018, 13, 34030. [Google Scholar] [CrossRef]
- Sievert, C. Interactive Web-Based Data Visualization with R, Plotly, and Shiny; Chapman and Hall/CRC: Boca Raton, FL, USA, 2020. [Google Scholar]
- Dallaire, C.O.; Lehner, B.; Sayre, R.; Thieme, M. A multidisciplinary framework to derive global river reach classifications at high spatial resolution. Environ. Res. Lett. 2019, 14, 24003. [Google Scholar] [CrossRef]
- Jager, H.I.; Efroymson, R.A.; Opperman, J.J.; Kelly, M.R. Spatial design principles for sustainable hydropower development in river basins. Renew. Sustain. Energy Rev. 2015, 45, 808–816. [Google Scholar] [CrossRef]
- Piman, T.; Cochrane, T.A.; Arias, M.E.; Green, A.; Dat, N.D. Assessment of flow changes from hydropower development and operations in Sekong, Sesan, and Srepok rivers of the Mekong basin. J. Water Resour. Plan. Manag. 2013, 139, 723–732. [Google Scholar] [CrossRef]
- Duc, N.A.; Nguyen, L.T.; Thai, T.H.; Khan, A.; Rautenstrauch, K.; Schmidt, C. Assessing cumulative impacts of the proposed Lower Mekong Basin hydropower cascade on the Mekong River floodplains and Delta–Overview of integrated modeling methods and results. J. Hydrol. 2020, 581, 122511. [Google Scholar]
- Annandale, G.; Golder Associates. Technical Memorandum on Options for Sediment Passage through Lower Se San 2 Dam; Ministry of Industry, Mines, and Energy: Phnom Penh, Cambodia; Ministry of Water Resources and Meteorology: Phnom Penh, Cambodia; Natural Heritage Institute: San Francisco, CA, USA, 2013.
- Sabo, J.L.; Ruhi, A.; Holtgrieve, G.W.; Elliott, V.; Arias, M.E.; Ngor, P.B.; Räsänen, T.A.; Nam, S. Designing river flows to improve food security futures in the Lower Mekong Basin. Science 2017, 358, eaao1053. [Google Scholar] [CrossRef]
- Wild, T.B.; Loucks, D.P.; Annandale, G.W.; Kaini, P. Maintaining sediment flows through hydropower dams in the Mekong River Basin. J. Water Resour. Plan. Manag. 2016, 142, 5015004. [Google Scholar] [CrossRef]
- Ngo, L.A.; Masih, I.; Jiang, Y.; Douven, W. Impact of reservoir operation and climate change on the hydrological regime of the Sesan and Srepok Rivers in the Lower Mekong Basin. Clim. Change 2018, 149, 107–119. [Google Scholar] [CrossRef]
- Natural Heritage Institute. Sambor Hydropower Dam Alternatives Assessment Final Report; Natural Heritage Institute: San Francisco, CA, USA, 2017. [Google Scholar]
- Räsänen, T.A.; Joffre, O.M.; Someth, P.; Thanh, C.T.; Keskinen, M.; Kummu, M. Model-based assessment of water, food, and energy trade-offs in a cascade of multipurpose reservoirs: Case study of the Sesan Tributary of the Mekong River. J. Water Resour. Plan. Manag. 2015, 141, 5014007. [Google Scholar] [CrossRef]
- Wells-Dang, A.; Soe, K.N.; Inthakoun, L.; Tola, P.; Socheat, P.; Van, T.T.; Chabada, A.; Youttananukorn, W. A political economy of environmental impact assessment in the Mekong Region. Water Altern. 2016, 9, 33–55. [Google Scholar]
- Baran, E.; Samadee, S.; Teoh, S.J.; Tran, T.C. Fish and Fisheries in the Sesan River Basin: MK3 Catchment Baseline, Fisheries Section; WorldFish Center: Phnom Penh, Cambodia; Penang, Malaysia; ICEM: Hanoi, Vietnam, 2011; pp. 1–61. [Google Scholar]
- Kraft, M.; Rosenberg, D.E.; Null, S.E. Prioritizing Stream Barrier Removal to Maximize Connected Aquatic Habitat and Minimize Water Scarcity. JAWRA J. Am. Water Resour. Assoc. 2019, 55, 382–400. [Google Scholar] [CrossRef]
- Pokhrel, Y.; Burbano, M.; Roush, J.; Kang, H.; Sridhar, V.; Hyndman, D.W. A review of the integrated effects of changing climate, land use, and dams on Mekong river hydrology. Water 2018, 10, 266. [Google Scholar] [CrossRef]
- Jensen, C.B. A flood of models: Mekong ecologies of comparison. Soc. Stud. Sci. 2020, 50, 76–93. [Google Scholar] [CrossRef] [PubMed]
- Johnston, R.; Kummu, M. Water resource models in the Mekong Basin: A review. Water Resour. Manag. 2012, 26, 429–455. [Google Scholar] [CrossRef]
- Piman, T.; Lennaerts, T.; Southalack, P. Assessment of hydrological changes in the lower Mekong Basin from Basin-Wide development scenarios. Hydrol. Process. 2013, 27, 2115–2125. [Google Scholar] [CrossRef]
- Cochrane, T.A.; Arias, M.E.; Piman, T. Historical impact of water infrastructure on water levels of the Mekong River and the Tonle Sap system. Hydrol. Earth Syst. Sci. 2014, 18, 4529–4541. [Google Scholar] [CrossRef]
- Stagge, J.H.; Rosenberg, D.E.; Abdallah, A.M.; Akbar, H.; Attallah, N.A.; James, R. Assessing data availability and research reproducibility in hydrology and water resources. Sci. Data 2019, 6, 190030. [Google Scholar] [CrossRef] [PubMed]
- Jager, H.I.; Smith, B.T. Sustainable reservoir operation: Can we generate hydropower and preserve ecosystem values? River Res. Appl. 2008, 24, 340–352. [Google Scholar] [CrossRef]
- IPCC (Intergovernmental Panel on Climate Change). Summary for Policymakers. In Climate Change 2014: Mitigation of Climate Change; Edenhofer, O., Pichs-Madruga, R., Sokona, Y., Farahani, E., Kadner, S., Seyboth, K., Adler, A., Baum, I., Brunner, S., Eickemeier, P., et al., Eds.; Cambridge University Press: Cambridge, UK, 2014. [Google Scholar]
- Federer, L.M.; Belter, C.W.; Joubert, D.J.; Livinski, A.; Lu, Y.L.; Snyders, L.N.; Thompson, H. Data sharing in PLoS ONE: An analysis of data availability statements. PLoS ONE 2018, 13, e0194768. [Google Scholar] [CrossRef] [PubMed]
- Graf, W.L. Dam nation: A geographic census of American dams and their large-scale hydrologic impacts. Water Resour. Res. 1999, 35, 1305. [Google Scholar] [CrossRef]
- Moran, E.F.; Lopez, M.C.; Moore, N.; Müller, N.; Hyndman, D.W. Sustainable hydropower in the 21st century. Proc. Natl. Acad. Sci. USA 2018, 115, 11891–11898. [Google Scholar] [CrossRef] [PubMed]
- Hanemann, M.; Dyckman, C. The San Francisco Bay-Delta: A failure of decision-making capacity. Environ. Sci. Policy 2009, 12, 710–725. [Google Scholar] [CrossRef]
- Elmore, L.R.; Null, S.E.; Mouzon, N.R. Effects of environmental water transfers on stream temperatures. River Res. Appl. 2016, 32, 1415–1427. [Google Scholar] [CrossRef]
- Null, S.E. Water Supply Reliability Tradeoffs between Removing Reservoir Storage and Improving Water Conveyance in California. J. Am. Water Resour. Assoc. 2016, 52, 350–366. [Google Scholar] [CrossRef]
- Null, S.E.; Medellin-Azuara, J.; Escriva-Bou, A.; Lent, M.; Lund, J.R. Optimizing the dammed: Water supply losses and fish habitat gains from dam removal in California. J. Environ. Manag. 2014, 136, 121–131. [Google Scholar] [CrossRef]
- Campbell, I.; Barlow, C. Hydropower Development and the Loss of Fisheries in the Mekong River Basin. Front. Environ. Sci. 2020, 8, 200. [Google Scholar] [CrossRef]
- Ansar, A.; Flyvbjerg, B.; Budzier, A.; Lunn, D. Should we build more large dams? The actual costs of hydropower megaproject development. Energy Policy 2014, 69, 43–56. [Google Scholar] [CrossRef]
- Chowdhury, A.F.M.K.; Dang, T.D.; Bagchi, A.; Galelli, S. Expected Benefits of Laos’ Hydropower Development Curbed by Hydroclimatic Variability and Limited Transmission Capacity: Opportunities to Reform. J. Water Resour. Plan. Manag. 2020, 146, 5020019. [Google Scholar] [CrossRef]
- Kummu, M.; Sarkkula, J. Impact of the Mekong River flow alteration on the Tonle Sap flood pulse. AMBIO A J. Hum. Environ. 2008, 37, 185–192. [Google Scholar] [CrossRef]
- Ngor, P.B.; McCann, K.S.; Grenouillet, G.; So, N.; McMeans, B.C.; Fraser, E.; Lek, S. Evidence of indiscriminate fishing effects in one of the world’s largest inland fisheries. Sci. Rep. 2018, 8, 1–12. [Google Scholar] [CrossRef] [PubMed]
- Chan, B.; Ngor, P.B.; Hogan, Z.S.; So, N.; Brosse, S.; Lek, S. Temporal Dynamics of Fish Assemblages as a Reflection of Policy Shift from Fishing Concession to Co-Management in One of the World’s Largest Tropical Flood Pulse Fisheries. Water 2020, 12, 2974. [Google Scholar] [CrossRef]
- Chea, R.; Grenouillet, G.; Lek, S. Evidence of water quality degradation in lower Mekong basin revealed by self-organizing map. PLoS ONE 2016, 11, e0145527. [Google Scholar] [CrossRef] [PubMed]
- Oeurng, C.; Cochrane, T.A.; Arias, M.E.; Shrestha, B.; Piman, T. Assessment of changes in riverine nitrate in the Sesan, Srepok and Sekong tributaries of the Lower Mekong River Basin. J. Hydrol. Reg. Stud. 2016, 8, 95–111. [Google Scholar] [CrossRef]
- Channa, P.; Sereyvuth, H.; Bunwath, T.A.N.S.; Kimsan, L.O.R.; Somany, P. Population Monitoring of the Critically Endangered Mekong River Dolphin Based on Mark-Resight, Cambodia; WWF-Cambodia Technical Report; WWF-Cambodia: Phnom Penh, Cambodia, 2015; pp. 1–22. [Google Scholar]
- Hogan, Z.S.; Moyle, P.B.; May, B.; Zanden, M.J.V.; Baird, I.G. The Imperiled Giants of the Mekong: Ecologists struggle to understand—and protect—Southeat Asia’s large migratory catfish. Am. Sci. 2004, 92, 228–237. [Google Scholar]
- Lohani, S.; Dilts, T.E.; Weisberg, P.J.; Null, S.E.; Hogan, Z.S. Rapidly accelerating deforestation in Cambodia’s Mekong River Basin: A comparative analysis of spatial patterns and drivers. Water 2020, 12, 2191. [Google Scholar] [CrossRef]
- Thilakarathne, M.; Sridhar, V. Characterization of future drought conditions in the Lower Mekong River Basin. Weather Clim. Extrem. 2017, 17, 47–58. [Google Scholar] [CrossRef]
- Yang, J.; Yang, Y.C.E.; Chang, J.; Zhang, J.; Yao, J. Impact of dam development and climate change on hydroecological conditions and natural hazard risk in the Mekong River Basin. J. Hydrol. 2019, 579, 124177. [Google Scholar] [CrossRef]
- Yoshida, Y.; Lee, H.S.; Trung, B.H.; Tran, H.D.; Lall, M.K.; Kakar, K.; Xuan, T.D. Impacts of Mainstream Hydropower Dams on Fisheries and Agriculture in Lower Mekong Basin. Sustainability 2020, 12, 2408. [Google Scholar] [CrossRef]
- Trisurat, Y.; Aekakkararungroj, A.; Ma, H.; Johnston, J.M. Basin-wide impacts of climate change on ecosystem services in the Lower Mekong Basin. Ecol. Res. 2018, 33, 73–86. [Google Scholar] [CrossRef] [PubMed]
- Null, S.; Farshid, A.; Goodrum, G.; Gray, C.; Lohani, S.; Morrisett, C.; Prudencio, L.; Sor, R. Environmental Tradeoffs of Hydropower Dams in the Sekong, Sesan, and Srepok (3S) Rivers of the Lower Mekong Basin, HydroShare. 2020. Available online: http://www.hydroshare.org/resource/5e57b81fa6994fc3b63f6b7d5dc54cf0 (accessed on 29 December 2020).
- Null, S.; Farshid, A.; Goodrum, G.; Gray, C.; Lohani, S.; Morrisett, C.; Prudencio, L.; Sor, R. Environmental tradeoffs of hydropower dams in the Sekong, Sesan, and Srepok (3S) Rivers of the Lower Mekong Basin, Mekong Water. 2020. Available online: http://data.mekongwater.org/resource/3ce6587a4c424e748498490e141a1077 (accessed on 29 December 2020).


| Mekong | AND | tradeoff OR trade-off | AND | dam OR hydropower | AND | Sesan OR Se San OR Sê San OR Srepok OR Sre Pok OR Serepôk OR Sekong OR Se Kong OR Sê Kông OR 3S |
Publisher’s Note: MDPI stays neutral with regard to jurisdictional claims in published maps and institutional affiliations. |
© 2020 by the authors. Licensee MDPI, Basel, Switzerland. This article is an open access article distributed under the terms and conditions of the Creative Commons Attribution (CC BY) license (http://creativecommons.org/licenses/by/4.0/).
Share and Cite
Null, S.E.; Farshid, A.; Goodrum, G.; Gray, C.A.; Lohani, S.; Morrisett, C.N.; Prudencio, L.; Sor, R. A Meta-Analysis of Environmental Tradeoffs of Hydropower Dams in the Sekong, Sesan, and Srepok (3S) Rivers of the Lower Mekong Basin. Water 2021, 13, 63. https://doi.org/10.3390/w13010063
Null SE, Farshid A, Goodrum G, Gray CA, Lohani S, Morrisett CN, Prudencio L, Sor R. A Meta-Analysis of Environmental Tradeoffs of Hydropower Dams in the Sekong, Sesan, and Srepok (3S) Rivers of the Lower Mekong Basin. Water. 2021; 13(1):63. https://doi.org/10.3390/w13010063
Chicago/Turabian StyleNull, Sarah E., Ali Farshid, Gregory Goodrum, Curtis A. Gray, Sapana Lohani, Christina N. Morrisett, Liana Prudencio, and Ratha Sor. 2021. "A Meta-Analysis of Environmental Tradeoffs of Hydropower Dams in the Sekong, Sesan, and Srepok (3S) Rivers of the Lower Mekong Basin" Water 13, no. 1: 63. https://doi.org/10.3390/w13010063
APA StyleNull, S. E., Farshid, A., Goodrum, G., Gray, C. A., Lohani, S., Morrisett, C. N., Prudencio, L., & Sor, R. (2021). A Meta-Analysis of Environmental Tradeoffs of Hydropower Dams in the Sekong, Sesan, and Srepok (3S) Rivers of the Lower Mekong Basin. Water, 13(1), 63. https://doi.org/10.3390/w13010063