Article

Seawater Intrusion Proneness and Geophysical Investigations in the Metaponto Coastal Plain (Basilicata, Italy)

1
Scuola di Ingegneria, Università degli Studi della Basilicata, 85100 Potenza, Italy
2
CNR—IRPI, National Research Council—Research Institute for Hydrogeological Protection, 70126 Bari, Italy
3
Department of Physics and Earth Sciences, University of Ferrara, 44121 Ferrara, Italy
4
CNR-IMAA, National Research Council, Institute of Methodologies for Environmental Analysis, 85050 Tito, Italy
*
Author to whom correspondence should be addressed.
Water 2021, 13(1), 53; https://doi.org/10.3390/w13010053
Submission received: 22 October 2020 / Revised: 20 December 2020 / Accepted: 23 December 2020 / Published: 29 December 2020

Abstract

:
The Metaponto coastal plain extends about 40 km along the Ionian coast, between the Sinni and Bradano Rivers (southern Italy). During the 20th century, the increases in modern irrigation systems, land reclamation works, the overexploitation of wells, and agricultural and industrial activities have deeply modified land use and groundwater availability and quality along the plain. These modifications negatively impacted the natural systems in terms of groundwater and soil salinization, magnifying the risks due to seawater intrusion. In this study, we explored the proneness to seawater intrusion, testing a multidisciplinary approach based on hydrochemical and geophysical investigations. A significant portion of the coastal plain was selected for this purpose. A set of 49 groundwater samples was analyzed to define the chemical characteristics of the water and geoelectrical measurements were recorded along three long profiles. The geoelectrical surveys showed in detail the aquifer bottom pattern where it is deeply incised by paleovalleys, defining the main hydrostratigraphic features, as it is necessary to prevent seawater intrusion worsening. The hydrochemical data highlighted areas with higher seawater intrusion proneness. The acquired measurements show the high proneness to seawater intrusion, especially where the aquifer bottom is very deep below the sea level, also far from the coast, and the relevance of the detailed knowledge of the aquifer bottom in supporting any kind of management.

1. Introduction

Coastal aquifers are an important source for drinking water supply and agriculture, especially in arid and semi-arid regions. However, coastal freshwater resources are significantly threatened by salinization due to seawater intrusion [1]. Seawater intrusion is defined as the movement of salt water invading freshwater aquifers, and it represents one of the main causes of groundwater being unsuitable both for drinking and irrigation use. Seawater intrusion also affects coastal environments by changing the soil chemistry, reducing its fertility, and impacting local ecosystems.
Under certain simplifying hypotheses, the interface between fresh groundwater and salt groundwater can be considered a sharp boundary. However, these miscible fluids are separated by a transition zone, within which dispersion and molecular diffusion processes occur due to concentration differences. These processes are caused by spatial variations and heterogeneities in the geologic structure and the hydraulic properties of the aquifer and adjacent confining units, and by dynamic forces, such as daily fluctuations in tide stages, seasonal and annual variations in groundwater recharge rates, and long-term changes in sea level [2]. For seawater intrusion, the aquifer bottom must be below sea level along the coastline; the salinization risk due to seawater intrusion may increase when the aquifer bottom depth below sea level increases. The natural balance between freshwater and salt water can be significantly altered by human activities, including groundwater overpumping, land drainage, land use changes, and/or groundwater recharge lowering in urbanized areas, especially along the coastal plains [3]. The effects of climate change, such as variations in precipitation, runoff, and recharge that may occur within coastal watersheds, are other factors affecting seawater intrusion, apart from sea level and salinity rise.
To properly manage water resources in coastal areas, different approaches can be adopted [4]. Hydrochemical methods can be used, measuring parameters, such as electrical conductivity, chloride concentration, and total dissolved-solids concentration, to highlight the saline contamination. Attention is now focused on geophysical techniques as an alternative to these traditional methods to directly or indirectly detect the hydrogeological structure of the aquifer to monitor salt water in coastal aquifers [4].
Geophysical methods are widely used to obtain geological and hydrogeological information in coastal environments, proving to be particularly valuable when traditional investigation techniques are too expensive, invasive, or their application is not feasible. Both land- and marine-based near-surface geophysical methods can be effective in numerous applications, including water resource management, watershed-scale and coastal hydrology, and characterization of the geological and hydrogeological properties of the subsoil for natural-hazards risk assessment or the design of coastal engineering structures. Shallow geophysical methods, such as ground-penetrating radar and seismic approaches, are widely used in sedimentology for the management of onshore environments. Seismic methods can assist in hydrogeological conceptualization by providing deep geological information, such as stratigraphy features. Seismic methods are particularly useful in coastal environments, where they can be used to delineate the distribution of geologic units that could also be affected by the movement of salt water [5]. Even if several geophysical methods can characterize coastal areas, the electrical resistivity is more closely connected and strongly related to pore water salinity. Numerous geoelectrical applications of case studies may be found in the literature [6,7,8,9]. The electrical geophysical prospecting method aims to determine the distribution of the subsoil electrical resistivity due to the recent apparatuses that can acquire many measurements of apparent resistivity from the ground surface. The electrical resistivity of a geological formation is a physical characteristic that determines the resistance to the flow of electric current in the formation. Resistivity varies with the texture of the rock, nature of mineralization, and conductivity of electrolyte contained within the porous rock. Resistivity increases with grain size and drastically decreases with the increase in clay content, which is commonly dispersed throughout as coatings on grains, disseminated masses, or as thin layers or lenses. In saturated rocks, low resistivity can be due to increased clay content or salinity. Hence, resistivity surveys are the best suited for delineation of clay or saline zones [10]. These concepts are well defined by the Archie law in saturated medium:
ρ =   ρ w φ n
where ρ is the electrical resistivity of a rock, ρ w is the resistivity of the water, φ is the fraction of porosity filled with water, and n is the cementation exponent of the rock. Therefore, electrical and electromagnetic methods could contribute to seawater intrusion studies. Several papers highlight the use of vertical electrical sounding (VES) and electrical resistivity tomography (ERT) methods for the characterization of coastal areas and the investigations of seawater intrusion phenomena [11,12]. The VES method defines the vertical variation of the electrical resistivity, but when the bedrock has an irregular geometry and strong lateral variations are distributed, only a spatial investigation method as the ERT has an important role in the coastal area characterization [13,14].
Few geophysical works investigated the Metaponto coastal area. Some of them highlighted the use of ERT method to define the seawater intrusion front and to map areas with a high level of salinization [15]. Moreover, different authors studied the geomorphology of the Metaponto coastal area from borehole analysis and horizontal-to-vertical spectral ratio (HVSR) method, delineating the morphology of the top of the bedrock between the Cavone and Bradano Rivers [16,17]. The last work suggested a high depth of this substratum, which also defined the clay bedrock incision where paleovalleys have settled and after refilled. The aim of this study was to apply a multidisciplinary approach to evaluating the proneness to seawater intrusion of a typical coastal plain, operating in a selected portion of the Metaponto coastal plain, between the Agri and Cavone Rivers (Figure 1). A multidisciplinary method with geophysical and hydrochemical tools was applied to define the spatial geometry of the aquifer system and provide more knowledge for the chemical characterization of groundwater resources. ERT was applied to obtain information about the spatial distribution of the electrical resistivity in the subsoil to define the main geological and hydrogeological features. Three long ERT profiles with a high depth of investigation (about 120 m) were applied, both overcoming the insufficient maximum depth investigated in the previous works [15] and increasing the bedrock substratum resolution, compared with the previous HVSR survey. The use of continuous coring drilling data improved the reliability of geophysical result interpretation.

2. Geological and Hydrogeological Setting of the Study Area

The Metaponto coastal plain (MCP) extends about 40 km along the Ionian coast, between the Sinni and Bradano Rivers. The observed mean annual rainfall and temperature at the Metaponto gauge are 534 mm and 16.4 °C, respectively; the mean annual effective rainfall is 101 mm, of which less than 20% is assessed as infiltration, contributing to the aquifer recharge. The climate is semi-arid [18].
The study area is the southernmost and most recent outcropping of the Bradanic Trough, bordering the Apulian foreland to the northeast and the Apennines Chain to the southwest. It is composed of regressive filling from the Pliocene to the Pleistocene age, with marine sediments deeply eroded by five major rivers running perpendicular to the shoreline (from SW to NE: Sinni, Agri, Cavone, Basento, and Bradano Rivers). Four geological formations and hydrogeological units can be identified (Figure 1). They are, from the bottom to the top: the Argille Subappennine (Subapennine Clays) Formation; the marine terraced deposits; alluvial, transitional, and marine deposits; and coastal deposits. The Argille Subappennine Formation (silty-clayey successions of Late Pliocene–Middle Pleistocene in age) outcrops in small strips along the slopes of the rivers. From the hydrogeological point of view, these deposits show very low hydraulic conductivity and constitute the impervious bottom of the aquifers present in the area [19,20].
The marine terraced deposits (regressive deposits consisting of sands, conglomerates, and silts of Middle–Upper Pleistocene in age), overlying the Argille Subappennine Formation, outcrop in the upland segments of the study area. The flat-topped surfaces of the terraces are broken off both by the river valleys and by marked morphological steps representing the marine terraced scarps, which run roughly parallel to the present coastline and should represent the ancient coastlines and the phases of sea level standing [21]. The hydraulic conductivity of the marine terraced deposits is generally from medium to high, with the highest values of 10−3 m/s [22], corresponding with the sandy and gravelly sediments, and becomes very low for the silty-clayey levels.
Alluvial, transitional, and marine deposits widely outcrop in the coastal plain [23]. Alluvial deposits outcrop in the valleys of the major rivers and their main tributaries. The alluvial deposits are essentially sandy silts and silty-clayey layers, with interbedded sandy strata. In the coastal plain, the alluvial sediments are more distinctly sandy and overlay on transitional deposits consisting of sand, gravel, and silt in layers variously distributed in space (Figure 2). The plain deposits have, on a large scale, a medium hydraulic conductivity, assessed as 2.3 × 10⁻⁴ and 6.53 × 10⁻⁵ m/s for mean and median values, respectively [22]; the hydraulic conductivity can locally change to very low values for the silty-clayey layers.
The Ionian littoral zone is mainly defined by sandy beaches, becoming gravely-sandy or sandy, with pebbly lens moving toward the Sinni area [24]. The beaches are bounded both by marshy areas and coastal dunes composed of sands, packed and weakly cemented. The MCP schematically extends orthogonally to the coast from the upper marine terraces to the Ionian littoral (Figure 1).
Recent stratigraphic studies improved the understanding of the subsurface structure of the MCP [23]. Three main lithostratigraphic units (LSUs) were identified. The lower unit (LSU1) is composed of shelf-transition silt, clay, and sand and is “the youngest part (middle and, dubitatively, upper Pleistocene) of the Argille Subappennine formation” [25], the bottom of the MCP aquifer. The LSU1 top surface is irregular and reaches a depth of 100 m corresponding to paleovalleys, mainly filled by estuarine deposits. The middle unit (LSU2), late Pleistocene in age, is characterized by fluvial and/or deltaic sandy-gravelly deposits. The upper unit (LSU3), late Pleistocene and Holocene in age, includes the outcropping deposits of the plain. The LSU2 and LSU3 units correspond to the coastal aquifer of the plain [25].
The spatial distribution of the different formations and geomorphological evolution led to the setting of different boundaries for the groundwater flow system. Three different aquifers can be distinguished. Two of these are inland aquifers constituted by marine terraced deposits and alluvial deposits of river valleys, which anastomose in the coastal plain aquifer, which is the third one. All the aquifers are mainly unconfined, apart from some confined portions. Groundwater outflow from the inland aquifers mainly feeds the coastal plain aquifer. Other recharge sources of the coastal plain aquifer are river leakage and direct rainfall infiltration, which is low due to the unfavorable climatic conditions and the low hydraulic conductivity of the top soil [22,26,27].
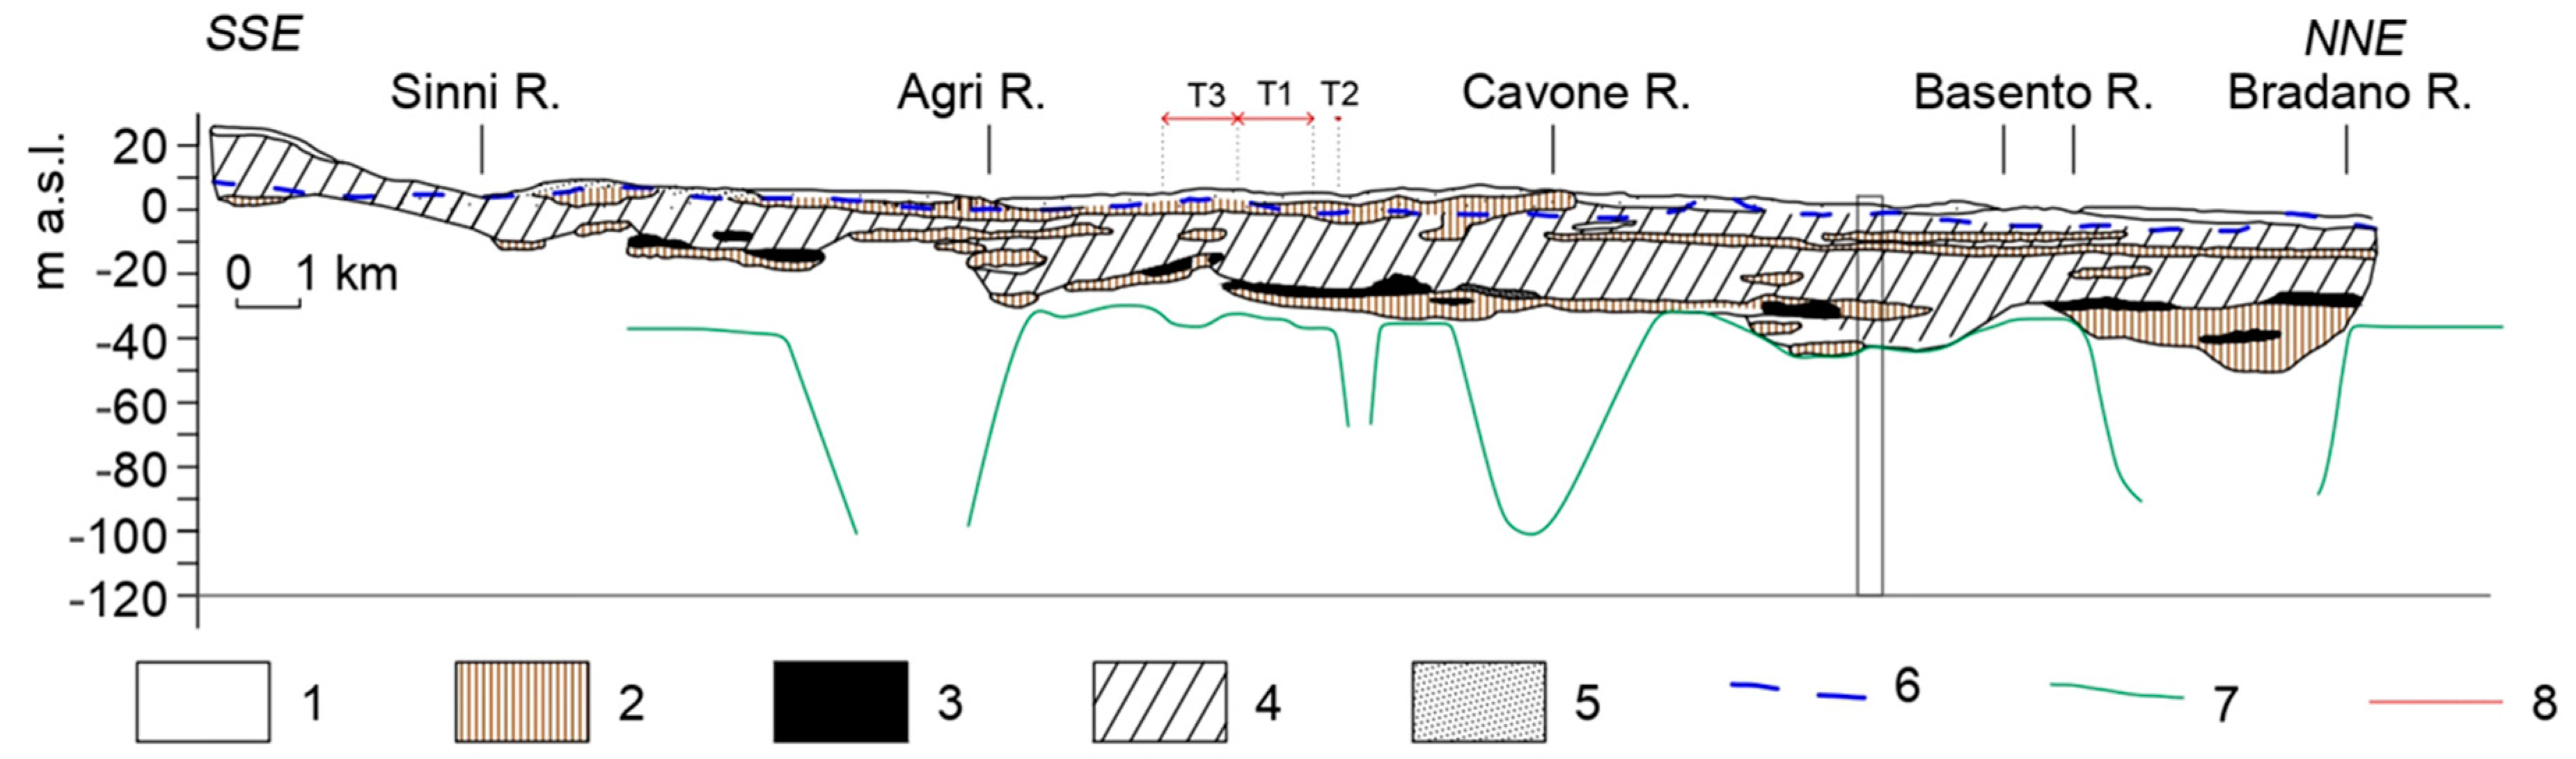
The coastal aquifer bottom from inland to the coast is below the mean sea level along most of the coastline, based on mapping of a large boring dataset [22]. Previous research works used scope-specific deep continuous core boring, geophysical surveys, and sedimentological assessments studying the pattern of the aquifer bottom [15,16,17,25,28,29,30,31]. A HVSR geophysical survey was used to obtain an isobath map, which highlighted three NW–SE-trending, elongated, and narrow depressions (Figure 2). They are roughly parallel to the current valleys of the Cavone, Basento, and Bradano Rivers. These depressions correspond to the paleovalleys that developed in the region during the Last Glacial Maximum and were buried below the MCP, mainly by silts and sands, during the subsequent sea level rise. Merging all boring, sedimentological, and geophysical data, the aquifer clay substratum was better described (Figure 2), showing the role of buried paleomorphological features on aquifer boundaries, especially for the bottom. Where these very deep depressions are filled by permeable sediments, they create preferential paths for lateral intrusion, highly increasing the risk of upconing effects. Improving the knowledge of these features could be highly relevant for modeling to support optimal management.
MCP is intensively cultivated and the groundwater quality is vital for the economic growth of tourism and agriculture [32]. During the 20th century, massive amounts of human activities (i.e., development of modern irrigation systems, reclamation works, overexploitation of wells, and agricultural and industrial activities) have deeply changed the surface water and groundwater flow systems in many coastal plains of southern Italy [3,33], including the MCP. The effects of the global change, including a relevant coastal retreat [34], are having increasingly negative impacts on the natural systems and the groundwater resources of the MCP, especially in terms of groundwater and soil salinization risks.
The effect of seawater intrusion in the forest located at the Bradano River mouth (Figure 1), a natural reserve, was evaluated with a geoelectrical survey and chemical analyses of soil and water samples [28]. The investigations revealed that the seawater intrusion worsening is contributing to the deterioration of the existing pine forest. The spatial distribution of brackish and saline water in the soil affected the vegetation cover: areas with higher soil salinity were covered by salt-tolerant grasses [28].
A subsequent multidisciplinary study, based on remote sensing, geophysical, and landscape ecology data, examined five protected areas along the MCP coastline over a period of about 30 years (1985–2013): the upward groundwater salinization fragmented the coniferous forest [29].

3. Materials and Methods

A multimethodological approach was defined to improve aquifer knowledge, merging basic and affordable investigation techniques and integrating boreholes data, electrical resistivity profiles, and groundwater hydrochemical analyses.
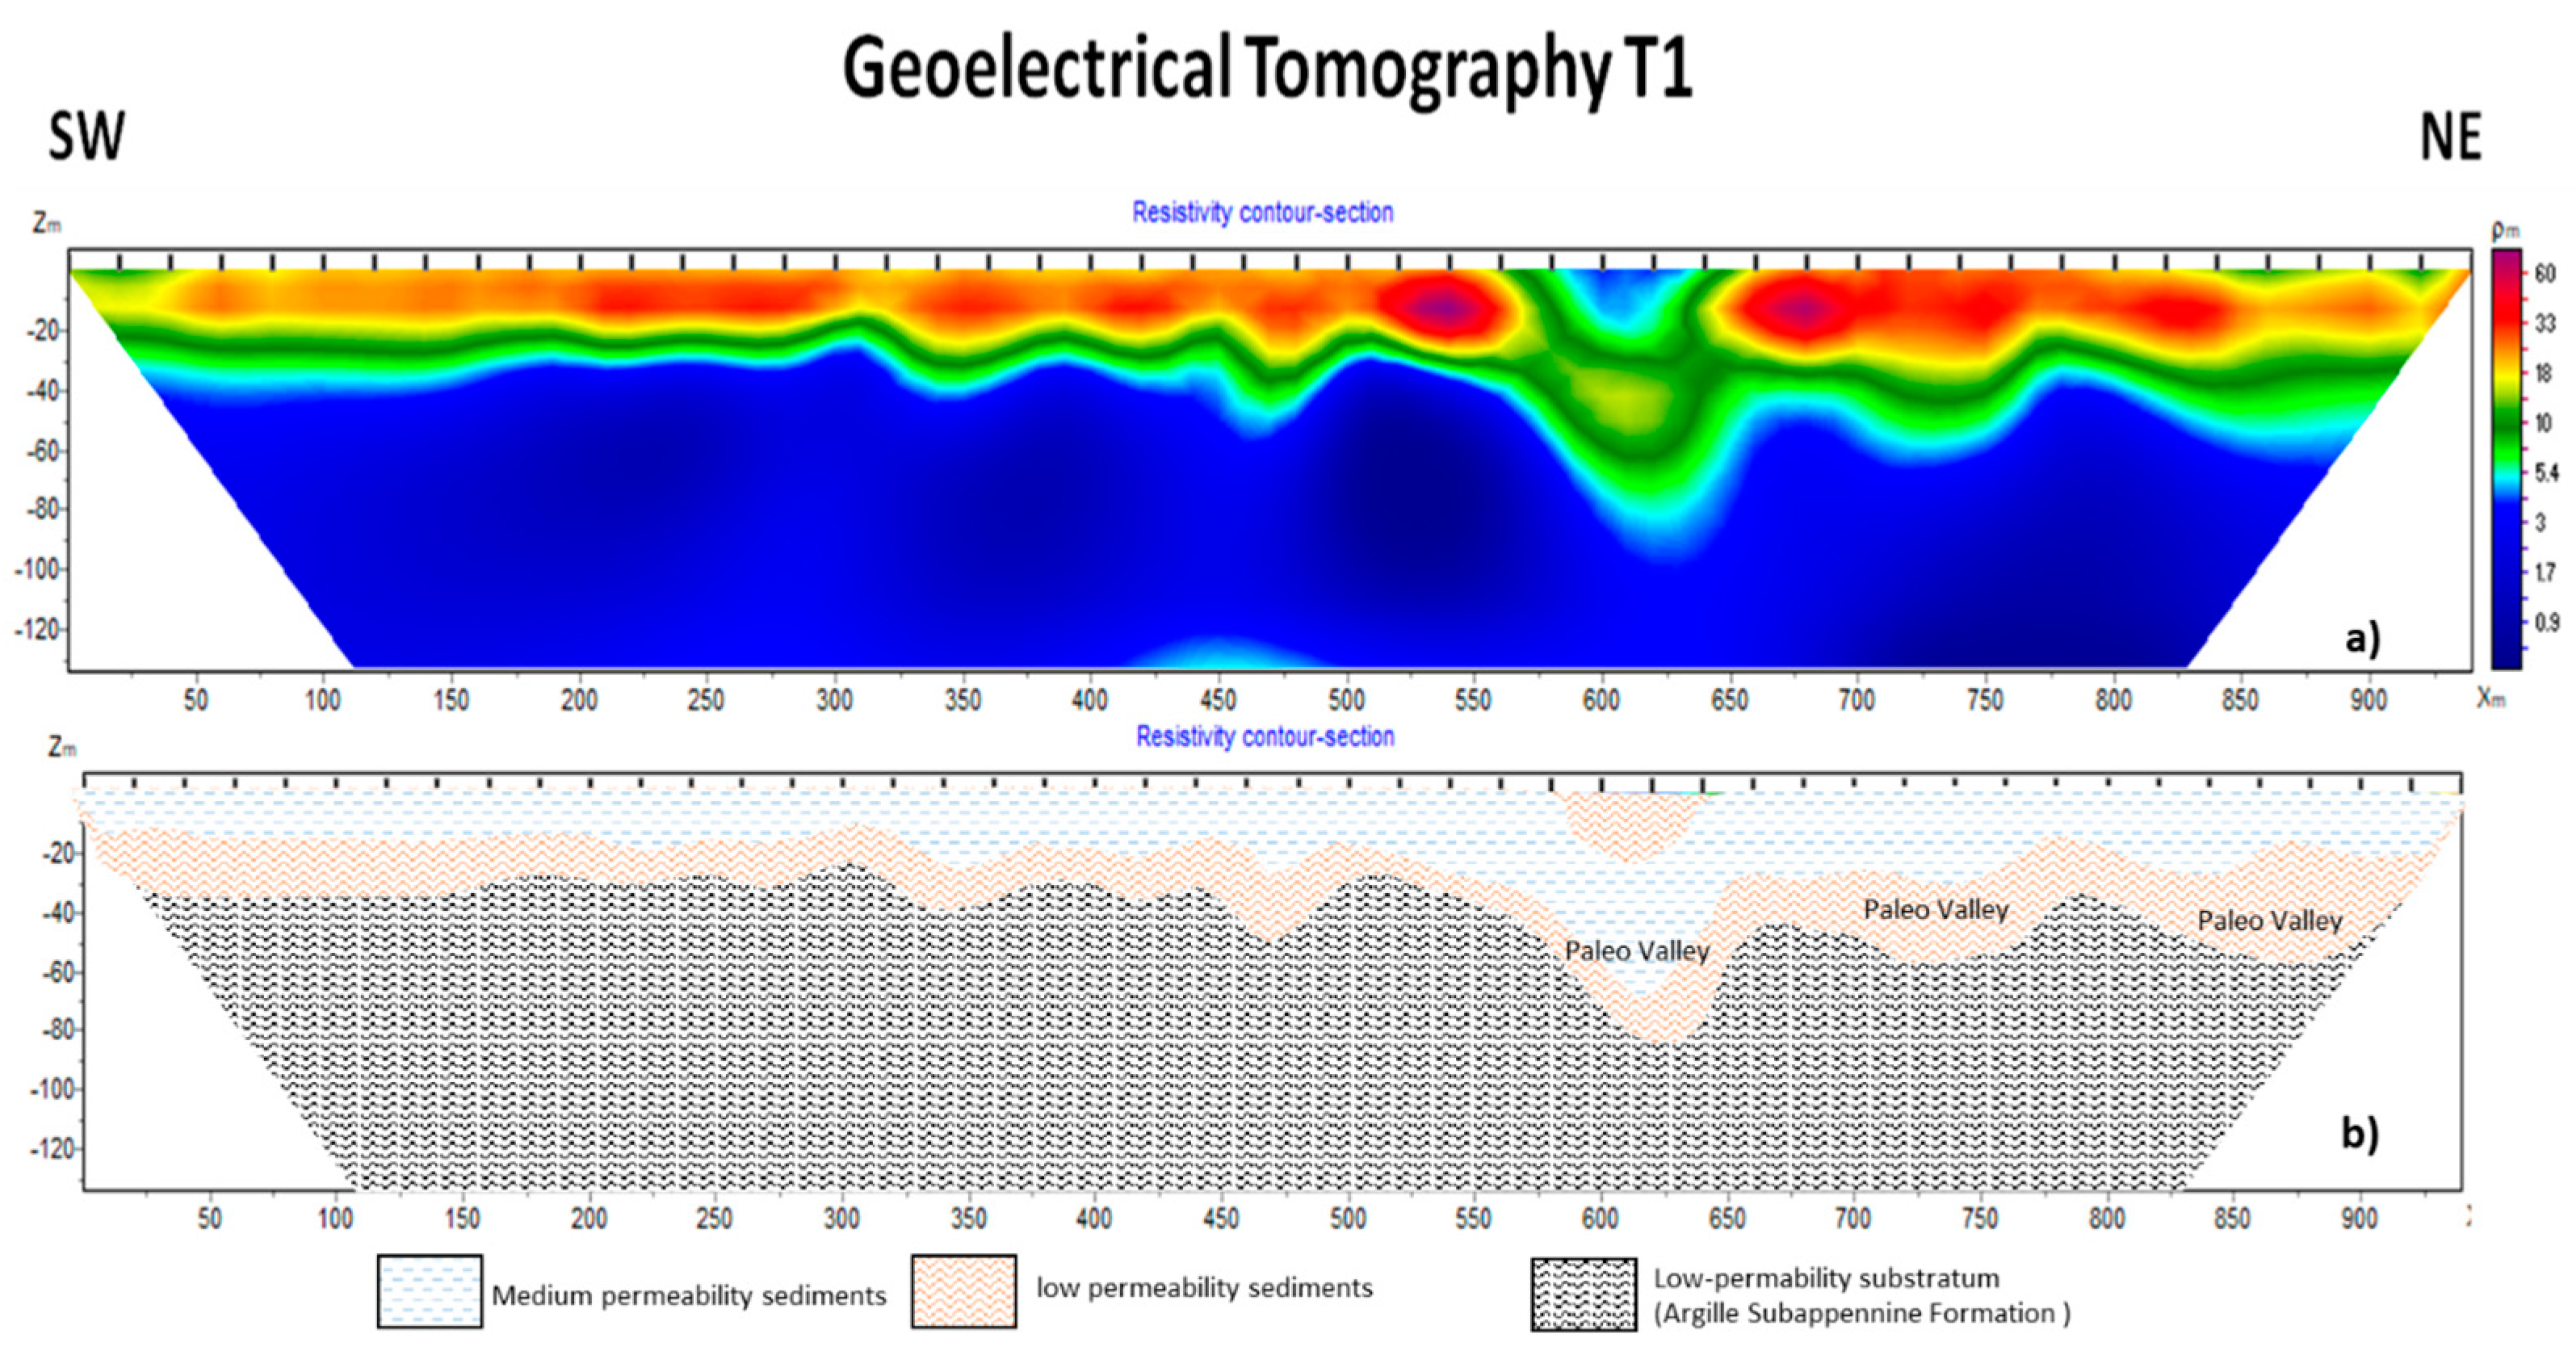
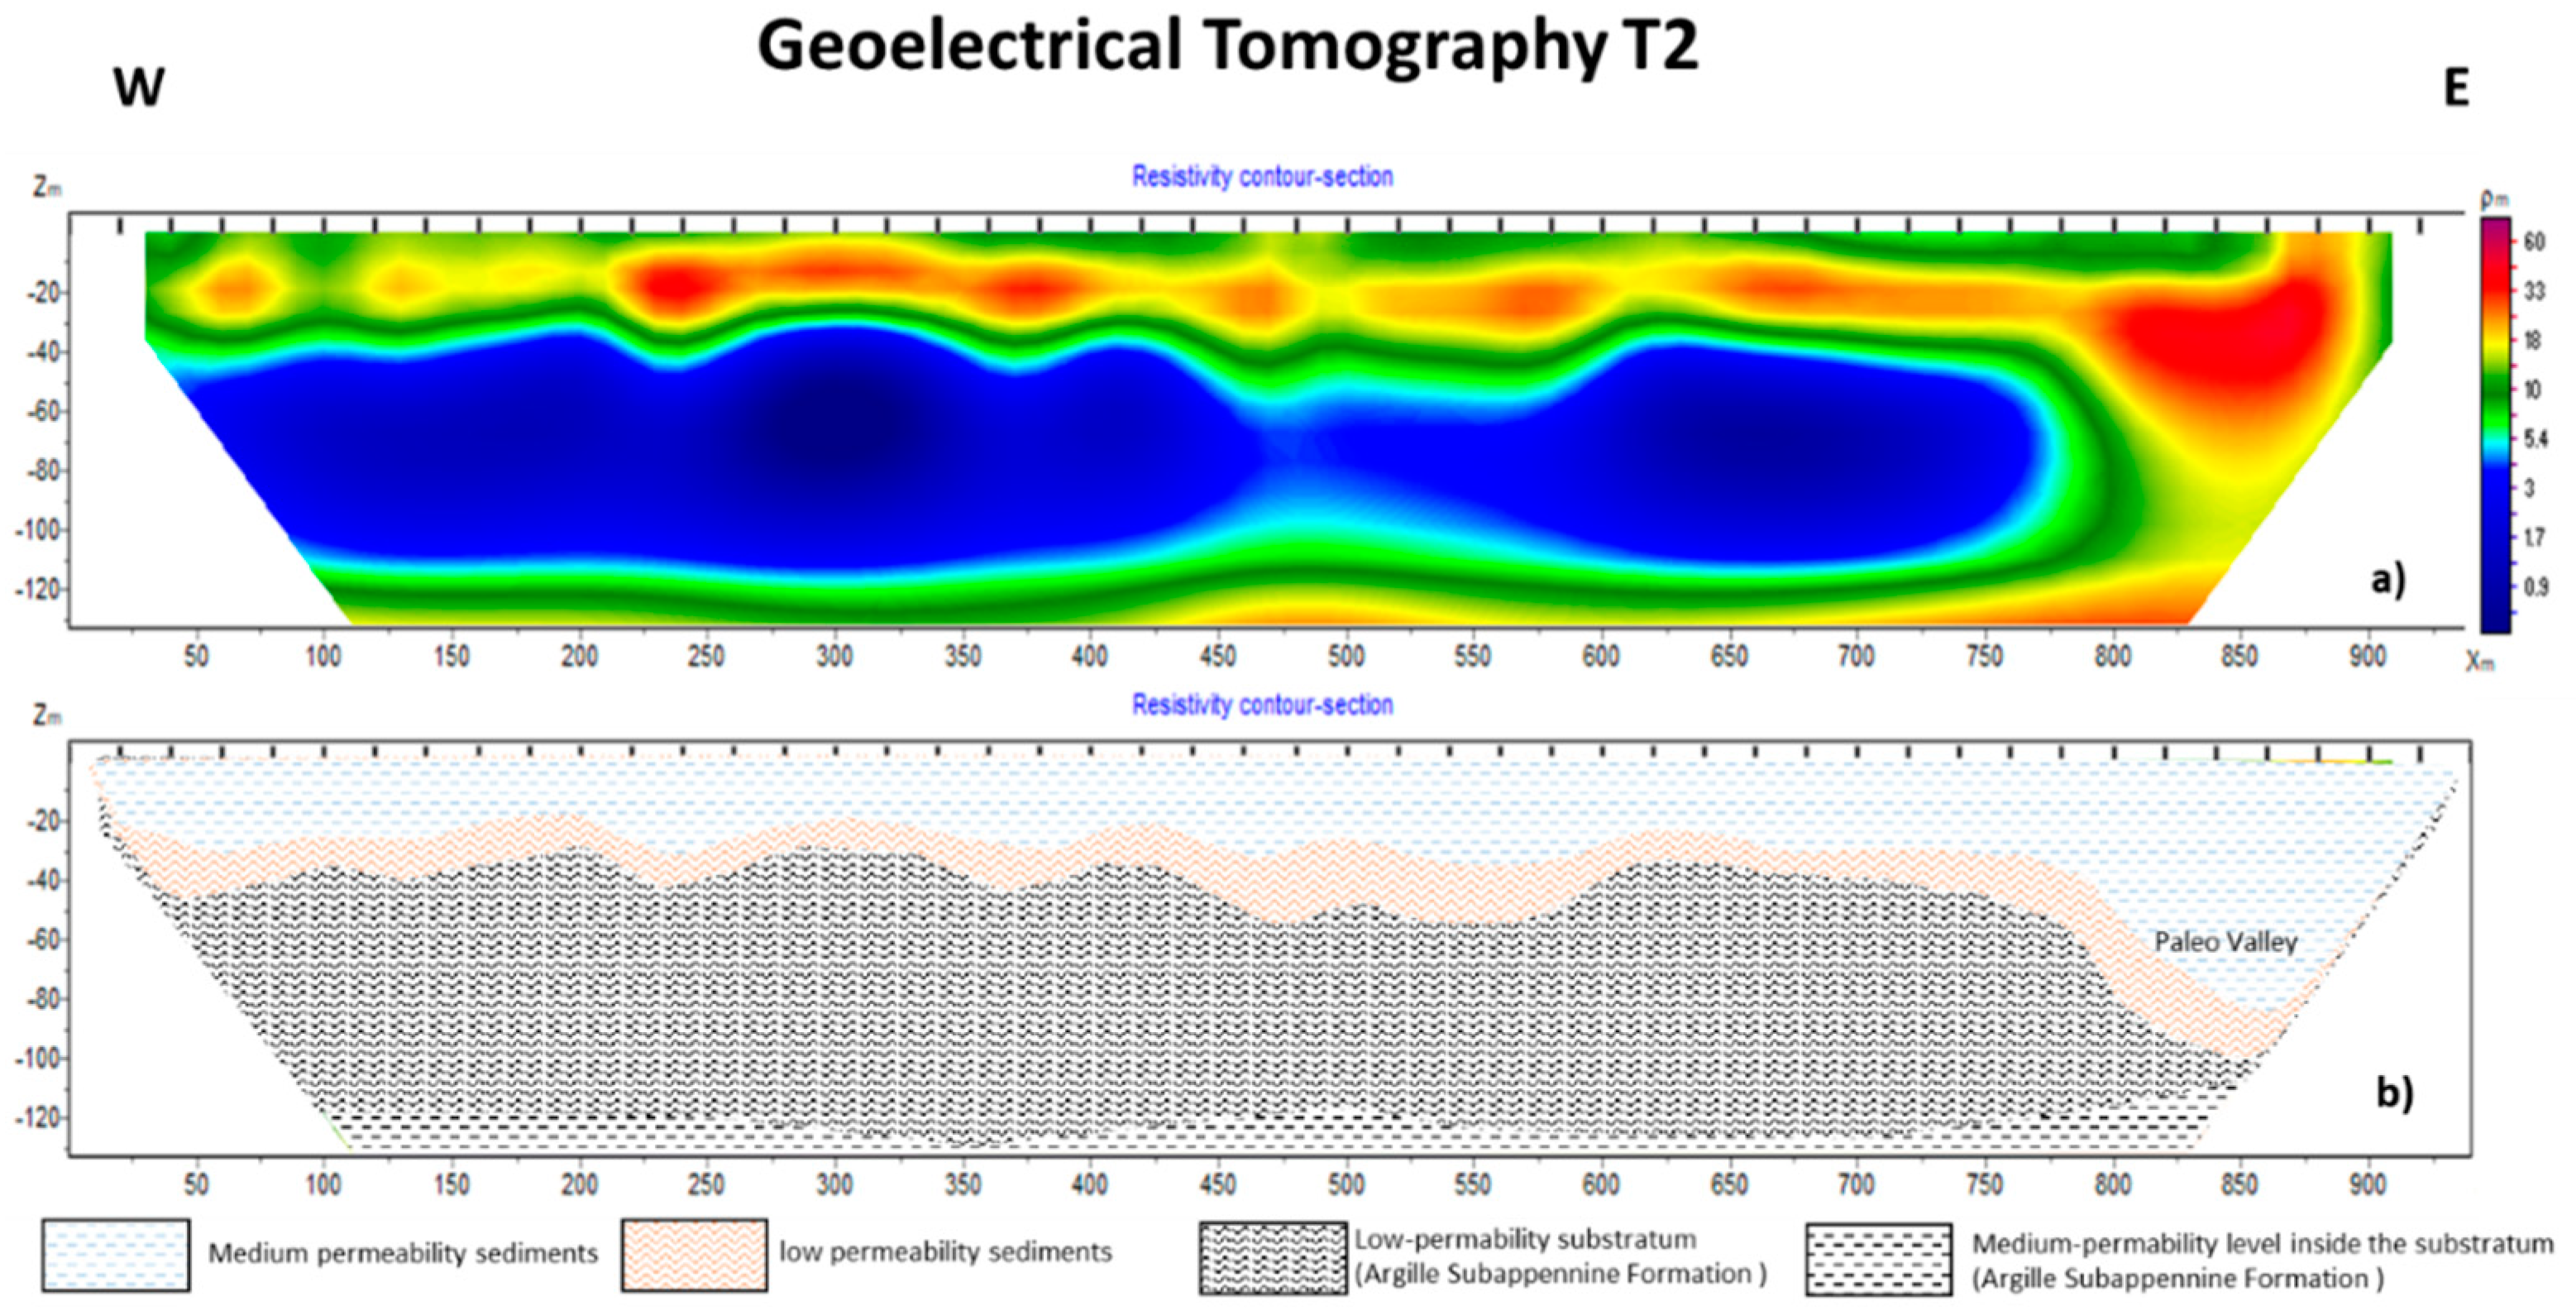
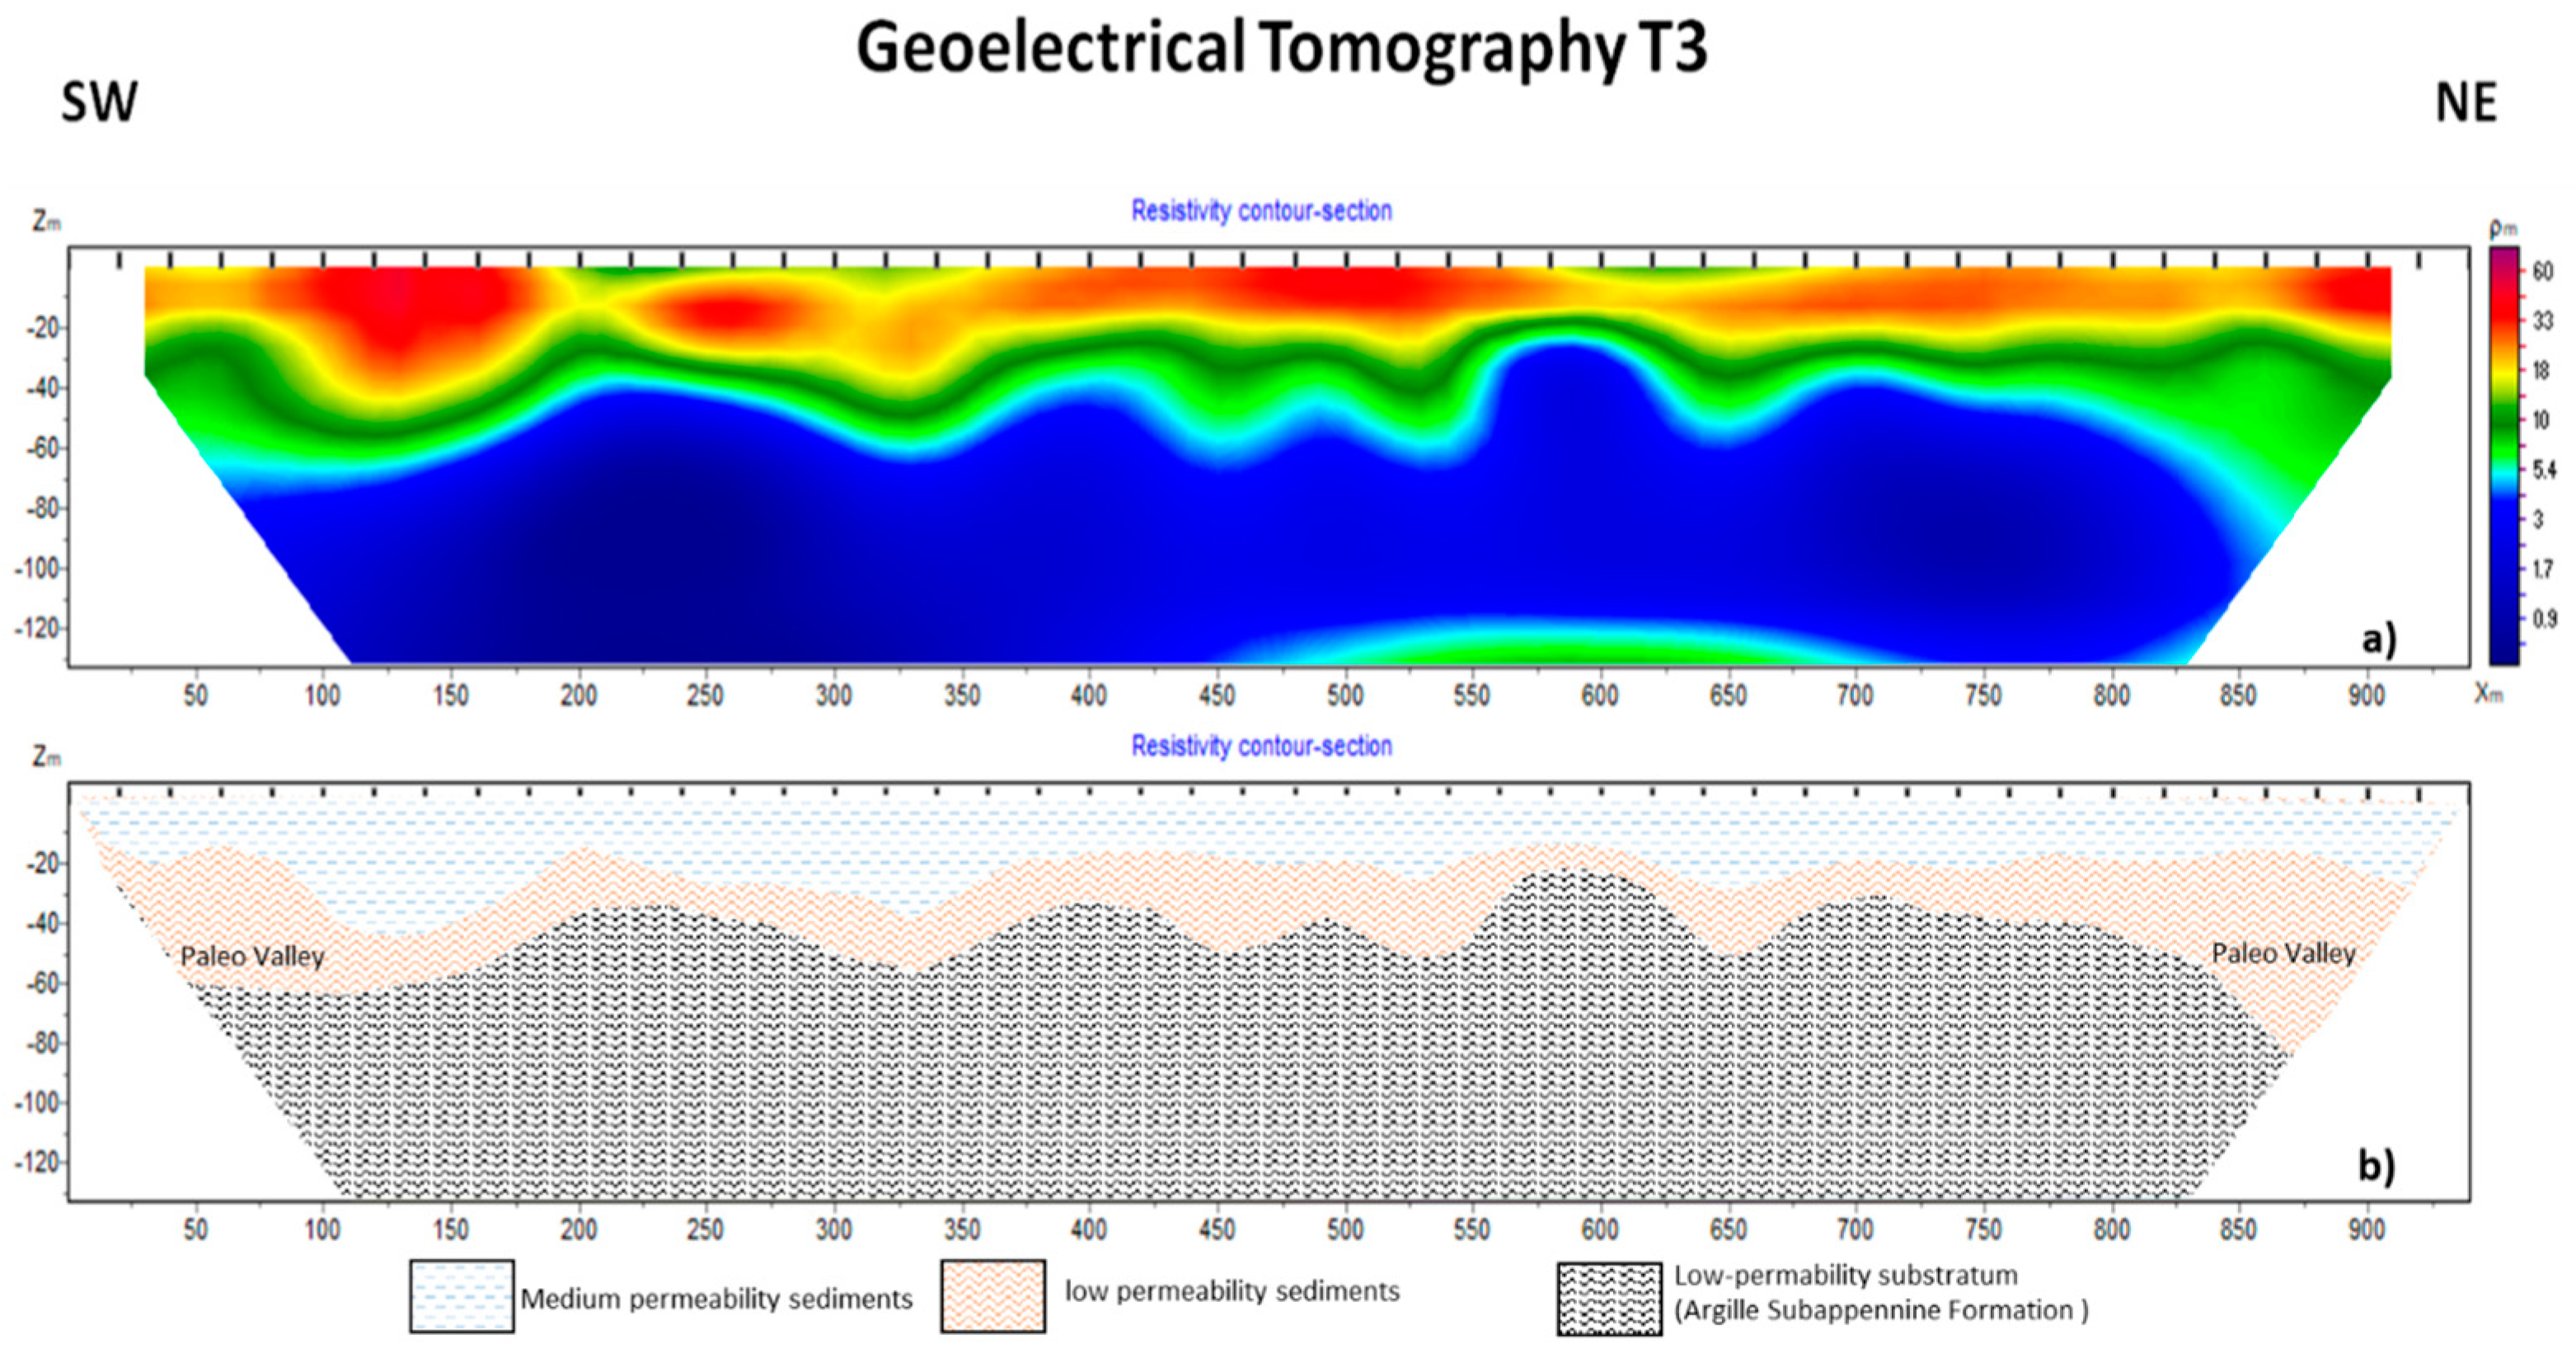
The approach was tested in a selected area characterizing the coastal aquifer bottom and the hydrochemical characteristics of groundwater, supporting the discussion of the variability of the bottom depressions and providing fresh–saline water mixing evidence. The used geophysical approach (ERT) was able to detect the detailed paleovalley patterns and the erosional morphology in the investigated area between the substratum (Subapennine Clay Formation) and the shallow filled units, which define an important rule for seawater intrusion phenomena.

3.1. Geophysical Work

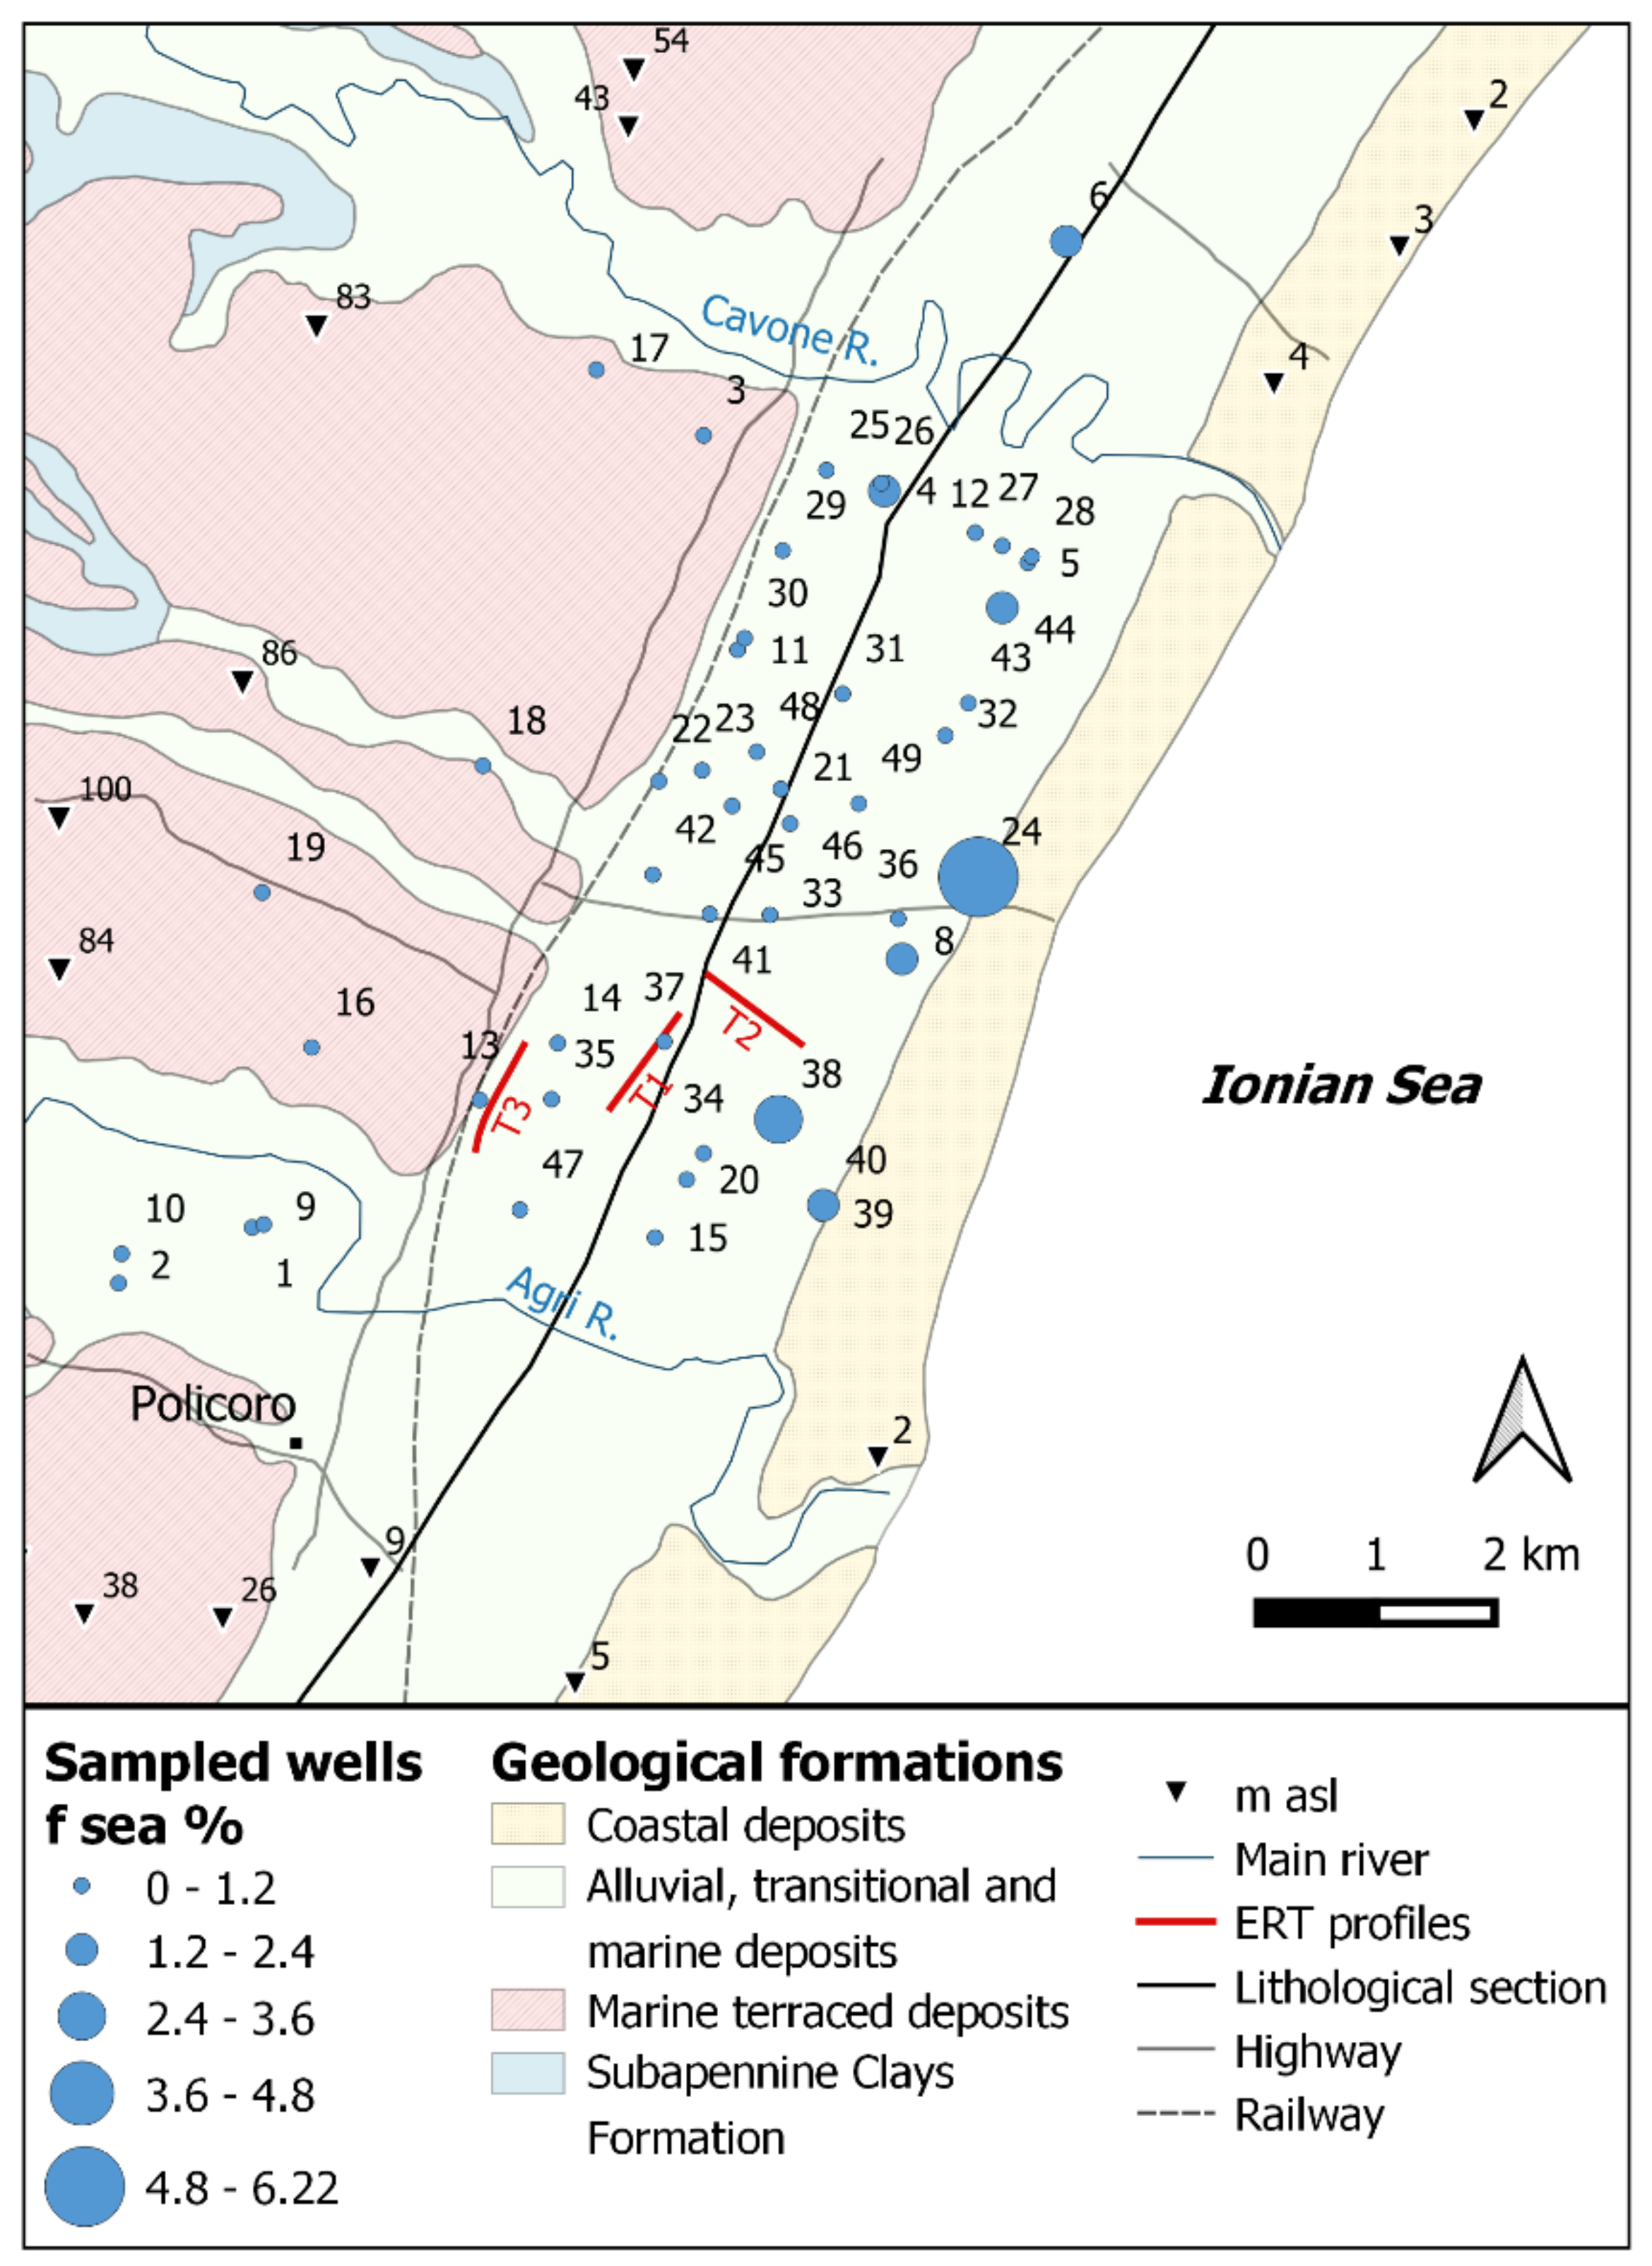
Three ERT profiles were identified between the Agri River and the Cavone River (Figure 3). They were acquired using a Syscal Pro Instruments georesistivimeter (Iris company, Orléans, France) with an electrode distance of about 20 m with 48 electrodes. Each profile is 940 m long to reach an investigation depth of about 140 m. ERT is realized by applying electrical current to the ground using well-defined electrode configurations and measuring the potential differences at the surface. ERT is used to assess the electrical resistivity distribution of the subsoil. Rock resistivity is of special interest for hydrogeological purposes as it allows, e.g., to discriminate between fresh water and salt water, between soft-rock sandy aquifers and clayey material, and between hard rock porous/fractured aquifers and low-permeable claystones and marlstones [10]. The electrode configuration affects the depth of investigation, the sensitivity to vertical and horizontal changes in the subsurface resistivity, the horizontal data coverage, and the signal strength. The data, as acquired during the survey process, are raw data that need to be elaborated to obtain the best interpretation possible. For this work, the apparent resistivity data were analyzed and converted into real resistivity values using ZondRes2D inversion software (Zond software LTD, Larnaca, Cyprus), which is a software for 2.5D interpretation of electrical resistivity tomography. The first step was preparing the data for the inversion, which involved detection of poor data. The next step was selecting the inversion type and parameters. To transform the apparent resistivity pseudosection into a model representing the distribution of the calculated electrical resistivity in the subsurface, we used the Marquardt method, which is a classic inversion algorithm using the least-square method with regularization by damping parameters [35]; after, we performed the Occam inversion. This last algorithm produces a contrast subsurface model, which is an inversion by the least-square method, using of a smoothing operator and an additional contrast minimization [36].

3.2. Hydrochemical Approach

A hydrochemical study was used to define the chemical characteristics of the water, supporting the hydrogeological conceptualization and, mainly, the macroscopic groundwater mixing [37]. The hydrochemical study focused on 49 groundwater samples for which on-site chemical–physical parameters (EC or electrical conductivity at 25 °C, T or temperature (°C) and pH) and main ions (Na+, K+, Ca2+, Mg2+, Cl, NO3−, SO42−, and HCO3) were determined. The locations of the sampling points are shown in Figure 3. The well depth ranged from 3 to 66 m (mean = 23 m).
Each sampled well was purged using a flow cell and a multi-parametric probe with EC, T, and pH sensors, withdrawing 3 water-well volumes in low flow conditions. After that, when steady parameter values were observed, the sampling was performed.
The water samples were filtered using a 0.45 µm membrane filter and then collected in double-capped 500 mL polyethylene bottles. The samples for cation analysis were acidified by the addition of HNO3 to pH < 2, whereas the samples for anion analysis were unacidified.
The main constituents of waters were determined by ion chromatography (I.C.) methods and, for separation of both cations and anions, with conductometric detection.
Total alkalinity values of the samples were determined by titration with 0.1 N HCl, to a pH end-point of 4.5.
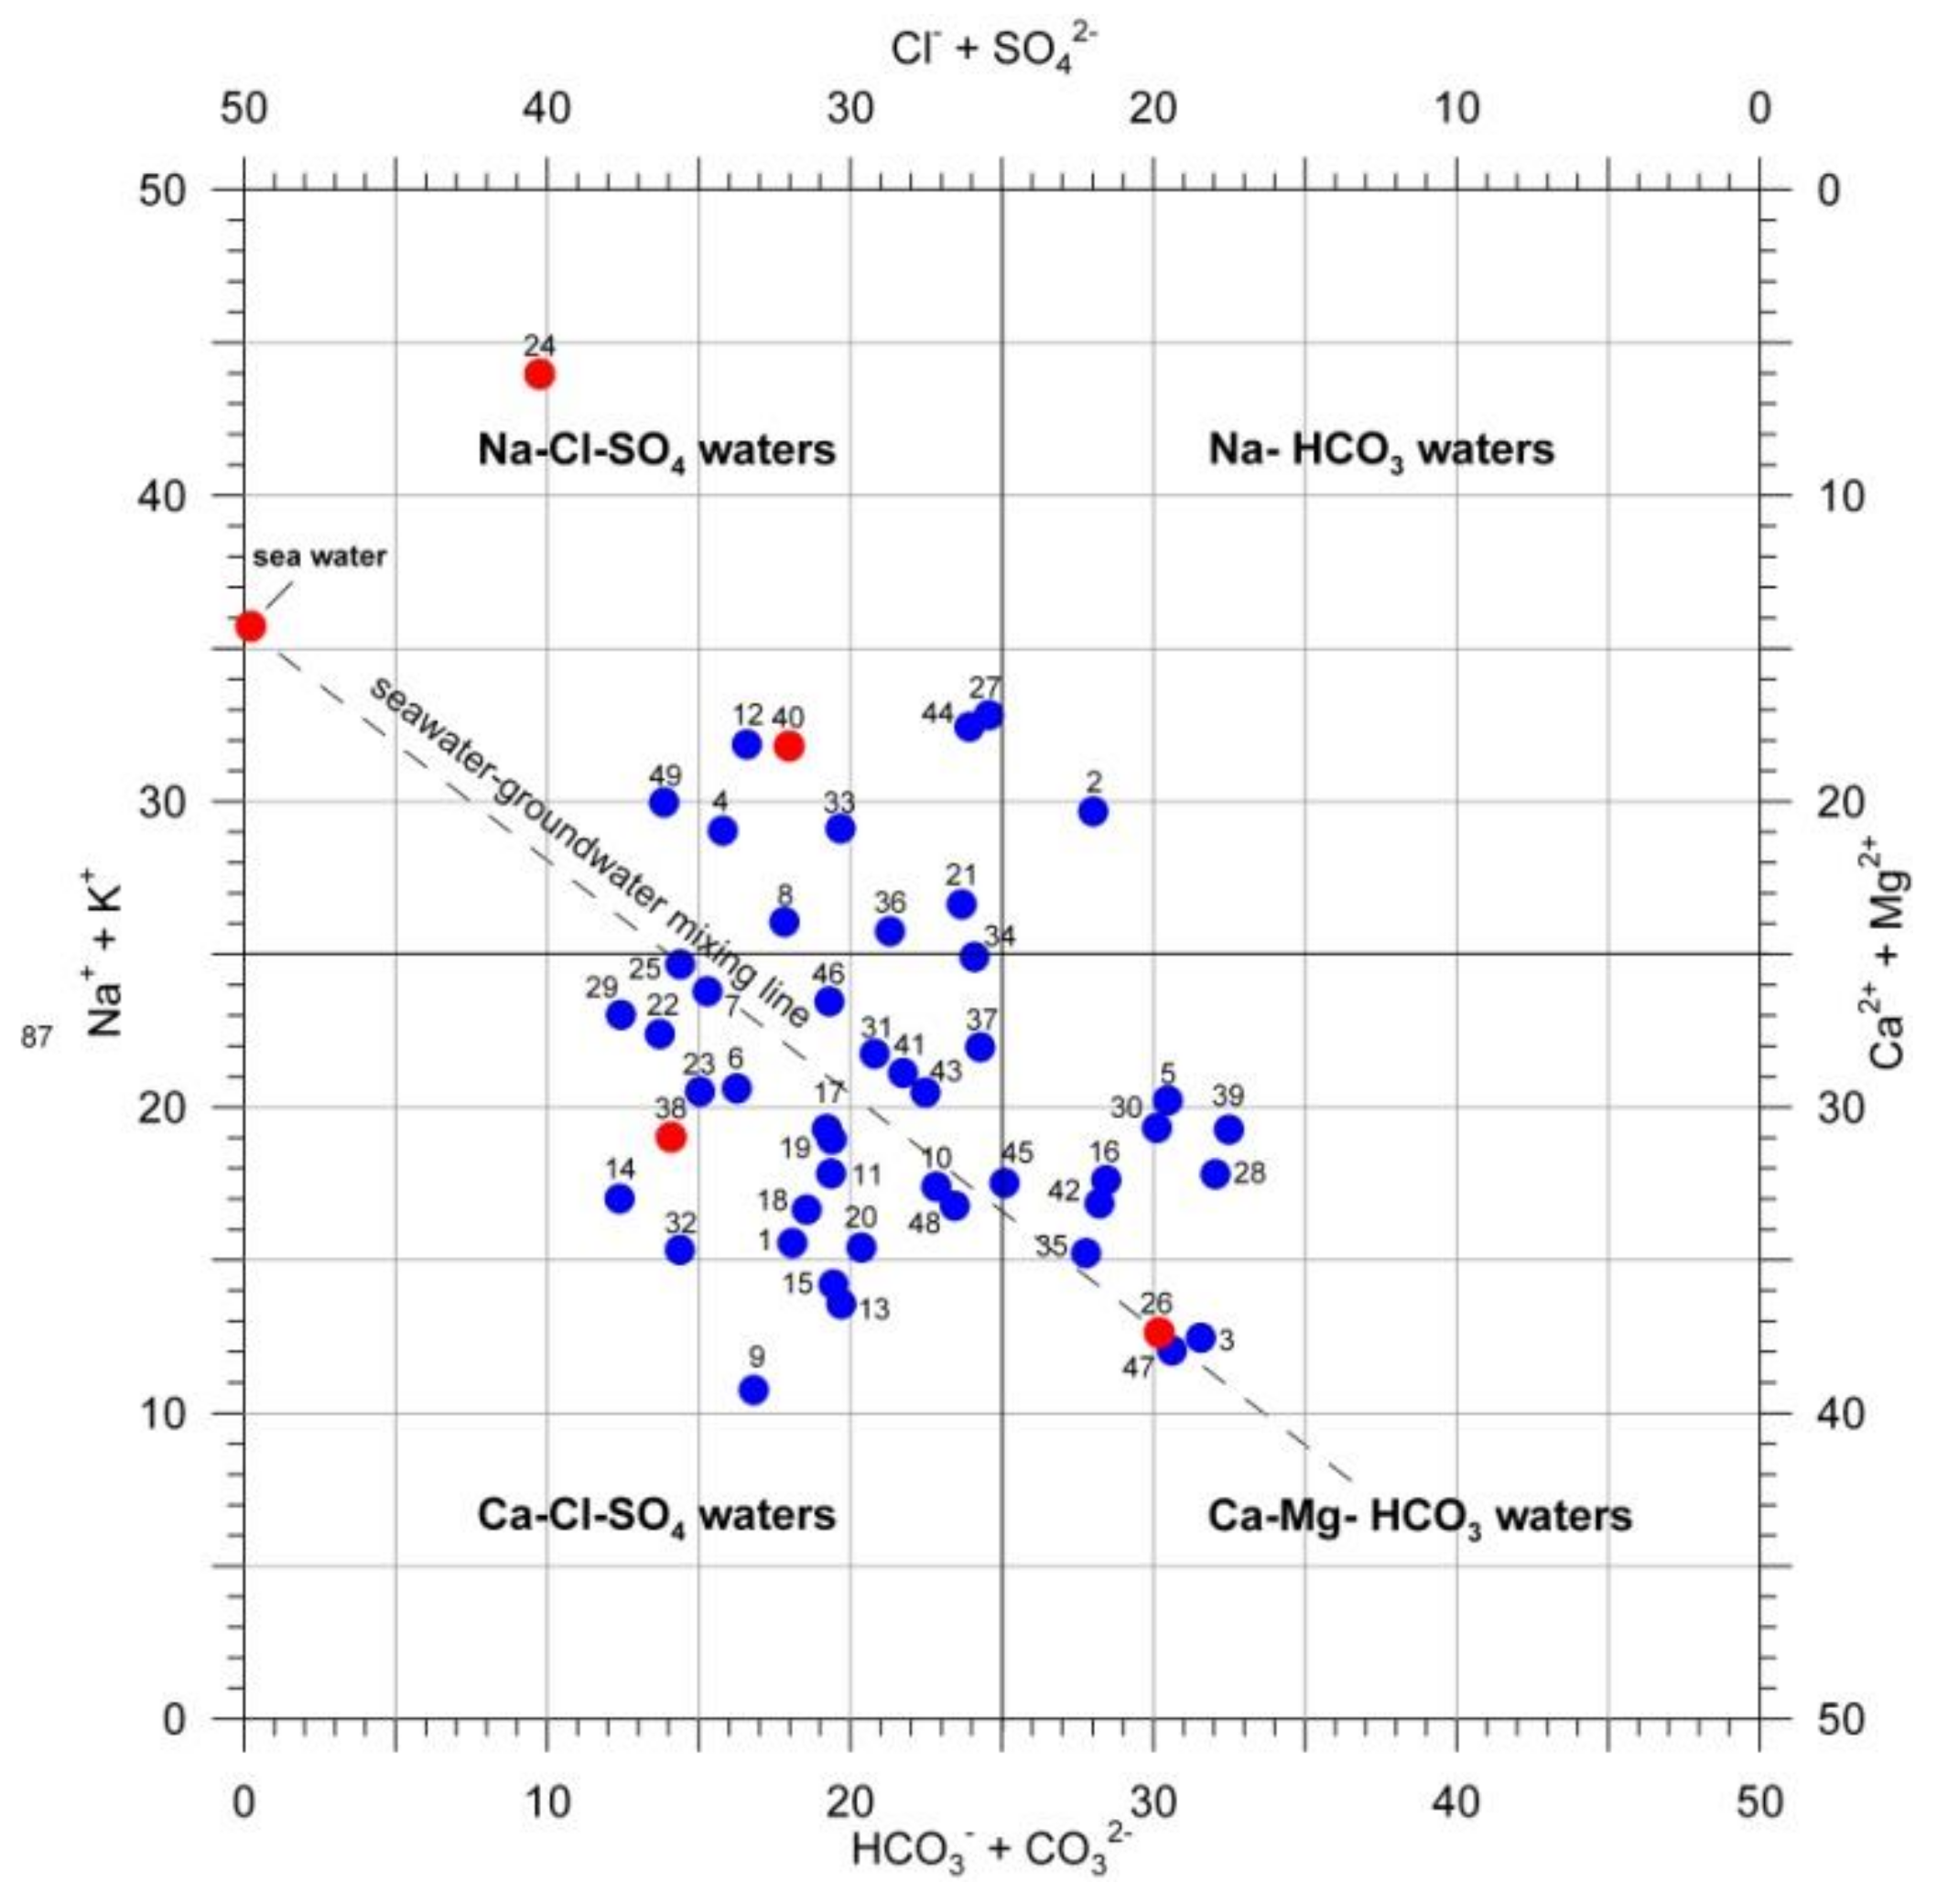
The charge balance error was used to check the quality of the analysis results, using 5% as the threshold value. The chemical groundwater classification was supported by diagrams; in the case of seawater mixing, the Langelier−Ludwig diagram is often effective [37].
The fraction of seawater (fsea) in the samples was calculated from the concentration of the chloride ions (mmol/L), considered a conservative ion in the mixing process [38], using the relationship:
f s e a = m C l , s a m p l e m C l , f r e s h m C l , s e a m C l , f r e s h .
The expected concentration of the different ions (mi,mix), resulting from mixing between fresh water and salt water, is calculated by:
m i , m i x = f s e a   ·   m i , s e a + 1 f s e a · m i , f r e s h ,
where mi,sea and mi,fresh are the concentration in seawater and freshwater of the species i, respectively. The enrichment or depletion (mi,react) of the species i is then obtained by:
m i , r e a c t = m i , s a m p l e m i , m i x ,  
where mi,react may take both positive and negative value, or be equal to zero (only mixing).
As end points, we used the seawater sample and a pure fresh groundwater sample, corresponding to well 26, which is the well with the lowest chloride concentration (0.80 meq/L).

4. Results and Discussion

4.1. Geophysical Surveys

The locations of the ERT profiles (Figure 3) were defined mainly to improve the accuracy of local knowledge of the aquifer bottom depth, verifying if it is relevant in terms of salinity variability and fresh−saline water mixing. In detail, the three geoelectrical profiles were acquired in two different paleogeographic zones: T1 and T2, in the middle of the plain alluvial deposits and along the two main directions: across and parallel the coastal line, close to the small paleovalley identified on the geological section in Figure 2, and the large one identified below the Cavone River in Figure 2; and T3, close to the foot of the marine terraced deposits and parallel to their boundary (Figure 3).
The T1 profile runs along the SW−NE direction (Figure 3). It highlights three main electrostratigraphic units (Figure 4): a shallow one, 20–25 m thick with resistivity values >30 Ωm; a geoelectrical electrolayer with resistivity values between the 10 and 30 Ωm; and a deep and very conductive layer (<5 Ωm). The boundaries between each one are not regular and are between 550 and 650 m. From the beginning of the profile, a large valley shape was well detected.
From a stratigraphic point of view, the first two shallow electrical layers could be related to the deposits of the upper unit with medium- and low-permeability sediments, as described previously [25], which consists of silt, sand, and gravel deposits. The deep one should be associated with the clayey substratum formation of the Subapennine Clays, with the lowest hydraulic conductivity. A peculiarity of the electrical image is the irregular shape of the contact zone of the two layers, highlighting the erosion surface of the clayey substratum, where some large paleovalleys occur. From Figure 2, several large paleovalleys were interpreted from the borehole data and the previous geophysical investigations [15,28], but a detailed geophysical investigation could improve the detection of the erosional structures. The results of the T1 ERT profile localized a main paleovalley, which seems to include medium- and low-permeability sediments, sandy gravels and/or pebbles, or, secondly, conglomerates, coherent with previous results [25]. Finally, the intermediate electrolayer (with electrical resistivity value between 10 and 30 Ωm) defines a low-permeability subsoil, but it could also be interpreted as a geological layer with salty water pore. Therefore, an increase in the detailed available borehole analysis will be necessary to improve this interpretation.
The T2 geoelectrical profile was identified along the W–E direction (Figure 3). The location of the T2 profile was defined by considering the geological section in Figure 2. The T2 electrical resistivity tomography profile highlights four different electrostratigraphic units (Figure 5). The shallow one shows relatively high electrical resistivity values (>30 Ωm) from ground surface to 20–25 m in depth. A relative conductive layer is located below the previous one and shows low resistivity values between 10 and 30 Ωm, ranging from 25 to 40 m in depth. The deep electrostratigraphic layer is very conductive (>5 Ωm) and an increase in the resistivity values is defined at this depth.
From the geological section in Figure 2, the location of the ERT profile is roughly close to the paleovalley below the Cavone River. Therefore, the geoelectrical data could be associated with the sediment deposited in that geological area (Figure 5b). The shallow electrostratigraphic unit could be associated with the silt, sand, and gravel lithology of the alluvial plain with medium and low hydraulic values. The deep layer could be associated with the substratum with very low-permeability sediments (substratum clay formation). On the contrary, the deepest thin layer could be associated with a large sandy layer (medium permeability sediments) included in the substratum formation. The erosion morphology between the substratum and the alluvial sediments was well highlighted. Finally, a deep paleovalley was detected at the east site of the profile. As with the previous interpretation, the intermediate electrostratigraphic unit (resistivity values between 10 and 30 Ωm) could also be associated with the presence of salty pore water.
The T3 ERT profile was identified along the SW−NE direction (Figure 3). As with the previous ERT profiles, three main electrostratigraphic units were highlighted (Figure 5): a shallow one (20−25 m deep) with resistivity values >30 Ωm; below, one with resistivity values between 10 and 30 Ωm, and a deep one with geoelectrical values <10 Ωm. The ERT profile also highlights a diffuse erosion surface between the substratum and the alluvial deposits, and two main valleys at the beginning and at the end of the profile were well detected. The geological interpretation is shown in Figure 6b, and the geological section highlights the shallow deposits of the upper unit and the deep clayey substratum formation of the Subapennine Clays, with the lowest permeability and two large paleovalleys. The paleovalleys are characterized by medium- and low-permeability sediments (Figure 5b). The intermediate electrolayer (resistivity values between 10 and 30 Ωm) could also be associated with the presence of salty pore water.
Considering the whole geophysical results together, the widespread use of these surveys could permit shaping the medium- and low-permeability sediments and recognizing the main patterns (small and large erosional valleys) in detail, which pay an important role in the seawater intrusion phenomena.

4.2. Chemical Features of Groundwater

The descriptive statistics for groundwater are provided in Table 1. The charge balance errors for the analyses were <5%. The chemical groundwater classification can be obtained from the Langelier−Ludwig diagram [37].
The chemical facies of groundwater are shown using the Langelier−Ludwig diagram (Figure 7). The first group of samples (right-bottom) shows a Ca–Mg–HCO3 composition, the second group shows a Ca–Cl–SO42− composition, and the third group shows a Na–Cl–SO42− composition. Sample 2 was the only one that showed a Na–HCO3 composition.
The theoretical pure mixing line was plotted and compared to the whole dataset (Figure 7). It showed that the geochemical variability can be mainly explained in terms of fresh–saline water mixing or seawater intrusion. The rest of the variability seems to be due to other geochemical phenomena, indicating the role of the different aquifer types to the recharge, the relationships with soil cover, the deep drainage system of the reclamation works, and the surface water system [22,32]. Regardless, the geochemical results showed that seawater intrusion affects the MCP groundwater quality, having significant effects closer to the coast.
The mixing ratio was calculated and is plotted in Figure 3. The minimum and the mean fraction of seawater (fsea%) values were 0.04 and 0.80, respectively. The highest values were observed close to the coast, specifically in wells 24 (fsea% = 6.2), 38, and 40. The fsea% trend increased moving from inland coastward, confirming the role of seawater intrusion. Focusing on the ERT area, the fsea% results are shown in Table 2. The fresh−saline groundwater mixing ratio was between 0.3% and 0.8% close to the three ERT profiles.
These results are in good agreement with other similar international experiences. In the case of the main USA coastal aquifers, the mean fsea% values observed close to the coast ranged generally from 8 to 10 [39]. In the case of the coastal springs of Taranto (Figure 1b), located in the Ionian Sea not far from Metaponto, the fsea% range was from 5 to 7 [40].
These values showed that the fresh−saline mixing was not negligible so far from the coast, confirming the negative role of the paleovalley on the groundwater salinization risk.
The whole study area is subject to seawater intrusion, not only very close to the coastline, as shown by previous researches based only on geophysical tools [15,28,29]. The seawater intrusion can be considered the main source of salinization risk in the Metaponto coastal plain.

5. Conclusions

The excessive groundwater withdrawals occurring due to global changes are disrupting the equilibrium between fresh and saline groundwater due to seawater intrusion, thus enhancing the lateral and upconing movement of brackish groundwater and the subsequent salinization of fresh groundwater. These phenomena could be amplified in some areas where, due to peculiar geological and structural conditions, some preferential pathways are formed that facilitate the intrusion of seawater inland, as in the case of the Metaponto coastal plain.
The results obtained from different investigation techniques highlight the seawater intrusion behaviour with geochemical tools, and the complexity of the hydrostratigraphic features of the Metaponto coastal plain with the electrical resistivity tomographies. As confirmed by the used tools, the articulated morphology, the reason for the proneness to lateral seawater intrusion, increases the vulnerability to seawater intrusion far from the coast. For developing methodologies and knowledge for the safeguarding of MCP groundwater resources, the multidisciplinary approach adopted can be useful for resource management purposes, e.g., to prevent upconing effects where they might be unexpected. The detailed use of the ERT approach with an optimal compromise between electrode distance and profile length produced a deep characterization of the MCP. The ERT results highlighted the complexity of the erosion phenomena that characterize the MCP subsurface. The previous geological knowledge of the subsurface stratigraphy/hydrostratigraphy was improved, indicating new erosion incisions, which could be considered of secondary importance from the global geological plain characterization perspective, but are essential to prevent salinization effects due to seawater intrusion. The previous works highlighted a good spatial analysis by HVSR methodology to define a synoptic map of the erosion substratum and the main paleovalley shapes [16,17]. If the previous shallow ERT experiences were important to enlarge the knowledge in terms of seawater intrusion very close to the MCP coastline, the results of this paper highlight how the use of deep ERT applications can detect in details the complexity of the hydrostratigraphy in terms of incision shapes and paleovalley formation, where medium/high-permeability sediments are widespread located. These morphologic structures could be the major source of salinization risks for seawater intrusion, to be considered a key point for any management tools.
The obtained results demonstrate the opportunity to continue and strengthen the research on this aquifer. Further research efforts should pursue the integration of different methods, with the aim of meeting the need to affordably manage seawater intrusion: increase the knowledge of the geometric features of the aquifer, and monitor and interpret water level, water quality conditions, and trends.
The widespread use of geophysical approaches continuously offers new possibilities to improve the knowledge of aquifer boundaries. The ERT approach in this work showed the need to define the relationship between the depth of investigation and lateral resolution to detect large erosion features (paleovalleys) in deep substrata, which are the most important vehicle for the seawater intrusion. Comparing the results of previous geophysical works with ours, we observed how the site-specific approach in this field is fundamental. Therefore, the next steps will consider the specificity of each site, improving the integration of borehole, geochemical, and geophysical methods. The deepest available boreholes will be selected for salinity logging, supporting the refining of the geophysical results and improving the bounding of the brackish groundwater body along the paleovalleys. Stable isotopes and more specific chemical parameters, e.g., bromide, iodide, etc., will be used to increase the knowledge of the geochemical processes that secondly affect groundwater salinity variability, providing further support to groundwater resources management tools. Finally, the next steps will introduce in our project an integration work between the geochemical and the geophysical data, with the aim of using the direct values to constrain the geophysical ones defining a large deep spatial estimation of the seawater intrusion in MCP.

Author Contributions

Data curation, R.M., L.C., V.G., G.D.G., L.E.Z., and E.R.; investigation, L.C., V.G., E.R., G.D.G., L.E.Z., and M.P.; formal data analysis, R.M., E.R., G.D.G., and L.E.Z.; methodology, R.M., F.S., F.C., E.R., and M.P.; writing—original draft R.M. and M.P.; writing—review R.M., M.P., E.R., F.C., F.S., L.C., V.G., G.D.G., and L.E.Z.; funding acquisition and project administration F.S. and M.P.; funding acquisition for geoelectrical prospection E.R.; supervision M.P. All authors have read and agreed to the published version of the manuscript.

Funding

The paper was partially supported by the Ipazia d’Alessandria Research Center, located in Metaponto (MT), Italy, through the Joint Research Agreement between ENI and CNR (Italian National Research Council). The geoelectric acquisition was supported by CNR—IMAA.

Institutional Review Board Statement

Not applicable.

Informed Consent Statement

Not applicable.

Data Availability Statement

The data presented in this study are available on request from the corresponding author.

Acknowledgments

The paper was carried out in the framework of the Ph.D. project “Optimal management of coastal groundwater resources focusing on salinization and subsidence risks” (School of Engineering, University of Basilicata—Ph.D. student: Rosalba Muzzillo).

Conflicts of Interest

The authors declare no conflict of interest.

References

  1. Polemio, M.; Walraevens, K. Recent research results on groundwater resources and saltwater intrusion in a changing environment. Water 2019, 11, 1118. [Google Scholar] [CrossRef] [Green Version]
  2. Barlow, P.M. Ground Water in Fresh Water-Salt Water Environments of the Atlantic Coast; U.S. Geological Survey: Denver, CO, USA, 2003.
  3. Vespasiano, G.; Apollaro, C.; Marini, L.; Dominici, R.; Cianflone, G.; Romanazzi, A.; Polemio, M.; De Rosa, R. Hydrogeological and isotopic study of the multi-aquifer system of the Sibari Plain (Calabria, Southern Italy). Rend. Online Soc. Geol. Ital. 2016, 39, 134–137. [Google Scholar] [CrossRef]
  4. Polemio, M.; Zuffianò, L.E. Review of Utilization Management of Groundwater at Risk of Salinization. J. Water Resour. Plan. Manag. 2020, 146. [Google Scholar] [CrossRef]
  5. Stewart, M.T. Geophysical investigations. In Seawater Intrusion in Coastal Aquifers. Concepts, Methods and Practices; Bear, J., Cheng, A.H.-D., Sorek, S., Ouazar, D., Herrera, I., Eds.; Kluwer Academic Publishers: Dordrecht, The Netherlands, 1999; pp. 9–50. [Google Scholar]
  6. Kazakis, N.; Pavlou, A.; Vargemezis, G.; Voudouris, K.S.; Soulios, G.; Pliakas, F.; Tsokas, G. Seawater intrusion mapping using electrical resistivity tomography and hydrochemical data. An application in the coastal area of eastern Thermaikos Gulf, Greece. Sci. Total Environ. 2016, 543, 373–387. [Google Scholar] [CrossRef]
  7. Goldman, M.; Kafri, U. Hydrogeophysical applications in coastal aquifers. In Applied Hydrogeophysics; Vereecken, H., Binley, A., Cassiani, G., Revil, A., Titov, K., Eds.; Springer: Dordrecht, The Netherlands, 2006; pp. 233–254. [Google Scholar]
  8. Nguyen, F.; Kemna, A.; Antonsson, A.; Engesgaard, P.; Kuras, O.; Ogilvy, R.; Gisbert, J.; Jorreto, S.E.; Pulido-Bosch, A. Characterization of seawater intrusion using 2D electrical imaging. Near Surf. Geophys. 2009, 7, 377–390. [Google Scholar] [CrossRef] [Green Version]
  9. Bouzaglou, V.; Crestani, E.; Salandin, P.; Gloaguen, E.; Camporese, M. Ensemble Kalman Filter Assimilation of ERT Data for Numerical Modeling of Seawater Intrusion in a Laboratory Experiment. Water 2018, 10, 397. [Google Scholar] [CrossRef] [Green Version]
  10. Kirsch, R. Groundwater Geophysics—A Tool for Hydrogeology; Springer: Dordrecht, The Netherlands, 2009. [Google Scholar]
  11. Hasan, M.; Shang, Y.; Jin, W.; Shao, P.; Yi, X.; Akhter, G. Geophysical Assessment of Seawater Intrusion into Coastal Aquifers of Bela Plain, Pakistan. Water 2020, 12, 3408. [Google Scholar] [CrossRef]
  12. Aladejana, J.A.; Kalin, R.M.; Sentenac, P.; Hassan, I. Hydrostratigraphic Characterisation of Shallow Coastal Aquifers of Eastern Dahomey Basin, S/W Nigeria, Using Integrated Hydrogeophysical Approach; Implication for Saltwater Intrusion. Geosciences 2020, 10, 65. [Google Scholar] [CrossRef] [Green Version]
  13. Costall, A.; Harris, B.; Pigois, J.P. Electrical resistivity imaging and the saline water interface in high-quality coastal aquifers. Surv. Geophys. 2018, 39, 753–816. [Google Scholar] [CrossRef] [Green Version]
  14. De Franco, R.; Biella, G.; Tosi, L.; Teatini, P.; Lozej, A.; Chiozzotto, B.; Giada, M.; Rizzetto, F.; Claude, C.; Mayer, A.; et al. Monitoring the saltwater intrusion by time lapse electrical resistivity tomography: The Chioggia test site (Venice Lagoon, Italy). J. Appl. Geophys. 2009, 69, 117–130. [Google Scholar] [CrossRef]
  15. Satriani, A.; Loperte, A.; Proto, M. Electrical resistivity tomography for coastal salt water intrusion characterization along the Ionian coast of Basilicata region (southern Italy). IWTJ 2011, 1, 83–90. [Google Scholar]
  16. Tropeano, M.; Cilumbriello, A.; Grippa, A.; Sabato, L.; Bianca, M.; Gallicchio, S.; Gallipoli, M.R.; Mucciarelli, M. Stratigraphy of the subsurface of the Metaponto Plain vs a geophysical 3D view of the late Pleistocene incised-valleys (Basilicata, Southern Italy). Rend. Online Soc. Geol. Ital. 2011, 17, 187–193. [Google Scholar]
  17. Tropeano, M.; Cilumbriello, A.; Sabato, L.; Gallicchio, S.; Grippa, A.; Longhitano, S.G.; Bianca, M.; Gallipoli, M.R.; Mucciarelli, M.; Spilotro, G. Surface and subsurface of the Metaponto coastal plain (Gulf of Taranto—southern Italy): Present-day- vs LGM-landscape. Geomorphology 2013, 203, 115–131. [Google Scholar] [CrossRef]
  18. Masciopinto, C.; Polemio, M. La ricarica naturale della falda idrica dell’acquifero costiero di Metaponto. Quad. Geol. Appl. 1994, 2, 399–406. [Google Scholar]
  19. Bear, J. Dynamics of Fluids in Porous Media; American Elsevier: New York, NY, USA, 1972; p. 764. [Google Scholar]
  20. Radina, B. Idrogeologia del Bacino del Fiume Basento. In Memorie degli Istituti di Geologia e Mineralogia dell’Università di Padova; Società Cooperativa Tipografica: Padova, Italy, 1969; p. 52. [Google Scholar]
  21. Parea, G.C. I terrazzi marini tardo-pleistocenici del fronte della catena appenninica in relazione alla geologia dell’avanfossa adriatica (The Late Pleistocene marine terraces in front of the Apennines in relation to the geology of Adriatic Foredeep). Mem. Soc. Geol. Ital. 1986, 35, 913–936. [Google Scholar]
  22. Polemio, M.; Limoni, P.P.; Mitolo, D.; Santaloia, F. Characterisation of the ionian-lucanian coastal plain aquifer (Italy). Bol. Geol. Min. 2003, 114, 225–236. [Google Scholar]
  23. Pescatore, T.; Pieri, P.; Sabato, L.; Senatore, M.R.; Gallicchio, S.; Boscaino, M.; Cilumbriello, A.; Quarantiello, R.; Capretto, G. Stratigrafia dei depositi pleistocenico-olocenici dell’area costiera di Metaponto compresa fra Marina di Ginosa ed il Torrente Cavone (Italia meridionale): Carta geologica in scala 1:25.000. Il Quat. Ital. J. Quat. Sci. 2009, 22, 307–324. [Google Scholar]
  24. Cocco, E.; Cravero, E.; Di Geronimo, S.; Mezzadri, G.; Parea, G.C.; Pescatore, T.; Valloni, R.; Vinci, A. Lineamenti geomorfologici e sedimentologici del litorale alto ionico (Golfo di Taranto). Boll. Soc. Geol. It. 1975, 94, 993–1051. [Google Scholar]
  25. Cilumbriello, A.; Sabato, L.; Tropeano, M.; Gallicchio, S.; Grippa, A.; Maiorano, P.; Mateu-Vicens, G.; Rossi, C.A.; Spilotro, G.; Calcagnile, L.; et al. Sedimentology, stratigraphic architecture and preliminary hydrostratigraphy of the Metaponto coastal-plain subsurface (Southern Italy). In Proceedings of the National Workshop Multidisciplinary Approach for Porous Aquifer Characterization; Bersezio, R., Amanti, M., Eds.; Memorie descrittive della Carta Geologica d’Italia: Rome, Italy, 2010; pp. 67–84. [Google Scholar]
  26. Polemio, M.; Ricchetti, E. Caratteri idrogeologici dell’acquifero della piana costiera di Metaponto (Basilicata). Ric. Sci. Istr. Perm. 1991, 93, 417–426. [Google Scholar]
  27. Pastore, N.; Cherubini, C.; Doglioni, A.; Giasi, C.I.; Simeone, V. Modelling of the Complex Groundwater Level Dynamics during Episodic Rainfall Events of a Surficial Aquifer in Southern Italy. Water 2020, 12, 2916. [Google Scholar] [CrossRef]
  28. Satriani, A.; Loperte, A.; Imbrenda, V.; Lapenna, V. Geoelectrical surveys for characterization of the coastal saltwater intrusion in Metapontum forest reserve (southern Italy). Int. J. Geophys. 2012, 2012, 238478. [Google Scholar] [CrossRef] [Green Version]
  29. Imbrenda, V.; Coluzzi, R.; Lanfredi, M.; Loperte, A.; Satriani, A.; Simoniello, T. Analysis of landscape evolution in a vulnerable coastal area under natural and human pressure. Geomat. Nat. Hazards Risk 2018, 9, 1249–1279. [Google Scholar] [CrossRef] [Green Version]
  30. Spilotro, G. Erosion profile of the Blue Clay bedrock along the Ionian coast of the Basilicata Region. Quat. Nova 2004, 8, 247–261. [Google Scholar]
  31. Grippa, A.; Bianca, M.; Tropeano, M.; Cilumbriello, A.; Gallipoli, M.R.; Mucciarelli, M.; Sabato, L. Use of the HVSR method to detect buried paleomorphologies (filled incised-valleys) below a coastal plain: The case of the Metaponto Plain (Basilicata, southern Italy). Boll. Geofis. Teor. Appl. 2011, 52, 225–240. [Google Scholar]
  32. Polemio, M.; Limoni, P.P.; Mitolo, D.; Santaloia, F.; Virga, R. Nitrate pollution and quality degradation of Ionian coastal groundwater (Southern Italy). In Nitrates in Groundwater; Razowska-Jaworek, L., Sadurski, A., Eds.; Balkema: Rotterdam, The Netherlands, 2005; pp. 163–176. [Google Scholar]
  33. Petrucci, O.; Polemio, M. Flood Risk Mitigation and Anthropogenic Modifications of a Coastal Plain in Southern Italy: Combined Effects over the Past 150 Years. Nat. Hazards Earth Syst. Sci. 2007, 7, 361–373. [Google Scholar] [CrossRef] [Green Version]
  34. Pellicani, R.; Argentiero, I.; Fidelibus, M.D.; Motta Zanin, G.; Parisi, A.; Spilotro, G. Dynamics of the Basilicata Ionian Coast: Human and Natural Drivers. Rend. Lincei Sci. Fis. Nat. 2020, 31, 353–364. [Google Scholar] [CrossRef]
  35. Marquardt, D.W. An Algorithm for Least Squares Estimation of Nonlinear Parameters. J. Soc. Indust. Appl. Math. 1963, 11, 431–441. [Google Scholar] [CrossRef]
  36. Constable, S.C.; Parker, R.L.; Constable, C.G. Occam’s inversion: A practical algorithm for generating smooth models from electromagnetic sounding data. Geophysics 1987, 52, 289–300. [Google Scholar] [CrossRef]
  37. Custodio, E.; Llamas, M.R. Hydrologia Subterranea; Omega: Barcelona, Spain, 1996. [Google Scholar]
  38. Appelo, C.A.J.; Postma, D. Geochemistry, Groundwater and Pollution; CRC Press: London, UK, 2004; p. 683. [Google Scholar]
  39. Lotfata, A.; Ambinakudige, S. Degradation of groundwater quality in the coastal aquifers of the USA. Sustain. Water Resour. Manag. 2020, 6, 41. [Google Scholar] [CrossRef]
  40. Zuffianò, L.E.; Basso, A.; Casarano, D.; Dragone, V.; Limoni, P.P.; Romanazzi, A.; Santaloia, F.; Polemio, M. Coastal Hydrogeological System of Mar Piccolo (Taranto, Italy). Environ. Sci. Pollut. Res. 2015, 23, 12502–12514. [Google Scholar] [CrossRef]
Figure 1. Geology and location maps. (a) Schematic structural map of Italy and location of (b); (b) schematic structural map of Southern Italy and location of (c); (c) schematic geological map of the Metaponto coastal plain (MCP) and location of the lithological section (Figure 2) and the selected study area (Figure 3).
Water 13 00053 g001
Figure 2. Schematic lithological section (modified from [22]): (1) soil; (2) clay or silty clay (yellow, brown, grey); (3) pebbles in a sandy and/or clayey matrix; (4) grey sands with clayey strata; (5) sands and/or silty sands; (6) piezometric surface (m a.s.l.); (7) pattern of the coastal aquifer bottom (data from [16]); (8) electrical resistivity tomography (ERT) profiles.
Water 13 00053 g002
Figure 3. Map of the sampled wells and the locations of the electrical resistivity tomography (ERT) profiles.
Water 13 00053 g003
Figure 4. (a) The T1 tomography ERT profile in the study area. (b) The geological and hydrogeological interpretation of the T1 ERT profile. The trace of this ERT is shown in Figure 3.
Water 13 00053 g004
Figure 5. (a) The T2 ERT profile in the study area. (b) The geological and hydrogeological interpretation of the T2 ERT profile. The trace of this ERT is shown in Figure 3.
Water 13 00053 g005
Figure 6. (a) The T3 ERT profile in the study area. (b) The geological and hydrogeological interpretation of the T3 ERT profile. The trace of this ERT is shown in Figure 3.
Water 13 00053 g006
Figure 7. Langelier–Ludwig diagram of the sampled waters (red dots mark cited wells).
Water 13 00053 g007
Table 1. Descriptive statistics for the physical–chemical parameters of groundwater.
ValueECTpHNa+K+ClHCO3Ca2+Mg2+
μS/cm at 25 °C°C-meq/L
Minimum64916.006.701.490.070.802.130.590.75
Mean173218.147.367.820.485.976.683.634.59
Maximum463021.007.9840.461.8438.4714.1910.3912.62
SD8701.260.427.310.386.203.291.932.74
Table 2. Fraction of seawater, mixing, and reacting.
Samplef %Na+mixNa+reactCa2+mixCa2+reactMg2+mixMg2+reactHCO3mixHCO3react
130.262.9−0.71.3−0.10.90.33.7−0.5
140.835.8−1.91.4−0.41.30.83.8−0.8
350.624.710.91.41.11.20.73.74.4
370.544.313.31.30.51.11.83.76.1
Publisher’s Note: MDPI stays neutral with regard to jurisdictional claims in published maps and institutional affiliations.

